Embed Size (px)
Citation preview
Degree Project in Applied Microbiology (KMBM05) 30 credits, A (Second Cycle) Lund, Sweden June 2020
Reconstruction of Genome-Scale Metabolic Models with Concomitant
Constraint-Based Modelling for Flux Prediction – a Case Study of Syngas
Consuming Hydrogenophaga pseudoflava Cristopher Ollagnier Widén Faculty of Engineering (LTH), Lund University

Degree Project in Applied Microbiology (KMBM05) 30 credits, A (Second Cycle) Lund, Sweden June 2020
Reconstruction of Genome-Scale Metabolic Models with Concomitant
Constraint-Based Modelling for Flux Prediction – a Case Study of Syngas
Consuming Hydrogenophaga pseudoflava ©Cristopher Ollagnier Widén This thesis is submitted for the degree of Master of Science in Engineering, Biotechnology at the Faculty of Engineering (LTH), Lund university. Alternative title: Rekonstruktion av genomskaliga modeller över ämnesomsättningen med tillhörande
modellering för fluxprediktion – en fallstudie av syntesgaskonsumerande Hydrogenophaga pseudoflava
Division Applied Microbiology, Faculty of Engineering (LTH), Lund Uni. Supervisor Associate Professor Dr. Ed van Niel, LTH Examiner Professor Dr. Marie-Francoise Gorwa-Grauslund, LTH Student opponent Marie Swensson, LTH Conducted at the Department of Protein Science at the School of Engineering Sciences in Chemistry, Biotechnology, and Health (CBH) KTH Main external supervisor Associate Professor Dr. Paul Hudson, KTH Secondary external supervisor Late-stage PhD student Kiyan Shabestary, KTH


To the teacher who patiently explains.

1
2
Abstract Metabolic modelling coupled with flux-balance analysis (FBA) has become a popular tool in systems
biology for quantitative predictions of metabolic processes in silico, and as an aid in metabolic
engineering. Drawing upon gene-protein-reaction associations deducible from information on the
genome-level, so-called genome-scale metabolic models (GEMs) are unequalled in their scope as they
attempt to encapsulate the entire reactome of a species or cell type. GEMs are conceived through a
process of metabolic network reconstruction, the methodology of which was investigated, summarized,
and distilled into distinct chronological steps. To substantiate these findings, and as a proof of concept, a
case study was performed with the objective to reconstruct and curate a draft GEM of Hydrogenophaga
pseudoflava strain DSM 1084. Ultimately, the purpose prompting acquisition of such a GEM is to predict
and evaluate the biocapabilities of this bacterium in silico, particularly for syngas fermentation, when
grown in lithoautotrophic (on CO2 + H2) and carboxydotrophic (on CO alone) conditions. Exploiting the
KEGG database using the MATLAB toolbox RAVEN allowed for network reconstruction. Subsequent
manual curation set out to have the model accommodate the wide heterotrophic substrate range
exhibited by H. pseudoflava, correct reaction directionalities and add an artificial biomass reaction.
These efforts eventually culminated in the first ever reported GEM of H. pseudoflava, HPseGEM,
consisting of 1537 reactions, 1679 metabolites, and 915 genes.
Key words: flux-balance analysis (FBA), genome-scale metabolic model (GEM), Hydrogenophaga
pseudoflava DSM 1084, KEGG, metabolic engineering, metabolic modelling, metabolic network
reconstruction, RAVEN, syngas, systems biology

3
4
Att modellera ämnesomsättning Alla levande celler har en ämnesomsättning. Ämnesomsättningen är unik för en given typ av cell, och
omfattar de intracellulära biokemiska reaktioner som möjliggör att kemiska föreningar inuti cellen kan
omvandlas sinsemellan. Ämnesomsättningen är mycket vidlyftig men tillgången på information är
detta till trots adekvat nog för att skapa – eller rekonstruera – modeller över en given cells
ämnesomsättning.
Enzymer ansvarar för de reaktioner som ämnesomsättningen utgörs utav. Förekomsten av en viss
uppsättning sådana är just vad som gör ämnesomsättningen specifik för en viss celltyp. Genom att
konsultera en godtycklig cells genetiska arvsmassa – DNA – så är det möjligt att medelst bioteknik utröna
vilka specifika enzymer som cellen ifråga har och därigenom bilda sig en uppfattning om hur dess unika
ämnesomsättning är beskaffad. På så vis är det möjligt att skapa en genomskalig modell över
ämnesomsättningen hos vilken cell som helst under förutsättning att man har kännedom om hur dess
DNA är utformat. Man kan sedermera uttrycka denna modell matematiskt för att därefter medelst
datorhjälpmedel förutsäga många olika saker. Ämnesomsättningen är dynamisk och fluktuerar bland
annat beroende på den omgivande miljön som cellen befinner sig i. Därför är en sådan här modell ett
användbart verktyg för att förstå ämnesomsättningen bättre. Bland annat så kan man estimera hur fort
cellens ämnesomsättning går och vad cellen prioriterar i en viss omständighet, t.ex. om den föredrar att
förbränna kolhydrater eller fett när den befinner sig i en syrefattig miljö. Det är även möjligt att estimera
hur mycket av en viss kemikalie – t.ex. bioetanol – som en cell är kapabel att producera.
Tillgången till en sådan här modell är ett mycket potent verktyg för att undersöka vad som torde vara
möjligt att åstadkomma medelst genmanipulation. Med en sådan här modell kan man många gånger
bedöma utfallet av en genmodifiering innan man tar steget vidare och faktiskt utför den i ett
laboratorium. Detta medför att genomskaliga modeller är till stor hjälp för bioteknisk industri där det är
vanligt att man genmodifierar celler för att producera allt ifrån mat till läkemedel.
Det examensarbete som mynnade ut i denna avhandling gick ut på att rekonstruera en sådan här
genomskalig modell över ämnesomsättningen hos bakterien Hydrogenophaga pseudoflava. I en värld där
överanvändning av fossila bränslen, och de utsläpp av skadliga växthusgaser detta medfört, skapar stora
problem är just den här bakterien intressant. Den gör nämligen precis raka motsatsen – den äter istället
växthusgaser och använder dem för att producera andra föreningar som är av godo och som djur och
natur har nytta av. Bakterien ifråga klarar även av att äta syntesgas som är en mycket vanlig gas i
industrin. Det är med anledning av detta intressant att med hjälp av en sådan här modell undersöka om
och i så fall hur man skulle kunna använda H. pseudoflava för att t.ex. producera miljövänliga biobränslen
och hur man bäst bör gå till väga för att genmodifiera den med hopp om att effektivisera denna
produktion. Bakteriens DNA är känt och kunde användas för att skapa en genomskalig modell som efter
diverse finjusteringar så småningom kom att innefatta 1537 reaktioner, 1679 föreningar och 915 gener.
Nyckelord: biobränslen, genomskalig modell över ämnesomsättningen, Hydrogenophaga pseudoflava,
ämnesomsättning

5

6
Preface This thesis is submitted for the degree of Master of Science in Engineering, Biotechnology at the Faculty
of Engineering (LTH), Lund university. The work herein presented was conducted in the systems biology
group of the Department of Protein Science at the School of Engineering Sciences in Chemistry,
Biotechnology, and Health (CBH) KTH located at Science for Life Laboratory (SciLifeLab) in Solna,
Stockholm (Sweden) between the 25th of November 2019 and the 15th of June 2020. This thesis was
presented orally 2 p.m. on the 18th of May 2020 at a public seminar at the division of Applied
Microbiology, Faculty of Engineering (LTH), Lund University.
7
Acknowledgements First and foremost, I would like to express my sincere gratitude to Paul Hudson for agreeing to be my
supervisor and taking me on as a M. Sc. student in his systems biology group. Knowing full well that you
would be on parental leave and spend at least a month overseas and still grant me the opportunity to
further deepen my fascination with metabolic networks in your group is nothing short of a gamble. Like
so many other scientists I queried with in the search of a suitable M. Sc. diploma project, you could have
easily said no or neglected to respond at all. Know that I am glad you didn’t. Also know that literally
minutes before you responded to my initial e-mail, I was sitting in an adjacent building to SciLifeLab in
full preparation to barge into your office unannounced. Since then, small things like passing by the coffee
machine only to overhear people casually speaking about metabolism makes me think I am in the right
place.
Late-stage PhD student Kiyan Shabestary gave very good advice on how to proceed along the path of
genome-scale metabolic modelling. Thank you Kiyan, I enjoyed working with you. I knew from the
moment when during one of the first days at SciLifeLab we spontaneously met and had a little check-up
in the hallway interspersed between laboratories that you would prove to be a solid supervisor. Postdoc
Michael Jahn also helped, and your input was much appreciated too! Thanks also to fellow master
student Manuel! Having witnessed how my mood oscillated between absolute despair and absolute
euphoria depending on whether MATLAB code worked or – more often – didn’t, you must think you’ve
shared offices with someone deeply insane.
I would also like to thank Ed van Niel and Marie-Francoise Gorwa-Grauslund for acting supervisor and
examiner to this master thesis, respectively. And, even more so, for jointly playing what was to become a
key role in challenging the metabolomics-hypnosis I was suffering from when I chanced upon your course
in metabolic engineering. Lesson learned; an interest in metabolic networks is equally well served
pursuing a research career in metabolic engineering and systems biology. It has now been almost two
years since Ed casually mentioned genome-scale metabolic modelling as something which might be of
interest. At the time, I barely registered the significance of this piece of information. Nevertheless, GEMs
turned out to be a worthwhile avenue into research on metabolic networks.
Furthermore, I would like to thank all of the teachers of biotechnology and related subjects at LTH.
Special thanks to Kristoffer Modig for his enthusiasm, to Peter Spégel for all the support and to
Margareta Sandahl for her encouragement.
Crucial for the process of navigating the academic jungle of Stockholm, the following scientists kindly
provided their advice: Roland Nilsson, Cheng Zhang, Adil Mardinoglu, Lukas Käll, Véronique Chotteau,
Jonathan Martin, Stefano Papazian and Anneli Kruve.
Last but not least, my thanks goes out to my mother Susanne Widén for her unfailing support.
8
Table of contents Abstract ..................................................................................................................................................... 2
Att modellera ämnesomsättning .............................................................................................................. 4
Preface ....................................................................................................................................................... 6
Acknowledgements ................................................................................................................................... 7
List of Abbreviations and Acronyms .......................................................................................................... 9
1. Introduction ..................................................................................................................................... 10
1.1 Purpose statement .............................................................................................................. 11
1.2 Report disposition ............................................................................................................... 11
2. Background ...................................................................................................................................... 12
2.1 Modelling metabolism – a brief overview of genome-scale metabolic models ....................... 13
2.2 The process of genome-scale metabolic network reconstruction ............................................ 15
2.3 Quantifying the metabolic network .............................................................................................. 19
2.4 Flux validation................................................................................................................................ 24
2.5 Metabolic and physiological properties of Hydrogenophaga pseudoflava DSM 1084 ................. 24
3. Material and methods ..................................................................................................................... 28
3.1 Genome-scale metabolic model reconstruction ........................................................................... 28
3.1.1 Addition of transport and exchange reactions ....................................................................... 29
3.1.2 Manual curation of reaction directionalities .......................................................................... 30
3.1.3 Incorporation of an artificial biomass reaction ...................................................................... 31
4. Results and discussion ..................................................................................................................... 32
5. Conclusions ...................................................................................................................................... 38
References ............................................................................................................................................... 39
Appendix .................................................................................................................................................. 44
9
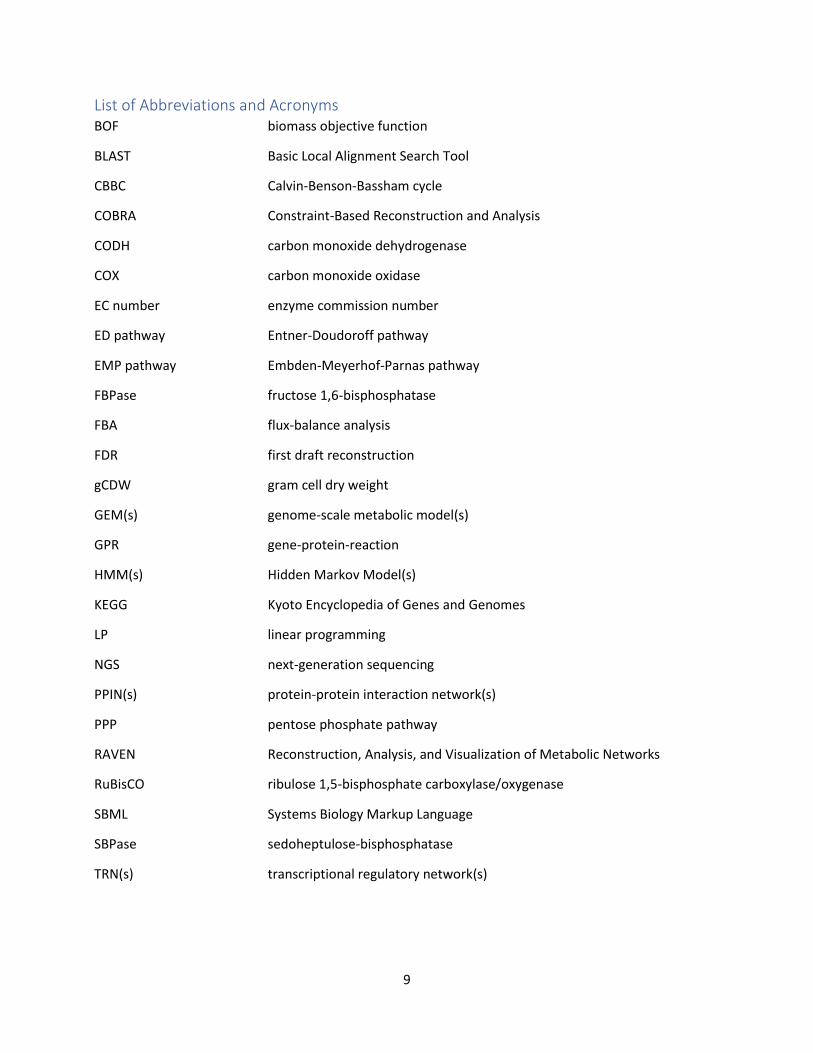
List of Abbreviations and Acronyms BOF biomass objective function
BLAST Basic Local Alignment Search Tool
CBBC Calvin-Benson-Bassham cycle
COBRA Constraint-Based Reconstruction and Analysis
CODH carbon monoxide dehydrogenase
COX carbon monoxide oxidase
EC number enzyme commission number
ED pathway Entner-Doudoroff pathway
EMP pathway Embden-Meyerhof-Parnas pathway
FBPase fructose 1,6-bisphosphatase
FBA flux-balance analysis
FDR first draft reconstruction
gCDW gram cell dry weight
GEM(s) genome-scale metabolic model(s)
GPR gene-protein-reaction
HMM(s) Hidden Markov Model(s)
KEGG Kyoto Encyclopedia of Genes and Genomes
LP linear programming
NGS next-generation sequencing
PPIN(s) protein-protein interaction network(s)
PPP pentose phosphate pathway
RAVEN Reconstruction, Analysis, and Visualization of Metabolic Networks
RuBisCO ribulose 1,5-bisphosphate carboxylase/oxygenase
SBML Systems Biology Markup Language
SBPase sedoheptulose-bisphosphatase
TRN(s) transcriptional regulatory network(s)
10
1. Introduction The objective of the diploma work concluded in this thesis was to reconstruct and curate a draft
genome-scale metabolic model (GEM) of the Gram-negative β-proteobacterium Hydrogenophaga
pseudoflava strain DSM 1084. Because of a distinct capacity for naturally consuming CO and CO2 – both
large components of synthesis gas – H. pseudoflava is potentially a green cell factory suitable for
biochemical production of e.g. biofuels such as ethanol. Synthesis gas – aptly called syngas – can be
derived from several sources including natural gas, coal and biomass through gasification (Li & Ge, 2016).
It consists primarily of a mixture of H2, CO and CO2 and is a common building block in chemical industry
where it is mainly used in oil refining processes, for methanol production and as the basis for the
synthesis of ammonia for fertilizer production (Ibid., 2016). Its composition allows for syngas
fermentation and permitting microorganisms like H. pseudoflava to take advantage of this prevalent gas
mixture is in many ways a promising avenue for sustainable development.
H. pseudoflava is gaining biotechnological interest as evident from contemporary research; a genetic
engineering protocol was recently established and high-quality data on detailed physiological
parameters pertaining to biomass-specific uptake rates and growth rates on various substrates are
available, including for gaseous substrates (Grenz et al., 2019). Moreover – crucial for the creation of a
GEM – whole-genome sequencing data of H. pseudoflava is available (Ibid., 2019). Of particular interest
to the research community are the so-far sparsely investigated constraints on product yield when grown
in lithoautotrophic conditions – with CO2 as carbon source and H2 as energy source – or in
carboxydotrophic conditions, where CO is used as the sole energy and carbon source. Genome-scale
metabolic modelling with concomitant flux-balance analysis will aid in the understanding of the limits of
cell productivity when grown in different growth modes and can be readily employed for generating such
estimates computationally (Cuevas et al., 2016; Orth et al., 2010). It should, for instance, be able to
predict the maximum product yield when CO is the sole carbon and energy source. It can also be used to
simulate reaction knockouts and seeing their effect on growth or biochemical production. It was thus
anticipated that the herein presented genome-scale metabolic model could serve as an appropriate basis
for addressing these issues.
The model will also help guide metabolic engineering in this strain by serving as a database amassing
gene-protein-reaction annotation tables describing the relationship between a gene and the reaction(s)
which its corresponding enzyme(s) catalyzes. It is thus estimated that the present model will be of
interest for the broader research community working with the organism now and in the future. The
genome-scale metabolic model generated in the present thesis is the first ever created for H.
pseudoflava. Due to its inherent utility, it is expected to contribute to the development of knowledge
through facilitating engineering strategies which in turn can be implemented to this particular organism
for the biochemical production of significant compounds.
The work herein presented is a product of the computer-assisted domains of systems biology. It is in
many ways a reflection of an ongoing movement within biology as a whole – a movement towards a
more quantitative approach to what the life sciences has to offer. As exemplified by this thesis, the
particular discipline of metabolic engineering is picking up momentum fast from merging with
computational methods. Indeed, although not yet a consolidated term, the emerging field of so-called
systems metabolic engineering (see Rok Choi et al., 2019) will likely prove a natural extension of
traditional metabolic engineering.
11
1.1 Purpose statement
The purpose of this diploma work was to produce a draft genome-scale metabolic model of H.
pseudoflava’s metabolism with which to eventually be able to predict and evaluate the biocapabilities of
this bacterium in silico, particularly when grown in lithoautotrophic conditions (on CO2 + H2) and in
carboxydotrophic conditions (on CO alone).
1.2 Report disposition
This thesis is divided into five chapters.
In chapter two, the justification for modelling metabolism in the first place is briefly addressed drawing
upon recent examples. The history of genome-scale metabolic models in particular is briefly outlined in
order to give the reader a bit of context and a feeling for where contemporary science is currently at.
The rest of this chapter then deals with the theoretical framework underlying the process of
reconstructing a genome-scale metabolic model and using it to simulate metabolic flux in silico.
Metabolic network reconstruction necessarily follows a few steps, and these are addressed in
chronological order. Special emphasis is put on explaining the principles that goes into the creation of a
formal, matrix-based description of metabolic networks – that which ultimately permits quantitative
exploration of metabolism. In short, the aim of this chapter is to summarize the literature study
necessarily undertaken to comprehend the principles behind genome-scale metabolic modelling. This
chapter also equips the reader with enough background information on H. pseudoflava to better
understand and interpret the findings of this work.
As a case study and as a proof of principle, chapter three sees the theoretical framework outlined above
implemented in the reconstruction of a draft metabolic network of Hydrogenophaga pseudoflava DSM
1084. The specific methods employed for the purposes of this reconstruction are outlined. Likewise, the
material used is specified.
Chapter four covers the results as well as a discussion thereof, along with future considerations. This
chapter also contains an implicit account of potential sources of errors.
In the fifth and final chapter, concluding remarks are provided.
12
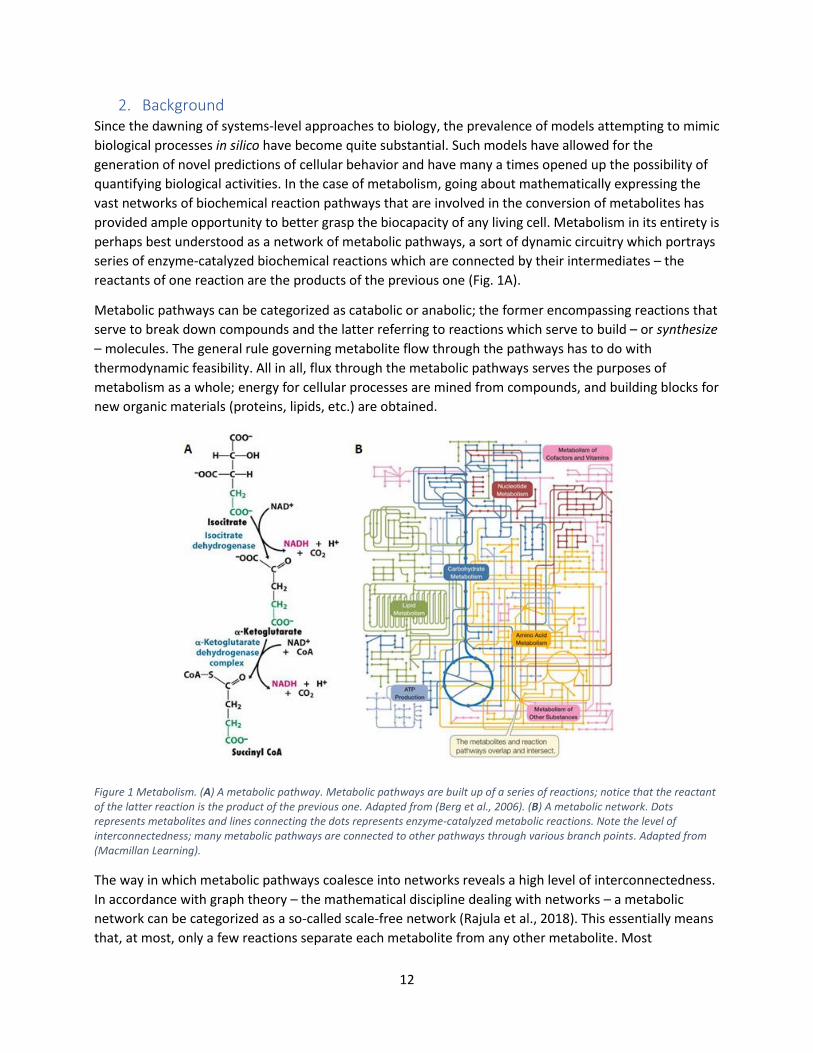
2. Background Since the dawning of systems-level approaches to biology, the prevalence of models attempting to mimic
biological processes in silico have become quite substantial. Such models have allowed for the
generation of novel predictions of cellular behavior and have many a times opened up the possibility of
quantifying biological activities. In the case of metabolism, going about mathematically expressing the
vast networks of biochemical reaction pathways that are involved in the conversion of metabolites has
provided ample opportunity to better grasp the biocapacity of any living cell. Metabolism in its entirety is
perhaps best understood as a network of metabolic pathways, a sort of dynamic circuitry which portrays
series of enzyme-catalyzed biochemical reactions which are connected by their intermediates – the
reactants of one reaction are the products of the previous one (Fig. 1A).
Metabolic pathways can be categorized as catabolic or anabolic; the former encompassing reactions that
serve to break down compounds and the latter referring to reactions which serve to build – or synthesize
– molecules. The general rule governing metabolite flow through the pathways has to do with
thermodynamic feasibility. All in all, flux through the metabolic pathways serves the purposes of
metabolism as a whole; energy for cellular processes are mined from compounds, and building blocks for
new organic materials (proteins, lipids, etc.) are obtained.
Figure 1 Metabolism. (A) A metabolic pathway. Metabolic pathways are built up of a series of reactions; notice that the reactant of the latter reaction is the product of the previous one. Adapted from (Berg et al., 2006). (B) A metabolic network. Dots represents metabolites and lines connecting the dots represents enzyme-catalyzed metabolic reactions. Note the level of interconnectedness; many metabolic pathways are connected to other pathways through various branch points. Adapted from (Macmillan Learning).
The way in which metabolic pathways coalesce into networks reveals a high level of interconnectedness.
In accordance with graph theory – the mathematical discipline dealing with networks – a metabolic
network can be categorized as a so-called scale-free network (Rajula et al., 2018). This essentially means
that, at most, only a few reactions separate each metabolite from any other metabolite. Most
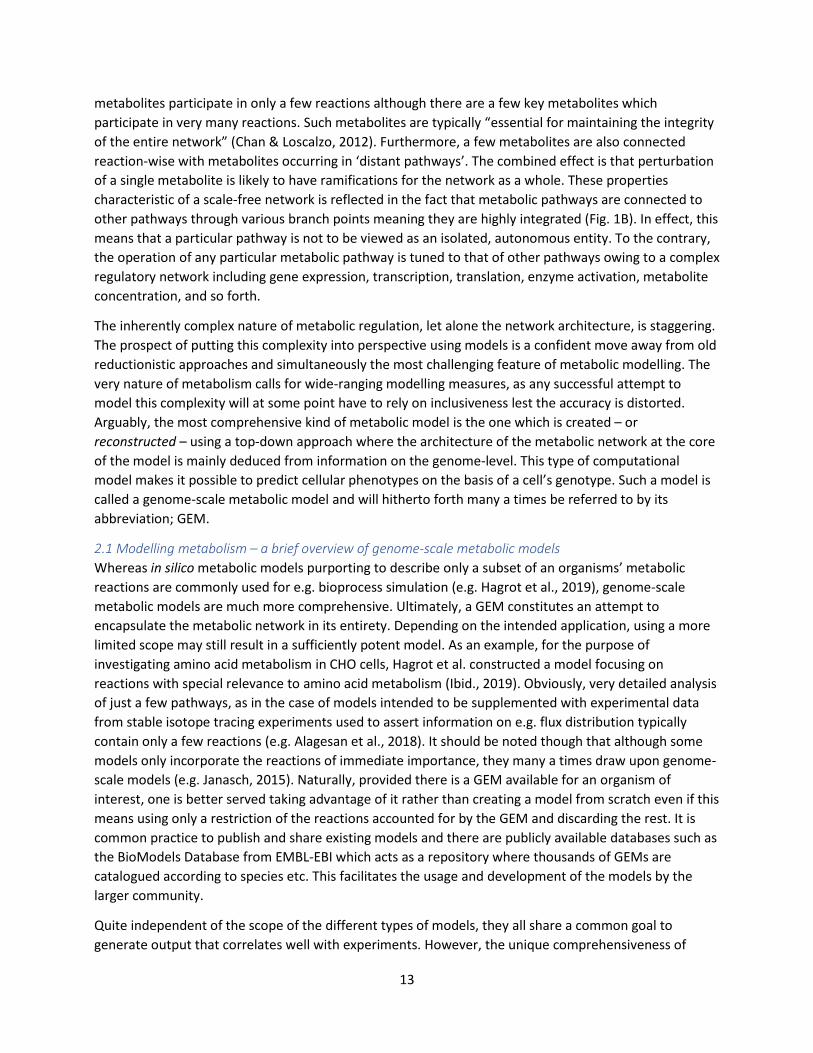
13
metabolites participate in only a few reactions although there are a few key metabolites which
participate in very many reactions. Such metabolites are typically “essential for maintaining the integrity
of the entire network” (Chan & Loscalzo, 2012). Furthermore, a few metabolites are also connected
reaction-wise with metabolites occurring in ‘distant pathways’. The combined effect is that perturbation
of a single metabolite is likely to have ramifications for the network as a whole. These properties
characteristic of a scale-free network is reflected in the fact that metabolic pathways are connected to
other pathways through various branch points meaning they are highly integrated (Fig. 1B). In effect, this
means that a particular pathway is not to be viewed as an isolated, autonomous entity. To the contrary,
the operation of any particular metabolic pathway is tuned to that of other pathways owing to a complex
regulatory network including gene expression, transcription, translation, enzyme activation, metabolite
concentration, and so forth.
The inherently complex nature of metabolic regulation, let alone the network architecture, is staggering.
The prospect of putting this complexity into perspective using models is a confident move away from old
reductionistic approaches and simultaneously the most challenging feature of metabolic modelling. The
very nature of metabolism calls for wide-ranging modelling measures, as any successful attempt to
model this complexity will at some point have to rely on inclusiveness lest the accuracy is distorted.
Arguably, the most comprehensive kind of metabolic model is the one which is created – or
reconstructed – using a top-down approach where the architecture of the metabolic network at the core
of the model is mainly deduced from information on the genome-level. This type of computational
model makes it possible to predict cellular phenotypes on the basis of a cell’s genotype. Such a model is
called a genome-scale metabolic model and will hitherto forth many a times be referred to by its
abbreviation; GEM.
2.1 Modelling metabolism – a brief overview of genome-scale metabolic models
Whereas in silico metabolic models purporting to describe only a subset of an organisms’ metabolic
reactions are commonly used for e.g. bioprocess simulation (e.g. Hagrot et al., 2019), genome-scale
metabolic models are much more comprehensive. Ultimately, a GEM constitutes an attempt to
encapsulate the metabolic network in its entirety. Depending on the intended application, using a more
limited scope may still result in a sufficiently potent model. As an example, for the purpose of
investigating amino acid metabolism in CHO cells, Hagrot et al. constructed a model focusing on
reactions with special relevance to amino acid metabolism (Ibid., 2019). Obviously, very detailed analysis
of just a few pathways, as in the case of models intended to be supplemented with experimental data
from stable isotope tracing experiments used to assert information on e.g. flux distribution typically
contain only a few reactions (e.g. Alagesan et al., 2018). It should be noted though that although some
models only incorporate the reactions of immediate importance, they many a times draw upon genome-
scale models (e.g. Janasch, 2015). Naturally, provided there is a GEM available for an organism of
interest, one is better served taking advantage of it rather than creating a model from scratch even if this
means using only a restriction of the reactions accounted for by the GEM and discarding the rest. It is
common practice to publish and share existing models and there are publicly available databases such as
the BioModels Database from EMBL-EBI which acts as a repository where thousands of GEMs are
catalogued according to species etc. This facilitates the usage and development of the models by the
larger community.
Quite independent of the scope of the different types of models, they all share a common goal to
generate output that correlates well with experiments. However, the unique comprehensiveness of
14
genome-scale metabolic models suggests a loftier goal. Indeed, genome-scale reconstructed biochemical
reaction networks not only serve as a basis for flux analysis, but also constitute an unprecedented
manner in which extensive information from databases covering all of the 'omes are allowed to converge
to form a true systems-level depiction of biology. In light of this, a GEM is a holistic, comprehensive
knowledge-base that can be used for biological interpretation and discovery (Österlund et al., 2012).
GEMs have also been used to elucidate evolutionary relationships e.g. by facilitating the investigation of
the degree of conservation of metabolic pathways between different organisms (Ibid., 2012).
Furthermore, GEMs equally highlight what is known and what is still unknown – thus providing a means
of generating relevant incentives for further study. Suffice to say, the comprehensiveness of genome-
scale models in particular will likely secure them a place of importance amongst computational models
of biological processes for years to come. Needless to say, being at the pinnacle of metabolic models, the
creation of GEMs is definitely worthwhile.
Following the advent of whole-genome sequencing in the 1990s (Brown, 2010), the growth of databases
harboring vast amounts of information key to elucidating the intricacies of metabolic networks would
eventually yield the first genome-scale metabolic model in 2000 (Edwards & Palsson, 2000). This GEM
was for Escherichia coli and it was shortly followed by the creation of the first GEM for an eukaryotic
organism – Saccharomyces cerevisiae – in 2003 (Förster et al., 2003). Although the intervening years has
seen the birth of a plethora of methods making GEMs increasingly versatile, creating and especially fine-
tuning genome-wide models can still be quite time-consuming and, to some extent, this is likely
impeding their popularity. In fact, GEMs for several organisms of vested biotechnological relevance still
have not been created and published. This is generally the case for gas fermenting microbes, the
exception being the acetogenic Clostridia.
Moreover, reconstructing a biologically accurate metabolic network hinges on the availability of
biological information. In effect, as information on e.g. novel biosynthetic pathways is discovered and
published incrementally, this means GEMs are modified every so often.
Nowadays, modern high-throughput technologies provide the possibility of acquiring data on the
transcriptome-, proteome-, and metabolome-level which, upon integration, will serve to further deepen
the knowledge-base that is a GEM. As such, GEMs are arguably the ideal scaffold for omics data
integration (Österlund et al., 2012) and it is clear from the literature that ongoing efforts are being
undertaken to systematically complement GEMs with this type of data. For instance, this is definitely the
case in systems biomedicine, where the integration of human cell-, and tissue-specific GEMs with omics
data have allowed for improved biomarker discovery and identification of drug targets (e.g. Lee et al.,
2016; Mardinoglu et al., 2014; Mardinoglu et al., 2013). Indeed, given the importance of medicine, a
major incentive to expand the utility of GEMs is not unlikely to come from the field of systems
biomedicine. In this scientific discipline it is now increasingly common to integrate GEMs with
transcriptional regulatory networks (TRNs) and protein-protein interaction networks (PPINs) (e.g. Lee et
al., 2016) – a powerful approach to further expand the utility of GEMs.
Having access to an accurate GEM is also a very powerful tool in metabolic engineering where computer-
aided metabolic intervention strategies can be used for strain optimization. For instance, combining flux
analysis with genome-scale modelling can be used to “predict novel genome editing targets for
optimized secondary metabolites production” (Wang et al., 2018). This means that e.g. overexpression
targets can be identified using GEMs, and they can also be used to tell whether a particular knock-out
15
would be productive or not. Sometimes a GEM can be used to tell whether a single knock-out is enough
to eliminate the flux through a particular pathway, or whether there is a need to knock out several genes
to achieve this end. Obviously, reaching such conclusions on a large scale using only experimental
approaches would likely prove unfeasible due to the inherent time-consumption as well as for economic
reasons. Moreover, as summarized in the eloquent words of Kildegaard et al., using genome-scale
models as a basis for flux balance analysis “is a powerful tool for studying the global response of the
cellular metabolism to environmental or genetic changes and for identifying the mechanisms involved in
re-routing the metabolic fluxes” (2016).
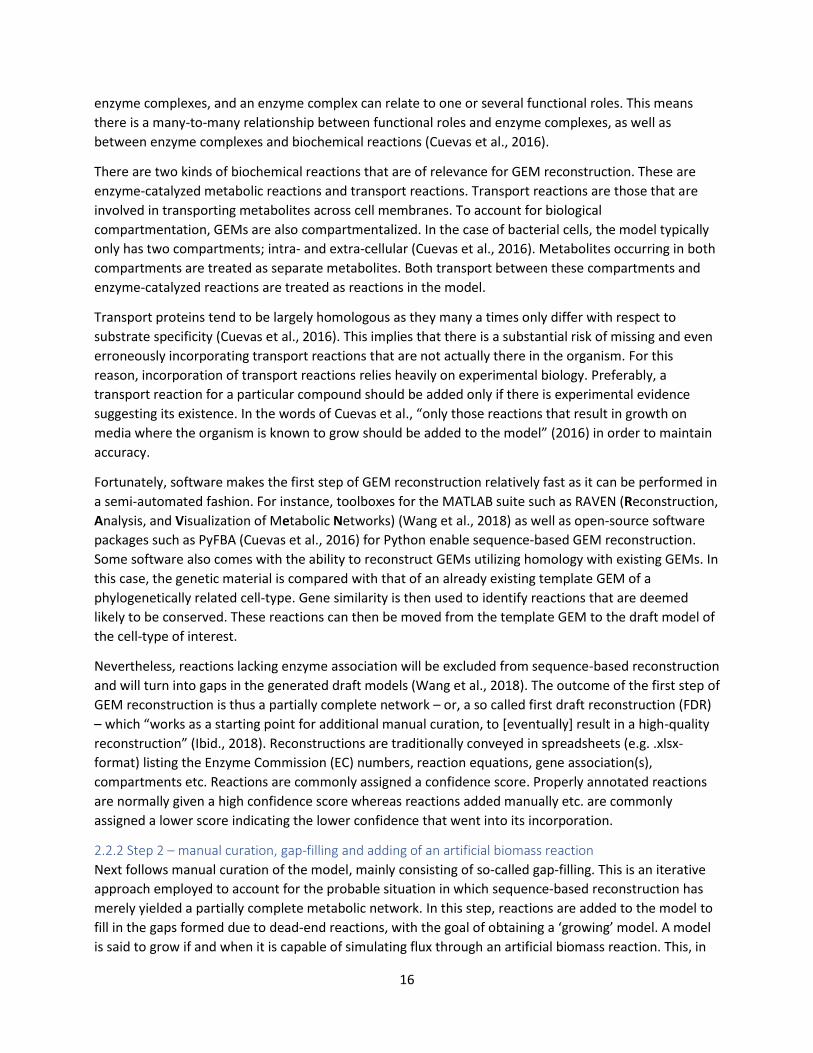
2.2 The process of genome-scale metabolic network reconstruction
The process of genome-scale metabolic network reconstruction evolves through three major steps, each
with a specific outcome in mind (Table 1).
Table 1 The three steps of GEM reconstruction, and the desired outcome of each step.
Step Desired outcome
Step 1 Sequence-based reconstruction Partially complete reconstructed network
Step 2 Manual curation, gap-filling of the network and adding of an artificial biomass reaction
Growing model
Step 3 Validating the reconstructed network with experimental data
Biological accuracy
2.2.1 Step 1 – sequence-based reconstruction
Naturally, although many core biochemical conversions are conserved in a wide spectrum of organisms,
the vastness of a network pertaining to a specific organism can only be captured utilizing a top-down
approach where the raw whole-genome sequence of the organism of interest is used for inference of all
present reactions; the reactome. The first and foremost step of GEM reconstruction thus entails
sequencing the genome of the organism of interest. Fortunately, modern next-generation sequencing
(NGS) technology can now facilitate this process with relative ease. Next, the genomic material needs to
be annotated which is possible to do by using e.g. BLAST or similar homology-based algorithms to
compare the DNA sequence of each gene with already annotated genes available in databases
(Kharchenko et al., 2004). Together with vast databases of functional genomics data, bibliomics provide
the gene-reaction associations crucial for GEM reconstruction. Regardless of whether a metabolic
pathway is active or not – i.e., if it is carrying any in vivo flux or not – its definite presence is inescapably
reflected in the existence of its corresponding genes. As a reasonable first approximation, genome-scale
metabolic models have traditionally assumed that every reaction occurs if its corresponding gene is
there (Cuevas et al., 2016) not withstanding potential regulation on the transcription-level or beyond.
Depending on the quality and extensiveness of the databases, sequence-based reconstruction can be
complicated. This is particularly the case for less characterized organisms. Reconstruction initially entails
distinguishing between protein-encoding genes and RNA-encoding genes; and assigning functional roles
to the former and disregarding the latter as they are less important for the purposes of GEM
reconstruction. Having established the link between a particular protein-encoding gene and its functional
role, things quickly become more complicated as a particular functional role can relate to one or several
enzyme complexes. These enzyme complexes, in turn, may relate to a single or multiple biochemical
reactions. The same is true the other way around; a biochemical reaction may relate to one or several
16
enzyme complexes, and an enzyme complex can relate to one or several functional roles. This means
there is a many-to-many relationship between functional roles and enzyme complexes, as well as
between enzyme complexes and biochemical reactions (Cuevas et al., 2016).
There are two kinds of biochemical reactions that are of relevance for GEM reconstruction. These are
enzyme-catalyzed metabolic reactions and transport reactions. Transport reactions are those that are
involved in transporting metabolites across cell membranes. To account for biological
compartmentation, GEMs are also compartmentalized. In the case of bacterial cells, the model typically
only has two compartments; intra- and extra-cellular (Cuevas et al., 2016). Metabolites occurring in both
compartments are treated as separate metabolites. Both transport between these compartments and
enzyme-catalyzed reactions are treated as reactions in the model.
Transport proteins tend to be largely homologous as they many a times only differ with respect to
substrate specificity (Cuevas et al., 2016). This implies that there is a substantial risk of missing and even
erroneously incorporating transport reactions that are not actually there in the organism. For this
reason, incorporation of transport reactions relies heavily on experimental biology. Preferably, a
transport reaction for a particular compound should be added only if there is experimental evidence
suggesting its existence. In the words of Cuevas et al., “only those reactions that result in growth on
media where the organism is known to grow should be added to the model” (2016) in order to maintain
accuracy.
Fortunately, software makes the first step of GEM reconstruction relatively fast as it can be performed in
a semi-automated fashion. For instance, toolboxes for the MATLAB suite such as RAVEN (Reconstruction,
Analysis, and Visualization of Metabolic Networks) (Wang et al., 2018) as well as open-source software
packages such as PyFBA (Cuevas et al., 2016) for Python enable sequence-based GEM reconstruction.
Some software also comes with the ability to reconstruct GEMs utilizing homology with existing GEMs. In
this case, the genetic material is compared with that of an already existing template GEM of a
phylogenetically related cell-type. Gene similarity is then used to identify reactions that are deemed
likely to be conserved. These reactions can then be moved from the template GEM to the draft model of
the cell-type of interest.
Nevertheless, reactions lacking enzyme association will be excluded from sequence-based reconstruction
and will turn into gaps in the generated draft models (Wang et al., 2018). The outcome of the first step of
GEM reconstruction is thus a partially complete network – or, a so called first draft reconstruction (FDR)
– which “works as a starting point for additional manual curation, to [eventually] result in a high-quality
reconstruction” (Ibid., 2018). Reconstructions are traditionally conveyed in spreadsheets (e.g. .xlsx-
format) listing the Enzyme Commission (EC) numbers, reaction equations, gene association(s),
compartments etc. Reactions are commonly assigned a confidence score. Properly annotated reactions
are normally given a high confidence score whereas reactions added manually etc. are commonly
assigned a lower score indicating the lower confidence that went into its incorporation.
2.2.2 Step 2 – manual curation, gap-filling and adding of an artificial biomass reaction
Next follows manual curation of the model, mainly consisting of so-called gap-filling. This is an iterative
approach employed to account for the probable situation in which sequence-based reconstruction has
merely yielded a partially complete metabolic network. In this step, reactions are added to the model to
fill in the gaps formed due to dead-end reactions, with the goal of obtaining a ‘growing’ model. A model
is said to grow if and when it is capable of simulating flux through an artificial biomass reaction. This, in
17
turn, requires the presence of reactions accommodating an uninterrupted flow of carbon (as well as N,
O, etc.) from an initial nutrient source all the way to an artificial biomass metabolite (the product of the
biomass reaction).
Whereas the actual occurrence of reactions proposed as a consequence of the sequence-based
reconstruction step ought to be somewhat likely, gap-filling often times unfortunately entails the
addition of reactions which are not actually there. Indeed, the “gap-filling step of building the model is
the point where most of the erroneous assertions about the metabolism of an organism is made”
(Cuevas et al., 2016). Consequently, this step of the reconstruction process ends up being a trade-off
between simplicity and biological accuracy. Inevitably, the quality of this step and thus on the GEM as a
whole will ultimately depend on the experience of the creator.
Several strategies for gap-filling exists. In addition to reactions which the sequence-based reconstruction
failed to capture due to missing annotations, some reactions can proceed spontaneously without any
enzymes involved in catalysis. Fortunately, software such as the MATLAB toolbox RAVEN, “can retrieve
spontaneous reactions depending the presence of the relevant reactants in the draft model” (Wang et
al., 2018). There are also over a hundred predefined reactions that are present in practically all
organisms and as a general gap-filling approach, these can be added to gap-fill any model (Cuevas et al.,
2020).
At times when sequence homology methods have yielded a nearly complete metabolic pathway and the
presence of a particular reaction is deemed very likely, methods have been developed to fill in the gap
using gene expression data. For instance, Kharchenko et al. used gene co-expression data in conjunction
with the structure of a partially reconstructed network to identify candidate genes for the suspected
reaction (2004). The idea is that all of the genes encoding the enzymes in a series of reactions in a
particular metabolic pathway ought to be somewhat co-expressed. This approach can also be used when
there is otherwise sufficient biological evidence to deem the presence of a particular reaction likely,
provided the genes encoding adjacent enzymes are known. The situation whereby existing sequence
homology methods alone have not been able to assign a gene to one or a few reactions in an otherwise
well-annotated metabolic pathway has been coined the ‘missing genes problem’ (Kharchenko et al.,
2004).
It is also common to use phenotypic data such as those from minimal media growth experiments to
further provide “evidence to incorporate reactions from particular transporters and enzymes into the
metabolic model” (Cuevas et al., 2016). It is typically of particular importance to use data obtained from
growth on minimal media consisting of a single carbon source and minerals. In the words of Price et al.,
“experiments with undefined media composition are often of limited use for quantitative in silico
modelling” (2004). Provided that experiments prove that growth is possible on a particular sole carbon
source, all the enzymes and transport proteins necessary to metabolize that carbon source must be
present in the organism and can thus be added to the GEM with a relatively high degree of certainty.
Similarly, enzyme assays can be performed to infer the presence of certain enzymes.
Orphan compounds – compounds which are only associated with a single reaction – also needs to be
accounted for at this stage (Cuevas et al., 2016). All metabolites have to come from somewhere and go
somewhere. If an orphan compound is produced a reaction needs to be added to account for its
consumption, unless it is to be secreted which would necessitate the adding of a transport reaction and a
producing exchange reaction. Similarly, orphan compounds that are consumed either needs to be

18
produced via an added intracellular reaction or taken up from the media via a transport reaction and a
consuming exchange reaction. Some algorithms have been built to cope with gaps using network
topology (Cuevas et al., 2016), some of which use orphan compounds as a starting point. For instance,
Satish Kumar et al. developed a method to query a multi-organism database such as MetaCyc for
reactions whose incorporation would restore the connectivity between the orphan compounds and the
parent network (2007).
Many gap-filling strategies are parsimony-based meaning they try to make amends of dead-end
reactions by incorporating the shortest reaction path possible. Often times, this entails the adding of
reactions that are inconsistent with the genomic data. In an attempt to decrease the likelihood of
incorporating erroneous reactions, so-called likelihood-based gap-filling approaches have been
developed as an alternative to the parsimony-based strategies (e.g. Benedict et al., 2014). These
strategies “weights genomic evidence [into the decision-making process] and [..] favors reaction paths
supported by evidence over paths without any supporting evidence from the genome” (Ibid., 2014).
To account for cellular growth, an artificial biomass reaction sometimes referred to as the biomass
objective function (BOF) is incorporated into the model. Maximizing the flux through this artificial
reaction using flux-balance analysis (FBA) is what allows for simulated estimates of cellular growth in
silico. Given that the biomass composition is “intimately related to a species’ growth rates” (Xavier et al.,
2017), this reaction is ideally based on the actual biomass composition of the modelled species. Indeed,
the literature emphasizes that “an extensive, well-formed biomass reaction is crucial for accurate
predictions with a GEM” (Lieven et al., 2020) and the very utility of a GEM is critically tied to the accuracy
of the BOF (Xavier et al., 2017). In principle, the biomass reaction can be formulated as a direct
biosynthesis from precursor metabolites. However, as the universe of precursors is immensely large and
heterogenous, the BOF is more commonly formulated as a biosynthesis from building blocks or
macromolecules in which case it is designed as a lumping together of biomolecular pools of e.g. proteins,
carbohydrates, lipids, DNA, RNA, etc. The constituents of these pools are qualitatively and quantitatively
estimated on the basis of “experimental measurements of biomass components” (Orth et al., 2010).
There is, however, a general lack of standardized protocols – experimental as well as computational – by
which it would be possible to properly determine actual biomass composition (Xavier at al., 2017) and in
reality, most GEMs “adapt the biomass composition from a few well-studied organisms” (Ibid., 2017).
Attempts are however being made to mediate this knowledge gap. Xavier et al., for instance, has
attempted to identify universally essential organic cofactors for prokaryotic metabolism (2017). Needless
to say, increasing the accuracy of biomass reactions will likely be benefitted mostly by similar efforts
attempting to improve biomass reactions generically as long as high-quality experimental protocols are
not available.
Above all, gap-filling emphasizes the incorporation of reactions allowing the formation of all the required
biomass precursors (Marcišauskas et al., 2019). When the model is finally growing, previously filled gaps
can be deliberately and recursively re-generated in an attempt to reduce the amount of erroneously
incorporated reactions. Through gap-generation, reactions whose presence is doubtful and not
absolutely necessary for growth are pruned off. Again, it is a trade-off; the desired outcome of this step
is a model capable of growth. Obviously, obtaining such a model requires enlarging the initially
incomplete network and yet, a larger network is not necessarily a better network. Ultimately, the one
defining factor which truly defines the quality of a reconstruction is the biological accuracy. Carelessly
adding reactions having only the immediate goal of obtaining a growing model in mind would almost
19
certainly render the model less biologically accurate. Having a growing model accidentally construed on
the basis of erroneous assumptions as to the existence of reactions is of limited use in the long run. Since
the end goal is to have a GEM capable of mimicking metabolism as close to reality as possible, adopting a
modest approach already during gap-filling will arguably prove beneficial. The only way to retain this
accuracy is to validate the model using experimental data, hence the third and final step of GEM
reconstruction.
2.2.3 Step 3 – validating the reconstructed network
Validating the reconstructed network entails ensuring that the model stays consistent with actual
biology. To this end, phenotypical data from growth experiments on minimal media along with e.g.
enzyme assays can, for instance, provide evidence supporting the addition of non-annotated reactions.
Likewise, it can also be helpful in identifying reactions that is suspected to have been erroneously added
during gap-filling. This makes it possible to “limit the growth of the model under conditions where it
should not grow” (Cuevas et al., 2016).
Moreover, a model’s gene-protein-reaction (GPR) annotation tables can be refined using gene
essentiality data. Deletion of a metabolic gene should annihilate the flux through the pathway in which
its corresponding enzyme is functioning. This is a key point with regards to gene essentiality, and the
determination thereof. Should a particular knockout prove lethal, this suggests that the gene in question
must also be essential for growth. Gene essentiality is readily predicted in silico using FBA on GEMs as it
is strongly tied to the biomass composition represented by the BOF, but can also be determined
experimentally using knock-out libraries. When investigated in vivo, gene essentiality data should
preferably be determined by growing mutants from a knock-out library on a variety of selected
substrates. Undoubtedly, few things can inform the BOF qualitatively as much as a record of essential
genes as evident from experimental studies. The fact that a metabolic gene is proven essential must
ultimately mean that a reaction tied to it is responsible for one or several metabolite conversions ending
up in the formation of an indispensable biomass precursor. Any and all such precursors should be
included in the BOF. If the GEM predicts a certain knock-out should be lethal whereas the actual knock-
out strain survives, this might, for instance, be indicative of enzyme promiscuity not yet accounted for in
the reconstruction which in turn provide clues on how the GEM ought to be revised.
Any inconsistencies discovered upon comparing experimentally derived lethality and simulated lethality
can serve as a powerful basis for model validation. Research has shown that the accuracy of model-
based predictions of gene essentiality can be quite high (Feist et al., 2007), indeed justifying the usage of
gene essentiality data for model validation. Upon interpreting inconsistencies, one has to take into
account that a putative essential gene that turns out dispensable may either be disguising a case of
pathway redundancy or, perhaps more likely, the gene in question is compensated for by isoenzymes
(Price et al., 2004). Discovering isoenzymes and alternative pathways and making sure the model can
account for them often makes the difference between a higher quality and a lower quality
reconstruction.
2.3 Quantifying the metabolic network Once there is a sufficiently elaborated qualitative model of the metabolic network topology, the network
is readily expressed mathematically thus permitting quantification. To this end, flux-balance analysis
(FBA) is the de facto standard method for flux prediction (Cuevas et al., 2016). It likely owes this status to
the fact that it allows for quick computations of large networks in conjunction with its suitability when it
20
comes to investigating all kinds of perturbations be them e.g. genetic manipulations or growth on
different media (Orth et al., 2010). FBA is readily used to harness the biochemical information encoded
in GEMs for prediction of growth rates of an organism along with the rate of production of e.g.
industrially significant compounds at steady state.
The methodology behind quantitative modelling of metabolism is perhaps best addressed by an
example. Suppose the objective is to create a model with which to quantify the metabolic network
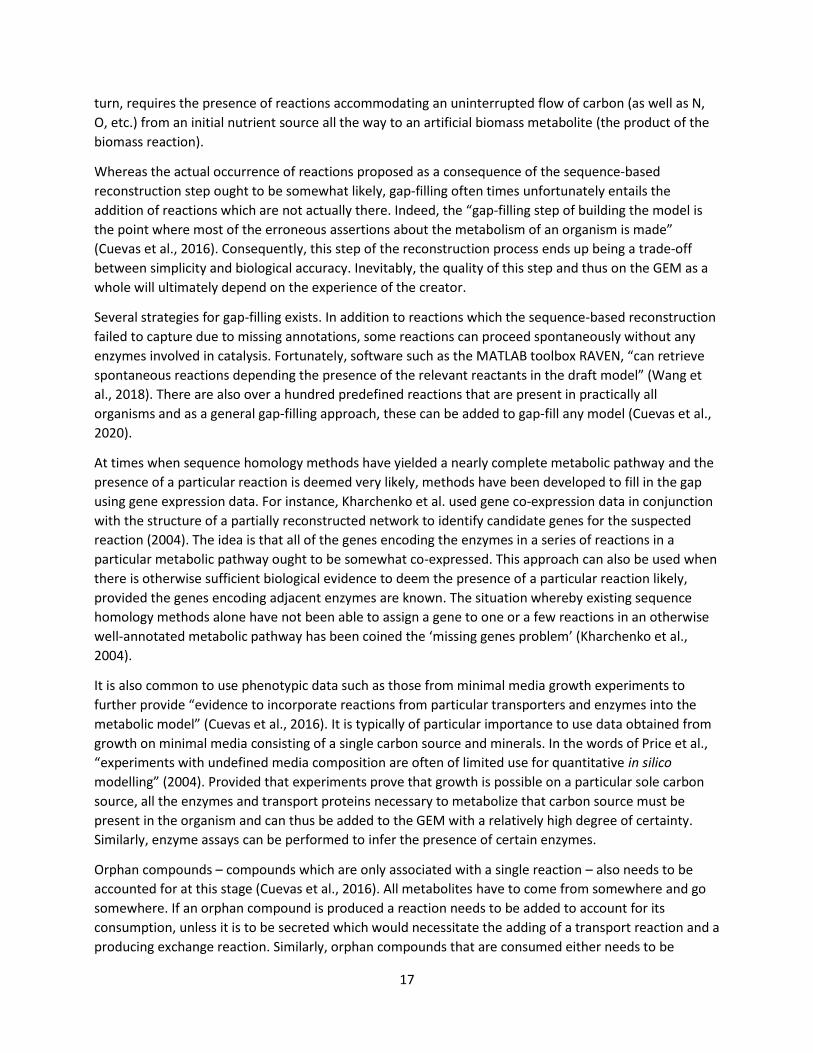
comprised of the twelve reactions (Fig. 2A) graphically represented in (Fig. 2B).
Figure 2 Modelling metabolism. (A) Metabolic reactions categorized as intracellular (black), transport (green), or exchange (red). Indexes indicate which compartment a particular metabolite belongs to; either C (cytosol) or E (extracellular). (B) A graphical representation of the metabolic model consisting of the two compartments. A system boundary encompasses both compartments. Reactions and directionalities thereof are indicated by arrows.
This metabolic model is compartmentalized into two compartments: cytosol and extracellular.
Metabolites that are present in both compartments are treated as two distinct metabolites (e.g. A[E] and
A[C]). The system boundary is set to encapsulate all compartments, and so-called exchange reactions
allows for modelling the event whereby metabolites enters or leaves the system. A distinction is made
between consuming and producing exchange reactions, the former referring to reactions which allows
the model to consume metabolites (e.g. r9) and the latter referring to reactions through which
metabolites can be produced by the model (e.g. r10). There are also intracellular reactions to account for
reactions occurring intracellularly, and transport reactions through which metabolites are allowed to
migrate between compartments. Independent of the sort of reaction, all reactions are either
unidirectional or bidirectional.
Note that 'uptake' and 'secretion' here refers to the event whereby a metabolite crosses the boundary
between the extracellular compartment and the cytosolic compartment through transport reactions.
'Consumption' and 'production', on the other hand, refers to the input and output of metabolites that
manifests as flux through exchange reactions. Hence, 'uptake' is not 'consumption' and 'secretion' is not
'production'.
A central tenet of the FBA approach is the steady-state assumption. This assumption asserts that, at
steady-state, the concentration of each metabolite pool remains the same over time – i.e., the rate of
consumption of any given metabolite equals the rate of production of the same metabolite. By assigning
21
a flux variable (𝑣𝑖) to each of the reactions, it becomes possible to express this mathematically by setting
up material balances over each metabolite (reaction directionalities as per the directions previously
indicated (Fig. 2A)). In the case of metabolite A[E], this reads:
𝑑𝐴[𝐸]
𝑑𝑡= 𝑣9 − (−𝑣5) = 𝑣9 + 𝑣5 = 0 (eq. 1)
All of the metabolic flux variables are gathered in a flux vector:
𝒗 =
(
𝑣1𝑣2𝑣3𝑣4𝑣5𝑣6𝑣7𝑣8𝑣9𝑣10𝑣11𝑣12)
(eq. 2)
and all of the flux variables are constrained by reaction bounds (eq. 3); 𝑣9, for instance, is constrained so
as to be able to assume an arbitrarily large positive value (upper bound) or zero (lower bound), but never
a negative integer. This reaction bound suggests that the ninth reaction (r9) is irreversible and only
capable of proceeding in the forward direction – i.e., →A[E] – which is indeed the case as it is a consuming
exchange reaction through which metabolite A[E] becomes available to the system. Fluxes are in the units
mmol per gram cell dry weight (gCDW) per hour [mmol gCDW-1 h-1].
0 ≤ 𝑣1 < ∞0 ≤ 𝑣2 < ∞−∞ < 𝑣3 < ∞−∞ < 𝑣4 < ∞−∞ < 𝑣5 < ∞0 ≤ 𝑣6 < ∞−∞ < 𝑣7 ≤ 0−∞ < 𝑣8 ≤ 00 ≤ 𝑣9 < ∞0 ≤ 𝑣10 < ∞0 ≤ 𝑣11 < ∞−∞ < 𝑣12 < ∞
(eq. 3)
Combined, all of the reactions of an organism are represented by a system of linear equations (eq. 4); a
system which is readily converted to a numerical stoichiometric matrix (𝑺) of size 𝑚 × 𝑛 with rows and
columns corresponding to metabolites and reactions, respectively (Villadsen et al., 2011) (eq. 5).
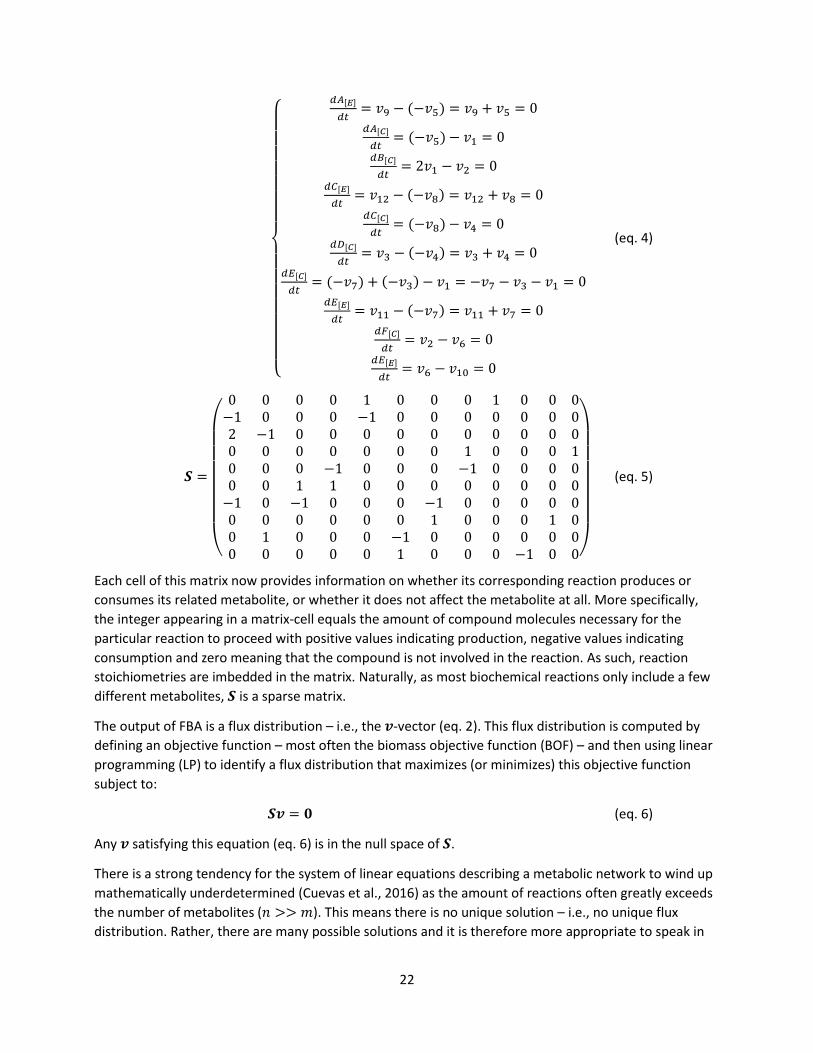
22
{
𝑑𝐴[𝐸]
𝑑𝑡= 𝑣9 − (−𝑣5) = 𝑣9 + 𝑣5 = 0
𝑑𝐴[𝐶]
𝑑𝑡= (−𝑣5) − 𝑣1 = 0
𝑑𝐵[𝐶]
𝑑𝑡= 2𝑣1 − 𝑣2 = 0
𝑑𝐶[𝐸]
𝑑𝑡= 𝑣12 − (−𝑣8) = 𝑣12 + 𝑣8 = 0
𝑑𝐶[𝐶]
𝑑𝑡= (−𝑣8) − 𝑣4 = 0
𝑑𝐷[𝐶]
𝑑𝑡= 𝑣3 − (−𝑣4) = 𝑣3 + 𝑣4 = 0
𝑑𝐸[𝐶]
𝑑𝑡= (−𝑣7) + (−𝑣3) − 𝑣1 = −𝑣7 − 𝑣3 − 𝑣1 = 0
𝑑𝐸[𝐸]
𝑑𝑡= 𝑣11 − (−𝑣7) = 𝑣11 + 𝑣7 = 0
𝑑𝐹[𝐶]
𝑑𝑡= 𝑣2 − 𝑣6 = 0
𝑑𝐸[𝐸]
𝑑𝑡= 𝑣6 − 𝑣10 = 0
(eq. 4)
𝑺 =
(
0 0 0 0 1 0 0 0 1 0 0 0−1 0 0 0 −1 0 0 0 0 0 0 02 −1 0 0 0 0 0 0 0 0 0 00 0 0 0 0 0 0 1 0 0 0 10 0 0 −1 0 0 0 −1 0 0 0 00 0 1 1 0 0 0 0 0 0 0 0−1 0 −1 0 0 0 −1 0 0 0 0 00 0 0 0 0 0 1 0 0 0 1 00 1 0 0 0 −1 0 0 0 0 0 00 0 0 0 0 1 0 0 0 −1 0 0)
(eq. 5)
Each cell of this matrix now provides information on whether its corresponding reaction produces or
consumes its related metabolite, or whether it does not affect the metabolite at all. More specifically,
the integer appearing in a matrix-cell equals the amount of compound molecules necessary for the
particular reaction to proceed with positive values indicating production, negative values indicating
consumption and zero meaning that the compound is not involved in the reaction. As such, reaction
stoichiometries are imbedded in the matrix. Naturally, as most biochemical reactions only include a few
different metabolites, 𝑺 is a sparse matrix.
The output of FBA is a flux distribution – i.e., the 𝒗-vector (eq. 2). This flux distribution is computed by
defining an objective function – most often the biomass objective function (BOF) – and then using linear
programming (LP) to identify a flux distribution that maximizes (or minimizes) this objective function
subject to:
𝑺𝒗 = 𝟎 (eq. 6)
Any 𝒗 satisfying this equation (eq. 6) is in the null space of 𝑺.
There is a strong tendency for the system of linear equations describing a metabolic network to wind up
mathematically underdetermined (Cuevas et al., 2016) as the amount of reactions often greatly exceeds
the number of metabolites (𝑛 >> 𝑚). This means there is no unique solution – i.e., no unique flux
distribution. Rather, there are many possible solutions and it is therefore more appropriate to speak in
23
terms of a solution space which includes the range of all possible solutions. Narrowing down the solution
space necessitates the introduction of constraints, hence the term constraint-based modelling.
Naturally, the living process of any microbial cell operates under a number of governing physical,
chemical and biological constraints which limit the range of possible functional phenotypic states the cell
can assume. Characterizing these and then imposing them on GEMs is a key feature of successfully
modelling metabolism in an accurate manner. Constraints should be determined from experimentation,
ideally tailored to the specific organism as much as possible. Quite regardless of the type of constraint,
they are implemented in the model in one of two ways; either in the form of a balance constraint or as a
capacity constraint.
Balance constraints – an example being the conservation of mass – are imposed on a model through the
inviolable stoichiometric reaction equations that balance reaction inputs and outputs (eq. 4) (Orth et al.,
2010) which is used to form the 𝑺-matrix (eq. 5). Capacity constraints, on the other hand, are
represented by inequalities that impose bounds on the system (Ibid., 2010) which, in effect, “limit
numerical ranges of individual variables” (Price et al., 2004) such as the flux variables (eq. 3). Whereas
balance constraints are somewhat hard-wired into the core of a GEM, capacity constraints are more
accessible and thus easier to manipulate.
Upon simulating reaction fluxes through GEMs, it is very common to choose which nutrients to make
available and at which rates they can be assimilated and then predict how fast metabolites of interest
can be produced given these circumstances. This is most often done by constraining the model’s reaction
bounds. Altering these bounds quickly facilitates simulating growth on different media compositions and
is also used to set the limiting growth factor. Moreover, reaction bounds are readily manipulated so as to
specify the reversibility of a reaction, a key constraint necessarily implemented so as to harmonize
reaction bounds with experimentally verified reaction directionalities. Reaction bounds can also be
manipulated so as to simulate a single-gene deletion (SGD) by setting the flux variable equal to zero. It is
also possible to manipulate the reaction bounds so as to force a minimal flux through a reaction by using
nonzero lower bounds. Such a constraint can, for instance, be implemented to “force a minimal flux
through artificial reactions […] such as the ‘ATP maintenance reaction’, which is a balanced ATP
hydrolysis reaction used to simulate energy demands not associated with growth” (Orth et al., 2010).
Forcing a minimal flux through the artificial biomass reaction is a good example of a means to prevent
the model from predicting no growth whatsoever – something which might happen if the optimization
objective is set to maximize for production of something else than biomass, such as a valuable secondary
metabolite.
To recap, FBA is really “the use of linear programming to solve 𝑺𝒗 = 𝟎, given a set of upper and lower
bounds on 𝒗 and a linear combination of fluxes as an objective function (Orth et al., 2010). Many
different flux distributions may exist which satisfies the optimization problem equally well and
simulation results are thus best understood as a hypothesis (Becker et al., 2007). However, the
hypothesis can be improved upon by elaborating the constraints as this will narrow down the allowable
solution space. Importantly, FBA entails “optimizing an a priori stated objective” (Price et al., 2004) and
this objective is commonly set to be the maximization of biomass formation. Accordingly, it is important
to keep in mind that the “maximum growth rate assumption is not always true, but it provides an
acceptable starting point for many types of computations” (Becker et al., 2007). Studies have also shown
that this assumption correlates rather well with the actual objective of living microorganisms (Nielsen et
24
al., 2017). One can argue that this is the case as selection has favored organisms that have evolved into
exceptionally good reproducers. In short, the competitive advantage of an organism capable of
outgrowing other organisms is the natural result of evolutionary pressure. For a cell, retaining an ability
to maximize biomass production is therefore rewarded by nature.
2.4 Flux validation As in the case of validating the reconstructed network, validating the output of flux-balance analysis
requires experimental data with which computationally predicted data can be compared. Just like gene
essentiality data can be used to validate the reconstruction, biomass-specific rates along with growth
rates can be used to validate FBA-based flux predictions. As the chief constraint enabling FBA is steady-
state, the computed reaction fluxes are only valid for conditions where there is no net accumulation of
any metabolite pool; the production rate of any given metabolite must equal the consumption rate. Such
conditions are achievable experimentally through steady-state cultivations. Experimental data obtained
by running bioreactors in chemostat mode are directly comparable with fluxes computed in silico and are
therefore suitable for validation.
Flux validation is the final step of having built a GEM, and the predictive power of the model is
determined here. Needless to say, the better the predictive accuracy, the better the GEM.
2.5 Metabolic and physiological properties of Hydrogenophaga pseudoflava DSM 1084 Hydrogenophaga pseudoflava DSM 1084 (formerly Pseudomonas pseudoflava and ”Pseudomonas
carboxydoflava” Z-1107) is a prototrophic Gram-negative β-proteobacterium originally isolated from
mud from the moscwa river in 1977 by enrichment for hydrogen bacteria (Willems et al., 1989; Zavarzin
& Nozhevnikova, 1977). Physiological characteristics include a rod-like shape with “rounded ends, 0.6 to
0.8 × 1.5-3.0 µm” (Zavarzin & Nozhevnikova, 1977), formation is characterized by yellow-pigmented,
slimy flakes and the bacterium “possess a single, subpolar flagellum when motile” (Ibid., 1977). The size
of the genome is 4,860,785 bp (chromosome) and 45,188 bp (plasmid) with G + C contents of 67.11%
(chromosome) and 61.49% (plasmid) (Grenz et al., 2019).
H. pseudoflava is an obligate aerobe (Ibid., 2019) and a facultative autotroph (Willems et al., 1989)
meaning it is able to grow either by autotrophy or heterotrophy, always and only in the presence of O2.
H. pseudoflava partly owes its autotrophic capacities to the fact that it is a hydrogen-oxidizing bacterium
capable of harvesting energy from H2 utilizing hydrogenases catalyzing the reaction:
(𝑖) H2 → 2H+ + 2e-
During chemolithoautotrophic growth on CO2 + H2, this hydrogen oxidizing reaction provides the energy
as well as the reducing power necessary for CO2-fixation.
However, H. pseudoflava also belong to the rather specialized physiological class of bacteria called
carboxydobacteria (Meyer, 1980). The “term 'carboxydobacter(s)' is used as a common designation for
microorganisms (bacteria) which are capable of oxidizing CO" (Zavarzin and Nozhevnikova, 1977). As
such, H. pseudoflava not only exhibits hydrogen-oxidizing activity, but is also capable of oxidizing carbon
monoxide. Indeed, in the capacity of being a carboxydotrophic bacterium, the C1 carbon source
utilization pattern of H. pseudoflava is broader than that of many other autotrophs. Thanks to its
capacity to grow in carboxydotrophic conditions – with CO as the sole source of both carbon and energy
– access to H2 is not essential for autotrophic growth. The CO is oxidized by the enzyme carbon
25
monoxide dehydrogenase (CODH) – also known as carbon monoxide oxidase (COX) which catalyze the
reaction (Kiessling & Meyer, 1982):
(𝑖𝑖) CO + H2O → CO2 + 2H+ + 2e-
In other words, carboxydotrophic growth provides another means by which autotrophy is possible. Here,
the physiological role of the CO-oxidizing activity alone is what accounts for “the generation of energy
and reducing power for the fixation of carbon dioxide and cell growth" (Cypionka et al., 1980).
Following whole-genome sequencing and subsequent gene annotation, Grenz et al. concluded that “all
relevant genes of the Calvin cycle with the exception of genes encoding GAPDH (NADP+) (EC 1.2.1.13) or
GAPDH (NAD(P)+) (EC 1.2.1.59) and sedoheptulose-bisphosphatase (SBPase, EC 3.1.3.37)” (2019) could
be identified. It is argued that glyceraldehyde 3-phosphate (G3-P) is instead provided by the NAD-
dependent GAPDH (EC 1.2.1.12) from the glycolytic Embden-Meyerhof-Parnas (EMP) pathway (Ibid.,
2019). Similarly, fructose 1,6-bisphosphatase from the EMP pathway may possess SBPase activity in
addition to fructose 1,6-bisphosphatase (FBPase) activity, as in the case of e.g. cyanobacteria and
Cupriavidus necator, which would then explain how sedoheptulose 7-phosphate might be formed (Ibid.,
2019). This, in conjunction with the conclusions of Zavarzin & Nozhevnikova, provides supporting
evidence that H. pseudoflava is able to assimilate CO2 via the Calvin-Benson-Bassham cycle (CBBC)
through the enzyme ribulose 1,5-bisphosphate carboxylase/oxygenase (RuBisCO) (1977). Carbon
assimilation involves the incorporation of CO2 regardless of whether the bacterium uses CO2 directly
available in e.g. syngas (chemolithoautotrophic growth) or whether it uses the CO2 that is produced in
the CODH-catalyzed reaction (carboxydotrophic growth), i.e., after the CO-oxidation (Cypionka et al.,
1980).
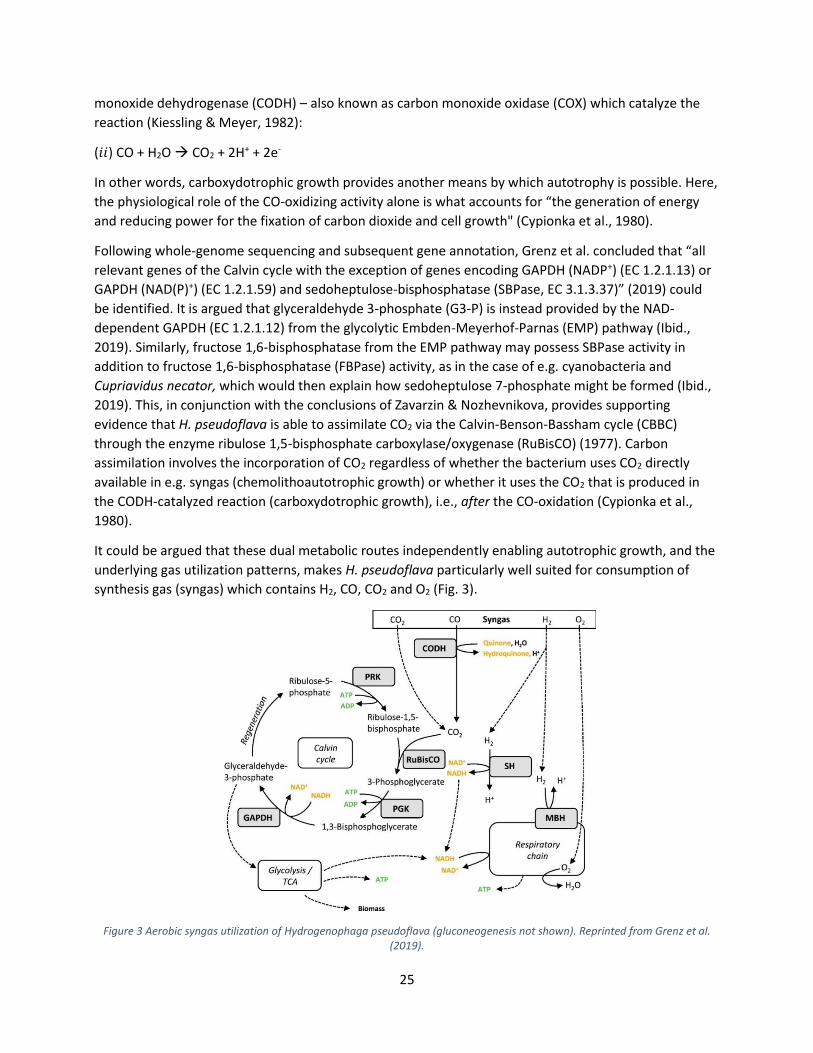
It could be argued that these dual metabolic routes independently enabling autotrophic growth, and the
underlying gas utilization patterns, makes H. pseudoflava particularly well suited for consumption of
synthesis gas (syngas) which contains H2, CO, CO2 and O2 (Fig. 3).
Figure 3 Aerobic syngas utilization of Hydrogenophaga pseudoflava (gluconeogenesis not shown). Reprinted from Grenz et al. (2019).
26
Early experiments aiming to characterize carboxydobacteria concluded that H. pseudoflava is a strong
candidate exhibiting high key enzyme activities when compared to other aerobic carboxydotrophs
(Cypionka, 1980). Notably, Grenz et al., reported quasi-steady state biomass-specific gas uptake rates
estimated from batch cultivations in autotrophic conditions using a non-explosive syngas mixture
comprised of 40% CO, 40% H2, 10% CO2, 8% Ar, 2% O2 which was purchased pre-mixed (2019). Under
these conditions, they reported a growth rate of 0.06 ± 0.01 h-1 and the rates were qH2=14.2 ± 0.3 mmol
H2 gCDW-1h-1, qCO=73.9 ± 1.8 mmol CO gCDW
-1h-1, qO2=31.4 ± 0.3 mmol O2 gCDW-1h-1 and qCO2=-56.2 ± 0.7
mmol CO2 gCDW-1h-1 with negative and positive values indicating formation and consumption, respectively
(Ibid., 2019).
By supplying H. pseudoflava with gas mixtures comprising a fixed O2 concentration of 20% and varying
the concentration of CO whilst using N2 as balance, Zavarzin & Nozhevnikova were able to conclude that
optimal yield was achieved at a CO concentration of 20% (1977). They further concluded that the
biomass decreased 1.5-fold at 40% CO and 3-fold at 80% CO (Ibid., 1977).
Most organisms are intolerant to CO which is why it has been argued that the prevention of
contaminations in large-scale cultivations on gaseous substrates such as syngas wouldn’t be very
cumbersome, which in turn would lower costs (Meyer, 1980). The fact that H. pseudoflava is relatively
resistant to poisonous impurities potentially contained in syngas as well as in most C1 carbon source
waste gases (Meyer, 1980) further supports the position of H. pseudoflava as a potent candidate for
biorefinery processes.
A few more things make H. pseudoflava an attractive host. For instance, it is non-pathogenic (Grenz et
al., 2019) and has a wide heterotrophic substrate range which facilitates convenient lab handling. A list
of sole carbon and energy sources and whether H. pseudoflava is reportedly able to grow on a particular
substrate or not is provided in the appendix (appendix, Table 3).
It has been determined that for “heterotrophic growth, H. pseudoflava possesses genes for the entire
citric acid cycle, glyoxylate shunt, gluconeogenesis and glycolysis with only the phosphofructokinase (EC
2.7.1.11) being annotated as a putative gene (pfkB, HPF_22920)" (Grenz et al., 2019). Likewise, the
enzymatic machinery enabling the Entner-Doudoroff (ED) pathway and the non-oxidative part of the
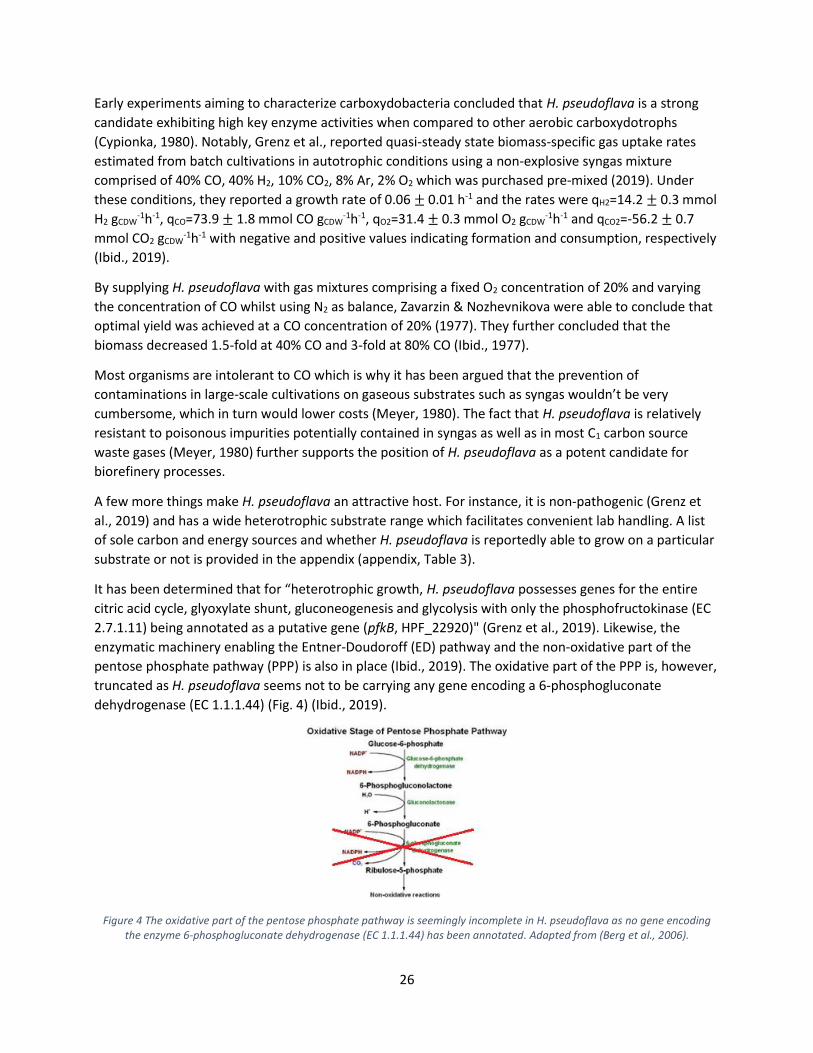
pentose phosphate pathway (PPP) is also in place (Ibid., 2019). The oxidative part of the PPP is, however,
truncated as H. pseudoflava seems not to be carrying any gene encoding a 6-phosphogluconate
dehydrogenase (EC 1.1.1.44) (Fig. 4) (Ibid., 2019).
Figure 4 The oxidative part of the pentose phosphate pathway is seemingly incomplete in H. pseudoflava as no gene encoding the enzyme 6-phosphogluconate dehydrogenase (EC 1.1.1.44) has been annotated. Adapted from (Berg et al., 2006).
27
Given the existence of this repertoire of metabolic pathways commonly known to support heterotrophic
growth it begs the question: what role does the CO-, and H2-oxidizing capability really play in the life of
H. pseudoflava? As Kiessling & Meyer eloquently showed, the two key enzymes in the Calvin cycle –
ribulose 1,5-bisphosphate carboxylase/oxygenase (RuBisCo) and phosphoribulose kinase – are absent
when H. pseudoflava is grown heterotrophically in the presence of carbon monoxide which suggests that
the bacterium will not assimilate carbon from any C1 gas if it does not have to (1982). In their words,
“autotrophic CO2-fixation via the Calvin cycle does not occur in heterotrophically growing” (1982) H.
pseudoflava. However, the energy generating enzymes CODH and hydrogenase are still present in
heterotrophic conditions because, if available, H. pseudoflava still makes use of CO and H2 to generate
energy which – in heterotrophic conditions – means it does not have to oxidize as much of the organic
carbon source for the sake of generating energy (Ibid., 1982). Instead, oxidation of carbon monoxide has
“a saving effect with respect to the organic substrate”, indeed enabling “the cell to assimilate a larger
portion of the organic substrate than in the absence of CO” (Ibid., 1982).
To conclude, the literature reveals that an interest in H. pseudoflava and other carboxydobacteria was
present in the late 70s and early 80s when they were characterized, and basic physiology was
investigated. The interest in harnessing the ability of microorganisms able to consume single-carbon
containing gases, such as carbon monoxide (CO), carbon dioxide (CO2) and methane (CH4) seems,
however, to be on the rising. The interest in H. pseudoflava in particular has resurfaced more recently
(e.g. Grenz et al., 2019) and this is likely because current times of increasing CO2 levels in the atmosphere
and climate change etc. is boosting incentives to make use of microbial fixation of CO2 (Salehizadeh et al.,
2020).
28
3. Material and methods The MATLAB toolbox RAVEN (v 2.3.0) (Wang et al., 2018) was used in MATLAB (v R2017b) (The
Mathworks Inc.) for genome-wide reconstruction and constraint-based modelling. The toolbox used the
Gurobi Optimizer (v 8.0.1) linear programming (LP) solver. Also, the libSBML MATLAB API (v 5.17.0)
(Hucka et al., 2003) was employed to enable exchange of computational models using the Systems
Biology Markup Language (SBML). Simulations were carried out on an HP ENVY laptop with 8 GB RAM
and an Intel® Core™ i5-4200M 2.50 GHz processor.
The MATLAB-script (HPse.m) along with the resulting GEM for H. pseudoflava (HPseGEM) in .xlsx-format
readily parsible by Excel (Microsoft) is available from the author’s GitHub repository:
https://github.com/Cristopher-O/Systems-Biology. Readers are encouraged to read this report and the
MATLAB-script in parallel for better comprehension of how the reconstruction process transpired.
3.1 Genome-scale metabolic model reconstruction Annotated whole-genome sequencing data of H. pseudoflava previously reported in the literature (Grenz
et al., 2019) accessible at DDBJ/ENA/GenBank under the accessions CP037867 (chromosome) and
CP037868 (megaplasmid pDSM1084) and catalogued in the Kyoto Encyclopedia of Genes and Genomes
(KEGG) database under the KEGG Organism Code ‘hpse’ was used as a basis for reconstruction of a
genome-scale metabolic model using the MATLAB toolbox RAVEN. Wherever possible, relevant
spontaneous, not enzyme-catalyzed reactions were included in the model. However, reactions which
were labelled ‘incomplete’, ‘erroneous’, or ‘unclear’ in KEGG as well as reactions with undefined
stoichiometry were excluded. Likewise, general reactions – e.g., ‘an aldehyde <=> an alcohol’ – or similar
were discarded since they are unsuitable for modelling purposes. Metabolites were differentiated into
either one of two compartments; cytosol or extracellular, as this was deemed sufficiently sophisticated a
model.
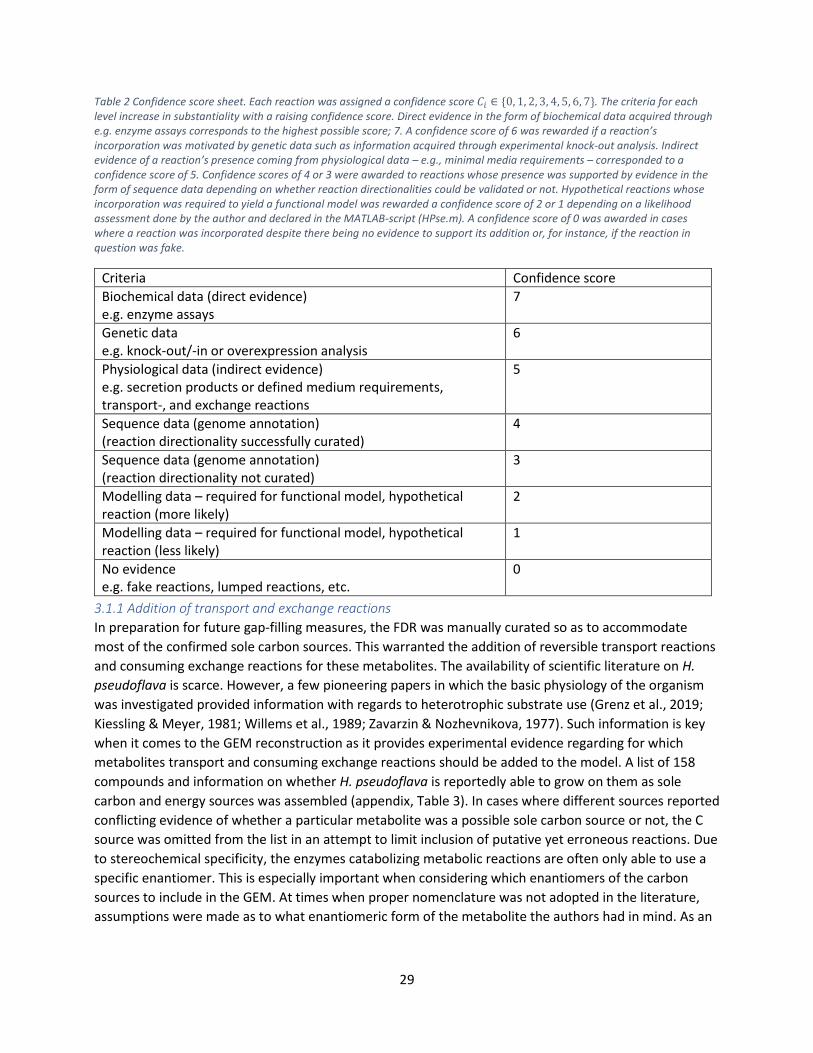
All of the reactions in the model were assigned a confidence score 𝐶𝑖 ∈ {0, 1, 2, 3, 4, 5, 6, 7} to indicate
the likelihood of its actual presence in the reactome of H. pseudoflava. The higher the confidence score,
the better the evidence motivating its incorporation (Table 2).
29
Table 2 Confidence score sheet. Each reaction was assigned a confidence score 𝐶𝑖 ∈ {0, 1, 2, 3, 4, 5, 6, 7}. The criteria for each level increase in substantiality with a raising confidence score. Direct evidence in the form of biochemical data acquired through e.g. enzyme assays corresponds to the highest possible score; 7. A confidence score of 6 was rewarded if a reaction’s incorporation was motivated by genetic data such as information acquired through experimental knock-out analysis. Indirect evidence of a reaction’s presence coming from physiological data – e.g., minimal media requirements – corresponded to a confidence score of 5. Confidence scores of 4 or 3 were awarded to reactions whose presence was supported by evidence in the form of sequence data depending on whether reaction directionalities could be validated or not. Hypothetical reactions whose incorporation was required to yield a functional model was rewarded a confidence score of 2 or 1 depending on a likelihood assessment done by the author and declared in the MATLAB-script (HPse.m). A confidence score of 0 was awarded in cases where a reaction was incorporated despite there being no evidence to support its addition or, for instance, if the reaction in question was fake.
Criteria Confidence score
Biochemical data (direct evidence) e.g. enzyme assays
7
Genetic data e.g. knock-out/-in or overexpression analysis
6
Physiological data (indirect evidence) e.g. secretion products or defined medium requirements, transport-, and exchange reactions
5
Sequence data (genome annotation) (reaction directionality successfully curated)
4
Sequence data (genome annotation) (reaction directionality not curated)
3
Modelling data – required for functional model, hypothetical reaction (more likely)
2
Modelling data – required for functional model, hypothetical reaction (less likely)
1
No evidence e.g. fake reactions, lumped reactions, etc.
0
3.1.1 Addition of transport and exchange reactions
In preparation for future gap-filling measures, the FDR was manually curated so as to accommodate
most of the confirmed sole carbon sources. This warranted the addition of reversible transport reactions
and consuming exchange reactions for these metabolites. The availability of scientific literature on H.
pseudoflava is scarce. However, a few pioneering papers in which the basic physiology of the organism
was investigated provided information with regards to heterotrophic substrate use (Grenz et al., 2019;
Kiessling & Meyer, 1981; Willems et al., 1989; Zavarzin & Nozhevnikova, 1977). Such information is key
when it comes to the GEM reconstruction as it provides experimental evidence regarding for which
metabolites transport and consuming exchange reactions should be added to the model. A list of 158
compounds and information on whether H. pseudoflava is reportedly able to grow on them as sole
carbon and energy sources was assembled (appendix, Table 3). In cases where different sources reported
conflicting evidence of whether a particular metabolite was a possible sole carbon source or not, the C
source was omitted from the list in an attempt to limit inclusion of putative yet erroneous reactions. Due
to stereochemical specificity, the enzymes catabolizing metabolic reactions are often only able to use a
specific enantiomer. This is especially important when considering which enantiomers of the carbon
sources to include in the GEM. At times when proper nomenclature was not adopted in the literature,
assumptions were made as to what enantiomeric form of the metabolite the authors had in mind. As an
30
example, by ’Galactose’, Zavarzin & Nozhevnikova was presumed to mean ’D-Galactose’ (see 1977). This
and similar assumptions are stated in the aforementioned table in the appendices (appendix, Table 3).
The experimentally verified sole carbon sources were categorized into one of five categories. What
category a particular sole carbon source was categorized into is indicated by numbers ranging from 1 to
5 (see appendix, Table 3). Category 1 encompassed compounds which were already present in the FDR
meaning they were successfully captured by the automatic sequence-based reconstruction. As such,
these metabolites had an obvious way of being incorporated into the model as reactions were already in
place to metabolize these substrates. However, some of the substrates that H. pseudoflava has been
known to grow on did not have an obvious route in to the crude FDR and hence necessitated
concomitant reaction additions in order to be functionally incorporated into the network. These were
assigned to category 2. In the KEGG database, all of the reactions a particular metabolite is known to
participate in is readily traceable. Therefore, reactions suitable for addition in conjunction with transport
and consuming exchange reactions for the metabolites in category 2 could be examined manually and
then added. Sometimes one out of several possible reactions were chosen arbitrarily. Information on
these reactions along with a short motivation on why a particular reaction was chosen for addition is
available in the appendices (appendix, Table 4). Category 3 consisted of Azelaic acid (C08261),
Butylamine (C18706), Sebacic acid (C08277), Suberic acid (C08278) and D-Turanose (C19636). These
compounds had no known reaction association in KEGG and was therefore discarded from the GEM.
Similarly, compounds in category 4 – Benzylamine (C15562) and Salicin (C01451) – lacked feasible
reaction associations and were thus discarded. Finally, category 5 included the compounds Amylamine,
Methyl-β-D-Xyloside and Levulinate which were discarded as no entries for these particular compounds
could be found in the KEGG compound database.
Since H. pseudoflava is able to oxidize hydrogen (H2) for energy, a transport and consuming exchange
reaction was added for it as well. A transport and consuming exchange reaction was also added for
ammonia to supply the GEM with an N-source. Being an obligate aerobe, H. pseudoflava needs oxygen
(O2) to survive which justified adding a transport reaction along with both consuming and producing
exchange reactions for O2. Similarly, a transport reaction along with both a consuming and a producing
exchange reaction was added for water. Producing exchange reactions were also added for CO and CO2,
allowing reactions in which CO is split off and decarboxylating reactions to proceed unhampered. Finally,
although not experimentally verified, producing exchange reactions were added for glycerol and acetate
as excretion of these compounds are commonly observed in other microorganisms and often occur as a
consequence of cells having to re-oxidize NADH and NADPH. These two producing exchange reactions
were assigned a confidence score of 2 to reflect the lack of evidence in support of their actual presence.
3.1.2 Manual curation of reaction directionalities
For the purpose of curating reaction directionalities, the MetaCyc database (Caspi et al., 2017)
containing reactions whose directionalities have been curated manually by trained scientists were
advised. URLs pointing to specific entries in the MetaCyc database from which information on reaction
directionalities were taken are provided in the MATLAB-script for each and every intracellular reaction in
HPseGEM. The confidence score of reactions in the FDR whose reaction directionality could not be
validated were lowered from 4 to 3 (Table 2). These reactions were constrained with arbitrarily large
lower and upper bounds of -1000 and 1000 mmol gCDW-1 h-1 respectively so as to avoid accidentally
prohibiting any of these reactions from carrying flux.
31
3.1.3 Incorporation of an artificial biomass reaction
The artificial biomass reaction adapted for the purpose of simulating production of biomass – i.e.,
growth – was adapted from the GEM RehMBEL1391_sbml_L3V1 on Cupriavidus necator H16 (formerly
Ralstonia eutropha H16) originally reported by Park et al. (2011) and available in an updated version
from the GitHub-repository of GitHub-user m-jahn (https://github.com/m-jahn/genome-scale-models).
The adapted biomass reaction was designed as a lumping together of the following biomolecular pools:
lipopolisaccharide, RNA, carbohydrate, phospholipid, peptidoglycan, protein, cofactors and vitamines
and DNA. Accordingly, artificial biosynthesis reactions for each of these pools had to be adapted as well.
All of these artificial reactions were assigned confidence scores of 0 to reflect the fact that no
computational or experimental efforts were done to check their eligibility in the specific case of H.
pseudoflava. Upon integration into HPseGEM, metabolite IDs pertaining to biomass precursors were
harmonized with KEGG-based terminology.
32
4. Results and discussion Central to the metabolic engineering of H. pseudoflava, a draft genome-scale metabolic model was
assembled with the impending aim of accurately predicting growth rates and production rates of
valuable metabolites on different substrates. This GEM, HPseGEM, is the first ever reported for H.
pseudoflava and it is publicly available from the author’s GitHub repository. A system has been set up for
provenance tracking. Attempts were made throughout reconstruction to keep the workflow
reproducible, the chief intent being to ensure interoperability and facilitate future reuse and curation by
the community. Care was taken to provide detailed explanations in the MATLAB-script ‘HPse.m’
accompanying the present thesis which offers a fully transparent picture of how the reconstruction
process transpired step-by-step.
Having compared the features of available GEM reconstruction software, the RAVEN toolbox for the
MATLAB suite was singled out due to its unequalled comprehensiveness (see Table 1 in Wang et al.,
2018). Employing RAVEN for automatic sequence-based reconstruction yielded a first draft
reconstruction (FDR) consisting of 1367 reactions, 1583 metabolites and 914 genes. Many published
GEMs of other organisms are not even that comprehensive, so the coverage of the FDR alone was
remarkably good and laid the foundation for a good quality model. When GEMs are reconstructed on the
basis of information from a variety of databases and similar sources, manual curation is often times
necessarily performed so as to harmonize metabolite and reaction names. In the case of HPseGEM, such
efforts were circumvented as the algorithms responsible for this reconstruction yielded an FDR fully
founded on KEGG terminology meaning that e.g. reaction IDs and metabolite IDs are derived from and
thus fully compatible with the KEGG database. Having HPseGEM stay consistent with a well-established
database is a great advantage as it facilitates future development of the model – something which is
often hampered by terminology inconsistencies. However, the gene-protein-reaction associations at the
core of the FDR, which were based on gene annotations specifically available for H. pseudoflava in the
KEGG database may not be properly updated. The author was made aware of instances when this had
been the case for at least one other organism. This is indeed a potential problem as GEM reconstruction
relies heavily on the querying of KEGG and similar databases. Fortunately, the solution is obvious
although not necessarily a task typically assigned to scientists engaged in GEM reconstruction; more
effort is needed to keep the databases up-to-date.
Transport and consuming exchange reactions for CO and CO2 were added along with 63 heterotrophic
sole carbon sources. As such, HPseGEM successfully accounts for the wide heterotrophic substrate range
exhibited by H. pseudoflava. However, the meager data available to support the actual presence of
added producing exchange reactions made the incorporation of such reactions into HPseGEM very
uncertain. This is likely often the case during GEM reconstruction, especially when the organism in
question is not very well investigated. This is expected to potentially have a big impact on the flux
distributions to be computed in the future using FBA as these are highly dependent on the availability of
producing exchange reactions through which carbon is allowed to leave the system. To mediate this,
qualitative metabolomics could be used to identify as well as validate the excretion capabilities of H.
pseudoflava experimentally. This information could then be used to add appropriately verified producing
exchange reactions to the model, along with transport reactions.
Since the KEGG reaction database does not contain transport reactions, these were not captured in the
FDR. Instead, transport reactions were added manually and all but one lack gene associations. The only
transport reaction with which a gene could be connected was that of ammonia. This gene (HPF_19190)
33
was found annotated accordingly in the MetaCyc database and the gene association was added
manually. Since proteins responsible for transport of various metabolites tend to have very similar
membrane domains, no further attempts were made to identify the genes encoding the transport
proteins.
As no benchmark GEM for H. pseudoflava or a phylogenetically closely related organism such as another
carboxydotroph currently exists, there were no template GEMs available from which to adapt reactions.
This severely complicated the prospect of accurate gap-filling. Nor could an established biomass reaction
for H. pseudoflava in particular be adapted, instead this reaction was seized from a GEM on Cupriavidus
necator. Like H. pseudoflava, C. necator is a Gram-negative betaproteobacterium capable of carbon
fixation. For this reason, appropriating the biomass reaction from a GEM on Cupriavidus necator strain
H16, RehMBEL1391_sbml_L3V1, was deemed a sufficient compromise. Additional artificial reactions for
biomolecular pools making up the biomass reaction were also added. These were formulated as
biosynthesis reactions made of various precursor metabolites. Out of all these precursors, only three –
ADP-L-glycero-D-manno-heptose, CDP-ethanolamine and UDP-N-acetyl-D-galactosamine – were not
already present in the FDR which was taken as another token of the comprehensiveness of the FDR.
Ideally, the biomass composition for H. pseudoflava should be determined experimentally or – albeit a
less reliable option – estimated computationally. Unfortunately, neither experimental nor computational
well-established protocols exist for the determination of precursor composition. Therefore, such
endeavours were never entertained in the present reconstruction. Nonetheless, adapting the biomass
reaction from the GEM on C. necator still appeared as a superior alternative to employing a generic
biomass equation as the organisms have much in common, autotrophic growth in particular.
The only gap-filling that was performed involved making sure all of the 63 possible heterotrophic carbon
sources were connected reaction-wise with the FDR. The model is thus in need of further gap-filling
before simulation of growth is possible. The number of dead-end reactions amounted to 767. However,
these stats are to be viewed somewhat dubiously as it was noticed that even small changes to the
repertoire of reactions can have a dramatic effect on the number of dead-end reactions. Nevertheless, it
ought to be somewhat safe to say that the model’s coverage of primary as well as secondary metabolism
would be improved significantly by a proper round of gap-filling. It would be a gross statement to claim
that the present GEM has captured the complete set of metabolic reactions available to H. pseudoflava.
Reaching such levels of comprehensiveness would have been very difficult without extensive gap-filling.
One could even argue that it is currently somewhat of an utopia to succeed in reconstructing such a GEM
as the magnitude of biochemical knowledge such endeavors would require simply is not there. There is
currently no way of knowing exactly how many reactions there are for a particular organism, which in
turn means there are no means by which one can say for certain to what extent a GEM has captured the
complete metabolism. This is especially the case for less characterized organisms. Even the RAVEN
developers claim that practically all GEMs contain errors and even indicate that the skill of the GEM
creator is measured more on the basis of her ability to make the model do stuff it is not really willing to
do rather than the ability to reconstruct an error free model exhibiting a lot of breadth. At some point
during the reconstruction process, the validity of this statement is bound to become clear. In the case of
HPseGEM, the original intention of reconstructing a very thorough GEM for H. pseudoflava – however
noble – was reduced to that of a simpler model. The current GEM still forms a high-quality foundation on
which to build and will eventually be able to account for the original research questions.
34
When it comes to reconstruction and gap-filling in particular, resorting to assumption often times
prevails as the only option at hand and deciding on a point of development sophisticated enough to be
content with will inevitably always entail a certain amount of risk. This perfectly illustrates why
reconstruction tends to end up being a trade-off between simplicity on the one hand, and biological
accuracy on the other. All efforts may not necessarily help with whatever the purpose of acquiring a
particular GEM might be. Ultimately, how comprehensive a model has to be will depend on the purpose
the model attempts to account for. Even though the risk of introducing erroneous reactions is perhaps
unavoidable, there is possibly a lot to gain from attempts at moving away from manual curation to
whatever extent possible. The main issue with manual curation lies in the fact that the quality of the
model will depend heavily on the judgment of whoever created the GEM. Having more systematic means
by which to carry out gap-filling and subsequent reaction pruning might alleviate this. Fortunately, some
reactions occur in almost all organisms and, as a first step in this direction, there is software that can
attempt to fill the gaps of incomplete networks using such highly conserved reactions (e.g. Cuevas et al.,
2016). It is likely that the quality of HPseGEM could be benefitted by such measures. Moreover, as GEMs
for more and more organisms are created, an increasing availability of other models to compare with will
definitely assist in reconstruction through exploiting the homology of existing template GEMs.
As the KEGG and MetaCyc databases often differ in terms of coverage, they tend to provide
complementary information which would ideally be capitalized on by merging models reconstructed
using the respective databases. The present model was reconstructed by querying KEGG for a priori
supplied annotations available for H. pseudoflava. However, both KEGG and MetaCyc can also be
employed for de novo reconstructions using RAVEN. In these cases, the protein sequences of H.
pseudoflava are fed to algorithms that then query these for similarity to Hidden Markov Models (HMMs)
trained on genes annotated in KEGG, or use BLASTP to search for homology with enzymes curated in the
MetaCyc database. Such de novo reconstructions would likely capture additional reactions that would
otherwise have been lost. Since the sequence-based step of reconstruction tends to be the most reliable,
using the full spectrum of available computational reconstruction methods and then merging the results
of each into a single FDR would likely be the best way to expand the coverage of the GEM.
Despite the precariousness of the situation, it is estimated that HPseGEM will be of interest for the
broader research community working with H. pseudoflava now and in the future. More specifically, the
model is expected to be used extensively to simulate lithoautotrophic and carboxydotrophic growth
once it is able to accommodate growth, which is difficult to investigate in the laboratory due to
expensive and low-throughput equipment. Moreover, investigating the capacity of H. pseudoflava to
grow on syngas or similar gas mixtures experimentally is also quite dangerous as these gas mixtures risk
causing asphyxiation and may be explosive. Having the possibility of evaluating the biocapacity of H.
pseudoflava in silico is thus extra valuable in the case of H. pseudoflava as it would allow scientists to
bypass dangerous laboratory work.
As in the case of any other already existing GEM, users always have the opportunity to update the model
and curate it as and when needed. This is often the case when a previously created model is employed to
tackle a new problem – something which may very well begin with a process of revising the model with
information available in up-to-date databases (e.g. Shabestary & Hudson, 2016). Needless to say,
curating an already existing model first entails unravelling new biological information and it is an
inescapable fact that the development of genome-scale metabolic models hinges on the incremental
advancements of functional genomics studies. Should the efficacy of genome-scale metabolic models be
35
recognized more widely henceforth, this can be expected to result in a growing incentive to update
GEMs in a more systematic manner. This is where well-established software and toolboxes like RAVEN
and Constraint-Based Reconstruction and Analysis (COBRA) (Heirendt et al., 2019) will play a key role as
they could provide the means by which models could be synchronized with databases in a close-to
automated fashion. Evolving the functionality of such software and increasing the quality of the queried
databases is also what will mediate the fact that GEM reconstruction tends to be quite time-consuming.
The possibility of quickening the reconstruction process would arguably increase the popularity of GEMs
which is why such efforts are important.
The final draft GEM for H. pseudoflava contained 1537 reactions, 1679 metabolites, and 915 genes.
Numerous rounds of iteration thus yielded a final genome-specific stoichiometric matrix of the
dimensions 1679 × 1537. The current model does not admit of any regulatory processes; all genes
identified and annotated are assumed to be expressed as well as functional. This is almost guaranteed
not the case in reality but it is still somewhat of a reasonable first approximation. Gathering gene
expression information (transcriptomics) and determining the presence and abundance of transcription
factors (proteomics) etc. could alleviate this issue as integration of such data into GEMs could make
them account for regulatory processes. Systems biology also offers more complex ways to further
elucidate the mechanisms involved in the regulation of metabolism. For instance, GEMs can be
integrated with transcriptional regulatory networks (TRNs) as well as protein-protein interaction
networks (PPINs) but it remains to be seen if this will ever be done for H. pseudoflava. Currently, such
endeavors are mostly deemed worthwhile only for very well-characterized organisms and specific cell
types. Lee et al., for instance, pursued a greater level of understanding of the mechanisms underlying
disease in hepatocytes by integrating GEMs with TRNs and PPINs (2016).
As no experimental efforts were carried out and because the literature on H. pseudoflava is scarce, the
highest confidence score that could be assigned to a reaction in the GEM was 5 out of 7. This means the
strongest kind of evidence of a reaction’s actual presence in the organism came from physiological data.
To substantiate the presence of such hypothetical reactions even further, enzyme assays etc. could be
performed. More importantly though, BLAST could be employed in an attempt to annotate genetic
material responsible for putative reactions currently lacking gene associations. Indeed, one of the most
important characteristics of a high-quality GEM is the degree to which the reactions in a GEM are
properly annotated. This is the case for the simple reason that a high degree of annotation ought to
correlate well with biological correctness; if a reaction can be associated with a gene it is more likely that
it is actually present in the organism. In the case of HPseGEM, the level of annotation was quite high. In
fact, 1235 out of 1249 (~99%) intracellular reactions were successfully annotated. However, this level of
annotation is expected to decrease as a consequence of the gap-filling which remains to be done for the
achievement of a growing model.
The draft GEM for H. pseudoflava containing reaction formulas as per the KEGG database had to be
curated as reaction directionalities are not properly curated in the KEGG reaction database per default.
Hence, constraining the directionality of every single reaction prompted intensive manual curation. All
but 145 intracellular reactions (~10% of all intracellular reactions) were successfully constrained in a
manner so as to adhere with validated reaction directionalities reported in the MetaCyc database or
elsewhere. This step was extremely time-consuming. When reaction directionalities pertaining to large
amounts of reactions are curated manually there is also a substantial risk of introducing errors by
mistake. Needless to say, having the means to curate reaction directionalities automatically would be
36
greatly beneficial. This, however, would again involve circumventing the oft-mentioned issue pertaining
to reaction and metabolite identifiers being different in separate databases.
Naturally, models are only as good as the extent to which they accurately mimic real biological
processes. HPseGEM, by virtue of being a metabolic model derived from the genome, is not solely
supposed to be accurately predictive, but also accurately descriptive. Therefore, both the reconstructed
network as well as the future flux predictions ought to be verified through experimental studies to
ensure consistency with actual biology. The metabolic network topology of HPseGEM was never
validated as gene essentiality data was not obtained nor available from previous work. The acquisition of
such data is, however, quite possible to obtain. With access to experimentally derived gene essentiality
data, validating the network topology would then have been a matter of determining which single-gene
deletions (SGDs) renders flux through the BOF impossible for each sole carbon source, and then
comparing simulated gene essentiality with actual gene essentiality. This would have been a natural next
step in order to produce a more accurate GEM.
For future validation of the predictive ability of the GEM, experimentally determined biomass-specific
uptake rates along with growth rates are required. As a starting point, Grenz et al. has made available
uptake rates from quasi steady-state conditions estimated from batch cultivations when cells were
growing in the exponential phase at their maximal growth rate, 𝜇𝑚𝑎𝑥 (2019). It would be better to
constrain the model using data from chemostat cultivations where the steady-state condition is actually
achieved, as such data would be more reliable. It would also be good to validate the flux predictions
using larger datasets which unfortunately are not yet available for H. pseudoflava. A lack of biochemical
data is difficult to circumvent in the reconstruction of a GEM for any organism. Unfortunately, there is a
rather small incentive to acquire vast amounts of biochemical data for H. pseudoflava compared to e.g.
E. coli. It is an inescapable fact that model-driven aspirations to better explore and analyze the
metabolism of a species definitely favors the well-characterized organisms.
In HPseGEM, the reaction bounds for many intracellular reactions are currently constrained with
arbitrarily large positive (or negative) integers. For all practical purposes, the GEM thus allows very large
fluxes through its reactions despite the fact that many enzyme-catalyzed reactions are associated with
very slow metabolite conversion rates, i.e. small reaction fluxes. To further constrict the solution space
that defines the phenotypical potential of H. pseudoflava, specific upper limits (𝑣𝑚𝑎𝑥) based on enzyme
capacity measurements could be used to constrain the reaction bounds in a more realistic manner. The
more relevant the constraints, the better the biological accuracy. Constraining the solution space even
further by incorporating kinetics likely make the flux predictions even more accurate. This, however, is
cumbersome as taking kinetic parameters into account would entail expanding the utility of FBA.
Another alternative would be to use experimental flux measurements based on stable isotope tracers
(e.g. 13C) to reduce the solution space. Such experiments could also provide the means to experimentally
determine how actual flux is distributed between different pathways.
As an interesting side-note, a reaction which would enable H. pseudoflava to oxidize methane appeared
as a consequence of the sequence-based reconstruction. Yet, the typical gas utilization pattern of
carboxydotrophs allegedly does not include methane (Zavarzin & Nozhevnikova, 1977). In other words,
there is a discrepancy between what information on the genome-level suggests and what Zavarzin and
Nozhevnikova found through experimental efforts. No mention of this discrepancy appeared in the
scientific paper by Grenz et al. in spite of the fact that they were the ones who performed whole-
37
genome sequencing (2019). This is a major finding and definitely warrants a new round of growth
experiments to check whether methane-oxidation truly is not possible. Unless the methane oxidizing
reaction appears due to erroneous annotation, which is not very likely, a methane oxidizing activity of H.
pseudoflava might have been missed by Zavarzin and Nozhevnikova. Perhaps transcription of the genes
encoding the enzyme responsible for methane oxidization were down-regulated under the conditions
investigated by the two scientists back in the late ‘70s. If so, there is a chance that the utility of H.
pseudoflava is even greater than originally anticipated. The C1-gas utilization pattern of H. pseudoflava
already includes CO and CO2, but if it is able to oxidize CH4 as well that would likely make it an even more
attractive host.
It is well worth mentioning as well that the impending step of gap-filling of HPseGEM, as well as of GEMs
in general, has the potential of providing positive feedback to the development of genome annotation.
Identifying missing reactions as a consequence of gap-filling can provide important clues regarding the
functions of the still unannotated genetic material (e.g. Mardinoglu et al., 2014; Wang et al., 2018).
Indeed, this can work to narrow down “the search space of functional roles the genetic material may be
associated with” (Cuevas et al., 2016). Needless to say, harnessing such information will likely be of great
interest. As such, genome-scale metabolic models such as HPseGEM stand a good chance of providing
crucial input to the vast databases on biological information from whence they were once sprung.
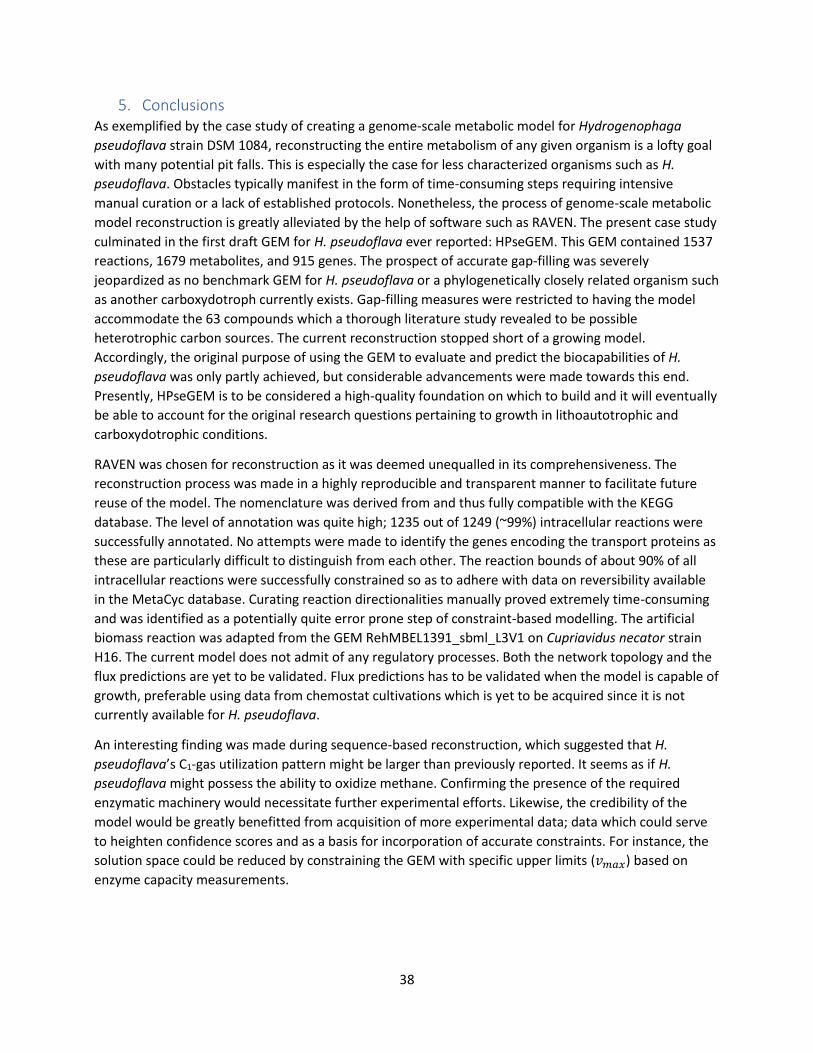
38
5. Conclusions As exemplified by the case study of creating a genome-scale metabolic model for Hydrogenophaga
pseudoflava strain DSM 1084, reconstructing the entire metabolism of any given organism is a lofty goal
with many potential pit falls. This is especially the case for less characterized organisms such as H.
pseudoflava. Obstacles typically manifest in the form of time-consuming steps requiring intensive
manual curation or a lack of established protocols. Nonetheless, the process of genome-scale metabolic
model reconstruction is greatly alleviated by the help of software such as RAVEN. The present case study
culminated in the first draft GEM for H. pseudoflava ever reported: HPseGEM. This GEM contained 1537
reactions, 1679 metabolites, and 915 genes. The prospect of accurate gap-filling was severely
jeopardized as no benchmark GEM for H. pseudoflava or a phylogenetically closely related organism such
as another carboxydotroph currently exists. Gap-filling measures were restricted to having the model
accommodate the 63 compounds which a thorough literature study revealed to be possible
heterotrophic carbon sources. The current reconstruction stopped short of a growing model.
Accordingly, the original purpose of using the GEM to evaluate and predict the biocapabilities of H.
pseudoflava was only partly achieved, but considerable advancements were made towards this end.
Presently, HPseGEM is to be considered a high-quality foundation on which to build and it will eventually
be able to account for the original research questions pertaining to growth in lithoautotrophic and
carboxydotrophic conditions.
RAVEN was chosen for reconstruction as it was deemed unequalled in its comprehensiveness. The
reconstruction process was made in a highly reproducible and transparent manner to facilitate future
reuse of the model. The nomenclature was derived from and thus fully compatible with the KEGG
database. The level of annotation was quite high; 1235 out of 1249 (~99%) intracellular reactions were
successfully annotated. No attempts were made to identify the genes encoding the transport proteins as
these are particularly difficult to distinguish from each other. The reaction bounds of about 90% of all
intracellular reactions were successfully constrained so as to adhere with data on reversibility available
in the MetaCyc database. Curating reaction directionalities manually proved extremely time-consuming
and was identified as a potentially quite error prone step of constraint-based modelling. The artificial
biomass reaction was adapted from the GEM RehMBEL1391_sbml_L3V1 on Cupriavidus necator strain
H16. The current model does not admit of any regulatory processes. Both the network topology and the
flux predictions are yet to be validated. Flux predictions has to be validated when the model is capable of
growth, preferable using data from chemostat cultivations which is yet to be acquired since it is not
currently available for H. pseudoflava.
An interesting finding was made during sequence-based reconstruction, which suggested that H.
pseudoflava’s C1-gas utilization pattern might be larger than previously reported. It seems as if H.
pseudoflava might possess the ability to oxidize methane. Confirming the presence of the required
enzymatic machinery would necessitate further experimental efforts. Likewise, the credibility of the
model would be greatly benefitted from acquisition of more experimental data; data which could serve
to heighten confidence scores and as a basis for incorporation of accurate constraints. For instance, the
solution space could be reduced by constraining the GEM with specific upper limits (𝑣𝑚𝑎𝑥) based on
enzyme capacity measurements.
39
References Alagesan S, Minton N, Malys N (2018) 13C-assisted metabolic flux analysis to investigate heterotrophic
and mixotrophic metabolism in Cupriavidus necator H16. Metabolomics 14:9
Becker S, Feist A, Mo M, Hannum G, Palsson B, Herrgard M (2007) Quantitative prediction of cellular
metabolism with constraint-based models: the COBRA Toolbox. Nat Protoc 2:3:727-738
Benedict M, Mundy M, Henry C, Chia N, Price N (2014) Likelihood-based gene annotations for gap filling
and quality assessment in genome-scale metabolic models. PLoS Comput Biol 10:10
Berg J, Tymoczko J, Stryer L (2006) Biochemistry. 6th ed. W.H Freeman Company. New York, USA
Brown T (2010) Gene cloning & DNA analysis: an introduction. 6th ed. Malaysia: Wiley-Blackwell
Caspi R, Bilington R, Fulcher C, Keseler I, Kothari A, Krummenacker M, Latendresse M, Midford P, Ong Q,
Kit Ong W, Paley S, Subhraveti P, Karp P (2017) The MetaCyc database of metabolic pathways and
enzymes. Nucleic Acids Res 46:D1:633-639
Chan S, Loscalzo J (2012) The emerging paradigm of network medicine in the study of human disease.
Circ Res 111:3:359-374
Cuevas D, Edirisinghe J, Henry C, Overbeek R, O’Connell T, Edwards R (2016) From DNA to FBA: how to
build your own genome-scale metabolic model. Front Microbiol 7
Cypionka H, Meyer O, Schlegel H.G. (1980) Physiological Characteristics of Various Species of Strains of
Carboxydobacteria. Arch Microbiol 127:301-307
Edwards J, Palsson B (2000) The Escherichia coli MG1655 in silico metabolic genotype: Its definition,
characteristics, and capabilities. PNAS 97:10:5528-5533
Feist A, Henry C, Reed J, Krummenacker M, Joyce A, Karp P. Broadbelt L, Hatzimanikatis V, Palsson B
(2007) A genome‐scale metabolic reconstruction for Escherichia coli K‐12 MG1655 that accounts for
1260 ORFs and thermodynamic information. Mol Sys Biol 3:121
Förster J, Famili I, Fu P, Palsson B, Nielsen J (2003) Genome-scale reconstruction of the Saccharomyces
cerevisiae metabolic network. Genome Res 13:2:244-253
Grenz S, Baumann P, Rückert C, Nebel B, Siebert D, Schwentner A, Eikmanns B, Hauer B, Kalinowski J,
Takors R, Blombach B (2019) Exploiting Hydrogenophaga pseudoflava for aerobic syngas-based
production of chemicals. Metab Eng 55:220-230
Hagrot E, Æsa Oddsdóttir H, Mäkinen M, Forsgren A, Chotteau V (2019) Novel column generation-based
optimization approach for poly-pathway kinetic model applied to CHO cell culture. Metab Eng Commun 8
Heirendt L, Arreckx S, Pfau T, Mendoza S, Richelle A, Heinken A, Haraldsdóttir H, Wachowiak J, Keating S,
Vlasov V, Magnusdóttir S, Ng C.Y., Preciat G, Žagare A, Chan S, Aurich M, Clancy C, Modamio J, Sauls J,
Noronha A, Bordbar A, Cousins B, El Assal D, Valcarcel L, Apaolaza I, Ghaderi S, Ahookhosh M, Ben Gebila
M, Kostromins A, Sompairac N, Le H, Ma D, Sun Y, Wang L, Yurkovich J, Oliveira M, Vuong P, El Assal L,
Kuperstein I, Zinovyev A, Hinton S, Bryant W, Aragon Artacho F, Planes F, Stalidzans E, Maass A, Vempala
S, Hucka M, Saunders M, Maranas C, Lewis N, Sauter T, Palsson B, Thiele I, Fleming R (2019) Creation and
analysis of biochemical constraint-based models using the COBRA Toolbox 3.0. Nat Protoc 14:639-702
40
Hucka M, Finney A, Sauro H.M., Bolouri H, Doyle J.C., Kitano H, Arkin A.P., Bornstein B.J., Bray D, Cornish-
Bowden A, Cuellar A.A., Dronov S, Gilles E.D., Ginkel M, Gor V, Goryanin I.I., Hedley W.J., Hodgman TC,
Hofmeyr J-H, Hunter P.J., Juty N.S., Kasberger J.L., Kremling A, Kummer U, Le Novère N, Loew L.M., Lucio
D, Mendes P, Minch E, Mjolsness E.D., Nakayama Y, Nelson M.R., Nielsen P.F., Sakurada T, Schaff J.C.,
Shapiro B.E., Shimizu T.S., Spence H.D., Stelling J, Takahashi K, Tomita M, Wagner J, Wang J (2003) The
systems biology markup language (SBML): a medium for representation and exchange of biochemical
network models. Bioinformatics 19:4:524-531
Janasch M (2015)A kinetically-constrained FBA-model of the synthesis of aromatic amino acid-derived
products in Saccharomyces cerevisiae. M. Sc. Thesis in Biotechnology. Chalmers University of
Technology, Göteborg
Kharchenko P, Vitkup D, Church G (2004) Filling gaps in a metabolic network using expression
information. Bioinformatics 20:i178-i185
Kiessling M, Meyer O (1982) Profitable oxidation of carbon monoxide or hydrogen during heterotrophic
growth of Pseudomonas carboxydoflava. FEMS Microbiol Lett 13:333-338
Kildegaard K, Jensen N, Schneider K, Czarnotta E, Özdemir E, Klein T, Maury J, Ebert B, Christensen H,
Chen Y, Kim I-K, Herrgård M, Blank L, Forster J, Nielsen J, Borodina I (2016) Engineering and systems-level
analysis of Saccharomyces cerevisiae for production of 3-hydroxypropionic acid via malonyl-CoA
reductase-dependent pathway. Microb Cell Fact 15:53
Lee S, Zhang C, Kilicarslan M, Piening B, Björnson E, Hallström B, Groen A, Ferrannini E, Laakso M, Snyder
M, Bluher M, Uhlèn M, Nielsen J, Hohmann S, Lee SY, Stephanopoulos G (2017) Systems Biology 6. Wiley-
VCH
Li Y, Ge X (2016) Advances in Bioenergy 1. Elsevier Inc
Lieven C, Beber M, Olivier B, Bergmann B, Ataman M, Babaei P, Bartell J, Blank L, Chauhan S, Correia K,
Diener C, Dräger A, Ebert B, Edirisinghe J, Faria J, Feist A, Fengos G, Fleming R, García-Jiménez B,
Hatzimanikatis V, van Helvoirt W, Henry C, Hermjakob H, Herrgård M, Kaafarani A, Uk Kim H, King Z,
Klamt S, Klipp E, Koehorst J, König M, Lakshmanan M, Lee D-Y, Lee SY, Lee S, Lewis N, Liu F, Ma H,
Machado D, Mahadevan R, Maia P, Mardinoglu A, Medlock G, Monk J, Nielsen J, Keld Nielsen L, Nogales
J, Nookaew I, Palsson B, Papin J, Patil K, Polman M, Price N, Resendis-Antonio O, Richelle A, Rocha I,
Sánchez B, Schaap P, Malik Sheriff R, Shoaie S, Sonnenschein N, Teusink B, Vilaça P, Vik J.O., Wodke J,
Xavier J, Yuan Q, Zakhartsev M, Zhang C (2020) MEMOTE for standardized genome-scale metabolic
model testing. Nat Biotechnol 38:3:272-276
Macmillan learning,
https://www.macmillanhighered.com/BrainHoney/Resource/6716/digital_first_content/trunk/test/hillis
2e/hillis2e_ch03_5.html. Accessed 20190109.
Marcišauskas S, Ji B, Nielsen J (2019) Reconstruction and analysis of a Kluyveromyces marxianus genome-
scale metabolic model. Bioinformatics 20:551
Mardinoglu A, Ågren R, Kampf C, Asplund A, Nookaew I, Jacobson P, Walley A, Froguel P, Carlsson L,
Uhlén M, Nielsen J (2013) Integration of clinical data with a genome-scale metabolic model of the human
adipocyte. Mol Sys Biol 9:649
41
Mardinoglu A, Ågren R, Kampf C, Asplund A, Uhlén M, Nielsen J (2014) Genome-scale metabolic
modelling of hepatocytes reveals serine deficiency in patients with non-alcoholic fatty liver disease Nat
Commun 5
Meyer O (1980) Using Carbon Monoxide to Produce Single-Cell Protein. BioScience 30:6:405-407
Nielsen J, Smith U, Serlie M, Boren J, Mardinoglu A (2016) Integrated network analysis reveals an
association between plasma mannose levels and insulin resistance. Cell Metab 24:1:172-184
Orth J, Thiele I, Palsson B (2010) What is flux balance analysis. Comput Biol 28:3:245-248
Park JM, Kim TY, Lee SY (2011) Genome-scale reconstruction and in silico analysis of the Ralstonia
eutropha H16 for polyhydroxyalkanoate synthesis, lithoautotrophic growth, and 2-methyl citric acid
production. BMC Syst Biol 5:101
Price N, Reed J, Palsson B (2004) Genome-scale models of microbial cells: evaluating the consequences
of constraints. Nat Rev Microbiol 2:11:886-897
Rok Choi K, Dae Jang W, Yang D, Sung Cho J, Park D, Lee SY (2019) Systems metabolic engineering
strategies: integrating systems and synthetic biology with metabolic engineering. Trends Biotechnol
37:8:817-837
Villadsen J, Nielsen J, Lidén G (2011) Bioreaction Engineering Principles. 3rd ed. Germany: Springer
Science+Business Media, LLC
Rajula H.S.R., Mauri M, Fanos V (2018) Scale-free networks in metabolomics. Bioinformation 14:3:140-
144
Salehizadeh H, Yan N, Farnood R (2020) Recent advances in microbial CO2 fixation and conversion to
value-added products. Chem Eng J
Satish Kumar V, Dasika M, Maranas C (2007) Optimization based automated curation of metabolic
reconstructions. BMC Bioinformatics 8:212
Shabestary K, Hudson P (2016) Computational metabolic engineering strategies for growth-coupled
biofuel production by Synechocystis. Metab Eng Commun 3:215-226
Wang H, Marcišauskas S, Sánchez B, Domenzain I, Hermansson D, Ågren R, Nielsen J, Kerkhoven E (2018)
RAVEN 2.0: A versatile toolbox for metabolic network reconstruction and a case study on Streptomyces
coelicolor. PLoS Comput Biol 14:10
Willems A, Busse J, Goor M, Pot B, Falsen E, Jantzen E, Hoste B, Gillis M, Kersters K, Auling G, De Ley J
(1989) Hydrogenophaga, a New Genus of Hydrogen-Oxidizing Bacteria That Includes Hydrogenophaga
flava comb. Nov. (Formerly Pseudomnas flava), Hydrogenophaga palleronii (Formerly Pseudomonas
palleronii), Hydrogenophaga pseudoflava (Formerly Pseudomonas pseudoflava and “Pseudomonas
carboxydoflava”), and Hydrogenophaga taeniospiralis (Formerly Pseudomonas taeniospiralis). Int J Syst
Bacteriol 39:3:319-333
Xavier J, Raosaheb Patil K, Rocha I (2017) Integration of Biomass Formulations of Genome-Scale
Metabolic Models with Experimental Data Reveals Universally Essential Cofactors in Prokaryotes. Metab
Eng 39:200-208

42
Zavarzin G.A., Nozhevnikova A.N. (1977) Aerobic Carboxydobacteria. Microb Ecol 3:4:305-326
Österlund T, Nookaew I, Nielsen J (2012) Fifteen years of large sclae metabolic modeling of yeast:
Developments and impacts. Biotechnol Adv 30:979-988

43
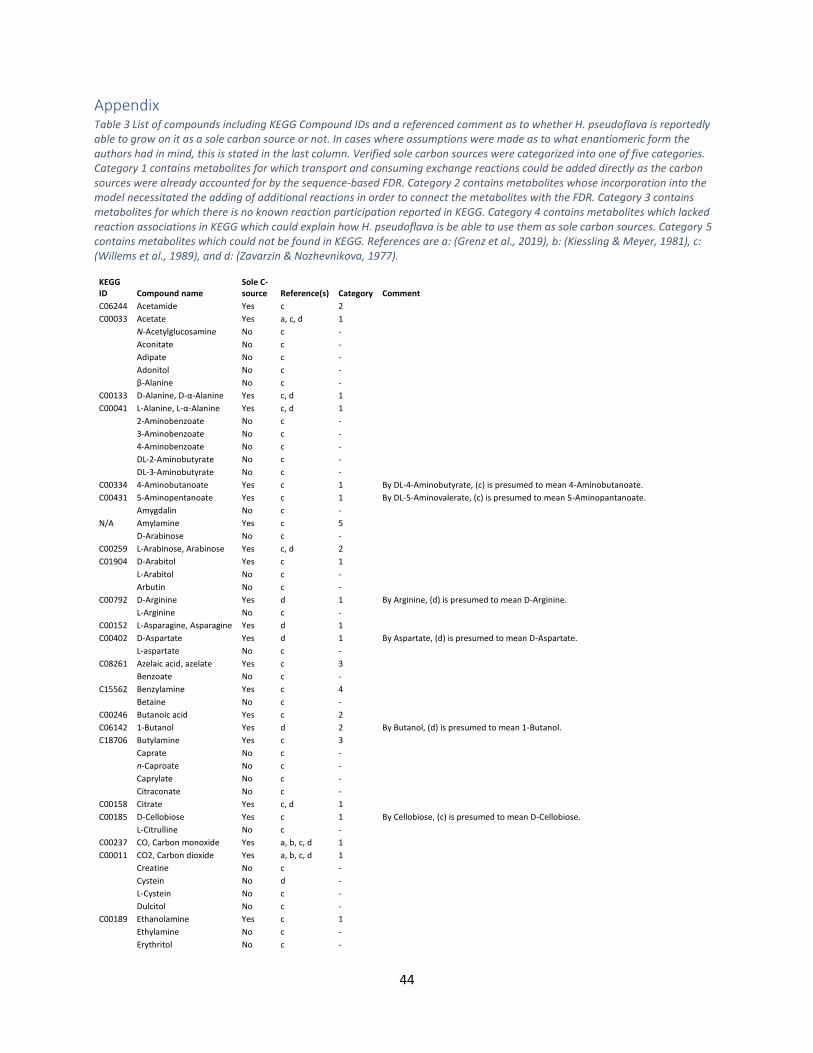
44
Appendix Table 3 List of compounds including KEGG Compound IDs and a referenced comment as to whether H. pseudoflava is reportedly able to grow on it as a sole carbon source or not. In cases where assumptions were made as to what enantiomeric form the authors had in mind, this is stated in the last column. Verified sole carbon sources were categorized into one of five categories. Category 1 contains metabolites for which transport and consuming exchange reactions could be added directly as the carbon sources were already accounted for by the sequence-based FDR. Category 2 contains metabolites whose incorporation into the model necessitated the adding of additional reactions in order to connect the metabolites with the FDR. Category 3 contains metabolites for which there is no known reaction participation reported in KEGG. Category 4 contains metabolites which lacked reaction associations in KEGG which could explain how H. pseudoflava is be able to use them as sole carbon sources. Category 5 contains metabolites which could not be found in KEGG. References are a: (Grenz et al., 2019), b: (Kiessling & Meyer, 1981), c: (Willems et al., 1989), and d: (Zavarzin & Nozhevnikova, 1977).
KEGG ID Compound name
Sole C-source Reference(s) Category Comment
C06244 Acetamide Yes c 2 C00033 Acetate Yes a, c, d 1 N-Acetylglucosamine No c - Aconitate No c - Adipate No c - Adonitol No c - β-Alanine No c - C00133 D-Alanine, D-α-Alanine Yes c, d 1 C00041 L-Alanine, L-α-Alanine Yes c, d 1 2-Aminobenzoate No c - 3-Aminobenzoate No c - 4-Aminobenzoate No c - DL-2-Aminobutyrate No c - DL-3-Aminobutyrate No c - C00334 4-Aminobutanoate Yes c 1 By DL-4-Aminobutyrate, (c) is presumed to mean 4-Aminobutanoate.
C00431 5-Aminopentanoate Yes c 1 By DL-5-Aminovalerate, (c) is presumed to mean 5-Aminopantanoate.
Amygdalin No c - N/A Amylamine Yes c 5 D-Arabinose No c - C00259 L-Arabinose, Arabinose Yes c, d 2 C01904 D-Arabitol Yes c 1 L-Arabitol No c - Arbutin No c - C00792 D-Arginine Yes d 1 By Arginine, (d) is presumed to mean D-Arginine.
L-Arginine No c - C00152 L-Asparagine, Asparagine Yes d 1 C00402 D-Aspartate Yes d 1 By Aspartate, (d) is presumed to mean D-Aspartate.
L-aspartate No c - C08261 Azelaic acid, azelate Yes c 3 Benzoate No c - C15562 Benzylamine Yes c 4 Betaine No c - C00246 Butanoic acid Yes c 2 C06142 1-Butanol Yes d 2 By Butanol, (d) is presumed to mean 1-Butanol.
C18706 Butylamine Yes c 3 Caprate No c - n-Caproate No c - Caprylate No c - Citraconate No c - C00158 Citrate Yes c, d 1 C00185 D-Cellobiose Yes c 1 By Cellobiose, (c) is presumed to mean D-Cellobiose.
L-Citrulline No c - C00237 CO, Carbon monoxide Yes a, b, c, d 1 C00011 CO2, Carbon dioxide Yes a, b, c, d 1 Creatine No c - Cystein No d - L-Cystein No c - Dulcitol No c - C00189 Ethanolamine Yes c 1 Ethylamine No c - Erythritol No c -
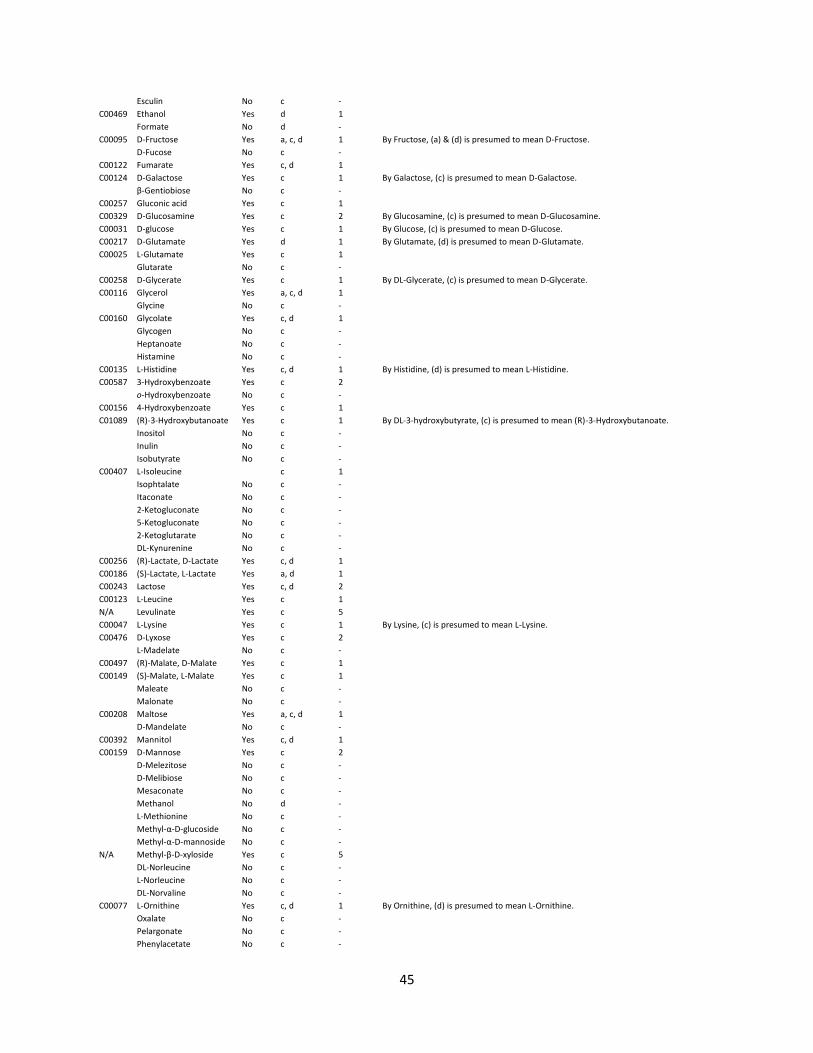
45
Esculin No c - C00469 Ethanol Yes d 1 Formate No d - C00095 D-Fructose Yes a, c, d 1 By Fructose, (a) & (d) is presumed to mean D-Fructose.
D-Fucose No c - C00122 Fumarate Yes c, d 1 C00124 D-Galactose Yes c 1 By Galactose, (c) is presumed to mean D-Galactose.
β-Gentiobiose No c - C00257 Gluconic acid Yes c 1 C00329 D-Glucosamine Yes c 2 By Glucosamine, (c) is presumed to mean D-Glucosamine.
C00031 D-glucose Yes c 1 By Glucose, (c) is presumed to mean D-Glucose.
C00217 D-Glutamate Yes d 1 By Glutamate, (d) is presumed to mean D-Glutamate.
C00025 L-Glutamate Yes c 1 Glutarate No c - C00258 D-Glycerate Yes c 1 By DL-Glycerate, (c) is presumed to mean D-Glycerate.
C00116 Glycerol Yes a, c, d 1 Glycine No c - C00160 Glycolate Yes c, d 1 Glycogen No c - Heptanoate No c - Histamine No c - C00135 L-Histidine Yes c, d 1 By Histidine, (d) is presumed to mean L-Histidine.
C00587 3-Hydroxybenzoate Yes c 2 o-Hydroxybenzoate No c - C00156 4-Hydroxybenzoate Yes c 1 C01089 (R)-3-Hydroxybutanoate Yes c 1 By DL-3-hydroxybutyrate, (c) is presumed to mean (R)-3-Hydroxybutanoate.
Inositol No c - Inulin No c - Isobutyrate No c - C00407 L-Isoleucine c 1 Isophtalate No c - Itaconate No c - 2-Ketogluconate No c - 5-Ketogluconate No c - 2-Ketoglutarate No c - DL-Kynurenine No c - C00256 (R)-Lactate, D-Lactate Yes c, d 1 C00186 (S)-Lactate, L-Lactate Yes a, d 1 C00243 Lactose Yes c, d 2 C00123 L-Leucine Yes c 1 N/A Levulinate Yes c 5 C00047 L-Lysine Yes c 1 By Lysine, (c) is presumed to mean L-Lysine.
C00476 D-Lyxose Yes c 2 L-Madelate No c - C00497 (R)-Malate, D-Malate Yes c 1 C00149 (S)-Malate, L-Malate Yes c 1 Maleate No c - Malonate No c - C00208 Maltose Yes a, c, d 1 D-Mandelate No c - C00392 Mannitol Yes c, d 1 C00159 D-Mannose Yes c 2 D-Melezitose No c - D-Melibiose No c - Mesaconate No c - Methanol No d - L-Methionine No c - Methyl-α-D-glucoside No c - Methyl-α-D-mannoside No c - N/A Methyl-β-D-xyloside Yes c 5 DL-Norleucine No c - L-Norleucine No c - DL-Norvaline No c - C00077 L-Ornithine Yes c, d 1 By Ornithine, (d) is presumed to mean L-Ornithine.
Oxalate No c - Pelargonate No c - Phenylacetate No c -
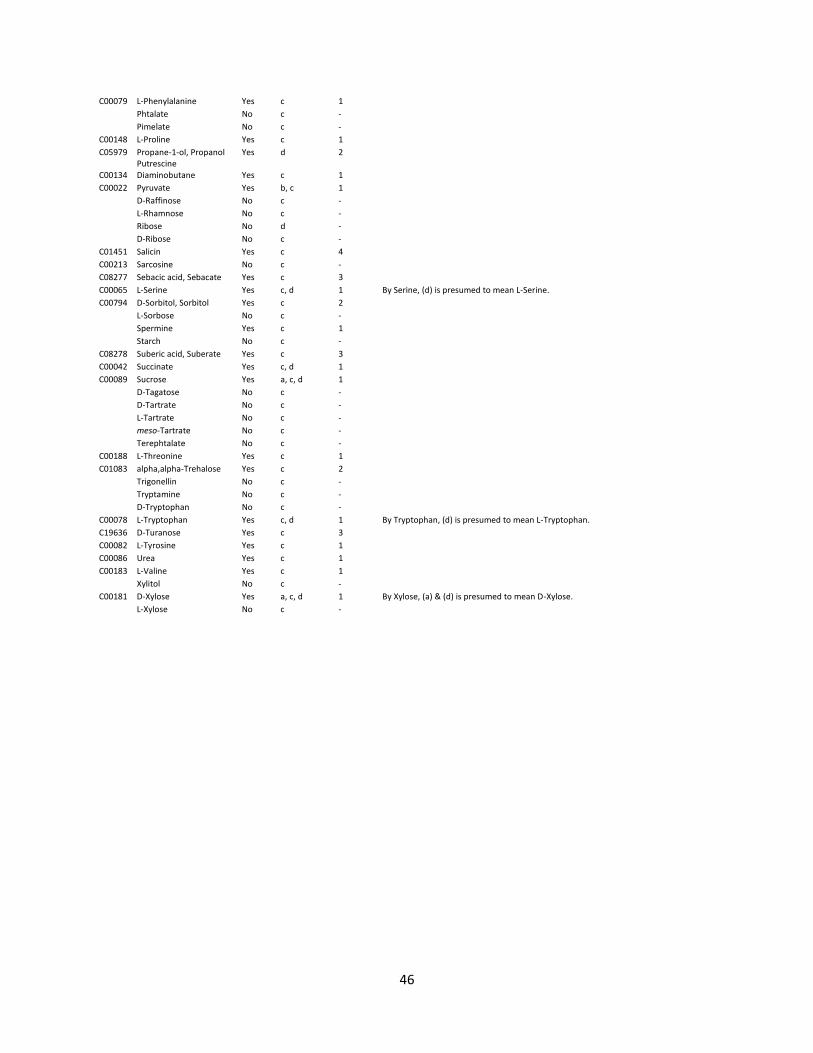
46
C00079 L-Phenylalanine Yes c 1 Phtalate No c - Pimelate No c - C00148 L-Proline Yes c 1 C05979 Propane-1-ol, Propanol Yes d 2
C00134 Putrescine Diaminobutane Yes c 1
C00022 Pyruvate Yes b, c 1 D-Raffinose No c - L-Rhamnose No c - Ribose No d - D-Ribose No c - C01451 Salicin Yes c 4 C00213 Sarcosine No c - C08277 Sebacic acid, Sebacate Yes c 3 C00065 L-Serine Yes c, d 1 By Serine, (d) is presumed to mean L-Serine.
C00794 D-Sorbitol, Sorbitol Yes c 2 L-Sorbose No c - Spermine Yes c 1 Starch No c - C08278 Suberic acid, Suberate Yes c 3 C00042 Succinate Yes c, d 1 C00089 Sucrose Yes a, c, d 1 D-Tagatose No c - D-Tartrate No c - L-Tartrate No c - meso-Tartrate No c - Terephtalate No c - C00188 L-Threonine Yes c 1 C01083 alpha,alpha-Trehalose Yes c 2 Trigonellin No c - Tryptamine No c - D-Tryptophan No c - C00078 L-Tryptophan Yes c, d 1 By Tryptophan, (d) is presumed to mean L-Tryptophan.
C19636 D-Turanose Yes c 3 C00082 L-Tyrosine Yes c 1 C00086 Urea Yes c 1 C00183 L-Valine Yes c 1 Xylitol No c - C00181 D-Xylose Yes a, c, d 1 By Xylose, (a) & (d) is presumed to mean D-Xylose.
L-Xylose No c -
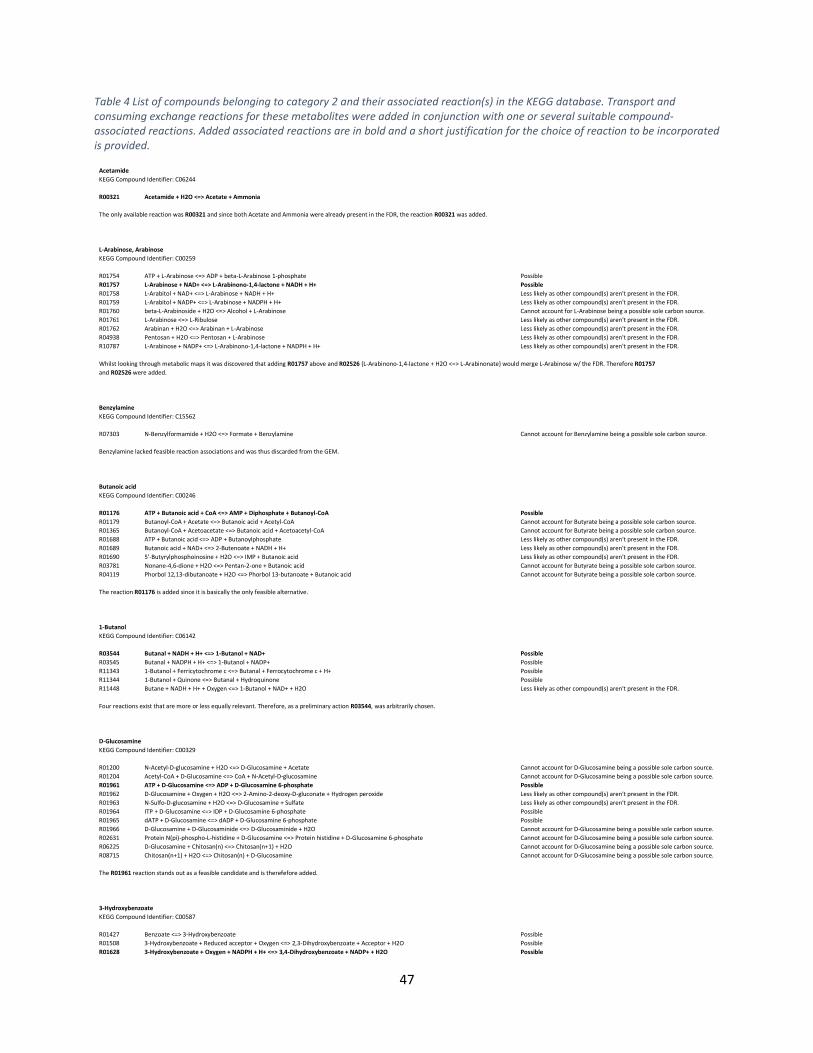
47
Table 4 List of compounds belonging to category 2 and their associated reaction(s) in the KEGG database. Transport and consuming exchange reactions for these metabolites were added in conjunction with one or several suitable compound-associated reactions. Added associated reactions are in bold and a short justification for the choice of reaction to be incorporated is provided.
Acetamide KEGG Compound Identifier: C06244
R00321 Acetamide + H2O <=> Acetate + Ammonia
The only available reaction was R00321 and since both Acetate and Ammonia were already present in the FDR, the reaction R00321 was added.
L-Arabinose, Arabinose KEGG Compound Identifier: C00259
R01754 ATP + L-Arabinose <=> ADP + beta-L-Arabinose 1-phosphate Possible
R01757 L-Arabinose + NAD+ <=> L-Arabinono-1,4-lactone + NADH + H+ Possible
R01758 L-Arabitol + NAD+ <=> L-Arabinose + NADH + H+ Less likely as other compound(s) aren't present in the FDR.
R01759 L-Arabitol + NADP+ <=> L-Arabinose + NADPH + H+ Less likely as other compound(s) aren't present in the FDR.
R01760 beta-L-Arabinoside + H2O <=> Alcohol + L-Arabinose Cannot account for L-Arabinose being a possible sole carbon source.
R01761 L-Arabinose <=> L-Ribulose Less likely as other compound(s) aren't present in the FDR.
R01762 Arabinan + H2O <=> Arabinan + L-Arabinose Less likely as other compound(s) aren't present in the FDR.
R04938 Pentosan + H2O <=> Pentosan + L-Arabinose Less likely as other compound(s) aren't present in the FDR.
R10787 L-Arabinose + NADP+ <=> L-Arabinono-1,4-lactone + NADPH + H+ Less likely as other compound(s) aren't present in the FDR.
Whilst looking through metabolic maps it was discovered that adding R01757 above and R02526 {L-Arabinono-1,4-lactone + H2O <=> L-Arabinonate} would merge L-Arabinose w/ the FDR. Therefore R01757
and R02526 were added.
Benzylamine KEGG Compound Identifier: C15562
R07303 N-Benzylformamide + H2O <=> Formate + Benzylamine Cannot account for Benzylamine being a possible sole carbon source.
Benzylamine lacked feasible reaction associations and was thus discarded from the GEM.
Butanoic acid KEGG Compound Identifier: C00246
R01176 ATP + Butanoic acid + CoA <=> AMP + Diphosphate + Butanoyl-CoA Possible
R01179 Butanoyl-CoA + Acetate <=> Butanoic acid + Acetyl-CoA Cannot account for Butyrate being a possible sole carbon source.
R01365 Butanoyl-CoA + Acetoacetate <=> Butanoic acid + Acetoacetyl-CoA Cannot account for Butyrate being a possible sole carbon source.
R01688 ATP + Butanoic acid <=> ADP + Butanoylphosphate Less likely as other compound(s) aren't present in the FDR.
R01689 Butanoic acid + NAD+ <=> 2-Butenoate + NADH + H+ Less likely as other compound(s) aren't present in the FDR.
R01690 5'-Butyrylphosphoinosine + H2O <=> IMP + Butanoic acid Less likely as other compound(s) aren't present in the FDR.
R03781 Nonane-4,6-dione + H2O <=> Pentan-2-one + Butanoic acid Cannot account for Butyrate being a possible sole carbon source.
R04119 Phorbol 12,13-dibutanoate + H2O <=> Phorbol 13-butanoate + Butanoic acid Cannot account for Butyrate being a possible sole carbon source.
The reaction R01176 is added since it is basically the only feasible alternative.
1-Butanol KEGG Compound Identifier: C06142
R03544 Butanal + NADH + H+ <=> 1-Butanol + NAD+ Possible
R03545 Butanal + NADPH + H+ <=> 1-Butanol + NADP+ Possible
R11343 1-Butanol + Ferricytochrome c <=> Butanal + Ferrocytochrome c + H+ Possible
R11344 1-Butanol + Quinone <=> Butanal + Hydroquinone Possible
R11448 Butane + NADH + H+ + Oxygen <=> 1-Butanol + NAD+ + H2O Less likely as other compound(s) aren't present in the FDR.
Four reactions exist that are more or less equally relevant. Therefore, as a preliminary action R03544, was arbitrarily chosen.
D-Glucosamine KEGG Compound Identifier: C00329
R01200 N-Acetyl-D-glucosamine + H2O <=> D-Glucosamine + Acetate Cannot account for D-Glucosamine being a possible sole carbon source.
R01204 Acetyl-CoA + D-Glucosamine <=> CoA + N-Acetyl-D-glucosamine Cannot account for D-Glucosamine being a possible sole carbon source.
R01961 ATP + D-Glucosamine <=> ADP + D-Glucosamine 6-phosphate Possible
R01962 D-Glucosamine + Oxygen + H2O <=> 2-Amino-2-deoxy-D-gluconate + Hydrogen peroxide Less likely as other compound(s) aren't present in the FDR.
R01963 N-Sulfo-D-glucosamine + H2O <=> D-Glucosamine + Sulfate Less likely as other compound(s) aren't present in the FDR.
R01964 ITP + D-Glucosamine <=> IDP + D-Glucosamine 6-phosphate Possible
R01965 dATP + D-Glucosamine <=> dADP + D-Glucosamine 6-phosphate Possible
R01966 D-Glucosamine + D-Glucosaminide <=> D-Glucosaminide + H2O Cannot account for D-Glucosamine being a possible sole carbon source.
R02631 Protein N(pi)-phospho-L-histidine + D-Glucosamine <=> Protein histidine + D-Glucosamine 6-phosphate Cannot account for D-Glucosamine being a possible sole carbon source.
R06225 D-Glucosamine + Chitosan(n) <=> Chitosan(n+1) + H2O Cannot account for D-Glucosamine being a possible sole carbon source.
R08715 Chitosan(n+1) + H2O <=> Chitosan(n) + D-Glucosamine Cannot account for D-Glucosamine being a possible sole carbon source.
The R01961 reaction stands out as a feasible candidate and is therefefore added.
3-Hydroxybenzoate KEGG Compound Identifier: C00587
R01427 Benzoate <=> 3-Hydroxybenzoate Possible
R01508 3-Hydroxybenzoate + Reduced acceptor + Oxygen <=> 2,3-Dihydroxybenzoate + Acceptor + H2O Possible
R01628 3-Hydroxybenzoate + Oxygen + NADPH + H+ <=> 3,4-Dihydroxybenzoate + NADP+ + H2O Possible
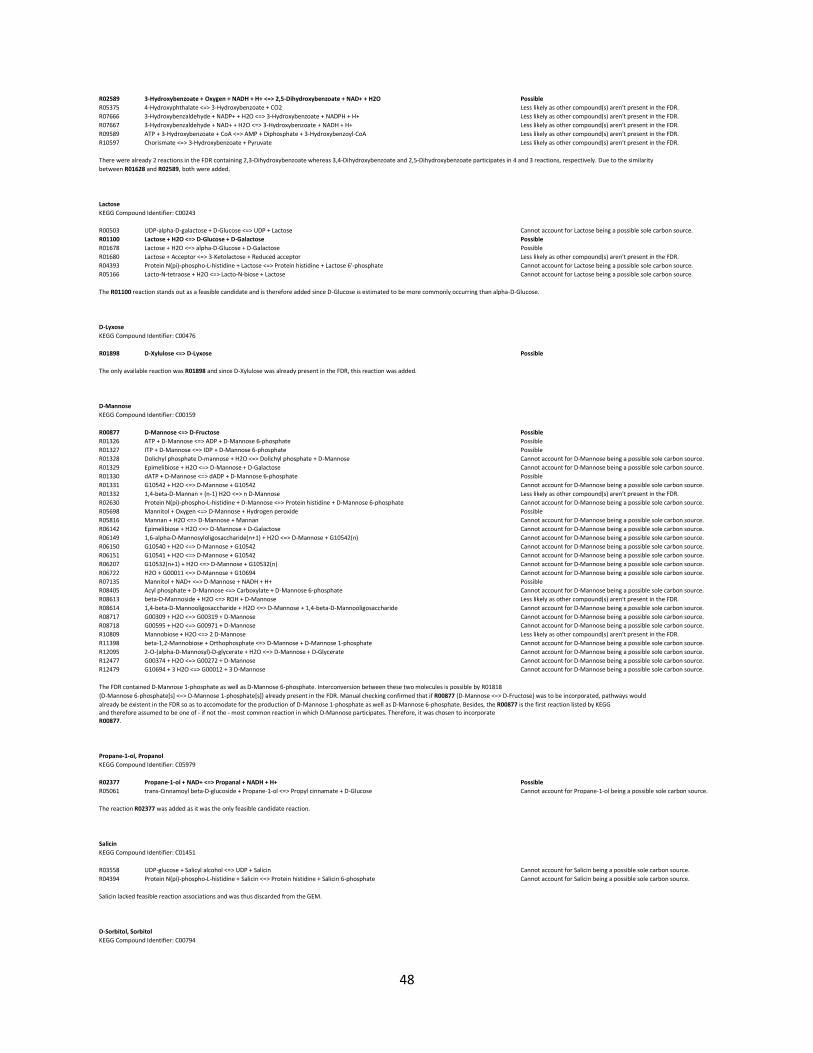
48
R02589 3-Hydroxybenzoate + Oxygen + NADH + H+ <=> 2,5-Dihydroxybenzoate + NAD+ + H2O Possible
R05375 4-Hydroxyphthalate <=> 3-Hydroxybenzoate + CO2 Less likely as other compound(s) aren't present in the FDR.
R07666 3-Hydroxybenzaldehyde + NADP+ + H2O <=> 3-Hydroxybenzoate + NADPH + H+ Less likely as other compound(s) aren't present in the FDR.
R07667 3-Hydroxybenzaldehyde + NAD+ + H2O <=> 3-Hydroxybenzoate + NADH + H+ Less likely as other compound(s) aren't present in the FDR.
R09589 ATP + 3-Hydroxybenzoate + CoA <=> AMP + Diphosphate + 3-Hydroxybenzoyl-CoA Less likely as other compound(s) aren't present in the FDR.
R10597 Chorismate <=> 3-Hydroxybenzoate + Pyruvate Less likely as other compound(s) aren't present in the FDR.
There were already 2 reactions in the FDR containing 2,3-Dihydroxybenzoate whereas 3,4-Dihydroxybenzoate and 2,5-Dihydroxybenzoate participates in 4 and 3 reactions, respectively. Due to the similarity
between R01628 and R02589, both were added.
Lactose KEGG Compound Identifier: C00243
R00503 UDP-alpha-D-galactose + D-Glucose <=> UDP + Lactose Cannot account for Lactose being a possible sole carbon source.
R01100 Lactose + H2O <=> D-Glucose + D-Galactose Possible
R01678 Lactose + H2O <=> alpha-D-Glucose + D-Galactose Possible
R01680 Lactose + Acceptor <=> 3-Ketolactose + Reduced acceptor Less likely as other compound(s) aren't present in the FDR.
R04393 Protein N(pi)-phospho-L-histidine + Lactose <=> Protein histidine + Lactose 6'-phosphate Cannot account for Lactose being a possible sole carbon source.
R05166 Lacto-N-tetraose + H2O <=> Lacto-N-biose + Lactose Cannot account for Lactose being a possible sole carbon source.
The R01100 reaction stands out as a feasible candidate and is therefore added since D-Glucose is estimated to be more commonly occurring than alpha-D-Glucose.
D-Lyxose KEGG Compound Identifier: C00476
R01898 D-Xylulose <=> D-Lyxose Possible
The only available reaction was R01898 and since D-Xylulose was already present in the FDR, this reaction was added.
D-Mannose KEGG Compound Identifier: C00159
R00877 D-Mannose <=> D-Fructose Possible
R01326 ATP + D-Mannose <=> ADP + D-Mannose 6-phosphate Possible
R01327 ITP + D-Mannose <=> IDP + D-Mannose 6-phosphate Possible
R01328 Dolichyl phosphate D-mannose + H2O <=> Dolichyl phosphate + D-Mannose Cannot account for D-Mannose being a possible sole carbon source.
R01329 Epimelibiose + H2O <=> D-Mannose + D-Galactose Cannot account for D-Mannose being a possible sole carbon source.
R01330 dATP + D-Mannose <=> dADP + D-Mannose 6-phosphate Possible
R01331 G10542 + H2O <=> D-Mannose + G10542 Cannot account for D-Mannose being a possible sole carbon source.
R01332 1,4-beta-D-Mannan + (n-1) H2O <=> n D-Mannose Less likely as other compound(s) aren't present in the FDR.
R02630 Protein N(pi)-phospho-L-histidine + D-Mannose <=> Protein histidine + D-Mannose 6-phosphate Cannot account for D-Mannose being a possible sole carbon source.
R05698 Mannitol + Oxygen <=> D-Mannose + Hydrogen peroxide Possible
R05816 Mannan + H2O <=> D-Mannose + Mannan Cannot account for D-Mannose being a possible sole carbon source.
R06142 Epimelibiose + H2O <=> D-Mannose + D-Galactose Cannot account for D-Mannose being a possible sole carbon source.
R06149 1,6-alpha-D-Mannosyloligosaccharide(n+1) + H2O <=> D-Mannose + G10542(n) Cannot account for D-Mannose being a possible sole carbon source.
R06150 G10540 + H2O <=> D-Mannose + G10542 Cannot account for D-Mannose being a possible sole carbon source.
R06151 G10541 + H2O <=> D-Mannose + G10542 Cannot account for D-Mannose being a possible sole carbon source.
R06207 G10532(n+1) + H2O <=> D-Mannose + G10532(n) Cannot account for D-Mannose being a possible sole carbon source.
R06722 H2O + G00011 <=> D-Mannose + G10694 Cannot account for D-Mannose being a possible sole carbon source.
R07135 Mannitol + NAD+ <=> D-Mannose + NADH + H+ Possible
R08405 Acyl phosphate + D-Mannose <=> Carboxylate + D-Mannose 6-phosphate Cannot account for D-Mannose being a possible sole carbon source.
R08613 beta-D-Mannoside + H2O <=> ROH + D-Mannose Less likely as other compound(s) aren't present in the FDR.
R08614 1,4-beta-D-Mannooligosaccharide + H2O <=> D-Mannose + 1,4-beta-D-Mannooligosaccharide Cannot account for D-Mannose being a possible sole carbon source.
R08717 G00309 + H2O <=> G00319 + D-Mannose Cannot account for D-Mannose being a possible sole carbon source.
R08718 G00595 + H2O <=> G00971 + D-Mannose Cannot account for D-Mannose being a possible sole carbon source.
R10809 Mannobiose + H2O <=> 2 D-Mannose Less likely as other compound(s) aren't present in the FDR.
R11398 beta-1,2-Mannobiose + Orthophosphate <=> D-Mannose + D-Mannose 1-phosphate Cannot account for D-Mannose being a possible sole carbon source.
R12095 2-O-(alpha-D-Mannosyl)-D-glycerate + H2O <=> D-Mannose + D-Glycerate Cannot account for D-Mannose being a possible sole carbon source.
R12477 G00374 + H2O <=> G00272 + D-Mannose Cannot account for D-Mannose being a possible sole carbon source.
R12479 G10694 + 3 H2O <=> G00012 + 3 D-Mannose Cannot account for D-Mannose being a possible sole carbon source.
The FDR contained D-Mannose 1-phosphate as well as D-Mannose 6-phosphate. Interconversion between these two molecules is possible by R01818 {D-Mannose 6-phosphate[s] <=> D-Mannose 1-phosphate[s]} already present in the FDR. Manual checking confirmed that if R00877 {D-Mannose <=> D-Fructose} was to be incorporated, pathways would
already be existent in the FDR so as to accomodate for the production of D-Mannose 1-phosphate as well as D-Mannose 6-phosphate. Besides, the R00877 is the first reaction listed by KEGG and therefore assumed to be one of - if not the - most common reaction in which D-Mannose participates. Therefore, it was chosen to incorporate R00877.
Propane-1-ol, Propanol KEGG Compound Identifier: C05979
R02377 Propane-1-ol + NAD+ <=> Propanal + NADH + H+ Possible
R05061 trans-Cinnamoyl beta-D-glucoside + Propane-1-ol <=> Propyl cinnamate + D-Glucose Cannot account for Propane-1-ol being a possible sole carbon source.
The reaction R02377 was added as it was the only feasible candidate reaction.
Salicin KEGG Compound Identifier: C01451
R03558 UDP-glucose + Salicyl alcohol <=> UDP + Salicin Cannot account for Salicin being a possible sole carbon source.
R04394 Protein N(pi)-phospho-L-histidine + Salicin <=> Protein histidine + Salicin 6-phosphate Cannot account for Salicin being a possible sole carbon source.
Salicin lacked feasible reaction associations and was thus discarded from the GEM.
D-Sorbitol, Sorbitol KEGG Compound Identifier: C00794
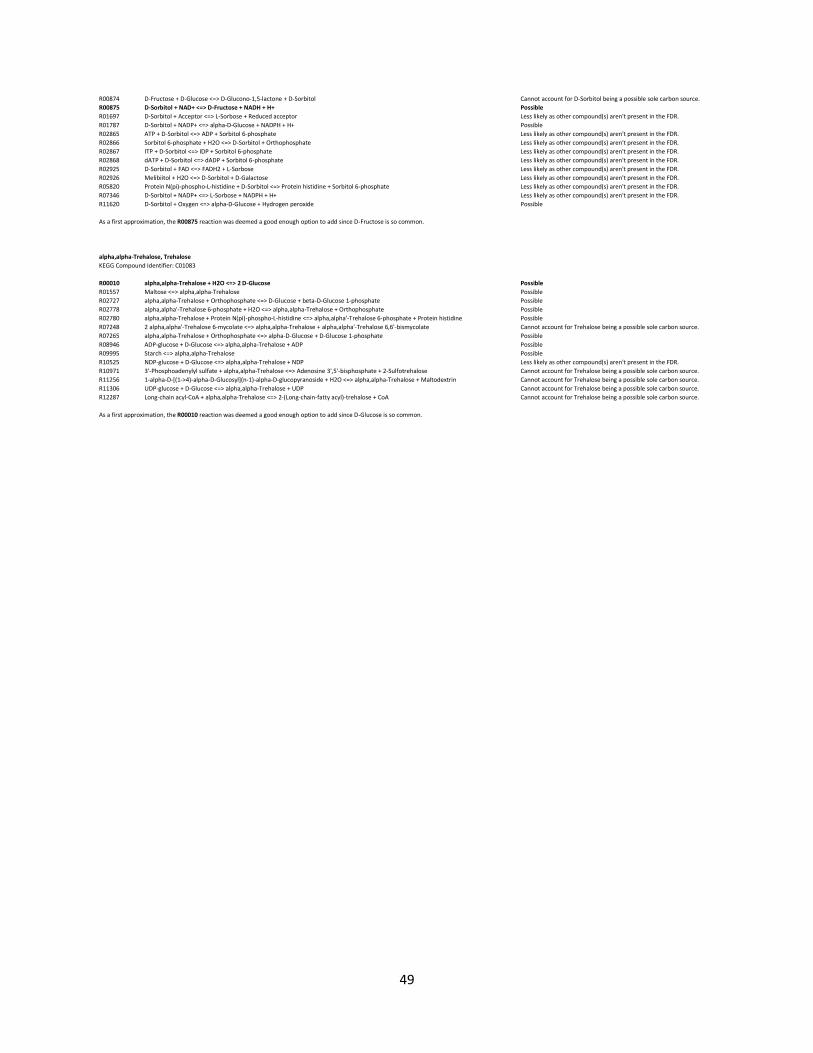
49
R00874 D-Fructose + D-Glucose <=> D-Glucono-1,5-lactone + D-Sorbitol Cannot account for D-Sorbitol being a possible sole carbon source.
R00875 D-Sorbitol + NAD+ <=> D-Fructose + NADH + H+ Possible
R01697 D-Sorbitol + Acceptor <=> L-Sorbose + Reduced acceptor Less likely as other compound(s) aren't present in the FDR.
R01787 D-Sorbitol + NADP+ <=> alpha-D-Glucose + NADPH + H+ Possible
R02865 ATP + D-Sorbitol <=> ADP + Sorbitol 6-phosphate Less likely as other compound(s) aren't present in the FDR.
R02866 Sorbitol 6-phosphate + H2O <=> D-Sorbitol + Orthophosphate Less likely as other compound(s) aren't present in the FDR.
R02867 ITP + D-Sorbitol <=> IDP + Sorbitol 6-phosphate Less likely as other compound(s) aren't present in the FDR.
R02868 dATP + D-Sorbitol <=> dADP + Sorbitol 6-phosphate Less likely as other compound(s) aren't present in the FDR.
R02925 D-Sorbitol + FAD <=> FADH2 + L-Sorbose Less likely as other compound(s) aren't present in the FDR.
R02926 Melibiitol + H2O <=> D-Sorbitol + D-Galactose Less likely as other compound(s) aren't present in the FDR.
R05820 Protein N(pi)-phospho-L-histidine + D-Sorbitol <=> Protein histidine + Sorbitol 6-phosphate Less likely as other compound(s) aren't present in the FDR.
R07346 D-Sorbitol + NADP+ <=> L-Sorbose + NADPH + H+ Less likely as other compound(s) aren't present in the FDR.
R11620 D-Sorbitol + Oxygen <=> alpha-D-Glucose + Hydrogen peroxide Possible
As a first approximation, the R00875 reaction was deemed a good enough option to add since D-Fructose is so common.
alpha,alpha-Trehalose, Trehalose KEGG Compound Identifier: C01083
R00010 alpha,alpha-Trehalose + H2O <=> 2 D-Glucose Possible
R01557 Maltose <=> alpha,alpha-Trehalose Possible
R02727 alpha,alpha-Trehalose + Orthophosphate <=> D-Glucose + beta-D-Glucose 1-phosphate Possible
R02778 alpha,alpha'-Trehalose 6-phosphate + H2O <=> alpha,alpha-Trehalose + Orthophosphate Possible
R02780 alpha,alpha-Trehalose + Protein N(pi)-phospho-L-histidine <=> alpha,alpha'-Trehalose 6-phosphate + Protein histidine Possible
R07248 2 alpha,alpha'-Trehalose 6-mycolate <=> alpha,alpha-Trehalose + alpha,alpha'-Trehalose 6,6'-bismycolate Cannot account for Trehalose being a possible sole carbon source.
R07265 alpha,alpha-Trehalose + Orthophosphate <=> alpha-D-Glucose + D-Glucose 1-phosphate Possible
R08946 ADP-glucose + D-Glucose <=> alpha,alpha-Trehalose + ADP Possible
R09995 Starch <=> alpha,alpha-Trehalose Possible
R10525 NDP-glucose + D-Glucose <=> alpha,alpha-Trehalose + NDP Less likely as other compound(s) aren't present in the FDR.
R10971 3'-Phosphoadenylyl sulfate + alpha,alpha-Trehalose <=> Adenosine 3',5'-bisphosphate + 2-Sulfotrehalose Cannot account for Trehalose being a possible sole carbon source.
R11256 1-alpha-D-[(1->4)-alpha-D-Glucosyl](n-1)-alpha-D-glucopyranoside + H2O <=> alpha,alpha-Trehalose + Maltodextrin Cannot account for Trehalose being a possible sole carbon source.
R11306 UDP-glucose + D-Glucose <=> alpha,alpha-Trehalose + UDP Cannot account for Trehalose being a possible sole carbon source.
R12287 Long-chain acyl-CoA + alpha,alpha-Trehalose <=> 2-(Long-chain-fatty acyl)-trehalose + CoA Cannot account for Trehalose being a possible sole carbon source.
As a first approximation, the R00010 reaction was deemed a good enough option to add since D-Glucose is so common.

50