Embed Size (px)
Citation preview
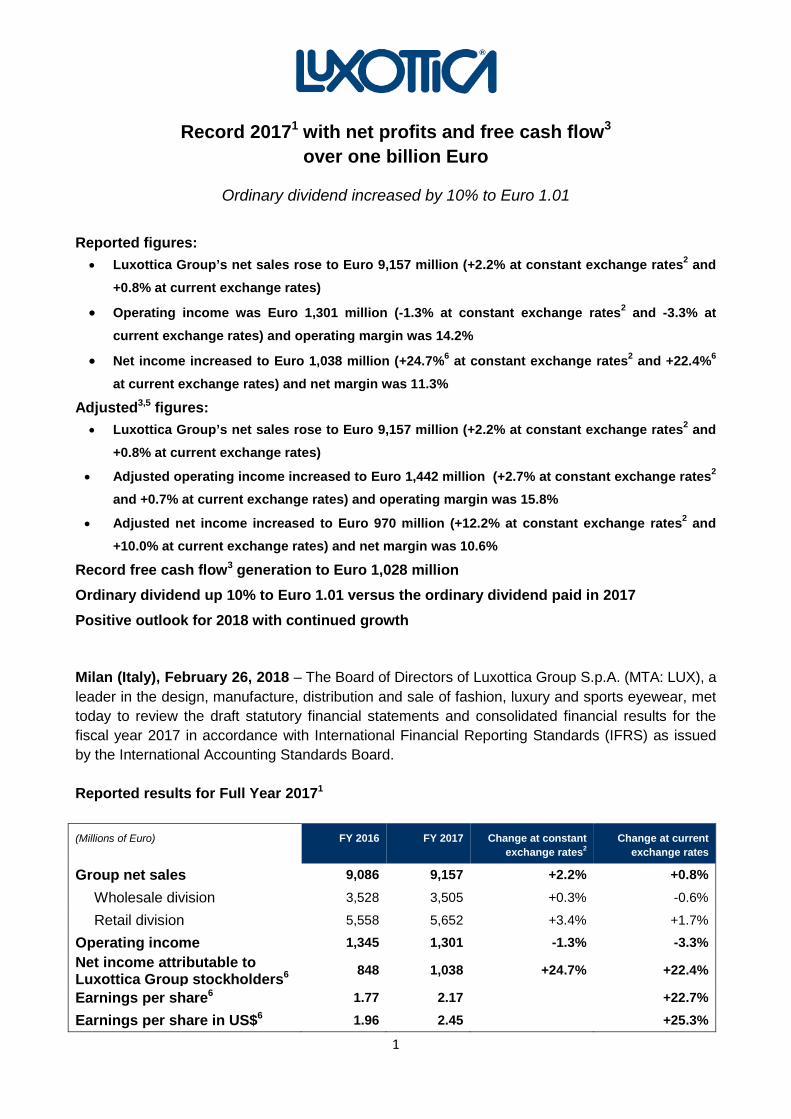
Record 20171 with net profits and free cash flow3 over one billion Euro
Ordinary dividend increased by 10% to Euro 1.01
Reported figures: • Luxottica Group’s net sales rose to Euro 9,157 million (+2.2% at constant exchange rates2 and
+0.8% at current exchange rates)
• Operating income was Euro 1,301 million (-1.3% at constant exchange rates2 and -3.3% at current exchange rates) and operating margin was 14.2%
• Net income increased to Euro 1,038 million (+24.7%6 at constant exchange rates2 and +22.4%6 at current exchange rates) and net margin was 11.3%
Adjusted3,5 figures:
• Luxottica Group’s net sales rose to Euro 9,157 million (+2.2% at constant exchange rates2 and +0.8% at current exchange rates)
• Adjusted operating income increased to Euro 1,442 million (+2.7% at constant exchange rates2 and +0.7% at current exchange rates) and operating margin was 15.8%
• Adjusted net income increased to Euro 970 million (+12.2% at constant exchange rates2 and +10.0% at current exchange rates) and net margin was 10.6%
Record free cash flow3 generation to Euro 1,028 million Ordinary dividend up 10% to Euro 1.01 versus the ordinary dividend paid in 2017 Positive outlook for 2018 with continued growth
Milan (Italy), February 26, 2018 – The Board of Directors of Luxottica Group S.p.A. (MTA: LUX), a leader in the design, manufacture, distribution and sale of fashion, luxury and sports eyewear, met today to review the draft statutory financial statements and consolidated financial results for the fiscal year 2017 in accordance with International Financial Reporting Standards (IFRS) as issued by the International Accounting Standards Board. Reported results for Full Year 20171 (Millions of Euro) FY 2016 FY 2017 Change at constant
exchange rates2 Change at current
exchange rates
Group net sales 9,086 9,157 +2.2% +0.8%
Wholesale division 3,528 3,505 +0.3% -0.6%
Retail division 5,558 5,652 +3.4% +1.7%
Operating income 1,345 1,301 -1.3% -3.3% Net income attributable to Luxottica Group stockholders6 848 1,038 +24.7% +22.4%
Earnings per share6 1.77 2.17 +22.7%
Earnings per share in US$6 1.96 2.45 +25.3%
1
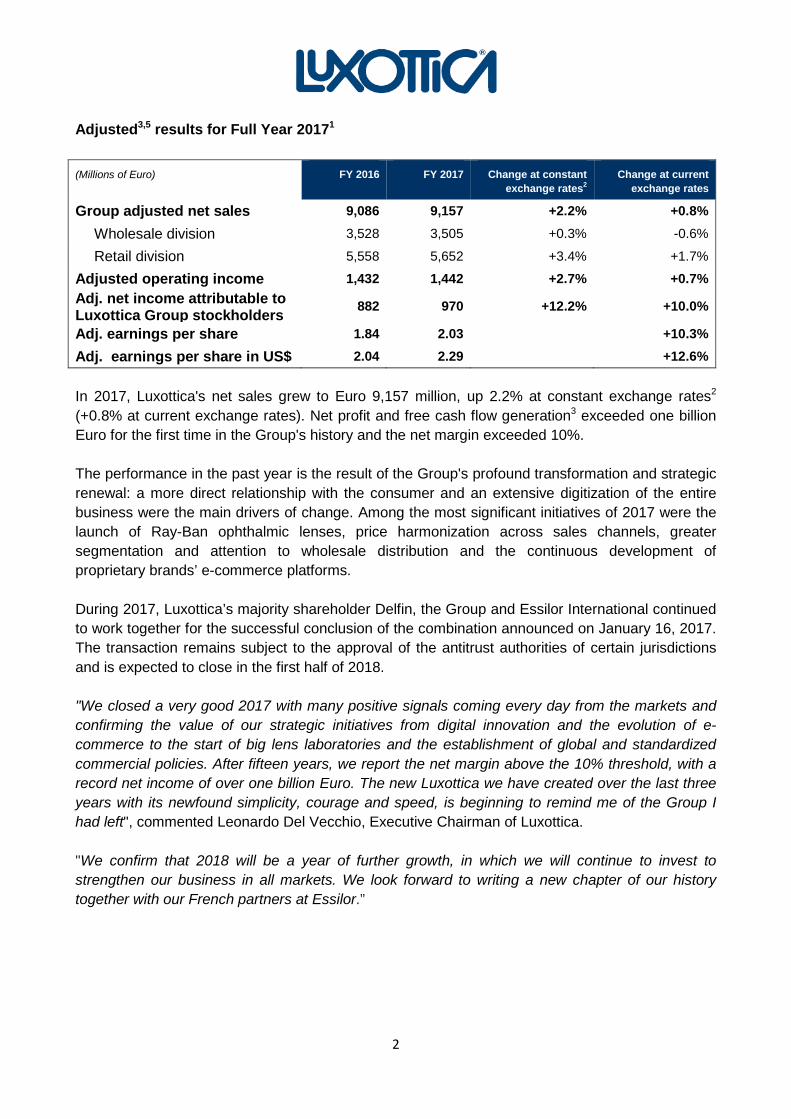
Adjusted3,5 results for Full Year 20171 (Millions of Euro) FY 2016 FY 2017 Change at constant
exchange rates2 Change at current
exchange rates
Group adjusted net sales 9,086 9,157 +2.2% +0.8%
Wholesale division 3,528 3,505 +0.3% -0.6%
Retail division 5,558 5,652 +3.4% +1.7%
Adjusted operating income 1,432 1,442 +2.7% +0.7% Adj. net income attributable to Luxottica Group stockholders 882 970 +12.2% +10.0%
Adj. earnings per share 1.84 2.03 +10.3%
Adj. earnings per share in US$ 2.04 2.29 +12.6% In 2017, Luxottica's net sales grew to Euro 9,157 million, up 2.2% at constant exchange rates2 (+0.8% at current exchange rates). Net profit and free cash flow generation3 exceeded one billion Euro for the first time in the Group's history and the net margin exceeded 10%. The performance in the past year is the result of the Group's profound transformation and strategic renewal: a more direct relationship with the consumer and an extensive digitization of the entire business were the main drivers of change. Among the most significant initiatives of 2017 were the launch of Ray-Ban ophthalmic lenses, price harmonization across sales channels, greater segmentation and attention to wholesale distribution and the continuous development of proprietary brands’ e-commerce platforms. During 2017, Luxottica’s majority shareholder Delfin, the Group and Essilor International continued to work together for the successful conclusion of the combination announced on January 16, 2017. The transaction remains subject to the approval of the antitrust authorities of certain jurisdictions and is expected to close in the first half of 2018. "We closed a very good 2017 with many positive signals coming every day from the markets and confirming the value of our strategic initiatives from digital innovation and the evolution of e-commerce to the start of big lens laboratories and the establishment of global and standardized commercial policies. After fifteen years, we report the net margin above the 10% threshold, with a record net income of over one billion Euro. The new Luxottica we have created over the last three years with its newfound simplicity, courage and speed, is beginning to remind me of the Group I had left", commented Leonardo Del Vecchio, Executive Chairman of Luxottica. "We confirm that 2018 will be a year of further growth, in which we will continue to invest to strengthen our business in all markets. We look forward to writing a new chapter of our history together with our French partners at Essilor.”
2
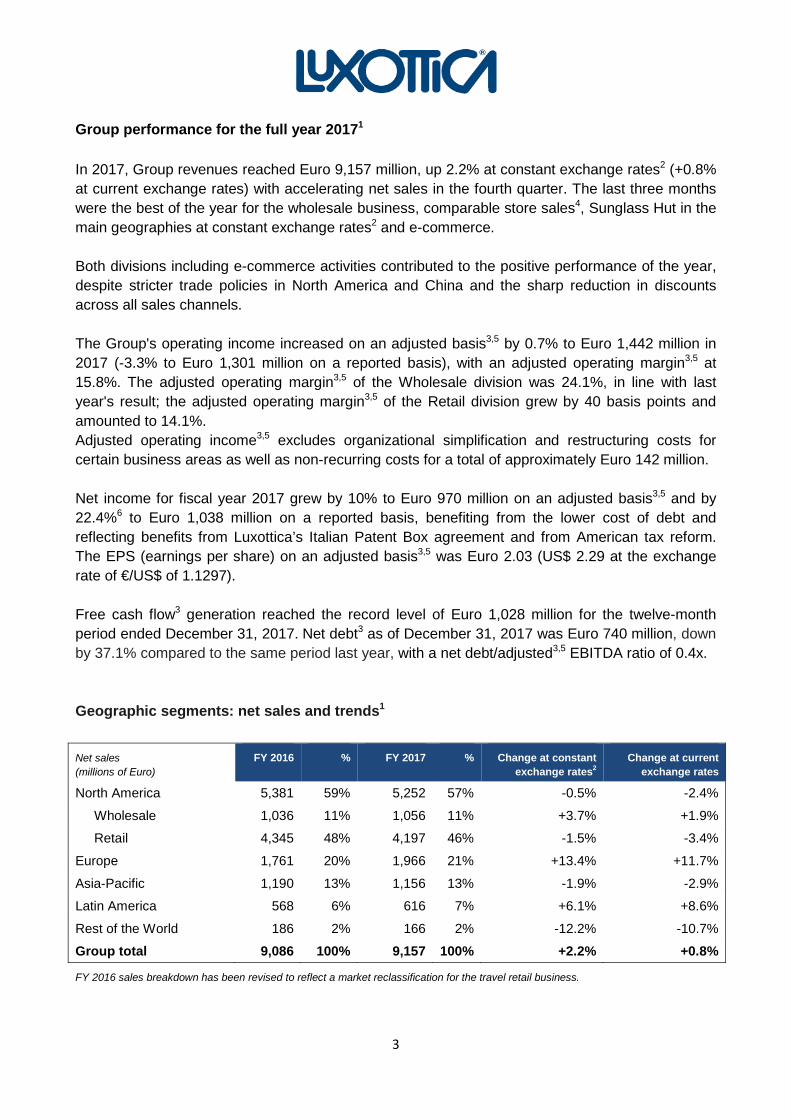
Group performance for the full year 20171
In 2017, Group revenues reached Euro 9,157 million, up 2.2% at constant exchange rates2 (+0.8% at current exchange rates) with accelerating net sales in the fourth quarter. The last three months were the best of the year for the wholesale business, comparable store sales4, Sunglass Hut in the main geographies at constant exchange rates2 and e-commerce. Both divisions including e-commerce activities contributed to the positive performance of the year, despite stricter trade policies in North America and China and the sharp reduction in discounts across all sales channels. The Group's operating income increased on an adjusted basis3,5 by 0.7% to Euro 1,442 million in 2017 (-3.3% to Euro 1,301 million on a reported basis), with an adjusted operating margin3,5 at 15.8%. The adjusted operating margin3,5 of the Wholesale division was 24.1%, in line with last year's result; the adjusted operating margin3,5 of the Retail division grew by 40 basis points and amounted to 14.1%. Adjusted operating income3,5 excludes organizational simplification and restructuring costs for certain business areas as well as non-recurring costs for a total of approximately Euro 142 million. Net income for fiscal year 2017 grew by 10% to Euro 970 million on an adjusted basis3,5 and by 22.4%6 to Euro 1,038 million on a reported basis, benefiting from the lower cost of debt and reflecting benefits from Luxottica’s Italian Patent Box agreement and from American tax reform. The EPS (earnings per share) on an adjusted basis3,5 was Euro 2.03 (US$ 2.29 at the exchange rate of €/US$ of 1.1297). Free cash flow3 generation reached the record level of Euro 1,028 million for the twelve-month period ended December 31, 2017. Net debt3 as of December 31, 2017 was Euro 740 million, down by 37.1% compared to the same period last year, with a net debt/adjusted3,5 EBITDA ratio of 0.4x. Geographic segments: net sales and trends1 Net sales (millions of Euro)
FY 2016 % FY 2017 % Change at constant exchange rates2
Change at current exchange rates
North America 5,381 59% 5,252 57% -0.5% -2.4%
Wholesale 1,036 11% 1,056 11% +3.7% +1.9%
Retail 4,345 48% 4,197 46% -1.5% -3.4%
Europe 1,761 20% 1,966 21% +13.4% +11.7%
Asia-Pacific 1,190 13% 1,156 13% -1.9% -2.9%
Latin America 568 6% 616 7% +6.1% +8.6%
Rest of the World 186 2% 166 2% -12.2% -10.7%
Group total 9,086 100% 9,157 100% +2.2% +0.8%
FY 2016 sales breakdown has been revised to reflect a market reclassification for the travel retail business.
3
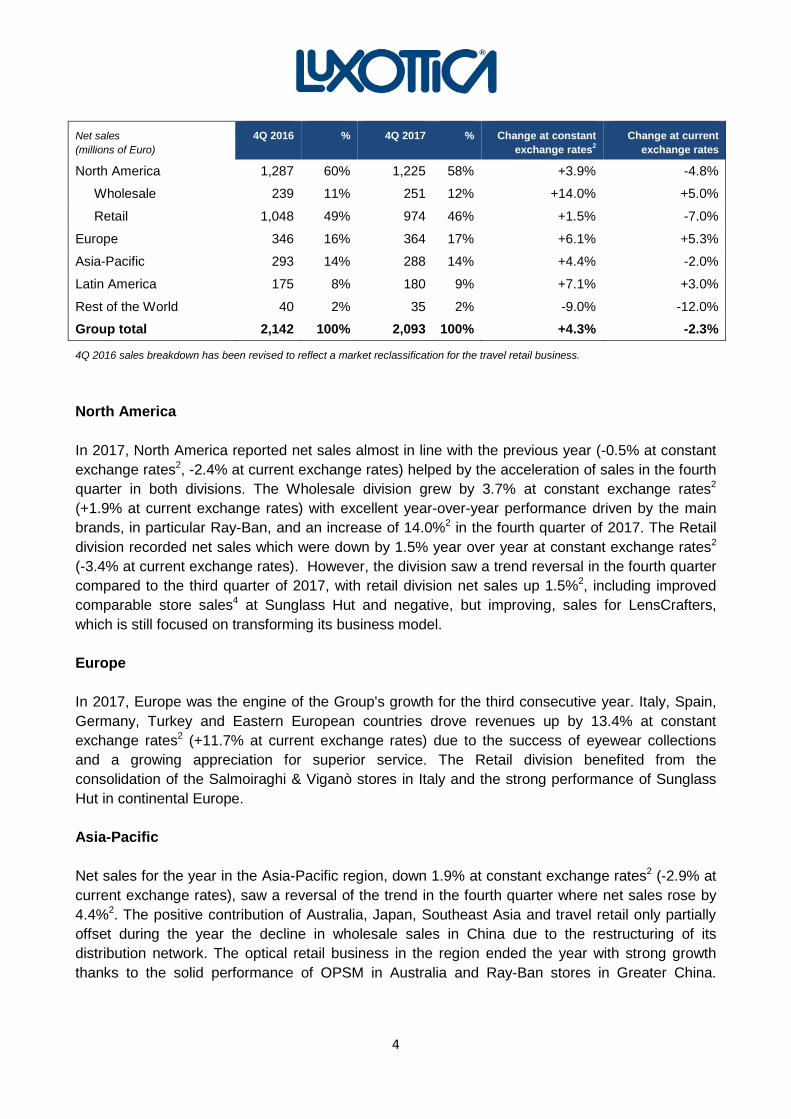
Net sales (millions of Euro)
4Q 2016 % 4Q 2017 % Change at constant exchange rates2
Change at current exchange rates
North America 1,287 60% 1,225 58% +3.9% -4.8%
Wholesale 239 11% 251 12% +14.0% +5.0%
Retail 1,048 49% 974 46% +1.5% -7.0%
Europe 346 16% 364 17% +6.1% +5.3%
Asia-Pacific 293 14% 288 14% +4.4% -2.0%
Latin America 175 8% 180 9% +7.1% +3.0%
Rest of the World 40 2% 35 2% -9.0% -12.0%
Group total 2,142 100% 2,093 100% +4.3% -2.3%
4Q 2016 sales breakdown has been revised to reflect a market reclassification for the travel retail business.
North America In 2017, North America reported net sales almost in line with the previous year (-0.5% at constant exchange rates2, -2.4% at current exchange rates) helped by the acceleration of sales in the fourth quarter in both divisions. The Wholesale division grew by 3.7% at constant exchange rates2 (+1.9% at current exchange rates) with excellent year-over-year performance driven by the main brands, in particular Ray-Ban, and an increase of 14.0%2 in the fourth quarter of 2017. The Retail division recorded net sales which were down by 1.5% year over year at constant exchange rates2 (-3.4% at current exchange rates). However, the division saw a trend reversal in the fourth quarter compared to the third quarter of 2017, with retail division net sales up 1.5%2, including improved comparable store sales4 at Sunglass Hut and negative, but improving, sales for LensCrafters, which is still focused on transforming its business model. Europe In 2017, Europe was the engine of the Group's growth for the third consecutive year. Italy, Spain, Germany, Turkey and Eastern European countries drove revenues up by 13.4% at constant exchange rates2 (+11.7% at current exchange rates) due to the success of eyewear collections and a growing appreciation for superior service. The Retail division benefited from the consolidation of the Salmoiraghi & Viganò stores in Italy and the strong performance of Sunglass Hut in continental Europe. Asia-Pacific Net sales for the year in the Asia-Pacific region, down 1.9% at constant exchange rates2 (-2.9% at current exchange rates), saw a reversal of the trend in the fourth quarter where net sales rose by 4.4%2. The positive contribution of Australia, Japan, Southeast Asia and travel retail only partially offset during the year the decline in wholesale sales in China due to the restructuring of its distribution network. The optical retail business in the region ended the year with strong growth thanks to the solid performance of OPSM in Australia and Ray-Ban stores in Greater China.
4

Latin America Latin America reported sales up 6.1% at constant exchange rates2 (+8.6% at current exchange rates). Drivers included the solid growth of Mexico, one of the Group’s most vital markets, and Brazil, which benefited in the second half from the completion of the acquisition of Óticas Carol, one of the region’s largest optical franchisors. In retail, Sunglass Hut continued its expansion with the opening of its first stores in Colombia, Argentina and the Caribbean, along with the launch of Ray-Ban stores in the region. Outlook for 2018 2018 is expected to be another year of growth and important investments for the Group. The growth pillars remain unchanged: product quality, strong brands, efficient factories, widespread distribution and an increasingly direct relationship with the end-consumer through retail and e-commerce. In 2018, the Group expects:
• Sales growth: +2-4% at constant exchange rates2 • Adjusted3,5 operating income growth2: 0.8-1.0x sales • Adjusted3,5 net income growth2: 1.0-2.0x sales • Net debt/EBITDA adjusted3,5 ratio: 0.3-0.4x
§
The Board of Directors will submit a motion to the General Meeting of Stockholders recommending the distribution of an ordinary cash dividend in the amount of Euro 1.01 per share, equal to 50% of the adjusted3,5 net income of the Group. The total dividend amount will be approximately Euro 483 million.
§ The Board of Directors will convene the Ordinary and Extraordinary General Meeting of Shareholders on April 19, 2018 to approve the 2017 Statutory Financial Statements, the distribution of the cash dividend, the appointment of the Board of Directors and the Board of Statutory Auditors, as current terms will expire concurrently with the General Meeting. The Company’s Compensation Policy will also be submitted for review. The Extraordinary General Meeting of Shareholders will be called to vote on a proposed amendment to Article 18 of the Group’s By-Laws relating to the term of office of the directors, in order to allow them to remain in office up to a maximum of three financial years according to the determinations that will be taken by the Group’s shareholders. The ordinary cash dividend will be payable on April 25, 2018 (the coupon detachment date will be April 23, 2018 pursuant to the Borsa Italiana calendar with a record date of April 24, 2018). Regarding the American Depositary Receipts (ADRs), the record date will be April 24, 2018 and, according to Deutsche Bank Trust Company Americas (the depositary bank for the ADR program),
5
the payment date for the dividend in US dollars is expected to be May 2, 2018. The dividend amount in US dollars will be determined based on the €/US$ exchange rate as of April 25, 2018.
§ The Board of Directors, upon the recommendation of the Human Resources Committee, assigned a total of 446,767 Luxottica Group shares to 478 beneficiaries of the Plan. This assignment was executed according to the Performance Share Plan 2015 first approved on May 4, 2015, and later amended by the Board of Directors on May 16, 2017. Detailed information on this assignment will be provided pursuant to Article 84bis of the CONSOB Issuers' Regulation, within the time limit provided by law for the publication of the remuneration report.
§ Results for fiscal year 2017 will be available via audio webcast on Monday, February 26, 2018 at 12:00PM EST (5:00PM GMT, 6:00PM CET). The audio webcast will be available to the financial community and the media from Luxottica Group’s corporate website at http://www.luxottica.com/en/investors/results-and-presentations/webcasts. The presentation will be available for download from Luxottica Group’s Investor Relations website at http://www.luxottica.com/en/investors/results-and-presentations shortly before the start of the audio webcast. The officer responsible for preparing the Company’s financial reports, Stefano Grassi, declares, pursuant to Article 154-bis, Section 2 of the Consolidated Law on Finance, that the accounting information contained in this press release is consistent with the data in the supporting documents, books of accounts and other accounting records. Contacts Alessandra Senici Group Investor Relations and Corporate Communications Director Tel.: +39 (02) 8633 4870 Email: [email protected] http://www.luxottica.com/en/investors/contacts
Marco Catalani Group Corporate Media Relations Senior Manager Tel.: +39 (02) 8633 4470 Email: [email protected] Notes to the press release 1 Comparisons, including percentage changes, are between the three and twelve-month periods ended December 31, 2017 and 2016. 2 Figures at constant exchange rates have been calculated using the average exchange rates in effect for the corresponding period in the previous year. For further information, please refer to the attached tables. 3 Adjusted data, EBITDA, EBITDA margin, free cash flow and net debt are not measures in accordance with IFRS. For further information, please refer to the attached tables.
6
4 “Comps” or “Comparable store sales” reflect the change in sales from one period to another that, for comparison purposes, includes in the calculation only stores open in the more recent period that also were open during the comparable prior period, and applies to both periods the average exchange rate for the prior period and the same geographic area. 5 The adjusted data for the year ended December 31, 2017 excludes: (i) restructuring and reorganization costs of Euro 115.7 million (Euro 87.3 million net of taxes and Euro 0.18 impact on EPS), (ii) non-recurring expenses of Euro 55.6 million (Euro 36.6 million net of taxes and Euro 0.08 impact on EPS) related to (a) the early repayment of financial liabilities for Euro 29.5 million (Euro 18.2 million net of taxes), (b) the pending combination with Essilor for Euro 18.5 million (Euro 13.0 million net of taxes), (c) Euro 7.6 million (Euro 5.3 million net of taxes) mainly related to the departure of Massimo Vian as CEO for Product and Operations; (iii) non-recurring income of Euro 48.7 million (Euro 192.3 million net of taxes and Euro 0.40 impact on EPS) related to (a) a gain on the sale of a building owned by the Group of Euro 48.7 million (Euro 34.9 net of taxes) and (b) the "Patent Box" tax benefit and US fiscal reform impact of Euro 157.4 million. The combined effect of (i), (ii) and (iii) for the year ended December 31, 2017, resulted in a total adjustment of approximately Euro 141.8 million at an operating income level, Euro 122.6 million at an income before provision for income taxes level, and Euro (68.4) million at a net income level. The adjusted data for the year ended December 31, 2016 excludes: (i) restructuring and reorganization costs of Euro 69.5 million (Euro 55.0 million net of taxes and Euro 0.11 impact on EPS), (ii) non-recurring expenses of Euro 17.4 million (Euro 12.0 million net of taxes and Euro 0.02 impact on EPS) related to the departure of Adil Mehboob-Khan as CEO for Markets and the Oakley integration, (iii) non-recurring income of Euro 33.4 million (Euro 0.07 impact on EPS) related to the acquisition of Salmoiraghi & Viganò. Other income/(expenses) and net income at December 31, 2016 were restated to include Euro 2.4 million from the Salmoiraghi & Viganò acquisition required by IFRS 3 - Business Combinations. 6 Net income attributable to Luxottica Group Stockholders at December 31, 2016 was restated to include Euro 2.4 million from the Salmoiraghi & Vigano’s acquisition required by IFRS 3 - Business Combinations. Luxottica Group S.p.A. Luxottica is a leader in the design, manufacture and distribution of fashion, luxury and sports eyewear. Its portfolio includes proprietary brands such as Ray-Ban, Oakley, Vogue Eyewear, Persol, Oliver Peoples and Alain Mikli, as well as licensed brands including Giorgio Armani, Burberry, Bulgari, Chanel, Coach, Dolce&Gabbana, Ferrari, Michael Kors, Prada, Ralph Lauren, Tiffany & Co., Valentino and Versace. The Group’s global wholesale distribution network covers more than 150 countries and is complemented by an extensive retail network of approximately 9,000 stores, with LensCrafters and Pearle Vision in North America, OPSM and LensCrafters in Asia-Pacific, GMO and Óticas Carol in Latin America, Salmoiraghi & Viganò in Italy and Sunglass Hut worldwide. In 2017, with approximately 85,000 employees, Luxottica posted net sales of over Euro 9 billion. Additional information on the Group is available at www.luxottica.com. Important information This press release does not constitute or form a part of any offer or solicitation to purchase or subscribe for securities in the United States or any other jurisdiction. Securities may not be offered or sold in the United States unless they have been registered under the U.S. Securities Act of 1933, as amended (the “U.S. Securities Act”), or are exempt from registration. The securities that may be offered in any transaction have not been and will not be registered under the U.S. Securities Act and Essilor does not intend to make a public offering of any such securities in the United States. This press release is only being distributed to and is only directed at (i) persons who are outside the United Kingdom or (ii) investment professionals falling within Article 19(5) of the Financial Services and Markets Act 2000 (Financial Promotion) Order 2005 (the “Order”) or (iii) high net worth companies, and other persons to whom it may lawfully be communicated, falling within Article 49(2)(a) to (d) of the Order (all such persons together being referred to as “relevant persons”). The securities which are referred to herein are only available to, and any invitation, offer or agreement to subscribe, purchase or otherwise acquire such securities will be engaged in only with, relevant persons. Any person who is not a relevant person should not act or rely on this document or any of its contents. Safe Harbor Statement Certain statements in this press release may constitute “forward-looking statements” as defined in the Private Securities Litigation Reform Act of 1995. Such statements involve risks, uncertainties and other factors that could cause actual results to differ materially from those which are anticipated. Such risks and uncertainties include, but are not limited to, the ability to manage the effects of the current uncertain international economic outlook, the ability to successfully
7

acquire and integrate new businesses, the ability to predict future economic conditions and changes to consumer preferences, the ability to successfully introduce and market new products, the ability to maintain an efficient distribution network, the ability to set and achieve our business objectives and manage growth, the ability to negotiate and maintain favorable license agreements, the availability of correction alternatives to prescription eyeglasses, fluctuations in exchange rates, changes in local conditions, the ability to protect intellectual property, the ability to maintain relationships with those hosting our stores, any failure of information technology, inventory and other asset-related risks, credit risk on our accounts, insurance risks, changes in tax laws as well as other political, economic, legal and technological factors and other risks and uncertainties described in Luxottica Group’s regulatory filings. These forward-looking statements are made as of the date hereof, and we do not assume any obligation to update them.
- APPENDIX FOLLOWS –
8
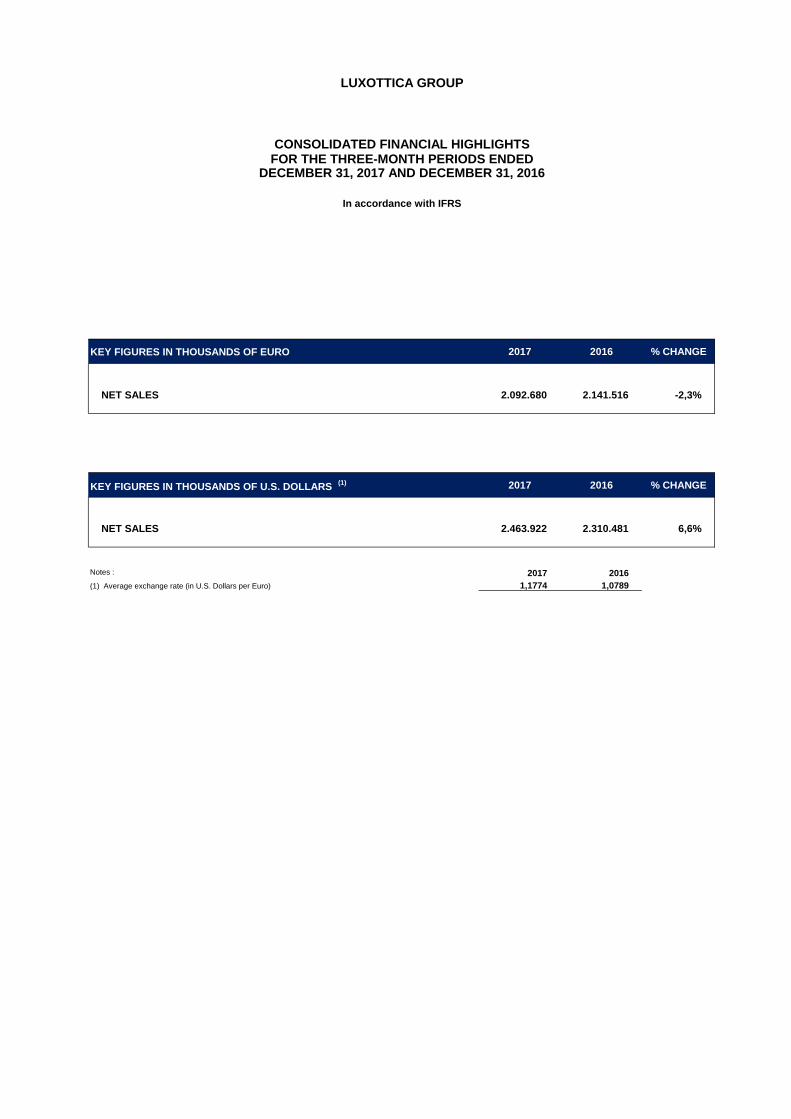
KEY FIGURES IN THOUSANDS OF EURO 2017 2016 % CHANGE
NET SALES 2.092.680 2.141.516 -2,3%
KEY FIGURES IN THOUSANDS OF U.S. DOLLARS (1) 2017 2016 % CHANGE
NET SALES 2.463.922 2.310.481 6,6%
Notes : 2017 2016
(1) Average exchange rate (in U.S. Dollars per Euro) 1,1774 1,0789
LUXOTTICA GROUP
CONSOLIDATED FINANCIAL HIGHLIGHTSFOR THE THREE-MONTH PERIODS ENDED
DECEMBER 31, 2017 AND DECEMBER 31, 2016
In accordance with IFRS

KEY FIGURES IN THOUSANDS OF EURO 2017 2016 (1) % CHANGE
NET SALES 9.157.291 9.085.707 0,8%
NET INCOME ATTRIBUTABLE TO LUXOTTICA GROUP STOCKHOLDERS 1.038.445 848.137 22,4%
BASIC EARNINGS PER SHARE (ADS) (2) 2,17 1,77 22,7%
KEY FIGURES IN THOUSANDS OF U.S. DOLLARS (3) 2017 2016 (1) % CHANGE
NET SALES 10.344.992 10.056.969 2,9%
NET INCOME ATTRIBUTABLE TO LUXOTTICA GROUP STOCKHOLDERS 1.173.132 938.802 25,0%
BASIC EARNINGS PER SHARE (ADS) (2)
2,45 1,96 25,3%
Notes : 2017 2016
(2) Weighted average number of outstanding shares 478.068.696 479.225.730
(3) Average exchange rate (in U.S. Dollars per Euro) 1,1297 1,1069
LUXOTTICA GROUP
CONSOLIDATED FINANCIAL HIGHLIGHTSFOR THE YEARS ENDED
DECEMBER 31, 2017 AND DECEMBER 31, 2016
In accordance with IFRS
(1) Net income attributable to Luxottica Group Stockholders at December 31, 2016 was restated to include Euro
2.4 million from the Salmoiraghi & Viganò acquisition required by IFRS 3 - Business Combinations.

KEY FIGURES IN THOUSANDS OF EURO (1) 2017% OF
SALES
2016
restated (2)
% OF
SALES% CHANGE
NET SALES 9.157.291 100,0% 9.085.707 100,0% 0,8%
COST OF SALES (3.282.098) (3.153.264)
GROSS PROFIT 5.875.194 64,2% 5.932.443 65,3% -1,0%
OPERATING EXPENSES:
SELLING EXPENSES (3.025.835) (2.889.177)
ROYALTIES (164.043) (169.890)
ADVERTISING EXPENSES (501.748) (567.895)
GENERAL AND ADMINISTRATIVE EXPENSES (882.971) (960.214)
TOTAL (4.574.597) (4.587.176)
OPERATING INCOME 1.300.596 14,2% 1.345.267 14,8% -3,3%
OTHER INCOME (EXPENSE):
INTEREST INCOME 18.199 15.469
INTEREST EXPENSES (107.746) (81.528)
OTHER - NET 45.441 37.099
OTHER INCOME (EXPENSES)-NET (44.106) (28.960)
INCOME BEFORE PROVISION FOR INCOME TAXES 1.256.490 13,7% 1.316.307 14,5% -4,5%
PROVISION FOR INCOME TAXES (216.085) (466.373)
NET INCOME 1.040.405 11,4% 849.934 9,4% 22,4%
OF WHICH ATTRIBUTABLE TO:
- LUXOTTICA GROUP STOCKHOLDERS 1.038.445 11,3% 848.137 9,3% 22,4%
- NON-CONTROLLING INTERESTS 1.960 0,0% 1.797 0,0%
NET INCOME 1.040.405 11,4% 849.934 9,4% 22,4%
BASIC EARNINGS PER SHARE (ADS): 2,17 1,77
FULLY DILUTED EARNINGS PER SHARE (ADS): 2,17 1,77
WEIGHTED AVERAGE NUMBER OF OUTSTANDING SHARES 478.068.696 479.225.730
FULLY DILUTED AVERAGE NUMBER OF SHARES 478.348.377 480.025.531
Notes:
(1) Except earnings per share (ADS), which are expressed in Euro
(2) Other Income (expenses) - net income as at December 31, 2016 ware restated to include Euro 2.4 million from the Salmoiraghi & Viganò acquisition required by IFRS 3 - Business
Combinations.
LUXOTTICA GROUP
FOR YEARS ENDEDDECEMBER 31, 2017 AND DECEMBER 31, 2016
CONSOLIDATED INCOME STATEMENT
In accordance with IFRS
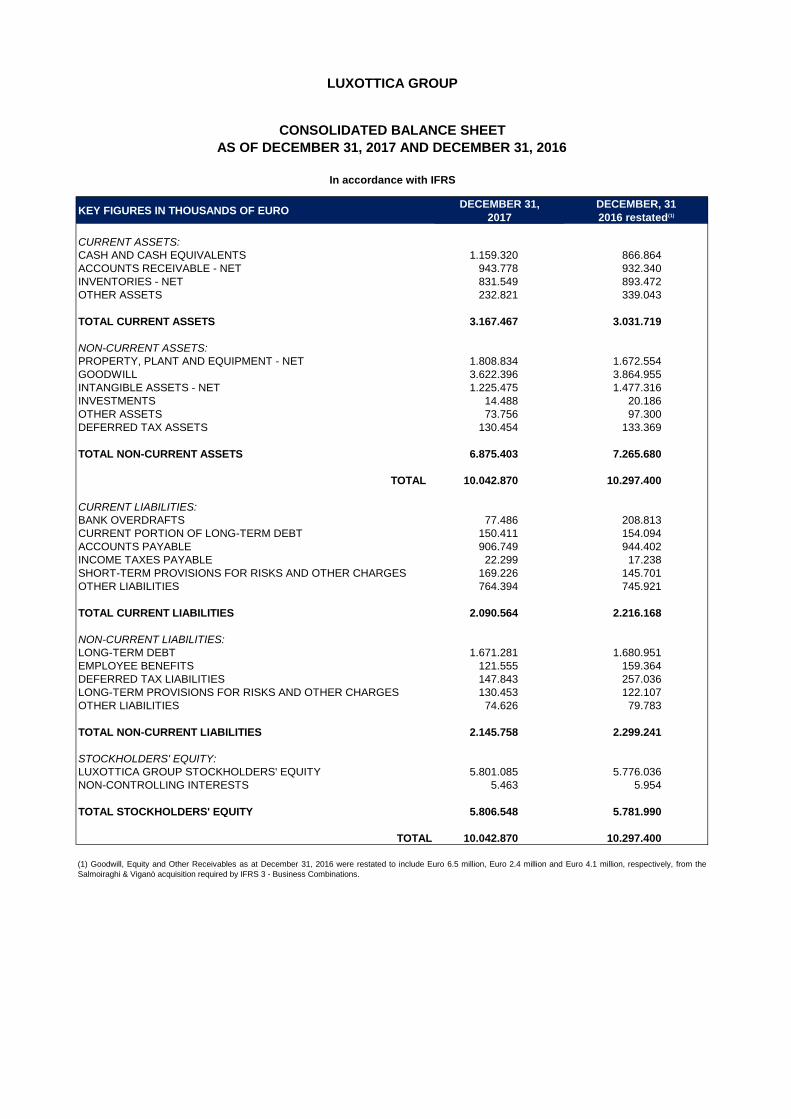
KEY FIGURES IN THOUSANDS OF EURO DECEMBER 31,
2017
DECEMBER, 31
2016 restated(1)
CURRENT ASSETS:
CASH AND CASH EQUIVALENTS 1.159.320 866.864
ACCOUNTS RECEIVABLE - NET 943.778 932.340
INVENTORIES - NET 831.549 893.472
OTHER ASSETS 232.821 339.043
TOTAL CURRENT ASSETS 3.167.467 3.031.719
NON-CURRENT ASSETS:
PROPERTY, PLANT AND EQUIPMENT - NET 1.808.834 1.672.554
GOODWILL 3.622.396 3.864.955
INTANGIBLE ASSETS - NET 1.225.475 1.477.316
INVESTMENTS 14.488 20.186
OTHER ASSETS 73.756 97.300
DEFERRED TAX ASSETS 130.454 133.369
TOTAL NON-CURRENT ASSETS 6.875.403 7.265.680
TOTAL 10.042.870 10.297.400
CURRENT LIABILITIES:
BANK OVERDRAFTS 77.486 208.813
CURRENT PORTION OF LONG-TERM DEBT 150.411 154.094
ACCOUNTS PAYABLE 906.749 944.402
INCOME TAXES PAYABLE 22.299 17.238
SHORT-TERM PROVISIONS FOR RISKS AND OTHER CHARGES 169.226 145.701
OTHER LIABILITIES 764.394 745.921
TOTAL CURRENT LIABILITIES 2.090.564 2.216.168
NON-CURRENT LIABILITIES:
LONG-TERM DEBT 1.671.281 1.680.951
EMPLOYEE BENEFITS 121.555 159.364
DEFERRED TAX LIABILITIES 147.843 257.036
LONG-TERM PROVISIONS FOR RISKS AND OTHER CHARGES 130.453 122.107
OTHER LIABILITIES 74.626 79.783
TOTAL NON-CURRENT LIABILITIES 2.145.758 2.299.241
STOCKHOLDERS' EQUITY:
LUXOTTICA GROUP STOCKHOLDERS' EQUITY 5.801.085 5.776.036
NON-CONTROLLING INTERESTS 5.463 5.954
TOTAL STOCKHOLDERS' EQUITY 5.806.548 5.781.990
TOTAL 10.042.870 10.297.400
(1) Goodwill, Equity and Other Receivables as at December 31, 2016 were restated to include Euro 6.5 million, Euro 2.4 million and Euro 4.1 million, respectively, from the
Salmoiraghi & Viganò acquisition required by IFRS 3 - Business Combinations.
In accordance with IFRS
LUXOTTICA GROUP
CONSOLIDATED BALANCE SHEET
AS OF DECEMBER 31, 2017 AND DECEMBER 31, 2016
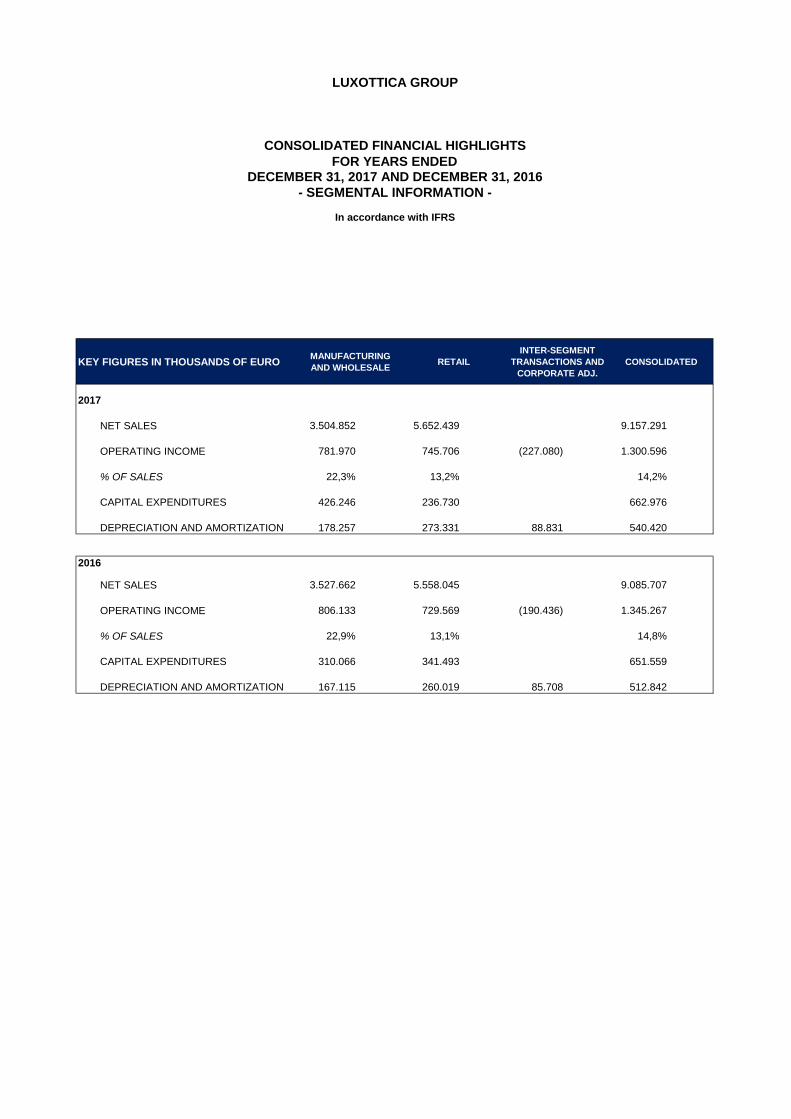
KEY FIGURES IN THOUSANDS OF EURO MANUFACTURING
AND WHOLESALE RETAIL
INTER-SEGMENT
TRANSACTIONS AND
CORPORATE ADJ.
CONSOLIDATED
2017
NET SALES 3.504.852 5.652.439 9.157.291
OPERATING INCOME 781.970 745.706 (227.080) 1.300.596
% OF SALES 22,3% 13,2% 14,2%
CAPITAL EXPENDITURES 426.246 236.730 662.976
DEPRECIATION AND AMORTIZATION 178.257 273.331 88.831 540.420
2016
NET SALES 3.527.662 5.558.045 9.085.707
OPERATING INCOME 806.133 729.569 (190.436) 1.345.267
% OF SALES 22,9% 13,1% 14,8%
CAPITAL EXPENDITURES 310.066 341.493 651.559
DEPRECIATION AND AMORTIZATION 167.115 260.019 85.708 512.842
LUXOTTICA GROUP
CONSOLIDATED FINANCIAL HIGHLIGHTS
In accordance with IFRS
DECEMBER 31, 2017 AND DECEMBER 31, 2016
- SEGMENTAL INFORMATION -
FOR YEARS ENDED
LUXOTTICA GROUP
NON-IFRS MEASURES: ADJUSTED MEASURES
In order to provide a supplemental comparison of current period results of operations to prior periods, we have adjusted for certain transactions
or events. We have made such adjustments to the following measures: cost of sales, operating expenses, operating income, EBITDA, other
income/(expense), income before provision for income taxes, provision for income taxes, net income and earnings per share.
The adjusted data for the year ended December 31, 2017 excludes: (i) restructuring and reorganization costs of Euro 115.7 million (Euro 87.3
million net of taxes and Euro 0.18 impact on EPS), (ii) non-recurring expenses of Euro 55.6 million (Euro 36.6 million net of taxes and Euro
0.08 impact on EPS) related to (a) the early repayment of financial liabilities for Euro 29.5 million (Euro 18.2 million net of taxes), (b) the
pending combination with Essilor for Euro 18.5 million (Euro 13.0 million net of taxes), (c) Euro 7.6 million (Euro 5.3 million net of taxes) mainly
related to the departure of Massimo Vian as CEO for Product and Operations, (iii) non-recurring income of Euro 48.7 million (Euro 192.3 million
net of taxes and Euro 0.40 impact on EPS) related to (a) a gain on the sale of a building owned by the Group of Euro 48.7 million (Euro 34.9
net of taxes) and (b) the "Patent Box" tax benefit and US fiscal reform impact of Euro 157.4 million.
The combined effect of (i), (ii) and (iii) for the year ended December 31, 2017, resulted in a total adjustment of approximately Euro 141.8 million
at an operating income level, Euro 122.6 million at an income before provision for income taxes level, and Euro (68.4) million at a net income
level.
The adjusted data for the year ended December 31, 2016 excludes: (i) restructuring and reorganization costs of Euro 69.5 million (Euro 55.0
million net of taxes and Euro 0.11 impact on EPS), (ii) non-recurring expenses of Euro 17.4 million (Euro 12.0 million net of taxes and Euro
0.02 impact on EPS) related to the departure of Adil Mehboob-Khan as CEO for markets and the Oakley integration, (iii) non-recurring income
of Euro 33.4 million (Euro 0.07 impact on EPS) related to the acquisition of Salmoiraghi & Viganò.
Other income/(expenses) and net income at December 31, 2016 were restated to include Euro 2.4 million from the Salmoiraghi & Viganò
acquisition required by IFRS 3 - Business Combinations.
The Company believes that these adjusted measures are useful to both management and investors in evaluating the Company’s operating
performance compared with that of other companies in its industry because they exclude the impact of certain items that are not relevant to the
Company’s operating performance.
The adjusted measures referenced above are not measures of performance in accordance with International Financial Reporting Standards as
issued by the International Accounting Standards Board (IFRS). We include these adjusted measures in this presentation in order to provide a
supplemental view of operations.
These adjusted measures are not meant to be considered in isolation or as a substitute for items appearing on our financial statements
prepared in accordance with IFRS. Rather, these non/IFRS measures should be used as a supplement to IFRS results to assist the reader in
better understanding the operational performance of the Company. The Company cautions that these adjusted measures are not defined terms
under IFRS and their definitions should be carefully reviewed and understood by investors. Investors should be aware that Luxottica Group’s
method of calculating these adjusted measures may differ from methods used by other companies.
The Company recognizes that there are limitations in the usefulness of adjusted measures due to the subjective nature of items excluded by
management in calculating adjusted comparisons. We compensate for the foregoing limitations by using these adjusted measures as a
comparative tool, together with IFRS measures, to assist in the evaluation of our operating performance.
See the tables on the following pages for a reconciliation of the adjusted measures discussed above to their most directly comparable IFRS
financial measures or, in the case of adjusted EBITDA and adjusted EBITDA margin, to EBITDA and EBITDA margin, respectively, which are
also non-IFRS measures. For a discussion of EBITDA and EBITDA margin and a reconciliation of EBITDA and EBITDA margin to their most
directly comparable IFRS financial measures, see the tables on the pages immediately following the reconciliation of the adjusted measures.
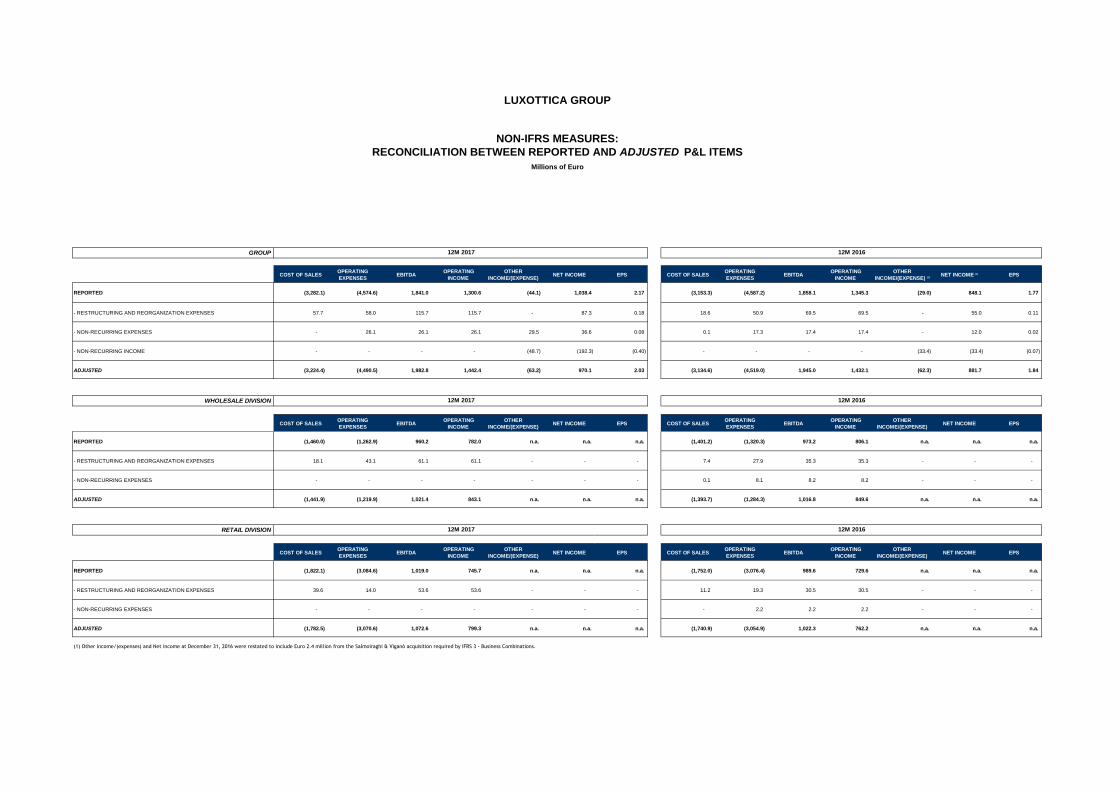
GROUP
COST OF SALESOPERATING
EXPENSES EBITDA
OPERATING
INCOME
OTHER
INCOME/(EXPENSE) NET INCOME EPS COST OF SALES
OPERATING
EXPENSES EBITDA
OPERATING
INCOME
OTHER
INCOME/(EXPENSE) (1) NET INCOME (1) EPS
REPORTED (3,282.1) (4,574.6) 1,841.0 1,300.6 (44.1) 1,038.4 2.17 (3,153.3) (4,587.2) 1,858.1 1,345.3 (29.0) 848.1 1.77
- RESTRUCTURING AND REORGANIZATION EXPENSES 57.7 58.0 115.7 115.7 - 87.3 0.18 18.6 50.9 69.5 69.5 - 55.0 0.11
- NON-RECURRING EXPENSES - 26.1 26.1 26.1 29.5 36.6 0.08 0.1 17.3 17.4 17.4 - 12.0 0.02
- NON-RECURRING INCOME - - - - (48.7) (192.3) (0.40) - - - - (33.4) (33.4) (0.07)
ADJUSTED (3,224.4) (4,490.5) 1,982.8 1,442.4 (63.2) 970.1 2.03 (3,134.6) (4,519.0) 1,945.0 1,432.1 (62.3) 881.7 1.84
WHOLESALE DIVISION
COST OF SALESOPERATING
EXPENSES EBITDA
OPERATING
INCOME
OTHER
INCOME/(EXPENSE) NET INCOME EPS COST OF SALES
OPERATING
EXPENSES EBITDA
OPERATING
INCOME
OTHER
INCOME/(EXPENSE) NET INCOME EPS
REPORTED (1,460.0) (1,262.9) 960.2 782.0 n.a. n.a. n.a. (1,401.2) (1,320.3) 973.2 806.1 n.a. n.a. n.a.
- RESTRUCTURING AND REORGANIZATION EXPENSES 18.1 43.1 61.1 61.1 - - - 7.4 27.9 35.3 35.3 - - -
- NON-RECURRING EXPENSES - - - - - - - 0.1 8.1 8.2 8.2 - - -
ADJUSTED (1,441.9) (1,219.9) 1,021.4 843.1 n.a. n.a. n.a. (1,393.7) (1,284.3) 1,016.8 849.6 n.a. n.a. n.a.
RETAIL DIVISION
COST OF SALESOPERATING
EXPENSES EBITDA
OPERATING
INCOME
OTHER
INCOME/(EXPENSE) NET INCOME EPS COST OF SALES
OPERATING
EXPENSES EBITDA
OPERATING
INCOME
OTHER
INCOME/(EXPENSE) NET INCOME EPS
REPORTED (1,822.1) (3,084.6) 1,019.0 745.7 n.a. n.a. n.a. (1,752.0) (3,076.4) 989.6 729.6 n.a. n.a. n.a.
- RESTRUCTURING AND REORGANIZATION EXPENSES 39.6 14.0 53.6 53.6 - - - 11.2 19.3 30.5 30.5 - - -
- NON-RECURRING EXPENSES - - - - - - - - 2.2 2.2 2.2 - - -
ADJUSTED (1,782.5) (3,070.6) 1,072.6 799.3 n.a. n.a. n.a. (1,740.9) (3,054.9) 1,022.3 762.2 n.a. n.a. n.a.
(1) Other income/(expenses) and Net income at December 31, 2016 were restated to include Euro 2.4 million from the Salmoiraghi & Viganò acquisition required by IFRS 3 - Business Combinations.
12M 201612M 2017
12M 2017
12M 2017 12M 2016
LUXOTTICA GROUP
NON-IFRS MEASURES:
RECONCILIATION BETWEEN REPORTED AND ADJUSTED P&L ITEMS
Millions of Euro
12M 2016
LUXOTTICA GROUP
NON-IFRS MEASURES: EBITDA AND EBITDA MARGIN
EBITDA represents net income before non-controlling interest, taxes, other income/expense, depreciation and
amortization. EBITDA margin means EBITDA divided by net sales. The Company believes that EBITDA is useful to both
management and investors in evaluating the Company’s operating performance compared with that of other companies in
its industry. Our calculation of EBITDA allows us to compare our operating results with those of other companies without
giving effect to financing, income taxes and the accounting effects of capital spending, which items may vary for different
companies for reasons unrelated to the overall operating performance of a company’s business.
EBITDA and EBITDA margin are not measures of performance under International Financial Reporting Standards as
issued by the International Accounting Standards Board (IFRS).
We include them in this presentation in order to:
● improve transparency for investors;
● assist investors in their assessment of the Company’s operating performance and its ability to refinance its debt as
it matures and incur additional indebtedness to invest in new business opportunities;
● assist investors in their assessment of the Company’s cost of debt;
● ensure that these measures are fully understood in light of how the Company evaluates its operating results and
leverage;
● properly define the metrics used and confirm their calculation; and
● share these measures with all investors at the same time.
EBITDA and EBITDA margin are not meant to be considered in isolation or as a substitute for items appearing on our
financial statements prepared in accordance with IFRS. Rather, these non-IFRS measures should be used as a
supplement to IFRS results to assist the reader in better understanding the operational performance of the Company. The
Company cautions that these measures are not defined terms under IFRS and their definitions should be carefully
reviewed and understood by investors. Investors should be aware that Luxottica Group’s method of calculating EBITDA
may differ from methods used by other companies.
The Company recognizes that the usefulness of EBITDA has certain limitations, including:
● EBITDA does not include interest expense. Because we have borrowed money in order to finance our operations,
interest expense is a necessary element of our costs and ability to generate profits and cash flows. Therefore, any
measure that excludes interest expense may have material limitations;
● EBITDA does not include depreciation and amortization expense. Because we use capital assets, depreciation and
amortization expense is a necessary element of our costs and ability to generate profits. Therefore, any measure that
excludes depreciation and expense may have material limitations;
● EBITDA does not include provision for income taxes. Because the payment of income taxes is a necessary
element of our costs, any measure that excludes tax expense may have material limitations;
● EBITDA does not reflect cash expenditures or future requirements for capital expenditures or contractual
commitments;
● EBITDA does not allow us to analyze the effect of certain recurring and non-recurring items that materially affect
our net income or loss.
We compensate for the foregoing limitations by using EBITDA as a comparative tool, together with IFRS measures, to
assist in the evaluation of our operating performance and leverage.
See the table on the following page for a reconciliation of EBITDA to net income, which is the most directly comparable
IFRS financial measure, as well as the calculation of EBITDA margin.

FY 2017 FY 2016(1)
NET INCOME/(LOSS) 1,038.4 848.1
(+)
NET INCOME ATTRIBUTABLE TO NON CONTROLLING INTEREST 2.0 1.8
(+)
PROVISION FOR INCOME TAXES 216.1 466.4
(+)
OTHER (INCOME)/EXPENSES 44.1 29.0
(+)
DEPRECIATION AND AMORTIZATION 540.4 512.8
(+)
EBITDA 1,841.0 1,858.1
(=)
NET SALES 9,157.3 9,085.7
(/)
EBITDA MARGIN 20.1% 20.5%
(=)
LUXOTTICA GROUP
NON-IFRS MEASURES:
EBITDA and EBITDA margin
Millions of Euro
(1) Other income/(expenses) and Net income at December 31, 2016 were restated to include Euro 2.4 million from the
Salmoiraghi & Viganò acquisition required by IFRS 3 - Business Combinations.

FY 2017 (1,2,3)
FY 2016 (4,5,6)
Adjusted NET INCOME/(LOSS) 970.1 881.7
(+)
NET INCOME ATTRIBUTABLE TO NON CONTROLLING INTEREST 2.0 1.8
(+)
PROVISION FOR INCOME TAXES 407.1 486.3
(+)
OTHER (INCOME)/EXPENSES 63.2 62.3
(+)
DEPRECIATION AND AMORTIZATION 540.4 512.8
(+)
Adjusted EBITDA 1,982.8 1,945.0
(=)
NET SALES 9,157.3 9,085.7
(/)
Adjusted EBITDA MARGIN 21.7% 21.4%
(=)
(1) Exclude for 2017 restructuring and reorganization costs of Euro 115.7 million (Euro 87.3 million net of taxes);
(2) Exclude for 2017 non-recurring expenses of Euro 55.6 million (Euro 36.6 million net of taxes);
(3) Exclude for 2017 non-recurring income of Euro 48.7 million (Euro 192.3 million net of taxes) related to a gain on the sales of a building owned by the
Group of Euro 48.7 million (Euro 34.9 net of taxes and Euro) and the "Patent Box" tax benefit and US fiscal reform impact of Euro 157.4 million;(4)
Exclude for 2016 restructuring and reorganization costs of Euro 69.5 million (Euro 55.0 million net of taxes);(5)
Exclude for 2016 non-recurring expenses of Euro 17.4 million (Euro 12.0 million net of taxes) related to the departure of Adil Mehboob-Khan as CEO for
markets and the Oakley integration;(6)
Exclude for 2016 non-recurring income of Euro 33.4 million related to the acquisition of Salmoiraghi & Viganò.
LUXOTTICA GROUP
The adjusted figures :
NON-IFRS MEASURES:
ADJUSTED EBITDA AND ADJUSTED EBITDA MARGIN
Millions of Euro
LUXOTTICA GROUP
NON-IFRS MEASURES: NET DEBT TO EBITDA RATIO
Net debt to EBITDA ratio: Net debt means the sum of bank overdrafts, current portion of long-term debt and long-term debt, less
cash. EBITDA represents net income before non-controlling interests, taxes, other income/expense, depreciation and
amortization. The Company believes that EBITDA is useful to both management and investors in evaluating the
Company’s operating performance compared with that of other companies in its industry. Our calculation of EBITDA allows us to
compare our operating results with those of other companies without giving effect to financing, income taxes and the accounting
effects of capital spending, which items may vary for different companies for reasons unrelated to the overall operating
performance of a company’s business. The ratio of net debt to EBITDA is a measure used by management to assess the
Company’s level of leverage, which affects our ability to refinance our debt as it matures and incur additional indebtedness to
invest in new business opportunities. The ratio also allows management to assess the cost of existing debt since it affects the
interest rates charged by the Company’s lenders.
EBITDA and ratio of net debt to EBITDA are not measures of performance under International Financial Reporting Standards as
issued by the International Accounting Standards Board (IFRS). We include them in this presentation in order to:
● improve transparency for investors;
● assist investors in their assessment of the Company’s operating performance and its ability to refinance its debt as it
matures and incur additional indebtedness to invest in new business opportunities;
● assist investors in their assessment of the Company’s cost of debt;
● ensure that these measures are fully understood in light of how the Company evaluates its operating results and leverage;
● properly define the metrics used and confirm their calculation; and
● share these measures with all investors at the same time.
EBITDA and the ratio of net debt to EBITDA are not meant to be considered in isolation or as a substitute for items appearing on
our financial statements prepared in accordance with IFRS. Rather, these non-IFRS measures should be used as a supplement to
IFRS results to assist the reader in better understanding the operational performance of the Company. The Company cautions that
these measures are not defined terms under IFRS and their definitions should be carefully reviewed and understood by investors.
Investors should be aware that Luxottica Group’s method of calculating EBITDA and the ratio of net debt to EBITDA may differ
from methods used by other companies.The Company recognizes that the usefulness of EBITDA and the ratio of net debt to
EBITDA as evaluative tools may have certain limitations, including:
● EBITDA does not include interest expense. Because we have borrowed money in order to finance our operations, interest
expense is a necessary element of our costs and ability to generate profits and cash flows. Therefore, any measure that excludes
interest expense may have material limitations;
● EBITDA does not include depreciation and amortization expense. Because we use capital assets, depreciation and
amortization expense is a necessary element of our costs and ability to generate profits. Therefore, any measure that excludes
depreciation and expense may have material limitations;
● EBITDA does not include provision for income taxes. Because the payment of income taxes is a necessary element of our
costs, any measure that excludes tax expense may have material limitations;
● EBITDA does not reflect cash expenditures or future requirements for capital expenditures or contractual commitments;
● EBITDA does not reflect changes in, or cash requirements for, working capital needs;
● EBITDA does not allow us to analyze the effect of certain recurring and non-recurring items that materially affect our net
income or loss; and
● The ratio of net debt to EBITDA is net of cash and cash equivalents, restricted cash and short-term investments, thereby
reducing our debt position.
Because we may not be able to use our cash to reduce our debt on a dollar-for-dollar basis, this measure may have material
limitations. We compensate for the foregoing limitations by using EBITDA and the ratio of net debt to EBITDA as two of several
comparative tools, together with IFRS measures, to assist in the evaluation of our operating performance and leverage.
See the table on the following page for a reconciliation of net debt to long-term debt, which is the most directly comparable IFRS
financial measure, as well as the calculation of the ratio of net debt to EBITDA. For a reconciliation of EBITDA to net income,
which is the most directly comparable IFRS financial measure, see the table on the preceding pages.

DECEMBER 31, 2017 DECEMBER 31, 2016
LONG-TERM DEBT (+) 1,671.3 1,681.0
CURRENT PORTION OF LONG TERM DEBT (+) 150.4 154.1
BANK OVERDRAFTS (+) 77.5 208.8
CASH (-) (1,159.3) (866.9)
NET DEBT (=) 739.9 1,177.0
EBITDA (LTM) 1,841.0 1,858.1
NET DEBT/EBITDA 0.4x 0.6x
NET DEBT @ AVG. EXCHANGE RATES (1)
718.9 1,172.2
NET DEBT @ AVG. EXCHANGE RATES (1)
/EBITDA 0.4x 0.6x
Notes:(1) Net debt figures are calculated using the average exchange rates used to calculate the EBITDA figures.
LUXOTTICA GROUP
NON-IFRS MEASURES:
NET DEBT AND NET DEBT/EBITDA
Millions of Euro
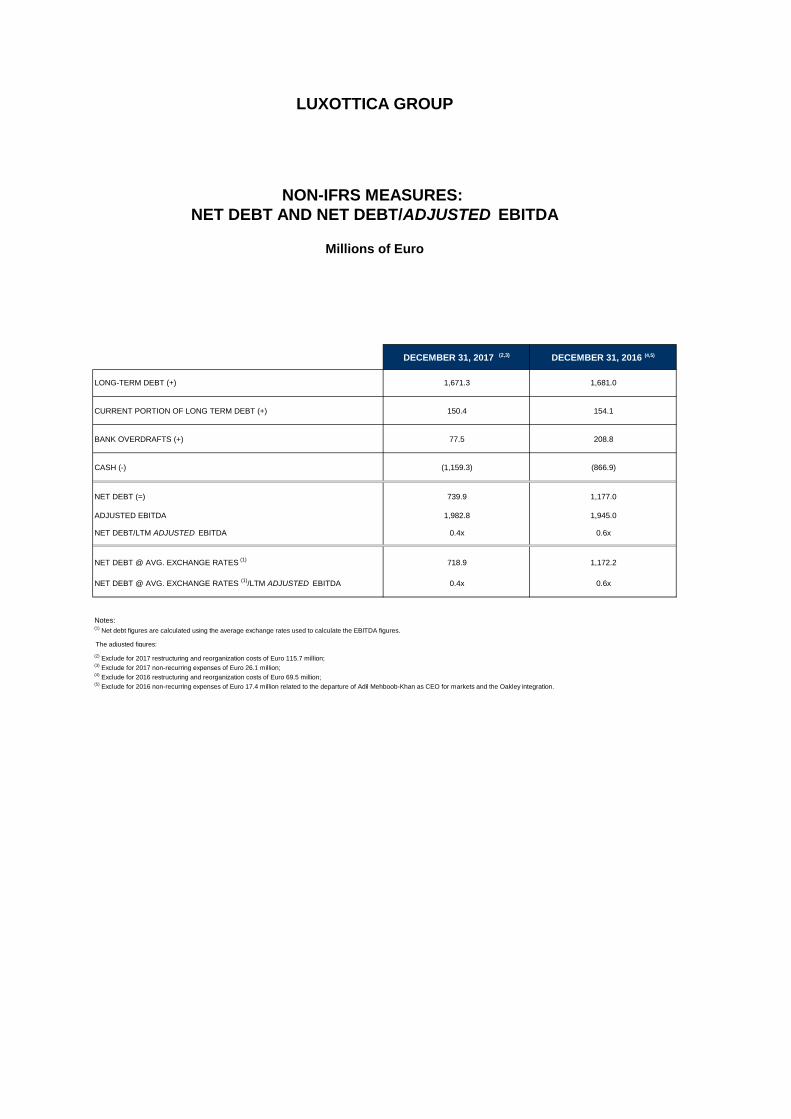
DECEMBER 31, 2017 (2,3) DECEMBER 31, 2016 (4,5)
LONG-TERM DEBT (+) 1,671.3 1,681.0
CURRENT PORTION OF LONG TERM DEBT (+) 150.4 154.1
BANK OVERDRAFTS (+) 77.5 208.8
CASH (-) (1,159.3) (866.9)
NET DEBT (=) 739.9 1,177.0
ADJUSTED EBITDA 1,982.8 1,945.0
NET DEBT/LTM ADJUSTED EBITDA 0.4x 0.6x
NET DEBT @ AVG. EXCHANGE RATES (1)
718.9 1,172.2
NET DEBT @ AVG. EXCHANGE RATES (1)
/LTM ADJUSTED EBITDA 0.4x 0.6x
Notes:
(2) Exclude for 2017 restructuring and reorganization costs of Euro 115.7 million;
(3) Exclude for 2017 non-recurring expenses of Euro 26.1 million;
(4) Exclude for 2016 restructuring and reorganization costs of Euro 69.5 million;
(5) Exclude for 2016 non-recurring expenses of Euro 17.4 million related to the departure of Adil Mehboob-Khan as CEO for markets and the Oakley integration.
The adjusted figures:
LUXOTTICA GROUP
NON-IFRS MEASURES:
NET DEBT AND NET DEBT/ADJUSTED EBITDA
Millions of Euro
(1) Net debt figures are calculated using the average exchange rates used to calculate the EBITDA figures.
LUXOTTICA GROUP
NON-IFRS MEASURES: FREE CASH FLOW
Free cash flow represents net income before non-controlling interests, taxes, other income/expense, depreciation and
amortization (i.e. EBITDA – see table on the earlier page) plus or minus the decrease/(increase) in working capital over
the prior period, less capital expenditures, plus or minus interest income/(expense) and extraordinary items, minus taxes
paid. The Company believes that free cash flow is useful to both management and investors in evaluating the Company’s
operating performance compared with other companies in its industry. In particular, our calculation of free cash flow
provides a clearer picture of the Company’s ability to generate net cash from operations, which is used for mandatory debt
service requirements, for funding discretionary investments, for paying dividends or pursuing other strategic opportunities.
Free cash flow is not a measure of performance under International Financial Reporting Standards as issued by the
International Accounting Standards Board (IFRS).
We include it in this presentation in order to:
● Improve transparency for investors;
● Assist investors in their assessment of the Company’s operating performance and its ability to generate cash from
operations in excess of its cash expenses;
● Ensure that this measure is fully understood in light of how the Company evaluates its operating results;
● Properly define the metrics used and confirm their calculation; and
● Share this measure with all investors at the same time.
Free cash flow is not meant to be considered in isolation or as a substitute for items appearing on our financial statements
prepared in accordance with IFRS. Rather, this non-IFRS measure should be used as a supplement to IFRS results to
assist the reader in better understanding the operational performance of the Company. The Company cautions that this
measure is not a defined term under IFRS and its definition should be carefully reviewed and understood by investors.
Investors should be aware that Luxottica Group’s method of calculation of free cash flow may differ from methods used by
other companies. The Company recognizes that the usefulness of free cash flow as an evaluative tool may have certain
limitations, including:
● The manner in which the Company calculates free cash flow may differ from that of other companies, which limits
its usefulness as a comparative measure;
● Free cash flow does not represent the total increase or decrease in the net debt balance for the period since it
excludes, among other things, cash used for funding discretionary investments and to pursue strategic opportunities
during the period and any impact of the exchange rate changes; and
● Free cash flow can be subject to adjustment at the Company’s discretion if the Company takes steps or adopts
policies that increase or diminish its current liabilities and/or changes to working capital.
Because we may not be able to use our cash to reduce our debt on a dollar-for-dollar basis, this measure may have
material limitations. We compensate for the foregoing limitations by using EBITDA and the ratio of net debt to EBITDA as
two of several comparative tools, together with IFRS measures, to assist in the evaluation of our operating performance
and leverage.
See the table on the following page for a reconciliation of net debt to long-term debt, which is the most directly comparable
IFRS financial measure, as well as the calculation of the ratio of net debt to EBITDA. For a reconciliation of EBITDA to net
income, which is the most directly comparable IFRS financial measure, see the table on the preceding page.
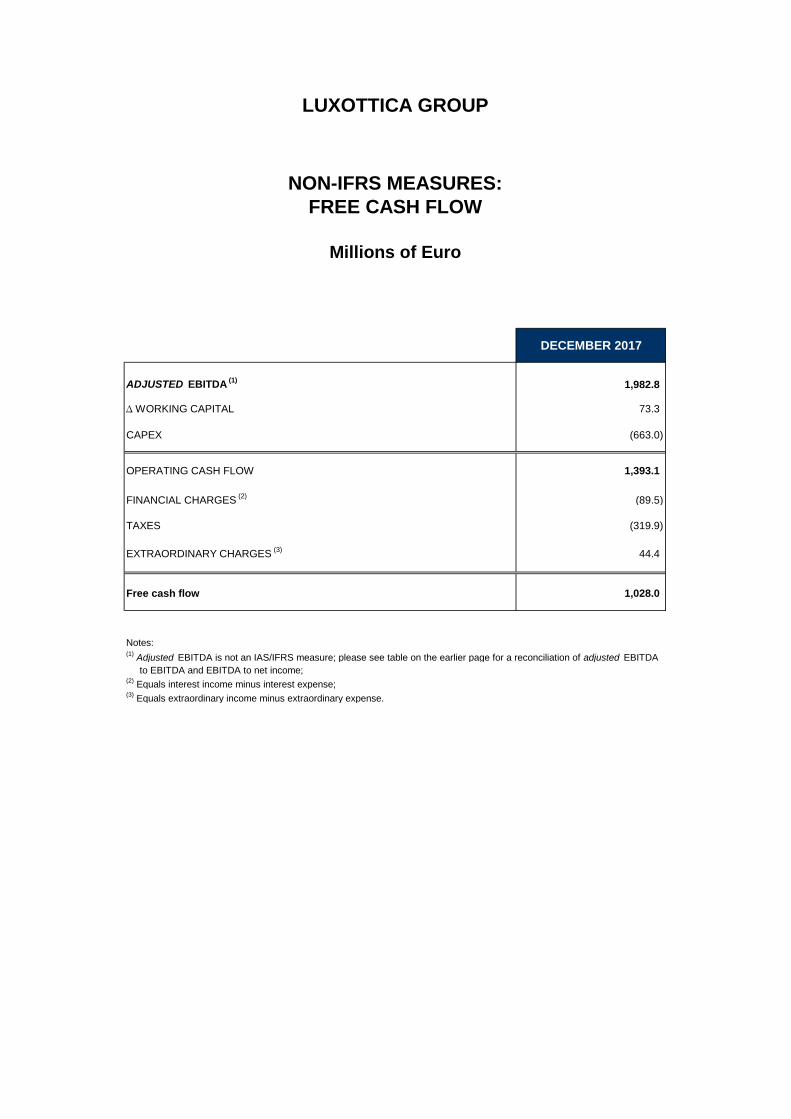
DECEMBER 2017
ADJUSTED EBITDA (1)
1,982.8
Δ WORKING CAPITAL 73.3
CAPEX (663.0)
OPERATING CASH FLOW 1,393.1
FINANCIAL CHARGES (2)
(89.5)
TAXES (319.9)
EXTRAORDINARY CHARGES (3)
44.4
Free cash flow 1,028.0
Notes:(1)
Adjusted EBITDA is not an IAS/IFRS measure; please see table on the earlier page for a reconciliation of adjusted EBITDA
to EBITDA and EBITDA to net income;(2)
Equals interest income minus interest expense;(3)
Equals extraordinary income minus extraordinary expense.
LUXOTTICA GROUP
NON-IFRS MEASURES:
FREE CASH FLOW
Millions of Euro
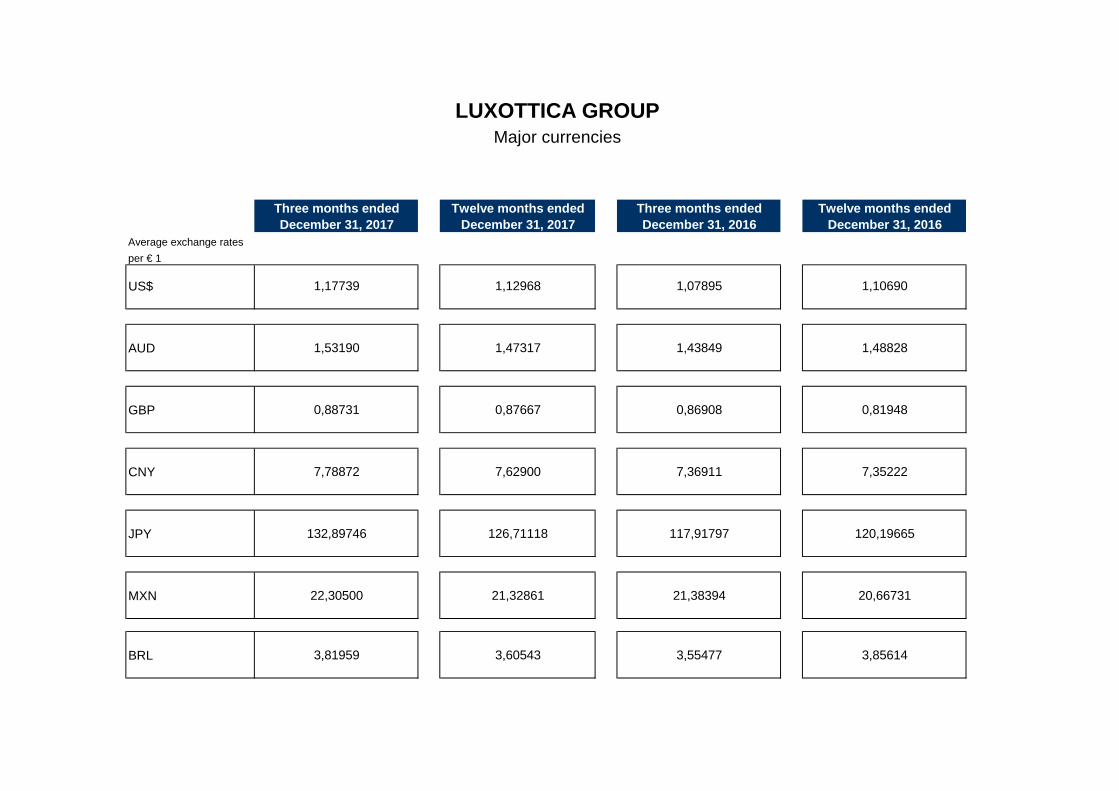
Three months ended Twelve months ended Three months ended Twelve months endedDecember 31, 2017 December 31, 2017 December 31, 2016 December 31, 2016
Average exchange ratesper € 1
US$ 1,17739 1,12968 1,07895 1,10690
AUD 1,53190 1,47317 1,43849 1,48828
GBP 0,88731 0,87667 0,86908 0,81948
CNY 7,78872 7,62900 7,36911 7,35222
JPY 132,89746 126,71118 117,91797 120,19665
MXN 22,30500 21,32861 21,38394 20,66731
BRL 3,81959 3,60543 3,55477 3,85614
LUXOTTICA GROUPMajor currencies