Embed Size (px)
Citation preview

Microbial Diversity from Harsh Environments
Recording Change at Mammoth Hot Springs
v o l u m e 1 8 • i s s u e 3 • 2 0 1 0

I remember visiting Mammoth Hot Springs during my family’s trip to Yellowstone when I was in elementary school. For me, the terraces paled in comparison to
the excitement of the geysers, the vivid colors of hot pools, and the surprise of seeing wildlife species we had never seen before. Having observed the Mammoth terraces now over many years, I’ve concluded that a single visit is interesting, but only after multiple visits can you begin to appreciate how dynamic the area really is.
In this issue, Ana Houseal shares a project in which el-ementary and junior high school students work with teach-ers and scientists to capture photographs and data that re-cord often dramatic changes at the terraces over time. These
students are creating a database that will be available for fu-ture study while learning valuable lessons about the power of observation and the scientific process. Maybe one of them will go on someday to be involved in a project like Brett Carr’s, where scientists are using aerial photographs and modern technology to map changes at Mammoth and mea-sure thermal water discharge from the system. Maybe one of them will choose to study the park’s extreme thermophiles, as discussed by Dennis Grogan in his article. And hopefully all of them will leave the park with a deeper understanding of and appreciation for a system that, at first glance, seems quiet and simple.
I hope you enjoy the issue.
The Power of Observation
An
A H
ou
seAl
“We cannot create observers by saying ‘observe,’ but by giving them the power and the means for this observation, and these means are procured through education of the senses.”
—Maria Montessori, Italian physician and educator

F e at u r e s
7 MammothHotsprings:WhereChangeisConstantA Student-Teacher-Scientist Partnership was established in 2008 to connect students and researchers, increase observations, and expand the Expedition: Yellowstone! program.Ana K. Houseal, Bruce W. Fouke, Robert Sanford, Robert Fuhrmann, and Ellen Petrick
15 MappingChangeatMammothHotspringsFew maps show the locations of flowing thermal water over time in Mammoth Hot Springs. The goal of this project was to create a series of maps showing the dynamic nature of the Mammoth hydrothermal system. Brett B. Carr, Cheryl Jaworowski, and Henry P. Heasler
23 Yellowstone’sthermophilesExtreme thermophiles thrive in the harsh environments of Yellowstone National Park and have a high degree of evolutionary diversity.Dennis W. Grogan
D e pa rt M e n t s
2 news¬esOld Faithful Visitor Education Center Opens • Superintendent Lewis Retires • 10th Biennial Scientific Conference Summary
5 shortsBiotransformation of Arsenic by a Yellowstone Alga • Remote Measurements of River Channel Depth
Mammoth Hot springs, one of the most rapidly and dramatically changing sites in Yellowstone national Park, April 20, 2009. sTaRRs photo point 9.
Yellowstone Science is published periodically. support for Yellowstone Science is provided
by the Yellowstone Association, a nonprofit educational organization dedicated to serving the park and its visitors. For more information about the association, including membership, or to donate to the production of Yellowstone Science, visit www.yellowstoneassociation.org or write: Yellowstone Association, Po Box 117,
Yellowstone national Park, WY 82190. The opinions expressed in Yellowstone Science are
the authors’ and may not reflect either national Park service policy or the views of
the Yellowstone Center for Resources. Copyright © 2010, Yellowstone Association
for natural science, History & education. For back issues of Yellowstone Science, please see
www.greateryellowstonescience.org/ys.
submissions are welcome from all investigators conducting formal research in the Yellowstone
area. To submit proposals for articles, to subscribe, or to send a letter to the editor,
please write to the following address: editor, Yellowstone Science, Po Box 168, Yellowstone national Park, WY 82190.
You may also email: [email protected].
Yellowstone Science is printed on recycled paper with a soy-based ink.
a periodical devoted to natural and cultural resources
Tami Blackfordeditor
Graphic Designer
Mary Ann FrankeAssociate editor
Janine WallerAssistant editor
Emily YostAssistant editor
Artcraft Printers, Inc.Bozeman, Montana
Printer
Cover photo:Canary spring at Mammoth Hot springs: top July 18, 2008, bottom
May 3, 2009. Courtesy Ana Houseal.
volume 18 • issue 3 • November 2010

Old Faithful Visitor Education Center Opens
On August 25, 2010, a dedication ceremony and grand opening was held at the new Visitor Education Center at Old Faithful in Yellowstone National Park. It was hosted by Yellowstone Superintendent Suzanne Lewis, and au-thor and former Yellowstone historian Paul Schullery gave the keynote ad-dress. Assistant Secretary of the Interior for Fish, Wildlife and Parks Tom Strickland, director of the National Park Service Jon Jarvis, and chairman of the Yellowstone Park Foundation Bannus Hudson also offered remarks.
The event opened with music from the Wyoming National Guard’s 67th Army Band and presentation of the colors by the Yellowstone National Park Mounted Color Guard. At the end of the ceremony the building opened to the public, offering visi-tors access to the interactive exhibits, including a working model geyser.
The building was designed to set new standards for accessibility and for the interpretation of complex scientific information to the public. It is one of the first National Park Service visitor centers to achieve Gold LEED certification from the US Green Building Council in recog-nition of its sustainable construc-tion and operational standards.
Of the $27 million design and construction cost of the new building, $15 million was provided by the non-profit Yellowstone Park Foundation, the official fundraising partner of Yellowstone National Park. More than 400 individuals, foundations, and corporations made contributions to the Yellowstone Park Foundation for the project. These contributions ranged from $2.00 to $3 million.
Superintendent Suzanne Lewis Retires
After nearly 32 years in the National Park Service, Yellowstone Superintendent Suzanne Lewis retired on October 22, 2010. As superintendent since February 10, 2002, she managed more than 2.2 million acres, a staff of 800, and an annual base budget of more than $36 million.
She began her National Park Service career as a seasonal park ranger in 1978 at Gulf Islands National Seashore. During her 11-year tenure there, she served in a variety of posi-tions including park technician, park historian, supervisory park ranger, and management assistant to the superin-tendent. Chosen in 1988 for an inter-national assignment to the Republic of Haiti, she assisted the United Nation’s efforts to preserve, protect, and educate Haitians in the preservation of natural and cultural resources. In 1989, Lewis was appointed acting superintendent of Christiansted National Historic Site and Buck Island Reef National Monument. In 1990, she was selected as the first superintendent for the newly created Timucuan Ecological and Historic Preserve. Lewis served as the superintendent for the Chattahoochee River National Recreation Area from 1997 to April 2000. She was superin-tendent at Glacier National Park prior to her Yellowstone appointment.
Lewis earned her BA (magna cum laude) in American History in 1978 from the University of West Florida. During her Senior Executive
Service Candidate Development Program, she completed assign-ments with the Department of Interior Secretary’s Special Assistant for Alaska, the Department of Interior Office of Management and Budget, the Walt Disney World Corporation, Harvard University, and Carnegie Mellon University.
Lewis received numerous awards throughout her National Park Service career, including the Rachel M. Carson Award for Women in Conservation from the National Audubon Society (2010), the Presidential Rank Award for Senior Executives in government (2009), a National Women’s History Month Honoree (2007), the Secretary’s Bronze Executive Leadership Award (2004), the National Park Service Meritorious Service Award (2003), and the National Parks and Conservation Association Park Manager of the Year for Partnerships (1994). She was also awarded the Woman of Distinction Award by the Girl Scout Councils of America in 1997.
The new old Faithful Visitor education Center.
PAu
l sCH
ulleRYNews & Notes
2 Yellowstone Science 18(3) • 2010

Summary of the 10th Biennial Scientific Conference on the Greater Yellowstone Ecosystem
Approximately 200 agency managers, scientists, and university research-ers and students joined together October 11–13, 2010, to participate in the Questioning Greater Yellowstone’s Future: Climate, Land Use, and Invasive Species conference held in Yellowstone National Park, Wyoming, at the Mammoth Hot Springs Hotel. The goal of this conference was to generate discussion on changes in three eco-logical drivers—climate, land use, and invasive species—that could dramati-cally alter Greater Yellowstone’s public and private lands. This conference offered participants an opportunity to help shape this region’s understand-ing of key issues such as how regional climate may change in the near future, ecological changes already attributed to changing climate and land use, impacts of increasing demands on public and private lands, threats by nonnative species, and tools and strate-gies required to address the challenges related to these environmental drivers.
The conference began Monday eve-ning with an opening keynote speech by US Geological Survey (USGS) Director Marcia McNutt. McNutt addressed the USGS’s emphasis on an ecosystem approach to natural science
and the importance of partnerships to ecosystem restoration. She con-cluded, quoting Theodore Roosevelt, “The nation behaves well if it treats the natural resources as assets which it must turn over to the next generation increased, and not impaired, in value.”
On Tuesday morning, a panel discussion was conducted on the Greater Yellowstone Area (GYA) Science Agenda Workshop held in November 2009, which approximately 90 land managers and experts attended (see Yellowstone Science volume 18, issue 2). The panel with Tom Olliff, National Park Service landscape coordinator for the Great Northern Landscape Conservation Cooperative (LCC); Cathy Whitlock, professor at Montana State University; and Yvette Converse, interim coordinator of the Great Northern LCC, discussed the science and strategies identified at the workshop that are intended to drive ecosystem management in the GYA over the next 10–20 years. Converse gave an overview of LCCs and how they may help align conservation pro-grams to work collaboratively towards common landscape goals. The panel-ists noted that research on the impacts of climate change on cultural heritage and social science studies are needed.
More than 45 presentations were given at the conference during concur-rent sessions in addition to the keynote speeches. Session topics included
changes in climate, disease, vegetation, wildlife, and aquatic resources; simula-tion models and technology; trophic cascades; and human adaptations to and alterations of their environment.
Keynote speeches addressed each of the drivers of ecological change in the GYA: climate, land use, and invasive species. Stephen Gray, Wyoming State Climatologist and director of the Wyoming Water Resources Data System, delivered the climate keynote. Gray addressed outcomes of future climate and change in the GYA under different scenarios. He also discussed potential challenges to management and suggested managers maintain and improve monitoring and build capacity for rapid data and information transfer.
Andrew Hansen, professor at Montana State University, gave a keynote on changes in the landscape and land use in the GYA. Hansen dis-cussed what the GYA might look like in the future, and the effects of land use change on biodiversity and other aspects of the ecosystem. He noted that in the past, the wilderness character of the GYA was undesirable to most people and kept the population low. This character is now a major driver of population growth and increased land use intensity. The increased develop-ment and population may eventually
QUESTIONING GREATER YELLOWSTONE’S FUTURE
Climate, Land Use, and Invasive Species
The 10th Biennial Scienti�c Conference on theGreater Yellowstone Ecosystem
G RRRRRRRRRRRRRRREEEEEEEEEEEEEEAAAAAAATTTTERR ELLLLLLLLLLLLOWWWWWWWWWWSTO
th Biennnnnnnnnniiiiiiiiaaaaaaaaaal SSSSSSSccccciiiiiiiieeeeeennnnnti�c CCCCCCCCCCCCCoooooooooooonfffffference Greaterrrrrrrr YYYYYYYYYeeeeeeeellowstone Ecosssssssssyyyyyyyyyystem
superintendent’s International luncheon speaker Göran ericsson.
nPs/JIM
PeAC
o
318(3) • 2010 Yellowstone Science

adversely impact the very character that is driving that growth. Hansen concluded that creative approaches are needed to sustain the natural amenity-based ecosystem coupled with the natural human system.
Robert Gresswell of the USGS Northern Rocky Mountain Science Center delivered the invasive spe-cies keynote. He focused on the Yellowstone cutthroat trout popula-tions in Yellowstone Lake and their significant decline under the illegal introduction of invasive lake trout. Gresswell presented the recommenda-tions of a panel of scientists assembled in 2008 to review Yellowstone National Park’s lake trout removal efforts. He stressed that the issue of cutthroat preservation and restoration should be a top priority for area managers. The panel’s recommendations were to sig-nificantly intensify lake trout removal efforts and invest additional resources in more precise monitoring of lake trout density and spawning behavior.
On Tuesday night, retired National Park Service and USGS biolo-gist Mary Meagher delivered the A. Starker Leopold Lecture, chroni-cling Yellowstone’s range history from management to ecology. Her narrative began in the mid-19th century, before Yellowstone National Park’s inception and continued through the beginning of the era of “natural regulation” in the later part of the 20th century. She discussed the many ways that manag-ers and citizens have conceived of wildlife in the Greater Yellowstone area throughout that time and the complex
relationships we have had to the wild-life and habitat under our protection.
Professor Göran Ericsson of the Swedish University of Agricultural Science presented the Superintendent’s International Lecture on Tuesday afternoon. Ericsson discussed his re-search on the long coexistence between moose and humans under varying climatic conditions. Moose have adapted to changing climate for more than 6,000 years in Arctic Sweden.
The Aubrey L. Haines Lecture was delivered by Judith Meyer of Missouri State University. Meyer tied historical analysis to scientific analysis, using Yellowstone to dem-onstrate the connection. She noted, “If Yellowstone’s historical record can shed light on the current situation [of science and management], one ray of hope shining from the past might be that Yellowstone has a capacity for infecting its public with a curiosity for science and scientific endeavors, a love and respect for tradition, and
with a sense of social responsibility to protect and preserve this place.”
Numerous sponsors and part-ners contributed to the Questioning Greater Yellowstone’s Future conference: USGS, Northern Rocky Mountain Science Center; US Fish and Wildlife Service; Montana State University; Yellowstone Association; University of Wyoming Ruckelshaus Institute; Rocky Mountains Cooperative Ecosystem Studies Unit; University of Wyoming-National Park Service Research Center; Greater Yellowstone Coordinating Committee: National Park Service (Grand Teton National Park, John D. Rockefeller, Jr. Memorial Parkway, Yellowstone National Park), US Fish and Wildlife Service (National Elk Refuge, Red Rock Lakes National Wildlife Refuge), US Forest Service (Beaverhead-Deerlodge National Forest, Bridger-Teton National Forest, Caribou-Targhee National Forest, Custer National Forest, Gallatin National Forest, Shoshone National Forest); Canon U.S.A., Inc.; Yellowstone Park Foundation; and Greater Yellowstone Science Learning Center. It was planned and orga-nized by the Science Communication Office of the Yellowstone Center for Resources, Yellowstone National Park, with other YCR staff, and a pro-gram committee of non-Yellowstone federal agency staff and independent scholars. The proceedings should be available at the end of 2011.
YS
More than 45 papers were presented and 25 posters were displayed.
There were approximately 200 participants at the conference.
nPs
nPs
4 Yellowstone Science 18(3) • 20104 Yellowstone Science 18(3) • 2010

nPs/H
FC C
oM
MIssIo
neD
ART
Co
lleCT
Ion
, ART
IsT G
Il Co
Hen
two different arsenic detoxification strategies. First, it actively transforms arsenite (the most toxic form of arsenic) to arsenate (a less toxic form) through oxidation. This is similar to what occurs with iron when it forms rust as a result of the addition of oxygen molecules (oxidation) to the iron atoms. Second, the algae modify arsenite by transforming arsenic with hydroxyl groups [As(OH)3] to arse-nic with methyl groups [As(CH3)3]. Arsenic with methyl groups is highly volatile and excreted by the alga as a gas, which detoxifies the arsenic. The researchers also cloned the genes from the alga that produce the enzyme re-sponsible for the detoxification in order to study the purified enzyme. This led to a breakthrough in the understand-ing of how the enzyme catalyzes the process of detoxification. Ultimately, this study provides a new view of how these algae function in their environ-ment far beyond photosynthesis, and demonstrates their importance to biogeochemical cycling in hot springs.
—Tim McDermott and Susan Kelly
Biotransformation of Arsenic by a Yellowstone AlgaQin, J., C.R. lehr, C. Yuan, X.C. le, T.R. McDermott, and B.P. Rosen. 2009. Biotransformation of arsenic by a Yellowstone thermoacidophilic eukaryotic alga. Proceedings of the National Academy of Sciences 06(13):5213–5217.
Arsenic, which has been used commer-cially in very small amounts as a weed killer and insecticide, is a common en-vironmental toxin, ranking first on the Superfund list of hazardous substances. Arsenic concentrations are naturally high in some geothermal environ-ments in Yellowstone National Park, and arsenic biogeochemical cycling has been an area of intense research interest in Yellowstone for years.
Having lived with arsenic for eons, nature has developed interesting ways to handle the toxic compound. For example, some bacteria have evolved mechanisms that detoxify arsenic or, more surprisingly, use it to generate cellular energy. Recently, scientists have gathered evidence that some eukary-otes—organisms (including plants and animals) that have more complex
cellular structure than bacteria—have adaptive mechanisms too. A recent article co-authored by Yellowstone researcher Dr. Tim McDermott shows that biochemical reactions within the eukaryotic alga modify the arsenic to become less toxic, at which point it is excreted from the organism.
In Yellowstone, there is a domi-nant group of algae in the microbial communities of acidic hot springs and heated soils. The green algae mats found in Tantalus Creek running under the boardwalk in Norris Geyser Basin are a good example of this group. These algae are known as Cyanidioschyon, Cyanidium, and Galdieria. They differ from each other in shape and other physiological properties. These algae are different than others in the world in that they thrive in an environ-ment that is very acidic (pH 0.2–3.5) and warm-to-hot (38°C–57°C). No other eukaryotic organism is known to withstand such an environmental extreme, let alone thrive in it. Acidic geothermal environments also contain very high levels of arsenic, and scien-tists are studying how these tiny plants can tolerate the toxin. The results of these studies are valuable to learning how, for example, agricultural plants might be engineered to avoid the accumulation of arsenic from soils.
Using liquid chromatography and mass spectroscopy, which are analyti-cal chemistry techniques that sepa-rate and characterize molecules, the authors found that the Yellowstone alga Cyanidioschyzon sp. uses at least
DIC
k C
AsT
enH
olz
Cyanidia.
enigma type “Galdieria” showing chloroplast in mother and daughter cells.
DIC
k C
AsT
enH
olz
518(3) • 2010 Yellowstone Science
Shorts

Remote Measurements of River Channel Depthlegleiter, C.J., D.A. Roberts, and R.l. lawrence. 2009. spectrally based remote sensing of river bathymetry. Earth Surface Processes and Landforms 34(8): 1039–1059.
The logistical challenges associated with traditional, field-based methods of characterizing channel form and behav-ior have restricted stream studies to short, isolated reaches, limiting our ability to understand the organization of river systems at larger spatial and temporal scales. Remote sensing techniques could facilitate progress in fluvial geo-morphology, stream ecology, and river management by en-abling large-scale, quantitative measurement of various river attributes. This study evaluated the potential for remote measurement of channel depth from optical image data. The researchers used a radiative transfer model to quantify the effects of suspended sediment concentration, variations in bottom reflectance, and water surface roughness; they used ground-based reflectance measurements to assess the accu-racy of spectrally-based depth retrieval under field condi-tions; and they produced depth maps of the Lamar River and Soda Butte Creek from hyperspectral image data con-sisting of many narrow wavelength bands. This approach was shown to be feasible under conditions where the signal recorded by the remote detector is dominated by radiance reflected from the streambed.
They developed a simple algorithm, Optimal Band Ratio Analysis (OBRA), for identifying pairs of wavelengths that yield strong, linear relationships between an image-de-rived quantity and flow depth. OBRA of simulated spectra generated by the radiative transfer model indicated that the optical properties of the water column were accounted for by a shorter wavelength numerator band (blue or green) that was sensitive to scattering by suspended sediment, whereas a longer wavelength band (red or near-infrared) subject to strong absorption by pure water provided depth information.
Field spectra collected along Soda Butte Creek indi-cated that bottom reflectance was fairly homogeneous and that the radiance measured above the water surface was
primarily reflected from the bottom, not the water column. Flow depths at spectral measurement locations averaged 27.6 cm and ranged from 4 to 80 cm. OBRA of these data, 28% of which were collected during a period of high tur-bidity, yielded strong relationships between a spectral band ratio and flow depth, demonstrating that accurate depth re-trieval is possible under field conditions. When applied to hyperspectral image data, this approach resulted in spatially coherent, hydraulically reasonable bathymetric maps, and comparison with a subsequent topographic survey suggested that depth estimates were of realistic magnitude. This study indicates that river bathymetry in Yellowstone National Park and similar environments can be accurately mapped using remote sensing.
However, an important difference between field spectra and image data is spatial resolution, which constrains remote mapping of small streams. Reliable depth estimates can be difficult to obtain in very shallow water and along channel banks where pixels include both terrestrial and aquatic fea-tures; in the study this juxtaposition of features with very different spectral characteristics resulted in negative depth estimates in some areas. These issues are most pronounced when the image pixel size is an appreciable fraction of the wetted channel width.
—Carl LegleiterYS
spectrally-based map of the lamar River channel.
FIGu
Res R
ePRIn
TeD
WIT
H PeR
MIssIo
n o
F TH
e PuBlIsH
eR, Jo
Hn
WIleY
& so
ns, lT
D
Image-derived depth estimates of the lamar River channel compared to data from a later topographic survey.
6 Yellowstone Science 18(3) • 2010

Mammoth Hot SpringsWhere change is constant Ana K. Houseal, Bruce W. Fouke, Robert Sanford, Robert Fuhrmann, and Ellen Petrick
While change is evident in geothermal features throughout Yellowstone, one of the most rapidly and dramatically changing sites in the park is at
Mammoth Hot Springs. Visitors to the springs never see the same scenery twice. Even if you are an infrequent visitor, you may notice that the springs seem different each trip. Perhaps the water has changed course, is flowing in a new location, or has ceased to flow altogether. Maybe you notice that the colors seem different than the last time you stood in that spot. Occasionally, you can no longer access a familiar area due to shifts in the springs and the resulting mineral deposi-tion that sometimes engulfs the boardwalk.
The seeming incongruity between memories of favor-ite springs and their present appearance can be baffling and disorienting. Rangers at the visitor center at Mammoth are
veterans at fielding questions such as: “What happened to the hot springs?,” “Are they drying up?,” or “They sure aren’t what they used to be!” The reply is that change is the only constant. The terraces at Mammoth are a direct product of the springs themselves, comprised of calcium carbonate (CaCO3) mineral deposits called travertine that precipitate directly from the hot water (Bargar 1978). While the springs may look very different over time, the total amount of water flowing into and through the entire Mammoth system is relatively constant (Sorey 1991). Yet this has been a difficult concept for visitors to see and, therefore, believe.
To help resolve this “seeing is believing” issue, an in-tegrative Student-Teacher-Scientist Partnership (STSP) was established in 2008 among Yellowstone National Park rangers, university geoscience and education researchers,
An
A H
ou
seAl
sTaRRs students get their first panoramic view of new Trail and Canary hot springs, the first stop for photo point data collection on each expedition.
718(3) • 2010 Yellowstone Science

Figure 1. Geographic map of hot springs along the upper Terrace loop on the Highland, Angel, and Main terraces at Mammoth Hot springs. Photo point locations are shown. Inset: location of Mammoth Hot springs in Yellowstone national Park.
and a group of 4th to 8th grade teachers and students. The partners work together to answer real-world questions about a phenomenon or problem the scientist is studying (Tinker 1997).
Called STaRRS (Students, Teachers, and Rangers & Research Scientists—Investigating Earth Systems at Mammoth), this STSP was designed to achieve several goals: (1) establish a connection with university researchers so that students in grades 4–8 would develop a deeper understand-ing of research taking place in Yellowstone; (2) have more year-round observations and data coverage at Mammoth for the university research team; and (3) expand the Expedition: Yellowstone! curriculum to include more specific scientific investigations.
The National Park Service established Expedition: Yellowstone! in 1985 as a curriculum-based, multi-day edu-cation program to provide four- and five-day overnight experiences in the park to investigate natural and cultural resources. For more than two decades participants have gath-ered pH and temperature data at Mammoth. In addition to the regular curriculum, STaRRS students made observa-tions and collected data on a few key physical, chemical, and biological parameters at strategic sites along the hot spring drainage systems at Mammoth. These sites, called photo points, provided visual data to help park visitors and scien-tists monitor geothermal change over time.
Use of Mammoth Hot Springs for a scientific and educational partnership
Mammoth Hot Springs has long generated inter-est for visitors because of its renowned terrace-shaped travertine mineral deposits (Bargar 1978). It provides an exceptional combination of natural and logistical attributes for use as a natural teach-ing and research labo-ratory for the STaRRS program.
The effervescent re-lease of carbon dioxide (CO2) from the spring water results in rapid travertine precipitation (5 mm/day or ¼ in/day), which is composed of the calcium carbonate
minerals aragonite and calcite (Fouke et al. 2000; Kandianis et al. 2008). Travertine precipitates in a variety of distinct crystalline shapes and forms that systematically change from upstream to downstream within each drainage flow path (Fouke et al. 2000). Each type of travertine is associated with discrete communities of heat-loving microorganisms (ther-mophilic bacteria and archaea) that grow in communities referred to as microbial mats and exhibit a wide variety of colors and shapes. They grow even more quickly than the remarkably high rate at which the travertine mineralization takes place (Fouke et al. 2003; Fouke in press). Although there are many travertine-depositing hot springs throughout the world, Mammoth is unique because of the long-term protection from human impacts afforded by the National Park Service. Mammoth has the added benefit of year-round access to the Lower and Upper terrace boardwalks, which provide safe access for visitors, students, and professional groups. Furthermore, its proximity to gateway communi-ties make Mammoth an accessible centerpiece for integrated teaching and research.
The geology of Mammoth Hot Springs
The spring water at Mammoth is derived from rain water and snowmelt that flows from the southern margin of the Gallatin Mountain Range into the deep subsurface along as-sociated fault systems. Estimates of how long it takes water to make this hydrologic transit range from less than 2,000 to more than 11,000 years (Rye and Truesdell 2007). During
100 m
Orange Spring Mound
AngelTerrace
ProspectTerrace
MainTerrace
HighlandTerrace
Norris
Mam
mot
h
“New”Trail Spring
N
Narrow Gauge Spring
Gardiner
Mammoth Hot Springs
10 km= road
NorrisGeyser Basin
Canary Spring
8 Yellowstone Science 18(3) • 2010

this travel time, the water flows through and dissolves lime-stone and evaporite rocks that were deposited approximately 350 million years ago during the Mississippian Period (Sorey 1991). The groundwater is heated to more than 100°C (212°F) by rock heated by the underlying Yellowstone hot-spot, which causes it to rise again to the surface through large subsurface fracture systems at Mammoth. During this underground journey, the spring water becomes super satu-rated with dissolved carbonate minerals and CO2 gas. The groundwater emerges from the vents at Mammoth at 73°C (163°F) and a neutral pH of 6. The CO2 immediately de-gasses from the water, causing a rapid increase in the wa-ter’s pH and creating conditions favorable for rapid CaCO3 mineral precipitation (Friedman 1971). This process forms the hallmark travertine terraces at Mammoth. The resident bacteria and archaea populations are an important part of this CaCO3 precipitation process, resulting in the long-term accumulation of thick travertine deposits (Kandianis et al. 2008).
At many locations within the Mammoth complex, as much as one meter of travertine accumulates in a single year (Fouke et al. 2000; Kandianis et al. 2008; Veysey and Goldenfeld 2008). In geologic terms this travertine growth occurs at light speed. On average, this is one million to one billion times faster than limestone deposition in most other geological settings, such as the deep sea floor or in caves. In fact, the only reason that travertine has not cov-ered all of Yellowstone is that the flow paths at Mammoth Hot Springs are small and the drainage systems flow in one place for only a relatively short period before switching to another location. Over time, this has formed a succes-sion of travertine limestone deposits at Mammoth and at Gardiner, Montana. The Gardiner travertine ranges in age from approximately 20,000 to 39,000 years old, while the travertine at Mammoth ranges in age from 0 to nearly 8,000 years before present (Sturchio et al. 1992, 1994; Butler 2008; Vescogni 2009). The travertine terraces at Mammoth are 73 meters thick and cover an area more than 4 square kilo-meters (Allen and Day 1935; White et al. 1975). The terraces at Gardiner, which are now part of a privately-owned quarry, are comparable in size (Sorey 1991).
Systems geobiology research at Mammoth Hot Springs
The systems geobiology research group at the University of Illinois at Urbana-Champaign includes geologists, geochem-ists, microbial ecologists, genomocists, physicists, and edu-cational specialists. Their research at Mammoth focuses on ways in which the environment influences and controls mi-crobial life, and microbial life influences and alters the envi-ronment. Understanding the carbonate rock record and the relationships between the biotic and abiotic components of the hot spring ecosystem can assist in understanding modern and ancient geological landscapes on Earth and potentially other planets. The group’s research is producing models of water-mineral-microbe interactions that predict system-scale dynamics across large dimensions of time and space in a wide variety of natural environments around the world.
The Illinois research group developed a model that can effectively track and predict interactions between water, minerals, and microbes that influence travertine deposition (Fouke et al. 2000, 2003; Fouke in press). From this work, four parameters were identified that control travertine de-position: (1) temperature, (2) pH, (3) flow rate and flow dy-namics, and (4) system composition—contextual observa-tions of travertine (shape and form), microbial mats (color, shape, size, growth rates), and distance along the drainage system from the source. Since the spring is constantly chang-ing, the location within the hot springs where a particular parameter, such as a change in pH, is observed is also associ-ated with changes in travertine formation and microorgan-isms (Veysey et al. 2008).
Fouke et al. (2000) developed a model of the hot springs that aids in understanding these complex systems
orange spring Mound is the site of photo point 5. It was chosen for both ease of access and recent visible activity.
sTAR
Rs PH
oTo
PoIn
T 5
At many locations within the Mammoth complex, as much as one meter of travertine accumulates in a single year.
918(3) • 2010 Yellowstone Science

Pond Facies
Proximal Slope Facies
Vent FaciesApron and Channel Facies
1 m
A
2m
2m
Facies
MineralspH
Vent Apron and Channel Pond Proximal Slope Distal SlopeTemp oC
aragonite aragonite aragonite and calcite aragonite and calcite calcite
73–71 70–60 59–45 44–35 35–286.0 6.1–6.5 6.6–7.2 7.3–7.7 7.8–8.1
Scale
= �owing spring water
B
Figure 2. (A) Field photograph of Angel Terrace spring AT-1 at Mammoth Hot springs (modified from Fouke et al. 2000, 2003; Fouke in press). (B) schematic cross-section of spring AT-1 indicating the basic physical and chemical attributes of the travertine and spring water within each travertine depositional facies (modified from Fouke et al. 2000, 2003; Fouke in press).
by grouping the travertine into packages of mineral deposi-tion along the main spring water flow path (fig. 2). Called “facies,” these groupings of travertine are defined by spe-cific rock characteristics (i.e., crystal size, shape, structure, porosity, and chemistry) that represent the sum total of the physical, chemical, and biological processes active in the hot spring environment (Fouke et al. 2000). The travertine facies model is manifested as distinct packages of CaCO3 deposited along a primary flow path within any given hot
spring system and has been consistently observed around the world (Veysey et al. 2008). This facies model includes five distinct groupings: the vent, apron and channel, pond, proximal slope, and distal slope (fig. 2). Students and teach-ers in the STaRRS partnership used this model to learn about the hot spring systems, develop questions, design and carry out experiments, and develop a deeper understanding of the system.
BRuC
e W. Fo
uk
e
10 Yellowstone Science 18(3) • 2010

The STaRRS partnership
The curriculum development and educational tools chosen for this STSP partnership were based on four dimensions: (1) the existing Expedition Yellowstone! curriculum, (2) the sys-tems being studied by the university research team, (3) the cognitive and social needs of the students, and (4) specific safety issues in regard to conducting research in an area with thermal features. For example, instead of using thermome-ters that required insertion into the spring water, the students used infrared thermometers to take surface temperatures a few meters from the water. Use of tools that can measure from a distance, while not as accurate as probes, enabled the students to monitor springs that might otherwise be unsafe due to very hot water and fragile deposits and to gather data without altering the travertine formations.
The equipment needed to measure the water tempera-ture and pH, travertine shapes, and microbial mat colors and shapes is relatively inexpensive and easy to use by teach-ers and students at a broad range of scientific expertise and grade levels. Use of a limited collection of measurements and the travertine facies model allowed teachers in grades 4–8 and their students to develop a basic operational under-standing of the system.
During the 2008–2009 school year, nine public and private 5th–8th grade school groups participated in three aspects of the STaRRS partnership: (1) they helped to collect photo point images; (2) they obtained specific temperature, pH, atmospheric, and hot spring flow data within a 50 cen-timeters x 50 centimeters (20 in x 20 in) transect at locations in two different hot spring systems; and (3) they developed testable scientific questions and then conducted experiments in the field to test their hypotheses. The students completed analysis and synthesis of their data and observations imme-diately after returning from the field. The on-site experience
culminated in student presentations. Further analysis and more formal presentations were made later to a wide range of audiences in their home communities. The students investi-gated a broad array of topics, such as the effects of humidity and flow rate on water temperature, pH, and microbial com-munities. The resulting list of scientific questions generated by students was remarkably similar to the questions driving ongoing university-level research at Mammoth.
Photo points
Photo points are designated locations where a standard digi-tal camera (Expedition Yellowstone! STaRRS students used the Nikon P60) is used to capture a series of identically framed images over an extended period of time. These care-fully selected sites have specific characteristics and impor-tance for a given scientific field study. After months or years, the sequential images are combined into a time-lapse movie, providing invaluable information about springs, including simultaneous travertine and microbe growth dynamics.
The use of a long-term photographic record (photo-grammetry) had been applied at Mammoth previously. A single location below the vent at Canary Spring in 2004 to 2006 was used in a recent study by the Illinois research group in collaboration with National Park Service rangers (Veysey and Goldenfeld 2008). Over a period of two years, 25 images were taken, aligned, and synthesized into a time-lapse movie that has been used in numerous educational and scientific forums and can be viewed at: http://guava.physics.uiuc.edu/projects/YNP/YNP_virtual_mammoth.html. However, logistics permitted only a limited number of images to be obtained over this two-year period. This re-sulted in irregular time gaps in recording the flow dynamics, microbial growth, and mineral deposition within the spring system. Optimally, this type of photographic record would include more frequent images taken over several years from several locations. This enhanced coverage could be aug-mented with photo point images and observations collected by STaRRS groups. The establishment of simple yet accurate protocols helps ensure that the images taken will be appro-priate for scientific data collection.
An
A H
ou
seAl
A sTaRRs student checks the pH of narrow Gauge Hot spring.
The resulting list of scientific questions generated by students was remarkably similar to the questions driving ongoing university-level research at Mammoth.
1118(3) • 2010 Yellowstone Science

Figure 3. Photo point field photographs taken at narrow Gauge, Mammoth Hot springs, (A) september 16, 2008, and (B) July 20, 2009. note the remarkable 0.3–0.6 meters (approximately 1 to 2 feet) of travertine accumulation that took place over 10 months.
The STaRRS photo points
In July 2008, rangers and Ana Houseal set up eight photo point locations along the boardwalk at Canary Spring, Narrow Gauge Terrace, and Orange Spring Mound (fig. 1). In February 2009, when New Trail Spring (fig. 1) began to show signs of increased flow, two photo points were added along the boardwalk overlooking the spring. The photo point locations were selected so that (1) they were on a boardwalk or approved hiking trail for easy relocation and access, (2) the field of view contained an easily identified object to serve as a scale marker that could be used to align photos and measure changes, and (3) the camera brackets would not detract from visitors’ view of the hot springs. The
locations were also selected with the understanding that the springs are constantly changing, and some initially promis-ing locations of strongly flowing spring water may not pro-duce long-term results while slower flowing spots may end up becoming very active.
Of the eight photo point locations, the most striking example of the dynamic results provided by the photo point approach was the sequence taken at one of the three Narrow Gauge sites (fig. 3). Figures 3 and 4, which were created from photos collected by several different groups of STaRRS students and teachers, demonstrates how quickly travertine can accumulate. Over a 10-month period at Narrow Gauge, the thickness of the travertine increased from approximately 0.3 to 0.6 meters (1 feet to 2 feet; fig. 3).
sTAR
Rs PH
oTo
PoIn
T 7
Narrow GaugeSeptember 16, 2008
Narrow GaugeJuly 20, 2009
A
B
travertine (10 months later)
travertine (10 months later)
travertine
travertine
travertine (initial)
travertine (initial)
0.5 m
0.5 m
12 Yellowstone Science 18(3) • 2010

Figure 4. Photo point field photographs taken at new Trail spring, upper Terrace Boardwalk, Mammoth Hot springs, (A) september 2, 2008, and (B) september 1, 2009. note the travertine accumulation in the foreground and background, demonstrating the changes in flow direction and volume that took place over 12 months.
Benefits of the STaRRS partnership
The STaRRS partnership is now using the photo point image database before and after student expeditions to cre-ate interest, extend thinking, and deepen conceptual under-standing related to the hot spring system. Having students gather images in the field and compare their images to those taken previously has helped reinforce understanding of the types and magnitude of the ecosystem processes active at Mammoth Hot Springs. Benefits for Yellowstone’s Division of Interpretation include the use of photo point images for other school groups and ranger-led talks. Eventually, images may also be used in an interpretive display to help visitors
understand the rapid changes occurring at Mammoth. The photo point images add to the growing collection of hot springs data, ready for use in the development and investiga-tion of new hot-spring geobiology research.
Yet the true potential for student contributions to sci-ence using this model could be far greater, reaching beyond Mammoth and Yellowstone to other environments around the world. The STaRRS contribution has shown that time-series photographs captured by elementary students can be used to generate basic data useful to students and scientists. The tools and skills required to engage in this type of data collection (digital cameras, simple brackets, and computers) are readily available. Students and teachers are eager to find
sTAR
Rs PH
oTo
PoIn
T 2
New Trail SpringSeptember 2, 2008
New Trail SpringSeptember 1, 2009
A
B
travertine
initial
travertine
initial
travertine 12 months later
travertine 12 months later
0.5m
0.5m
1318(3) • 2010 Yellowstone Science

opportunities to engage in meaning-ful, real-world scientific research. The limiting factor need only be the imagi-nation. The STaRRS model developed at Mammoth Hot Springs could easily be applied to other settings and pro-vide insight on topics such as glacial retreat, post-fire plant succession, ero-sional processes, and even rising sea levels. This approach will also work in complex systems where change is constant but challenging to monitor. Schools and children are everywhere and elementary-aged students may be the world’s most underutilized natural resource.
YS
Acknowledgements
This work was supported by a national science Foundation (nsF) Biocomplexity in the environment Program (eAR-0221743) grant award to Fouke and a supplementary nsF Research experience for Teachers Program award. The conclusions of this study are those of the authors and do not necessarily reflect those of the funding or permitting agencies. We are greatly indebted to the input and support of many col-leagues who made this study possible. We thank national Park service rangers Brian
suderman, Trudy Patton, Melanie Condon, Michael Breis, Beth Taylor, Matt ohlen, sabrina Diaz, Christie Hendrix, and Henry Heasler for their tireless work to preserve Yellowstone resources while making them available for educational and scientific programs. We also thank the teachers and their school systems that participated in the sTaRRs partnership. The intensive work and contributions of several members of the Fouke research group at the university of Illinois are also gratefully acknowledged, including the contributions of Amanda oehlert, Holly Vescogni, sam Dwyer, Mike kandianis, Tom schickel, and Roy Johnson.
Ana K. Houseal received her PhD in secondary and continuing education from the university of Illinois at urbana-Cham-paign.The sTaRRs partnership formed the basis for her dissertation research. she has been working with the education and interpretation staff at Yellowstone since 2006. Bruce W. Fouke is a Professor in Geology, Microbiology, and the Institute for Genomic Biology at the university of Illinois at urbana-Champaign. His ongoing geomicrobiology research is to determine how the activity of specific living microbes or microbial communities influence the precipitation of common carbonate mineral deposits. Robert Sanford, PhD, is an environmental microbiologist and Re-search Associate Professor at the univer-sity of Illinois at urbana-Champaign De-partment of Geology. Robert Fuhrmann has been Yellowstone’s education Program Manager in the Division of Interpretation since 1998. Ellen Petrick is a former education specialist at Yellowstone. she is currently the education specialist at Cure-canti national Recreation Area and Black Canyon of the Gunnison national Park.
ReferencesAllen, e.T., and A.l. Day. 1935. Hot springs of the
Yellowstone National Park. Carnegie Institution of Washington. Publication no. 466, 525 p.
Bargar, k.e. 1978. Geology and thermal history of Mammoth Hot springs, Yellowstone na-tional Park, Wyoming. u.s. Geological survey Bulletin 1444, 54 p.
Butler, s.k. 2007. A facies-controlled model of Pleistocene travertine deposition and glaciation in the northern Yellowstone region. university of Illinois urbana-Champaign, urbana, Illinois, 77 pp.
Fouke, B.W. (in press). Hot-spring systems geobiology: Abiotic and biotic influences on travertine formation at Mammoth Hot springs, Yellowstone national Park, usA. Sedimentology.
Fouke, B.W., G.T. Bonheyo, e. sanzenbacher, and J. Frias-lopez. 2003. Partitioning of bacterial communities between travertine depositional facies at Mammoth Hot springs, Yellowstone national Park, usA. Canadian Journal of Earth Sciences 40:1531–1548.
Fouke, B.W., J.D. Farmer, D.J. Des Marias, l. Pratt, n.C. sturchio, P.C. Burns, M.k. Discipulo. 2000. Depositional facies and aqueous-solid geochemistry of travertine-depositing hot springs (Angel Terrace, Mammoth Hot springs, Yellowstone national Park, u.s.A.). Journal of Sedimentary Research 70(3):565–585.
kandianis, M.T., B.W. Fouke, R.W. Johnson, J. Vesey, W.P. Inskeep. 2008. Microbial biomass: A catalyst for CaCo3 precipitation in advec-tion-dominated transport regimes. Geological Society of America Bulletin 120(3/4):442–450.
Rye, R.o., and A.H. Truesdell. 2007. The ques-tion of recharge to the deep thermal reser-voir underlying the geysers and hot springs of Yellowstone national Park. In Integrated Geo-science Studies in the Greater Yellowstone Area: Volcanic, Tectonic, and Hydrothermal Processes in the Yellowstone Ecosystem. l.A. Morgan, ed., 235–270. u.s. Geological survey.
sorey, M.l. 1991. Effects of potential geothermal development in the Corwin Springs Known Geothermal Resources Area, Montana, on the thermal features of Yellowstone National Park. Water Resources Investigation Report 91-4052. Menlo Park, CA: u.s. Geological survey, 210 p.
sturchio, n.C., k.l. Pierce, M.T. Murrell, and M.l. sorey. 1994. uranium series aging of travertine and timing of the last glaciation in the northern Yellowstone area, Wyoming-Montana. Quaternary Research 41:265–277.
Tinker, R.F. 1997. student scientist partnerships: shrewd maneuvers. Journal of Science Educa-tion and Technology 6:111–117.
Vescogni, H.s. 2009. Microbial biomarkers: Min-eralogy, crystal fabric and chemistry of calcium carbonate mineralization. university of Illinois urbana-Champaign, urbana, Illinois, 64 pp.
Veysey, J., B.W. Fouke, M.T. kandianis, T.J. schickel, R.W. Johnson, and n. Goldenfeld. 2008. Reconstruction of water temperature, pH, and flux of ancient hot springs from travertine depositional facies. Journal of Sedi-mentary Research 78:69–76.
Veysey, J. and n. Goldenfeld. 2008. Watching rocks grow. Nature Physics: 4(4):1–4; 1–5.
White, D.e., R.o. Fournier, l.P.J. Muffler, A.H. Truesdell. 1975. Physical results of research drilling in thermal areas of Yellowstone National Park, Wyoming. Professional Paper 892. u.s. Geological survey.
TesA
sIRon
en
A sTaRRs student checks the temperature in the distal slope near orange spring Mound.
An
A H
ou
seAl
14 Yellowstone Science 18(3) • 201014 Yellowstone Science 18(3) • 2010

Early explorers, park personnel, and visitors have observed changes on the terraces of Mammoth Hot Springs for the past 130 years. Mammoth Hot
Springs is a dynamic hydrothermal system where the pres-ence of flowing thermal water at specific vents is seldom con-stant. Springs can form or dry up in a matter of days, switch between periods of activity and inactivity multiple times in a given year, or remain active for years in the same general location, dry up, and then reinitiate.
Since the first explorations of Yellowstone National Park, scientists have asked the same question about the fluc-tuations in water flow at Mammoth Hot Springs that many visitors ask today: “Are the springs drying up?” From 1928 to 1932, researchers Eugene Thomas Allen and Arthur Lewis
Day studied the outflow of thermal water and documented a decline. Like park visitors, they wondered whether a prevail-ing drought had any effect upon the thermal water flowing on the Mammoth terraces. They summarized their investi-gation in 1935 saying: “It has been concluded by observers of the US Geological Survey, that spring water when it ceases to flow at any point in this area, as it not infrequently does, reappears in equal amount at some other point, so that the aggregate discharge remains constant.” Studies by Bargar (1978) and Sorey (1991) argue for “continual change in the location and flow rate of individual vents.”
Previous studies of Mammoth Hot Springs show that thermal water discharge can vary seasonally (Sorey 1991; Freidman and Norton 2007; Allen and Day 1935). The
It’s Not Drying Up, Just ChangingMapping Change at Mammoth Hot Springs Using Aerial Photographs and Visual ObservationsBrett B. Carr, Cheryl Jaworowski, and Henry P. Heasler
Helicopter oblique photographs of Canary, Main and Trail springs in August 2009 (A) showing new hydrothermal activity along the southern edge of the Main Terrace and (B) a similar area in July 2010. notice that the vent locations are the same, but the boundaries of the flowing hydrothermal water and area covered by the colorful microbial mats have changed.
A
B
1518(3) • 2010 Yellowstone Science

studies attribute the variability to the hydraulic pressure ex-erted on the hydrothermal systems by the volume of water entering the system at the surface. When the volume is high during the spring and early summer, greater pressure is ex-erted and more thermal water is discharged at the outlet of the system. The thermal water flowing on the terraces ac-counts for approximately 10% of the total discharge of the Mammoth hydrothermal system (Sorey 1991). Most of the remaining hydrothermal water discharges at Boiling River. Therefore, the thermal water discharge at Boiling River is one indicator of the total discharge of thermal water in the Mammoth hydrothermal system.
Despite the wealth of observations since 1871, when the Hayden survey described Mammoth Hot Springs, there are few maps showing the locations of flowing thermal water over time. Our goal was to create a series of maps or “snap-shots in time” that show flowing hydrothermal water and the dynamic nature of the Mammoth hydrothermal system.
Study area
Located outside the 640,000-year-old Yellowstone caldera, Mammoth Hot Springs formed in the northern part of Yellowstone National Park, five miles south of Gardiner, Montana (fig. 1). The Mammoth hydrothermal system forms terraces composed of travertine (a sedimentary rock made of calcium carbonate) from the Upper Terrace Drive (Pinyon Terrace) to the Gardner River. The historic Fort Yellowstone, park headquarters, Mammoth Hotel, Mammoth camp-ground, and other buildings in Mammoth Hot Springs were built on the travertine terraces.
Geology
Examination of Yellowstone’s bedrock map helps place the Mammoth hydrothermal system in a parkwide, geologic context (USGS 1972). The Mammoth hydrothermal sys-tem is one of the few hydrothermal areas in Yellowstone National Park that has carbonate-rich hot spring deposits. Glacial sediments overlie travertine and the travertine over-lies sedimentary and volcanic rocks. During the last 2.1 million years, the Yellowstone volcano has covered parts of the region with tuffs (a volcanic rock made of glass, pum-ice, and small rocks) and basaltic lava flows (Christiansen 2001). Fifty million years ago, the Absaroka volcanism af-fected the Mammoth area; today Sepulcher Mountain and Bunsen Peak are reminders of that volcanic past. Outcrops of sedimentary rocks, 550-million- to 100-million-year-old limestones, sandstones, siltstones, and shales are reminders of a geologic past dominated by shallow seas. The limestones are crucial to the formation of the Mammoth terraces as the rock supplies the carbonate necessary for building them.
The Norris–Mammoth corridor, a zone of faults trend-ing generally north–south, stretches from the edge of the 640,000-year-old Yellowstone caldera to Mammoth Hot Springs (Pierce 1991). The faults in this region may allow groundwater near Norris to reach a depth where it is heated and provide a potential path for the heated water to reach Mammoth (Sorey 1991). The other potential source of the Mammoth hydrothermal water is localized deep circulation of water from the Gallatin Mountains interacting with a pos-sible local heat source beneath Mammoth (Kharaka 1991).
Methods
Bargar’s 1978 geologic map of Mammoth Hot Springs pro-vided the basis for mapping areas covered by thermal water. In total, we created 11 maps showing flowing thermal water from 1954 to 2010 (table 1), including nine maps (1954–2006) generated from historical aerial photographs. For 2009 and 2010, we sketched visual observations of flowing thermal water on Bargar’s geologic map and used air-oblique photography from 2009 and 2010 to confirm and edit the sketched field maps. We converted the mapped areas show-ing thermal water into polygons using ArcGIS software.
The three types of aerial photographs, black and white (B&W), color infrared (CIR), and true color, generated dif-ferent quality maps (table 1). On a CIR aerial photograph (fig. 2), vegetation shows up as a bright red color. Healthy vegetation emits near-infrared radiation, which is not vis-ible to the human eye. A true-color image shows the land-scape as a human would see it. Some aerial photographs (1969, 1994, 2001, and 2006) were georectified. The pro-cess of georectification, or tying airborne images to known places on the ground, makes it easier to work with multiple
Figure 1. Map showing the location of Mammoth Hot springs relative to the Yellowstone caldera.
Mammoth Hot Springs
Yellowstone Caldera
16 Yellowstone Science 18(3) • 2010

aerial photographs in geographic information (ArcGIS) and image processing software (ENVI). The US Department of Agriculture Aerial Photo Field Office in Salt Lake City, Utah (www.apfo.usda.gov), has an aerial photography ar-chive where many of the photographs used in this project are stored for public use.
Overexposure of the bright white travertine presents a challenge during image processing (fig. 2). The first step in making hydrothermal water areas more visible was to im-prove the image contrast and easily distinguish vegetation from the highly reflective travertine. Once the image con-trast was improved, we applied ENVI’s automated feature extraction wizard (ITT Visual Information Services 2008) to each of the aerial photographs. Feature extraction uses spatial, spectral, and textural characteristics of an image to define areas sharing similar characteristics. We were able to optimize parameters and consistently identify the areas of flowing thermal water on the terraces. These areas were imported into ArcGIS and visually grouped into a set of larger areas, thus representing the thermal water from dif-ferent vents or sets of vents on the terraces. Finally, we cal-culated the total area with flowing thermal water for each photograph.
Five photographs used in this study were not georecti-fied: two digital photos downloaded from the National Park Service (NPS) Technical Information Center (ETIC) in Denver and three hard copies from the Yellowstone Spatial Analysis Center and Heritage and Research Center (HRC) in Gardiner, Montana. To create digital files, we scanned the hard-copy photographs at 1,200 dots per inch. We used Adobe Photoshop to increase the contrast between areas of flowing thermal water and other areas, and the georefer-encing tools in ArcGIS to roughly align each photograph
to a 2006 orthorectified, National Agriculture Imagery program (NAIP) true-color image. Then we used the ArcGIS edi-tor tools to manually draw polygons around the areas on the terraces covered by thermal water. Finally, we calculated the total area of the polygons for each photograph (table 1).
We also used histori-cal observations by NPS North District interpre-tive rangers from 1871 to the present. These obser-vations confirmed where thermal water was present in the aerial photographs.
No thermal water polygons were drawn without supporting visual evidence from the aerial photographs. Historical ob-servations were not used for years in which feature extraction could be used to create the polygons on the aerial photo-graphs (1969, 1994, 2001, and 2006).
Figure 2. Color infrared aerial photograph of the Mammoth terraces, August, 25, 2001. Around the buildings, the grass appears bright red (top right). overexposure makes accurate identification of flowing hydrothermal water on the terraces difficult.
Year Day Type Source Polygon Method Area (m2)
1954 sep 14 B&W HRC scan and draw 8,500
1964 sep 12 B&W eTIC scan and draw 28,200
1969 sep 7 Color HRC Feature extraction 30,300
1976 sep 8 Color eTIC scan and draw 21,800
1988 oct 6 CIR HRC scan and draw 31,500
1994 sep 3 B&W usDA Feature extraction 15,800
1998 Aug 5 CIR HRC scan and draw 17,900
2001 Aug 25 CIR sanborn Feature extraction 14,300
2006 Aug 14 Color nAIP Feature extraction 20,000
2009 Aug 26 Field map Authors Map and draw 32,900
2010 Jun 21 Field map Authors Map and draw 21,400
Table 1. Date, type, source, and method for obtaining the thermal water polygons and thermal water area for each of the nine aerial photographs and two field maps used in this study.
1718(3) • 2010 Yellowstone Science

Results
We created 11 maps showing flowing thermal water at the Mammoth Hot Springs terraces from 1954 to 2010 (figs. 3A–I). Only the regions covered by flowing thermal water on aerial photographs or visually observed are shown on the maps. Historical observations by NPS interpretive rangers (NPS 2009) may record activity, flowing thermal water, or inactivity where steam may be present.
Several general observations can be made about figures 3A–3I. The area near Palette Spring shows flowing thermal water on 9 of the maps and Canary Spring shows flowing thermal water on 10 of the maps. Considering the entire span of 56 years, most of Mound, Jupiter, and Palette ter-races were active at some point between 1954 and 2010. Flowing thermal water from active springs is also present in the vicinity of the Upper Terrace Drive between 1954 and 2010, but difficult to map using aerial photographs.
Decadal variability
According to observations by North District interpretive rangers, thermal water flowed somewhere on Mound Terrace from 1904 through 1963 and has been inactive since 1989. Mound Terrace shows eastward flowing thermal water on the 1964, 1969, 1976, and 1988 aerial photographs (figs. 3B, C, and D) whereas the 1994, 1998, 2001, and 2006 aerial pho-tographs (figs. 3E, F, and G) show no colorful, thermal water flowing east. Colorful hydrothermal water began flowing from the north side of Mound Terrace in November 2007 and continues at present. The 2009 and 2010 maps (figs. 3H and I), generated by visual mapping along the boardwalks, show this north-flowing hydrothermal water.
New Palette Spring shows flowing thermal water on the 1964, 1969 (fig. 3B), and 1976 (fig. 3C) aerial photographs, but none on the 1988 (fig. 3D) and 1994 (fig. 3E) aerial photographs, water is shown again on the 1998 aerial photo-graphs. Visual mapping showed flowing thermal water dur-ing the summers of 2009 and 2010 (figs. 3H and I).
From 1954 until 1998, visitors and North District inter-pretive rangers observed flowing thermal water at Minerva Spring . The maps show Minerva Spring flowing in 1954 (fig. 3A), 1969 (fig. 3B), 1976 (fig. 3C), and 2001 (fig. 3F) and not flowing in 1964, 1988 (fig. 3D), and 1994 (fig. 3E). It is interesting to note that clear, hydrothermal water flow-ing on white and highly reflective travertine would not be visible or mapped on aerial photographs.
Hydrothermal springs along the Upper Terrace Drive are more dispersed and smaller than the thermal springs on the lower Mammoth terraces. Narrow Gage Spring, Orange Spring Mound, Highland Spring, and Angel Terrace show the most consistent hydrothermal activity over time.
Figure 3 (A–I). Map of Mammoth Hot springs showing the areas covered by hydrothermal water in (above in 1954). The gray area is the approximate boundary of the terraces based on observations of travertine, topography, and vegetation.
A
B
18 Yellowstone Science 18(3) • 2010

C
D
E
F
1918(3) • 2010 Yellowstone Science

Annual variability
The 2009 and 2010 maps (figs. 3H and I) show the changes in flowing thermal water from year to year. The thermal ac-tivity at Canary, Palette, New Palette, and Jupiter springs seems relatively constant, but the thermal water flowing out of the vents varies in both direction and extent. Cleopatra Spring is the most similar between the two years, and Angel Terrace (not shown) was the most variable, with two new vents initiating in the past year.
Weekly and daily variability
Canary Spring provides an example of weekly variability in vents and the effect upon mapping flowing hydrother-mal water. On the morning of September 11, 2006, Canary Spring stopped flowing thermal water. The following day, some thermal water began flowing from Canary’s vent. During the next four days, flowing thermal water began to cover the colorful red-brown- and green-colored microbial mats. Aerial photographs and derived maps would show very different hydrothermal activity depending upon the day of the flight.
G I
H
20 Yellowstone Science 18(3) • 2010

Discussion
The various sources of aerial photographs (table 1) make consistency in the mapping of thermal water areas dif-ficult. Areas with thermal water flow look very different on CIR, B&W, and true color aerial photographs. North District interpretive rangers observed flowing thermal water at Minerva Spring in 1964, 1988, and 1994. In contrast, our maps based on aerial photographs do not show flow-ing thermal water. On color aerial photographs, the presence of colorful microbial mats aids mapping of flowing thermal water and thermal pools. The area of flowing thermal water is easiest to pick out on the true-color, aerial photographs from 1969, 1976, and 2006, making them the most accurate maps. On the 2001 CIR aerial photograph, we identified an area appearing to be thermal water at Minerva Spring when the interpretive rangers reported no activity. However, when interpretive rangers use the term “no activity,” steam and mi-crobial activity may be present at a vent. The shades of gray
in a B&W aerial photograph (1954, 1964, and 1994) make it difficult to distinguish between areas of flowing thermal water, shadows, or grasses on the terraces. Areas with clear or microbe-poor thermal water are almost indistinguishable from dry areas covered by young, white travertine. Further work is necessary to account for the discrepancies between human observations and the aerial photographs.
The ENVI feature extraction wizard provides a consis-tent application of parameters but does not eliminate bias in our maps. The extracted areas undergo subjective human analysis as contiguous areas of flowing thermal waters are mapped. Thus, human interpretation affects these estimates of flowing thermal water as the computer-generated areas are grouped visually.
The white-colored and highly reflective travertine ter-races also affect the quality of the images. Most of the aerial photographs cover a wide area and include travertine, build-ings, asphalt roads, and vegetation. This diverse landscape results in overexposure of the travertine terraces. For exam-ple, while North District Interpretation records indicate a large active area near Canary Spring in 2001, our 2001 map shows only a small area of flowing thermal water associated with the Canary Spring vent (fig. 3F). The overexposure on the 2001 CIR aerial photograph may underestimate the area covered by flowing thermal water at Canary Spring. In gen-eral, travertine terraces are less overexposed on the true-color images than the CIR or B&W images.
We place the most confidence on the area of flowing thermal water estimated for the 1969 (fig. 3B) and 2006 (fig. 3G) maps because both are true-color aerial photographs (green circles, fig. 4). Figure 4 shows the range of values from approximately 8,500 square meters to 33,000 square meters (91,300 ft2 to 354,380 ft2). It is interesting that our estimates of flowing thermal water for summer 2009 and 2010 (33,000 and 21,400 m2) show a similar range of thermal water area (33,000 to 20,000 m2) for 1969 and 2006. The 2009 and 2010 visual mapping from the boardwalks provides addi-tional confidence in our area estimates derived from ENVI’s automated feature extraction routine. For a visitor who saw the terraces in 1969 (figs. 3B and 4) and again in 1976 (figs. 3C and 4), it may appear that the terraces are drying up. In actuality, the visitor more likely witnessed the natural vari-ability of flowing thermal water on the Mammoth terraces.
One assessment of the dynamic Mammoth hydrother-mal system involves a comparison of the area covered by flowing thermal water (fig. 4) and the mean annual discharge of the nearby rivers. We know that the thermal water on the Mammoth terraces accounts for only 10% of the discharge from the Mammoth hydrothermal system (Sorey 1991) and that Boiling River is the primary source of thermal water discharge. Data collection began in 1989 for the Boiling River discharge (missing data from 1995 to 2002) and for the Gardner River in 1939 (missing from 1972 to 1984; see
Figure 4. The thermal water area on the Mammoth terraces (top) is shown with the mean annual discharge for the Boiling and Gardner rivers (bottom). Discharge is displayed in cubic feet per second (cf/s). Thermal water area values are grouped in three ways: from field observations (circles), those believed to be the most accurate (triangles), and from historical aerial photos (diamonds).
0
5,000
10,000
15,000
20,000
25,000
30,000
35,000
1950 1960 1970 1980 1990 2000 2010
The
rmal
Wat
er A
rea
(m2 )
Year
Mammoth Hot Springs
0
5
10
15
20
25
30
35
1950 1960 1970 1980 1990 2000 2010
Gar
dner
Riv
er D
isch
arge
(x10
cf/s
)B
oilin
g R
iver
Dis
char
ge (c
f/s)
Year
River Discharge Gardner (x10) Boiling
Other PhotographsMost AccurateField Map
2118(3) • 2010 Yellowstone Science

http://water.usgs.gov). Although data gaps make detection of trends diffi-cult, there is no consistent increasing or decreasing trend in the total area covered by flowing thermal water on the Mammoth terraces. Nor is there any correlation between areas of flow-ing thermal water and the discharge of the Boiling or the Gardner rivers. Thus, the relatively constant discharge of Boiling River since 1987 (within 10% of the average) implies that there has been a relatively constant outflow of thermal water from the Mammoth hydrothermal system (fig. 4).
Summary
The maps in this article show the dy-namic Mammoth hydrothermal sys-tem and the changes in flowing ther-mal water from year to year. Because thermal discharge can also change monthly, weekly, or daily, these maps do not capture all the variability of the system. Additionally, we pro-duced initial estimates of the area cov-ered by flowing thermal water on the Mammoth terraces. Comparison of the thermal water area to Boiling River discharge indicates a generally constant outflow of thermal water from the en-tire hydrothermal system. Changes in flowing thermal water on the terraces and errors in estimating the flowing thermal water cause variations in the area estimates. We found no evidence to suggest that the volume of thermal water or level of activity changed sig-nificantly during the 56 years of visual record. The appearance of the terraces, with their changing patterns of flow-ing thermal water, varies much more than the actual flow of water. We also applied a simple method for visually mapping the terraces that can be per-formed every year or multiple times a year. This mapping method can supplement aerial photography and
easily document the changes at the Mammoth hydrothermal system.
YS
Acknowledgements
This project began in the summer of 2009 as part of the Geological society of America’s GeoCorps America Program. The geologists-in-the-park program is a collaborative partnership between the national Park service Geologic Resources Division, the Yellowstone national Park geology program, and the Geological society of America. During summer 2010, the student Temporary employment Program made it possible to continue this work. Brian suderman, supervisory Park Ranger with the Division of Interpretation, provided access to the historical observa-tions by his interpretive staff, and Colleen Curry, supervisory Museum Curator at the Heritage and Research Center, retrieved some aerial photographs. In addition, Brian suderman and Jennifer Conrad, supervisory Park Ranger with the Division of Interpreta-tion, contributed information about ongoing changes at Mammoth Hot springs. In 2009, kevin sattler, hydrologist at the usGs Mon-tana Water science Center kindly shared his hydrologic knowledge. My supervisors at the Yellowstone Center For Resources, Hank Heasler and Cheryl Jaworowski, provided guidance and support. I also thank my fellow 2009 GeoCorps participants, Chelsea Feeney and Tim Moloney, and 2010 GeoCorps participant lindsey Harriman for helpful suggestions and ArcGIs expertise.
Brett B. Carr is a doctoral student at Arizona state university. He received a Bachelor of Arts degree in earth sciences from Dartmouth College in 2007 and a Master of science degree in geophysics from university of Wisconsin in 2008.
Cheryl Jaworowski is a geologist at Yel-lowstone national Park. she received her doctorate in geology from the university of Wyoming and specializes in Quaternary geology and applying remote sensing to geologic mapping. Hank Heasler is the park geologist at Yellowstone national Park, specializing in geothermal systems.
ReferencesAllen, e.T., and A.l. Day. 1935. Hot springs of
the Yellowstone national Park. Carnegie Institution of Washington Publication 466, 525 p.
Bargar, k.e. 1978. Geology and thermal history of Mammoth Hot springs, Yellowstone na-tional Park, Wyoming. u.s. Geological survey Bulletin 1444, 55 p.
Christiansen, R.l. 2001. The Quaternary and Pliocene Yellowstone Plateau Volcanic Field of Wyoming, Idaho, and Montana. u.s. Geo-logical survey Professional Paper 729-G.
Friedman, I. and D.R. norton. 2007. Is Yel-lowstone losing its steam? Chloride flux out of Yellowstone national Park. In Integrated Geoscience Studies in the Greater Yellowstone Area: Volcanic, Hydrothermal and Tectonic Processes in the Yellowstone Geoecosystem. l.A. Morgan, ed., 275–297. u.s. Geological survey Professional Paper 1717.
ITT Visual Information services. 2008. enVI Tutorial: Impervious surface Feature extrac-tion, in enVI 4.5 Fx Workshop.
kharaka, Y.k., R.H. Mariner, T.D. Bullen, B.M. kennedy, and n.C. sturchio. 1991. Geo-chemical investigations of hydraulic connec-tions between the Corwin springs known Geothermal Resources Area and adjacent parts of Yellowstone national Park. In Effects of Potential Geothermal Development in the Corwin Springs Known Geothermal Resources Area, Montana, on the Thermal Features of Yellowstone National Park. M.l. sorey, ed. u.s. Geological survey Water-Resources Investi-gations Report 91-4052, p. F1-F37.
national Park service 2009. Hot springs Re-cords. unpublished data.
Pierce, k.l., k.D. Adams, and n.C. sturchio. 1991. Geologic setting of the Corwin springs known Geothermal Resources Area-Mam-moth Hot springs area in and adjacent to Yel-lowstone national Park. In Effects of Potential Geothermal Development in the Corwin Springs Known Geothermal Resources Area, Montana, on the Thermal Features of Yellowstone National Park. M.l. sorey, ed. u.s. Geological survey Water-Resources Investigations Report 91-4052, p C1-C37.
sorey, M.l. 1991. summary and conclusions. In Effects of Potential Geothermal Development in the Corwin Springs Known Geothermal Re-sources Area, Montana, on the Thermal Features of Yellowstone National Park. M.l. sorey, ed. u.s. Geological survey Water-Resources Investigations Report 91-4052, p A1-A17.
We found no evidence to suggest that the volume of thermal water or level of activity changed significantly during the 56 years of visual record.
22 Yellowstone Science 18(3) • 201022 Yellowstone Science 18(3) • 2010

Extremely thermophilic microorganisms in Yellowstone National Park were first documented systematically by Thomas Brock and his students
from about 1965 through 1971. They probed various hydro-thermal environments using some simple but informative techniques, one of which involved immersing clean glass slides in hot springs and examining them microscopically after several days. The slides became coated with a film of diverse microbial cells and micro-colonies, showing that mi-croorganisms in the hot spring were attaching to the surface and possibly reproducing there (Brock 1978). In another method, water samples from hot springs were supplemented with nutrients and incubated at temperatures typical of the original spring (65°C–85°C, or about 150°F–185°F). In sev-eral cases, dense populations of microorganisms developed, which were then re-cultured to yield pure cell lines (also called “clones,” “strains,” or “isolates”). Once a pure culture was established in the laboratory, it was relatively simple to
Yellowstone’s ThermophilesMicrobial Diversity from Harsh Environments
Dennis W. Grogan
Yellowstone national Park harbors a unique microbiota adapted to the chemical compositions and extremely high temperatures of its hydrothermal features. The extreme thermophiles that have been cultured from these environments span a tremendous range of evolutionary diversity, and the history of their analysis illustrates their value for basic research, biotechnology, and informed conservation. Rabbit Creek thermal area.
JAso
n H
ATC
HeR
test the effects of temperature, pH, and other culture condi-tions on the organism’s rate of growth. The results confirmed that the microorganisms recovered from Yellowstone’s hy-drothermal environments did not simply survive the ex-tremely high temperatures found in these environments, but required them.
One of these thermophiles (literally, “heat lovers”) went on to become Yellowstone’s most famous microbe. Thermus aquaticus was officially described in 1969 as a rod-shaped bacterium that requires oxygen and organic nutrients for growth, and grows best at a pH of about 7.7 and tempera-ture of 70°C (Brock and Freeze 1969). As one of the most thermophilic organisms known at the time, T. aquaticus at-tracted attention from specialists interested in enzyme sta-bility and other cellular adaptations to high temperature. In the mid-1980s, however, it was pushed onto center stage when its DNA polymerase became the key component in a technique for amplifying small intervals of DNA in a test
2318(3) • 2010 Yellowstone Science

tube. The new technique, called “polymerase chain reaction” (PCR), became valuable to molecular biologists and anyone else interested in detecting, analyzing, or recovering DNA sequences with great sensitivity. Patents issued to Cetus Corporation and later sold to Hoffman-LaRoche covered the thermostable polymerase and the PCR process (Gelfand et al. 1989), and the popularity of the technique generated huge profits.
Although the material critical to this invention was a microorganism discovered in a national park by academic researchers, neither the US government nor the researchers were entitled to royalty-free use of the technology or a share of the income. The legal situation prompted the National Park Service (NPS) and Yellowstone National Park to draft a policy for “benefits sharing” to govern microbiological and related research. The policy, which was recently approved by the director of the NPS, requires researchers to negotiate a cooperative research and development agreement (CRADA) with the NPS before commercializing technology derived from materials collected in the park. The draft policy sur-vived a major legal challenge in April 2000 when a US federal court ruled that a CRADA did not, in itself, com-promise the NPS mission of preservation and conservation. The ruling is also consistent with the fact that most CRADA bioprospecting involves removing only small environmen-tal samples, followed by culturing or molecular cloning in laboratories off-site. Ironically, the patent on the T. aquaticus DNA polymerase, which had initially motivated the policy, failed a legal challenge of its own. In December 1999, a US District Court ruled the patent invalid, based on evidence that the DNA polymerase cited in the patent application was the same one documented years earlier by researchers at the University of Cincinnati (Chien et al. 1976).
Given this species’ dramatic his-tory, complete with colorful personali-ties, revolutionary technology, massive profits, legal intrigue, and a Nobel Prize, one can understand why many take T. aquaticus as the icon of Yellowstone’s “extremophiles.” From a microbiolo-gist’s perspective, however, it seems im-portant to stress that this species is not the only extreme thermophile living in Yellowstone, the most thermophilic, or even the most interesting, but is sim-ply one of the first to be coaxed into reproducing in captivity. The succes-sion of thermophiles that has followed it, and the molecular signatures of many more that remain uncultured, point to the largely unappreciated complexity of Earth’s geothermal microbiota and the value of exploring it in biological terms.
Metabolic diversity
Although T. aquaticus requires extremely high temperatures for growth, the basic outlines of its metabolism are familiar. Each Thermus cell takes up dissolved organic compounds from its liquid environment and breaks them down into somewhat simpler molecules, collectively called intermedi-ary metabolites. The growing Thermus cell assimilates some of this material, but oxidizes the rest of it to water and CO2 in order to generate energy. Many microorganisms, as well as the mitochondria of eukaryotic cells, follow this strategy of consuming organic compounds supplied by the environ-ment and are classified as “heterotrophs,” signifying that they “feed” on “something else.”
However, many of Yellowstone’s thermophiles discov-ered after T. aquaticus have been found to live by radically different strategies. A number of them, for example, produce their cellular material from CO2, as the chloroplasts of green plants do, and are thus classified as “autotrophs” (literally, “self-feeders”). In doing this, however, these thermophiles do not use the Calvin-Benson-Bassham pathway of CO2 fixa-tion found in chloroplasts. Furthermore, they obtain the en-ergy required to drive the process not by absorbing sunlight, but by oxidizing and reducing various chemicals provided by the geochemistry of their environment. Acidicaldus spp. for example, use oxygen to oxidize elemental sulfur to sulfuric acid; part of the resulting electrons are channeled through oxidative phosphorylation to generate ATP and the rest are transferred to CO2 to generate intermediary metabolites and new cellular material. Other Yellowstone thermophiles find alternative electron acceptors in their hydrothermal environ-ments to substitute for oxygen. Thermoterrabacterium ferri-reducens and Geothermobacterium ferrireducens, for example,
A small bubbling mudpot, Central plateau.
JAso
n H
ATC
HeR
24 Yellowstone Science 18(3) • 2010

use ferric ions (Fe+3) as the oxidizing agent. Another inter-esting oxidation-reduction process, whose metabolic sig-nificance remains less clear, is the oxidation of arsenite to arsenate by other bacteria in some Yellowstone hot springs (D’Imperio et al. 2007). If arsenic metabolism sounds un-healthy, one must consider that a bacterium isolated from the Norris Geyser Basin, Thermosinus carboxydivorans, de-rives both cell carbon and energy from carbon monoxide (Solokova et al. 2004). This thermophile therefore challenges the classical distinction between heterotroph and autotroph, and has perhaps the chemically simplest diet of any known organism. These various metabolic strategies sound complex and bizarre, but they share a practical logic, because they en-able the organism to harvest some form of energy provided by the geochemistry of its hydrothermal environment.
Furthermore, these apparently unusual thermophiles are familiar in terms of the structure and compositions of their cells, because they share many basic features of other bacte-ria, including the Escherichia coli cells diagramed in biology textbooks, the Yersinia pestis that caused the bubonic plague of medieval Europe, and the soil Actinomycetes that produce various antibiotics. All these microorganisms consist of cells about one micrometer in diameter that lack a true nucleus or any other membrane-enclosed organelles. In these cells, the cytoplasm is contained within a phospholipid bilayer, which is surrounded and supported by a cell wall composed of pep-tidoglycan, a cross-linked polymer found only in bacterial cells. Some bacteria, designated Gram-negative because of certain staining properties, have a second, outer membrane just outside the cell wall that incorporates another uniquely bacterial substance, lipopolysaccharide (figs. 1A and 1B).
Evolutionary diversity
Although bacteria are common in extreme environments, many of the microorganisms found in geohydrothermal environments differ fundamentally from bacteria as well as from the larger, more complex eukaryotic cells of protozoa, fungi, plants, and animals. These Archaea, which Carl Woese first described as a third form of life, are evolutionarily dis-tinct from both bacteria and Eucarya (eukaryotes) (Woese et al. 1990). Woese’s discovery was based originally on analyses of the ribosomal RNA sequences found in all cells (fig. 2), but differences can be seen in cell structure as well (fig. 1).
Archaeal cells resemble bacterial cells with respect to their small size and lack of nuclei and other internal organ-elles. However, they have neither peptidoglycan cell walls nor phospholipid in their cytoplasmic membranes (CM). Outside the CM, most archaea have only a protein layer, formed by a highly ordered array of subunits that are an-chored to the underlying membrane and interact strongly with each other (fig. 1C). The archaeal CM also differs from its bacterial counterpart, being composed of unique lipids in which long isoprenoid chains (hydrocarbons built up from 5-carbon isoprene units), rather than fatty acids, are linked to glycerol via ether linkages rather than ester linkages. In ad-dition to these properties not found in bacteria, archaea have various proteins closely related to those of eukaryotic cells. These molecular similarities are consistent with analyses of highly conserved gene families that indicate archaea share a non-bacterial ancestor with modern eukaryotes (Woese et al. 1990).
The first archaea from Yellowstone National Park were isolated several years before this distinct lineage of cellular life
Measuring the temperature of a small hydrothermal outflow on the central plateau.
JAso
n H
ATC
HeR
2518(3) • 2010 Yellowstone Science
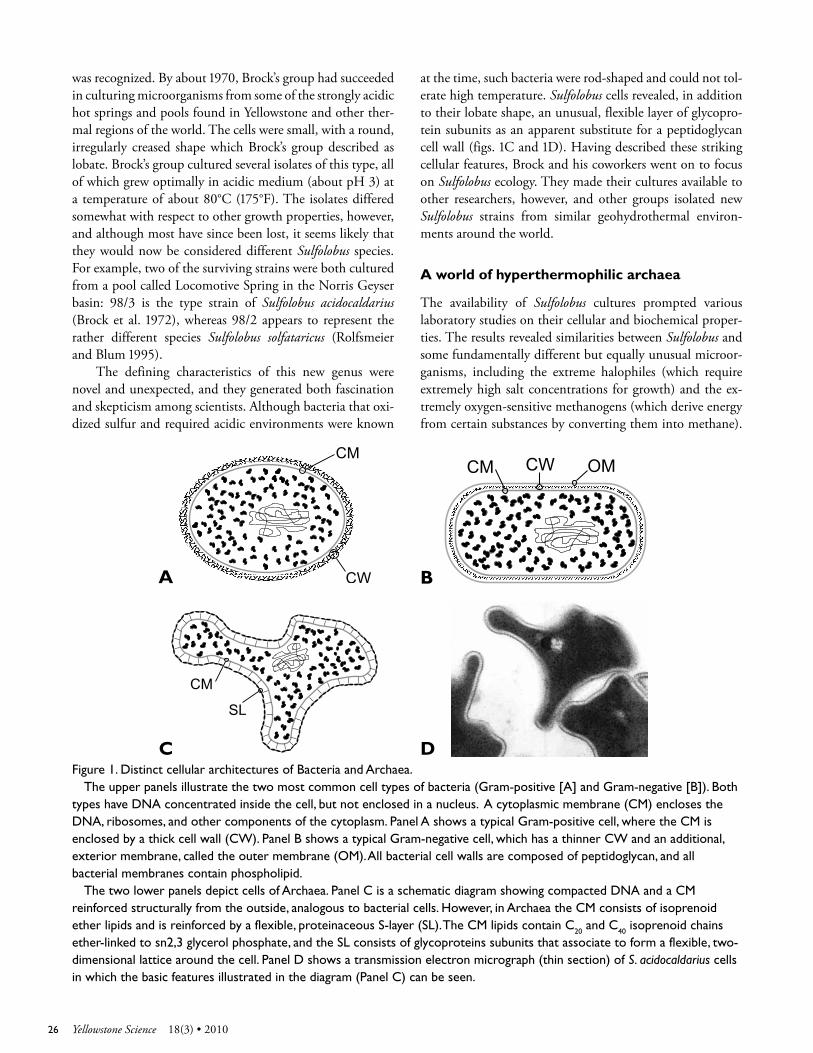
A B
C DFigure 1. Distinct cellular architectures of Bacteria and Archaea.
The upper panels illustrate the two most common cell types of bacteria (Gram-positive [A] and Gram-negative [B]). Both types have DnA concentrated inside the cell, but not enclosed in a nucleus. A cytoplasmic membrane (CM) encloses the DnA, ribosomes, and other components of the cytoplasm. Panel A shows a typical Gram-positive cell, where the CM is enclosed by a thick cell wall (CW). Panel B shows a typical Gram-negative cell, which has a thinner CW and an additional, exterior membrane, called the outer membrane (oM). All bacterial cell walls are composed of peptidoglycan, and all bacterial membranes contain phospholipid.
The two lower panels depict cells of Archaea. Panel C is a schematic diagram showing compacted DnA and a CM reinforced structurally from the outside, analogous to bacterial cells. However, in Archaea the CM consists of isoprenoid ether lipids and is reinforced by a flexible, proteinaceous s-layer (sl). The CM lipids contain C20 and C40 isoprenoid chains ether-linked to sn2,3 glycerol phosphate, and the sl consists of glycoproteins subunits that associate to form a flexible, two-dimensional lattice around the cell. Panel D shows a transmission electron micrograph (thin section) of S. acidocaldarius cells in which the basic features illustrated in the diagram (Panel C) can be seen.
was recognized. By about 1970, Brock’s group had succeeded in culturing microorganisms from some of the strongly acidic hot springs and pools found in Yellowstone and other ther-mal regions of the world. The cells were small, with a round, irregularly creased shape which Brock’s group described as lobate. Brock’s group cultured several isolates of this type, all of which grew optimally in acidic medium (about pH 3) at a temperature of about 80°C (175°F). The isolates differed somewhat with respect to other growth properties, however, and although most have since been lost, it seems likely that they would now be considered different Sulfolobus species. For example, two of the surviving strains were both cultured from a pool called Locomotive Spring in the Norris Geyser basin: 98/3 is the type strain of Sulfolobus acidocaldarius (Brock et al. 1972), whereas 98/2 appears to represent the rather different species Sulfolobus solfataricus (Rolfsmeier and Blum 1995).
The defining characteristics of this new genus were novel and unexpected, and they generated both fascination and skepticism among scientists. Although bacteria that oxi-dized sulfur and required acidic environments were known
at the time, such bacteria were rod-shaped and could not tol-erate high temperature. Sulfolobus cells revealed, in addition to their lobate shape, an unusual, flexible layer of glycopro-tein subunits as an apparent substitute for a peptidoglycan cell wall (figs. 1C and 1D). Having described these striking cellular features, Brock and his coworkers went on to focus on Sulfolobus ecology. They made their cultures available to other researchers, however, and other groups isolated new Sulfolobus strains from similar geohydrothermal environ-ments around the world.
A world of hyperthermophilic archaea
The availability of Sulfolobus cultures prompted various laboratory studies on their cellular and biochemical proper-ties. The results revealed similarities between Sulfolobus and some fundamentally different but equally unusual microor-ganisms, including the extreme halophiles (which require extremely high salt concentrations for growth) and the ex-tremely oxygen-sensitive methanogens (which derive energy from certain substances by converting them into methane).
26 Yellowstone Science 18(3) • 2010

Figure 2. The Tree of life from a molecular perspective.This dendrogram, adapted from Pace (1997), shows the evolutionary relatedness of small-subunit ribosomal RnAs (ssu-
rRnAs) from representative genera of cellular organisms. This RnA is one of the few gene products that occurs in all cells and carries out the same function, thus allowing divergence of its sequence to be measured between any two organisms. This divergence is represented on the dendrogram by the combined length of the two branches joining any two organisms. These evolutionary distances reveal several significant patterns:
The cryptic diversity of single-celled organisms. species of plants, animals, and fungi are defined by visible morphological differences, but single-celled organisms appear very similar by this criterion; this results in severe under-estimation of microbial diversity. When the molecular divergence of all cellular organisms is compared on a common basis, the diversity of single-celled organisms dwarfs that of multicellular plants, animals, and fungi (blue box).
The relatedness of Archaea and Eucarya. Additional analyses (not described here) place the root of the ssu-rRnA tree along the base of the bacterial branch, as indicated in the figure. This means that the first major evolutionary split gave rise to the bacterial lineage, on one hand, and an ancestor shared between Archaea and eucarya, on the other. This shared ancestor is consistent with many molecular features besides the ssu-rRnA sequences that archaea and eukaryotes share but do not appear in bacteria.
Thermophilia as a primitive characteristic. Branches leading to thermophilic organisms emerge from near the base of their respective groups, which are marked by the red circles. This may indicate that early bacterial and archaeal cells may have also been adapted to extremely high temperatures.
The diversity of Yellowstone thermophiles. organisms cultured or detected in hydrothermal systems within Yellowstone national Park have been marked by an orange letter Y on the dendrogram. some of the branches are identified by clone number, not genus name. These represent ssu-rRnA sequences cloned from thermal environments, and indicate the extensive diversity of extreme thermophiles that have not been cultured.
2718(3) • 2010 Yellowstone Science

Paul Blum’s group investigated carbohydrate metabolism in Yellowstone isolate 98/2, purifying several carbohydrate-de-grading enzymes (Rolfsmeier and Blum 1995) and isolating mutant strains in which some of these enzymes had been inactivated or their expression altered. Later studies inves-tigated the regulation of gene expression and mechanisms of heavy metal resistance (Dixit et al. 2004). Meanwhile, the author began studying S. acidocaldarius (isolate 98/3), whose vigorous growth seemed promising for genetic ma-nipulation, and discovered in it a form of conjugation in which cells pair and transfer pieces of DNA. The transferred DNA can recombine into the corresponding site of the re-cipient chromosome, and can thus displace any mutation at that location (Grogan 1996). Based on the resilience of the process under laboratory conditions, it is expected to occur in natural Sulfolobus populations, and to affect their genetic diversification over time.
The author’s students at the University of Cincinnati went on to investigate the process of mutation in specific S. acidocaldarius genes. This revealed that Sulfolobus replicates its DNA with an accuracy matching that of E. coli, despite the fact that the pH and temperature within the Sulfolobus cell predict a 1000-fold faster rate of spontaneous DNA damage (Jacobs and Grogan 1997). This observation and others suggest that Sulfolobus cells repair their DNA very ef-ficiently. Most details of the repair strategies remain mysteri-ous, however, because genes related to several DNA repair genes of other organisms do not occur in the genome of any Sulfolobus species or any other hyperthermophilic archaeon (Grogan 2004). However, one repair strategy, photo-reversal of UV damage, has been demonstrated biologically (Grogan 1997), and the gene encoding the necessary enzyme has been identified genetically. The likelihood that additional DNA repair systems operate in these archaea and use novel mecha-nisms, remains an important research question.
Back to nature
Genetic analyses of microorganisms require reliable “plat-ing,” a basic microbiological technique that rarely succeeds for hyperthermophilic archaea (Huber et al. 2000). Plating involves solidifying liquid growth medium to form a sterile gel, usually in a petri dish, and then spreading or streaking a few cells on the surface of the gel. When the resulting plate is incubated under suitable conditions, an isolated microbial cell on the plate surface grows and divides for many genera-tions, producing a visible mound (colony) representing up to several million identical daughter cells. The technique can be used in a preparative sense, to generate pure cultures, or in a quantitative sense, to count the number of viable cells in a suspension.
Adapting this technique to Sulfolobus required solv-ing several technical problems. For example, the traditional
The properties shared by these otherwise divergent groups of microorganisms provided additional evidence support-ing Carl Woese’s three-domain phylogeny. In turn, Woese’s identification of the evolutionary distinctiveness of Archaea intensified interest in the molecular features of archaea from extreme environments. Teams of microbiologists, including several European groups, applied new isolation strategies to geohydrothermal environments and succeeded in cultivating a series of new thermophiles.
Unlike Sulfolobus spp., many of the new thermophiles were anaerobic, and several defined new metabolic strate-gies. For example, the thermophilic, rod-shaped anaerobes Thermoproteus and Pyrobaculum were found to reduce sulfur to hydrogen sulfide. Members of a third group, Acidianus, had a Sulfolbus-like cell shape, but were shown to switch between oxidative and reductive modes of sulfur metabo-lism depending on the availability of oxygen. Archaea were later discovered that can oxidize ferrous iron in solution or as insoluble metal sulfides, or precipitate realgar, an arse-nic sulfide, as an end-product of metabolism (Huber et al. 2000). The oxidation of metal sulfides also has a practical application, as it increases the recovery of copper and other metals from sulfidic ores, and this continues to be developed for the mining of low-grade ores (Nemati et al. 2000). The archaeal successors to Sulfolobus also set new temperature re-cords. Pyrodictium occultum, isolated from shallow marine events near Vulcano, Italy, grows optimally at about 103°C, for example, whereas the current record-holder in culture, Pyrolobus fumarii, grows optimally at 106°C, can still grow at 113°C, and can survive brief periods of autoclaving (121°C) (Blöchl et al. 1997).
Into the laboratory
Consistent with their record-breaking growth temperatures, the anaerobic hyperthermophiles have various unusual cel-lular features that raise questions about the early evolution of cellular life and how biological processes can be sustained at such high temperatures. Unfortunately, however, these organisms remain difficult to culture, and experimenting on them often requires Herculean effort and skill. In con-trast, the relatively simple culturing conditions and vigorous growth of Sulfolobus species enables non-microbiologists to produce their own cell mass, which facilitates detailed study of Sulfolobus enzymes and other cellular features. As a result, throughout the 1980s and 1990s, Sulfolobus, especially S. sol-fataricus strains isolated from Italy, became increasingly pop-ular subjects for biochemistry and molecular biology. This trend intensified with the sequencing of the S. solfataricus and S. tokodaii genomes in the late 1990s.
During this period, few labs focused on Brock’s Yellowstone isolates, but those that did were rewarded with interesting phenomena. At the University of Nebraska,
28 Yellowstone Science 18(3) • 2010

gelling agent, agar, melts near the incubation tempera-tures needed for Sulfolobus and decomposes in strong acid. Thus, a substitute had to be found which could withstand the combination of high temperature, low pH, and long incubation times required for Sulfolobus colonies to form. Fortunately for Sulfolobus research, a commercially avail-able gelling agent, gellan gum, works admirably and requires only minor modifications to traditional plate-pouring pro-cedures. Another incubation problem, rapid drying of the plates, can be solved by sealing them inside plastic bags or other containers for incubation.
Through the 1990s, as Sulfolobus plating became in-creasingly reliable, the author was struck by two trends in the scientific literature. First, new Sulfolobus species were being described at a fairly steady pace, but none originated from Yellowstone despite the fact that this region has probably the largest network of acidic thermal features in the world. Second, all Sulfolobus species, new and old, had been iso-lated by the classical technique of liquid enrichment, despite publication of the fairly straightforward Sulfolobus plating procedure (Grogan 1989). Because liquid enrichment gener-ally yields only the fastest-growing species from a complex mixture of microorganisms, it remained unclear whether the environments that yielded the existing Sulfolobus species also contained species that were missed simply because they were being out-competed during liquid enrichment.
The situation raised the following question: What would emerge if someone isolated extreme thermoacido-philes from locations throughout Yellowstone National Park by plating samples directly, with no liquid enrichment? The presumed answer was that much greater diversity would be recovered. The idea was integrated with a summer labora-tory course and the author’s ongoing genetic research in a proposal to the National Science Foundation, which was eventually funded.
Sampling Sulfolobus populations in Yellowstone
The Sulfolobus culturing scheme that has emerged from this NSF-sponsored project involves six stages: (1) selecting suitable thermal sites in the park, (2) measuring tempera-ture and pH in the hydrothermal features, (3) taking fluid and sediment samples back to the laboratory, (4) plating on acidic medium, (5) evaluating the diversity of colonies that form, and (6) purifying and cryo-preserving a subset of these strains. Site selection relies heavily on advice and help provided by staff of the Yellowstone Center for Resources (YCR) and park volunteers. In particular, the Spatial Analysis Center has compiled an inventory of thermal features that can be searched online through the Research Coordination Network website (http://www.rcn.montana.edu/), which provides a valuable resource for researchers interested in get-ting a permit to sample thermal features of particular types or in particular locations. In addition, YCR staff advise re-searchers, approve the sites, and relay current conditions at many thermal areas, helping ensure that the work is done safely and out of public view. Although public visibility or hazardous conditions eliminates a number of interesting areas, it has become clear that the remaining Sulfolobus habi-tat will, at the current pace, require decades to sample.
Figure 3 shows some acidic thermal pools that were se-lected for sampling. At each site, the temperatures of pools and springs are measured by a pole-mounted thermometer (fig. 3A) to identify those between about 65 and 85°C. These waters are then tested to identify those that have pH be-tween about 2.5 and 4.5. From these springs, about 10 mil-liliters (0.3 fl. oz.) of water plus solid material (sand, gravel, or silt) are scooped into a sterile glass vial, also mounted on a long pole. Airspaces are left in the vials, and the samples are stored and transported at ambient temperature. Alternative strategies such as excluding air or adding a buffer to moder-
ate the pH have been tested on replicate samples, but did not increase the yield of viable cells significantly. Within five days, the samples are taken back to the laboratory, where small volumes of both diluted and undiluted samples are spread on gellan gum plates containing acidic nutrient medium. Plates are incubated at 76 to 78°C and examined for colonies after seven to eight days. Of the 15–20 samples typically taken from a given thermal area, about half usually yield colonies, and in a few of these, the num-bers can be extremely high (fig. 3D).
Many microbial ecologists discour-age the culturing of microorganisms as a means of analyzing natural microbial
Mudpots often outnumber the available sampling vials. Photo at Turbid lake.
JAso
n H
ATC
HeR
2918(3) • 2010 Yellowstone Science

communities because, as a rule, this yields only a small fraction of the species and viable cells present, and thus presents an inaccurate pic-ture. Culturing nevertheless has one impor-tant advantage over purely molecular analy-ses, which is that each strain recovered can be grown indefinitely and therefore analyzed to great resolution. The direct-plating technique standardized in the author’s laboratory also provides quantitative (if rather rough) compar-isons of the abundance of culturable Sulfolobus cells in acidic thermal features throughout Yellowstone National Park.
The direct-plating data collected so far depict a highly patchy distribution of these culturable cells among hydrothermal features. For example, one thermal area has yielded colonies from every sample taken, while others with dozens of acidic pools and springs over thousands of square meters have yielded none. Most acidic thermal areas fall between these ex-tremes, and the individual samples taken from them vary widely in culturable cell abundance. Taken together, the results suggest patchy population clusters with complex boundaries. The number of culturable cells generally does not correlate with temperature or pH values (within the acceptable range sampled), but other geochemical parameters of the samples have not been tested.
In addition to widely varying concentra-tions of culturable cells, the samples vary in the apparent diversity of the cells. When a sample yields a number of colonies on a plate, the colonies often differ with respect to size, color, and opacity, which argues for some biological differences among the clones (fig. 3D). However, as the Yellowstone isolates have been analyzed in molecular terms, it has become clear that this apparent diversity does not represent multiple species. Each Sulfolobus strain from Yellowstone that has been isolated in the author’s lab by di-rect plating and subjected to DNA sequencing analysis has been found to be in one species with all the other Yellowstone isolates so analyzed, as well as with Sulfolobus strains iso-lated from Lassen Volcanic National Park, the Kamchatka peninsula of eastern Siberia, and Iceland. Sulfolobus isolates from Icelandic thermal areas had been informally named “Sulfolobus islandicus” by Wolfram Zillig’s research group in Germany (Zillig et al. 1994), and some researchers have ap-plied this name to all the closely related isolates from various world regions.
The plating conditions themselves do not seem to explain the consistent recovery of this single species from throughout the northern hemisphere, as several other
Sulfolobus species grow well under the same conditions. Furthermore, hot spring samples from New Zealand plated under these same conditions in the same laboratory yielded colonies of a species very different from S. islandicus and closely related to Sulfurisphaera. Although the cultivation data remain incomplete, they suggest that Sulfolobus habitats in the northern hemisphere may be dominated numerically by S. islandicus, whereas other thermoacidophiles appear to dominate in some other world regions. It must be stressed that this numerical abundance does not preclude the pos-sibility that other Sulfolobus species, such as S. acidocaldarius or yet-unknown species, persist at low levels in Yellowstone or elsewhere.
Levels of genetic diversity
Although the author’s ongoing survey of Yellowstone has not yielded the diverse new species originally sought, it has pre-served intraspecific diversity, which provides an interesting perspective on the genetics of Sulfolobus populations within the park. This diversity was first documented by collaborators
Figure 3. Cultivating Sulfolobus from Yellowstone national Park. Panels A–C: Acidic thermal pools sampled for Sulfolobus isolates. Dead trees indicate that relatively recent shifts in subsurface conduits have caused acidic fluids and steam to emerge in a formerly wooded site. Panel D: Photograph of a plate demonstrating a high concentration of viable cells. A hot spring sample was diluted by a factor of 20 with sterile acidic buffer, and about 0.2 milliliters of the resulting dilution were spread over the surface of a gellan gum plate and incubated at 76°C–78°C for more than one week. The Sulfolobus colonies on this plate number about a thousand, and vary in diameter and other visible properties.
PAn
els A A
nD
C: BR
IAn
kIn
kle; B, JA
son
HAT
CH
eR; D
, Den
nIs G
RoG
An
30 Yellowstone Science 18(3) • 2010
using the technique of multilocus sequence typing (MLST), in which several genes important for basic cellular function, so-called “housekeeping genes,” are sequenced from each isolate. The resulting DNA sequences are joined to form a composite genotype that can be compared across a num-ber of isolates. MLST of Sulfolobus isolates from different thermal regions of the northern hemisphere put them into a common species, but generated discrete clusters which cor-responded to the different regions sampled (Whitaker et al. 2003). Although such genetic endemism, a sign of allopatric speciation, is routinely observed with plant or animal popu-lations, it is generally disputed for unicellular organisms, due to the efficiency of their passive dispersal.
In another study, multiple clones were cultured from two neighboring outflows of a thermal area in Kamchatka which approximate a single point on the relevant spatial scale. MLST of 60 isolates defined 17 distinct genotypes, demonstrating extensive genetic diversity within this lim-ited sample of the local population. Statistical analyses of the alleles at the different MLST loci further indicated that most of this genetic diversity could be attributed to recom-bination among pre-existing genetic differences, rather than formation of new mutations (Whitaker et al. 2005). Such a combinatorial mode of genetic variation is known from both theoretical and experimental studies to provide a more efficient route to adaptive evolution than de novo mutation.
The genes chosen for MLST perform important cellular functions and, as a result, generally accumulate only rela-tively inconsequential substitutions of one DNA base for an-other, and do so at a slow rate. Sequencing of entire bacterial and archaeal genomes, however, shows a very different mode of variation on the genome-wide scale, namely the appar-ently random acquisition and loss of large DNA segments that often cover several genes. The faster pace and more dras-tic nature of these mutations compared to those measured by MLST raises the question as to whether variation of gene content among Sulfolobus genomes would reveal geographi-cal patterning like that revealed by MLST. Hybridization of genomic DNA to microarrays of S. solfataricus probes was used to score the presence or absence of genes in eight Sulfolobus isolates recovered from four regions of the north-ern hemisphere. The analysis revealed many differences and, with one apparent exception, their pattern followed a geographical structuring similar to that seen previously in MLST (Grogan et al. 2008). Geographical pattern in these very different forms of genetic divergence reinforces the idea that Sulfolobus populations remain relatively isolated within the small islands defined by their hydrothermal habitat.
A third level of genetic variation in Sulfolobus is harder to quantify, and involves various entities collectively called mobile genetic elements. They are largely parasitic DNA se-quences that occur in all cellular microorganisms and fall into three broad classes: transposable genetic elements, plas-mids, and viruses. Sulfolobus strains from Yellowstone and other regions have been found to differ with respect to the genetic elements that actively transpose in their genomes (Blount and Grogan 2005). Similarly, a number of relatively large Sulfolobus plasmids have been found that can transfer themselves between strains (Greve et al. 2004). They are not known to confer any specific biological property on their host, however. As a result, these plasmids are normally de-tected through DNA analysis. One conjugative plasmid, for example, was discovered only when the DNA of its Sulfolobus host, a strain isolated from the Mud Volcano area, was sequenced.
The viruses of Sulfolobus and related archaea span a range of genome sizes and exhibit diverse and unusual char-acteristics. In several cases, classifying them has required the creation of entirely new families having no counterparts among bacterial, plant, or animal viruses (Prangishvili and Garrett 2004). Sulfolobus viruses may provide valuable tools for focused, mechanistic studies of molecular processes of hyperthermophilic archaea, which have proven difficult so far. In addition, since viruses function as predators to control the abundance of their host species in microbial communi-ties, the study of Sulfolobus viruses should shed new light on the ecology of natural populations. The nature of the selec-tive pressure that viruses exert on host populations, and the defenses that the hosts employ, represent compelling ques-tions for current and future research.
In summary, Yellowstone National Park supports large populations of diverse bacteria and archaea adapted to the extreme environmental conditions found only in hydrother-mal systems. They differ radically from historically familiar microorganisms, and represent a dynamic and largely un-der-appreciated natural resource. The gene sequences, ther-mostable enzymes, and basic knowledge gained from these thermophiles address scientific interests ranging from ecol-ogy to cellular physiology, and cellular evolution to biotech-nology. Reliable cultivation methods allow Sulfolobus clones and populations to be studied in great detail, and the obser-vations made so far raise new questions. Why, for example, are culturable Sulfolobus cells distributed so unevenly within geothermal features of apparently uniform characteristics? How severely do Sulfolobus populations fluctuate over time, and what factors dictate these dynamics? Do thermophilic
Yellowstone National Park supports large populations of diverse bacteria and archaea adapted to the extreme environmental conditions found only in hydrothermal systems.
3118(3) • 2010 Yellowstone Science

Grogan, D.W. 1989. Phenotypic characteriza-tion of the archaebacterial genus Sulfolobus: comparison of five wild-type strains. Journal of Bacteriology 171(12):6710–9.
———. 1996. exchange of genetic markers at extremely high temperatures in the archaeon Sulfolobus acidocaldarius. Journal of Bacteriology 178(11):3207–3211.
———. 1997. Photoreactivation in an archaeon from geothermal environments. Microbiology 143:1071–6.
———. 2004. stability and repair of DnA in hyperthermophilic Archaea. Current Issues in Molecular Biology 6:137–44.
Grogan, D.W., M.A. ozarzak, and R. Bernander. 2008. Variation in gene content among geographically diverse Sulfolobus isolates. Environmental Microbiology 10(1):137–146.
Huber, R., H. Huber, and k.o. stetter. 2000. Towards the ecology of hyperthermophiles: Biotopes, new isolation strategies and novel metabolic properties. FEMS Microbiology Reviews 24(5):615–623.
Jacobs, k.l., and D.W. Grogan. 1997. Rates of spontaneous mutation in an archaeon from geothermal environments. Journal of Bacteriol-ogy 179(10):3298–3303.
nemati, M., J. lowenadler, and s.T. Harrison. 2000. Particle size effects in bioleaching of pyrite by acidophilic thermophile Sulfolobus metallicus (BC). Applied Microbiolology and Biotechnolology 53(2):173–179.
Pace, n.R. 1997. A molecular view of micro-bial diversity and the biosphere. Science 276(5313):734–740.
Prangishvili, D. and R.A.Garrett. 2004. excep-tionally diverse morphotypes and genomes of crenarchaeal hyperthermophilic viruses. Bio-chemical Society Transactions 32(2):204–208.
Rolfsmeier, M., and P. Blum. 1995. Purifica-tion and characterization of a maltase from the extremely thermophilic crenarchaeote Sulfolobus solfataricus. Journal of Bacteriology 177(1):482–5.
sokolova, T.G., J.M. González, n.A. kostrikina, n.A. Chernyh, T.V. slepova, e. A. Bonch-os-molovskaya, and F.T. Robb. 2004. Thermosinus carboxydivorans gen. nov., sp. nov., a new anaerobic, thermophilic, carbon-monoxide-oxidizing, hydrogenogenic bacterium from a hot pool of Yellowstone national Park. International Journal of Systematic and Evolution-ary Microbiology 54:2353–9.
Whitaker, R.J., D.W. Grogan, and J.W. Taylor. 2003. Geographic barriers isolate endemic populations of hyperthermophilic archaea. Science 301(5635):976–8.
Whitaker, R.J., D.W. Grogan, and J.W. Taylor. 2005. Recombination shapes the natural population structure of the hyperthermo-philic archaeon Sulfolobus islandicus. Molecular Biology and Evolution 22(12):2354–2361.
Woese, C.R., o. kandler, and M. Wheelis. 1990. Towards a natural system of organisms: Proposal for the domains Archaea, Bacteria, and eucarya. Proceedings of the National Acad-emy of Sciences of the United States of America 87:4576–9.
zillig, W., A. kletzin, C. schleper, and I. Holz. 1994. screening for sulfolobales, their plasmids and their viruses in Icelandic solfataras. Systematic and Applied Microbiology 16(4):609–628.
bacteria adapted to hydrothermal habitats show geographical patterning of genetic diversity, as Sulfolobus popu-lations do? The productive, and still relatively brief, history of culturing Yellowstone’s thermophiles illustrates the value of basic research conducted in the park, and its fundamental com-patibility with the preservation and conservation missions of the National Park Service.
YS
Acknowledgements
Many individuals have contributed to the author’s research in Yellowstone over the past 10 years. special thanks go to Christie Hendrix, stacey Gunther, liz Cleveland, and other YCR staff at park headquarters, and to field escorts smokey sturtevant, Ann Deutch, Carrie Guiles, Blake Weidenheft, and George Rice. Brian kinkle, norio kurosawa, Jason Hatcher, Jack Young, Clyde stauffer, and the author’s family provided valuable field assistance. Members of the Grogan lab at the university of Cincinnati helped isolate, analyze, and preserve Sul-folobus cultures from Yellowstone sources; these include katie schmidt sorg, Rebecca Perkins, shannon strini, Greg Dikos, Greg Bell, Josh Hansen, zachary Blount, Cynthia sakofsky, Michael Wolfe, and Dominic Mao, and the university of Cincinnati under-graduate students enrolled in the course “Micro-organisms from extreme environ-ments.” Additional thanks go to Ann Deutch, Christie Hendrix, and Brian kinkle for com-ments on the manuscript. Culturing surveys conducted from 1999 through 2004 were funded by nsF grant MCB 9733303.
Dennis Grogan grew up near kansas City, Missouri; he majored in Biological sciences and Chemistry at the university
of Missouri–Columbia, where his involve-ment in undergraduate research intensi-fied his interest in prokaryotic forms of life. He completed Ms and PhD degrees in microbiology at the university of Illinois, urbana–Champaign, with a focus on bacte-rial genetics and lipid metabolism. During graduate school, he became intrigued by the archaebacteria (as they were called then) through the research of Ralph Wolfe, Carl Woese, and others at the university of Illinois. This led to post-doctoral studies in the research groups of Wolfram zillig (Max-Planck-Institute for Biochemistry), Giuseppe Bertani (nAsA Jet Propulsion lab), and Rob Gunsalus (university of California, los Angeles). He is currently a professor in the Department of Biological sciences at the university of Cincinnati, where he and his students analyze the genetic processes of Sulfolobus species.
ReferencesBlöchl, e., R. Rachel, s. Burggraf, D. Hafen-
brandl, H.W, Jannasch, and k.o. stetter. 1997. Pyrolobus fumarii, gen. and sp. nov., represents a novel group of archaea, extend-ing the upper temperature limit for life to 113 degrees C. Extremophiles 1:14–21.
Blount, z.D., and D.W. Grogan. 2005. new insertion sequences of Sulfolobus: Functional properties and implications for genome evolution in hyperthermophilic archaea. Molecular Microbiology 55:312–325.
Brock, T.D. 1978. Thermophilic microorganisms and life at high temperatures. new York: springer-Verlag.
Brock, T.D., k.M. Brock, R.T. Belly, and R.l. Weiss. 1972. Sulfolobus: A new genus of sulfur-oxidizing bacteria living at low pH and high temperature. Archives of Microbiology 84(1):54–68.
Brock, T.D., and H. Freeze. 1969. Thermus aquaticus gen. n. and sp. n., a nonsporulating extreme thermophile. Journal of Bacteriology 98(1):289–297.
Chien, A., D.B. edgar, and J.M. Trela. 1976. Deoxyribonucleic acid polymerase from the extreme thermophile Thermus aquaticus. Journal of Bacteriology 127(3):1550–7.
D’Imperio, s., C.R. lehr, M. Breary, and T.R. McDermott. 2007. Autecology of an arsenite chemolithotroph: sulfide constraints on function and distribution in a geothermal spring. Applied and Environmental Microbiology 73(21):7067–7074.
Dixit, V., e. Bini, M. Drozda, and P. Blum. 2004. Mercury inactivates transcription and the generalized transcription factor TFB in the archaeon Sulfolobus solfataricus. Antimicrobial Agents and Chemotherapy 48(6):1993–9.
Gelfand, D.H., s. stoffel, F.C. lawyer, and R.k. saiki. 1989. Purified Thermostable enzyme, united states patent number 4,889,818, December 26, 1989.
Greve, B., s. Jensen, k. Brügger, W. zillig, and R.A. Garrett. 2004. Genomic comparison of archaeal conjugative plasmids from Sulfolobus. Archaea 1(4):231–239.
JAso
n H
ATC
HeR
32 Yellowstone Science 18(3) • 201032 Yellowstone Science 18(3) • 2010
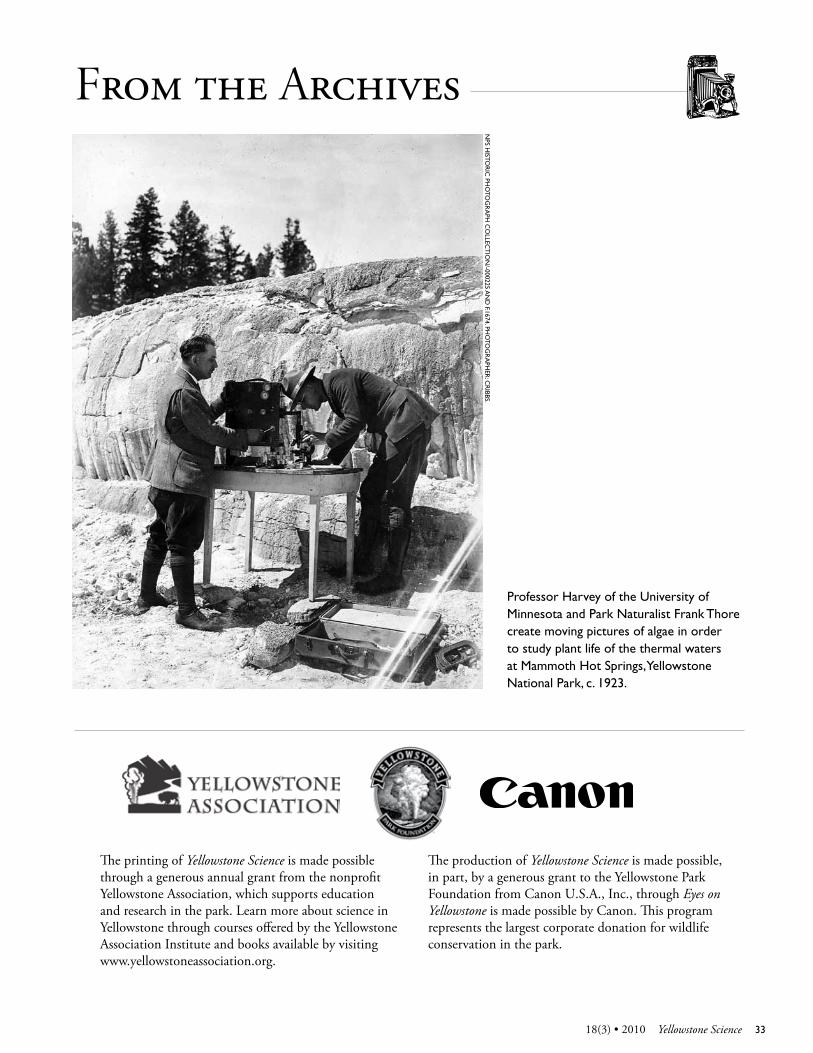
Professor Harvey of the university of Minnesota and Park naturalist Frank Thore create moving pictures of algae in order to study plant life of the thermal waters at Mammoth Hot springs, Yellowstone national Park, c. 1923.
nPs H
IsToR
IC PH
oTo
GR
APH
Co
lleCT
Ion
/-000225 An
D F.1674. PH
oTo
GR
APH
eR: C
RIBBs.
3318(3) • 2010 Yellowstone Science
From the Archives
The printing of Yellowstone Science is made possible through a generous annual grant from the nonprofit Yellowstone Association, which supports education and research in the park. Learn more about science in Yellowstone through courses offered by the Yellowstone Association Institute and books available by visiting www.yellowstoneassociation.org.
The production of Yellowstone Science is made possible, in part, by a generous grant to the Yellowstone Park Foundation from Canon U.S.A., Inc., through Eyes on Yellowstone is made possible by Canon. This program represents the largest corporate donation for wildlife conservation in the park.

Yellowstone Science is available electronically at www.greateryellowstonescience.org/ys and in print.
Readers may subscribe to the electronic and/or the print version. To update your subscription, email [email protected].
Yellowstone Center for ResourcesPO Box 168
Yellowstone National Park, WY 82190
Change Service Requested
PRsRT sTD AuTous PosTAGe PAID
national Park serviceDept. of the Interior
Permit no. G-83
Support Yellowstone
Science
Our readers’ generosity helps to defray printing costs.
Make checks payable to the Yellowstone Association, and indicate
your donation is for Yellowstone Science. Checks can be mailed to
Yellowstone Association PO Box 117
Yellowstone National Park, WY 82190-0117
Thank you!
sTaRRs students document changes at Mammoth Hot springs.
An
A H
ou
seAl