Embed Size (px)
Citation preview

RECOVERYANDGROWTH
Annual Report 2013For the year ended March 31, 2013
Refine Technology with Customers FirstTechnology to Customers
Continuing to Deliver New Values and Joy to People around the World
Directing our Energies toward Recovery and Growth
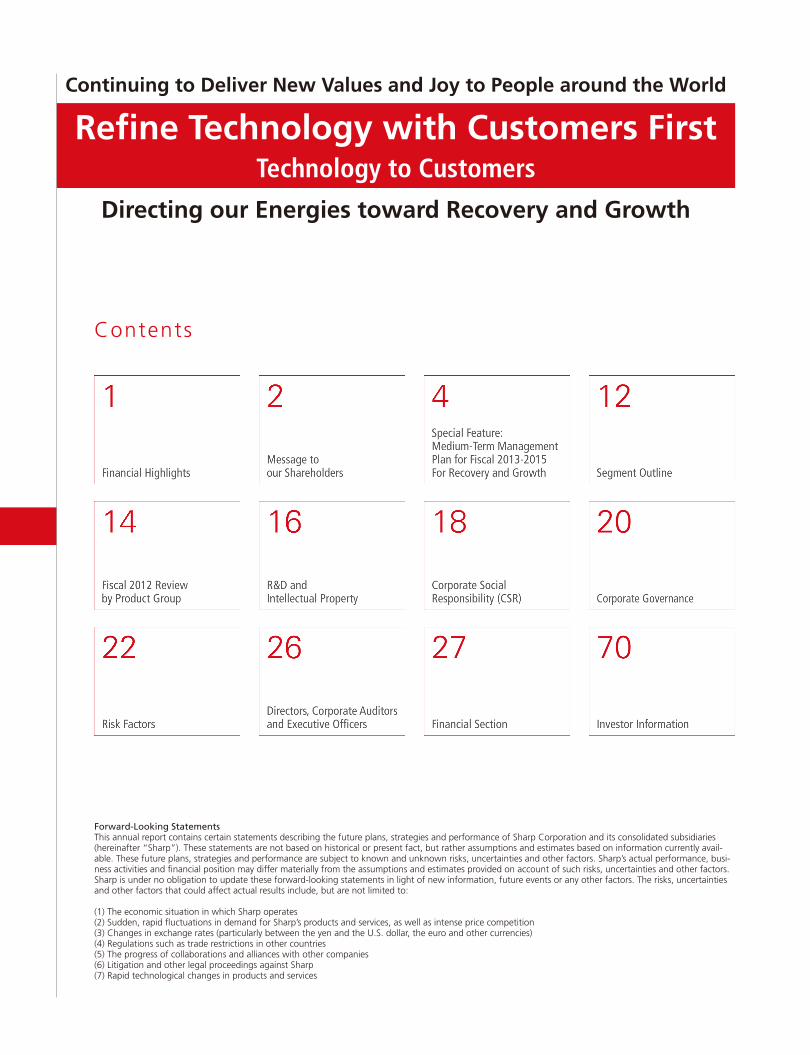
Contents
Forward-Looking StatementsThis annual report contains certain statements describing the future plans, strategies and performance of Sharp Corporation and its consolidated subsidiaries (hereinafter “Sharp”). These statements are not based on historical or present fact, but rather assumptions and estimates based on information currently avail-able. These future plans, strategies and performance are subject to known and unknown risks, uncertainties and other factors. Sharp’s actual performance, busi-ness activities and financial position may differ materially from the assumptions and estimates provided on account of such risks, uncertainties and other factors. Sharp is under no obligation to update these forward-looking statements in light of new information, future events or any other factors. The risks, uncertainties and other factors that could affect actual results include, but are not limited to:
(1) The economic situation in which Sharp operates(2) Sudden, rapid fluctuations in demand for Sharp’s products and services, as well as intense price competition(3) Changes in exchange rates (particularly between the yen and the U.S. dollar, the euro and other currencies)(4) Regulations such as trade restrictions in other countries(5) The progress of collaborations and alliances with other companies(6) Litigation and other legal proceedings against Sharp (7) Rapid technological changes in products and services

Annual Report 2013 1
売上高 設備投資研究開発費
設備投資 研究開発費
Net Sales Capital InvestmentR&D Expenditures
営業利益(損失)当期純利益(損失)
営業利益(損失) 当期純利益(損失)
(十億円)
09 10 11 12 13
-600
0
-200
-400
200
0
3,500
3,000
2,500
2,000
1,500
1,000
500
(十億円)
09 10 11 12 13
0
200
100
(十億円)
09 10 11 12 13
300
Operating Income (Loss)Net Income (Loss)
Operating income (loss) Net income (loss) Capital investment R&D expenditures
(billions of yen)
09 10 11 12 13
-600
0
-200
-400
200
0
3,500
3,000
2,500
2,000
1,500
1,000
500
(billions of yen)
09 10 11 12 13
0
200
100
(billions of yen)
09 10 11 12 13
300
Notes: 1. The translation into U.S. dollar figures is based on ¥93=U.S.$1.00, the approximate exchange rate prevailing on March 31, 2013. All dollar figures hereinafter refer to U.S. currency.
2. The amount of leased properties is included in capital investment. 3. The computation of net income (loss) per share is based on the weighted average number of shares of common stock outstanding during each fiscal year. 4. The number of shares outstanding is net of treasury stock.
Yen(millions)
U.S. Dollars(thousands)
2009 2010 2011 2012 2013 2013
Net Sales ¥2,847,227 ¥2,755,948 ¥3,021,973 ¥2,455,850 ¥2,478,586 $26,651,462
Domestic sales 1,302,261 1,429,057 1,592,909 1,181,168 1,007,264 10,830,795
Overseas sales 1,544,966 1,326,891 1,429,064 1,274,682 1,471,322 15,820,667
Operating Income (Loss) (55,481) 51,903 78,896 (37,552) (146,266) (1,572,753)
Income (Loss) before Income Taxes and Minority Interests (204,139) 6,139 40,880 (238,429) (466,187) (5,012,763)
Net Income (Loss) (125,815) 4,397 19,401 (376,076) (545,347) (5,863,946)
Net Assets 1,048,447 1,065,860 1,048,645 645,120 134,837 1,449,860
Total Assets 2,688,721 2,836,255 2,885,678 2,614,135 2,087,763 22,449,065
Capital Investment 260,337 215,781 172,553 118,899 82,458 886,645
R&D Expenditures 195,525 166,507 173,983 154,798 137,936 1,483,183
Per Share of Common Stock (yen and U.S. dollars)
Net income (loss) (114.33) 4.00 17.63 (341.78) (489.83) (5.27)
Cash dividends 21.00 17.00 17.00 10.00 0.00 0.00
Net assets 944.24 949.19 932.46 568.83 106.90 1.15
Return on Equity (ROE) (11.1%) 0.4% 1.9% (45.5%) (145.3%) —
Number of Shares Outstanding (thousands of shares) 1,100,480 1,100,414 1,100,346 1,100,324 1,166,224 —
Number of Employees 54,144 53,999 55,580 56,756 50,647 —
Financial Highlights
Financial HighlightsSharp Corporation and Consolidated SubsidiariesYears Ended March 31

We will realize full “recovery and growth”
by steadily implementing
our Medium-Term Management Plan.
2 SHARP CORPORATION Annual Report 2013 3
Kozo Takahashi
April 1980 Joined Sharp Corporation
September 2008 Executive Officer;
Group General Manager, Health and Environment Sys-
tems Group
April 2010 Executive Managing Officer;
Group General Manager, North and South America
Group
April 2012 Executive Vice President;
Chief Officer, Sales and Marketing;
Group General Manager, Global Business Group
June 2012 Representative Director and Executive Vice President;
Chief Officer, Sales and Marketing;
Group General Manager, Global Business Group
July 2012 Representative Director and Executive Vice President;
Chief Officer, Products Business;
Group General Manager, Global Business Group
April 2013 Representative Director and Executive Vice President;
Chief Officer, Products Business Group
June 2013 President of Sharp Corporation
In fiscal 2012, ended March 31, 2013, the Japanese economy
showed signs of a partial recovery toward the end of the fiscal
year in the form of a rebound in stock prices and an improve-
ment in the export environment due to the yen’s depreciation.
However, overall conditions remained severe, with prolonged
deflation, weak business investment and stagnant employment
situation. Economies overseas remained deeply uncertain amid
the European financial crisis and a slowdown in the growth of
China and emerging countries, although the U.S. economy con-
tinued to be in moderate recovery.
Amid these circumstances, Sharp has worked to create dis-
tinctive devices and original products that meet our custom-
ers’ needs. These efforts include reinforcing mass-production
of IGZO LCDs, launching smartphones and tablet terminals
equipped with IGZO LCDs, and enhancing sales of Black Solar
high-efficiency solar cells. In addition, Sharp Corporation issued
new shares via third-party allotments under the “Capital/Busi-
ness Alliance Agreement with Qualcomm Incorporated for the
Joint Development of Next Generation MEMS*1 Display” and
“Strengthening of Alliance with Samsung Electronics for Liquid
Crystal Business.” We have also taken measures to improve fi-
nancial performance on a company-wide basis, including reduc-
tions in inventories as well as slashing fixed costs centering on
labor costs.
As a result, we were able to return to profitability at the oper-
ating level in the second half of fiscal 2012. However, for the full
year, Sharp recorded a substantial operating loss and net loss,
continuing the trend of the last fiscal year. This is due mainly
to a narrower gross margin caused by intensified competition,
restructuring charges recorded as an extraordinary item in other
expenses, and a reversal of deferred tax assets.
As for the ¥360.0 billion syndicated loan due in June 2013,
Sharp secured an agreement for an extension with its two main
banks, Mizuho Corporate Bank, Ltd.*2 and The Bank of Tokyo-
Mitsubishi UFJ, Ltd., as well as other participating banks. In ad-
dition, we have made an agreement with our main banks on an
additional borrowing facility of ¥150.0 billion to prepare for the
redemption of 20th unsecured convertible bonds with subscrip-
tion rights to shares, due on September 30, 2013.
In order to expand our corporate value so that it enhances
common benefits for our shareholders, we should continuously
strive to solidify our financial foundation and create innovative
products and services in accordance with client needs by making
full use of our advanced electronics technologies.
Based on this vision, we have developed our Medium-Term
Management Plan, aiming to become a new Sharp that achieves
stable growth in profits and steady cash generation. In this Me-
dium-Term Management Plan, we define fiscal 2013, the plan’s
first year, as the Restructuring Stage and fiscal 2014 and 2015
as the Re-growth Stage, where we step up efforts to realize full
“recovery and growth.”
In order to accomplish our goals, we will press forward with
the three basic strategies below.
1. Shift to “advantageous markets and fields”
2. Exit closed innovation and aggressively utilize alliances
3. Strengthen execution capabilities through governance sys-
tem innovation
To be specific, we will push ahead with such five strategic
measures as “Restructuring our Business Portfolio,” “Improv-
ing the Profitability of our LCD Business,” “Expanding Overseas
Businesses Focusing on the ASEAN Market,” “Reducing Fixed
Costs by Reforming our Cost Structure,” and “Improving our
Financial Position,” thus raising our corporate value going for-
ward.
In addition, we will work to take steps to expand our CSR
activities company-wide, helping to preserve the global environ-
ment and enforcing compliance in business management to
raise our corporate value. We look forward to your ongoing sup-
port and encouragement.
*1 Micro Electro Mechanical System*2 Its trade name as of June 2013
Message to our Shareholders
Message to our Shareholders
Message to our Shareholders
July 2013
President

For Recovery and Growth
Sharp’s business philosophy and business creed embody a spirit that is unchanged since its founda-
tion, such as sincerity, harmony, politeness, creativity, courage, and not seeking merely to expand
on business volume. In the course of broadening the scope of our operations, we lost sight of this
spirit and became overwhelmed by the inefficient corporate culture peculiar to large companies,
characterized by a declining spirit of challenge, loss of customer focus, and arrogance. We believe
that these factors are behind our current business stagnation. As we implement our Medium-Term
Management Plan, we will create a new Sharp with the mindset to change everything other than
our business philosophy and business creed.
4 SHARP CORPORATION Annual Report 2013 5
Medium
-Term M
anagement Plan for Fiscal 2013-2015: For Recovery and G
rowth
FY2012 (2H) FY2013 FY2014 FY2015
Operating income surplus(Accomplished)
Net incomesurplus
Strengthenprofitability
Operating incomeratio 5%
Restructuring StageRe-growth Stage
Phase I Phase IIRecovery and
Growth (Return to
bond market)
1Shift to “advantageous markets and fields” 2Exit closed innovation
and aggressively utilize alliances
3Strengthen execution capabilities through governance system
innovation
In the Medium-Term Management Plan, we position fiscal 2013 as the Restruc-
turing Stage and fiscal 2014–2015 as the Re-growth Stage.
Sharp aims to achieve “recovery and growth” by implementing the Medium-
Term Management Plan based on the following three basic strategies.
For Recovery and GrowthMedium-Term Management Plan for Fiscal 2013–2015
Targeted goals
Under the Medium-Term Management Plan, our first goal is to achieve a net income surplus in fiscal 2013, the first year of the plan. In
fiscal 2015, the final year of the plan, our targets are net sales of ¥3.0 trillion, operating income of ¥150.0 billion, net income of ¥80.0
billion, and an operating income ratio of 5%.
Targeted Goals and Five Strategic Measures
By implementing our five strategic measures,we will seek to achieve an operating income ratio of 5% in fiscal 2015.
Five strategic measures
Guided by its three basic strategies, Sharp will implement the following five strategic measures to realize “recovery and growth.”
(1) Restructuring our business portfolio
(2) Improving the profitability of our LCD business
(3) Expanding overseas businesses focusing on the ASEAN market
(4) Reducing fixed costs by reforming our cost structure
(5) Improving our financial position
Numerical Targets of the Medium-Term Management Plan (billions of yen)
FY2012 2H Result FY2013 Forecast FY2014 Plan FY2015 Plan
Net Sales(Year on Year)
1,374.4(+20.4%)
2,700.0(+8.9%)
2,820.0(+4.4%)
3,000.0 (+6.4%)
Operating Income(Ratio)
22.6(1.6%)
80.0(3.0%)
110.0(3.9%)
150.0(5.0%)
Net Income(Ratio)
-157.7 (-11.5%)
5.0 (0.2%)
40.0 (1.4%)
80.0 (2.7%)
Medium
-Term M
anagement Plan for Fiscal 2013-2015: For Recovery and G
rowth

Shift to Value Markets (Compete in Advantageous Fields)
Competition
BtoC BusinessDigital
informationequipment
(Audio-Visual)
Small- andmedium-size/
large-sizeLCDs Electronic
devices
Fluctuation risk in profitabilityHigh
Communi-cation
systems
Communi-cation
systems Health andenvironment
Solarcells
Solarcells
Businesssolutions BtoB Business
Device Business
Global Value MarketAdded value for each customer
type can be pursued
Global Scale-Driven MarketScale-driven competitiveness
is required
Regional Value MarketLocal adaptation for
each region is required
Prod
uct
Device
Small- andmedium-size
LCDs
Electronicdevices
Low
Shift to High Added-Value Zones
Representative applications
Directionof actions
Directionof actions
Directionof actions
Representative applications
Representative applications
• LCD TVs (volume zone)
• Smartphones (high-end) • Industrial/car applications
Expand orders with our high resolution and high technology models
Fluctuation risk in profitabilityLow
Low High
High
Profitability
Contributes to differentia-tion of customers via swift response at early-stage concept design
• Smartphones (volume zone)• Ultrabook™, tablet terminals
Control volatility with strategic alliances with large clients
6 SHARP CORPORATION Annual Report 2013 7
Medium
-Term M
anagement Plan for Fiscal 2013-2015: For Recovery and G
rowth
Medium
-Term M
anagement Plan for Fiscal 2013-2015: For Recovery and G
rowth
Five Strategic Measures to Realize Recovery and Growth
1 Restructuring our Business PortfolioSharp will expand its business in advantageous fields while controlling fluctuation risk in profitability. 2 Improving the Profitability of our LCD Business
Sharp will step up initiatives in high added-value zones and increase sales by expanding transactions with major clients.
(1) Shift to value markets
(2) Directions of innovation on each business
(1) Stepped-up initiatives in high added-value zones
(2) Increase sales by expanding transactions with major clients
The shift to high added-value zones (see diagram at right) illus-
trates how Sharp intends to improve the profitability of its LCD
business. The vertical axis shows fluctuation risk in profitability
and the horizontal axis shows profitability.
The bottom left quadrant, represented by LCD panels for TVs,
is a low-profitability, highly volatile domain, impacted by falling
prices stemming from commoditization, as well as LCD panel
supply/demand balance issues.
We will work to improve profitability and reduce profit volatil-
ity risk by expanding the ratio of our sales in high added-value
zones, which encompasses LCDs for high-end smartphones, in-
dustrial equipment, and car use, where we have a technological
advantage. This domain offers the best match for our product
lineup and technological prowess, including IGZO, so we will
strive to cultivate new customers and applications in order to
achieve business stability.
In the LCD business, Sharp will target steady sales growth and
reduced fluctuation risk in profitability.
To this end, we aim to increase sales by continuously expand-
ing transactions with existing major clients (red in the bar chart
on the right) and developing new major accounts in fiscal 2013
and onwards through product development and marketing ac-
tivities from customer’s viewpoint.
Going forward, we plan to elevate the ratio of sales to major
clients in total LCD sales to the level of 50% plus, with the aim of
growing this business while ensuring the expansion of sales and
the minimization of fluctuation risk in profitability.
When considering medium- and long-term growth strategies,
Sharp identified three markets from the perspective of “differ-
ences in competitive environment.”
Global Scale-Driven Market
Scale-driven competitiveness on a global basis is required
Global Value Market
Added value for each customer type can be pursued on a
global scale
Regional Value Market
Local adaptation for each region is required
Digital consumer electronics, such as LCD TVs, and commod-
ity-type devices is a business domain where dominant business
scale in the global market is a key competitive determinant.
Sharp will seek to rebuild its business portfolio by shifting from
this “global scale-driven market” to “value markets” in which a
variety of winning methods exist.
We will minimize fluctuation risk in sales and profits and in-
crease operational stability by allocating core management re-
sources mainly toward “advantageous business domains (tech-
nologies, fields, and regions)” in which we are strong, such as
shifting to high value-added zones including IGZO and MEMS,
and expanding our presence in the domestic solar cell market,
where we have a robust business foundation.
Under the Medium-Term Management Plan, Sharp will under-
take a widespread reassessment of its entire operations with the
aim of concentrating management resources on fields and mar-
kets that it has identified as advantageous.
An urgent priority is to improve the profitability of our TV busi-
ness in Europe, Blu-ray Disc recorder/player businesses, and solar
cell businesses in Europe and the U.S. Here, we will formulate
drastic measures going forward.
Five Strategic Measures to Realize Recovery and Growth
Sales Growth by Expanding Transactions withMajor Clients (Plan)
0
200
400
600
800
1,000
1,200(billions of yen)
LCD
business sales
(Fiscal years) 12 13 14 15
Currentmajorclients
Newmajorclients
Other

Overseas Sales Compositionby Region (Products Business Group)
Strengthen Initiatives at Indonesian Business
FY2012
TVs Refrigerators Washingmachines
Airconditioners
No.1 No.1 No.1 No.2
Sharp’s Position in Indonesian Market Population Ratio byASEAN Member
Sharp’s Business Development in IndonesiaTo structure the most powerful value chain for local production for local consumption
30% 36% 30% 20%
Planning Development Production Marketing
Develop an Indonesian-type business model in other nations and regions
Indonesia-completingstructure already in place
(focusing on creatinglocal-fit products)
New plantoperation
start (2013)
No. 1 servicenetwork inthe industry(352 bases)
2012 market shares (Source: Sharp)
Sales Service
Strong relations with retailers
• No. 1 sales channel coverage (81%)
• Unique marketing utilizing an industry-leading brand
Asia
21%
2011
Indonesia
40.5%Middle East/Africa
ChinaThe Americas
Europe
FY2015
Asia
31%
Middle East/AfricaChina
The Americas
Europe
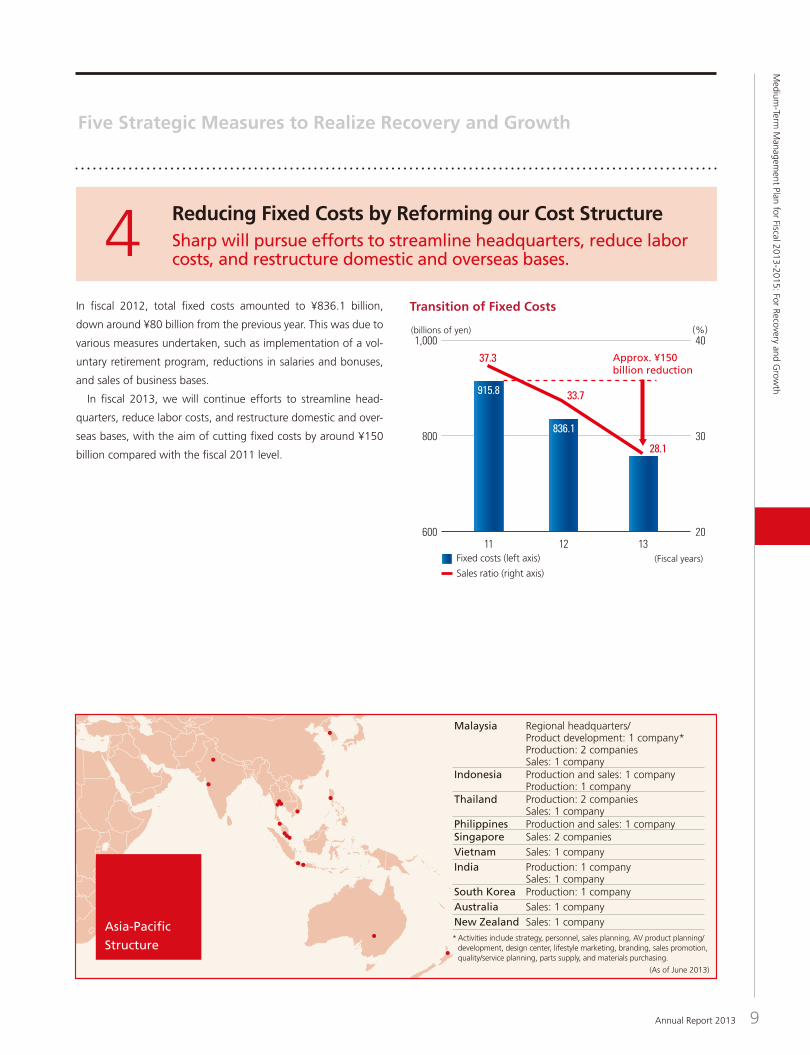
Transition of Fixed Costs
11 12 13
(billions of yen) (%)
(Fiscal years)
Approx. ¥150billion reduction
37.3
33.7
28.1
Fixed costs (left axis) Sales ratio (right axis)
600
800
1,000
20
30
40
915.8
836.1
Malaysia Regional headquarters/Product development: 1 company*Production: 2 companiesSales: 1 company
Indonesia Production and sales: 1 companyProduction: 1 company
Thailand Production: 2 companiesSales: 1 company
Philippines Production and sales: 1 companySingapore Sales: 2 companies
Vietnam Sales: 1 company
India Production: 1 companySales: 1 company
South Korea Production: 1 company
Australia Sales: 1 company
New Zealand Sales: 1 company
* Activities include strategy, personnel, sales planning, AV product planning/development, design center, lifestyle marketing, branding, sales promotion, quality/service planning, parts supply, and materials purchasing.
Asia-Pacific
Structure
(As of June 2013)
8 SHARP CORPORATION Annual Report 2013 9
Medium
-Term M
anagement Plan for Fiscal 2013-2015: For Recovery and G
rowth
Medium
-Term M
anagement Plan for Fiscal 2013-2015: For Recovery and G
rowth
3Expanding Overseas Businesses Focusing on the ASEAN MarketSharp will strategically allocate core management resources to regions in which it can demonstrate its competitive strengths.
4 Reducing Fixed Costs by Reforming our Cost StructureSharp will pursue efforts to streamline headquarters, reduce labor costs, and restructure domestic and overseas bases.
In our overseas business, we will strategically allocate core man-
agement resources to regions in which we can demonstrate our
competitive strengths.
In the ASEAN region, where economic growth has been ro-
bust in recent years, we have sales operations in six nations and
production facilities in four.
We will step up initiatives in the region with the aim of raising
the ratio of Asian sales to total Products Business Group* sales from
21% in fiscal 2012 to 31% in fiscal 2015. This will propel Asia to the
top regional spot in Sharp’s overseas sales, surpassing the Americas.
In Indonesia, which accounts for around 40% of ASEAN’s
population and is expected to see strong economic growth in
the future, Sharp holds the No. 1 market share for TVs, refrig-
erators and washing machines, and the No. 2 share for air con-
ditioners. The source of our competitive edges lies in our value
chain, which is the strongest in Indonesia, including our locally
driven product development, rock-solid relationships with retail-
ers and the No. 1 service network in the industry.
To address flourishing demand, Sharp fast-tracked the open-
ing of a new plant in Indonesia to manufacture washing ma-
chines and refrigerators. Originally scheduled for late fiscal
2013, the new plant opened in September 2013. In this way, we
will accelerate the pace of business expansion and build a robust
market foundation.
Going forward, Sharp will work to replicate its success in Indo-
nesia across various ASEAN nations, including Thailand where it
has a white goods plant, in order to expand its business region-
wide and boost its market share.
* Businesses which do not include LCDs and Other Electronic Devices
In fiscal 2012, total fixed costs amounted to ¥836.1 billion,
down around ¥80 billion from the previous year. This was due to
various measures undertaken, such as implementation of a vol-
untary retirement program, reductions in salaries and bonuses,
and sales of business bases.
In fiscal 2013, we will continue efforts to streamline head-
quarters, reduce labor costs, and restructure domestic and over-
seas bases, with the aim of cutting fixed costs by around ¥150
billion compared with the fiscal 2011 level.
Five Strategic Measures to Realize Recovery and Growth Five Strategic Measures to Realize Recovery and Growth
Overseas Sales Compositionby Region (Products Business Group)
Strengthen Initiatives at Indonesian Business
FY2012
TVs Refrigerators Washingmachines
Airconditioners
No.1 No.1 No.1 No.2
Sharp’s Position in Indonesian Market Population Ratio byASEAN Member
Sharp’s Business Development in IndonesiaTo structure the most powerful value chain for local production for local consumption
30% 36% 30% 20%
Planning Development Production Marketing
Develop an Indonesian-type business model in other nations and regions
Indonesia-completingstructure already in place
(focusing on creatinglocal-fit products)
New plantoperation
start (2013)
No. 1 servicenetwork inthe industry(352 bases)
2012 market shares (Source: Sharp)
Sales Service
Strong relations with retailers
• No. 1 sales channel coverage (81%)
• Unique marketing utilizing an industry-leading brand
Asia
21%
2011
Indonesia
40.5%Middle East/Africa
ChinaThe Americas
Europe
FY2015
Asia
31%
Middle East/AfricaChina
The Americas
Europe
Transition of Fixed Costs
11 12 13
(billions of yen) (%)
(Fiscal years)
Approx. ¥150billion reduction
37.3
33.7
28.1
Fixed costs (left axis) Sales ratio (right axis)
600
800
1,000
20
30
40
915.8
836.1
Malaysia Regional headquarters/Product development: 1 company*Production: 2 companiesSales: 1 company
Indonesia Production and sales: 1 companyProduction: 1 company
Thailand Production: 2 companiesSales: 1 company
Philippines Production and sales: 1 companySingapore Sales: 2 companies
Vietnam Sales: 1 company
India Production: 1 companySales: 1 company
South Korea Production: 1 company
Australia Sales: 1 company
New Zealand Sales: 1 company
* Activities include strategy, personnel, sales planning, AV product planning/development, design center, lifestyle marketing, branding, sales promotion, quality/service planning, parts supply, and materials purchasing.
Asia-Pacific
Structure
(As of June 2013)
8 SHARP CORPORATION Annual Report 2013 9
Medium
-Term M
anagement Plan for Fiscal 2013-2015: For Recovery and G
rowth
Medium
-Term M
anagement Plan for Fiscal 2013-2015: For Recovery and G
rowth
3Expanding Overseas Businesses Focusing on the ASEAN MarketSharp will strategically allocate core management resources to regions in which it can demonstrate its competitive strengths.
4 Reducing Fixed Costs by Reforming our Cost StructureSharp will pursue efforts to streamline headquarters, reduce labor costs, and restructure domestic and overseas bases.
In our overseas business, we will strategically allocate core man-
agement resources to regions in which we can demonstrate our
competitive strengths.
In the ASEAN region, where economic growth has been ro-
bust in recent years, we have sales operations in six nations and
production facilities in four.
We will step up initiatives in the region with the aim of raising
the ratio of Asian sales to total Products Business Group* sales from
21% in fiscal 2012 to 31% in fiscal 2015. This will propel Asia to the
top regional spot in Sharp’s overseas sales, surpassing the Americas.
In Indonesia, which accounts for around 40% of ASEAN’s
population and is expected to see strong economic growth in
the future, Sharp holds the No. 1 market share for TVs, refrig-
erators and washing machines, and the No. 2 share for air con-
ditioners. The source of our competitive edges lies in our value
chain, which is the strongest in Indonesia, including our locally
driven product development, rock-solid relationships with retail-
ers and the No. 1 service network in the industry.
To address flourishing demand, Sharp fast-tracked the open-
ing of a new plant in Indonesia to manufacture washing ma-
chines and refrigerators. Originally scheduled for late fiscal
2013, the new plant opened in September 2013. In this way, we
will accelerate the pace of business expansion and build a robust
market foundation.
Going forward, Sharp will work to replicate its success in Indo-
nesia across various ASEAN nations, including Thailand where it
has a white goods plant, in order to expand its business region-
wide and boost its market share.
* Businesses which do not include LCDs and Other Electronic Devices
In fiscal 2012, total fixed costs amounted to ¥836.1 billion,
down around ¥80 billion from the previous year. This was due to
various measures undertaken, such as implementation of a vol-
untary retirement program, reductions in salaries and bonuses,
and sales of business bases.
In fiscal 2013, we will continue efforts to streamline head-
quarters, reduce labor costs, and restructure domestic and over-
seas bases, with the aim of cutting fixed costs by around ¥150
billion compared with the fiscal 2011 level.
Five Strategic Measures to Realize Recovery and Growth Five Strategic Measures to Realize Recovery and Growth

Healthcare/Medical Services
High-sensitivity sensors forinitial diagnosis in healthcare Sensing
CompoundSemiconductor
Robotics Workload-reducing robots MechatronicsMovie/Picture
Processing
Smart Home/Mobility/Office
Information services utilizing Sharpproducts (power saving, observation, etc.)
EnergyConversion
Device Connection/Communication
Safety and Security of Food/Water/Air
Plant factories and environmental sensorsto support safe and secure lifestyles
CleanTechnology Light Control
EducationTablet terminals and BIG PAD to promote
IT solutions in the education field DisplayUser
Interface
Foods
Chemicals
Automotive Parts
DIY
Home Facilities
MedicalEquipment
CommunicationInfrastructure
Transportation
Real Estate
University/Hospital
Partners/CollaboratorsMain Applied TechnologiesImmediate Targets
…
Optimization of Inventory Level
0
300
600
1
2
3
(billions of yen)(months)
11 12 13
Minimization of Capital Investment
0
50
100
150
2
3
4
5
(billions of yen)(%)
11 12 13
Cutting Down on Interest-Bearing Debt
0
300
600
900
1,200
(billions of yen)
11 12 13
(Fiscal year-ends)
(Fiscal year-ends)
(Fiscal years)
527.4
310.72.58
1.501.40
Inventories (left axis)
Inventory ratio against monthly turnover (right axis)
118.8
82.4
4.8
3.33.0
LCD-related investments (left axis)
Non-LCD-related investments (left axis)
Ratio of sales to capital investment (right axis)
Loans from financial institutions Commercial paper
Convertible bonds Straight bonds
1,127.1 1,174.4
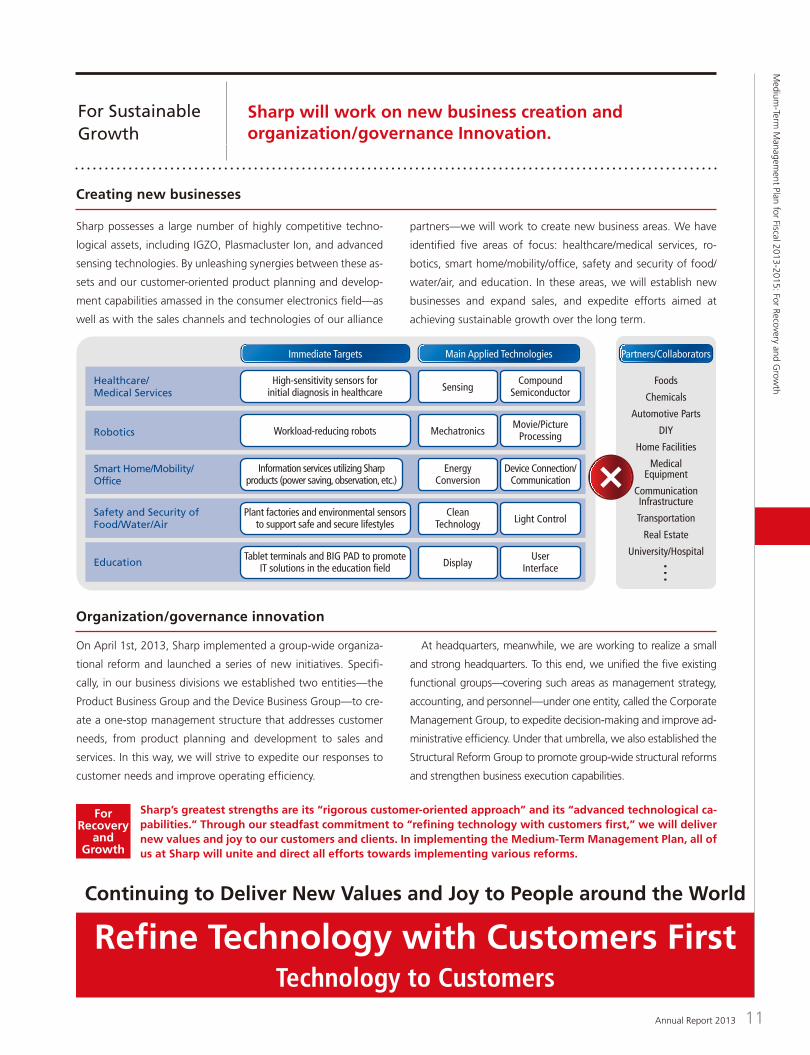
Sharp’s greatest strengths are its “rigorous customer-oriented approach” and its “advanced technological ca-pabilities.” Through our steadfast commitment to “refining technology with customers first,” we will deliver new values and joy to our customers and clients. In implementing the Medium-Term Management Plan, all of us at Sharp will unite and direct all efforts towards implementing various reforms.
For Recovery
and Growth
Continuing to Deliver New Values and Joy to People around the World
Refine Technology with Customers FirstTechnology to Customers
10 SHARP CORPORATION Annual Report 2013 11
Medium
-Term M
anagement Plan for Fiscal 2013-2015: For Recovery and G
rowth
Medium
-Term M
anagement Plan for Fiscal 2013-2015: For Recovery and G
rowth
5 Improving our Financial PositionSharp will seek to optimize inventory levels, reduce capital investment, and cut interest-bearing debt.
(1) Optimization of inventory level
At the end of fiscal 2011, inventories amounted to ¥527.4 bil-
lion, for an inventory ratio against monthly turnover of 2.58
months, which was a high level. Thanks for rigorous efforts to
optimize inventory levels, however, inventories at fiscal 2012
year-end fell to ¥310.7 billion, for an inventory ratio against
monthly turnover of 1.50 months.
In fiscal 2013 and beyond, we will continue working to opti-
mize inventory level and thus enhance financial efficiency.
(2) Minimization of capital investment
We will dramatically reduce capital investment in LCDs where we
made an enormous investment in the past, by utilizing not only
our own plants but also other companies’ facilities in a flexible
manner.
In fiscal 2013 and thereafter, while limiting capital investment
to essential outlays to production and sales such as mold and
masks, we will pursue an efficient investment by primarily in-
vesting in new fields earmarked for future growth as well as the
human resource, technology, and marketing fields.
(3) Cutting down on interest-bearing debt
At the end of fiscal 2012, total interest-bearing debt stood at
¥1,174.4 billion, up ¥47.3 billion over the previous year.
Accompanying a shift from direct to indirect financing, the
levels of bonds and commercial paper have declined while loans
from financial institutions have increased.
In addition to minimizing capital investment, we will opti-
mize inventories and noncurrent assets as a means of address-
ing bonds redemptions. As for loan from financial institutions,
meanwhile, we will make proper repayments as we work to
steadily cut interest-bearing debt.
For Sustainable Growth
Sharp will work on new business creation and organization/governance Innovation.
Five Strategic Measures to Realize Recovery and Growth
Creating new businesses
On April 1st, 2013, Sharp implemented a group-wide organiza-
tional reform and launched a series of new initiatives. Specifi-
cally, in our business divisions we established two entities—the
Product Business Group and the Device Business Group—to cre-
ate a one-stop management structure that addresses customer
needs, from product planning and development to sales and
services. In this way, we will strive to expedite our responses to
customer needs and improve operating efficiency.
Organization/governance innovation
At headquarters, meanwhile, we are working to realize a small
and strong headquarters. To this end, we unified the five existing
functional groups—covering such areas as management strategy,
accounting, and personnel—under one entity, called the Corporate
Management Group, to expedite decision-making and improve ad-
ministrative efficiency. Under that umbrella, we also established the
Structural Reform Group to promote group-wide structural reforms
and strengthen business execution capabilities.
Sharp possesses a large number of highly competitive techno-
logical assets, including IGZO, Plasmacluster Ion, and advanced
sensing technologies. By unleashing synergies between these as-
sets and our customer-oriented product planning and develop-
ment capabilities amassed in the consumer electronics field—as
well as with the sales channels and technologies of our alliance
partners—we will work to create new business areas. We have
identified five areas of focus: healthcare/medical services, ro-
botics, smart home/mobility/office, safety and security of food/
water/air, and education. In these areas, we will establish new
businesses and expand sales, and expedite efforts aimed at
achieving sustainable growth over the long term.
Healthcare/Medical Services
High-sensitivity sensors forinitial diagnosis in healthcare Sensing
CompoundSemiconductor
Robotics Workload-reducing robots MechatronicsMovie/Picture
Processing
Smart Home/Mobility/Office
Information services utilizing Sharpproducts (power saving, observation, etc.)
EnergyConversion
Device Connection/Communication
Safety and Security of Food/Water/Air
Plant factories and environmental sensorsto support safe and secure lifestyles
CleanTechnology Light Control
EducationTablet terminals and BIG PAD to promote
IT solutions in the education field DisplayUser
Interface
Foods
Chemicals
Automotive Parts
DIY
Home Facilities
MedicalEquipment
CommunicationInfrastructure
Transportation
Real Estate
University/Hospital
Partners/CollaboratorsMain Applied TechnologiesImmediate Targets
…
Optimization of Inventory Level
0
300
600
1
2
3
(billions of yen)(months)
11 12 13
Minimization of Capital Investment
0
50
100
150
2
3
4
5
(billions of yen)(%)
11 12 13
Cutting Down on Interest-Bearing Debt
0
300
600
900
1,200
(billions of yen)
11 12 13
(Fiscal year-ends)
(Fiscal year-ends)
(Fiscal years)
527.4
310.72.58
1.501.40
Inventories (left axis)
Inventory ratio against monthly turnover (right axis)
118.8
82.4
4.8
3.33.0
LCD-related investments (left axis)
Non-LCD-related investments (left axis)
Ratio of sales to capital investment (right axis)
Loans from financial institutions Commercial paper
Convertible bonds Straight bonds
1,127.1 1,174.4
Optimization of Inventory Level
0
300
600
1
2
3
(billions of yen)(months)
11 12 13
Minimization of Capital Investment
0
50
100
150
2
3
4
5
(billions of yen)(%)
11 12 13
Cutting Down on Interest-Bearing Debt
0
300
600
900
1,200
(billions of yen)
11 12 13
(Fiscal year-ends)
(Fiscal year-ends)
(Fiscal years)
527.4
310.72.58
1.501.40
Inventories (left axis)
Inventory ratio against monthly turnover (right axis)
118.8
82.4
4.8
3.33.0
LCD-related investments (left axis)
Non-LCD-related investments (left axis)
Ratio of sales to capital investment (right axis)
Loans from financial institutions Commercial paper
Convertible bonds Straight bonds
1,127.1 1,174.4
Optimization of Inventory Level
0
300
600
1
2
3
(billions of yen)(months)
11 12 13
Minimization of Capital Investment
0
50
100
150
2
3
4
5
(billions of yen)(%)
11 12 13
Cutting Down on Interest-Bearing Debt
0
300
600
900
1,200
(billions of yen)
11 12 13
(Fiscal year-ends)
(Fiscal year-ends)
(Fiscal years)
527.4
310.72.58
1.501.40
Inventories (left axis)
Inventory ratio against monthly turnover (right axis)
118.8
82.4
4.8
3.33.0
LCD-related investments (left axis)
Non-LCD-related investments (left axis)
Ratio of sales to capital investment (right axis)
Loans from financial institutions Commercial paper
Convertible bonds Straight bonds
1,127.1 1,174.4
Sharp’s greatest strengths are its “rigorous customer-oriented approach” and its “advanced technological ca-pabilities.” Through our steadfast commitment to “refining technology with customers first,” we will deliver new values and joy to our customers and clients. In implementing the Medium-Term Management Plan, all of us at Sharp will unite and direct all efforts towards implementing various reforms.
For Recovery
and Growth
Continuing to Deliver New Values and Joy to People around the World
Refine Technology with Customers FirstTechnology to Customers
10 SHARP CORPORATION Annual Report 2013 11
Medium
-Term M
anagement Plan for Fiscal 2013-2015: For Recovery and G
rowth
Medium
-Term M
anagement Plan for Fiscal 2013-2015: For Recovery and G
rowth
5 Improving our Financial PositionSharp will seek to optimize inventory levels, reduce capital investment, and cut interest-bearing debt.
(1) Optimization of inventory level
At the end of fiscal 2011, inventories amounted to ¥527.4 bil-
lion, for an inventory ratio against monthly turnover of 2.58
months, which was a high level. Thanks for rigorous efforts to
optimize inventory levels, however, inventories at fiscal 2012
year-end fell to ¥310.7 billion, for an inventory ratio against
monthly turnover of 1.50 months.
In fiscal 2013 and beyond, we will continue working to opti-
mize inventory level and thus enhance financial efficiency.
(2) Minimization of capital investment
We will dramatically reduce capital investment in LCDs where we
made an enormous investment in the past, by utilizing not only
our own plants but also other companies’ facilities in a flexible
manner.
In fiscal 2013 and thereafter, while limiting capital investment
to essential outlays to production and sales such as mold and
masks, we will pursue an efficient investment by primarily in-
vesting in new fields earmarked for future growth as well as the
human resource, technology, and marketing fields.
(3) Cutting down on interest-bearing debt
At the end of fiscal 2012, total interest-bearing debt stood at
¥1,174.4 billion, up ¥47.3 billion over the previous year.
Accompanying a shift from direct to indirect financing, the
levels of bonds and commercial paper have declined while loans
from financial institutions have increased.
In addition to minimizing capital investment, we will opti-
mize inventories and noncurrent assets as a means of address-
ing bonds redemptions. As for loan from financial institutions,
meanwhile, we will make proper repayments as we work to
steadily cut interest-bearing debt.
For Sustainable Growth
Sharp will work on new business creation and organization/governance Innovation.
Five Strategic Measures to Realize Recovery and Growth
Creating new businesses
On April 1st, 2013, Sharp implemented a group-wide organiza-
tional reform and launched a series of new initiatives. Specifi-
cally, in our business divisions we established two entities—the
Product Business Group and the Device Business Group—to cre-
ate a one-stop management structure that addresses customer
needs, from product planning and development to sales and
services. In this way, we will strive to expedite our responses to
customer needs and improve operating efficiency.
Organization/governance innovation
At headquarters, meanwhile, we are working to realize a small
and strong headquarters. To this end, we unified the five existing
functional groups—covering such areas as management strategy,
accounting, and personnel—under one entity, called the Corporate
Management Group, to expedite decision-making and improve ad-
ministrative efficiency. Under that umbrella, we also established the
Structural Reform Group to promote group-wide structural reforms
and strengthen business execution capabilities.
Sharp possesses a large number of highly competitive techno-
logical assets, including IGZO, Plasmacluster Ion, and advanced
sensing technologies. By unleashing synergies between these as-
sets and our customer-oriented product planning and develop-
ment capabilities amassed in the consumer electronics field—as
well as with the sales channels and technologies of our alliance
partners—we will work to create new business areas. We have
identified five areas of focus: healthcare/medical services, ro-
botics, smart home/mobility/office, safety and security of food/
water/air, and education. In these areas, we will establish new
businesses and expand sales, and expedite efforts aimed at
achieving sustainable growth over the long term.

12 SHARP CORPORATION Annual Report 2013 13
Sales(billions of yen) (billions of yen)
(billions of yen) (billions of yen)Total Assets
Oprating Income (Loss)
Capital Investment
090
1,000
2,000
10 11 12 13 09-200
-100
0
100
10 11 12 13
090
1,000
500
1,500
10 11 12 13 090
100
200
300
10 11 12 13
(billions of yen) (billions of yen)
(billions of yen) (billions of yen)
Sales
Total Assets
Oprating Income (Loss)
Capital Investment
09 10 11 12 13 09 10 11 12 13
09 10 11 12 13 09 10 11 12 130
100
200
300
-200
-100
0
100
0
1,000
500
1,500
0
1,000
2,000
Segment O
utline
エレクトロニクス機器
電子部品
売上高
総資産
設備投資
Consumer/Information Products
Electronic Components
Sales
Total Assets
Capital Investment
49.3%50.7%
36.9%63.1%
25.3%
74.7%
49.3%50.7%
36.9%
63.1%
25.3%
74.7%
• Sales figures shown on pages 12-13 include internal sales be-tween segments (Consumer/Information Products and Electronic Components). The percentage of sales in the pie chart has been calculated accordingly.
• Operating income (loss) figures shown on page 13 are the amounts before adjustment of intersegment trading.
• Total assets figures shown on pages 12-13 are the amounts be-fore adjustment of intersegment trading. The percentage of total assets in the pie chart has been calculated accordingly.
• Capital investment figures shown on pages 12-13 include the amounts of leased properties, and do not include unallocated capital investments. The percentage of capital investment in the pie chart has been calculated accordingly.
• Effective for the year ended March 31, 2011, the Company has applied the “Accounting Standard for Disclosures about Seg-ments of an Enterprise and Related Information” (Accounting Standards Board of Japan (ASBJ) Statement No. 17, issued by the ASBJ on March 27, 2009) and the “Guidance on Accounting Standard for Disclosures about Segments of an Enterprise and Related Information” (ASBJ Guidance No. 20, issued by the ASBJ on March 21, 2008). In this connection, sales, operating income (loss) and total assets for 2010 shown on page 13 have been restated to conform with the 2011 presentation.
Consumer/Information Products
Main ProductsLCD color televisions, color televisions, projec-tors, Blu-ray Disc recorders, Blu-ray Disc players, mobile phones, tablet terminals, electronic dic-tionaries, calculators, facsimiles, telephones
Audio-Visual and Communication Equipment
Main ProductsRefrigerators, superheated steam ovens, micro-wave ovens, small cooking appliances, air condi-tioners, washing machines, vacuum cleaners, air purifiers, electric fans, dehumidifiers, humidifiers, Plasmacluster Ion generators, electric heaters, beauty appliances, LED lights, solar-powered LED lights, network control units
Health and Environmental Equipment
Main ProductsPOS systems, handy data terminals, electronic cash registers, information displays, digital MFPs (multi-function printers), options and consuma-bles, software, FA equipment, ultrasonic clean-ers
Information Equipment
Main ProductsAmorphous silicon LCD modules, IGZO LCD modules, CG-Silicon LCD modules
LCDs
Main ProductsCrystalline solar cells, thin-film solar cells
Solar Cells
Main ProductsCCD/CMOS imagers, LSIs for LCDs, microproces-sors, flash memory, analog ICs, components for satellite broadcasting, terrestrial digital tuners, RF modules, network components, laser diodes, LEDs, optical pickups, optical sensors, compo-nents for optical communications, regulators, switching power supplies
Other Electronic Devices
Electronic Components
Segment OutlineSharp Corporation and Consolidated SubsidiariesYears Ended March 31
Segment O
utline

14 SHARP CORPORATION Annual Report 2013 15
Electronic Components
売上高構成比 営業利益(損失)(十億円)
売上高
0
300
600
900
1,200
09 10 11 12 13
(十億円)
-150
-120
-30
-60
-90
0
30
09 10 11 12 13
0
300
600
900
1,200
09 10 11 12 13-150
-120
-30
-60
-90
0
30
09 10 11 12 13
(billions of yen) (billions of yen)
Sales Operating Income (Loss)
31.2%
31.2%
Sales by Product Group
LCDs
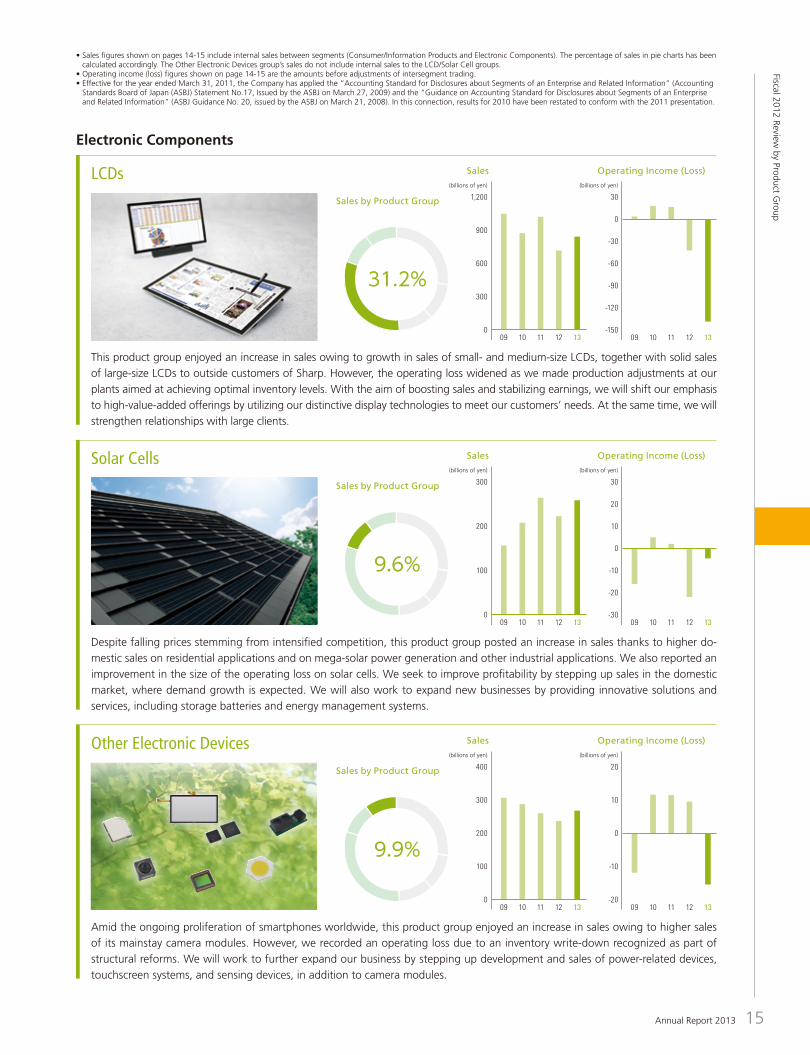
This product group enjoyed an increase in sales owing to growth in sales of small- and medium-size LCDs, together with solid sales
of large-size LCDs to outside customers of Sharp. However, the operating loss widened as we made production adjustments at our
plants aimed at achieving optimal inventory levels. With the aim of boosting sales and stabilizing earnings, we will shift our emphasis
to high-value-added offerings by utilizing our distinctive display technologies to meet our customers’ needs. At the same time, we will
strengthen relationships with large clients.
売上高構成比 営業利益(損失)(十億円)
売上高
0
100
200
300
09 10 11 12 13
(十億円)
-30
-20
-10
10
0
30
20
09 10 11 12 13
0
100
200
300
09 10 11 12 13-30
-20
-10
10
0
30
20
09 10 11 12 13
Operating Income (Loss)Sales
(billions of yen) (billions of yen)
9.6%
9.6%
Sales by Product Group
Solar Cells
Despite falling prices stemming from intensified competition, this product group posted an increase in sales thanks to higher do-
mestic sales on residential applications and on mega-solar power generation and other industrial applications. We also reported an
improvement in the size of the operating loss on solar cells. We seek to improve profitability by stepping up sales in the domestic
market, where demand growth is expected. We will also work to expand new businesses by providing innovative solutions and
services, including storage batteries and energy management systems.
Other Electronic Devices
売上高構成比 営業利益(損失)(十億円)
売上高
0
100
200
300
400
09 10 11 12 13
(十億円)
-20
-10
10
0
20
09 10 11 12 13
0
100
200
300
400
09 10 11 12 13-20
-10
10
0
20
09 10 11 12 13
Sales Operating Income (Loss)
(billions of yen) (billions of yen)
9.9%
9.9%
Sales by Product Group
Amid the ongoing proliferation of smartphones worldwide, this product group enjoyed an increase in sales owing to higher sales
of its mainstay camera modules. However, we recorded an operating loss due to an inventory write-down recognized as part of
structural reforms. We will work to further expand our business by stepping up development and sales of power-related devices,
touchscreen systems, and sensing devices, in addition to camera modules.
• Sales figures shown on pages 14-15 include internal sales between segments (Consumer/Information Products and Electronic Components). The percentage of sales in pie charts has been calculated accordingly. The Other Electronic Devices group’s sales do not include internal sales to the LCD/Solar Cell groups.
• Operating income (loss) figures shown on page 14-15 are the amounts before adjustments of intersegment trading.• Effective for the year ended March 31, 2011, the Company has applied the “Accounting Standard for Disclosures about Segments of an Enterprise and Related Information” (Accounting
Standards Board of Japan (ASBJ) Statement No.17, Issued by the ASBJ on March 27, 2009) and the “Guidance on Accounting Standard for Disclosures about Segments of an Enterprise and Related Information” (ASBJ Guidance No. 20, issued by the ASBJ on March 21, 2008). In this connection, results for 2010 have been restated to conform with the 2011 presentation.
Fiscal 2012 Review by Product G
roup
売上高構成比 営業利益(十億円)
売上高
0
100
200
300
400
09 10 11 12 13
(十億円)
0
10
20
30
40
09 10 11 12 13
0
100
200
300
400
09 10 11 12 130
10
20
30
40
09 10 11 12 13
Operating IncomeSales
(billions of yen) (billions of yen)
11.4%
11.4%
Sales by Product Group
Health and Environmental Equipment
This product group reported increases in both sales and operating income on the back of healthy demand for air conditioners, air
purifiers, and other products. We aim to continue working to broaden our business by expanding sales of products with Plasmaclus-
ter Ion and other technologies unique to Sharp and by reinforcing sales in emerging markets, centering on ASEAN nations where
we have sales and products operations in place.
Consumer/Information Products
売上高構成比 営業利益(損失)(十億円)
売上高
0
300
600
900
1,200
1,500
09 10 11 12 13
(十億円)
-60
-30
0
30
60
09 10 11 12 13
Operating Income (Loss)
(billions of yen) (billions of yen)
Sales
0
300
600
900
1,200
1,500
09 10 11 12 13-60
-30
0
30
60
09 10 11 12 13
27.0%
Sales by Product Group
27.0%
This product group posted a sales decline and widened operating loss due to lower sales of LCD TVs and mobile phones. We aim to improve
earnings with following initiatives going forward. We seek to further expand sales of large-screen LCD TVs while striving to create new de-
mand for high-value-added models, such as those featuring high-definition and high-image-quality. In mobile phones, we will differentiate our
models by pursuing user-friendliness and offering new uses enabled by our advanced software technologies and devices, such as IGZO LCDs.
Audio-Visual and Communication Equipment
売上高構成比 営業利益(十億円)
売上高
0
100
200
300
400
09 10 11 12 13
(十億円)
0
10
20
30
09 10 11 12 13
0
100
200
300
400
09 10 11 12 130
10
20
30
09 10 11 12 13
Operating IncomeSales
(billions of yen) (billions of yen)
10.9%
10.9%
Sales by Product Group
This product group recorded higher sales in the wake of firm demand for color MFPs in Japan and for information displays. However,
operating income declined due mainly to falling prices stemming from intensified competition. We will work to broaden our busi-
ness by expanding sales of high-speed MFPs, strengthening our lineup of color MFPs for emerging markets, and proposing solutions
in the office and digital signage fields using our unique displays.
Information Equipment
Fiscal 2012 Review by Product G
roup
Fiscal 2012 Review by Product GroupSharp Corporation and Consolidated SubsidiariesYears Ended March 31
14 SHARP CORPORATION Annual Report 2013 15
Electronic Components
売上高構成比 営業利益(損失)(十億円)
売上高
0
300
600
900
1,200
09 10 11 12 13
(十億円)
-150
-120
-30
-60
-90
0
30
09 10 11 12 13
0
300
600
900
1,200
09 10 11 12 13-150
-120
-30
-60
-90
0
30
09 10 11 12 13
(billions of yen) (billions of yen)
Sales Operating Income (Loss)
31.2%
31.2%
Sales by Product Group
LCDs
This product group enjoyed an increase in sales owing to growth in sales of small- and medium-size LCDs, together with solid sales
of large-size LCDs to outside customers of Sharp. However, the operating loss widened as we made production adjustments at our
plants aimed at achieving optimal inventory levels. With the aim of boosting sales and stabilizing earnings, we will shift our emphasis
to high-value-added offerings by utilizing our distinctive display technologies to meet our customers’ needs. At the same time, we will
strengthen relationships with large clients.
売上高構成比 営業利益(損失)(十億円)
売上高
0
100
200
300
09 10 11 12 13
(十億円)
-30
-20
-10
10
0
30
20
09 10 11 12 13
0
100
200
300
09 10 11 12 13-30
-20
-10
10
0
30
20
09 10 11 12 13
Operating Income (Loss)Sales
(billions of yen) (billions of yen)
9.6%
9.6%
Sales by Product Group
Solar Cells
Despite falling prices stemming from intensified competition, this product group posted an increase in sales thanks to higher do-
mestic sales on residential applications and on mega-solar power generation and other industrial applications. We also reported an
improvement in the size of the operating loss on solar cells. We seek to improve profitability by stepping up sales in the domestic
market, where demand growth is expected. We will also work to expand new businesses by providing innovative solutions and
services, including storage batteries and energy management systems.
Other Electronic Devices
売上高構成比 営業利益(損失)(十億円)
売上高
0
100
200
300
400
09 10 11 12 13
(十億円)
-20
-10
10
0
20
09 10 11 12 13
0
100
200
300
400
09 10 11 12 13-20
-10
10
0
20
09 10 11 12 13
Sales Operating Income (Loss)
(billions of yen) (billions of yen)
9.9%
9.9%
Sales by Product Group
Amid the ongoing proliferation of smartphones worldwide, this product group enjoyed an increase in sales owing to higher sales
of its mainstay camera modules. However, we recorded an operating loss due to an inventory write-down recognized as part of
structural reforms. We will work to further expand our business by stepping up development and sales of power-related devices,
touchscreen systems, and sensing devices, in addition to camera modules.
• Sales figures shown on pages 14-15 include internal sales between segments (Consumer/Information Products and Electronic Components). The percentage of sales in pie charts has been calculated accordingly. The Other Electronic Devices group’s sales do not include internal sales to the LCD/Solar Cell groups.
• Operating income (loss) figures shown on page 14-15 are the amounts before adjustments of intersegment trading.• Effective for the year ended March 31, 2011, the Company has applied the “Accounting Standard for Disclosures about Segments of an Enterprise and Related Information” (Accounting
Standards Board of Japan (ASBJ) Statement No.17, Issued by the ASBJ on March 27, 2009) and the “Guidance on Accounting Standard for Disclosures about Segments of an Enterprise and Related Information” (ASBJ Guidance No. 20, issued by the ASBJ on March 21, 2008). In this connection, results for 2010 have been restated to conform with the 2011 presentation.
Fiscal 2012 Review by Product G
roup
売上高構成比 営業利益(十億円)
売上高
0
100
200
300
400
09 10 11 12 13
(十億円)
0
10
20
30
40
09 10 11 12 13
0
100
200
300
400
09 10 11 12 130
10
20
30
40
09 10 11 12 13
Operating IncomeSales
(billions of yen) (billions of yen)
11.4%
11.4%
Sales by Product Group
Health and Environmental Equipment
This product group reported increases in both sales and operating income on the back of healthy demand for air conditioners, air
purifiers, and other products. We aim to continue working to broaden our business by expanding sales of products with Plasmaclus-
ter Ion and other technologies unique to Sharp and by reinforcing sales in emerging markets, centering on ASEAN nations where
we have sales and products operations in place.
Consumer/Information Products
売上高構成比 営業利益(損失)(十億円)
売上高
0
300
600
900
1,200
1,500
09 10 11 12 13
(十億円)
-60
-30
0
30
60
09 10 11 12 13
Operating Income (Loss)
(billions of yen) (billions of yen)
Sales
0
300
600
900
1,200
1,500
09 10 11 12 13-60
-30
0
30
60
09 10 11 12 13
27.0%
Sales by Product Group
27.0%
This product group posted a sales decline and widened operating loss due to lower sales of LCD TVs and mobile phones. We aim to improve
earnings with following initiatives going forward. We seek to further expand sales of large-screen LCD TVs while striving to create new de-
mand for high-value-added models, such as those featuring high-definition and high-image-quality. In mobile phones, we will differentiate our
models by pursuing user-friendliness and offering new uses enabled by our advanced software technologies and devices, such as IGZO LCDs.
Audio-Visual and Communication Equipment
売上高構成比 営業利益(十億円)
売上高
0
100
200
300
400
09 10 11 12 13
(十億円)
0
10
20
30
09 10 11 12 13
0
100
200
300
400
09 10 11 12 130
10
20
30
09 10 11 12 13
Operating IncomeSales
(billions of yen) (billions of yen)
10.9%
10.9%
Sales by Product Group
This product group recorded higher sales in the wake of firm demand for color MFPs in Japan and for information displays. However,
operating income declined due mainly to falling prices stemming from intensified competition. We will work to broaden our busi-
ness by expanding sales of high-speed MFPs, strengthening our lineup of color MFPs for emerging markets, and proposing solutions
in the office and digital signage fields using our unique displays.
Information Equipment
Fiscal 2012 Review by Product G
roup
Fiscal 2012 Review by Product GroupSharp Corporation and Consolidated SubsidiariesYears Ended March 31

16 SHARP CORPORATION Annual Report 2013 17
R&D
and Intellectual Property
R&D
and Intellectual Property
R&D and Intellectual Property
R&D Strategy
Sharp conducts R&D activities with the goal of developing the
technologies needed to constantly create one-of-a-kind prod-
ucts from the perspective of users to uncover new demand, as
well as the goal of consistently delivering new levels of value and
joy to people around the world. To accomplish these goals, we
focus on three approaches to R&D. First is creating unique prod-
ucts through the vertical integration of our core technologies.
Second is leveraging commodity technologies shared widely in
and outside of Sharp. Third is tackling fields of technology that
are new to Sharp, with using “open innovation” and coopera-
tion with partners. These approaches allow us to perform dis-
tinctive, speedy, as well as efficient R&D.
Super Fast Response (SFR) LCD Technology
Sharp has developed super fast response (SFR) LCD technol-
ogy that realizes clear unstressed images in a temperature range
(–30˚C-90˚C) that covers nearly all conditions in which display
could be used. When used in low-temperature conditions, the
display performance of normal LCDs is impaired due to motion
blurring and tailing caused by lower response speeds. However,
Sharp’s SFR LCD has resolved this problem through the develop-
ment of a proprietary pixel structure and new driving technology.
Sharp will tap new markets for this new technology with a wide
range of applications. They include digital signage and car moni-
tors for cold regions, displays for smartphones and watches that
can be used in winter sports settings, and monitors for aircraft
that can be used in ultralow temperatures in emergency situations.
Conversion Efficiency of Solar Cells Increased
Sharp’s ongoing work on the development of energy-creating
technologies has resulted in higher conversion efficiency in so-
lar cells. A monocrystalline solar cell project targeting improved
conversion efficiency in a Black Solar high-efficiency solar cell
achieved high conversion efficiency of 22.3%.*1*2 The forma-
tion of an amorphous silicon layer using thin-film technology
Display at –30˚C SFR LCD (left) and normal LCD (right)
The new standards will cover MPEG-DASH (Dynamic Adaptive
Streaming over HTTP), H.265 High Efficiency Video Coding
(HEVC), an encoding method that doubles the data compres-
sion ratio, and the MPEG Media Transport (MMT), the multiplex
method which is currently under development and will see the
convergence of broadcasting and telecommunications. Sharp
has provided its research and development findings, some of
which have been adopted into these standards.
Intellectual Property Strategy
Sharp views its intellectual property strategy as one of its key
management measures, promoting it in a coherent manner with
business and R&D strategies. By aggressively targeting acquisition
of patent rights, Sharp works to secure competitive edges in its
Product and Device Businesses and thus reinforce its operational
foundation. In advancing its intellectual property strategy in a
consistent manner, Sharp’s Intellectual Property Center, under
the Corporate Research and Development Division, undertakes
management of overall strategy and cooperates with patent-re-
lated entities within each Business Division and site. At the same
time, the center organizes various initiatives related to intellectual
property through an approach of mutual cooperation.
Sharp has clearly delineated the fields that are central to each
business group and has assigned engineers well versed in patent
matters to each of these core business fields to conduct strategic
patent development* close to the front line. Sharp also obtains
useful patents arising from alliance activities from collaboration
with other companies or universities. As of March 31, 2013,
Sharp had 20,764 patents in Japan and 25,093 overseas. Sharp
utilizes these patents to strengthen its strategic businesses.
Sharp is also working to obtain design and trademark registra-
tions based on its brand strategy so as to increase the number of
applications and registrations globally.
Sharp endeavors to make full use of its intellectual property
in coordination with its business and R&D strategies. In addi-
tion, we take actions to protect our intellectual property rights,
and we adopt an approach of respecting the intellectual prop-
erty rights of other organizations. Our fundamental policy is to
resolve infringement issues through dialogue. If other organi-
zations fail to respect our intellectual property rights, however,
we are fully prepared to enlist third parties, including courts, to
obtain a judgment.
Sharp also works hard to reinforce the protection of trade se-
crets and to prevent leaks concerning its unique and important
production technologies and know-how. Also, the impact of
counterfeit Sharp products overseas has grown in recent years.
In response, we have been promoting measures to clamp down
on this practice in cooperation with the relevant authorities and
industry associations.
* International patent applications (PCT applications) in 2012: Sharp ranked 3rd among applications (WIPO data)
Imaging Standardization (Standardization of Next-Generation Video Transmission and Encoding Method)
on the monocrystalline surface of a Back Contact type solar cell
raises light absorption efficiency.
Sharp also increased the conversion efficiency of a triple-
junction compound solar cell with three layers made from dif-
ferent compounds to 37.9%,*2*3 and the conversion efficiency
of a dye-sensitized solar cell to 11.9%.*2*3 Both ratios are the
world’s highest*4 conversion efficiency for each type of cell.
*1 Conversion efficiency measured by Japan Electrical Safety & Environment Technology Laboratories (JET)
*2 The project was undertaken as part of a project promoted by New Energy and Industrial Technology Development Organization (NEDO).
*3 Conversion efficiency measured by National Institute of Advanced Indus-trial Science and Technology (AIST)
*4 The triple-junction compound solar cell: As of April 24, 2013, for non-concentrator solar cells at the research stage.
The dye-sensitized solar cell: As of December 22, 2012, for dye-sensitized solar cells at the research stage. (Sharp survey)
Microorganism Sensor
Sharp has developed a highly sensitive sensor system that can
detect airborne microorganisms (fungi and bacteria). The sys-
tem measures airborne microorganisms continuously at roughly
15-minute intervals, a process that previously required the man-
ual task of cultivating microorganisms in a petri dish over several
days. When linked to a network, the system can be connected
to an air quality control system and controlled remotely. Sharp
will initially target the system at food processing plants, pharma-
ceutical manufacturing plants, and hospitals. After that, we will
expand applications further to include everyday products used
in the home.
With the progressive formulation of new international standards
focusing on the core technologies over broadcasting, storage,
and distribution of ultrahigh-definition video content, Sharp is
developing key technologies for the realization of such services.
Microorganism sensor (prototype)

18 SHARP CORPORATION Annual Report 2013 19
Corporate Social Responsibility (C
SR)
Corporate Social Responsibility (C
SR)
Corporate Social Responsibility (CSR)
CSR Concept“Make products that others want to imitate.” This message of
Sharp’s founder Tokuji Hayakawa encapsulates management’s
stance of aiming to become a trusted company by contributing
to society as a manufacturer that is among the first to grasp the
needs of the next era.
In 1973, Sharp codified the unchanging spirit of its founder
in the Company’s business philosophy and business creed. The
business philosophy, which states Sharp’s vision, includes state-
ments such as “Contribute to the culture, benefits and welfare
of people throughout the world.” This forms the foundation of
CSR at Sharp today, aimed at achieving co-existence and mutual
prosperity with society and stakeholders. The business creed calls
for “Sincerity and Creativity,” and all employees must adhere to
and follow it in order to fully realize this business philosophy.
Sharp has striven to realize its business philosophy and con-
tribute to the establishment of a sustainable society through
its business activities. Today, we are returning to these original
commitments as we strive for recovery and growth. To ensure
that we fulfill our social responsibilities and remain a company
trusted by society, we conduct ourselves with sincerity while
adopting a rigorous customer-focused perspective. At the same
time with this in mind, Sharp will harness the creativity that has
flowed through its corporate DNA to create new value through
the development of innovative products.
Environmental ActivitiesSharp’s corporate vision is to become an Eco-Positive Company.
Under this vision, Sharp aims to become a company whose posi-
tive impact—by reducing greenhouse gases through its energy-
saving and energy-creating products—outweighs its negative
impact, which is the amount of emissions generated in the
course of its business activities. In fiscal 2011, the positive impact
from reduced emissions was 3.1 times the amount of emissions
from business activities.
Meanwhile, a recent trend in the reporting of greenhouse gas
emissions calls for the disclosure of emission levels based on the
international Scope 3 Standard. Scope 3 prescribes a method for
calculating emissions generated throughout the supply chain,
from materials procurement to product use, in addition to emis-
sions resulting from manufacturing processes.
We have responded by extending our scope of management
for negative impact parameters from “only our activities” to in-
clude “our entire supply chain.” In addition, we devised a Green
Shared Value (GSV) index that links our business growth with
fulfilling the environmental needs of society. Our new policy on
the environment is entitled “Increasing Green Shared Value.”
We will constantly strive to be a company whose positive im-
pact through energy-saving and energy-creating products that
reduce greenhouse gases in magnitudes exceeds the negative
impact of emissions generated by our business activities, broad-
ened to include our entire supply chain.
Examples of InitiativesEnvironmental TechnologiesSince fiscal 2001, Sharp has used proprietary closed-loop mate-
rial recycling technology to recover plastics from used consumer
electronics and recycles these materials in new consumer elec-
tronics. The amount of recycled plastics using this technology
has increased every year, reaching a cumulative total of 9,000
tons.
We are currently developing technology that will recycle waste
LCD panels, which are expected to increase along with the pro-
liferation of LCD TVs. Sharp will encourage the effective use of
limited resources by continuing development activities centered
on these key environmentally friendly technologies.
Environmentally Friendly Products and DevicesSharp makes a positive contribution to the environment by en-
hancing the environmental performance of its products and de-
vices. We have introduced standards that we use to certify the
environmental performance of our products. Products with a ba-
sic level of environmental performance are designated as Green
Products (GPs), and products with extremely high levels of envi-
ronmental performance are designated as Super Green Products
(SGPs). In fiscal 2013, we revised these certification standards to
increase the emphasis on energy-saving performance, an issue
of growing worldwide interest. Going forward, we will continue
developing environmentally responsible products in line with
user needs.
Environmentally Responsible Business ActivitySharp works actively to raise the environmental performance of
its operations, including plants, offices, and logistics, in order to
reduce the impact on the environment. We have an environmen-
tal certification system for plants based on our own assessment
standards. Plants that are environmentally responsible are des-
ignated as Green Factories (GFs), and those with superior envi-
ronmental performance receive the Super Green Factories (SGFs)
designation. After being certified as an SGF, a plant pursues the
SGF II level of certification by achieving even higher environmen-
tal performance.
CommunicationSharp uses a variety of means to inform its wide range of stake-
holders about its environmental initiatives. We disclose informa-
tion via the Social & Environmental Activities page on our web-
site, as well as through newspapers, television, and other media.
We strive to communicate with local communities about envi-
ronmental issues through a range of measures, including plant
reports produced by each manufacturing facility, factory tours,
and special events at plants.
Business Philosophy
We do not seek merely to expand our business volume. Rather, we are dedicated to the use of our unique, innovative technology to con-tribute to the culture, benefits and welfare of people throughout the world. It is the intention of our corporation to grow hand-in-hand with our employees, encouraging and aiding them to reach their full potential and improve their standard of living. Our future prosperity is directly linked to the prosperity of our customers, dealers and shareholders …indeed, the entire Sharp family.
Business Creed
By committing ourselves to these ideals, we can derive genuine satisfaction from our work, while making a meaningful contribution to society.
Sincerity is a virtue fundamentalto humanity … always be sincere.Harmony brings strength … trust eachother and work together.Politeness is a merit … alwaysbe courteous and respectful.Creativity promotes progress … remainconstantly aware of the need toinnovate and improve.Courage is the basis of a rewardinglife … accept every challenge with apositive attitude.
• Detailed information on Sharp’s CSR activities is available at the following website: http://www.sharp-world.com/corporate/eco/index.html (English)
全ての事業プロセスで「誠意と創意」をもって業務を行い、経営理念を実現する
Achieve the Tenets of the Business Philosophy by Promoting “Sincerity and Creativity” in All Business Practices
Business CreedDedicated to two
principal idealsSincerity and
Creativity
Sales
Production
Procurement
DesignR&D
Planning
Service
Business Activities
Social Contribution Activities
■ Perspective of social contribution through business activities
“Contribute to the culture, benefits, and welfare of people throughout the world”
■ Perspective concerning employees “It is the intention of our corporation to grow hand-in-hand with our employees”
■ Perspective concerning stakeholders “Prosperity is directly linked to the prosperity of the entire Sharp family”
Realization of Business Philosophy
United Nations Global CompactSharp has been a participant in the United Nations Global
Compact since June 2009. The Global Compact contains 10
principles in the areas of human rights, la-
bor, the environment and anti-corruption.
Sharp has set targets for specific activities
in each of these areas and is promoting ef-
forts across the group.
Socially Responsible Investment (SRI) Recognition Sharp has received recognition in Japan and overseas for its
strong commitment to corporate citizenship. As of March
2013, Sharp was recognized by major SRI evaluating bodies
and selected for SRI indices as noted below.
• FTSE4Good Global Index (U.K.)• MSCI Global Climate Index (U.S.A.)• Morningstar Socially Responsible Investment Index (Japan)
Efforts Aimed at Increasing Green Shared Value
温暖化ガス排出量
製品使用 廃棄リサイクルお客様 リサイクル会社
素材調達 製品製造 輸 送取引先 当社 物流会社
温暖化ガス削減貢献量
省エネ製品 太陽光発電
Suppliers
Materials procurement
Customers
Use
Sharp
Greenhouse gas emissions Greenhousegas emission reductions
Logistics companies
Logistics
Energy-saving products Solar power generation
Recycling companies
Disposal, recycling
Manufacture
• The business creed is the central axis of all business activities.
• “Sincerity” means a working attitude mindful of what will offer genuinely useful solutions and happiness to everyone.
• “Creativity” means a working attitude not content with the way things are. An attitude that always seeks to add value, and to make efforts to innovate and improve.

20 SHARP CORPORATION Annual Report 2013 21
Corporate G
overnance
Corporate Governance
Corporate G
overnance
Basic Concept Concerning Corporate GovernanceSharp’s business philosophy contains a statement of “Our future
prosperity is directly linked to the prosperity of our customers,
dealers and shareholders ...indeed, the entire Sharp family.” Un-
der this philosophy, Sharp’s basic concept concerning corporate
governance is to maximize corporate value through swift and ac-
curate management that preserves transparency, objectivity and
soundness.
Based on this stance, Sharp appoints an outside director who
has international, multi-faceted and compliance perspectives on
wide-ranging issues, such as the social and economic environ-
ment, and the future direction of Sharp. In doing so, we strive
to strengthen the decision-making functions within the Board of
Directors and the functions for supervising directors’ execution of
duties. We also have the Executive Officer System, thereby divid-
ing the supervisory and decision-making functions from the busi-
ness execution functions, and creating a structure that steadily
facilitates nimble, efficient business execution.
With respect to corporate auditors and the Board of Corporate
Auditors, Sharp appoints outside independent corporate auditors
in order to reinforce the monitoring and checking functions on
the management and otherwise strengthen the corporate gov-
ernance system.
Status of Corporate Governance SystemSharp’s corporate governance system comprises the Board of Di-
rectors, which supervises directors’ execution of duties, the Board
of Corporate Auditors, which audits the business executions of
directors, and the Executive Officer System, which divides the su-
pervisory and decision-making functions from the business execu-
tion functions. By also appointing an outside director and setting
up various committees to supplement the supervisory functions of
the Board of Directors, Sharp believes that its corporate govern-
ance system is adequate in terms of transparency, objectivity and
soundness.
The Board of Directors Meetings of Sharp Corporation are held
on a monthly basis in principle to make decisions on matters stip-
ulated by law and management-related matters of importance,
and to supervise the state of business execution. To improve man-
agement agility and flexibility, and to clarify the responsibilities of
Shareholders’ Meeting
Business execution
Representative directors/managing directors
(Executive officers)
Corporate Auditors Office
Supervisory/decision-making functions
Business execution functions
Audit functions
Corporate Governance System (As of June 27, 2013)
Election/dismissal Election/dismissal Election/dismissal
Supplement supervisoryfunctions
Supervision/decision making
Supervision
Supplement business execution functions
Businessexecution
andchecks Discussion/report
Report Operationalaudit
Operational audit
Accountingaudit
Appointment/removal
(Election/dismissal)
Resolution/report
Report
Monitoring
Coordination Coordination
Coordination
Coordination
Report
Report
Audit
Audit
Report
Deliberation on key policies, etc.
Report Accounting auditors
Internal Audit Unit
DirectorsBoard of Directors Meeting
Corporate auditors
Board of Corporate AuditorsInternal Control Committee
Special Committee
Compensation Committee
Consultative Committee
Nominating Committee
Executive ManagementCommittee
Executive officers, etc.
the company management during each accounting period, the
term of office for members of the Board of Directors is set at one
year.
As an advisory body to the Board of Directors, the Company
has the Internal Control Committee, which deliberates on basic
policies, and the state of development and implementation re-
garding internal controls and internal audits, then reports on and
discusses important matters with the Board of Directors. As advi-
sory bodies to the Board of Directors, Sharp also has the Nominat-
ing Committee and the Compensation Committee.
In addition to the Board of Directors, the Company has the Ex-
ecutive Management Committee, where matters of importance
related to corporate management and business operation are dis-
cussed and reported twice a month in principle. This committee
facilitates prompt executive decision making.
The Board of Corporate Auditors is composed of four corpo-
rate auditors, three of whom are outside independent corporate
auditors. Each corporate auditor meets regularly with the repre-
sentative directors, the directors, the executive officers, the ac-
counting auditors, the head of the Internal Audit Unit and others
to exchange opinions and work to ensure that business is execut-
ed legally, appropriately and efficiently.
Ongoing Development of the Internal Control SystemIn May 2006, the Board of Directors passed a resolution to adopt
a basic policy related to the development of systems necessary to
ensure the properness of business (Basic Policy for Internal Con-
trol), which was partially amended in April 2013. This amended
policy forms the basis for Sharp’s ongoing development and im-
plementation of its internal control system. The Internal Control
Committee, which is an advisory body to the Board of Directors,
deliberates on basic policies regarding internal controls and in-
ternal audits, and the state of development and implementation
of initiatives related to the internal control system, then reports
on and discusses important matters with the Board of Directors.
The department promoting internal controls on a company-wide
basis oversees the internal controls of the business execution de-
partments. Meanwhile the Internal Audit Unit makes concrete
proposals on how to improve business operations and reinforces
internal controls by checking the validity of business execution as
well as the appropriateness and efficiency of management.
To enhance compliance throughout the group, Sharp intro-
duced the Sharp Group Charter of Corporate Behavior, a set of
principles to guide corporate behavior, and the Sharp Code of
Conduct, which clarifies the conduct expected of all directors, au-
ditors, executive officers and employees of Sharp. Sharp ensures
that these guidelines are thoroughly observed by posting them
on the Web and carrying out position-specific training programs.
Based on the basic rules of compliance, Sharp is also develop-
ing a company-wide compliance promotion system. Meanwhile,
Sharp is implementing thorough measures to prevent compliance
breaches by distributing a Sharp Group Compliance Guidebook
to all employees and implementing training based on the guide-
book.
In order to comprehensively and systematically deal with diverse
business risk, Sharp formulated the Business Risk Management
Guideline to achieve prevention of and swift responses to risk.
Plan Regarding Large-Scale Purchases ofSharp Corporation Shares (Takeover Defense Plan)In order to protect and enhance the corporate value and common
interests of shareholders of a manufacturing firm such as Sharp, a
company must develop in-house and make good use of advanced
technology and manufacturing technology from a medium- to
long-term perspective. Furthermore, Sharp believes it is essential
to build good cooperative relationships with stakeholders such as
customers, business partners and employees.
The Board of Directors of Sharp believes that determining
whether to accept large-scale share purchases aimed at a takeover
should be ultimately entrusted to the shareholders. However, the
Board of Directors of Sharp also believes that it is not appropriate
for any party that conducts an inappropriate purchase, such as
one that clearly harms the corporate value and common interests
of shareholders and/or puts undue pressure on shareholders to
sell shares, to take control over Sharp, and that it is necessary to
take reasonable countermeasures against such purchases.
In order to prevent such purchasing activity, Sharp has adopt-
ed the prior warning type of defense measures called the Plan
Regarding Large-Scale Purchases of Sharp Corporation Shares
(Takeover Defense Plan)* (hereinafter referred to as the “Plan”).
The Plan provides rules for enabling shareholders to reach a
proper decision, by requiring large-scale purchasers of the Com-
pany’s shares who intend to obtain 20% or more of the voting
rights of the Company to provide sufficient information and give
an adequate assessment period. If a large-scale purchaser does
not follow the rules, or although the large-scale purchaser com-
plies with these rules, the large-scale purchase is deemed to be
harmful to corporate value and common interests of sharehold-
ers, the Board of Directors of Sharp will make a decision concern-
ing the implementation of countermeasures after fully taking into
consideration the advice and recommendations of the Special
Committee consisting of three or more persons who remain inde-
pendent of Sharp’s management.
At the 117th Ordinary General Meeting of Shareholders held
on June 23, 2011, shareholders approved the continuation of the
Plan. The effective term of the Plan is until the conclusion of the
120th Ordinary General Meeting of Shareholders, which will be
held by June 30, 2014.
* For more details of the Plan, please visit the website below: http://www.sharp-world.com/corporate/ir/topics/pdf/130514.pdf

22 SHARP CORPORATION Annual Report 2013 23
Risk Factors
Risk Factors
Risk Factors
Listed below are the principal business risks of Sharp that may
have a significant influence on investors’ decisions. Note that in
addition to these, there exist certain other risks that are difficult
to foresee. Each of these risks has the potential to impact the
operations, business results and financial position of Sharp. All
references to possible future developments in the following text
were made by Sharp as of March 31, 2013 (or June 25, 2013 as
appropriate).
(1) Global Market TrendsSharp conducts its business in different regions around the
world. Business results and financial position are thus subject
to economic and consumer trends (especially trends in private
consumption and corporate capital investment), competition
with other companies, product demand, raw material supply
and price fluctuations in each region, including Japan. The politi-
cal and economic situation in respective areas may also exert an
influence on business results and financial position.
(2) Exchange Rate FluctuationsThe proportion of consolidated net sales accounted for by over-
seas sales was 47.3% in fiscal 2010, 51.9% in fiscal 2011 and
59.4% in fiscal 2012. Although Sharp hedges the risk of ex-
change rate fluctuations by employing forward exchange con-
tracts and expanding and strengthening overseas production,
such fluctuations may affect its business results.
(3) Medium-Term Management PlanSharp is currently devoting relentless efforts toward realizing its
Medium-Term Management Plan, announced on May 14, 2013.
However, the plan is based on various assumptions concerning
external factors, including customer demand for Sharp’s prod-
ucts and services, foreign exchange rates, interest rates and the
overall economic growth rate. Moreover, there is no guarantee
that business initiatives outlined in the plan will be executed.
Accordingly, it is possible that Sharp may not be able to achieve
targets set under the plan. Moreover, enforcement of business
restructuring may result in additional losses.
(4) Dependence on Certain Products and ClientsSales of LCDs and digital information equipments account for
more than half of Sharp’s total net sales. Accordingly, Sharp’s
business results may be impacted due to reasons including a
decline in customer demand for such products, the arrival of
alternative or competing products of other companies, and in-
tensified competition stemming from the entry of new compa-
nies into the market. Because the sales of our LCDs and mobile
phones are dominated by only a small number of clients, Sharp’s
business results and financial position could be affected if sales
to such important clients languish due to, for example, its prod-
uct-related issues or the clients’ sales strategies. Also, maintain-
ing and developing business with such a small number of clients
may lead to various limitations on Sharp’s business operations.
(5) Strategic Alliances and CollaborationsSharp implements strategic alliances and collaborations as well
as capital alliances with other companies—including the Sam-
sung Group and the Qualcomm Group—in order to enhance
corporate competitiveness, to improve profitability and to bolster
the development of new technologies and products in various
business fields. Moreover, Sharp’s policy is to continue actively
pursuing such alliances. If, however, any strategic or other busi-
ness issues arise, or objectives change, it may become difficult
to maintain such alliances and collaborative ties with these com-
panies, or to generate adequate results. In such cases, Sharp’s
business results and financial position may be impacted. In addi-
tion, there is a possibility that alliances and collaborations could
restrict the freedom of Sharp’s business, or that shares issued un-
der a capital alliance could dilute the value of existing shares. On
March 27, 2012, Sharp Corporation entered into an agreement
to execute capital and business alliance with four companies of
the Hon Hai Group. However, subscription payment for shares
to be issued under the agreement was not executed. Under the
agreement, Sharp Corporation is to issue 121,649 thousand
shares of common stock, to be purchased by the Hon Hai Group
for ¥550.00 per share. The agreement is valid for three years.
(6) Business PartnersSharp procures materials and receives services from a large
number of business partners, and transactions are made once
a detailed credit check of the company has been completed.
However, there is a risk that business partners may suffer deteri-
oration in performance due to slumping demand or severe price
erosion, or face an unexpected M&A, or be impacted by natural
disasters or accidents, or become involved in a corporate scandal
such as a breach of the law, or be affected by legal regulations
concerning human rights or environmental issues such as the
problem of “conflict minerals” in the supply chain. Due to these
and other factors, Sharp may be unable to access sufficient sup-
plies of materials/parts from procurement sources, or the quality
of such materials/parts may be inadequate. Any of these factors
may affect Sharp’s business results and financial position.
(7) Other Factors Affected by Financial PositionSharp procures funds through borrowings from financial institu-
tions, such as banks and life insurance companies, and through
bond issues. As of March 31, 2013, the balance of such debt
was equivalent to 54.8% of total assets. Accordingly, Sharp
might become subject to restrictions on how it uses its cash
flows in order to repay such debt, and also faces the possibility
of an increase in expenses due to rising interest rates. Moreover,
Sharp has possibility of increase in fund procurement costs as
well as limitations on fund procurement. This may be that neces-
sary funds cannot be obtained at required time with adequate
conditions, including for the refinancing of existing debt. These
factors may affect Sharp’s business results and financial posi-
tion. Sharp has borrowing agreements with multiple financial
institutions, and such agreements entail financial covenants. If
its consolidated net assets, operating income or net income fall
below the levels specified under such financial covenants, Sharp
may forfeit the benefit of time at the lender’s request. Moreover,
Sharp may also forfeit the benefit of time on bonds and other
borrowings if it violates the relevant financial covenants. In ad-
dition, dependence on borrowings, a credit ratings reduction
caused by it, or deterioration of Sharp’s financial position may
work to its disadvantage with respect to competition with other
companies with robust financial positions, and contract-related
issues could also arise between Sharp and its lenders or business
partners.
(8) Technological InnovationNew technologies are emerging rapidly in the markets where
Sharp operates. Resultant changes in social infrastructure, in-
tensified market competition, changes in technology standards,
obsolescence of technologies, or the appearance of substitute
technologies may lead to an increase in inventories or the inabil-
ity to recover product development costs. These and other fac-
tors may impact Sharp’s business results and financial position.
(9) Intellectual Property RightsSharp strives to protect its proprietary technologies by acquir-
ing patents, trademarks, and other intellectual property rights
in Japan and in other countries, and by concluding contracts
with other companies. However, there is a risk that rights may
not be granted, or a third party may demand invalidation of an
application, such that Sharp may be unable to obtain sufficient
legal protection of its proprietary technologies. In addition, intel-
lectual property that Sharp holds may not result in a superior
competitive advantage, or Sharp may not be able to make effec-
tive use of such intellectual property, such as when a third party
infringes on the intellectual property rights of Sharp. There may
also be instances where a third party launches litigation against
Sharp, claiming infringement of intellectual property rights. Res-
olution of such cases may place a significant financial burden on
Sharp. Furthermore, if such a third-party claim against Sharp is
recognized, Sharp may have to pay a large amount of compen-
sation, and may incur further damage by having to cease using
the technology in question. Also, as a result of an M&A, a third
party previously unlicensed to use Sharp’s intellectual property
may acquire such license, with the result that Sharp’s intellec-
tual property may lose its superiority. Alternatively, an M&A with
a third party could result in Sharp’s business becoming subject
to new restrictions to which it had not previously been subject,
the resolution of which may require Sharp to pay additional
compensation. Furthermore, although compensation is given
to employees for innovations that they make in the course of
their work pursuant to a patent reward system governed by in-
ternal regulations, an employee may consider such payment in-
adequate and initiate legal action. If any of the above problems
related to intellectual property were to occur, it could impact
Sharp’s business results and financial position.
(10) Long-Term Investments and AgreementsSharp actively invests in manufacturing equipment and the like
and has a large amount of noncurrent assets. Various factors re-
lated to such manufacturing equipment may prevent Sharp from
securing anticipated income and require it to book impairment
losses, which could impact its business results and financial posi-
tion. These factors include equipment not functioning as expect-
ed and difficulty converting for other products due to equipment
performance problems or contractual limitations. Sharp also has
goodwill and other noncurrent assets. Sharp may be required
to apply impairment treatment to such assets if its profitability
declines or if the market prices of its asset holdings decline sig-
nificantly. Such factors may affect Sharp’s business results and
financial position. In addition, Sharp has a large number of long-
term contractual agreements in place, and fluctuations in prices
and costs during the periods of such agreements may have a
major negative effect on Sharp’s business. In particular, there are
such agreements covering raw materials for solar panels. These
include a contract that obligates Sharp to purchase a total of
25,775 tons of polysilicon by the end of 2020 at a rate substan-
tially higher than recent market prices (the weighted average
price under the contracts exceeded the market price as of June
19, 2013 by around ¥2,500 per kilogram). Sharp’s Medium-Term
Management Plan, announced on May 14, 2013, incorporates
the assumption that Sharp is obligated to purchase polysilicon
at higher than market rates throughout the period covered by
the plan.
(11) Product LiabilitySharp manufactures products in accordance with strict quality
control standards to ensure the utmost in quality. In order to
fulfill its responsibility as a manufacturer in case product defects
do arise, Sharp has taken out insurance to cover compensations
based on product liability. Nonetheless, there is still a risk of a
large-scale product recall or litigation caused by unforeseen
events, which may adversely affect Sharp’s brand image or influ-
ence its business results and financial position.

24 SHARP CORPORATION Annual Report 2013 25
Risk Factors
Risk Factors
(12) Laws and RegulationsThe business activities of Sharp are subject to various regulations
in countries where it operates, including business and invest-
ment approval, export regulations, tariffs, accounting standards
and taxation. Sharp must also adhere to various laws and regu-
lations concerning trading, antitrust practices, product liability,
consumer protection, intellectual property rights, product safety,
the environment, recycling and internal control, and labor regu-
lations. Changes in such laws and regulations, or additional ex-
penses to comply with the amendments, or the occurrence of
violations of legal rules by persons in Sharp may affect Sharp’s
business results and financial position. Furthermore, in a case
where an accident occurs related to one of Sharp’s products,
report of said incident, based on the Consumer Product Safety
Law and related regulations in Japan, and disclosure of the ac-
cident information based on a system for public announcements
could diminish Sharp’s brand image.
(13) Litigation and Other Legal ProceedingsSharp conducts business activities around the world, and as
such, there is a risk that Sharp could become involved with liti-
gation and other legal proceedings in each country. If Sharp be-
comes involved in litigation or other legal proceedings, with the
different legal and judicial systems in each country, depending
on the case, Sharp may be ordered to pay a significant amount
in damages or fines. Sharp is subject to investigations conducted
by the Directorate-General for Competition of the European
Commission, etc., with respect to its TFT LCD business. In ad-
dition, civil lawsuits seeking monetary damages resulting from
alleged anticompetitive behavior have been filed in North Amer-
ica and Europe against Sharp. Sharp also received a cease and
desist order and a surcharge payment order from the Japan Fair
Trade Commission. However, Sharp has submitted a complaint
to the Commission and the complaint is pending. With respect
to the result of these proceedings and litigation, Sharp has made
a reasonable estimate of potential future losses and provided a
reserve in the amount deemed necessary. However, it is difficult
to predict or estimate all results at this stage. An adverse result
could affect Sharp’s business results and financial position.
(14) Leakage of Personal Data and Other InformationSharp retains personal data and other confidential information
concerning its customers, business partners and employees. Ex-
treme care is taken to protect this information. A company-wide
management system promotes employee education, internal au-
diting, and other measures aimed at ensuring compliance with
management regulations. If information is leaked, however, it
may reduce confidence in Sharp or result in substantial costs (as-
sociated with leakage prevention measures or indemnification
for damages, for instance), which may affect Sharp’s business
results and financial position.
(15) Large-Scale Natural DisastersSharp has created and adopted preventative/emergency meas-
ures and a business continuity plan aimed at rapid recovery/res-
toration in order to be prepared and limit damage in the event of
large-scale natural disasters such as earthquakes and typhoons.
However, if Sharp or its partners’ business activities are impaired
due to the occurrence of a large-scale natural disaster, it may af-
fect Sharp’s business results and financial position.
(16) Risks Accompanying the Nuclear Power Plant Disaster
The Tokyo Electric Power (TEPCO) Fukushima Daiichi Nuclear
Power Plant accident accompanying the Great East Japan Earth-
quake on March 11, 2011, has had various adverse effects on
both Japanese and overseas markets, which is affecting Sharp’s
business results and financial position. Moreover, in response to
electricity usage restrictions in the areas served by TEPCO and
Tohoku Electric Power, and energy-conservation requests in the
areas served by Kansai Electric Power (KEPCO) and elsewhere in
2011, we are promoting company-wide energy-saving efforts. In
the summer of 2012, Sharp responded to an energy-conserva-
tion request based on specific numerical targets determined by
KEPCO. In the winter of 2012, Sharp responded to an energy-
conservation request without numerical targets. In the future,
if electricity supply shortages escalate due to electricity usage
restrictions by the government or energy-conservation requests
from power companies, and Sharp is requested to significantly
reduce electricity usage amounts, or if a situation such as rolling
blackouts occurs, plant operations will be reduced or produc-
tion temporarily suspended, which may affect Sharp’s business
results and financial position. Moreover, substantial increases in
electricity prices by electric power companies may also affect
Sharp’s business results and financial position.
(17) Competition to Secure Skilled PersonnelTo achieve future success, Sharp relies heavily on its ability to se-
cure exceptional human resources in such fields as science, tech-
nology, and management. However, since demand for talented
personnel in various fields exceeds supply, competition to secure
human resources is increasing. In the event that Sharp is unable
to attract personnel or prevent the departure of existing employ-
ees, its business results and financial position may be affected.
(18) Other Key Variable FactorsIn addition to the aforementioned risks, Sharp’s business results
may be significantly affected by human-induced calamities such
as accidents, conflicts, insurrections or terrorism; the spread of
a new strain of influenza or other infectious disease; or major
fluctuations in the stock and bond markets.
(19) Outline of Significant Events Relating to Assumed Going ConcernThe operating results for the six months ended March 31, 2013,
turned positive due to sales increase of distinctive devices and
products such as smartphones and tablet terminals with IGZO
LCDs as well as Black Solar high-efficiency solar cells. Also,
company-wide measures, including reductions in inventories
and slashing total costs primarily focused on labor costs through
such schemes as a voluntary retirement program, have largely
contributed to the turnaround. Continuing from the previous
fiscal year, Sharp’s consolidated financial performance for fiscal
2012 resulted in substantial operating and net losses, as well as
substantial negative cash flows from operating activities. In ad-
dition, concerns have been expressed that Sharp might face dif-
ficulties in redemption of the 20th unsecured convertible bonds
with subscription rights to shares, due on September 30, 2013.
Although there are events or conditions that may cast significant
doubt on the entity’s ability to continue as a going concern, we
believe that these conditions will not cast a material uncertainty
about Sharp’s ability to continue as a going concern, due to
implementation of various measures to resolve these and other
major issues as described below. Therefore, no further disclosure
for the “Going Concern Assumption” in the notes to the con-
solidated financial statements is necessary.
Sharp has received continued support and cooperation from
financial institutions. With respect to a ¥360.0 billion syndicated
loan due in June 2013, the agreement was amended on June
25, 2013 to extend the loan with the consent of the two main
banks—Mizuho Corporate Bank, Ltd. and The Bank of Tokyo-
Mitsubishi UFJ, Ltd.—and other participating banks. On the
same day, an agreement was reached with the two main banks
to provide an additional borrowing facility of ¥150.0 billion,
which will be used to redeem Sharp’s 20th unsecured convert-
ible bonds with subscription rights to shares, due on September
30, 2013. Accordingly, there is no problem with the redemption
of those bonds. As a corporate strategy for steady achievement
of “recovery and growth,” Sharp has developed a Medium-Term
Management Plan incorporating five strategic measures: “Re-
structuring its Business Portfolio,” “Improving the Profitability
of its LCD Business,” “Expanding Overseas Businesses Focusing
on the ASEAN Market,” “Reducing Fixed Costs by Reforming
its Cost Structure,” and “Improving its Financial Position.” Also,
in order to strengthen headquarters control and governance
function, as well as action forces to complete the Medium-Term
Management Plan, Sharp newly set up the “Corporate Manage-
ment Group” and “Structural Reform Group.” Through steady
implementation of the Medium-Term Management Plan and
financial arrangements, Sharp aims to improve its financial posi-
tion, while at the same time reinforcing management founda-
tion, to realize sustainable growth and a stable net income.

26 SHARP CORPORATION
Directors, Corporate Auditors and Executive Officers(As of June 25, 2013)
Directors
Executive OfficersCorporate Auditors
President
Kozo Takahashi
ExecutiveVice President
Shigeaki Mizushima
Senior ExecutiveManaging Officers
Tetsuo Onishi
Norikazu Hohshi
Fujikazu Nakayama
Executive Managing Officers
Yoshisuke Hasegawa
Moriyuki Okada
Satoshi Fujimoto
Yoshihiro Hashimoto
Noboru Fujimoto
Toshihiko Fujimoto
Kazutaka Ihori
Nobuyuki Taniguchi
Executive Officers
Masayuki Mohri
Ryutaro Egawa
Kazushi Mukai
Akira Atarashi
Paul Molyneux
Mototaka Taneya
Toshiyuki Osawa
Satoshi Sakakibara
Junichi Kodama
Yumiko Ito
Akihiko Imaya
Hiroshi Kataoka
Masahiro Okitsu
Shinichi Niihara
Shogo Fukahori
Full-time Corporate Auditors
Junzo Ueda
Shinji Hirayama*2
Corporate Auditors
Yoichiro Natsuzumi*2
Masuo Okumura*2
*1 Outside Director*2 Outside Corporate Auditors
Representative Director,President
Kozo Takahashi
Directors, C
orporate Auditors and Executive O
fficers
Representative Director
Shigeaki MizushimaRepresentative Director
Tetsuo OnishiRepresentative Director
Norikazu HohshiDirector
Satoshi Fujimoto
Director
Yoshihiro HashimotoDirector
Toshihiko FujimotoDirector
Yumiko ItoDirector
Makoto Kato*1

Annual Report 2013 27
F inancia l Sect ion
Financial Section
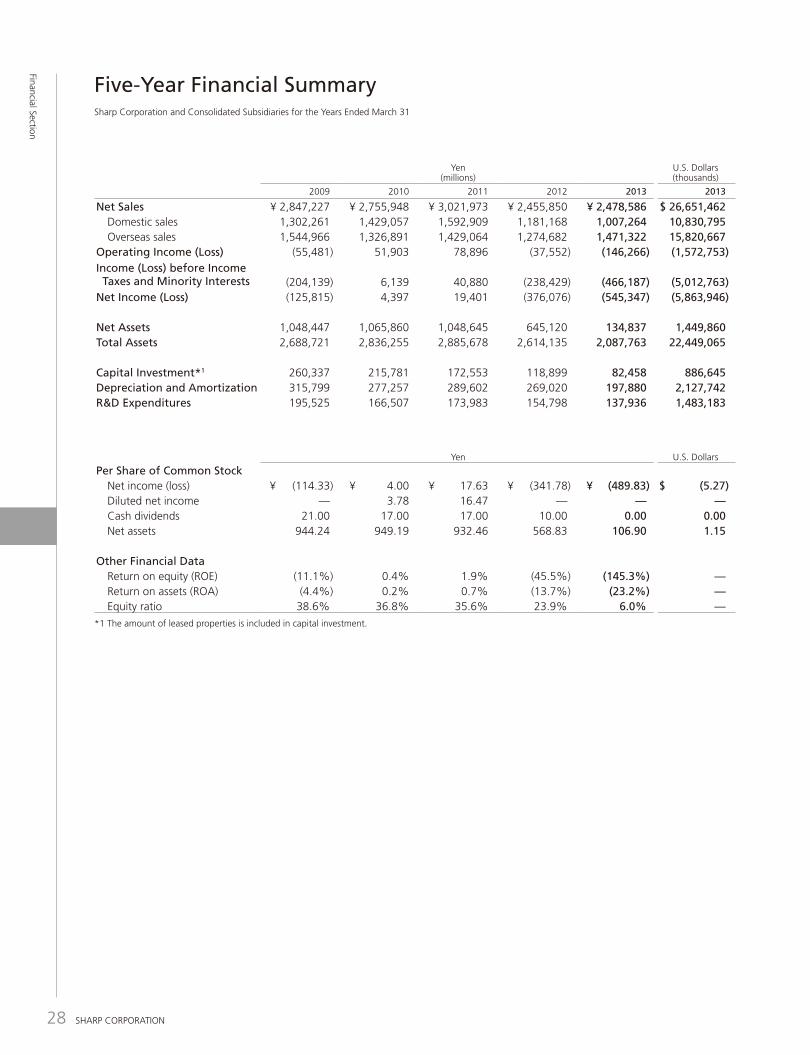
28 SHARP CORPORATION Annual Report 2013 29
Five-Year Financial SummarySharp Corporation and Consolidated Subsidiaries for the Years Ended March 31
Yen(millions)
U.S. Dollars (thousands)
2009 2010 2011 2012 2013 2013
Net Sales ¥ 2,847,227 ¥ 2,755,948 ¥ 3,021,973 ¥ 2,455,850 ¥ 2,478,586 $ 26,651,462 Domestic sales 1,302,261 1,429,057 1,592,909 1,181,168 1,007,264 10,830,795 Overseas sales 1,544,966 1,326,891 1,429,064 1,274,682 1,471,322 15,820,667 Operating Income (Loss) (55,481) 51,903 78,896 (37,552) (146,266) (1,572,753)Income (Loss) before Income Taxes and Minority Interests (204,139) 6,139 40,880 (238,429) (466,187) (5,012,763)Net Income (Loss) (125,815) 4,397 19,401 (376,076) (545,347) (5,863,946)
Net Assets 1,048,447 1,065,860 1,048,645 645,120 134,837 1,449,860 Total Assets 2,688,721 2,836,255 2,885,678 2,614,135 2,087,763 22,449,065
Capital Investment*1 260,337 215,781 172,553 118,899 82,458 886,645 Depreciation and Amortization 315,799 277,257 289,602 269,020 197,880 2,127,742 R&D Expenditures 195,525 166,507 173,983 154,798 137,936 1,483,183
Yen U.S. Dollars
Per Share of Common Stock Net income (loss) ¥ (114.33) ¥ 4.00 ¥ 17.63 ¥ (341.78) ¥ (489.83) $ (5.27) Diluted net income — 3.78 16.47 — — — Cash dividends 21.00 17.00 17.00 10.00 0.00 0.00 Net assets 944.24 949.19 932.46 568.83 106.90 1.15
Other Financial Data Return on equity (ROE) (11.1%) 0.4% 1.9% (45.5%) (145.3%) — Return on assets (ROA) (4.4%) 0.2% 0.7% (13.7%) (23.2%) — Equity ratio 38.6% 36.8% 35.6% 23.9% 6.0% —
Yen(millions)
U.S. Dollars (thousands)
2009 2010 2011 2012 2013 2013
Net Sales ¥ 2,847,227 ¥ 2,755,948 ¥ 3,021,973 ¥ 2,455,850 ¥ 2,478,586 $ 26,651,462
Sales by Product Group (Sales to Outside Customers)
Audio-Visual and Communication Equipment 1,367,600 1,332,129 1,426,243 1,060,770 732,017 7,871,150 Health and Environmental Equipment 225,290 244,090 269,845 292,224 309,613 3,329,172 Information Equipment 306,077 266,920 273,900 277,561 296,787 3,191,258 Consumer/Information Products 1,898,967 1,843,139 1,969,988 1,630,555 1,338,417 14,391,580 LCDs 573,854 508,630 614,373 420,226 650,847 6,998,355 Solar Cells 157,095 208,732 265,492 223,869 259,895 2,794,570 Other Electronic Devices 217,311 195,447 172,120 181,200 229,427 2,466,957 Electronic Components 948,260 912,809 1,051,985 825,295 1,140,169 12,259,882 Total 2,847,227 2,755,948 3,021,973 2,455,850 2,478,586 26,651,462
Sales by Region*2
Japan 1,302,261 1,429,057 — — — — The Americas 488,428 342,923 — — — — Europe 451,090 393,212 — — — — China 407,777 365,440 — — — — Other 197,671 225,316 — — — — Total 2,847,227 2,755,948 — — — —
Japan — 1,429,057 1,592,909 1,181,168 1,007,264 10,830,795 The Americas — 283,641 302,021 288,380 355,288 3,820,301 Europe — 336,642 367,962 282,606 174,381 1,875,065 China — 422,881 516,977 483,298 667,933 7,182,075 Other — 283,727 242,104 220,398 273,720 2,943,226 Total — 2,755,948 3,021,973 2,455,850 2,478,586 26,651,462
*1 The amount of leased properties is included in capital investment.
*2 Effective for the year ended March 31, 2011, the Company has applied the “Accounting Standard for Disclosures about Segments of an Enterprise and Related Information” (Accounting Standards Board of Japan (ASBJ) Statement No. 17, issued by the ASBJ on March 27, 2009) and the “Guidance on Accounting Stand-ard for Disclosures about Segments of an Enterprise and Related Information” (ASBJ Guidance No. 20, issued by the ASBJ on March 21, 2008). In this regard, “Sales by Region” of 2010 has been restated to conform with the 2011 presentation.
Financial Section
Financial Section
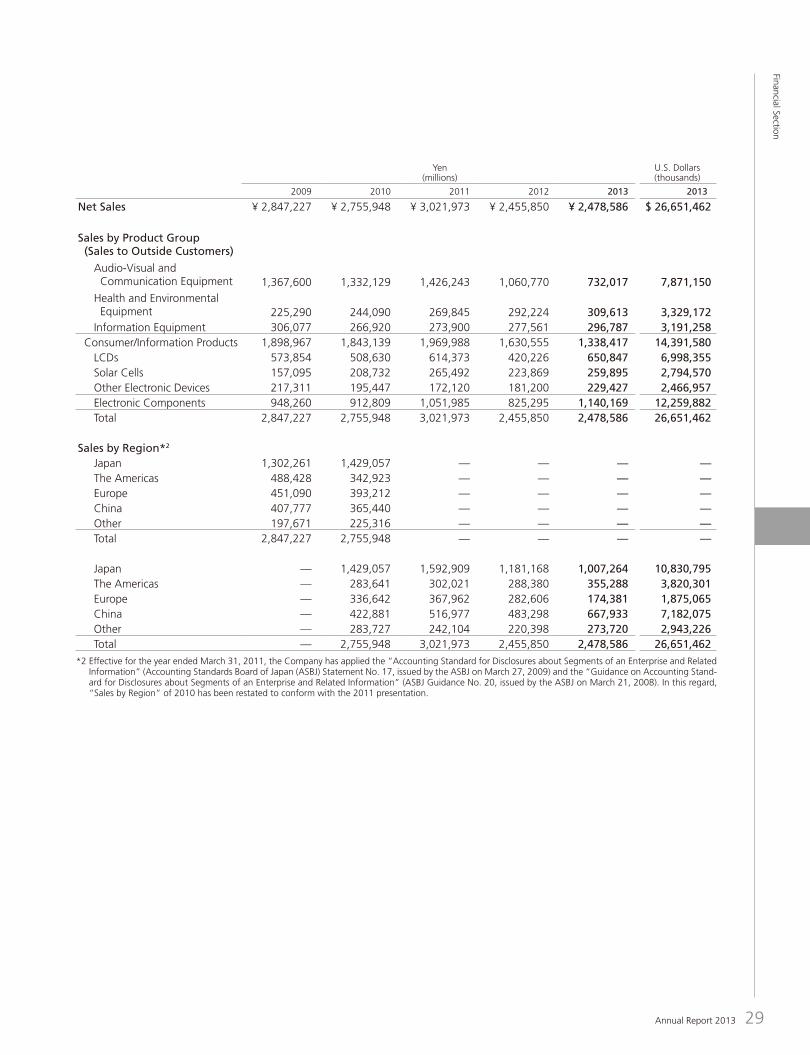

30 SHARP CORPORATION Annual Report 2013 31
Financial Section
Financial Section
Financial ReviewSharp Corporation and Consolidated Subsidiaries
Operations
Consolidated net sales for the year ended March 31, 2013
amounted to ¥2,478,586 million, up 0.9% from the previous year.
Financial Results
Cost of sales increased by ¥174,161 million over the previous
year to ¥2,218,003 million, and the cost of sales ratio rose from
83.2% to 89.5%.
Selling, general and administrative (SG&A) expenses declined
by ¥42,711 million to ¥406,849 million, and the ratio of SG&A
expenses against net sales fell from 18.3% to 16.4%, compared
with the previous year. SG&A expenses included R&D expendi-
tures of ¥32,508 million and employees’ salaries and other ben-
efits expenses of ¥110,009 million.
As a result, the operating loss amounted to ¥146,266 million,
compared with the loss of ¥37,552 million in the previous year.
Other expenses, net of other income, resulted in a net loss
position and amounted to ¥319,921 million.
Accordingly, the loss before income taxes and minority interests
was ¥466,187 million, compared with the loss of ¥238,429 mil-
lion in the previous year, and the net loss was ¥545,347 million,
compared with the loss of ¥376,076 million in the previous year.
The net loss per share of common stock was ¥489.83.
Segment Information
Sales in the Consumer/Information Products segment declined
by 17.9% over the previous year to ¥1,339,741 million, and the
operating income fell 8.5% to ¥46,695 million.
Sales in the Electronic Components segment increased by
16.3% to ¥1,376,113 million, and the operating loss widened
from ¥54,699 million to ¥159,007 million.
[Reference Information]
Information by Product Group
Consumer/Information Products
Audio-Visual and Communication Equipment
In this product group, sales declined by 31.0% to ¥732,651
million, and the operating loss was ¥9,858 million, which was
greater than the loss of ¥6,194 million in the previous year. Sales
of LCD TVs declined significantly over the previous year, despite
an increase in sales volume in ASEAN nations and other emerg-
ing countries. This was mainly due to sluggish demand in Japan
and a sales decline in China stemming from worsening Japan–
China relations. Mobile phone sales were impacted by languish-
ing volume sales caused by severe competition with overseas
manufacturers, as well as supply shortages of key components
in the first half of the fiscal year.
Health and Environmental Equipment
Sales in this group grew by 5.9% to ¥309,673 million, due main-
ly to healthy sales of air conditioners and air purifiers in Japan
and overseas. The operating income rose by 9.3% to ¥32,210
million.
Information Equipment
Sales in this group increased by 7.1% to ¥297,417 million, thanks
to robust sales of color MFPs and information displays. The op-
erating income decreased by 12.3% to ¥24,343 million, due
mainly to falling prices stemming from intensified competition.
Electronic Components
LCDs
Sales in this group increased by 17.4% to ¥846,716 million.
This was due mainly to increased sales of small- and medium-
size LCDs for smartphones and tablet terminals. The operating
loss amounted to ¥138,991 million, compared with a loss of
¥42,236 million in the previous year. This was primarily due to
efforts to optimize inventory levels, including making production
adjustments at plants for large-size LCDs in the first half of the
year.
Solar Cells
Sales in this group rose by 16.1% to ¥259,916 million, owing
-600
-500
-400
-300
-200
-100
0
100
0
100
200
300
400
0
500
1,000
1,500
2,000
2,500
-160
-120
-80
-40
0
40
80
0
1,000
2,000
3,000
4,000
0
100
200
300
400
500
600
0
200
400
600
800
1,000
1,200
0
100
200
300
400
0
10
20
30
40
50
0
1,000
2,000
3,000
0
30
60
90
Ratio to net sales [right axis]
Operating income (loss)Net income (loss)
Cost of Sales
09 10 11 12 13
09 10 11 12 13
09 10 11 12 13
Net Sales(billions of yen)
09 10 11 12 13
Inventories(billions of yen)
09 10 11 12 13
Interest-Bearing Debt(billions of yen)
09 10 11 12 13
Cash and Cash Equivalents(billions of yen)
09 10 11 12 13
Equity Ratio(%)
Operating Income (Loss)/Net Income (Loss)(billions of yen)
Capital investmentDepreciation and amortization
09 10 11 12 13
Capital Investment/Depreciation and Amortization(billions of yen)
Consumer/Information ProductsElectronic Components
09 10 11 12 13
Sales(billions of yen)
Consumer/Information ProductsElectronic Components
09 10 11 12 13
Operating Income (Loss)(billions of yen)
(billions of yen) (%)
Sales by Product GroupYen
(millions)U.S. Dollars(thousands)
2011 2012 2013 2013
Audio-Visual and Communication Equipment ¥ 1,426,734 ¥ 1,061,092 ¥ 732,651 $ 7,877,968 Health and Environmental Equipment 269,883 292,303 309,673 3,329,817 Information Equipment 273,953 277,604 297,417 3,198,032Consumer/Information Products 1,970,570 1,630,999 1,339,741 14,405,817
LCDs 1,026,959 720,978 846,716 9,104,473 Solar Cells 265,538 223,916 259,916 2,794,796 Other Electronic Devices 261,520 238,114 269,481 2,897,645Electronic Components 1,554,017 1,183,008 1,376,113 14,796,914
Adjustments (502,614) (358,157) (237,268) (2,551,269)Total 3,021,973 2,455,850 2,478,586 26,651,462
-600
-500
-400
-300
-200
-100
0
100
0
100
200
300
400
0
500
1,000
1,500
2,000
2,500
-160
-120
-80
-40
0
40
80
0
1,000
2,000
3,000
4,000
0
100
200
300
400
500
600
0
200
400
600
800
1,000
1,200
0
100
200
300
400
0
10
20
30
40
50
0
1,000
2,000
3,000
0
30
60
90
Ratio to net sales [right axis]
Operating income (loss)Net income (loss)
Cost of Sales
09 10 11 12 13
09 10 11 12 13
09 10 11 12 13
Net Sales(billions of yen)
09 10 11 12 13
Inventories(billions of yen)
09 10 11 12 13
Interest-Bearing Debt(billions of yen)
09 10 11 12 13
Cash and Cash Equivalents(billions of yen)
09 10 11 12 13
Equity Ratio(%)
Operating Income (Loss)/Net Income (Loss)(billions of yen)
Capital investmentDepreciation and amortization
09 10 11 12 13
Capital Investment/Depreciation and Amortization(billions of yen)
Consumer/Information ProductsElectronic Components
09 10 11 12 13
Sales(billions of yen)
Consumer/Information ProductsElectronic Components
09 10 11 12 13
Operating Income (Loss)(billions of yen)
(billions of yen) (%)

32 SHARP CORPORATION Annual Report 2013 33
mainly to higher sales in residential as well as industrial use ap-
plications in Japan, including mega-solar power generation. The
operating loss totaled ¥4,497 million, which improved from the
loss of ¥21,982 million in the previous year. The decrease in sell-
ing prices stemming from intensified competition resulted in the
operating loss.
Other Electronic Devices
Sales in this group increased by 13.2% to ¥269,481 million,
thanks mainly to growth in sales of camera modules for smart-
phones and tablet terminals, as well as higher sales of LEDs. The
operating loss was ¥15,519 million, compared with operating
income of ¥9,519 million in the previous year. This was primarily
due to efforts to optimize inventory levels.
Capital Investment and Depreciation
Capital investment totaled ¥82,458 million, down 30.6% from
the previous year. Much of this investment was allocated to ex-
pansion and improvement of the production lines for small- and
medium-size LCDs, in order to meet flourishing demand for LCDs
for mobile devices such as smartphones and tablet terminals.
By business segment, capital investment was ¥19,772 mil-
lion for Consumer/Information Products and ¥58,316 million for
Electronic Components. Unallocated capital investment amount-
ed to ¥4,370 million.
Depreciation and amortization declined by 26.4% to
¥197,880 million.
Assets, Liabilities and Net Assets
Total assets amounted to ¥2,087,763 million, down ¥526,372
million from the end of the previous year.
Assets
Current assets amounted to ¥1,221,835 million, down
¥199,290 million. This was due mainly to a decrease in inven-
tories by ¥216,774 million to ¥310,709 million. Included in
inventories, finished products decreased by ¥36,847 million to
¥157,373 million; work in process declined by ¥174,146 million
to ¥90,431 million; and raw materials and supplies were down
¥5,781 million to ¥62,905 million.
Plant and equipment declined by ¥308,743 million to
¥563,699 million, due mainly to deconsolidation of Sakai Display
Products Corporation.
Investments and other assets amounted to ¥302,229 million,
down ¥18,339 million. This was due mainly to a reduction in
investments in securities due to the sale of shareholdings as well
as decrease in other assets, which was partially offset by the
increase in investments in nonconsolidated subsidiaries and af-
filiates due to the deconsolidation of Sakai Display Products Cor-
poration, which was accounted for under the equity method.
Liabilities
Current liabilities increased by ¥276,453 million to ¥1,667,533
million. Short-term borrowings rose by ¥326,116 million to
¥924,113 million. This was due mainly to an increase in bank
loans by ¥411,169 million to ¥610,254 million and an increase
in current portion of long-term debt by ¥265,947 million to
¥313,859 million, which was partially offset by a decrease in
commercial paper by ¥351,000 million to zero. Notes and ac-
counts payable declined by ¥30,949 million to ¥405,624 million.
Long-term liabilities decreased by ¥292,542 million to
¥285,393 million. This was due mainly to a ¥278,850 million
decline in long-term debt.
Interest-bearing debt at fiscal year-end stood at ¥1,174,423
million, up ¥47,266 million from the previous year.
Net Assets
Net assets amounted to ¥134,837 million, a decrease of ¥510,283
million. This was due mainly to a turnaround from retained earn-
ings of ¥259,937 million in the previous year to accumulated defi-
cits of ¥290,912 million. The equity ratio was 6.0%.
Cash Flows
Cash and cash equivalents at the end of year stood at ¥187,866
million, down ¥5,906 million over the previous year, as cash out-
flows from operating activities exceeded combined cash inflows
from investing and financing activities.
Net cash used in operating activities amounted to ¥81,075
million, an improvement of ¥62,227 million from the previous
year. This was due mainly to a turnaround in inventories from
a ¥48,686 million increase in the previous year to a ¥228,510
million decrease, while the loss before income taxes and minor-
ity interests deteriorated by ¥227,758 million, compared to the
previous year.
Net cash provided by investing activities totaled ¥7,110
million, compared to net cash used in investing activities of
¥159,557 million in the previous year. This was due mainly to
¥65,143 million in proceeds from sales of stocks of subsidiar-
ies and affiliates resulting in change in scope of consolidation,
as well as a ¥56,709 million year-on-year decrease in purchase
of property, plant and equipment and a ¥19,279 million year-
on-year increase in proceeds from sales of property, plant and
equipment.
Net cash provided by financing activities was ¥51,637 million,
with cash inflows down by ¥204,744 million from the previous
year. The main factors included a ¥220,182 million year-on-year
decline in net increase in short-term borrowings.
-600
-500
-400
-300
-200
-100
0
100
0
100
200
300
400
0
500
1,000
1,500
2,000
2,500
-160
-120
-80
-40
0
40
80
0
1,000
2,000
3,000
4,000
0
100
200
300
400
500
600
0
200
400
600
800
1,000
1,200
0
100
200
300
400
0
10
20
30
40
50
0
1,000
2,000
3,000
0
30
60
90
Ratio to net sales [right axis]
Operating income (loss)Net income (loss)
Cost of Sales
09 10 11 12 13
09 10 11 12 13
09 10 11 12 13
Net Sales(billions of yen)
09 10 11 12 13
Inventories(billions of yen)
09 10 11 12 13
Interest-Bearing Debt(billions of yen)
09 10 11 12 13
Cash and Cash Equivalents(billions of yen)
09 10 11 12 13
Equity Ratio(%)
Operating Income (Loss)/Net Income (Loss)(billions of yen)
Capital investmentDepreciation and amortization
09 10 11 12 13
Capital Investment/Depreciation and Amortization(billions of yen)
Consumer/Information ProductsElectronic Components
09 10 11 12 13
Sales(billions of yen)
Consumer/Information ProductsElectronic Components
09 10 11 12 13
Operating Income (Loss)(billions of yen)
(billions of yen) (%)
Notes: 1. Effective for the year ended March 31, 2011, the Company has ap-plied the “Accounting Standard for Disclosures about Segments of an Enterprise and Related Information” (ASBJ Statement No. 17, issued by the ASBJ on March 27, 2009) and the “Guidance on Ac-counting Standard for Disclosures about Segments of an Enterprise and Related Information” (ASBJ Guidance No. 20, issued by the ASBJ on March 21, 2008). As a result, figures for 2010 included in “Segment Information” have been restated to conform with the 2011 presentation.
2. Sales figures by segment and product group shown in “Segment In-formation” include internal sales between segments (Consumer/In-formation Products and Electronic Components). Operating income (loss) figures are the amounts before adjustment for intersegment trading.
3. Capital investment figures shown in “Capital Investment and Depre-ciation” include the amount of leased properties.
Financial Section
Financial Section

34 SHARP CORPORATION Annual Report 2013 35
Financial Section
Yen(millions)
U.S. Dollars(thousands)
LIABILITIES AND NET ASSETS 2011 2012 2013 2013
Current Liabilities: Short-term borrowings, including current portion of long-term debt (Notes 5 and 7)
¥ 287,330 ¥ 597,997 ¥ 924,113 $ 9,936,699
Notes and accounts payable (Note 7) — Trade 524,641 384,322 341,351 3,670,441 Construction and other 71,356 47,804 40,616 436,731 Nonconsolidated subsidiaries and affiliates 6,084 4,447 23,657 254,377 Accrued expenses 217,339 195,506 240,394 2,584,882 Income taxes (Note 4) 12,471 5,963 6,206 66,731 Other current liabilities (Note 4) 126,692 155,041 91,196 980,602 Total current liabilities 1,245,913 1,391,080 1,667,533 17,930,463
Long-term Liabilities: Long-term debt (Notes 5 and 7) 559,920 529,160 250,310 2,691,505 Allowance for severance and pension benefits (Note 12) 4,618 6,000 6,501 69,903 Deferred tax liabilities (Note 4) 11,600 29,304 14,044 151,011 Other long-term liabilities 14,982 13,471 14,538 156,323
591,120 577,935 285,393 3,068,742
Contingent Liabilities (Note 11)
Net Assets (Note 9): Common stock: Authorized — 2,500,000 thousand shares
Issued — 1,110,699 thousand shares in 2011 and 2012, and 1,176,623 thousand shares in 2013 204,676 204,676 212,337 2,283,193 Capital surplus 268,530 268,528 276,179 2,969,667 Retained earnings (accumulated deficits) 648,935 259,937 (290,912) (3,128,086) Less cost of treasury stock:
10,353 thousand shares, 10,375 thousand shares and 10,399 thousand shares in 2011, 2012 and 2013 (13,863) (13,876) (13,872) (149,161)
Net unrealized holding gains (losses) on securities 5,915 5,610 6,062 65,183 Deferred gains (losses) on hedges (1,028) (5,749) (25) (269) Foreign currency translation adjustments (85,317) (90,305) (61,467) (660,936) Pension liability adjustment of foreign subsidiaries (1,815) (2,927) (3,631) (39,043)
Minority interests 22,612 19,226 10,166 109,312 Total net assets 1,048,645 645,120 134,837 1,449,860
¥ 2,885,678 ¥ 2,614,135 ¥ 2,087,763 $ 22,449,065
Consolidated Balance SheetsSharp Corporation and Consolidated Subsidiaries as of March 31, 2011, 2012 and 2013
Financial Section
Yen(millions)
U.S. Dollars (thousands)
ASSETS 2011 2012 2013 2013
Current Assets: Cash and cash equivalents (Note 7) ¥ 241,110 ¥ 193,772 ¥ 187,866 $ 2,020,065 Time deposits (Note 7) 1,053 1,341 74 796 Restricted cash (Notes 2 and 7) 5,725 212 4,001 43,021 Notes and accounts receivable (Note 7) — Trade 379,609 368,561 416,107 4,474,269 Other 202,824 76,730 122,499 1,317,193 Nonconsolidated subsidiaries and affiliates 15,996 12,164 24,882 267,548 Allowance for doubtful receivables (2,730) (4,407) (5,259) (56,548) Inventories (Note 3) 486,060 527,483 310,709 3,340,957 Deferred tax assets (Note 4) 93,810 90,394 19,369 208,269 Other current assets 99,093 154,875 141,587 1,522,441 Total current assets 1,522,550 1,421,125 1,221,835 13,138,011
Property, Plant and Equipment, at Cost (Note 6): Land 100,124 98,840 94,448 1,015,570 Buildings and structures 840,912 841,205 713,657 7,673,731 Machinery, equipment, vehicles and others 2,041,523 2,030,081 1,726,978 18,569,656 Construction in progress 31,269 81,245 22,874 245,957
3,013,828 3,051,371 2,557,957 27,504,914 Less accumulated depreciation (2,048,914) (2,178,929) (1,994,258) (21,443,634)
964,914 872,442 563,699 6,061,280
Investments and Other Assets: Goodwill 24,338 23,129 21,064 226,495 Investments in securities (Notes 2 and 7) 57,505 58,859 49,666 534,043 Investments in nonconsolidated subsidiaries and affiliates (Note 7) 40,960 40,547 106,790 1,148,279 Bond issue cost 2,316 1,458 610 6,559 Other assets 273,095 196,575 124,099 1,334,398
398,214 320,568 302,229 3,249,774 ¥ 2,885,678 ¥ 2,614,135 ¥ 2,087,763 $ 22,449,065
The accompanying notes to the consolidated financial statements are an integral part of these statements.
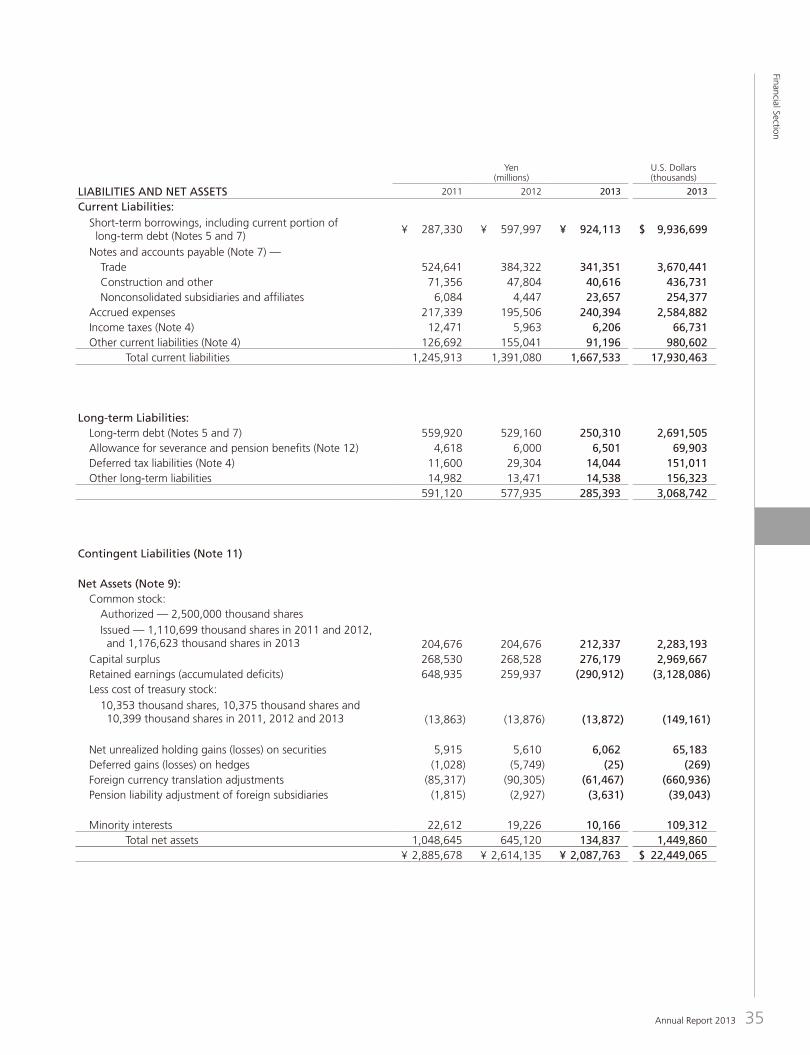

36 SHARP CORPORATION
Consolidated Statements of OperationsSharp Corporation and Consolidated Subsidiaries for the Years Ended March 31, 2011, 2012 and 2013
Yen(millions)
U.S. Dollars(thousands)
2011 2012 2013 2013
Net Sales ¥ 3,021,973 ¥ 2,455,850 ¥ 2,478,586 $ 26,651,462
Cost of Sales 2,452,345 2,043,842 2,218,003 23,849,494 Gross profit 569,628 412,008 260,583 2,801,968
Selling, General and Administrative Expenses 490,732 449,560 406,849 4,374,721 Operating income (loss) 78,896 (37,552) (146,266) (1,572,753)
Other Income (Expenses): Interest and dividends income 3,119 2,730 2,278 24,495 Interest expenses (8,001) (8,646) (13,170) (141,613) Subsidy income — 10,000 — — Impairment loss (Note 14) — (6,656) (47,396) (509,634) Loss on valuation of investment securities — — (3,782) (40,667) Loss on sales of stocks of subsidiaries and affiliates — — (3,583) (38,527) Loss on quality compensation — (11,500) — — Loss on suspension of large size LCD plant operation (Note 15) — (25,887) — — Restructuring charges (Note 16) (12,655) (117,110) (143,397) (1,541,903) Settlement package — (18,857) (17,899) (192,462) Provision for loss on litigation — — (32,321) (347,538) Loss on charge in equity — — (705) (7,581) Other, net (20,479) (24,951) (59,946) (644,580)
(38,016) (200,877) (319,921) (3,440,010) Income (loss) before income taxes and minority interests 40,880 (238,429) (466,187) (5,012,763)
Income Taxes (Note 4): Current 26,927 19,617 17,607 189,323 Deferred (7,244) 115,523 59,972 644,860
19,683 135,140 77,579 834,183 Income (loss) before minority interests 21,197 (373,569) (543,766) (5,846,946)
Minority Interests in Income of Consolidated Subsidiaries (1,796) (2,507) (1,581) (17,000) Net income (loss) ¥ 19,401 ¥ (376,076) ¥ (545,347) $ (5,863,946)
Yen U.S. Dollars
2011 2012 2013 2013Per Share of Common Stock (Note 9): Net income (loss) ¥ 17.63 ¥ (341.78) ¥ (489.83) $ (5.27) Diluted net income 16.47 — — — Cash dividends 17.00 10.00 0.00 0.00The accompanying notes to the consolidated financial statements are an integral part of these statements.Diluted net loss per share computation for the years ended March 31, 2012 and 2013 are not presented since net loss were recorded.
Financial Section

Annual Report 2013 37
Consolidated Statements of Comprehensive IncomeSharp Corporation and Consolidated Subsidiaries for the Years Ended March 31, 2011, 2012 and 2013
Yen(millions)
U.S. Dollars(thousands)
2011 2012 2013 2013
Income (Loss) before Minority Interests ¥ 21,197 ¥ (373,569) ¥ (543,766) $ (5,846,946)
Other Comprehensive Income: Net unrealized holding gains (losses) on securities (1,460) (515) 451 4,849 Deferred gains (losses) on hedges (1,246) (4,725) 5,915 63,602 Foreign currency translation adjustments (13,254) (5,137) 30,150 324,194 Pension liability adjustment of foreign subsidiaries (612) (1,112) (703) (7,559) Share of other comprehensive income of affiliates accounted for using equity method (236) 178 75 806 Total other comprehensive income (16,808) (11,311) 35,888 385,892
Comprehensive Income 4,389 (384,880) (507,878) (5,461,054)
Comprehensive income attributable to: Owners of the parent 3,052 (387,418) (511,037) (5,495,022) Minority interests 1,337 2,538 3,159 33,968
Financial Section

38 SHARP CORPORATION
Consolidated Statements of Changes in Net AssetsSharp Corporation and Consolidated Subsidiaries for the Years Ended March 31, 2011, 2012 and 2013
Financial Section
(thousands) Yen (millions)
Number ofShares
Commonstock
(Note 9)
Capitalsurplus
(Note 9)
Retainedearnings
(accumulateddeficits)(Note 9)
Treasurystock
Netunrealized
holdinggains (losses)on securities
Deferredgains (losses)
on hedges
Foreigncurrency
translationadjustments
Pensionliability
adjustmentof foreign
subsidiariesMinorityinterests Total
Balance at beginning of fiscal 2011 1,110,699 ¥ 204,676 ¥ 268,534 ¥ 649,795 ¥ (13,805) ¥ 7,372 ¥ 218 ¥ (72,283) ¥ 0 ¥ 21,353 ¥ 1,065,860
Effect of changes in accounting policies applied to foreign affiliates accounted for by equity method (14) (14) Transfer to pension liability adjustment of foreign subsidiaries from retained earnings 1,203 (1,203) 0 Net income 19,401 19,401
Dividends from surplus (22,008) (22,008)
Change of scope of consolidation (438) (438)
Change of scope of equity method 996 996
Purchase of treasury stock (68) (68)
Disposal of treasury stock (4) 10 6
Net changes of items other than shareholders’ equity (1,457) (1,246) (13,034) (612) 1,259 (15,090)
Balance at end of fiscal 2011 1,110,699 ¥ 204,676 ¥ 268,530 ¥ 648,935 ¥ (13,863) ¥ 5,915 ¥ (1,028) ¥ (85,317) ¥ (1,815) ¥ 22,612 ¥ 1,048,645
(thousands) Yen (millions)
Number ofShares
Commonstock
(Note 9)
Capitalsurplus
(Note 9)
Retainedearnings
(accumulateddeficits)(Note 9)
Treasurystock
Netunrealized
holdinggains (losses)on securities
Deferredgains (losses)
on hedges
Foreigncurrency
translationadjustments
Pensionliability
adjustmentof foreign
subsidiariesMinorityinterests Total
Balance at beginning of fiscal 2012 1,110,699 ¥ 204,676 ¥ 268,530 ¥ 648,935 ¥ (13,863) ¥ 5,915 ¥ (1,028) ¥ (85,317) ¥ (1,815) ¥ 22,612 ¥ 1,048,645 Net loss (376,076) (376,076)
Dividends from surplus (13,204) (13,204)
Change of scope of consolidation 113 113
Change of scope of equity method 169 169
Purchase of treasury stock (18) (18)
Disposal of treasury stock (2) 5 3
Net changes of items other than shareholders’ equity (305) (4,721) (4,988) (1,112) (3,386) (14,512)
Balance at end of fiscal 2012 1,110,699 ¥ 204,676 ¥ 268,528 ¥ 259,937 ¥ (13,876) ¥ 5,610 ¥ (5,749) ¥ (90,305) ¥ (2,927) ¥ 19,226 ¥ 645,120
(thousands) Yen (millions)
Number ofShares
Commonstock
(Note 9)
Capitalsurplus
(Note 9)
Retainedearnings
(accumulateddeficits)(Note 9)
Treasurystock
Netunrealized
holdinggains (losses)on securities
Deferredgains (losses)
on hedges
Foreigncurrency
translationadjustments
Pensionliability
adjustmentof foreign
subsidiariesMinorityinterests Total
Balance at beginning of fiscal 2013 1,110,699 ¥ 204,676 ¥ 268,528 ¥ 259,937 ¥ (13,876) ¥ 5,610 ¥ (5,749) ¥ (90,305) ¥ (2,927) ¥ 19,226 ¥ 645,120 Net loss (545,347) (545,347) Dividends from surplus (5,502) (5,502) Issuance of new shares 65,924 7,661 7,661 15,322 Purchase of treasury stock (10) (10) Disposal of treasury stock (10) 14 4
Net changes of items other than shareholders’ equity 25,250 452 5,724 28,838 (704) (9,060)Balance at end of fiscal 2013 1,176,623 ¥ 212,337 ¥ 276,179 ¥ (290,912) ¥ (13,872) ¥ 6,062 ¥ (25) ¥ (61,467) ¥ (3,631) ¥ 10,166 ¥ 134,837
(thousands) U.S. Dollars (thousands)
Number ofShares
Commonstock
(Note 9)
Capitalsurplus
(Note 9)
Retainedearnings
(accumulateddeficits)(Note 9)
Treasurystock
Netunrealized
holdinggains (losses)on securities
Deferredgains (losses)
on hedges
Foreigncurrency
translationadjustments
Pensionliability
adjustmentof foreign
subsidiariesMinorityinterests Total
Balance at beginning of fiscal 2013 1,110,699 $ 2,200,817 $ 2,887,398 $ 2,795,021 $ (149,204) $ 60,323 $ (61,817) $ (971,022) $ (31,473) $ 206,731 $ 6,936,774 Net loss (5,863,946) (5,863,946) Dividends from surplus (59,161) (59,161) Issuance of new shares 65,924 82,376 82,376 164,752 Purchase of treasury stock (107) (107) Disposal of treasury stock (107) 150 43
Net changes of items other than shareholders’ equity 4,860 61,548 310,086 (7,570) (97,419) 271,505 Balance at end of fiscal 2013 1,176,623 $ 2,283,193 $ 2,969,667 $ (3,128,086) $ (149,161) $ 65,183 $ (269) $ (660,936) $ (39,043) $ 109,312 $ 1,449,860 The accompanying notes to the consolidated financial statements are an integral part of these statements.

Annual Report 2013 39
Consolidated Statements of Cash FlowsSharp Corporation and Consolidated Subsidiaries for the Years Ended March 31, 2011, 2012 and 2013
Financial Section
Yen(millions)
U.S. Dollars(thousands)
2011 2012 2013 2013
Cash Flows from Operating Activities: Income (loss) before income taxes and minority interests ¥ 40,880 ¥ (238,429) ¥ (466,187) $ (5,012,763) Adjustments to reconcile income (loss) before income taxes and minority interests to net cash (used in) provided by operating activities — Depreciation and amortization of properties and intangibles 272,081 248,425 177,765 1,911,452 Interest and dividends income (3,119) (2,730) (2,278) (24,495) Interest expenses 8,001 8,646 13,170 141,613 Foreign exchange gains (938) (1,268) (1,684) (18,108) Loss on sales and retirement of noncurrent assets 7,376 5,950 15,612 167,871 Subsidy income — (10,000) — — Impairment loss — 6,656 78,922 848,624 Loss on valuation of investment securities — — 3,782 40,667 Loss on sales of stocks of subsidiaries and affiliates — — 3,583 38,527 Loss on quality compensation — 11,500 — — Special extra retirement payments — — 25,496 274,150 Settlement package — 18,857 17,899 192,462 Increase in provision for loss on litigation — — 32,321 347,538 (Increase) decrease in notes and accounts receivable (82,209) 149,905 (41,176) (442,753) Decrease (increase) in inventories (83,749) (48,686) 228,510 2,457,097 Decrease in payables (762) (147,162) (89,765) (965,215) Other, net 41,684 (89,976) (19,721) (212,054) Total 199,245 (88,312) (23,751) (255,387) Interest and dividends income received 3,664 3,169 2,656 28,559 Interest expenses paid (8,148) (8,572) (13,028) (140,086) Subsidy income received — — 10,000 107,527 Special extra retirement payments paid — — (25,289) (271,925) Settlement package paid — (18,622) (16,894) (181,656) Income taxes paid (27,318) (30,965) (14,769) (158,806) Net cash (used in) provided by operating activities 167,443 (143,302) (81,075) (871,774)
Cash Flows from Investing Activities: Payments into time deposits (13,200) (603) (101) (1,086) Proceeds from withdrawal of time deposits 31,641 443 718 7,720 Purchase of investments in subsidiaries and affiliates resulting in change in scope of consolidation (24,524) (4,405) (366) (3,935) Proceeds from sales of stocks of subsidiaries and affiliates resulting in change in scope of consolidation — — 65,143 700,462 Purchase of property, plant and equipment (195,404) (118,168) (61,459) (660,849) Proceeds from sales of property, plant and equipment 992 2,547 21,826 234,688 Purchase of investment securities and investments in nonconsolidated subsidiaries and affiliates (9,738) (3,326) (1,935) (20,806) Proceeds from sales of investment securities and investments in nonconsolidated subsidiaries and affiliates 130 22 10,359 111,387 Other, net (34,510) (36,067) (27,075) (291,129) Net cash provided by (used in) investing activities (244,613) (159,557) 7,110 76,452
Cash Flows from Financing Activities: Net increase in short-term borrowings 7,328 305,595 85,413 918,419 Proceeds from long-term debt 85,725 13,286 23,417 251,796 Repayments of long-term debt (78,162) (53,462) (51,338) (552,022) Cash dividends paid (21,999) (13,237) (5,500) (59,140) Other, net 854 4,199 (355) (3,817) Net cash provided by (used in) financing activities (6,254) 256,381 51,637 555,236
Effect of Exchange Rate Change on Cash and Cash Equivalents (3,790) (1,080) 16,418 176,538Net Decrease in Cash and Cash Equivalents (87,214) (47,558) (5,910) (63,548)Cash and Cash Equivalents at Beginning of Year 328,125 241,110 193,772 2,083,570Increase in Cash and Cash Equivalents from Newly Consolidated Subsidiary 199 220 4 43Cash and Cash Equivalents at End of Year ¥ 241,110 ¥ 193,772 ¥ 187,866 $ 2,020,065
The accompanying notes to the consolidated financial statements are an integral part of these statements.
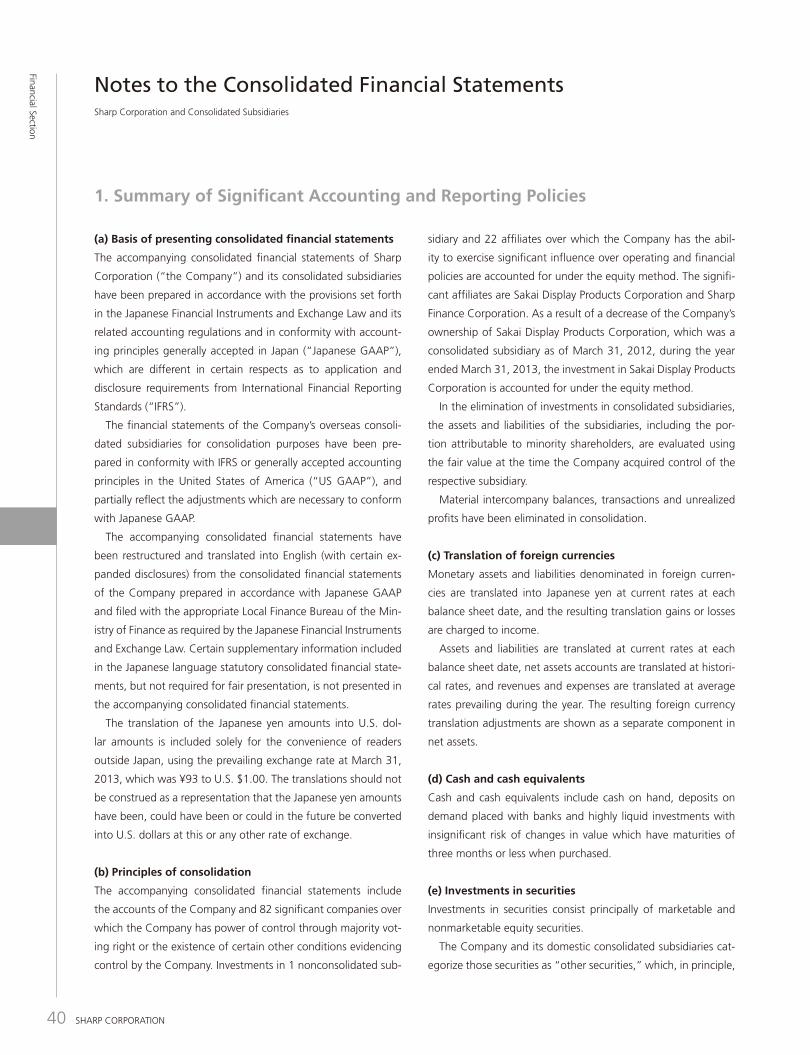
40 SHARP CORPORATION Annual Report 2013 41
Financial Section
include all securities other than trading securities and held-to-
maturity securities.
Other securities with available fair market values are stated at
fair market value, which is calculated as the average of market
prices during the last month of the fiscal year. Unrealized holding
gains and losses on these securities are reported, net of applica-
ble income taxes, as a separate component of net assets. Real-
ized gains and losses on the sale of such securities are computed
principally using average cost.
Other securities with no available fair market values are stated
at average cost.
If the fair market value of other securities declines significantly,
such securities are stated at fair market value and the difference
between the fair market value and the carrying amount is rec-
ognized as loss in the period of decline. If the net asset value of
other securities with no available fair market values declines sig-
nificantly, the securities are written down to the net asset value
and charged to income. In these cases, the fair market value or
the net asset value is carried forward to the next year.
(f) Inventories
Inventories held by the Company and its domestic consolidated
subsidiaries are primarily measured at moving average cost (for
balance sheet valuation, in the event that an impairment is de-
termined inventories impairment is computed using net realiz-
able value). For overseas consolidated subsidiaries, inventories
are measured at the lower of moving average cost and net re-
alizable value.
(g) Depreciation and amortization
For the Company and its domestic consolidated subsidiar-
ies, depreciation of plant and equipment other than lease as-
sets is computed using the declining-balance method, except
for machinery and equipment at the LCD plants in Mie and
Kameyama and the buildings (excluding attached structures) ac-
quired by the Company and its domestic consolidated subsidiar-
ies on and after April 1, 1998; all of which are depreciated using
the straight-line method over the estimated useful life of the
asset. Properties at overseas consolidated subsidiaries are depre-
ciated using the straight-line method.
Maintenance and repairs, including minor renewals and bet-
terments, are charged to income as incurred.
Amortization of intangible assets except for lease assets is
computed using the straight-line method.
Software costs are included in other assets. Software used by
the Company is amortized using the straight-line method over
the estimated useful life of principally 5 years, and software em-
bedded in products is amortized over the forecasted sales quan-
tity.
Depreciation of lease assets under finance leases that do not
transfer ownership is computed using the straight-line method,
using the lease period as the depreciable life and the residual
value as zero. Lease payments are recognized as expenses for fi-
nance leases of the Company and its domestic consolidated sub-
sidiaries that do not transfer ownership for which the starting
date of the lease transaction is on and before March 31, 2008.
(h) Accrued bonuses
The Company and its domestic consolidated subsidiaries accrue
estimated amounts of employees’ bonuses based on the esti-
mated amounts to be paid in the subsequent period.
(i) Provision for loss on litigation
Out of possible future loss on litigation, the Company and its
domestic consolidated subsidiaries accrue estimated amounts
for possible future loss on litigation in amounts considered nec-
essary.
(j) Income taxes
The asset and liability approach is used to recognize deferred tax
assets and liabilities for the expected future tax consequences of
temporary differences between the carrying amounts of assets
and liabilities for financial reporting purposes and the amounts
used for income tax purposes.
(k) Severance and pension benefits
The Company and its domestic consolidated subsidiaries have
primarily a trustee non-contributory defined benefit pension
plan for their employees to supplement a governmental welfare
pension plan.
Certain overseas consolidated subsidiaries primarily have de-
fined contribution pension plans and lump-sum retirement ben-
efit plans.
The Company and its domestic consolidated subsidiaries pro-
Financial Section
Notes to the Consolidated Financial StatementsSharp Corporation and Consolidated Subsidiaries
(a) Basis of presenting consolidated financial statements
The accompanying consolidated financial statements of Sharp
Corporation (“the Company”) and its consolidated subsidiaries
have been prepared in accordance with the provisions set forth
in the Japanese Financial Instruments and Exchange Law and its
related accounting regulations and in conformity with account-
ing principles generally accepted in Japan (“Japanese GAAP”),
which are different in certain respects as to application and
disclosure requirements from International Financial Reporting
Standards (“IFRS”).
The financial statements of the Company’s overseas consoli-
dated subsidiaries for consolidation purposes have been pre-
pared in conformity with IFRS or generally accepted accounting
principles in the United States of America (“US GAAP”), and
partially reflect the adjustments which are necessary to conform
with Japanese GAAP.
The accompanying consolidated financial statements have
been restructured and translated into English (with certain ex-
panded disclosures) from the consolidated financial statements
of the Company prepared in accordance with Japanese GAAP
and filed with the appropriate Local Finance Bureau of the Min-
istry of Finance as required by the Japanese Financial Instruments
and Exchange Law. Certain supplementary information included
in the Japanese language statutory consolidated financial state-
ments, but not required for fair presentation, is not presented in
the accompanying consolidated financial statements.
The translation of the Japanese yen amounts into U.S. dol-
lar amounts is included solely for the convenience of readers
outside Japan, using the prevailing exchange rate at March 31,
2013, which was ¥93 to U.S. $1.00. The translations should not
be construed as a representation that the Japanese yen amounts
have been, could have been or could in the future be converted
into U.S. dollars at this or any other rate of exchange.
(b) Principles of consolidation
The accompanying consolidated financial statements include
the accounts of the Company and 82 significant companies over
which the Company has power of control through majority vot-
ing right or the existence of certain other conditions evidencing
control by the Company. Investments in 1 nonconsolidated sub-
sidiary and 22 affiliates over which the Company has the abil-
ity to exercise significant influence over operating and financial
policies are accounted for under the equity method. The signifi-
cant affiliates are Sakai Display Products Corporation and Sharp
Finance Corporation. As a result of a decrease of the Company’s
ownership of Sakai Display Products Corporation, which was a
consolidated subsidiary as of March 31, 2012, during the year
ended March 31, 2013, the investment in Sakai Display Products
Corporation is accounted for under the equity method.
In the elimination of investments in consolidated subsidiaries,
the assets and liabilities of the subsidiaries, including the por-
tion attributable to minority shareholders, are evaluated using
the fair value at the time the Company acquired control of the
respective subsidiary.
Material intercompany balances, transactions and unrealized
profits have been eliminated in consolidation.
(c) Translation of foreign currencies
Monetary assets and liabilities denominated in foreign curren-
cies are translated into Japanese yen at current rates at each
balance sheet date, and the resulting translation gains or losses
are charged to income.
Assets and liabilities are translated at current rates at each
balance sheet date, net assets accounts are translated at histori-
cal rates, and revenues and expenses are translated at average
rates prevailing during the year. The resulting foreign currency
translation adjustments are shown as a separate component in
net assets.
(d) Cash and cash equivalents
Cash and cash equivalents include cash on hand, deposits on
demand placed with banks and highly liquid investments with
insignificant risk of changes in value which have maturities of
three months or less when purchased.
(e) Investments in securities
Investments in securities consist principally of marketable and
nonmarketable equity securities.
The Company and its domestic consolidated subsidiaries cat-
egorize those securities as “other securities,” which, in principle,
1. Summary of Significant Accounting and Reporting Policies

42 SHARP CORPORATION Annual Report 2013 43
Financial Section
The following is a summary of other securities with available fair market values as of March 31, 2011, 2012 and 2013:
2. Investments in Securities
Inventories as of March 31, 2011, 2012 and 2013 were as follows:
3. Inventories
Yen (millions)
2013
Acquisition cost Unrealized gains Unrealized losses Fair market value
Equity securities ¥ 34,880 ¥ 12,075 ¥ (2,661) ¥ 44,294 ¥ 34,880 ¥ 12,075 ¥ (2,661) ¥ 44,294
U.S. Dollars (thousands)
2013
Acquisition cost Unrealized gains Unrealized losses Fair market value
Equity securities $ 375,054 $ 129,839 $ (28,613) $ 476,280 $ 375,054 $ 129,839 $ (28,613) $ 476,280
Yen (millions)
2012
Acquisition cost Unrealized gains Unrealized losses Fair market value
Equity securities ¥ 39,715 ¥ 15,428 ¥ (6,735) ¥ 48,408 ¥ 39,715 ¥ 15,428 ¥ (6,735) ¥ 48,408
Yen (millions)
2011
Acquisition cost Unrealized gains Unrealized losses Fair market value
Equity securities ¥ 39,186 ¥ 16,343 ¥ (6,105) ¥ 49,424 ¥ 39,186 ¥ 16,343 ¥ (6,105) ¥ 49,424
Yen(millions)
U.S. Dollars (thousands)
2011 2012 2013 2013
Finished products ¥ 191,628 ¥ 194,220 ¥ 157,373 $ 1,692,183 Work in process 206,614 264,577 90,431 972,376 Raw materials and supplies 87,818 68,686 62,905 676,398
¥ 486,060 ¥ 527,483 ¥ 310,709 $ 3,340,957
The proceeds from sales of other securities were ¥131 mil-
lion, ¥13 million, and ¥4,358 million ($46,860 thousands) for
the years ended March 31, 2011, 2012 and 2013, respectively.
The gross realized gains on those sales were ¥24 million, ¥8 mil-
For the years ended March 31, 2011, 2012 and 2013, the write-offs of the inventory are ¥38,240 million, ¥98,147 million and
¥46,925 million ($504,570 thousand), respectively.
lion and ¥307 million ($3,301 thousands), respectively. The gross
realized losses on those sales were ¥0 million, ¥0 million and ¥0
million ($0 thousand), respectively.
vide an allowance for severance and pension benefits based on
the estimated amounts of projected benefit obligation and the
fair value of plan assets at the balance sheet date. Projected ben-
efit obligation and expenses for severance and pension benefits
are determined based on the amounts actuarially calculated us-
ing certain assumptions.
Prior service costs are amortized using the straight-line meth-
od over the average of the estimated remaining service years
(16 years) commencing with the current period. Actuarial gains
and losses are primarily amortized using the straight-line method
over the average of the estimated remaining service years (16
years) commencing with the following period.
(l) Research and development expenses
Research and development expenses are charged to income as
incurred. The research and development expenses charged to
income amounted to ¥173,983 million, ¥154,798 million and
¥137,936 million ($1,483,183 thousand) for the years ended
March 31, 2011, 2012 and 2013 respectively.
(m) Derivative financial instruments
The Company and some of its consolidated subsidiaries use
derivative financial instruments, including foreign exchange
forward contracts in order to hedge the risk of fluctuations in
foreign currency exchange rates associated with assets and li-
abilities denominated in foreign currencies.
All derivative financial instruments are stated at fair value and
recorded on the balance sheets. The deferred method is used
for recognizing gains or losses on hedging instruments and the
hedged items. When foreign exchange forward contracts meet
certain conditions, the hedged items are stated at the forward
exchange contract rates.
Derivative financial instruments are used based on internal
policies and procedures on risk control. The risks of fluctuations
in foreign currency exchange rates have been assumed to be
completely hedged over the period of hedging contracts as the
major conditions of the hedging instruments and the hedged
items are consistent. Accordingly, an evaluation of the effective-
ness of the hedging contracts is not required.
The credit risk of such derivatives is assessed as being low be-
cause the counter-parties of these transactions have good credit
ratings with financial institutions.
(n) Method and Period for Amortization of Goodwill
Goodwill for which the effective term is possible to be estimated
is amortized evenly over the estimated terms, while the other is
amortized evenly over 5 years. However, if the amount is minor,
the entire amount is amortized during the period of occurrence.
(o) Changes in accounting policies that are difficult to
distinguish from changes in accounting estimates
In accordance with the amendment of the Corporation Tax Law,
effective from the year ended March 31, 2013, the Company
and its domestic consolidated subsidiaries have changed the de-
preciation method for plant and equipment acquired on or after
April 1, 2012.
This change had an immaterial impact on financial statements.
(p) Reclassifications
Certain account balances in the financial statements and ac-
companying footnotes for the years ended March 31, 2011 and
2012 have been reclassified to made to conform to the presen-
tation for the fiscal year ended March 31, 2013.Financial Section

42 SHARP CORPORATION Annual Report 2013 43
Financial Section
The following is a summary of other securities with available fair market values as of March 31, 2011, 2012 and 2013:
2. Investments in Securities
Inventories as of March 31, 2011, 2012 and 2013 were as follows:
3. Inventories
Yen (millions)
2013
Acquisition cost Unrealized gains Unrealized losses Fair market value
Equity securities ¥ 34,880 ¥ 12,075 ¥ (2,661) ¥ 44,294 ¥ 34,880 ¥ 12,075 ¥ (2,661) ¥ 44,294
U.S. Dollars (thousands)
2013
Acquisition cost Unrealized gains Unrealized losses Fair market value
Equity securities $ 375,054 $ 129,839 $ (28,613) $ 476,280 $ 375,054 $ 129,839 $ (28,613) $ 476,280
Yen (millions)
2012
Acquisition cost Unrealized gains Unrealized losses Fair market value
Equity securities ¥ 39,715 ¥ 15,428 ¥ (6,735) ¥ 48,408 ¥ 39,715 ¥ 15,428 ¥ (6,735) ¥ 48,408
Yen (millions)
2011
Acquisition cost Unrealized gains Unrealized losses Fair market value
Equity securities ¥ 39,186 ¥ 16,343 ¥ (6,105) ¥ 49,424 ¥ 39,186 ¥ 16,343 ¥ (6,105) ¥ 49,424
Yen(millions)
U.S. Dollars (thousands)
2011 2012 2013 2013
Finished products ¥ 191,628 ¥ 194,220 ¥ 157,373 $ 1,692,183 Work in process 206,614 264,577 90,431 972,376 Raw materials and supplies 87,818 68,686 62,905 676,398
¥ 486,060 ¥ 527,483 ¥ 310,709 $ 3,340,957
The proceeds from sales of other securities were ¥131 mil-
lion, ¥13 million, and ¥4,358 million ($46,860 thousands) for
the years ended March 31, 2011, 2012 and 2013, respectively.
The gross realized gains on those sales were ¥24 million, ¥8 mil-
For the years ended March 31, 2011, 2012 and 2013, the write-offs of the inventory are ¥38,240 million, ¥98,147 million and
¥46,925 million ($504,570 thousand), respectively.
lion and ¥307 million ($3,301 thousands), respectively. The gross
realized losses on those sales were ¥0 million, ¥0 million and ¥0
million ($0 thousand), respectively.
vide an allowance for severance and pension benefits based on
the estimated amounts of projected benefit obligation and the
fair value of plan assets at the balance sheet date. Projected ben-
efit obligation and expenses for severance and pension benefits
are determined based on the amounts actuarially calculated us-
ing certain assumptions.
Prior service costs are amortized using the straight-line meth-
od over the average of the estimated remaining service years
(16 years) commencing with the current period. Actuarial gains
and losses are primarily amortized using the straight-line method
over the average of the estimated remaining service years (16
years) commencing with the following period.
(l) Research and development expenses
Research and development expenses are charged to income as
incurred. The research and development expenses charged to
income amounted to ¥173,983 million, ¥154,798 million and
¥137,936 million ($1,483,183 thousand) for the years ended
March 31, 2011, 2012 and 2013 respectively.
(m) Derivative financial instruments
The Company and some of its consolidated subsidiaries use
derivative financial instruments, including foreign exchange
forward contracts in order to hedge the risk of fluctuations in
foreign currency exchange rates associated with assets and li-
abilities denominated in foreign currencies.
All derivative financial instruments are stated at fair value and
recorded on the balance sheets. The deferred method is used
for recognizing gains or losses on hedging instruments and the
hedged items. When foreign exchange forward contracts meet
certain conditions, the hedged items are stated at the forward
exchange contract rates.
Derivative financial instruments are used based on internal
policies and procedures on risk control. The risks of fluctuations
in foreign currency exchange rates have been assumed to be
completely hedged over the period of hedging contracts as the
major conditions of the hedging instruments and the hedged
items are consistent. Accordingly, an evaluation of the effective-
ness of the hedging contracts is not required.
The credit risk of such derivatives is assessed as being low be-
cause the counter-parties of these transactions have good credit
ratings with financial institutions.
(n) Method and Period for Amortization of Goodwill
Goodwill for which the effective term is possible to be estimated
is amortized evenly over the estimated terms, while the other is
amortized evenly over 5 years. However, if the amount is minor,
the entire amount is amortized during the period of occurrence.
(o) Changes in accounting policies that are difficult to
distinguish from changes in accounting estimates
In accordance with the amendment of the Corporation Tax Law,
effective from the year ended March 31, 2013, the Company
and its domestic consolidated subsidiaries have changed the de-
preciation method for plant and equipment acquired on or after
April 1, 2012.
This change had an immaterial impact on financial statements.
(p) Reclassifications
Certain account balances in the financial statements and ac-
companying footnotes for the years ended March 31, 2011 and
2012 have been reclassified to made to conform to the presen-
tation for the fiscal year ended March 31, 2013.
Financial Section

44 SHARP CORPORATION Annual Report 2013 45
Financial Section
In response to the issuance on December 2, 2011 of the “Act
regulating revision of part of the Income Tax Act and other re-
lated laws/regulations, in order to establish a taxation system
that reflects structural changes in the economy and society” and
the “Act regarding securing funds necessary for implementing
programs promoting recovery from the Great East Japan Earth-
quake,” the Company has changed the statutory tax rate used
for calculating the deferred tax assets and deferred tax liabilities
as of March 31, 2012 from 40.6% to 37.9% for revenue and
payments made between the forecast period of April 1, 2012
and March 31, 2015. Those on or after April 1, 2015 will both
be changed to 35.5%.
Due to this change, the net deferred tax assets decreased by
¥1,951 million and deferred gains (losses) on hedges decreased
by ¥256 million, while deferred income tax calculated for the
year ended March 31, 2012 increased by ¥2,054 million and
net unrealized holding gains (losses) on securities increased by
¥359 million.
Short-term borrowings including current portion of long-term debt as of March 31, 2011, 2012 and 2013 consisted of the following:
The weighted average interest rates of short-term borrowings as of March 31, 2011, 2012 and 2013 were 0.8%, 0.5% and 1.8%,
respectively.
Net deferred tax assets as of March 31, 2011, 2012 and 2013 were included in the consolidated balance sheets as follows:
5. Short-term Borrowings and Long-term Debt
Yen(millions)
U.S. Dollars(thousands)
2011 2012 2013 2013
Bank loans ¥ 104,522 ¥ 199,085 ¥ 610,254 $ 6,561,871 Commercial paper 139,766 351,000 — — Current portion of long-term debt 43,042 47,912 313,859 3,374,828
¥ 287,330 ¥ 597,997 ¥ 924,113 $ 9,936,699
Yen(millions)
U.S. Dollars(thousands)
2011 2012 2013 2013
Deferred tax assets (Current Assets) ¥ 93,810 ¥ 90,394 ¥ 19,369 $ 208,269 Other assets (Investments and Other Assets) 101,259 11,421 11,571 124,419 Other current liabilities (6) (15) (343) (3,688)Deferred tax liabilities (Long-term Liabilities) (11,600) (29,304) (14,044) (151,011)Net deferred tax assets ¥ 183,463 ¥ 72,496 ¥ 16,553 $ 177,989
Financial Section
The Company is subject to a number of different income taxes
which, in the aggregate, indicate a statutory tax rate in Japan
of approximately 40.6% for the years ended March 31, 2011
and 2012, and approximately 37.9% for the year ended March
31, 2013.
The Company and its wholly owned domestic subsidiaries
have adopted the consolidated tax return system of Japan.
The differences between the statutory tax rate and the effec-
tive tax rate for financial statement purposes for the year ended
March 31, 2012 and 2013 are not disclosed because loss before
income taxes and minority interests were recorded.
The following table summarizes the significant differences between the statutory tax rate and the effective tax rate for financial
statements purposes for the year ended March 31, 2011:
Significant components of deferred tax assets and deferred tax liabilities as of March 31, 2011, 2012 and 2013 were as follows:
4. Income Taxes
2011 2012 2013
Statutory tax rate 40.6% — — Foreign withholding tax 17.9 — — Dividends income 3.3 — — Expenses not deductible for tax purposes 2.0 — — Differences in normal tax rates of overseas subsidiaries (14.6) — — Tax effect on equity in earnings of affiliates, net (3.3) — — Other 2.2 — —Effective tax rate 48.1% — —
Yen(millions)
U.S. Dollars(thousands)
2011 2012 2013 2013
Deferred tax assets: Inventories ¥ 40,804 ¥ 70,797 ¥ 73,924 $ 794,882 Other accounts payable 9,765 12,904 5,109 54,935 Accrued expenses 14,572 20,047 15,997 172,011 Provision for loss on litigation — — 12,249 131,710 Buildings and structures 965 962 12,255 131,774 Machinery, equipment and vehicles 1,472 1,466 10,577 113,731 Software 20,569 17,113 14,961 160,871 Long-term prepaid expenses 16,567 14,104 21,914 235,634 Loss carried forward 115,026 161,893 247,570 2,662,043 Other 45,399 32,950 51,664 555,527 Gross deferred tax assets 265,139 332,236 466,220 5,013,118 Valuation allowance (2,897) (197,223) (427,832) (4,600,344) Total deferred tax assets 262,242 135,013 38,388 412,774 Deferred tax liabilities:
Retained earnings appropriated for tax allowable reserves (61,752) (42,445) (3,258) (35,032) Prepaid pension cost (11,539) (9,966) (8,304) (89,290) Net unrealized holding gains (losses) on securities (4,116) (3,087) (3,339) (35,903) Other (1,372) (7,019) (6,934) (74,560) Total deferred tax liabilities (78,779) (62,517) (21,835) (234,785)Net deferred tax assets ¥ 183,463 ¥ 72,496 ¥ 16,553 $ 177,989

46 SHARP CORPORATION Annual Report 2013 47
Yen (millions) U.S. Dollars (thousands)
2011 2012 2013 2013
Future minimum lease payments: Due within one year ¥ 10,183 ¥ 5,527 ¥ 1,617 $ 17,387 Due after one year 7,659 2,036 436 4,688
¥ 17,842 ¥ 7,563 ¥ 2,053 $ 22,075
Accumulated impairment loss on leased assets ¥ 512 ¥ 0 ¥ 0 $ 0
Yen (millions) U.S. Dollars (thousands)
2011 2012 2013 2013
Lease payments ¥ 14,182 ¥ 10,116 ¥ 5,502 $ 59,161 Reversal of allowance for impairment loss on leased assets 237 512 0 0
Finance leases
With regards to finance leases that do not transfer ownership and commenced on or before March 31, 2008, lease payments are
recognized as expenses.
Information relating to finance leases that do not transfer ownership and commenced on or before March 31, 2008, as of, and for
the years ended March 31, 2011, 2012 and 2013, were as follows:
As lessee
(1) Future minimum lease payments and accumulated impairment loss on leased assets
(2) Lease payments, reversal of allowance for impairment loss on leased assets
Yen (millions) U.S. Dollars (thousands)
2011 2012 2013 2013
Due within one year ¥ 36,883 ¥ 31,444 ¥ 6,812 $ 73,247 Due after one year 37,860 16,647 8,854 95,205
¥ 74,743 ¥ 48,091 ¥ 15,666 $ 168,452
Operating leases
(a) As lessee
Future minimum lease payments for only non-cancelable contracts as of March 31, 2011, 2012 and 2013 were as follows:
Yen (millions) U.S. Dollars (thousands)
2011 2012 2013 2013
Due within one year ¥ 1,520 ¥ 1,777 ¥ 1,583 $ 17,022 Due after one year 1,961 1,877 2,878 30,946
¥ 3,481 ¥ 3,654 ¥ 4,461 $ 47,968
(b) As lessor
Future minimum lease receipts for only non-cancelable contracts as of March 31, 2011, 2012 and 2013 were as follows:
6. Leases
Financial Section
Long-term debt as of March 31, 2011, 2012 and 2013 consisted of the following:
The following is a summary of the terms for conversion and redemption of convertible bonds with subscription rights to shares:
The aggregate annual maturities of long-term debt as of March 31, 2013 were as follows:
Yen(millions)
U.S. Dollars(thousands)
2011 2012 2013 2013
0.0%-9.1% loans principally from banks, due 2011 to 2034 ¥ 149,554 ¥ 126,188 ¥ 137,774 $ 1,481,441 0.970% unsecured straight bonds, due 2012 20,000 20,000 — — 1.165% unsecured straight bonds, due 2012 10,000 — — — 1.423% unsecured straight bonds, due 2014 30,000 30,000 30,000 322,581 2.068% unsecured straight bonds, due 2019 10,000 10,000 10,000 107,527 0.846% unsecured straight bonds, due 2014 100,000 100,000 100,000 1,075,269 1.141% unsecured straight bonds, due 2016 20,000 20,000 20,000 215,054 1.604% unsecured straight bonds, due 2019 30,000 30,000 30,000 322,581 0.000% unsecured convertible bonds with subscription rights to shares, due 2013 201,783 201,068 200,354 2,154,344 0.250%-1.177% unsecured Euroyen notes issued by a consolidated subsidiary, due 2012 to 2013 5,046 6,996 5,000 53,763 0.500% unsecured Pound discount notes issued by a consolidated subsidiary, due 2011 to 2012 290 130 — —Lease obligations 26,289 32,690 31,041 333,774
602,962 577,072 564,169 6,066,334 Less-Current portion included in short-term borrowings (43,042) (47,912) (313,859) (3,374,828)
¥ 559,920 ¥ 529,160 ¥ 250,310 $ 2,691,506
Years ending March 31 Yen(millions)
U.S. Dollars(thousands)
2015 ¥ 110,560 $ 1,188,817 2016 21,560 231,828 2017 34,171 367,430 2018 21,574 231,978 2019 and thereafter 62,445 671,452
¥ 250,310 $ 2,691,505
Yen
Conversion price
0.000% unsecured convertible bonds with subscription rights to shares, due 2013 ¥2,522.90
The conversion price is subject to adjustment for certain sub-
sequent events such as the issue of common stock at less than
market value and stock splits.
If all convertible bonds with subscription rights to shares
were converted as of March 31, 2011, 2012 and 2013, 79,018,
79,018 and 79,272 thousand shares of common stock would
have been issuable, respectively.
Financial Section

48 SHARP CORPORATION Annual Report 2013 49
Financial Section
For other securities and investments in capital, The Com-
pany regularly monitors prices and the issuer’s financial
position, and continually reviews the possession by taking
these indices as well as the relationship with issuers into
consideration.
[3] Management of liquidity risk in financing activities
The Treasury Department manages liquidity risk by making
and updating financial plans based on reports from each
section, and maintains ready liquidity.
(4) Supplementary explanation of fair value of financial
instruments
The fair value of financial instruments is based on the quoted
market price in the active market, but in case a market price is
not available, reasonably estimated prices are included in fair
value. As variable factors are incorporated in the determina-
tion of this reasonably estimated price, it may vary depend-
ing on different assumptions. The contract amount related to
derivative transactions has nothing to do with the market risk
related to the derivative transactions.
(b) Fair values of financial instruments
The consolidated balance sheet amounts, fair values and dif-
ferences between the two as of March 31, 2011, 2012 and
2013 are included in the tables below. Financial instruments
of which fair values are considered to be too difficult to be
estimated are not included in the tables. Refer to (Note 2) for
the details of such financial instruments.
Yen (millions)
2013
Consolidated Balance Sheet Amount Fair Value Difference
(1) Cash and cash equivalents, Time deposits, and Restricted cash ¥ 191,941 ¥ 191,941 ¥ 0 (2) Notes and accounts receivable 563,488 559,611 (3,877) (3) Investments in securities 1) Shares of nonconsolidated subsidiaries and affiliates 1,419 1,433 14 2) Other securities 44,294 44,294 0 Total Assets 801,142 797,279 (3,863) (4) Notes and accounts payable (excluding other accounts payable) 365,121 365,121 0 (5) Bank loans and Current portion of long-term borrowings (included in short-term borrowings) 674,941 674,941 0 (6) Straight bonds (included in short-term borrowings and long-term debt) 195,000 156,441 (38,559) (7) Bonds with subscription rights to shares (included in short-term borrowings) 200,354 175,897 (24,457) (8) Long-term borrowings (included in long-term debt) 73,087 73,749 662 Total of Liabilities 1,508,503 1,446,149 (62,354) (9) Derivative transactions* 1,508 1,914 406
Financial Section
(a) Qualitative information on financial instruments
(1) Policies for financial instruments
The Company and its consolidated subsidiaries obtain neces-
sary funds mainly through bank loans and issuing bonds ac-
cording to its capital investment plan for its main business of
manufacturing and distributing electronics equipment and
electronic components.
Short-term operating funds are obtained through bank
loans.
Transactions involving such financial instruments are con-
ducted with creditworthy financial institutions. The Company
utilizes derivative transactions for minimizing risk and not for
speculative or dealing purposes.
(2) Description and risks of financial instruments
Notes and accounts receivable are exposed to customer credit
risk. Some notes and accounts receivable are denominated in
foreign currencies because the Company has business rela-
tions globally and therefore are exposed to foreign currency
risk. Notes and accounts payable (excluding other accounts
payable) are payable within one year. Some notes and ac-
counts payable arising from the import of raw materials are
denominated in foreign currencies and therefore are exposed
to foreign currency risk. The Company offsets foreign currency
denominated notes and accounts receivable with notes and
accounts payable, and uses forward exchange contracts to
hedge foreign currency risk exposure.
Other securities are held for the long term to construct bet-
ter business alliances and relations with Company customers
and suppliers. Other securities are exposed to market price
fluctuation risk. Long-term borrowings (included in long-term
debt) and bonds (included in short-term borrowings and long-
term debt) are mainly in preparation for capital investments.
The longest redemption date for bonds is six and a half years
after March 31, 2013.
Derivative transactions consist primarily of forward ex-
change contracts, and currency swap contracts are used to
hedge foreign currency risk exposure. Interest swap contracts
are used to hedge interest rate risk exposure. For hedging
instruments, hedged items, hedging policies and assessment
methods of effectiveness of hedging instruments, please see
Note 1.
(3) Risk management of financial instruments
[1] Management of credit risk
For notes and accounts receivable, the Company periodi-
cally reviews the status of its key customers, monitoring
their respective payment deadlines and remaining out-
standing balances.
The Company strives to recognize and reduce irrecover-
able risks, due to deteriorating financial conditions or other
factors at an early stage. The Company’s consolidated sub-
sidiaries also follow the same monitoring and administra-
tion process.
[2] Management of market risk
The Company decides basic policy for derivative transac-
tions at the Foreign Exchange Administration Committee
meeting which is held monthly and the Finance Adminis-
tration Committee meeting which is required by the Com-
pany’s internal procedure.
The Treasury Department of Corporate Accounting and
Control Group executes transactions and reports the result
of such transactions to the Accounting Department of Cor-
porate Accounting and Control Group on a daily basis. The
Accounting Department has set up a specialized section
for transaction results and position management and re-
ports the result of transactions to the General manager of
Corporate Accounting and Control Group on a daily basis.
In addition, the Treasury Department reports the result
of transactions to the Foreign Exchange Administration
Committee and the Finance Administration Committee on
a periodic basis. Its consolidated subsidiaries also manage
forward foreign exchange transactions in accordance with
the rules established by the Company and report the con-
tent of such transactions to the Company on a monthly
basis. For interest swap contracts and currency swap con-
tracts, its consolidated subsidiaries execute transactions
after the Company approves.
7. Financial Instruments
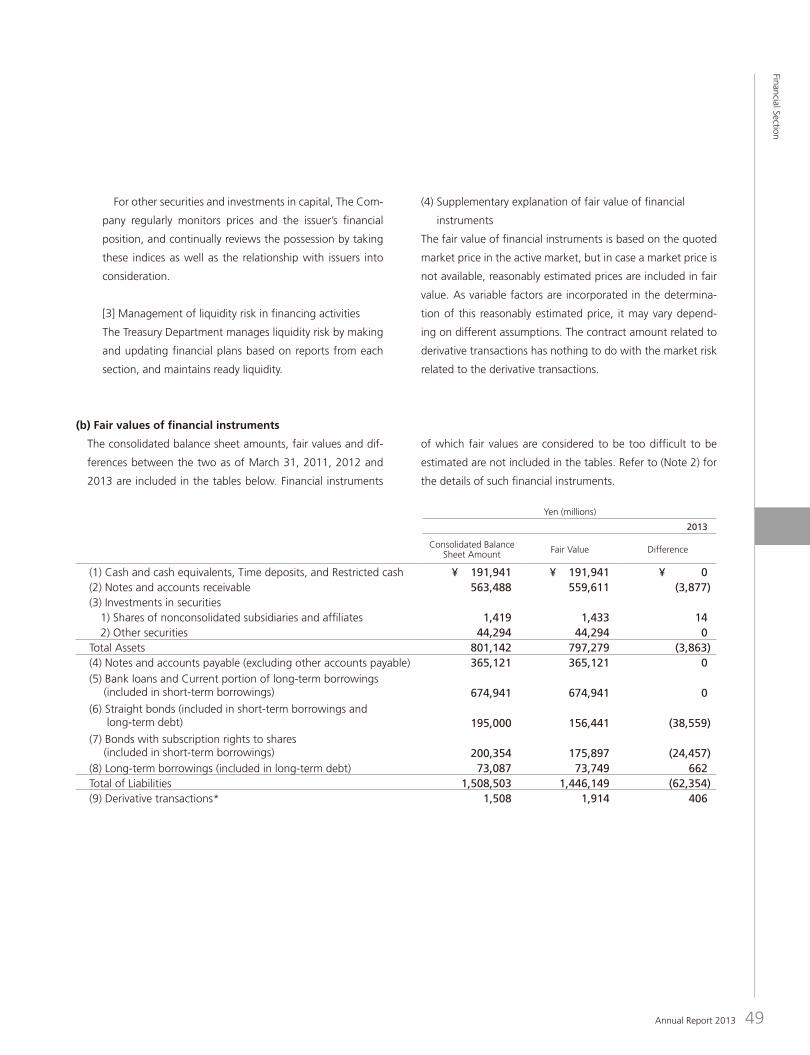
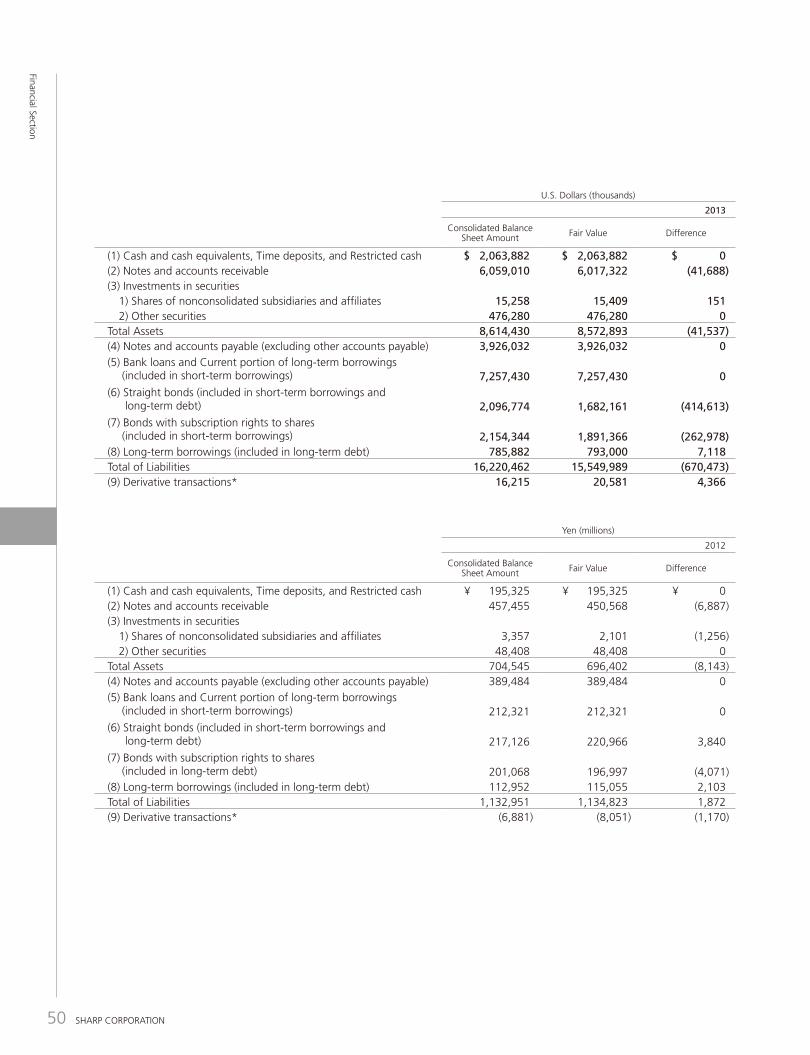
50 SHARP CORPORATION Annual Report 2013 51
Yen (millions)
2011
Consolidated Balance Sheet Amount Fair Value Difference
(1) Cash and cash equivalents, Time deposits, and Restricted cash ¥ 247,888 ¥ 247,888 ¥ 0 (2) Notes and accounts receivable 577,426 573,674 (3,752) (3) Investments in securities 1) Shares of nonconsolidated subsidiaries and affiliates 3,364 2,866 (498) 2) Other securities 49,424 49,424 0 Total Assets 878,102 873,852 (4,250) (4) Notes and accounts payable (excluding other accounts payable) 531,638 531,638 0
(5) Bank loans and Current portion of long-term borrowings (included in short-term borrowings) 128,453 128,453 0
(6) Straight bonds (included in short-term borrowings and long-term debt) 225,336 229,283 3,947
(7) Bonds with subscription rights to shares (included in long-term debt) 201,783 195,997 (5,786) (8) Long-term borrowings (included in long-term debt) 125,623 126,992 1,369 Total of Liabilities 1,212,833 1,212,363 (470) (9) Derivative transactions* (1,159) (1,166) (7)
*Net receivables and payables arising from derivative transactions. Net payables are indicated by “( ).”
(Note 1) Methods of Calculating the Fair Value of Financial In-
struments and Matters Related to Securities and Deriva-
tive Transactions
(1) Cash and cash equivalents, Time deposits, and Restrict-
ed cash
The fair value of time deposits and Restricted cash ap-
proximates their book value, due to their short maturity
periods.
(2) Notes and accounts receivable
The fair value of notes and accounts receivable due
within a year approximates their book value. The fair
value of notes and accounts receivable with long ma-
turity periods is discounted using a rate which reflects
both the period until maturity and credit risk.
(3) Investments in securities
The fair value of investments in securities is based on
average quoted market price for the last month of the
fiscal year.
(4) Notes and accounts payable (excluding other accounts
payable)
The fair value of notes and accounts payable (excluding
other accounts payable) approximates their book value
due to their short maturity periods.
(5) Bank loans and current portion of long-term borrow-
ings (included in short-term borrowings)
The fair value of bank loans and current portion of
long-term borrowings approximates their book value
due to their short maturity periods.
(6) Straight bonds (included in short-term borrowings and
long-term debt)
The fair value of marketable straight bonds is deter-
mined by the quoted market price. The fair value of
non-marketable straight bonds is based on quoted
prices from financial institutions.
(7) Bonds with subscription rights to shares (included in
short-term borrowings and long-term debt)
The fair value of marketable bonds with subscription
rights to shares is determined by quoted market prices.
The fair value of non-marketable bonds with subscrip-
tion rights to shares is based on quoted prices from
financial institutions.
(8) Long-term borrowings (included in long-term debt)
The fair value of long-term borrowings is determined
by the total amount of the principal and interest using
the rate which would apply if similar borrowings were
newly made.
Financial Section
U.S. Dollars (thousands)
2013
Consolidated Balance Sheet Amount Fair Value Difference
(1) Cash and cash equivalents, Time deposits, and Restricted cash $ 2,063,882 $ 2,063,882 $ 0 (2) Notes and accounts receivable 6,059,010 6,017,322 (41,688) (3) Investments in securities 1) Shares of nonconsolidated subsidiaries and affiliates 15,258 15,409 151 2) Other securities 476,280 476,280 0 Total Assets 8,614,430 8,572,893 (41,537) (4) Notes and accounts payable (excluding other accounts payable) 3,926,032 3,926,032 0 (5) Bank loans and Current portion of long-term borrowings (included in short-term borrowings) 7,257,430 7,257,430 0 (6) Straight bonds (included in short-term borrowings and long-term debt) 2,096,774 1,682,161 (414,613) (7) Bonds with subscription rights to shares (included in short-term borrowings) 2,154,344 1,891,366 (262,978) (8) Long-term borrowings (included in long-term debt) 785,882 793,000 7,118 Total of Liabilities 16,220,462 15,549,989 (670,473) (9) Derivative transactions* 16,215 20,581 4,366
Yen (millions)
2012
Consolidated Balance Sheet Amount Fair Value Difference
(1) Cash and cash equivalents, Time deposits, and Restricted cash ¥ 195,325 ¥ 195,325 ¥ 0 (2) Notes and accounts receivable 457,455 450,568 (6,887) (3) Investments in securities 1) Shares of nonconsolidated subsidiaries and affiliates 3,357 2,101 (1,256) 2) Other securities 48,408 48,408 0 Total Assets 704,545 696,402 (8,143) (4) Notes and accounts payable (excluding other accounts payable) 389,484 389,484 0
(5) Bank loans and Current portion of long-term borrowings (included in short-term borrowings) 212,321 212,321 0
(6) Straight bonds (included in short-term borrowings and long-term debt) 217,126 220,966 3,840
(7) Bonds with subscription rights to shares (included in long-term debt) 201,068 196,997 (4,071) (8) Long-term borrowings (included in long-term debt) 112,952 115,055 2,103 Total of Liabilities 1,132,951 1,134,823 1,872 (9) Derivative transactions* (6,881) (8,051) (1,170)
Financial Section

52 SHARP CORPORATION Annual Report 2013 53
Business Divestiture
Sharp Corporation “The Company” entered into an agreement
to execute capital and business alliance with four companies of
the Hon Hai Group on March 27, 2012.
In association with the above capital and business alliance,
the Company has transferred a part of shares of its owned sub-
sidiary, Sharp Display Products Corporation (“SDP”), to SIO Inter-
national Holdings Limited, an investment company of Mr. Terry
Tai-Ming Gou, the representative of Hon Hai Precision Industry
Co., Ltd (“Hon Hai”).
Furthermore, the Company, Toppan Printing Co., Ltd. (“Top-
pan”) and Dai Nippon Printing Co., Ltd. (“DNP”) executed a ba-
sic agreement on April 10, 2012, with regard to the business
integration of the LCD color filter businesses operated by Top-
pan, DNP and DNP’s wholly owned subsidiary, DNP Color Techno
Sakai Co., Ltd. (“DNP Color Techno Sakai”) at the Sakai Plant,
into SDP, and conducted deliberations on concrete issues.
The Company resolved at its board of directors meeting held
on May 24, 2012 to execute business integration agreements
with Toppan and DNP respectively and transfer the LCD color
filter businesses at the Sakai Plant operated by Toppan, DNP and
DNP Color Techno Sakai, to SDP in the manner of a simplified
absorption-type company split. In August 11, the simplified ab-
sorption-type company split came into effect.
(a) Outline of business divestitures
(1) Name of parties who succeed the divested business
SIO International Holdings Limited, Toppan Printing Co.,
Ltd., Dai Nippon Printing Co., Ltd and DNP Color Techno
Sakai Co., Ltd.
(2) Nature of divested business
Development, production and sales of LCD panels
(3) Aim of business divestiture
With the efforts such as 1) promotion of the enhancement
of cost competitiveness and profit performance through
maintaining a high facility operation rate of SDP by making
practical use of Hon Hai’s purchasing power and 2) inte-
gration of the LCD color filter businesses, the Company
is seeking to promote further efficiency of the large-size
LCD business including the businesses of color filters, the
primary component of LCD panels, as well as to achieve
improvement of the competitiveness of such businesses.
(4) Date of business divestiture
[1] Transfer of shares July 12, 2012
[2] Simplified absorption-type company split August 11,
2012
(5) Other items with regard to outline of transactions which
include description of legal form
[1] Transfer of shares
The Company will receive only assets such as cash as
consideration for the transfer of shares.
[2] Absorption-type company split
The method to be employed is a simplified absorption-
type company split which designates Toppan, DNP and
DNP Color Techno Sakai as split companies and SDP as
their succeeding company.
8. Business Combination
(b) Outline of accounting method
(1) Transfer profit and lossYen
(millions)U.S. Dollars(thousands)
Loss on sales of stocks of subsidiaries and affiliates ¥ 3,346 $ 35,978 Loss on change in equity 705 7,581
Financial Section
(9) Derivative transactions
The fair value of currency swap contracts and interest
swap contracts is based on quoted prices from financial
institutions. The fair value of forward exchange con-
tracts are based on forward exchange rate.
(Note 2) Financial instruments of which fair values are con-
sidered to be too difficult to be estimated are unlist-
ed stocks of ¥36,567 million as of March 31, 2011,
¥37,364 million as of March 31, 2012 and ¥103,671
million ($1,114,742 thousand) as of March 31, 2013
and other investments of ¥8,477 million as of March
31, 2011, ¥10,277 million as of March 31, 2012 and
¥7,071 million ($76,032 thousand) as of March 31,
2013. Since there are no quoted market prices and it
is too difficult to estimate the fair values, they are not
included in “(3) Investments in securities.”
(Note 3) Maturity analysis for Cash and cash equivalents, Time deposits, and Restricted cash, and Notes and accounts receivable.
Yen (millions)
2013
Due in one year or less Due after one year
Cash and cash equivalents, Time deposits, and Restricted cash ¥ 191,941 ¥ — Notes and accounts receivable 522,486 41,002 Total ¥ 714,427 ¥ 41,002
U.S. Dollars (thousands)
2013
Due in one year or less Due after one year
Cash and cash equivalents, Time deposits, and Restricted cash $ 2,063,882 $ — Notes and accounts receivable 5,618,129 440,882 Total $ 7,682,011 $ 440,882
Yen (millions)
2012
Due in one year or less Due after one year
Cash and cash equivalents, Time deposits, and Restricted cash ¥ 195,325 ¥ — Notes and accounts receivable 408,715 48,740 Total ¥ 604,040 ¥ 48,740
Yen (millions)
2011
Due in one year or less Due after one year
Cash and cash equivalents, Time deposits, and Restricted cash ¥ 247,888 ¥ — Notes and accounts receivable 528,103 49,323 Total ¥ 775,991 ¥ 49,323
Financial Section

54 SHARP CORPORATION Annual Report 2013 55
Collateral asset and liabilities of the collateral as of March 31, 2011, 2012 and 2013 were as follows:
(1) Collateral Assets
(2) Liabilities of the Collateral
meeting, legal earnings reserve and additional paid-in capital
may be transferred to other retained earnings and capital sur-
plus, respectively, which are potentially available for dividends.
The maximum amount that the Company can distribute as
dividends is calculated based on the nonconsolidated financial
statements of the Company in accordance with the Law.
Year end cash dividends are approved by the shareholders
after the end of each fiscal year, and semiannual interim cash
dividends are declared by the Board of Directors after the end
of each interim six-month period. Such dividends are payable
to shareholders of record at the end of each fiscal year or in-
terim six-month period. In accordance with the Law, final cash
dividends and the related appropriations of retained earnings
have not been reflected in the financial statements at the end
of such fiscal year. However, cash dividends per share shown in
the accompanying consolidated statements of operations reflect
dividends applicable to the respective period.
At the annual shareholders’ meeting held on June 25, 2013, a
resolution of no dividend to shareholders of record as of March
31, 2013 was approved.
10. Collateral Assets and Liabilities of the Collateral
Financial Section
Yen(millions)
U.S. Dollars(thousands)
2011 2012 2013 2013
Restricted cash ¥ 5,725 ¥ 212 ¥ 316 $ 3,398 Notes and account receivable Trade — 1,732 74,604 802,193 Nonconsolidated subsidiaries and affiliates — — 4,518 48,581 Inventories — 1,249 188,868 2,030,839 Other current assets — — 19,212 206,581 Land — — 88,032 946,580 Buildings and structures — — 237,285 2,551,451 Machinery and equipment — — 40,290 433,226 Investments in securities — — 42,316 455,011 Investments in nonconsolidated subsidiaries and affiliates — 7,798 2,684 28,860 Other assets 6,486 8,412 — —
¥ 12,211 ¥ 19,403 ¥ 698,125 $ 7,506,720
Yen(millions)
U.S. Dollars(thousands)
2011 2012 2013 2013
Short-term borrowings ¥ 0 ¥ 1,275 ¥ 333,183 $ 3,582,613 Long-term debt 7,574 2,378 2,613 28,097
¥ 7,574 ¥ 3,653 ¥ 335,796 $ 3,610,710
(2) Appropriate book value of the assets and liabilities transferred and its main items
(3) Accounting method
The difference between the amount received as a value
of transferred business and the amount of owner’s equity
regarding the transferred business is recognized as trans-
fer profit or loss. This accounting method is assuming that
the investment regarding transferred business of develop-
ment, production and sales of LCD panels, is liquidated.
Yen(millions)
U.S Dollars(thousands)
Current Assets ¥ 43,461 $ 467,323Non-Current Assets 177,915 1,913,064Deferred Assets 590 6,344Total Assets ¥ 221,966 $ 2,386,731Current Liabilities 77,297 831,150Long-term Liabilities 5,941 63,882Total Liabilities ¥ 83,238 $ 895,032
Yen(millions)
U.S. Dollars(thousands)
Net Sales ¥ — $ —Operation income 107 1,151
(c) The name of reportable segment in which transferred business was included
The Electronic Components business segment
(d) Estimated amount of profit and loss regarding divested business, which was recorded in Consolidated Statements of
Operations for the year ended March 31, 2013
(e) Outline of ongoing commitment
Purchase of LCD displays from SDP and temporary transfer of employees to SDP
As of July 17, 2012, Sharp Display Products Corporation has changed its corporate name to Sakai Display Products Corporation.
Under the Japanese Corporate Law (“the Law”), the entire
amount paid for new shares is required to be designated as
common stock. However, a company may, by a resolution of
the Board of Directors, designate an amount not exceeding one-
half of the price of the new shares as additional paid-in capital,
which is included in capital surplus.
Under the Law, in cases where a dividend distribution of sur-
plus is made, the smaller of an amount equal to 10% of the
dividend or the excess, if any, of 25% of common stock over
the total of legal earnings reserve and additional paid-in capital
must be set aside as legal earnings reserve or additional paid-in
capital. Legal earnings reserve is included in retained earnings in
the accompanying consolidated balance sheets.
As of March 31, 2013, the total amount of legal earnings re-
serve and additional paid-in capital exceeded 25% of the com-
mon stock, therefore, no additional provision is required.
Legal earnings reserve and additional paid-in capital may not
be distributed as dividends. By the resolution of shareholders’
9. Net Assets and Per Share DataFinancial Section

54 SHARP CORPORATION Annual Report 2013 55
Collateral asset and liabilities of the collateral as of March 31, 2011, 2012 and 2013 were as follows:
(1) Collateral Assets
(2) Liabilities of the Collateral
meeting, legal earnings reserve and additional paid-in capital
may be transferred to other retained earnings and capital sur-
plus, respectively, which are potentially available for dividends.
The maximum amount that the Company can distribute as
dividends is calculated based on the nonconsolidated financial
statements of the Company in accordance with the Law.
Year end cash dividends are approved by the shareholders
after the end of each fiscal year, and semiannual interim cash
dividends are declared by the Board of Directors after the end
of each interim six-month period. Such dividends are payable
to shareholders of record at the end of each fiscal year or in-
terim six-month period. In accordance with the Law, final cash
dividends and the related appropriations of retained earnings
have not been reflected in the financial statements at the end
of such fiscal year. However, cash dividends per share shown in
the accompanying consolidated statements of operations reflect
dividends applicable to the respective period.
At the annual shareholders’ meeting held on June 25, 2013, a
resolution of no dividend to shareholders of record as of March
31, 2013 was approved.
10. Collateral Assets and Liabilities of the Collateral
Financial Section
Yen(millions)
U.S. Dollars(thousands)
2011 2012 2013 2013
Restricted cash ¥ 5,725 ¥ 212 ¥ 316 $ 3,398 Notes and account receivable Trade — 1,732 74,604 802,193 Nonconsolidated subsidiaries and affiliates — — 4,518 48,581 Inventories — 1,249 188,868 2,030,839 Other current assets — — 19,212 206,581 Land — — 88,032 946,580 Buildings and structures — — 237,285 2,551,451 Machinery and equipment — — 40,290 433,226 Investments in securities — — 42,316 455,011 Investments in nonconsolidated subsidiaries and affiliates — 7,798 2,684 28,860 Other assets 6,486 8,412 — —
¥ 12,211 ¥ 19,403 ¥ 698,125 $ 7,506,720
Yen(millions)
U.S. Dollars(thousands)
2011 2012 2013 2013
Short-term borrowings ¥ 0 ¥ 1,275 ¥ 333,183 $ 3,582,613 Long-term debt 7,574 2,378 2,613 28,097
¥ 7,574 ¥ 3,653 ¥ 335,796 $ 3,610,710
(2) Appropriate book value of the assets and liabilities transferred and its main items
(3) Accounting method
The difference between the amount received as a value
of transferred business and the amount of owner’s equity
regarding the transferred business is recognized as trans-
fer profit or loss. This accounting method is assuming that
the investment regarding transferred business of develop-
ment, production and sales of LCD panels, is liquidated.
Yen(millions)
U.S Dollars(thousands)
Current Assets ¥ 43,461 $ 467,323Non-Current Assets 177,915 1,913,064Deferred Assets 590 6,344Total Assets ¥ 221,966 $ 2,386,731Current Liabilities 77,297 831,150Long-term Liabilities 5,941 63,882Total Liabilities ¥ 83,238 $ 895,032
Yen(millions)
U.S. Dollars(thousands)
Net Sales ¥ — $ —Operation income 107 1,151
(c) The name of reportable segment in which transferred business was included
The Electronic Components business segment
(d) Estimated amount of profit and loss regarding divested business, which was recorded in Consolidated Statements of
Operations for the year ended March 31, 2013
(e) Outline of ongoing commitment
Purchase of LCD displays from SDP and temporary transfer of employees to SDP
As of July 17, 2012, Sharp Display Products Corporation has changed its corporate name to Sakai Display Products Corporation.
Under the Japanese Corporate Law (“the Law”), the entire
amount paid for new shares is required to be designated as
common stock. However, a company may, by a resolution of
the Board of Directors, designate an amount not exceeding one-
half of the price of the new shares as additional paid-in capital,
which is included in capital surplus.
Under the Law, in cases where a dividend distribution of sur-
plus is made, the smaller of an amount equal to 10% of the
dividend or the excess, if any, of 25% of common stock over
the total of legal earnings reserve and additional paid-in capital
must be set aside as legal earnings reserve or additional paid-in
capital. Legal earnings reserve is included in retained earnings in
the accompanying consolidated balance sheets.
As of March 31, 2013, the total amount of legal earnings re-
serve and additional paid-in capital exceeded 25% of the com-
mon stock, therefore, no additional provision is required.
Legal earnings reserve and additional paid-in capital may not
be distributed as dividends. By the resolution of shareholders’
9. Net Assets and Per Share Data
Financial Section

56 SHARP CORPORATION Annual Report 2013 57
General information about reportable segments
The Company’s chief operating decision maker is its Board of
Directors. The Company’s reportable segments are components
of the Group that engage in business activities, whose operating
results are regularly reviewed by the Board of Directors when
making resource allocation and performance assessment deci-
sions, and for which discrete financial information is available.
The Group’s reportable segments consist of the Consumer/
Information Products business segment and the Electronic Com-
ponents business segment.
The Consumer/Information Products business segment in-
cludes digital information equipment, health and environmental
equipment and business solutions products.
The Electronic Components business segment includes LCDs,
solar cells and other electronic device products.
Expenses for severance and pension benefits of the Company and its domestic consolidated subsidiaries for the years ended March
31, 2011, 2012 and 2013 consisted of the following:
In addition, for the year ended March 31, 2013, the voluntary retirement of employees cost of ¥25,496 million ($274,151 thousand)
was included in restructuring charges.
The accounting policies for the reportable segments are consist-
ent with the Company’s accounting policies used in the prepara-
tion of its consolidated financial statements. Intersegment sales
and income (loss) are recognized based on current market prices.
Segment profit and loss is determined as operating profit less
basic research and development costs and administrative ex-
penses related to the Company’s corporate headquarters.
Depreciable assets of sales and distribution groups of the
Company’s headquarters and the sales subsidiaries depreciable
assets not directly allocated to product groups are not allocated
to reportable segments. On the other hand, depreciation and
amortization of these assets are allocated to reportable seg-
ments based on mainly sales of each reportable segment.
Basis of measurement of reported segment income or loss, segment assets and other material items
The discount rate used by the Company and its domestic con-
solidated subsidiaries for the years ended March 31, 2011, 2012
and 2013 was 2.5%, 2.5% and 1.5%, respectively. The rate of
expected return on plan assets used by the Company and its do-
mestic consolidated subsidiaries for the years ended March 31,
2011, 2012 and 2013 was 4.5%, 3.7% and 3.1%, respectively.
The estimated amount of all retirement benefits to be paid at
future retirement dates is allocated to each service year based
mainly on points.
13. Segment Information
Yen(millions)
U.S. Dollars(thousands)
2011 2012 2013 2013
Service costs ¥ 12,700 ¥ 12,398 ¥ 11,672 $ 125,505 Interest costs on projected benefit obligation 8,897 8,832 8,438 90,731 Expected return on plan assets (13,091) (10,458) (7,951) (85,495)Actuarial losses 10,813 11,814 12,888 138,581 Prior service costs (3,012) (3,017) (3,015) (32,419)Expenses for severance and pension benefits ¥ 16,307 ¥ 19,569 ¥ 22,032 $ 236,903
Financial Section
As of March 31, 2013, a part of the above-mentioned collat-
eral assets is pledged as collateral of ¥50,000 million ($537,634
thousand), which was not provided, out of maximum ¥180,000
million ($1,935,484 thousand) of uncommitted credit facility un-
der loan contract of September 27, 2012.
In relation to TFT-LCD business, the Company and some of
its subsidiaries are currently subject to the investigations being
conducted by the Directorate General for Competition of the
European Commission etc., and civil lawsuits seeking monetary
damages resulting from the alleged anticompetitive behavior
have been filed against the Company and some of its subsidiar-
In addition, ¥7,798 million and ¥2,684 million ($28,860 thou-
sand) investments in nonconsolidated subsidiaries and affiliates
for the years ended March 31, 2012 and 2013, respectively, are
pledged as collateral of ¥20,117 and ¥20,393 million ($219,280
thousand) long-term borrowings of affiliates.
ies in North America and Europe. The Company received a cease
and desist order and an administrative surcharge payment order
from the Japan Fair Trade Commission. However, the Company
has submitted a complaint to the Japan Fair Trade Commission,
which is currently pending.
As of March 31, 2011, 2012 and 2013, the Company and its consolidated subsidiaries had contingent liabilities as follows:
Allowance for severance and pension benefits of the Company and its domestic consolidated subsidiaries as of March 31, 2011, 2012
and 2013 consisted of the following:
In addition, allowances for severance and pension benefits of ¥2,845 million as of March 31, 2011, ¥4,235 million as of March
31, 2012 and ¥4,833 million ($51,968 thousand) as of March 31, 2013, respectively were provided by certain overseas consolidated
subsidiaries.
11. Contingent Liabilities
12. Employees’ Severance and Pension Benefits
Yen(millions)
U.S. Dollars(thousands)
2011 2012 2013 2013
Loans guaranteed ¥ 28,647 ¥ 27,349 ¥ 23,103 $ 248,419 ¥ 28,647 ¥ 27,349 ¥ 23,103 $ 248,419
Yen(millions)
U.S. Dollars(thousands)
2011 2012 2013 2013
Projected benefit obligation ¥ 353,413 ¥ 348,986 ¥ 329,085 $ 3,538,548 Less - fair value of plan assets (282,757) (268,758) (224,509) (2,414,075)Less - unrecognized actuarial losses (123,995) (129,560) (145,344) (1,562,839)Unrecognized prior service costs 26,049 23,122 20,059 215,688 Prepaid pension cost 29,063 27,975 22,377 240,613 Allowance for severance and pension benefits ¥ 1,773 ¥ 1,765 ¥ 1,668 $ 17,935
Financial Section

58 SHARP CORPORATION Annual Report 2013 59
Adjustments of segment income or loss were ¥(31,089) mil-
lion, ¥(33,861) million and ¥(33,954) million ($(365,097) thou-
sand) for the years ended March 31, 2011, 2012 and 2013,
respectively, and comprised elimination of intersegment trans-
actions and corporate expenses not allocated to each report-
able segment. The elimination of intersegment transactions was
¥3,083 million, ¥1,061 million and ¥1,117 million ($12,011
thousand), respectively. Corporate expenses not allocated to
each reportable segment were ¥(35,880) million, ¥(35,704) mil-
lion and ¥(36,306) million ($(390,387) thousand), for the years
ended March 31, 2011, 2012 and 2013, respectively. Corporate
expenses were mainly attributable to basic R&D expenses and
expenses related to the administrative groups of the Company’s
headquarters.
Adjustments of segment assets were ¥723,779 million,
¥557,336 million and ¥462,857 million ($4,976,957 thousand)
as of March 31, 2011, 2012 and 2013, respectively, and com-
prised elimination of intersegment transactions and corporate
assets not allocated to each reportable segment. The elimination
of intersegment transactions was ¥(36,464) million, ¥(18,788)
million and ¥(11,532) million ($(124,000) thousand), respective-
ly. Corporate assets not allocated to each reportable segment
were ¥760,243 million, ¥576,124 million and ¥474,389 million
($5,100,957 thousand), as of March 31, 2011, 2012 and 2013,
respectively. Corporate assets not allocated to each reportable
segment were mainly attributable to cash and cash equivalents,
deferred tax assets, the Company’s investments in securities, and
depreciable assets related to the Company’s R&D groups as well
as the administrative, sales and distribution groups of the Com-
pany’s headquarters.
Adjustments of investments in nonconsolidated subsidiar-
ies and affiliates accounted for using the equity method were
¥21,877 million, ¥22,807 million and ¥25,245 million ($271,452
thousand), as of March 31, 2011, 2012 and 2013, respectively,
and mainly comprised investments in Sharp Finance Corpora-
tion.
Adjustments of increase in plant, equipment and intangible
assets were ¥14,900 million, ¥13,493 million and ¥8,142 mil-
lion ($87,548 thousand) for the years ended March 31, 2011,
2012 and 2013, respectively, and mainly comprised increase in
the Company’s R&D groups and the administrative, sales and
distribution groups of the Company’s headquarters.
Depreciation and amortization includes the amortization of
long-term prepaid expenses.
Increase in plant, equipment and intangible assets includes
the increase in long-term prepaid expenses.
Financial Section
Information about reported segment income or loss, segment assets and other material items
Segment information as of and for the years ended March 31, 2011, 2012 and 2013 was as follows:
Yen(millions)
U.S. Dollars(thousands)
2011 2012 2013 2013
Net Sales: Consumer/Information Products: Customers ¥ 1,969,988 ¥ 1,630,555 ¥ 1,338,417 $ 14,391,580 Intersegment 582 444 1,324 14,237 Total 1,970,570 1,630,999 1,339,741 14,405,817 Electronic Components: Customers 1,051,985 825,295 1,140,169 12,259,882 Intersegment 502,032 357,713 235,944 2,537,032 Total 1,554,017 1,183,008 1,376,113 14,796,914 Eliminations (502,614) (358,157) (237,268) (2,551,269) Consolidated Net Sales ¥ 3,021,973 ¥ 2,455,850 ¥ 2,478,586 $ 26,651,462
Segment Income (Loss): Consumer/Information Products ¥ 79,257 ¥ 51,008 ¥ 46,695 $ 502,097 Electronic Components 30,728 (54,699) (159,007) (1,709,753) Adjustments (31,089) (33,861) (33,954) (365,097) Consolidated Operating (Loss) Income ¥ 78,896 ¥ (37,552) ¥ (146,266) $ (1,572,753)
Segment Assets: Consumer/Information Products ¥ 677,100 ¥ 632,365 ¥ 599,676 $ 6,448,129 Electronic Components 1,484,799 1,424,434 1,025,230 11,023,979 Adjustments 723,779 557,336 462,857 4,976,957 Consolidated Assets ¥ 2,885,678 ¥ 2,614,135 ¥ 2,087,763 $ 22,449,065
Other Material Items Depreciation and Amortization: Consumer/Information Products ¥ 82,276 ¥ 73,497 ¥ 64,747 $ 696,204 Electronic Components 190,963 166,030 111,747 1,201,581 Adjustments 8,025 7,563 4,518 48,581 The amount presented in Consolidated Financial Statements ¥ 281,264 ¥ 247,090 ¥ 181,012 $ 1,946,366
Amortization of Goodwill: Consumer/Information Products ¥ 3,033 ¥ 3,336 ¥ 2,826 $ 30,387 Electronic Components 432 1,730 1,788 19,226 Adjustments 85 121 116 1,247 The amount presented in Consolidated Financial Statements ¥ 3,550 ¥ 5,187 ¥ 4,730 $ 50,860
Investments in Nonconsolidated Subsidiaries and Affiliates accounted for using the equity methods: Consumer/Information Products ¥ 3,252 ¥ 3,340 ¥ 3,389 $ 36,440 Electronic Components 7,716 7,969 74,400 800,000 Adjustments 21,877 22,807 25,245 271,452 The amount presented in Consolidated Financial Statements ¥ 32,845 ¥ 34,116 ¥ 103,034 $ 1,107,892
Increase in Plant, Equipment and Intangible Assets: Consumer/Information Products ¥ 76,861 ¥ 67,309 ¥ 52,295 $ 562,312 Electronic Components 159,220 123,904 69,568 748,043 Adjustments 14,900 13,493 8,142 87,548 The amount presented in Consolidated Financial Statements ¥ 250,981 ¥ 204,706 ¥ 130,005 $ 1,397,903
Financial Section

60 SHARP CORPORATION Annual Report 2013 61
Amortization of goodwill and unamortized balance by reportable segment
Amortization of goodwill and unamortized balance by reportable segment as of and for the years ended March 31, 2011, 2012 and
2013 were as follows:Yen
(millions)U.S. Dollars(thousands)
2011 2012 2013 2013
Amortization of Goodwill: Consumer/Information Products ¥ 3,033 ¥ 3,336 ¥ 2,826 $ 30,387 Electronic Components 432 1,730 1,788 19,226 Corporate Assets and Elimination 85 121 116 1,247 Total ¥ 3,550 ¥ 5,187 ¥ 4,730 $ 50,860
Balance at end of period: Consumer/Information Products ¥ 7,708 ¥ 7,313 ¥ 5,414 $ 58,215 Electronic Components 16,385 15,470 15,577 167,495 Corporate Assets and Elimination 245 346 73 785 Total ¥ 24,338 ¥ 23,129 ¥ 21,064 $ 226,495
(Impairment Loss)
With regards to application of accounting for impairment as-
sets, the Company and its consolidated subsidiaries identifies
cash generating units in consideration of business characteristics
and business operation. As a result, idle assets are identified as
respective cash generating units.
The Company and its consolidated subsidiaries reduced the
book value of idle and unused-in-the-future production equip-
ment of thin-film solar cells in the Katsuragi Plant etc. to recover-
able amount, and recognized the decreased amount of ¥6,656
million as impairment loss for the year ended March 31, 2012.
Details are as follows: ¥4,547 million for lease assets; ¥1,167
million for machinery and vehicles; ¥942 million for other.
The Company reduced the book value of production equip-
ment of LCD panels and audio-visual equipment to an estimated
recoverable amount due to the decreasing profitability and the
unlikelihood of recouping investment, and recognized the de-
creased amount of ¥47,396 million ($509,634 thousand) as im-
pairment loss for the year ended March 31, 2013.
Details are as follows: ¥13,527 million ($145,452 thousand)
for buildings and structures; ¥16,416 million ($176,516 thou-
sand) for machinery, equipment and vehicles; ¥13,137 million
($141,258 thousand) for long-term prepaid expense; ¥4,316
milion ($46,409 thousand) for other.
The recoverable amount of those impaired assets was meas-
ured using their net realizable values, and net realizable values
of impaired assets that are not expected to be sold are regarded
as zero.
14. Impairment Loss
This loss for the year ended March 31, 2012 comprises extraor-
dinary operating expenses caused by the temporary suspension
of production of large-size LCD panels in the Company and its
consolidated subsidiary, Sharp Display Products Corporation.
15. Loss on suspension of Large size LCD plant operation
Financial Section
Related information
Sales by product/service for the years ended March 31, 2011, 2012 and 2013 were as follows:Yen
(millions)U.S. Dollars(thousands)
2011 2012 2013 2013
Sales to outside customers: LCDs ¥ 614,373 ¥ 420,226 ¥ 650,847 $ 6,998,355 LCD Color TVs 803,592 581,357 388,436 4,176,731 Others 1,604,008 1,454,267 1,439,303 15,476,376 Total ¥ 3,021,973 ¥ 2,455,850 ¥ 2,478,586 $ 26,651,462
Sales by region/country for the years ended March 31, 2011, 2012 and 2013 were as follows:Yen
(millions)U.S. Dollars(thousands)
2011 2012 2013 2013
Sales: Japan ¥ 1,592,909 ¥ 1,181,168 ¥ 1,007,264 $ 10,830,795 China 516,977 483,298 667,933 7,182,075 U.S.A. 229,955 240,668 263,777 2,836,312 Others 682,132 550,716 539,612 5,802,280 Total ¥ 3,021,973 ¥ 2,455,850 ¥ 2,478,586 $ 26,651,462 Sales are classified according to regions or countries where customers are located.
Plant and Equipment by region/country as of March 31, 2011, 2012 and 2013 were as follows:Yen
(millions)U.S. Dollars(thousands)
2011 2012 2013 2013
Plant and Equipment, at cost less accumulated depreciation:
Japan ¥ 870,320 ¥ 780,396 ¥ 461,539 $ 4,962,785 Others 94,594 92,046 102,160 1,098,495 Total ¥ 964,914 ¥ 872,442 ¥ 563,699 $ 6,061,280
Impairment Loss of fixed assets by reportable segment
Impairment Loss of fixed assets by reportable segment for the years ended March 31, 2011, 2012 and 2013 were as follows:Yen
(millions)U.S. Dollars(thousands)
2011 2012 2013 2013
Impairment Loss: Consumer/Information Products ¥ — ¥ 542 ¥ 13,374 $ 143,807 Electronic Components — 6,114 65,039 699,344 Corporate Assets and Elimination — — 509 5,473 Total ¥ — ¥ 6,656 ¥ 78,922 $ 848,624
Financial Section
Sales to Apple Inc., of the Company’s Electronic Components segment represents ¥320,433 million ($3,445,516 thousand) of the
Company’s consolidated net sales for the year ended march 31, 2013.

62 SHARP CORPORATION Annual Report 2013 63
Information about reported segment income or loss, segment assets and other material items for the year ended March 31, 2013,
based on the new segment classifications was as follows:
Financial Section
Yen(millions)
U.S. Dollars(thousands)
2013 2013
Net Sales: Product Business: Customers ¥ 1,598,312 $ 17,186,150 Intersegment 893 9,602 Total 1,599,205 17,195,752 Device Business: Customers 880,274 9,465,312 Intersegment 237,271 2,551,301 Total 1,117,545 12,016,613 Eliminations (238,164) (2,560,903) Consolidated Net Sales ¥ 2,478,586 $ 26,651,462
Segment Income (Loss): Product Business ¥ 42,198 $ 453,742 Device Business (154,510) (1,661,398) Adjustments (33,954) (365,097) Consolidated Operating (Loss) Income ¥ (146,266) $ (1,572,753)
Segment Assets: Product Business ¥ 889,353 $ 9,562,936 Device Business 735,238 7,905,785 Adjustments 463,172 4,980,344 Consolidated Assets ¥ 2,087,763 $ 22,449,065
Other Material Items Depreciation and Amortization: Product Business ¥ 72,323 $ 777,667 Device Business 104,171 1,120,118 Adjustments 4,518 48,581 The amount presented in Consolidated Financial Statements ¥ 181,012 $ 1,946,366
Amortization of Goodwill: Product Business ¥ 4,614 $ 49,613 Device Business — — Adjustments 116 1,247 The amount presented in Consolidated Financial Statements ¥ 4,730 $ 50,860
Investments in Nonconsolidated Subsidiaries and Affiliates accounted for using the equity methods: Product Business ¥ 7,034 $ 75,634 Device Business 70,755 760,806 Adjustments 25,245 271,452 The amount presented in Consolidated Financial Statements ¥ 103,034 $ 1,107,892
Increase in Plant, Equipment and Intangible Assets: Product Business ¥ 55,454 $ 596,280 Device Business 66,409 714,075 Adjustments 8,142 87,548 The amount presented in Consolidated Financial Statements ¥ 130,005 $ 1,397,903
These restructuring charges for the year ended March 31, 2011
are mainly related to the reorganization of LCD plants, including
depreciation and maintenance charges of plants that have been
suspended due to production line changes to meet the increas-
ing demand for high value-added products.
These restructuring charges for the year ended March 31,
2012 are related to the LCD business restructuring, etc. Those
mainly comprise depreciation and maintenance charges of
¥37,717 million concerning plants that were suspended in the
Company and its consolidated subsidiary, Sharp Display Prod-
ucts Corporation to improve production to meet the increasing
demand for high value-added products, and costs of ¥68,125
million incurred to reinforce business foundations (inventory
write-down, etc.) in preparation for promoting establishment of
strategic vertical integration of the large-size LCD business.
These restructuring charges for the year ended March 31,
2013 are as follows:
(a) This concerns LCD business and comprises costs of ¥12,056
million ($129,634 thousand) incurred for maintenance of in-
active fixed assets caused in the Company and its consolidated
subsidiary, Sharp Display Products Corporation (its corporate
name was changed to Sakai Display Products Corporation on
July 17, 2012), along with improving production to meet the
increasing demand for high value-added products.
(b) This mainly concerns reduction of production of the Com-
pany’s Large-size LCD panels and comprises the loss on valu-
ation of inventories of ¥53,468 million ($574,925 thousand).
(c) This mainly concerns a structural switch of Solar Cells busi-
ness and comprises costs of ¥31,526 million ($338,989 thou-
sand) incurred to impairment loss on fixed assets.
The Company and its consolidated subsidiaries categorizes
assets for business use in view of business facility, type of busi-
ness and others in a comprehensive manner. Idle assets are
categorized by each asset.
The Company and its consolidated subsidiaries reduced
the book value of idle and unused-in-the-future production
equipment of thin-film solar cells to an estimated recoverable
amount, and recognized the decreased amount of ¥31,526
million ($338,989 thousand) as a restructuring charge includ-
ed in other expenses.
Details are as follows: ¥17,568 million ($188,903 thou-
sand), for buildings and structures; ¥4,963 million ($53,366
thousand), for machinery, equipment and vehicles; ¥4,007
million ($43,086 thousand), for lease assets; ¥2,247 million
($24,161 thousand), for long-term prepaid expenses; ¥2,741
million ($29,473 thousand), for other.
(d) This comprises the loss on cancellation of lease contracts,
etc. by structural switch of Solar Cells business of ¥14,249
million ($153,215 thousand).
(e) This comprises the costs of restructuring of consolidated
subsidiaries of ¥6,602 million ($70,989 thousand).
(f) This comprises the costs of the voluntary retirement pro-
gram for employees of the Company and its domestic consoli-
dated subsidiaries of ¥25,496 million ($274,151 thousand).
16. Restructuring Charges
Change of reportable segment
The Company Group’s reportable segments were Consumer/In-
formation Products and Electronic Components in the year end-
ed March 31, 2013. Due to a reform of the organization on April
1, 2013, the Consumer/Information Products segment has been
changed to the Product Business segment and the Electronic
Components segment has been changed to the Device Business
segment in the year ending March 31, 2014. The Solar Cells
business which had been included in the Electronic Components
segment has been included in the Product Business segment.
17. Significant Subsequent Events
Financial Section
64 SHARP CORPORATION Annual Report 2013 65
Financial Section
It was decided at the board of directors meeting held on May 30,
2013, to continue measures to reinforce business foundations
with the reduction of labor costs. Subjects that required labor
union discussion were informed to the labor union on the same
the day, and were accepted by the labor union on June 20, 2013.
(a) Reasons to continue measures to reinforce business
foundations
The Company group is currently in the process of recovering
its business performance. As part of its measures to reduce
labor costs, the reduction in salary of managerial staff and
rank-and-file (union members) employees and the review of
bonuses has been conducted.
While business circumstances surrounding the Company
group are still harsh, the improvement of financial strengths
for “Recovery and Growth” needs to be secured, and there-
fore continuation of measures has been deemed necessary.
Based on this decision, the following measures will be imple-
mented.
(b) Details of the continuation of business reinforcement
measures
(1) Measures against managerial staff
[1] Reduction in salary
A 10% salary cut implemented from October 2012 to
September 2013 will continue with “a 5% cut.”
Implementation period: from October 2013 to March
2014
Note: A 5% reduction of salary was implemented from
April to September 2012.
[2] Review of bonuses
The December 2013 bonuses will be halved compared
to the June 2012 bonuses which were reduced by ap-
proximately 30% compared to the previous year.
(The same measure took place with the December
2012 and the June 2013 bonuses.)
[3] Others
Several allowances and welfare programs for union
member employees are currently applied to managerial
staff as well. Changes in these items that are subject to
(2) Legal Reserve
The Company will reduce the entire amount of legal re-
serve ¥26,115,000,000 as of March 31, 2013, and will
transfer the entire amount of the reduction of legal reserve
to retained earnings carried forward.
(d) Details of Appropriation of Surpluses
Following transfers of the common stock and capital reserve
described above, the Company will reduce other capital
surplus by ¥414,448,530,462 out of other capital surplus
of ¥426,015,533,792, reserve for severance payment of
¥1,756,000,000, and general reserve of ¥76,950,000,000,
and will transfer them to retained earnings carried forward to
cover the deficit.
(1) Item and amount of surpluses to be reduced
Other Capital Surplus: ¥414,448,530,462
Reserve for Severance Payment: ¥1,756,000,000
General Reserve: ¥76,950,000,000
(2) Item and amount of surplus to be increased
Retained Earnings Carried Forward: ¥493,154,530,462
(e) Schedule
May 14, 2013
Resolution of the board of directors meeting
May 27, 2013
Initial date of public notice for creditors to make objections
June 25, 2013
Resolution of the Ordinary General Meeting of
Shareholders
June 27, 2013
Final due date for creditors to make objections
June 28, 2013
Effective date
Continuation of Measures to Reinforce Business Foundations
Financial Section
Adjustments of segment income or loss were ¥(33,954) mil-
lion ($(365,097) thousand), and comprised elimination of in-
tersegment transactions and corporate expenses not allocated to
each reportable segment. The elimination of intersegment trans-
actions was ¥1,117 million ($12,011 thousand). Corporate ex-
penses not allocated to each reportable segment were ¥(36,306)
million ($(390,387) thousand). Corporate expenses were mainly
attributable to basic R&D expenses and expenses related to the
administrative groups of the Company’s headquarters.
Adjustments of segment assets were ¥463,172 million
($4,980,344 thousand), and comprised elimination of interseg-
ment transactions and corporate assets not allocated to each re-
portable segment. The elimination of intersegment transactions
was ¥(11,217) million ($(120,613) thousand). Corporate assets
not allocated to each reportable segment were ¥474,389 million
($5,100,957 thousand). Corporate assets not allocated to each
reportable segment were mainly attributable to cash and cash
equivalents, the Company’s investments in securities, and depre-
ciable assets related to the Company’s R&D groups as well as the
administrative, sales and distribution groups of the Company’s
headquarters.
Adjustments of investments in nonconsolidated subsidiar-
ies and affiliates accounted for using the equity methods were
¥25,245 million ($271,452 thousand), and mainly comprised in-
vestments in Sharp Finance Corporation.
Adjustments of increase in plant, equipment and intangible
assets was ¥8,142 million ($87,548 thousand), and mainly com-
prised increase in the Company’s R&D groups and the admin-
istrative, sales and distribution groups of the Company’s head-
quarters.
Depreciation and amortization includes the amortization of
long-term prepaid expenses.
Increase in plant, equipment and intangible assets includes
the increase in long-term prepaid expenses.
The Company passed a resolution at its board of directors meet-
ing held on May 14, 2013 to submit a proposal on reduction of
common stock, capital reserve and legal reserve, and on appro-
priation of surpluses to the Ordinary General Meeting of Share-
holders to be held on June 25, 2013, and the resolution was
then approved.
(a) Purpose of Reduction of Common Stock, Capital
Reserve and Legal Reserve, and Appropriation of
Surpluses
The Company recorded a ¥525,030,530,462 loss of retained
earnings carried forward for the year ended March 2013. In
order to regain financial strength at an early stage, and to
prepare for mobile and flexible implementation of future capi-
tal policy, by covering the deficit, the Company will reduce
common stock, capital reserve and legal reserve pursuant to
the provisions of Article 447, Paragraph 1 and Article 448,
Paragraph 1, of the Companies Act, and will then appropriate
the surpluses pursuant to the provision of Article 452 of the
Companies Act.
In addition, since these actions are accounting transfers within
the “Net Assets section” in the balance sheet of the Com-
pany, they will not change the Company’s net assets, and will
not affect the total number of issued shares and the number
of shares owned by each shareholder, etc.
(b) Details of Reduction of Common Stock
The Company will reduce common stock by ¥162,336,938,238
out of the amount of common stock as of March 31, 2013, of
¥212,336,938,238, and will transfer the entire amount of the
reduction of common stock to other capital surplus.
(c) Details of Reduction of Capital Reserve and Legal
Reserve
(1) Capital Reserve
The Company will reduce capital reserve by
¥256,576,762,667 out of the amount of capital reserve as
of March 31, 2013, of ¥269,076,762,667, and will trans-
fer the entire amount of the reduction of capital reserve to
other capital surplus.
Reduction of Common Stock, Capital Reserve and Legal Reserve, and Appropriation of Surpluses
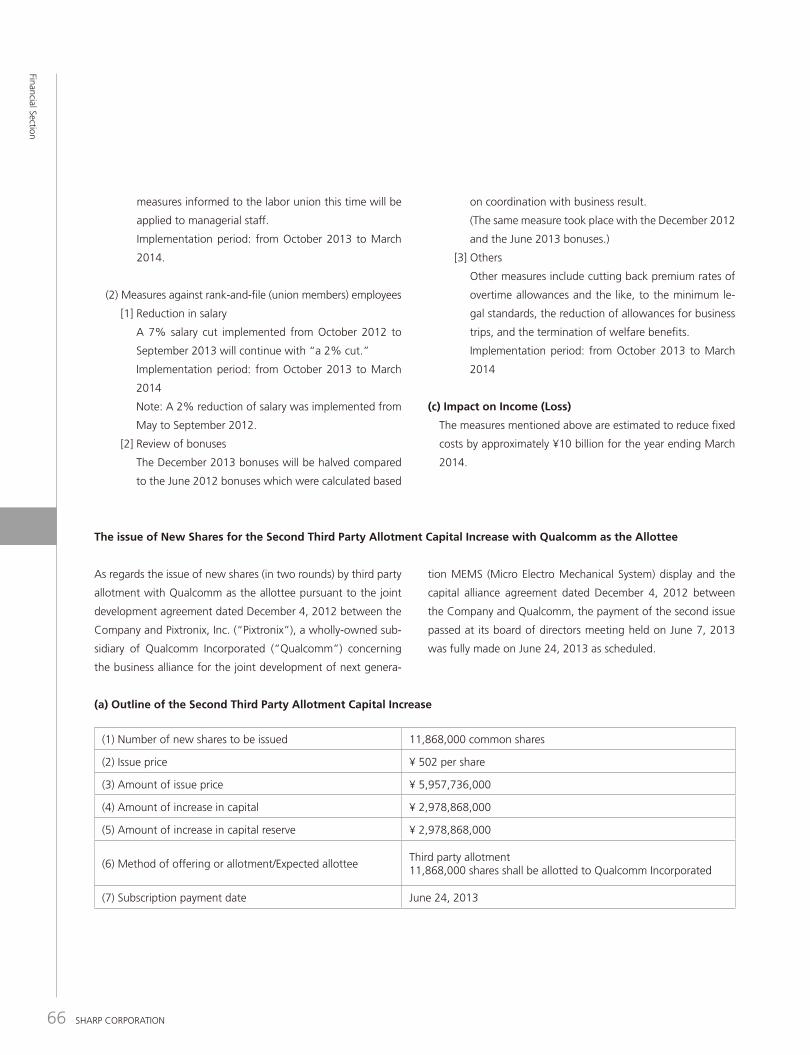
66 SHARP CORPORATION Annual Report 2013 67
The funds is expected to be used for costs and expenses, and equipment investment for the commercialization of the Next-Generation
MEMS Display.
(b) Purpose of use of the funds
The Company signed the agreement on June 25, 2013 regard-
ing renewal of the agreement which was signed in September
27, 2012 for the current syndicated loan of ¥360 billion due on
June 30, 2013, and the arrangement for new syndicated loan
of ¥150 billion.
The Renewal of Current Syndicated Loan Agreement and Signing of New Agreement
Current Syndicated Loan New Syndicated Loan
Amount ¥360 billion ¥150 billion (limit)
Type of LoanTerm Loan: ¥180 billion
Uncommitted line of credit: ¥180 billion (limit)Uncommitted line of credit
Purpose of Loan Working capital Capital for the redemption of convertible bonds
Arranger and AgentMizuho Corporate Bank, Ltd.
The Bank of Tokyo-Mitsubishi UFJ, Ltd.Same as on the left
Contract Term June 28, 2013 to March 31, 2016 June 25, 2013 to March 31, 2016
Financial Section
measures informed to the labor union this time will be
applied to managerial staff.
Implementation period: from October 2013 to March
2014.
(2) Measures against rank-and-file (union members) employees
[1] Reduction in salary
A 7% salary cut implemented from October 2012 to
September 2013 will continue with “a 2% cut.”
Implementation period: from October 2013 to March
2014
Note: A 2% reduction of salary was implemented from
May to September 2012.
[2] Review of bonuses
The December 2013 bonuses will be halved compared
to the June 2012 bonuses which were calculated based
on coordination with business result.
(The same measure took place with the December 2012
and the June 2013 bonuses.)
[3] Others
Other measures include cutting back premium rates of
overtime allowances and the like, to the minimum le-
gal standards, the reduction of allowances for business
trips, and the termination of welfare benefits.
Implementation period: from October 2013 to March
2014
(c) Impact on Income (Loss)
The measures mentioned above are estimated to reduce fixed
costs by approximately ¥10 billion for the year ending March
2014.
As regards the issue of new shares (in two rounds) by third party
allotment with Qualcomm as the allottee pursuant to the joint
development agreement dated December 4, 2012 between the
Company and Pixtronix, Inc. (“Pixtronix”), a wholly-owned sub-
sidiary of Qualcomm Incorporated (“Qualcomm”) concerning
the business alliance for the joint development of next genera-
(a) Outline of the Second Third Party Allotment Capital Increase
tion MEMS (Micro Electro Mechanical System) display and the
capital alliance agreement dated December 4, 2012 between
the Company and Qualcomm, the payment of the second issue
passed at its board of directors meeting held on June 7, 2013
was fully made on June 24, 2013 as scheduled.
The issue of New Shares for the Second Third Party Allotment Capital Increase with Qualcomm as the Allottee
(1) Number of new shares to be issued 11,868,000 common shares
(2) Issue price ¥ 502 per share
(3) Amount of issue price ¥ 5,957,736,000
(4) Amount of increase in capital ¥ 2,978,868,000
(5) Amount of increase in capital reserve ¥ 2,978,868,000
(6) Method of offering or allotment/Expected allotteeThird party allotment11,868,000 shares shall be allotted to Qualcomm Incorporated
(7) Subscription payment date June 24, 2013
Financial Section
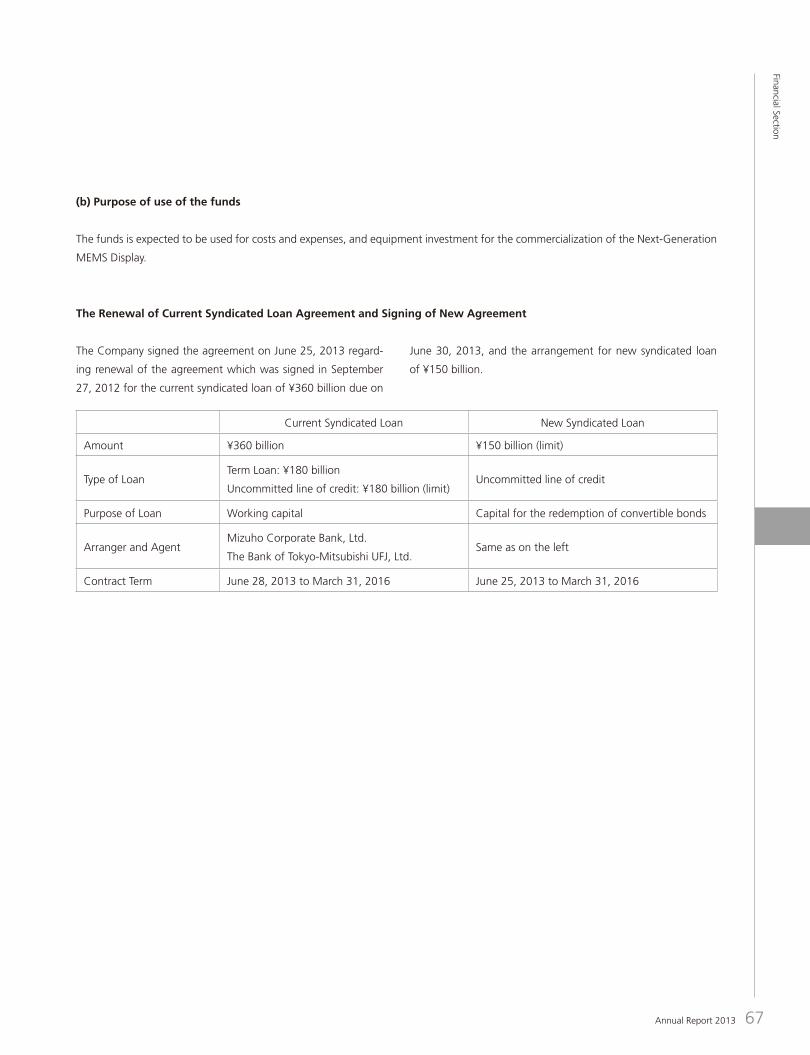

68 SHARP CORPORATION
Financial Section
Independent Auditor’s Report
To the Board of Directors of Sharp Corporation:We have audited the accompanying consolidated financial statements of Sharp Corporation and its consolidated subsidiaries, which comprise
the consolidated balance sheets as at March 31, 2013, 2012 and 2011, and the consolidated statements of operations, statements of com-
prehensive income, statements of changes in net assets and statements of cash flows for the years then ended, and a summary of significant
accounting policies and other explanatory information.
Management’s Responsibility for the Consolidated Financial Statements
Management is responsible for the preparation and fair presentation of these consolidated financial statements in accordance with account-
ing principles generally accepted in Japan, and for such internal control as management determines is necessary to enable the preparation of
consolidated financial statements that are free from material misstatements, whether due to fraud or error.
Auditor’s Responsibility
Our responsibility is to express an opinion on these consolidated financial statements based on our audits. We conducted our audits in ac-
cordance with auditing standards generally accepted in Japan. Those standards require that we comply with ethical requirements and plan and
perform the audit to obtain reasonable assurance about whether the consolidated financial statements are free from material misstatement.
An audit involves performing procedures to obtain audit evidence about the amounts and disclosures in the consolidated financial statements.
The procedures selected depend on our judgement, including the assessment of the risks of material misstatement of the consolidated financial
statements, whether due to fraud or error. In making those risk assessments, we consider internal control relevant to the entity’s preparation
and fair presentation of the consolidated financial statements in order to design audit procedures that are appropriate in the circumstances,
while the objective of the financial statement audit is not for the purpose of expressing an opinion on the effectiveness of the entity’s internal
control. An audit also includes evaluating the appropriateness of accounting policies used and the reasonableness of accounting estimates
made by management, as well as evaluating the overall presentation of the consolidated financial statements.
We believe that the audit evidence we have obtained is sufficient and appropriate to provide a basis for our audit opinion.
Opinion
In our opinion, the consolidated financial statements present fairly, in all material respects, the financial position of Sharp Corporation and its
consolidated subsidiaries as at March 31, 2013, 2012 and 2011, and their financial performance and cash flows for the years then ended in
accordance with accounting principles generally accepted in Japan.
Emphasis of Matter
Without qualifying our opinion, we draw attention to Note 17 “Significant Subsequent Events” to the consolidated financial statements as follows:
(1) The Company changed reportable segments for the year ending March 31, 2014.
(2) The Company passed a resolution at its board of directors meeting held on May 14, 2013 to submit a proposal on reduction of common
stock, capital reserve and legal reserve, and on appropriation of surpluses to the Ordinary General Meeting of Shareholders to be held on
June 25, 2013, and the resolution was then approved.
(3) The Company decided at the board of directors meeting held on May 30, 2013, to continue measures to reinforce business foundations
with the reduction of labor costs and informed the labor union of subjects that required labor union discussion on the same day that were
accepted by the labor union on June 20, 2013.
(4) The Company passed a resolution at its board of directors meeting held on June 7, 2013 to issue new shares by third party allotment and
the payment was fully made on June 24, 2013.
(5) The Company signed the agreement on June 25, 2013 regarding renewal of the agreement which was signed in September 27, 2012 for
the current syndicated loan of ¥360 billion due on June 30, 2013, and the arrangement for new syndicated loan of ¥150 billion.
Convenience Translation
The U.S. dollar amounts in the accompanying consolidated financial statements with respect to the year ended March 31, 2013 are presented
solely for convenience. Our audit also included the translation of yen amounts into U.S. dollar amounts and, in our opinion, such translation
has been made on the basis described in Note 1.(a) to the consolidated financial statements.
June 25, 2013
Osaka, Japan

Annual Report 2013 69
Financial Section
Sharp Electronics Marketing CorporationSharp System Products Co., Ltd.Sharp Manufacturing Systems CorporationSharp Engineering CorporationSharp Document Systems CorporationSharp Amenity Systems CorporationSharp Niigata Electronics CorporationSharp Trading CorporationSharp Business Computer Software Inc.Sharp Yonago CorporationSharp Mie CorporationiDeep Solutions CorporationSharp Support & Service Corporation
Sharp Electronics Corporation <New Jersey, U.S.A.> Sharp Laboratories of America, Inc. <Washington, U.S.A.>Sharp Electronics Manufacturing Company of America, Inc. <California, U.S.A.>Sharp US Holding Inc. <California, U.S.A.>Recurrent Energy, LLC <California, U.S.A.> *2
Sharp Electronics of Canada Ltd. <Ontario, Canada>Sharp Electronica Mexico S.A. de C.V. <Baja California, Mexico>Sharp Corporation Mexico, S.A. de C.V. <Mexico City, Mexico>Sharp Brasil Comércio e Distribuiçáo de Artigos Eletrônicos Ltda. <San Paulo, Brazil>Sharp Electronics (Europe) GmbH <Hamburg, Germany>Sharp Electronics (Europe) Limited <London, U.K.>Sharp Electronics (U.K.) Ltd. <Middlesex, U.K.>Sharp Laboratories of Europe, Ltd. <Oxford, U.K.>Sharp International Finance (U.K.) Plc. <Middlesex, U.K.>Sharp Electronics (Schweiz) AG <Rüschlikon, Switzerland>Sharp Electronics (Nordic) AB <Bromma, Sweden>Sharp Electronics France S.A. <Paris, France>Sharp Manufacturing France S.A. <Soultz, France>Sharp Electronics (Italia) S.p.A. <Milano, Italy>Sharp Electronics Benelux B.V. <Houten, The Netherlands>Sharp Manufacturing Poland Sp. z o. o. <Torun, Poland>Sharp Electronics Russia LLC. <Moscow, Russia>Sharp Electronic Components (Taiwan) Corporation <Taipei, Taiwan>Sharp (Phils.) Corporation <Manila, Philippines>Sharp-Roxy Sales (Singapore) Pte., Ltd. <Singapore>Sharp Electronics (Singapore) Pte., Ltd. <Singapore>Sharp Manufacturing Corporation (M) Sdn. Bhd. <Johor, Malaysia>Sharp Electronics (Malaysia) Sdn. Bhd. <Selangor, Malaysia>Sharp Appliances (Thailand) Ltd. <Chachoengsao, Thailand>Sharp Manufacturing (Thailand) Co., Ltd. <Nakornpathom, Thailand>Sharp Business Systems (India) Ltd. <New Delhi, India>Shanghai Sharp Electronics Co., Ltd. <Shanghai, China>Sharp Office Equipments (Changshu) Co., Ltd. <Changshu, China>Wuxi Sharp Electronic Components Co., Ltd. <Wuxi, China>Nanjing Sharp Electronics Co., Ltd. <Nanjing, China>Sharp Electronics (Shanghai) Co., Ltd. <Shanghai, China>Sharp Technical Components (Wuxi) Co., Ltd. <Wuxi, China>Sharp Electronics Sales (China) Co., Ltd. <Shanghai, China>Sharp Electronics Research & Development (Nanjing) Co., Ltd. <Nanjing, China>Sharp Laboratories of China Co., Ltd. <Shanghai, China>Sharp (China) Investment Co., Ltd. <Beijing, China>P.T. Sharp Electronics Indonesia <Jakarta, Indonesia>P.T. Sharp Semiconductor Indonesia <West Java, Indonesia>Sharp Electronics (Vietnam) Company Limited <Ho Chi Minh City, Vietnam>Sharp Corporation of Australia Pty. Ltd. <New South Wales, Australia>Sharp Corporation of New Zealand Ltd. <Auckland, New Zealand>Sharp Middle East FZE <Dubai, U.A.E.>
Domestic:
Overseas: <Countries and Areas>
*1 In addition to the companies listed above, there are 22 consolidated subsidiaries.*2 Although all of the Recurrent Energy, LLC-owned 177 subsidiaries related to solar power generation plants are included in the scope of consolidation, in counting consolidated subsidiaries
of the Company, they and Recurrent Energy, LLC are considered as one company in consideration of the fact that it is a solar project developer.
Consolidated Subsidiaries*1

証券会社 12,091,876株(1.03%)
合計 1,176,623,887株
その他の法人 93,765,927株(7.97%)
外国人 180,745,896株(15.36%)
自己株式 10,399,220株(0.88%)
個人453,874,866株(38.58%)
※ 投資信託・年金信託に係る株式数が 36,472,000株(3.10%)含まれています。
金融機関※ 425,746,102株(36.18%)
Japanese securities companies12,091,876(1.03%)
Total 1,176,623,887
shares
Treasury stock 10,399,220(0.88%)
Japaneseindividual shareholders453,874,866 (38.58%)
* A total of 36,472,000 shares (3.10%) in investment trusts and pension trust funds are included in shares held by Japanese financial institutions.
Other Japanese corporations93,765,927(7.97%)
Foreign shareholders180,745,896(15.36%)
Japanese financial institutions*425,746,102(36.18%)
70 SHARP CORPORATION
Shareholders Number of Shareholders 165,096
Principal Shareholders
Nippon Life Insurance Company 55,667,384 4.73
Meiji Yasuda Life Insurance Company 45,781,000 3.89
Mizuho Corporate Bank, Ltd. 41,910,469 3.56
The Bank of Tokyo-Mitsubishi UFJ, Ltd. 41,678,116 3.54
Samsung Electronics Japan Co., Ltd. 35,804,000 3.04
Mitsui Sumitomo Insurance Company, Limited 30,658,022 2.61
Qualcomm Incorporated 30,120,000 2.56
SHARP Employee Share-Holding Association 25,793,758 2.19
Japan Trustee Services Bank, Ltd. (Trust Account) 22,861,000 1.94
Sompo Japan Insurance Inc. 21,496,000 1.83
Share Distribution (Proportion of total issued shares)
Stock Exchange Tokyo, OsakaListings
Transfer Agent Mizuho Trust & Banking Co., Ltd.
Osaka Stock Transfer Agency Department
11-16, Sonezaki 2-chome, Kita-ku, Osaka 530-0057, Japan
Investor Relations Sharp Corporation Investor Relations
Osaka 22-22, Nagaike-cho, Abeno-ku, Osaka 545-8522, Japan
Phone: +81-6-6625-3023 Fax: +81-6-6625-0918
Tokyo Seavans South Building, 1-2-3 Shibaura, Minato-ku, Tokyo, 105-0023, Japan
Phone: +81-3-5446-8208 Fax: +81-3-5446-8206
Websites:
(English) http://sharp-world.com/corporate/ir/index.html
(Japanese) http://www.sharp.co.jp/corporate/ir/index.html
Investor Information(As of March 31, 2013)
Investor Information
Notes: 1. Percentage of total shares is calculated by the number of shares issued (including 10,399,220 treasury shares). 2. Aside from the above, a total of 4,770,000 shares in Mizuho Corporate Bank, Ltd. have been set up as trust assets related to
the employee pension trust.
Number of shares heldPercentage of
total shares (%)
22-22, Nagaike-cho, Abeno-ku, Osaka 545-8522, JapanPhone: +81-6-6621-1221http://www.sharp.co.jp