Embed Size (px)
Citation preview
Recovery of Platinum Group Metals from
Waste Sources
by
Scott Taylor
A thesis submitted to
The University of Birmingham
for the degree of
MPhil.
Department of Chemical Engineering
College of Engineering & Physical Sciences
The University of Birmingham
October 2011
University of Birmingham Research Archive
e-theses repository This unpublished thesis/dissertation is copyright of the author and/or third parties. The intellectual property rights of the author or third parties in respect of this work are as defined by The Copyright Designs and Patents Act 1988 or as modified by any successor legislation. Any use made of information contained in this thesis/dissertation must be in accordance with that legislation and must be properly acknowledged. Further distribution or reproduction in any format is prohibited without the permission of the copyright holder.

Acknowledgments
I would like to thank Angela Murray, Prof. Stuart Blackburn and Prof. Lynne Macaskie for
their help and support during this project, as well as all the members of both work groups I
was involved with who offered help with both equipment and expertise during this project.
I would like to thank the B.B.S.R.C for the funding which enabled me to carry out this
project. I would also like to give special thanks to both my friends and family for their
ongoing support throughout this study.
Abstract
The metal recovering abilities of cells which are “pre-loaded” with either Pd or Pt metals
are well documented and known to work well. This study prepared several different
batches of “pre-loaded” cells produced using identical methodologies to identify which
combination of metal and wt% loading offered the optimum for metal recovery from
solution and afterwards offered the highest catalytic activity. Recovery of metals from
model solutions showed that all loadings for both Pt and Pd achieved recovery of 100% of
the mixed Pd and Pt contained within solution in near identical times.
To highlight the optimum pre-loading catalytic testing in the form of chromate Cr(VI)
reduction was carried out which showed that cells using an initial pre-loading of 2wt% Pd
were found to offer the optimum activity and recovery properties. Further independent
testing of cells using an initial pre-loading of 2wt% Pd in a 2 Pentyne hydrogenation
reaction again showed them to offer optimum catalytic activity.
The other aspect of the recovery process investigated was that of a model road dust
system, several different techniques were used to imitate the manufacture of TWC’s (three
way catalytic converters) to aid in producing an accurate model for a road dust. Using
SEM, EDX and XRD analysis a production method involving the extrusion of an alumina
wash coat material impregnated with Pt solution was seen to offer the best model of a real
catalyst.
Table of contents
1. INTRODUCTION .......................................................................................................................... 1
1.1. Aim .......................................................................................................................................... 2
1.2. Thesis layout ........................................................................................................................... 2
2. LITERATURE REVIEW ............................................................................................................... 3
2.1. Platinum Group Metals ........................................................................................................... 3
2.2. Catalytic Converters ................................................................................................................ 7
2.2.1. Construction and Materials .............................................................................................. 8
2.2.2. Washcoat Materials .......................................................................................................... 9
2.3. Road Dusts ............................................................................................................................ 11
2.4. Bio-recovery .......................................................................................................................... 14
3. EXPERIMENTAL PROGRAMME : Development of Model Road Dusts ................................. 17
3.1. Methods & Materials: Model road dust materials ................................................................. 17
3.1.1. Model Road Dust ........................................................................................................... 17
3.1.2. Substrate Preparation ...................................................................................................... 18
3.1.3. Cordierite tubes .............................................................................................................. 18
3.1.4. Washcoating ................................................................................................................... 20
3.1.5. Steel Sheet ...................................................................................................................... 22
3.1.6. Milled Wash Coat ........................................................................................................... 22
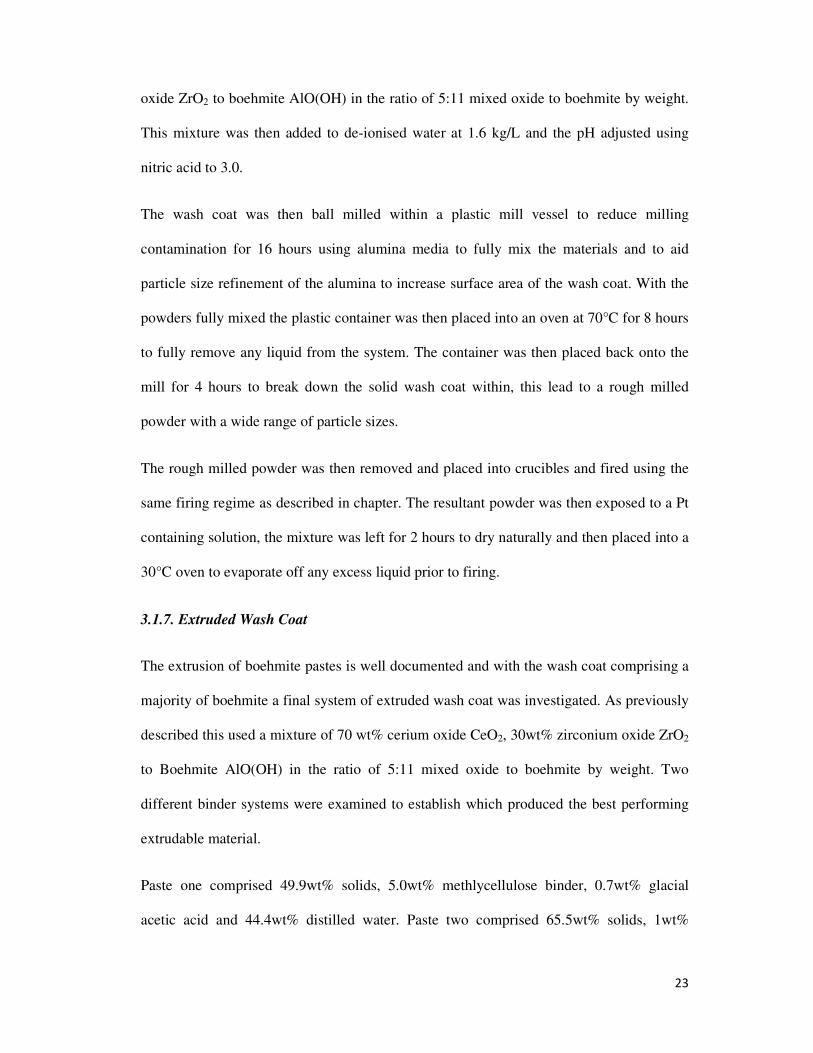
3.1.7. Extruded Wash Coat ....................................................................................................... 23
3.1.8. Substrate firing regime ................................................................................................... 24
3.1.9. Pt doping of rods ............................................................................................................ 25
3.1.10. Pt firing regime............................................................................................................. 26
3.1.11. SEM analysis ................................................................................................................ 28
3.1.12. XRD analysis................................................................................................................ 28
3.1.13. BET analysis ................................................................................................................ 28
3.1.14. Model road dust powder mixing .................................................................................. 29
3.1.15. Road Dust Sampling ..................................................................................................... 29
3.2 Results & Discussions: Development of model road dust materials & TWC models ........... 31
3.2.1. Model Road Dust ........................................................................................................... 31
3.2.2. Car Catalyst SEM ........................................................................................................... 32
3.2.3. Cordierite substrate ........................................................................................................ 33
3.2.4. Steel Sheet Substrate ...................................................................................................... 37
3.2.5. Milled Wash Coat ........................................................................................................... 38
3.2.6. Extruded Rods ................................................................................................................ 40
3.2.7. Comparision of model road dust system with real road dusts ........................................ 42
3.2.8. XRD Analysis ................................................................................................................ 45
3.2.9. BET Analysis ................................................................................................................. 47
4. EXPERIMENTAL PROGRAMME : Metal Biorecovery into new catalysts .............................. 48
4.1. Methods & Materials: Metal biorecovery into new catalysts ................................................ 48
4.1.1. Introduction .................................................................................................................... 48
4.1.2. Petri Dish Agar Plate Preparation .................................................................................. 49
4.1.3. E.coli Plate Preparation .................................................................................................. 49
4.1.4. Aerobic Growth Media Preparation ............................................................................... 50
4.1.5. Anaerobic Growth Media Preparation ........................................................................... 50
4.1.6. Small Inoculation ........................................................................................................... 51
4.1.7. Transfer to Larger Batches ............................................................................................. 51
4.1.8. Centrifugation of live cells ............................................................................................. 52
4.1.9. Metalisation of live cells ................................................................................................ 52
4.1.10. Centrifugation of metallised cells ................................................................................. 54
4.1.11. Recovery of metal from model solution ....................................................................... 55
4.1.12. Effect of Inter Batch Variability ................................................................................... 56
4.1.13. Centrifugation of Bio-Catalysts .................................................................................... 56
4.1.14. Preparation of Powdered Bio-catalyst .......................................................................... 57
4.1.15. Transmission Electron Microscopy (TEM) .................................................................. 57
4.1.16. Chromate Reduction Testing ........................................................................................ 58
4.1.17. 2 Pentyne Hydrogenation ............................................................................................. 59
4.1.18. Recovery of Metals from Real Leachates .................................................................... 59
4.1.19. Addition of Contaminants to Model Solutions ............................................................. 60
4.1.20. Chromate Testing of Catalyst from Real Leachates ..................................................... 61
4.2. Results & Discussions: Metal biorecovery and catalytic testing ........................................... 61
4.2.1. Stannous Chloride Calibration ....................................................................................... 61
4.2.2. Reduction From Model Solutions .................................................................................. 64
4.2.3. TEM Imaging ................................................................................................................. 68
4.2.4. Maximum Recovery ....................................................................................................... 70
4.2.5. Chromate Reduction ....................................................................................................... 70
4.2.6. Aqua Regia Neutralization ............................................................................................. 73
4.2.7. Metal Reduction from Real Leachate ............................................................................. 74
4.2.8. Addition of Contaminants .............................................................................................. 75
4.2.9. Chromate Reduction with Real Catalyst ........................................................................ 76
4.2.10. 2-Pentyne Hydrogentation ............................................................................................ 77
5. THESIS DISCUSSION ................................................................................................................ 80
6. CONCLUSIONS .......................................................................................................................... 81
7. FUTURE WORK ......................................................................................................................... 82
8. REFERENCES ............................................................................................................................. 84
9. APPENDIX .................................................................................................................................. 93
Appendix 1. Cell Preparation Methodology ................................................................................ 93
Appendix 2. Outreach Activities .................................................................................................. 96
Appendix 3. Conference Presentations & Publications ................................................................ 97
3.1. 2011 International Biohydrometallury Symposium Paper ................................................ 97
3.2. Intech Biorecycling of precious metals and rare Earth elements chapter extract ............ 105
List of figures
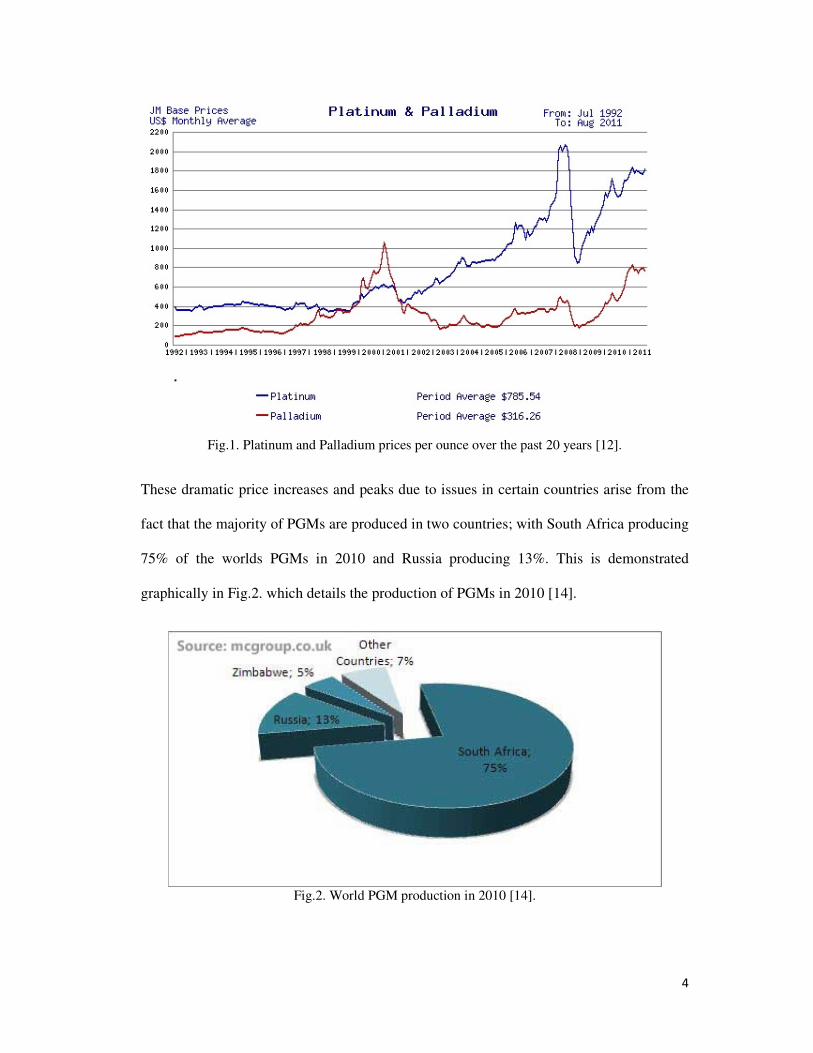
Fig.1. Platinum and Palladium prices per ounce over the past 20 years [12]. .................................... 4
Fig.2. World PGM production in 2010 [14]. ...................................................................................... 4
Fig.3. Worldwide PGM demand [15]. ................................................................................................ 5
Fig.4. Platinum demand by application (reproduced from oingold.com) [16]. ................................. 6
Fig.5. Palladium demand by application (reproduced from oingold.com) [16]. ................................ 6
Fig.6. A typical car catalytic converter and operation [22]. ............................................................... 8
Fig.7. Concentration of Pt, Rh and Pd in roadside soils near Stuttgart.[40] .................................... 13
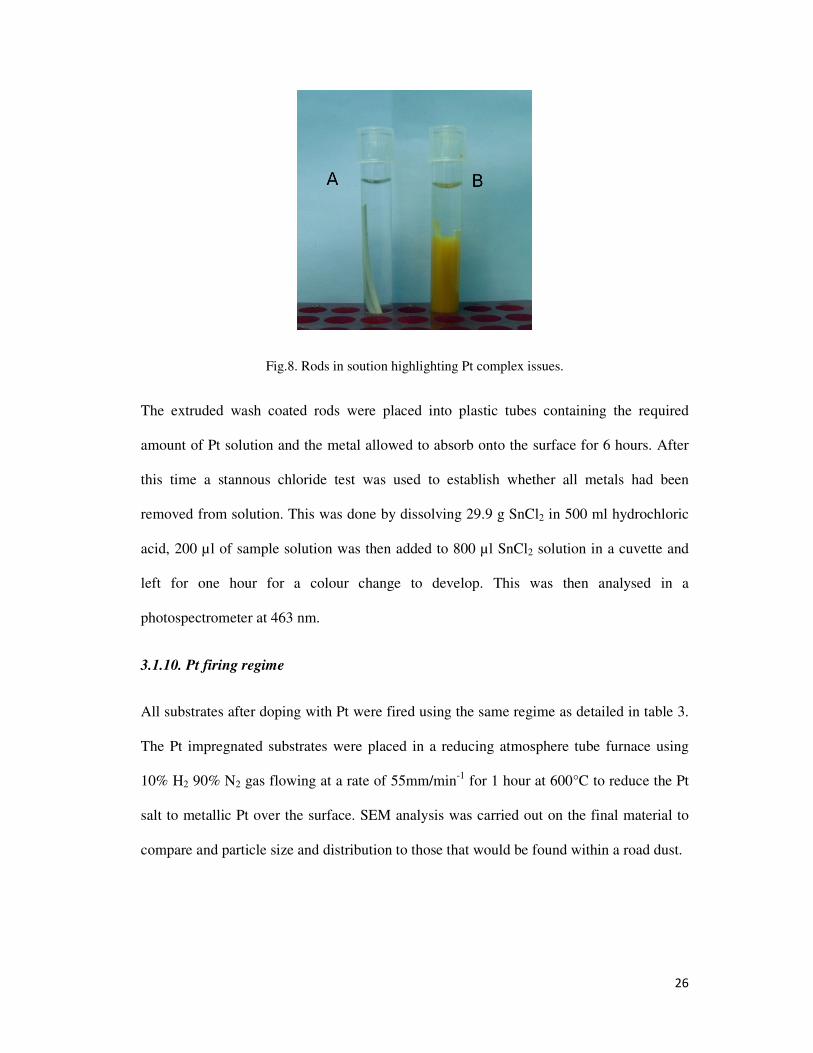
Fig.8. Rods in soution highlighting Pt complex issues. ................................................................... 26
Fig.9. Extruded wash coat tubes in various states. ........................................................................... 27
Fig.10. Map of Birmingham showing sampling sites [69] ............................................................... 30
Fig.11a. EDX Spectrum of TWC washcoat. .................................................................................... 32
Fig.11b.SEM image of car catalyst .................................................................................................. 33
Fig.12. SEM image of uncoated cordierite rod. ............................................................................... 34
Fig.13. SEM image of alumina wash coated cordierite rod. ............................................................ 35
Fig.14. SEM image of alumina wash coated cordierite tube impregnated with platinum. .............. 36
Fig.15. EDX spectrum of wash coat seen in figure 14. .................................................................... 36
Fig.16. SEM image of steel sheet substrate material ....................................................................... 38
Fig.17a. SEM image of milled wash coat substrate. ........................................................................ 39
Fig.17b. EDX pattern for area shown in figure 17a. ........................................................................ 39
Fig.18. SEM image of extruded wash coat before impregnation. .................................................... 40
Fig.19. SEM image of extruded wash coat after impregnation circled area used for EDX analysis.
.......................................................................................................................................................... 41
Fig.20. EDX trace of extruded wash coat after impregnation. ......................................................... 41
Fig.21. SEM image of a real road dust sample. ............................................................................... 42
Fig.22. EDX trace of a real road dust sample. ................................................................................. 42
Fig.23. EDX trace of a real road dust sample highlighting contaminants. ....................................... 43
Fig.24. SEM image of a real road dust sample. ............................................................................... 43
Fig.25. SEM image of a model road dust sample. ........................................................................... 44
Fig.26. EDX trace of a model road dust sample. ............................................................................. 44
Fig.27. XRD pattern showing phase change from boehmite to gamma alumina. ............................ 45
Fig.28. XRD pattern of (a) boehmite, (b) boehmite derived γ alumina[70]. .................................... 46
Fig.29. XRD trace of a real road dust sample. ................................................................................. 47
Fig.29. Method of producing metallasied E.coli bio-catalysts (courtesy of I.P.Mikheenko[71]). ... 54
Fig.30. Bottles containing PGM solution and E.coli cells. .............................................................. 56
Fig.31. Palladium calibration curve for 200:800 .............................................................................. 62
Fig.32. Palladium calibration curve for 500:500 .............................................................................. 62
Fig.33. Platinum calibration curve for 200:800 ............................................................................... 63
Fig.34. Palladium calibration curve for 500:500 .............................................................................. 63
Fig.35. 1%Pd preloaded cells reduction of Pd&Pt from model solution ......................................... 64
Fig.36. 2%Pd preloaded cells reduction of Pd&Pt from model solution. ........................................ 65
Fig.37. 5%Pd preloaded cells reduction of Pd&Pt from model solution ......................................... 65
Fig.38. 1%Pt preloaded cells reduction of Pd&Pt from model solution .......................................... 66
Fig.39. 2%Pt preloaded cells reduction of Pd&Pt from model solution .......................................... 66
Fig.40. 5%Pt preloaded cells reduction of Pd&Pt from model solution .......................................... 66
Fig.41. Average reduction of Pd&Pt from model solution for all metal loadings as shown inset ... 67
Fig.42. TEM imaging of various cells. ............................................................................................. 69
Fig.43. Average chromate reduction for all cells of differing loadings. .......................................... 71
Fig.44. Chromate reduction by commercial 5% Pd catalyst. ........................................................... 72
Fig.45 PGM reduced from real leachate solution by 5% Pd metallised cells. ................................. 75
Fig.46. PGM reduction from solution with added Al2O3 contamination. ........................................ 76
Fig.47. Chromate reduction using catalyst from real leachate means ± SEM from 3 experiments
where errors are not shown there were within dimension of the symbols ....................................... 77
Fig.48. 2-Pentyne conversion for Pd on E.coli and Al2O3 substrates. .............................................. 78
Fig.49. 2-Pentyne conversion for pre-loaded cells and cells with recovered metals. ....................... 79
List of tables
Table 1. Cordierite firing regime. ..................................................................................................... 20
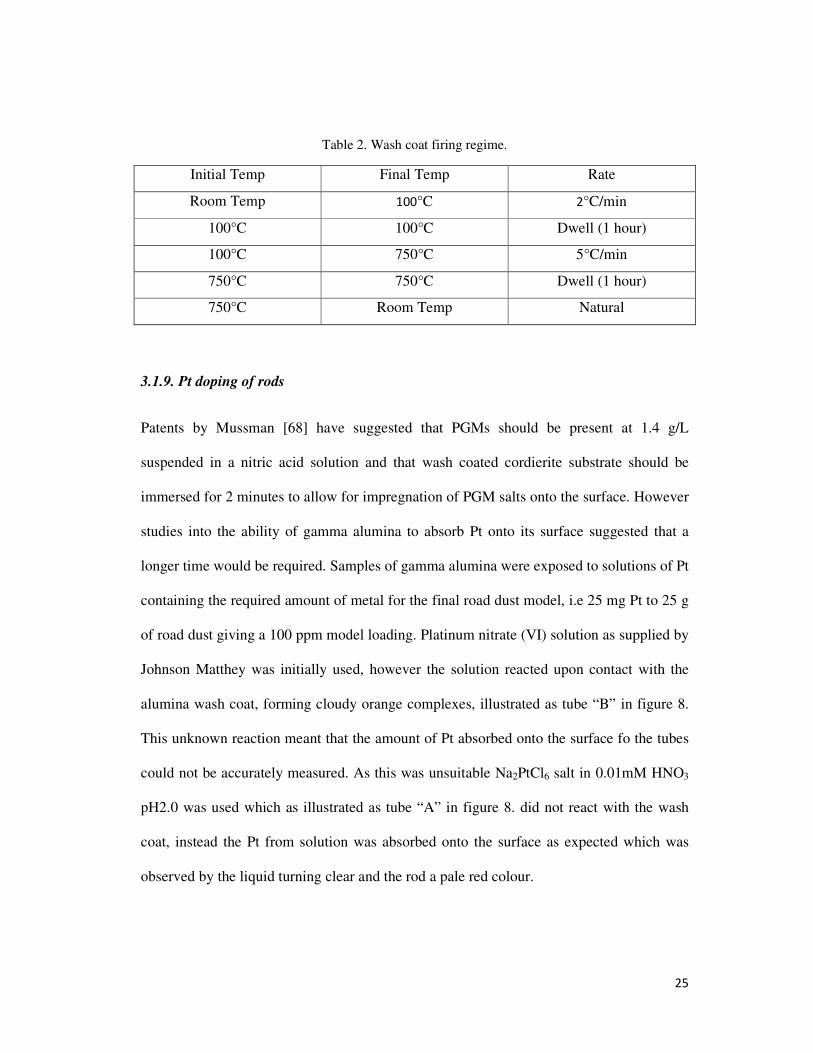
Table 2. Wash coat firing regime. .................................................................................................... 25
Table 3. Pt firing regime. ................................................................................................................. 27
Table 4. BET surface areas of fired alumina samples. ..................................................................... 47
Table 5. Loadings of cells after recovery of metals from model solutions. ..................................... 55
Table 6. Effect of Aqua regia on pre-metallised cells at various concentrations. ............................ 73
1
1. INTRODUCTION
Platinum Group Metals (PGMs) are an extremely scarce high value group of elements,
used in a range of applications from jewellery to cancer drugs, with the largest demand
coming from the automotive industry for use within autocatalysts. Currently supplies of
PGMs regularly fall below that of the demand [1] and with newly emerging technologies
such as hydrogen fuel cells demand for PGMs, in particular platinum, is likely to increase
[2].
As PGMs are a finite resource with an increasing demand and no reserves in Europe [3] it
is of great importance to find alternative sources to ensure supplies of these metals.
Recovery of PGMs from currently unexploited waste sources is one option for this.
Several studies worldwide have shown that there is an apparent concentration of PGMs in
close proximity to roads, suggesting that road dust collected from these areas would be a
potentially suitable waste source from which to recover PGMs. Studies in Italy between
1992 and 2001 by Cinti et al. suggest that there is a correlation between catalytic converter
use in motor vehicles and the increase in Pt levels in soils[4] at the road side, while other
studies by Schafer in Germany [5] and Gomez et al. [6] in Spain, along with others; have
shown higher levels of PGMs within soil samples near to roads.
Previous work carried out by Murray et al.[7] and Macaskie et al. [8] showed that it is
possible to recover PGMs from urban waste sources; these were based on refractory brick
and translated to road dusts, with metal contents in the wastes equivalent to that of a low
grade mine ore. E. coli bacteria were used to recover the PGMs from solution after a
number of physical processing and extraction methods had been applied. The metallised
bacteria, i.e. bacteria which have had metal reduced onto their surface, exhibited catalytic
activity and therefore have potential added value.
2
1.1. Aim
The first aim of this study was to progress the PGM recovery techniques already in use and
under development at Birmingham. This was achieved by evaluating the effectiveness of
current techniques by means of a model system to identify the optimum system for metal
recovery. The second aim was to identify a suitable manufacturing method to produce a
model road dust which could be used in the future to create model leachates to which
recovery techniques could then be applied and further evaluated. To simplify analysis
Platinum was chosen as the single metal for use within this model road dust as it is the
most abundant within catalytic converters [9]. The purpose of using a model road dust
instead of the constituent materials was to produce a material as close to that which would
be found in a real world situation as possible. The third aim was to show PGM biorecovery
from model solution and waste leachates and demonstrate catalytic properties of the
resulting materials in comparison to commercially available catalysts.
1.2. Thesis layout
Within this thesis, the literature review, chapter 2, outlines the background to the work
carried out during this study as well as detailing current techniques used within other
studies. The main experimental section, chapter 3, contains all experimental work,
materials, methodologies, results and discussions. The work detailed within that chapter is
split into two sections, materials study and recovery/catalysis; these two sections represent
the work carried out; separate but complementary to each other. The final sections present
a discussion of the work within this thesis, (chapter 5), and draw together conclusions from
the experimental section, (chapter 6), and chapter 7 proposes future work, focussing on
work to link together the different facets of the work.
3
2. LITERATURE REVIEW
2.1. Platinum Group Metals
The PGM’s (platinum group metals) consist of ruthenium, rhodium, palladium, osmium,
iridium, and platinum [10]. They are highly valuable metals due to their physical and
chemical properties, offering considerable catalytic activity alongside high wear and high
temperature resistance. Throughout this study Pd and Pt are of the most interest due to
their extensive use within the automotive industry within car catalytic converters.
Due to global demand for Pd and Pt constantly increasing and currently available resources
e.g. the Merensky reef in South Africa which contains the majority of the worlds PGM’s
[11] constantly decreasing the values of these metals per troy ounce have been steadily
rising over the last 20 years. Fig.1. shows a graph of the monthly average price in U.S.
dollars per Troy ounce for the last 20 years for both metals. Over this period the value of
Pd has increased over 9 fold from $83.42/oz. to $757.72/oz. and Pt increased nearly 5
times from $384.14/oz. to $1816.09/oz [12].
Prices can be seen to be following the gradual increasing trend due to increasing demand,
however in 2000 there was a sharp increase in the value of Pd; this was due to the Russian
supply of palladium being disrupted as the export quota was not granted on time [13]. The
peak in Pt prices in 2008 was due to a power crisis in South Africa causing a production
shutdown of all mines for 5 days and led to supply fears driving up the price. Both of these
example illustrate the high volatility of the precious metals market and the vulnerability of
non-producing nations to this, highlighting the importance to secure new resources of these
materials.
4
Fig.1. Platinum and Palladium prices per ounce over the past 20 years [12].
These dramatic price increases and peaks due to issues in certain countries arise from the
fact that the majority of PGMs are produced in two countries; with South Africa producing
75% of the worlds PGMs in 2010 and Russia producing 13%. This is demonstrated
graphically in Fig.2. which details the production of PGMs in 2010 [14].
Fig.2. World PGM production in 2010 [14].
5
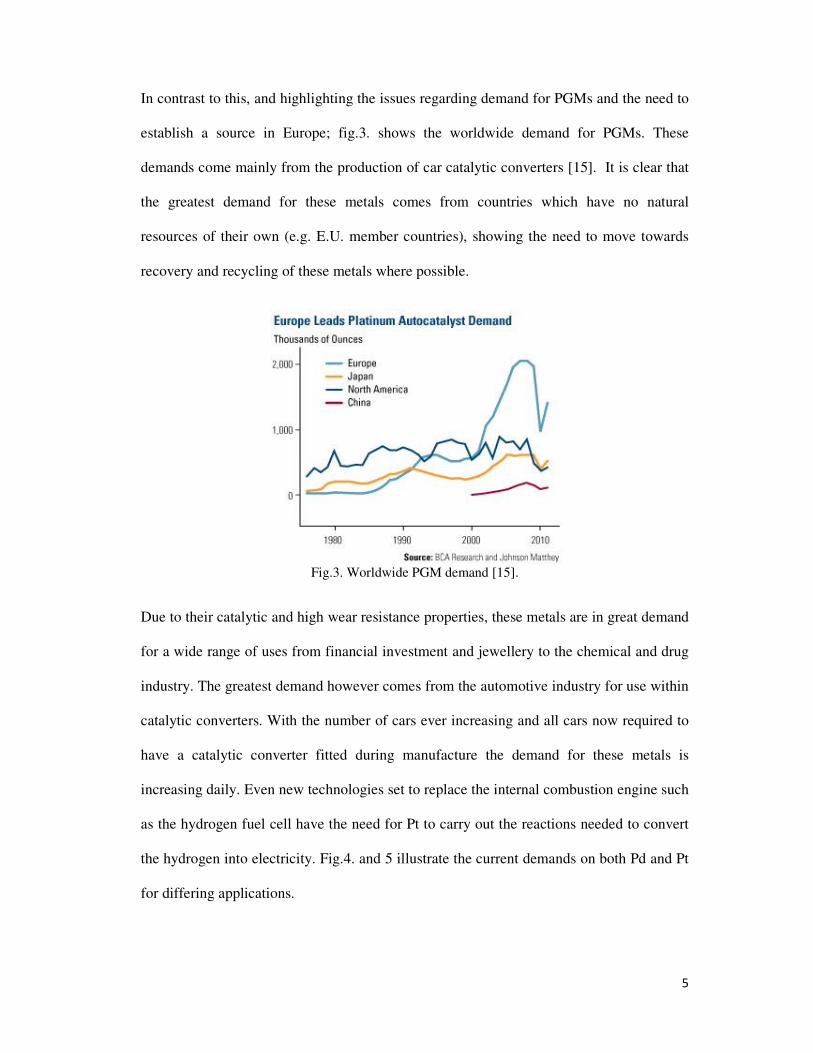
In contrast to this, and highlighting the issues regarding demand for PGMs and the need to
establish a source in Europe; fig.3. shows the worldwide demand for PGMs. These
demands come mainly from the production of car catalytic converters [15]. It is clear that
the greatest demand for these metals comes from countries which have no natural
resources of their own (e.g. E.U. member countries), showing the need to move towards
recovery and recycling of these metals where possible.
Fig.3. Worldwide PGM demand [15].
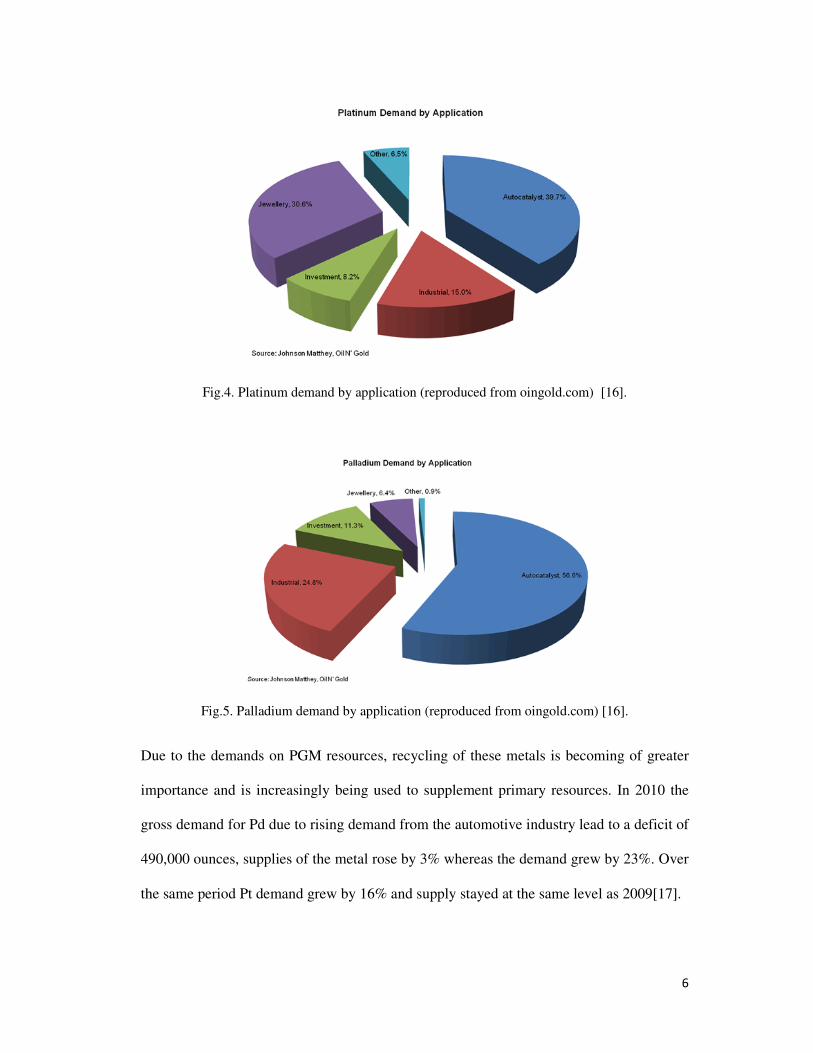
Due to their catalytic and high wear resistance properties, these metals are in great demand
for a wide range of uses from financial investment and jewellery to the chemical and drug
industry. The greatest demand however comes from the automotive industry for use within
catalytic converters. With the number of cars ever increasing and all cars now required to
have a catalytic converter fitted during manufacture the demand for these metals is
increasing daily. Even new technologies set to replace the internal combustion engine such
as the hydrogen fuel cell have the need for Pt to carry out the reactions needed to convert
the hydrogen into electricity. Fig.4. and 5 illustrate the current demands on both Pd and Pt
for differing applications.
6
Fig.4. Platinum demand by application (reproduced from oingold.com) [16].
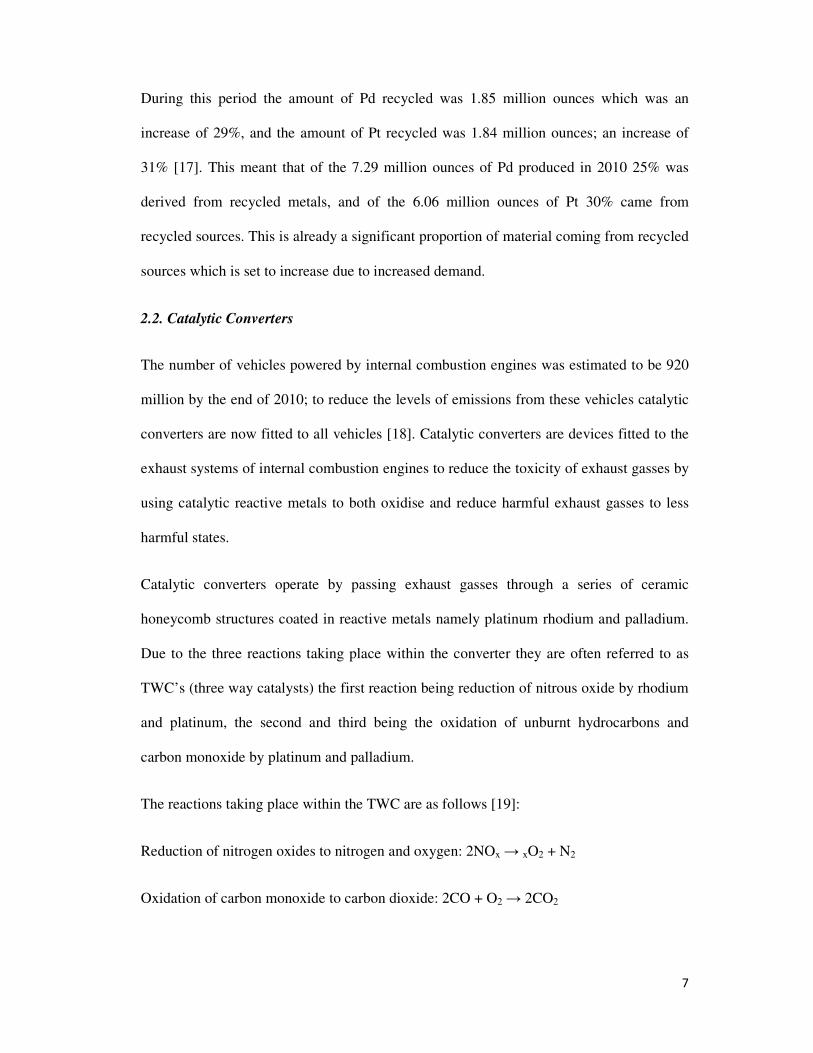
Fig.5. Palladium demand by application (reproduced from oingold.com) [16].
Due to the demands on PGM resources, recycling of these metals is becoming of greater
importance and is increasingly being used to supplement primary resources. In 2010 the
gross demand for Pd due to rising demand from the automotive industry lead to a deficit of
490,000 ounces, supplies of the metal rose by 3% whereas the demand grew by 23%. Over
the same period Pt demand grew by 16% and supply stayed at the same level as 2009[17].
7
During this period the amount of Pd recycled was 1.85 million ounces which was an
increase of 29%, and the amount of Pt recycled was 1.84 million ounces; an increase of
31% [17]. This meant that of the 7.29 million ounces of Pd produced in 2010 25% was
derived from recycled metals, and of the 6.06 million ounces of Pt 30% came from
recycled sources. This is already a significant proportion of material coming from recycled
sources which is set to increase due to increased demand.
2.2. Catalytic Converters
The number of vehicles powered by internal combustion engines was estimated to be 920
million by the end of 2010; to reduce the levels of emissions from these vehicles catalytic
converters are now fitted to all vehicles [18]. Catalytic converters are devices fitted to the
exhaust systems of internal combustion engines to reduce the toxicity of exhaust gasses by
using catalytic reactive metals to both oxidise and reduce harmful exhaust gasses to less
harmful states.
Catalytic converters operate by passing exhaust gasses through a series of ceramic
honeycomb structures coated in reactive metals namely platinum rhodium and palladium.
Due to the three reactions taking place within the converter they are often referred to as
TWC’s (three way catalysts) the first reaction being reduction of nitrous oxide by rhodium
and platinum, the second and third being the oxidation of unburnt hydrocarbons and
carbon monoxide by platinum and palladium.
The reactions taking place within the TWC are as follows [19]:
Reduction of nitrogen oxides to nitrogen and oxygen: 2NOx → xO2 + N2
Oxidation of carbon monoxide to carbon dioxide: 2CO + O2 → 2CO2
8
Oxidation of unburnt hydrocarbons (HC) to carbon dioxide and water: HC + NO → CO2 +
H2O + N2 (Unbalanced reaction).
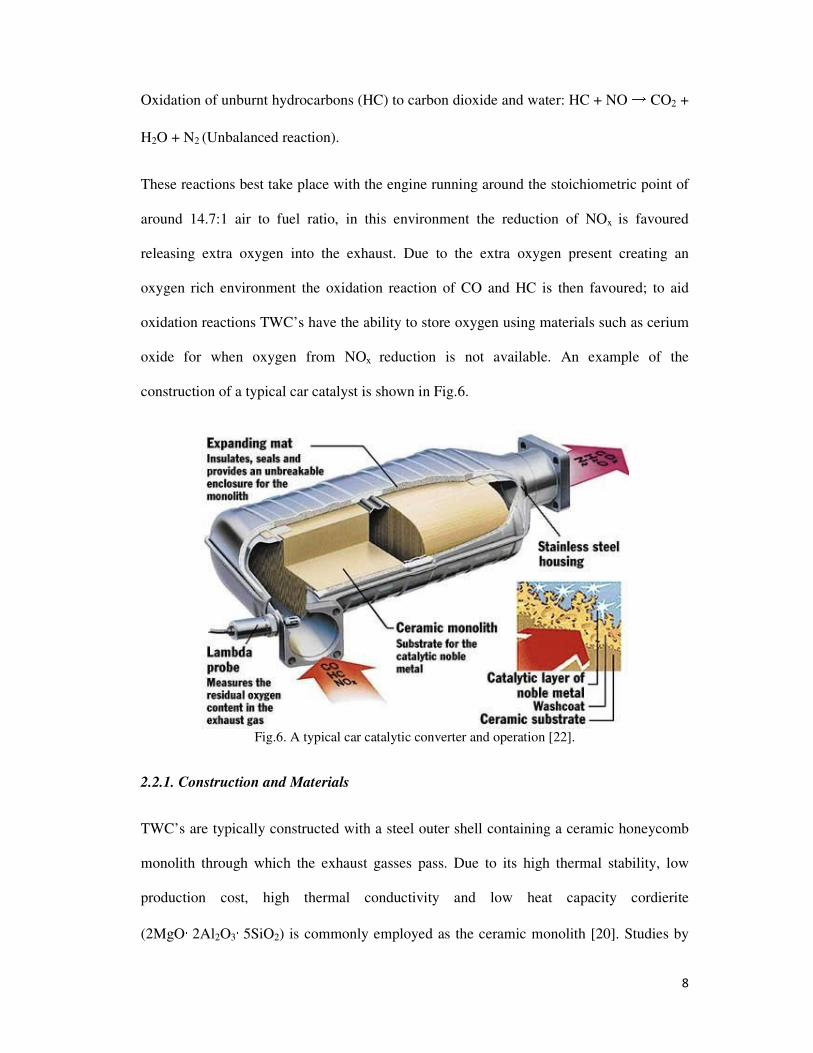
These reactions best take place with the engine running around the stoichiometric point of
around 14.7:1 air to fuel ratio, in this environment the reduction of NOx is favoured
releasing extra oxygen into the exhaust. Due to the extra oxygen present creating an
oxygen rich environment the oxidation reaction of CO and HC is then favoured; to aid
oxidation reactions TWC’s have the ability to store oxygen using materials such as cerium
oxide for when oxygen from NOx reduction is not available. An example of the
construction of a typical car catalyst is shown in Fig.6.
Fig.6. A typical car catalytic converter and operation [22].
2.2.1. Construction and Materials
TWC’s are typically constructed with a steel outer shell containing a ceramic honeycomb
monolith through which the exhaust gasses pass. Due to its high thermal stability, low
production cost, high thermal conductivity and low heat capacity cordierite
(2MgO·2Al2O3·5SiO2) is commonly employed as the ceramic monolith [20]. Studies by
9
Das et al. have shown that a cordierite formulation comprising 39wt% talc, 46wt% kaolin
clay and 15wt% calcined alumina combined with a binder system of 2wt% methylcellulose
and 23wt% de-ionised water performed well in the extrusion of honeycomb monoliths
[21].
The honeycomb monoliths found within a TWC typically contain 400cell/inch2
0.62cell/mm2 and using ceramic honeycombs have 69% open area with 31% closed area
meaning exhaust gasses can pass through 69% of the face of the monolith leading to a low
pressure drop. Improvements in ceramic extrusion technology leading to thinner wall
thicknesses of material are now leading to cell densities around 900cell/inch2 [9].
Upon the ceramic monolith surface layers of material are deposited or “washcoated”.
Depending on the production method this is achieved either one layer comprising all
materials including alumina and catalytic metals, or two layers one comprising alumina (to
increase the surface area of the catalytic converter) and a second containing the catalytic
metals. Washcoat layers are applied in various ways including dip coating or by insipient
wetness techniques; any excess material is blown out using hot air and the layer then
calcined to obtain the finished TWC [23].
2.2.2. Washcoat Materials
Despite the varied production methods there are some common components, which
represent the state-of-art of the washcoating compositions:
• γ Alumina, which is employed as a high surface area support.
• CeO2 or CeO2–ZrO2 mixed oxides, principally added as oxygen storage promoters.
• Noble metals (Rh, Pt and Pd) as active phases.
10
• Barium and/or lanthana oxides as stabilisers of the alumina surface area.
Alumina (γ Al2O3) is used as a carrier in order to increase the surface area of the ceramic
honeycomb monolith which is typically below 2–4 m2 l−1. Boehmite AlO (OH) with a low
surface area of around 10 m2 g−1 is used and then calcined to form a γ alumina phase with
high surface areas typically above 150 m2 g-1[24].
Cerium in the form of CeO2 is used as previously discussed as an oxygen trap within the
converter to store or release oxygen depending up the conditions within the exhaust.
Studies have shown that CeO2–ZrO2 mixed oxides are now preferred to CeO2 on its own
due to the effect of increasing the thermal stability of the alumina support and promotion
of noble metal dispersion [25].
Barium as well as cerium is employed as a stabiliser to prevent γ alumina phase changing
to low surface area alpha alumina due to the high (greater than 1000°c) temperatures
experienced within the exhaust system. This is important due to the greatly decreased
surface area of alpha alumina as discussed previously.
The noble metals used within TWC as mentioned previously are platinum, rhodium and
palladium. Studies have shown general agreement upon the use of rhodium being
employed for its ability to promote the dissociation of NO within the exhaust. Platinum
and palladium are employed for their ability to promote the oxidation reaction, with
palladium in particular promoting the oxidation of unburnt hydrocarbons.
SEM studies of used and new catalytic converters by Angelidis et al. showed that a typical
catalytic converter contained between 5% and 10% PGM and 30% and 60% alumina [26].
These figures agreed with various patents including Mussman et al. which suggested a
11
PGM content of between 0.001% and 10%, however between 0.5% and 5% were typically
used for economical and longevity optimisation [24].
2.3. Road Dusts
Road dust as the name suggests is granular detritus found within the environment in close
proximity to roads, its composition varies greatly due to a variety of factors. The local
geology with soils comprising different elements, the local environment whether it be
industrial, rural or inner city, along with the traffic flow within the local area, will all have
a large impact on the road dust composition. Currently road dusts are treated as a waste
material which is removed by the use of road sweepers. This collected material is then
disposed of by means of incineration and land fill. In the U.K alone more than 1 million
tonnes of road sweepings are collected by road sweepers and disposed of via landfill at a
cost of around £48 per tonne of material at the time of writing [27].
The particulate matter found near road sides has been investigated in detail due to the
interest in the impact on health due to these particles[28][29][30]. For these studies
particulate matter was sorted into different fraction sizes and denoted as such Pm2.5 for
particles of sub 2.5 microns Pm10 for particles of sub 10 microns etc. The correlation
between these size fractions of dust and the levels of traffic experienced in the local area
has been shown in various studies [31][32]. Studies have looked into the main constituents
of these powders within road dusts, studies by Han et al. in Anshan China found there to
be 23 main constituent elements[33], while Ho et al. identified 47 different elements in
Hong Kong [34]; Amato et al. looked at dusts within Barcelona and identified 15 “major”
constituents along with a further 33 trace elements[35]. From these studies the main
constituents were seen to be SiO2 (18-32%) and C (7-23%) with Ca also showing
significant amounts present. Al2O3 was present at up to 9% with all other elements present

12
at much lower levels and trace amounts such as Fe (1-3%) and K (1-2%). As the increase
in road traffic has been directly linked to the increase of these Pm fraction levels, the
higher traffic experienced should lead to an increase in the presence of PGMs within these
road dusts due to the expulsion of nanoparticulate PGMs from vehicle exhaust systems.
All internal combustion engine vehicles must now be fitted with a catalytic converter
during manufacture. During the working lifespan of these vehicles the catalytic converter
will start to degrade and break down due to thermal and shock loadings experienced during
driving. The particles of converter which have degraded and broken off from the surface
are expelled from the vehicle exhaust and are deposited within road dusts. Due to the
nature of the catalytic converters this means that the PGMs initially contained on their
surfaces become deposited in road dusts. Since PGMs are chemically unreactive they
become dispersed as nanoparticulates into the environment permanently unless recovery
methods are implemented.
Studies worldwide have looked into the accumulation of PGMs in road dusts and road
gully run offs; many studies have shown that there is a noted increase over the background
levels of PGMs [36] [37]. Some studies have shown levels of Pd up to 2.25 ppm [38] and
up to 0.6 ppm for Pt [39] Schafer et al. investigated the levels of PGMs found in soils and
dusts at increasing distances from the road surface; a strong correlation between the
distance from the road and the levels of PGMs was shown, with PGM concentration
decreasing with increased distance [40]. Other studies have shown that the levels of PGMs
present in road side soils drops by 1 order of magnitude within 10 m from the road surface
[41].
13
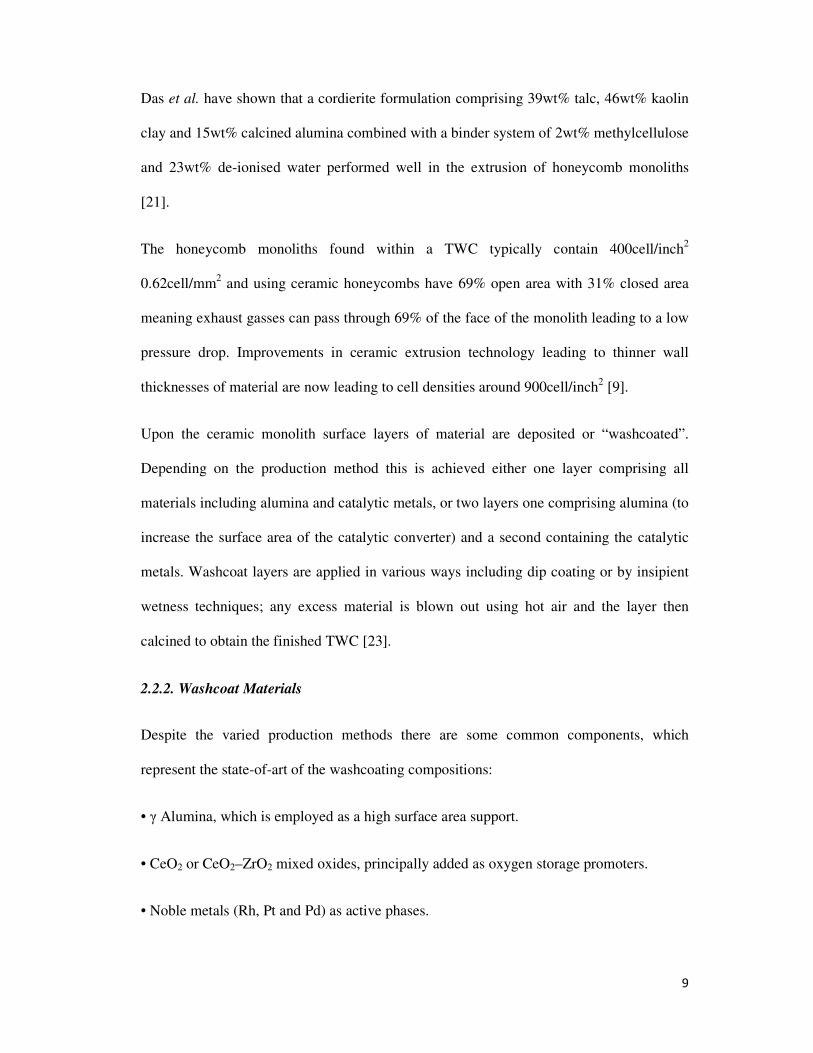
Fig.7. Concentration of Pt, Rh and Pd in roadside soils near Stuttgart.[40]
The mobility of PGMs in road dusts and the amount of time they stay within the dusts by
the road side before being moved and deposited elsewhere by mechanisms such as wind or
rain has also been investigated. These studies suggested that the mechanisms for
transportation of these metals are preferential to Pd. This means that Pd will be distributed
over a greater distance in a shorter period after expulsion from the exhaust compared to Pt
[42].
With PGMs being such a scarce resource, the recovery of these metals deposited by the
road side is going to become of great importance. Currently even the world’s richest mine
ores in the Merensky reef only have PGM levels of between 1 and 5 ppm. Studies carried
out around the city of Sheffield have shown that PGM levels in road dusts in high traffic
areas can be as high as 1 ppm for Pd and 0.6ppm for Pt [42] which is equivalent to that of
a low grade mine ore. The benefits of recovering metals from the road side to that of
primary mining are very obvious in the reduction of pollution which occurs due to deep
14
earth mining along with the massive energy demands of PGM extraction and processing
from primary ores, whereas in contract road PGMs in road dust are already finely divided.
Knowing that roads with a high volume of traffic and also specific road features such as
tunnels, roundabouts or intersections prone to congestion have a higher presence of PGMs
[37], locations for sampling can be identified. This targeting of specific roads and areas
has been termed as “urban mining” and due to the raised levels of PGMs being similar to
that of a naturally occurring mine ore this is a relevant terminology for these technologies.
2.4. Bio-recovery
Several bacteria have previously been shown to have the ability to reduce a large range of
metallic elements. Desulfovibrio desulfuricans was shown to reduce Au(III), Fe(III),
Cr(VI), U(VI)[43] and Pd(II)[44] , while Desulfovibrio fructosovorans showed ability to
reduce Tc (VII) [45]. Cells of Escherichia coli (E.coli) have shown the ability to reduce
Pd(II)[46], and Au(III)[47]. These bacteria carry out dissimilatory metal reduction
whereby the oxidation of substrates such as H2 or formate is coupled to the reduction of
metallic ions by redox-active enzymes such as periplasmic (NiFe) hydrogenases[48].
These bacteria have been shown to reduce metal from both mono metallic and bi metallic
solutions onto their surface, showing that the hydrogenase reactions are not limited or
preferential to one metal. These bacteria are employed within a wide range of emerging
innovative processes in differing fields of biotechnology, e.g. technologies such as
bioremediation [49] and biorecovery [50]. The resultant catalysts produced by reducing
metals onto cell surfaces have been tested against commercially available catalysts in
many different reactions. E.coli bacteria loaded with Au, Pd and Au/Pd, were tested for
selective oxidisation of glycerol [51], and selective oxidation of alcohols[52] (Au/Pd),
Cr(VI) reduction[53] and within a fuel cell electrocatalyst[53] (Pd). Desulfovibrio

15
desulfuricans loaded with Au, Au/Pd, Pd, Pt were also tested against selective oxidation of
glycerol[51], selective oxidation of alcohols[52], Mizoroki-Heck couplings[55] & within a
fuel cell electrocatalyst[53] respectively. As well as use within catalytic reactions, these
pre metallised cells can be used for further recovery of metals from solutions. In this case
the pre-loaded metal acts as a chemical catalyst for further metal deposition [54].
The advantage of using bio recovered metals on the surface of bacterial cells are firstly
financial as the growth of bacteria to reduce these metals is a comparatively low cost
solution when compared to the cost of alternative metal support substrates such as Al2O3
or carbon [56]. The second advantage is the small nano scale particles which are formed
during these bio-reductions means an increased surface area of catalytic metal which will
be exposed to the target materials in catalysis.
Escherichia coli (E. coli) is a rod shaped, gram negative bacterium found most commonly
within the lower intestine of warm blooded organisms such as humans. Cells of the
bacteria are around 2 µm in length and around 0.5 µm in diameter, with certain strains
possessing flagella [56]. Cells can be grown under aerobic respiration (with O2 the
terminal electron acceptor) and anaerobic respiration whereby NO3, NO2 or fumarate serve
as final electron acceptors for respiratory electron transport processes [57]. The alternative
method of anaerobic fermentation occurs in the absence of O2 or alternative electron
acceptors. Due to its origins within the (highly anaerobic) lower intestine of living
organisms optimal growth occurs at 37°C however some studies have shown growth to
take place at higher temperatures [58].
The ability of E.coli to reduce metals onto its surface has been well documented [51][52],
the resultant biocatalysts have been shown to offer catalytic activity similar to that of
commercially available catalysts in a variety of different reaction such as Cr(VI) reduction.
16
These metallised cells have also been shown to have the ability to reduce further metals
onto their surface from model solutions [59]. They have also been shown to reduce metals
from leachates of waste sources [60] showing the possibility of using these metallised cells
to recover waste metals which would otherwise be lost. This is very important as
physiological metal reduction occurs in a limited pH range (4.5-8.5) in contrast waste
metal solutions are commonly far more acidic which is incompatible with the cells
metabolism. By pre-metallising the cells under physiologically suitable conditions the cells
can then be killed leaving the metal seed sites over the cell surface to act as chemical
catalysts in more aggressive solutions.
Studies have shown that it is not currently possible to selectively reduce specific target
metals from solutions of waste metals; however studies by Creamer et al. have shown that
a selective process can be achieved however this would not be suitable for
commercialisation and industrial adoption due to the complexity of the process [61].
However despite the unavoidability of producing mixed metal catalysts studies by Mabbett
et al. [54] have shown that these mixed metals on bacterial cells have activity in reductive
processes. Studies by Yong also showed the ability of these cells to work within fuel cell
catalysts after recovery of wastes from PGM reprocessing wastes [53]. Following
pioneering work by Mabbett et al. [54] Murray et al. showed the ability of E.coli
metallised with recovered metals from PGM leachates from secondary sources to reduce
Cr(VI) within a Cr(VI) reaction [59], while Gauthier showed the effectiveness of Pd
recovered from industrial effluent within Suzuki-Miyaura coupling [62].
17
3. EXPERIMENTAL PROGRAMME : Development of Model Road Dusts
3.1. Methods & Materials: Model road dust materials
3.1.1. Model Road Dust
Many studies such as ones by Han [33] & Ho [34] have looked at road dusts; however
these studies were only interested in heavy metal deposits such as Pb and therefore did not
report data for the bulk material. The bulk make up of smaller road dust fractions pm 5
(particulate matter sub 5 microns) and pm 10 (particulate matter sub 10 microns) had
received more detailed investigation; studies by Amato [35] suggested that the largest
constituents of road dust were carbon (12%) and SiO2 (18%) with a large amount (8%) of
alumina also present. The rest of the bulk material was made up of over 30 different
elements in small percentages.
To create a model road dust system these materials were used to formulate the bulk
material make up as they are the only accurate data available on small fraction road dusts.
The alumina came from a model wash coat system which was created to mimic the
production of a car catalytic converter. As a result this mixture also contained cerium and
zirconium oxides which would be present in TWC’s and which would give some
interference with PGMs during analysis but a known amount so that they can be accounted
for. The method by which these alumina powders were created are detailed in the next
chapters.
The carbon used would be in the form of carbon black (carbon c22) which is an inorganic
mineral carbon and the quartz in the form of fine grain silica sand. The alumina was
initially in the form of boehmite (Condea pural sb) which was fired to 750°C to phase
18
change to high surface area γ alumina, the cerium and zirconium oxides were supplied by
Sigma Aldrich.
3.1.2. Substrate Preparation
The carbon and silica sand were used as supplied in powder form, the alumina, cerium and
zirconium were processed to form a model wash coat as would be produced during the
manufacture of TWC’s. This was done to give an accurate model for the metal
impregnated microstructure of TWC’s which are subsequently deposited into the road side
environment. Several systems were developed to investigate which would give the most
accurate model to mimic the particles found at the road side, and to produce the required
amount of model material for testing.
The systems investigated are detailed in the following chapters along with the
methodology for impregnation with platinum salt solutions. The initial concentration of Pt
added to the system was greater than that present within real road dusts to enable more
accurate chemical analysis to be achieved given the test methods available, before
reducing the amount of metal present close to that found in real world situations. 2 mM
solutions of Pt salts were used to give a final PGM content of 100 ppm (parts per million)
in the overall road dust sample.
3.1.3. Cordierite tubes
Three way catalytic converters (TWC’s) as found in motor vehicles are typically
constructed with a steel outer shell containing a ceramic honeycomb monolith through
which the exhaust gasses pass. Due to its high thermal stability, low production cost, high
thermal conductivity and low heat capacity cordierite (2MgO·2Al2O3·5SiO2) is commonly
employed as the ceramic monolith. Studies by Das [63] have shown that a cordierite
19
formulation comprising 39 wt% (weight percent) talc, 46 wt% kaolin clay and 15 wt%
calcined alumina combined with a binder system of 2 wt% methylcellulose and 30 wt%
de-ionised water performed well in the extrusion of honeycomb monoliths.
For the purposes of the initial testing within this report cordierite tubes were prepared
using this formulation along with two others to establish the most suitable for this
application. Using atomic weights of the constituent materials the mixture of kaolin clay
46 wt%, talc 43 wt% and alumina (Kumichel) 11 wt% was found. The final formulation
investigated was from a paper investigating the production of cordierite by Neto [64] and
suggested a mixture of kaolin clay 40 wt%, talc 44 wt% and alumina 16 wt%.
The binder system used with all three different mixtures was water 30 wt% and
methylcellulose 2 wt%, the wt% of the binder as a percentage of the total dry powders
within the mixture. This binder system was shown to lead to the best performing
extrusions, as the resultant extrudate had the least incident of defects and was the most
manageable material.
The cordierite substrate was prepared by dry mixing of constituent powders, to which 200
g of water was added to form a slurry. This mixture was then ball milled for 4 hours using
alumina ball media, dried in an oven at 100°C for around 24 hours then ground using a
pestle and mortar. The subsequent powder was passed through a sieve to reduce any
agglomerates formed during mixing. Methylcellulose binder was added to the powder, the
dry mixture was then loaded into a Werner Pfiler z-blade mixer and dry mixed for 10
minutes. 50 wt% of de-ionised water was then added in aliquots until all powders were
seen to bind together. This was then allowed to mix for 45 minutes until a homogenous
paste was formed.
20
The paste was loaded into a barrel then placed into an Instron 4467 load frame using a
round barrel with a 2.2 mm die, and extruded at a speed of 1mm/min to allow for any air to
be forced out of the system, and to reduce surface defects. The extruded rod was then cut
into 100 mm lengths and placed into a furnace at 100°C for one hour to dry before
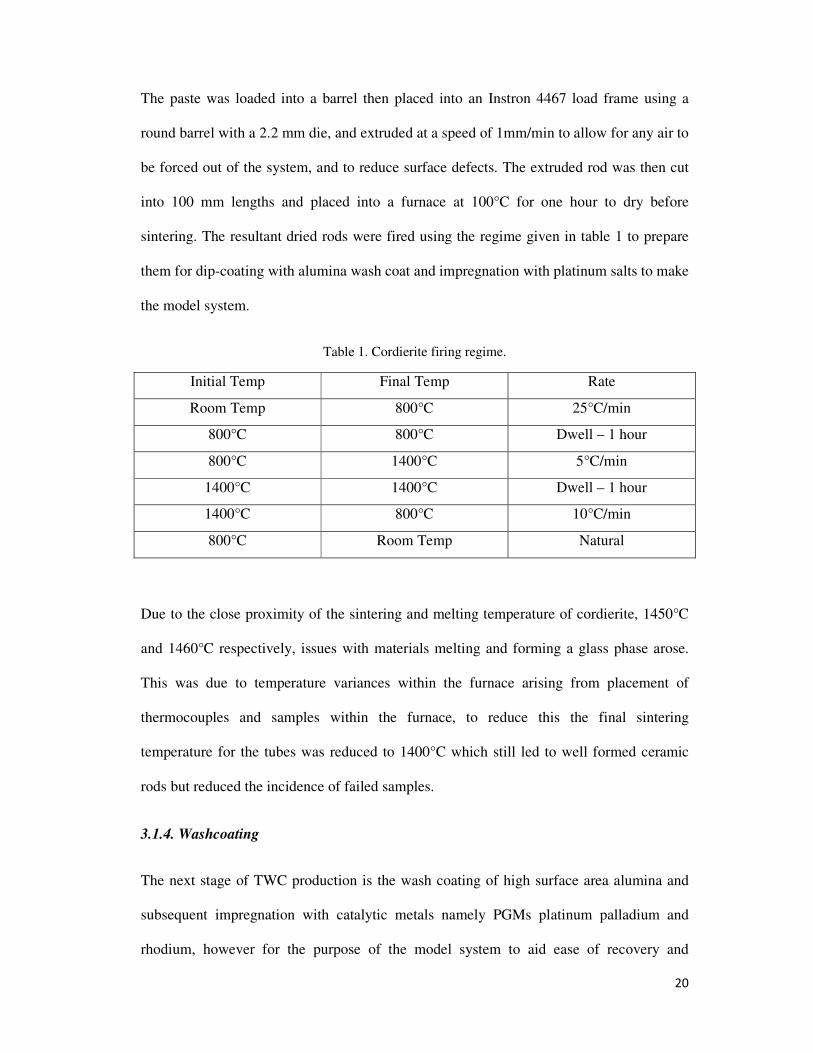
sintering. The resultant dried rods were fired using the regime given in table 1 to prepare
them for dip-coating with alumina wash coat and impregnation with platinum salts to make
the model system.
Table 1. Cordierite firing regime.
Initial Temp Final Temp Rate
Room Temp 800°C 25°C/min
800°C 800°C Dwell – 1 hour
800°C 1400°C 5°C/min
1400°C 1400°C Dwell – 1 hour
1400°C 800°C 10°C/min
800°C Room Temp Natural
Due to the close proximity of the sintering and melting temperature of cordierite, 1450°C
and 1460°C respectively, issues with materials melting and forming a glass phase arose.
This was due to temperature variances within the furnace arising from placement of
thermocouples and samples within the furnace, to reduce this the final sintering
temperature for the tubes was reduced to 1400°C which still led to well formed ceramic
rods but reduced the incidence of failed samples.
3.1.4. Washcoating
The next stage of TWC production is the wash coating of high surface area alumina and
subsequent impregnation with catalytic metals namely PGMs platinum palladium and
rhodium, however for the purpose of the model system to aid ease of recovery and
21
detection only one metal platinum was used as it is used in greater amounts during TWC
production. An extensive patent search was carried out to establish manufacturing
techniques and materials used were comparable within the model system to an actual
TWC.
Studies by Kaspar et al. [65] into automotive catalytic converter design gave details on
common wash coat materials used within manufacture, these being alumina as a high
surface area support, cerium CeO2 zirconium ZrO2 mixed oxides. PGMs platinum rhodium
and palladium were used to promote reactions within the converter. High surface area
gamma alumina Al2O3 can be derived from boehmite powder AlO(OH) when fired at 700
°C upwards and as such was used, XRD analysis of the resultant powders was used to
confirm the phase change to gamma alumina.
Patents submitted by Wan, Wei and Mussmann all suggest a PGM loading of between
0.001% and 10% but more typically between 0.05% and 5% [66][67][68]. Taking average
values for material contents the wash coat was prepared using the following method.
The alumina wash coat was prepared by adding a mixture of 70 wt% cerium oxide CeO2,
30 wt% zirconium oxide ZrO2 to boehmite AlO(OH) in the ratio of 5:11 mixed oxide to
boehmite by weight. This mixture was then added to de-ionised water at 160 g/L and the
pH adjusted using nitric acid to 3.0.
This wash coat suspension was then ball milled for 16 hours using alumina ball media to
reduce contamination from milling and to fully suspend the wash coat materials, the
process also aided particle size refinement of the alumina to increase surface area of the
wash coat. After milling the pH was again adjusted using nitric acid to 3.0. The wash coat
was then transferred to small test tubes and the cordierite tubes immersed and allowed to
22
uptake material for 2 minutes. The washcoated tubes were then ready for firing in
preparation for doping with Pt from solution.
3.1.5. Steel Sheet
An alternative to the cordierite substrate system was to use a steel substrate onto which the
wash coat material was adhered. The suitability of this system as an accurate model for
road dust materials was also investigated. The wash coat was prepared as described for the
cordierite substrate in section 3.1.4.
At this stage a sheet of austenitic steel was placed into a clean plastic dish; the wash coat
mixture was then poured over the steel sheet fully submerging it. This was left for 5
minutes to allow the wash coat to adhere to the steels surface, the sheet was removed from
the wash coat and placed into an oven at 30°C for 2 hours to remove any moisture. The
resultant steel sheet coated with wash coat material was then placed into a furnace and
fired with the firing regime detailed in table 2 in section 3.1.8.
After firing the wash coat was removed from the steel sheet surface using a plastic spatula
to reduce contamination from the steel sheet. The resultant powder was then exposed to a
Pt containing solution, the mixture was left for 2 hours to dry naturally and then placed
into an oven at 30°C to evaporate off any excess liquid prior to firing.
3.1.6. Milled Wash Coat
To reduce the chances of contamination due to metal pick up from the steel sheet system
and to allow for complete control of the amount of metal put into the system, the use of a
simple dried wash coat was investigated.
Firstly a wash coat mixture was prepared as previously but with a higher solids loading to
form a thicker mixture, adding a mixture of 70 wt% cerium oxide CeO2, 30 wt% zirconium
23
oxide ZrO2 to boehmite AlO(OH) in the ratio of 5:11 mixed oxide to boehmite by weight.
This mixture was then added to de-ionised water at 1.6 kg/L and the pH adjusted using
nitric acid to 3.0.
The wash coat was then ball milled within a plastic mill vessel to reduce milling
contamination for 16 hours using alumina media to fully mix the materials and to aid
particle size refinement of the alumina to increase surface area of the wash coat. With the
powders fully mixed the plastic container was then placed into an oven at 70°C for 8 hours
to fully remove any liquid from the system. The container was then placed back onto the
mill for 4 hours to break down the solid wash coat within, this lead to a rough milled
powder with a wide range of particle sizes.
The rough milled powder was then removed and placed into crucibles and fired using the
same firing regime as described in chapter. The resultant powder was then exposed to a Pt
containing solution, the mixture was left for 2 hours to dry naturally and then placed into a
30°C oven to evaporate off any excess liquid prior to firing.
3.1.7. Extruded Wash Coat
The extrusion of boehmite pastes is well documented and with the wash coat comprising a
majority of boehmite a final system of extruded wash coat was investigated. As previously
described this used a mixture of 70 wt% cerium oxide CeO2, 30wt% zirconium oxide ZrO2
to Boehmite AlO(OH) in the ratio of 5:11 mixed oxide to boehmite by weight. Two
different binder systems were examined to establish which produced the best performing
extrudable material.
Paste one comprised 49.9wt% solids, 5.0wt% methlycellulose binder, 0.7wt% glacial
acetic acid and 44.4wt% distilled water. Paste two comprised 65.5wt% solids, 1wt%
24
glacial acetic acid and 33.5wt% distilled water. The binding within this system was a result
of the peptisation of boehmite. Both pastes were mixed using the same methodology; first
the dry powders were added to a Kenwood food mixer and mixed for 10 minutes, then
80% of the water was added and the paste mixed for a further 10 minutes, after which the
glacial acetic acid was mixed into the remaining water and added to the paste; the paste
was mixed for a further 15 minutes until sufficiently stiff for extrusion.
To ensure full and proper mixing high shear loadings are required, this would generally be
carried out using a z-blade mixer as previously described for the preparation of cordierite,
however to reduce any extra contamination the paste was mixed using an Intsron 4467
load frame. The paste was loaded into the barrel and extruded at a rate of 5 mm/min-1
through a 2 mm die. This was repeated until all of the paste had been passed through the
die, the paste was then passed through the die a further two times to ensure full mixing.
With the paste fully mixed it was loaded again into the barrel to be extruded at a rate of 1
mm/min-1 and placed in drying racks. The paste was extruded at a lower speed for the final
extrudate as lower ram speeds lead to a decrease in surface defects and an overall
improvement of the surface of the extrudate. The extruded paste was then placed in the
drying racks in an oven at 30°C for 2 hours to dry fully. They were then fired using the
firing regime as detailed in table 2 in section 3.1.8. of this report.
3.1.8. Substrate firing regime
The prepared substrates were all fired using the same firing regime as described in table 2.
This was done to fire the boehmite to high surface area gamma alumina. The resultant
material was tested using XRD and BET analysis to verify the phase change and to
establish the surface area after firing.
25
Table 2. Wash coat firing regime.
Initial Temp Final Temp Rate
Room Temp 100°C 2°C/min
100°C 100°C Dwell (1 hour)
100°C 750°C 5°C/min
750°C 750°C Dwell (1 hour)
750°C Room Temp Natural
3.1.9. Pt doping of rods
Patents by Mussman [68] have suggested that PGMs should be present at 1.4 g/L
suspended in a nitric acid solution and that wash coated cordierite substrate should be
immersed for 2 minutes to allow for impregnation of PGM salts onto the surface. However
studies into the ability of gamma alumina to absorb Pt onto its surface suggested that a
longer time would be required. Samples of gamma alumina were exposed to solutions of Pt
containing the required amount of metal for the final road dust model, i.e 25 mg Pt to 25 g
of road dust giving a 100 ppm model loading. Platinum nitrate (VI) solution as supplied by
Johnson Matthey was initially used, however the solution reacted upon contact with the
alumina wash coat, forming cloudy orange complexes, illustrated as tube “B” in figure 8.
This unknown reaction meant that the amount of Pt absorbed onto the surface fo the tubes
could not be accurately measured. As this was unsuitable Na2PtCl6 salt in 0.01mM HNO3
pH2.0 was used which as illustrated as tube “A” in figure 8. did not react with the wash
coat, instead the Pt from solution was absorbed onto the surface as expected which was
observed by the liquid turning clear and the rod a pale red colour.
26
Fig.8. Rods in soution highlighting Pt complex issues.
The extruded wash coated rods were placed into plastic tubes containing the required
amount of Pt solution and the metal allowed to absorb onto the surface for 6 hours. After
this time a stannous chloride test was used to establish whether all metals had been
removed from solution. This was done by dissolving 29.9 g SnCl2 in 500 ml hydrochloric
acid, 200 µl of sample solution was then added to 800 µl SnCl2 solution in a cuvette and
left for one hour for a colour change to develop. This was then analysed in a
photospectrometer at 463 nm.
3.1.10. Pt firing regime
All substrates after doping with Pt were fired using the same regime as detailed in table 3.
The Pt impregnated substrates were placed in a reducing atmosphere tube furnace using
10% H2 90% N2 gas flowing at a rate of 55mm/min-1 for 1 hour at 600°C to reduce the Pt
salt to metallic Pt over the surface. SEM analysis was carried out on the final material to
compare and particle size and distribution to those that would be found within a road dust.
27
Table 3. Pt firing regime.
Initial Temp Final Temp Rate
Room Temp 600°C 5°C/min
600°C 600°C Dwell (1 hour)
600°C Room Temp Natural
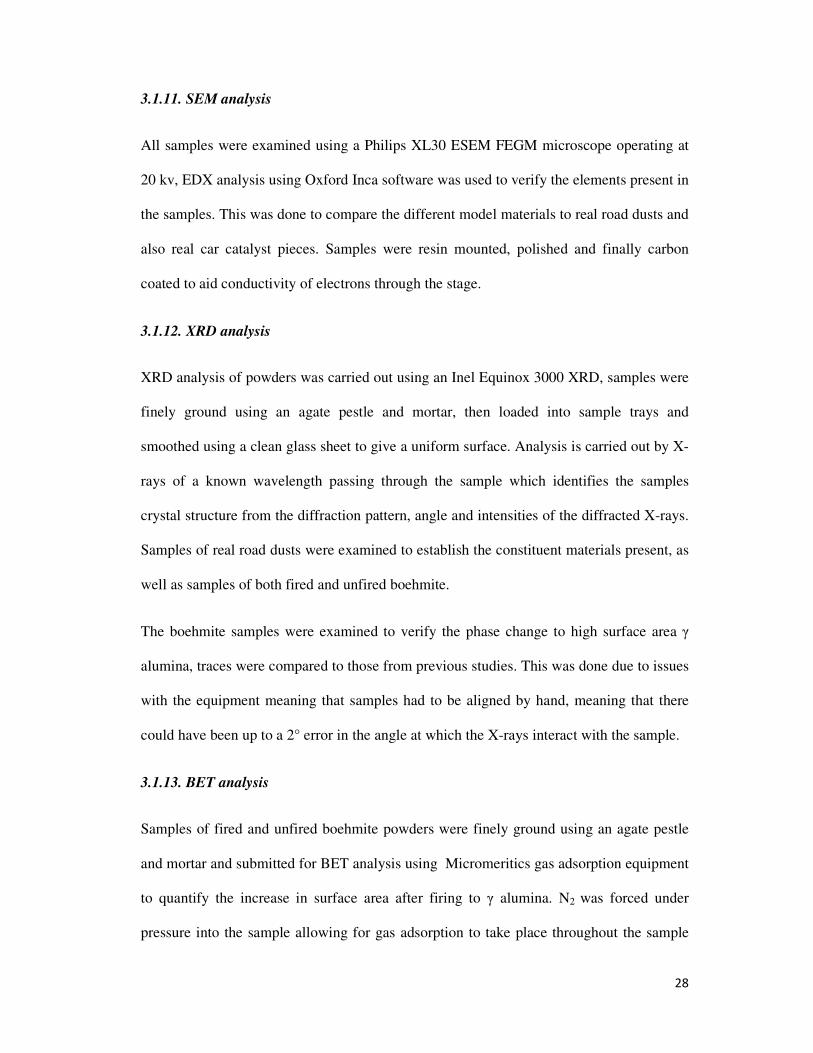
Figure 9 shows the difference in surface colour of the extruded wash coat rods. Rod “A” is
extruded and fired with no Pt on the surface, rod “B” is after absorption of Pt from solution
onto the surface and road “C” is after Pt absorption and subsequent firing and reduction.
Fig.9. Extruded wash coat tubes in various states.
After firing of all substrates, samples of each were resin mounted in preparation for SEM
imaging to look at the deposition of metal on the surface. For the cordierite rod substrate
the wash coated surface was then carefully removed from the cordierite substrate using a
plastic spatula to reduce any cordierite material being removed. This material was then
ground in an agate pestle and mortar to reduce contamination in preparation for mixing
with other powders to produce the final road dust. For all other substrates the material
produced was placed directly into an agate pestle and mortar and ground.
28
3.1.11. SEM analysis
All samples were examined using a Philips XL30 ESEM FEGM microscope operating at
20 kv, EDX analysis using Oxford Inca software was used to verify the elements present in
the samples. This was done to compare the different model materials to real road dusts and
also real car catalyst pieces. Samples were resin mounted, polished and finally carbon
coated to aid conductivity of electrons through the stage.
3.1.12. XRD analysis
XRD analysis of powders was carried out using an Inel Equinox 3000 XRD, samples were
finely ground using an agate pestle and mortar, then loaded into sample trays and
smoothed using a clean glass sheet to give a uniform surface. Analysis is carried out by X-
rays of a known wavelength passing through the sample which identifies the samples
crystal structure from the diffraction pattern, angle and intensities of the diffracted X-rays.
Samples of real road dusts were examined to establish the constituent materials present, as
well as samples of both fired and unfired boehmite.
The boehmite samples were examined to verify the phase change to high surface area γ
alumina, traces were compared to those from previous studies. This was done due to issues
with the equipment meaning that samples had to be aligned by hand, meaning that there
could have been up to a 2° error in the angle at which the X-rays interact with the sample.
3.1.13. BET analysis
Samples of fired and unfired boehmite powders were finely ground using an agate pestle
and mortar and submitted for BET analysis using Micromeritics gas adsorption equipment
to quantify the increase in surface area after firing to γ alumina. N2 was forced under
pressure into the sample allowing for gas adsorption to take place throughout the sample
29
leading to a film of adsorbate over the whole surface. The amount of adsorbate adhering to
the surface at varying pressure and at a constant temperature was recorded and lead to an
isotherm being derived.
The Langmuir model which relates the fractional surface coverage (θ) to the pressure over
the surface (P) with the Langmuir adsorption constant (α) in the equation;
However this only works for monolayer adsorption and gas adsorption leads to multiple
layers. For this reason the BET model was used instead of the Langmuir model as the BET
model takes into account the multi layer adsorption as it is an extension of the Langmuir
theory applied to many layers.
3.1.14. Model road dust powder mixing
To form the final model road dust samples for use within further testing all constituent
powders C, SiO2 and the varying model Pt impregnated wash coats 2:2:1 by weight were
added to clean glassware. They were then stirred thoroughly for around 5 minutes using a
spatula to achieve good and full mixing of the powders. Powders were then ground in an
agate pestle and mortar to prevent any contamination and to ensure they were well mixed;
care was taken to ensure that no material was lost. Samples of these model road dusts were
analysed using SEM analysis as described previously however using gold sputter coating
in place of carbon.
3.1.15. Road Dust Sampling
Six samples of road dust were collected from varying sites around the city of Birmingham,
all samples were collected on 23.03.11 after a two week period of dry weather. The sample
sites were selected due to the high traffic flows experienced at these sites, all samples were
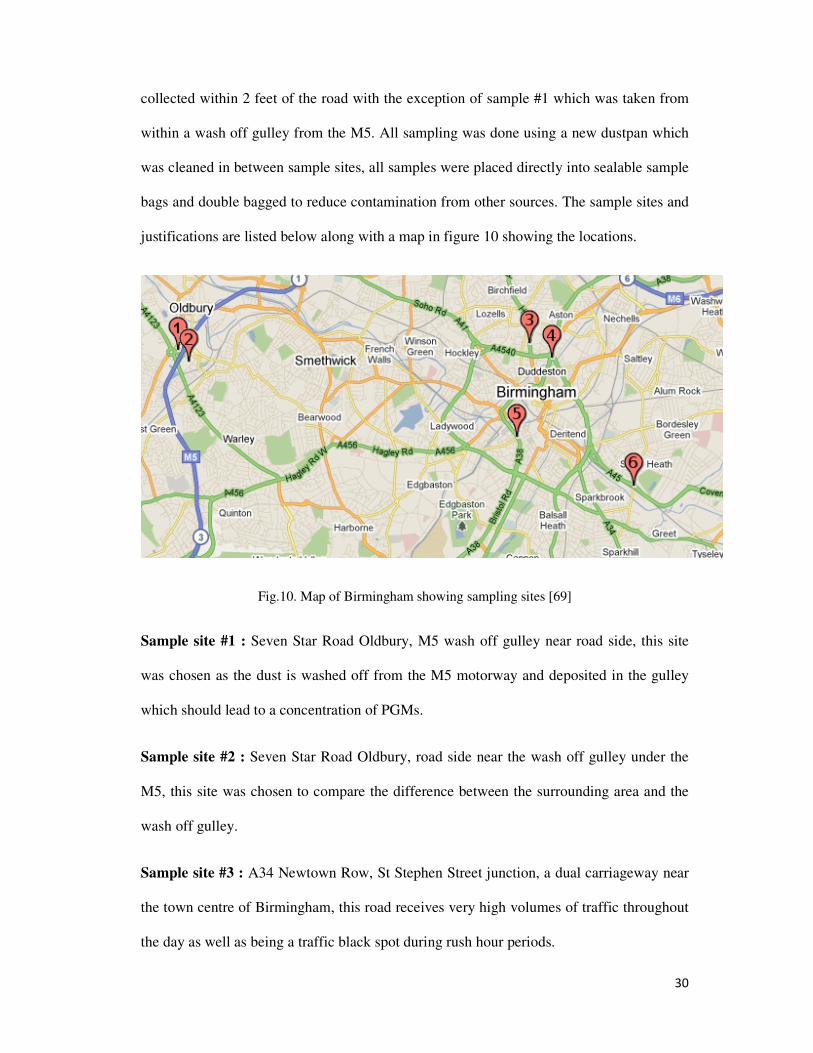
30
collected within 2 feet of the road with the exception of sample #1 which was taken from
within a wash off gulley from the M5. All sampling was done using a new dustpan which
was cleaned in between sample sites, all samples were placed directly into sealable sample
bags and double bagged to reduce contamination from other sources. The sample sites and
justifications are listed below along with a map in figure 10 showing the locations.
Fig.10. Map of Birmingham showing sampling sites [69]
Sample site #1 : Seven Star Road Oldbury, M5 wash off gulley near road side, this site
was chosen as the dust is washed off from the M5 motorway and deposited in the gulley
which should lead to a concentration of PGMs.
Sample site #2 : Seven Star Road Oldbury, road side near the wash off gulley under the
M5, this site was chosen to compare the difference between the surrounding area and the
wash off gulley.
Sample site #3 : A34 Newtown Row, St Stephen Street junction, a dual carriageway near
the town centre of Birmingham, this road receives very high volumes of traffic throughout
the day as well as being a traffic black spot during rush hour periods.
31
Sample site #4 : A38 Pumping Station Island, a large roundabout near the town centre of
Birmingham just off the M6 Spaghetti junction. This area receives very high volumes of
traffic throughout the day as well as being a traffic black spot during rush hour periods.
Sample site #5 : Suffolk Street Queensway, a tunnel underneath the city centre along the
A38 a busy dual carriageway. This road experiences very high traffic flows and again is a
traffic black spot during rush hour. It was also of interest as being contained within a
tunnel environmental factors should have less effect as wind and rain do not penetrate as
far as the sample site. This sample site should yield a high PGM content as they should be
deposited by the road side and not carried away by wind or other mechanisms.
Sample site #6 : Poet's corner island on A34 Small Heath Highway. This road was
designed as a relief road for the A34 Coventry road, as such it receives a large traffic flow
especially during rush hour periods. It is also situated locally to several industrial parks
and as such has a large traffic flow at all times.
3.2 Results & Discussions: Development of model road dust materials & TWC models
3.2.1. Model Road Dust
In order to initiate studies on biorecovery of leachates of simplified model road dusts with
reduced contaminants, various model systems were considered. The bulk materials to be
used were established by means of literature review. To introduce PGMs as might be
desposited into road dusts from vehicles several model TWC systems were investigated to
produce a model TWC which would then be broken up and mixed with the bulk powders
to form the final model road dust. The various systems to create a model road dust were
assessed firstly on the physical production of TWC model i.e. whether or not it was a
feasible system. Secondly SEM analysis was carried out to compare the model TWC
32
systems to a real car catalysts system, and then the resultant model road dust to that of a
real road dust.
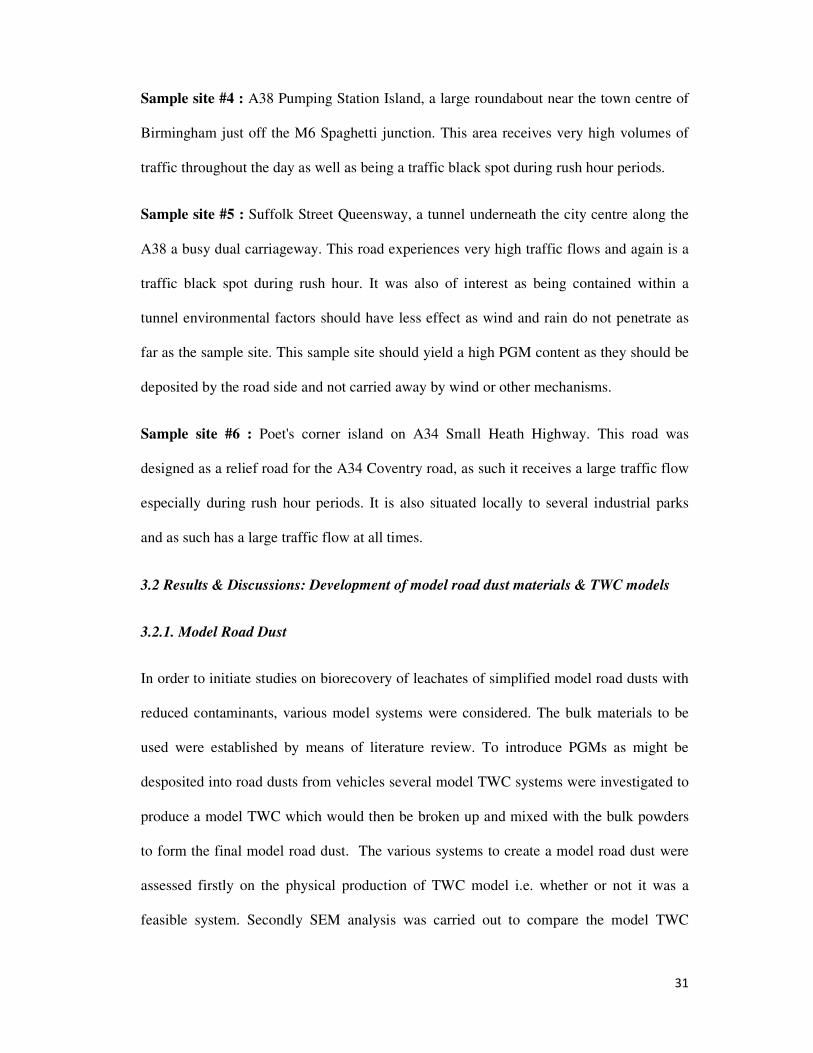
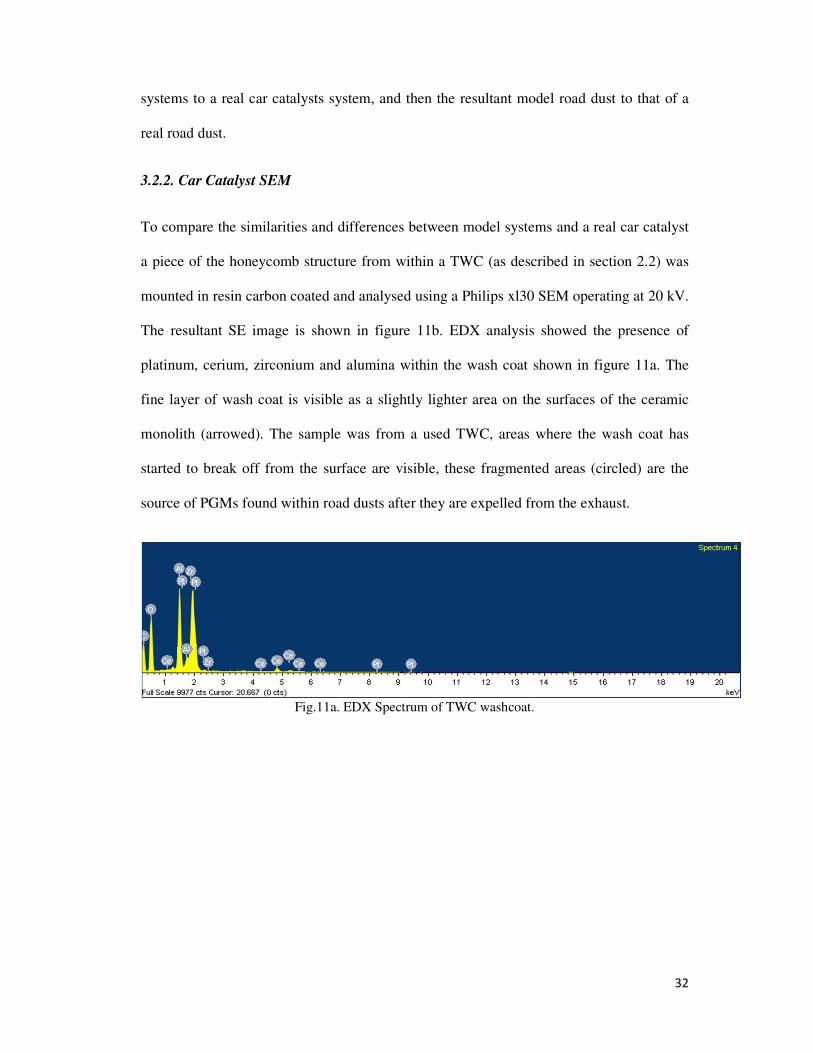
3.2.2. Car Catalyst SEM
To compare the similarities and differences between model systems and a real car catalyst
a piece of the honeycomb structure from within a TWC (as described in section 2.2) was
mounted in resin carbon coated and analysed using a Philips xl30 SEM operating at 20 kV.
The resultant SE image is shown in figure 11b. EDX analysis showed the presence of
platinum, cerium, zirconium and alumina within the wash coat shown in figure 11a. The
fine layer of wash coat is visible as a slightly lighter area on the surfaces of the ceramic
monolith (arrowed). The sample was from a used TWC, areas where the wash coat has
started to break off from the surface are visible, these fragmented areas (circled) are the
source of PGMs found within road dusts after they are expelled from the exhaust.
Fig.11a. EDX Spectrum of TWC washcoat.
33
Fig.11b.SEM image of car catalyst
3.2.3. Cordierite substrate
SEM analysis was carried out to investigate the cordierite tubes as described in section
3.1.3. as previously the samples were mounted in resin then carbon coated, a Philips xl30
SEM was used operating at 20 kv. EDX analysis was used to verify elements present
across areas of the surface. The SEM images in figures 12-14 show the cordierite substrate
tubes before and after wash coating and platinum impregnation.

34
Fig.12. SEM image of uncoated cordierite rod.
Figure 12. shows the SEM image of an uncoated cordierite rod showing well distributed
evenly sized pores throughout the cordierite substrate, with a good mixture of constituent
materials and firing leading to the formation of cordierite. There were also very few firing
defects throughout the rods which would appear as cracks within the rods suggesting the
firing regime was well suited to the formulation. Another indication of a good firing
regime leading to the formation of cordierite is that the sintering of constituent materials to
form cordierite results in almost zero shrinkage, all samples using this firing regime
showed no shrinkage, this was assessed by measuring the rods before and after firing using
a digital micrometer.
35
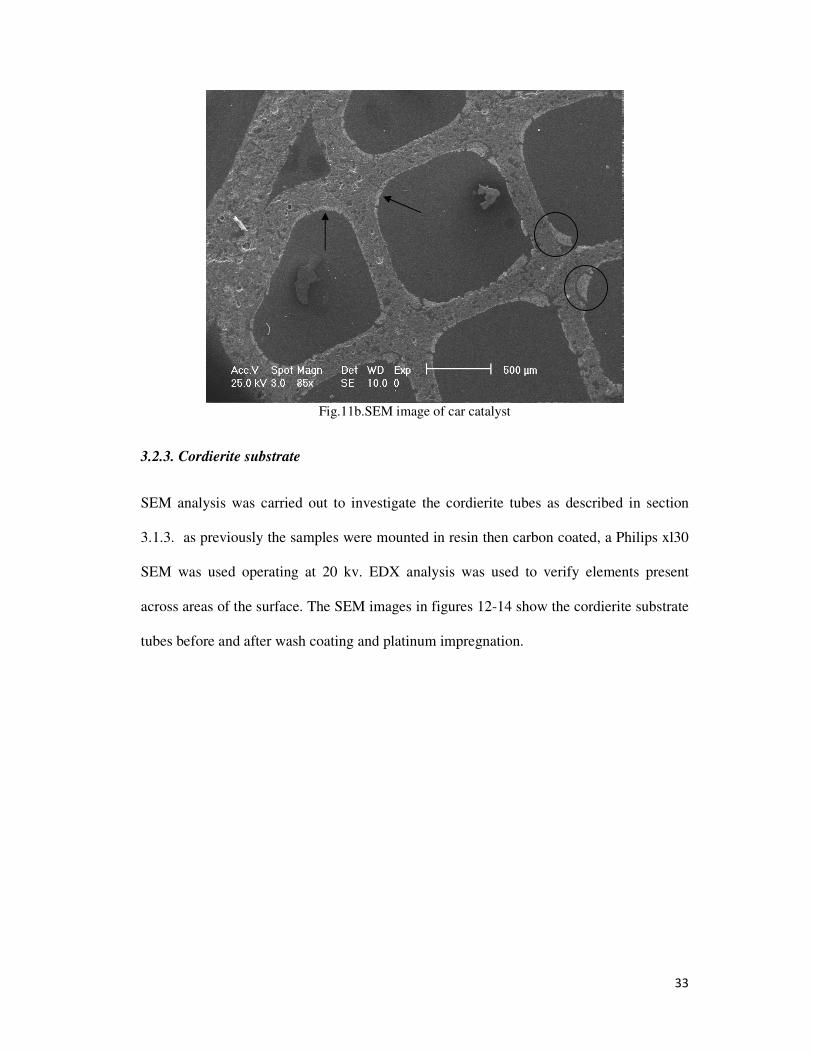
Fig.13. SEM image of alumina wash coated cordierite rod.
Figure 13. shows the alumina wash coat on the surface of the cordierite with an
approximate thickness of 10 µm (arrowed in the image) with the wash coat appearing to be
evenly distributed over the surface. When compared to the edge of the rod in figure 12 the
roughness of the gamma alumina wash coat is apparent when compared to the cordierite
surface, this shows the improved surface area required within TWCs for PGMs to adhere
to.
36
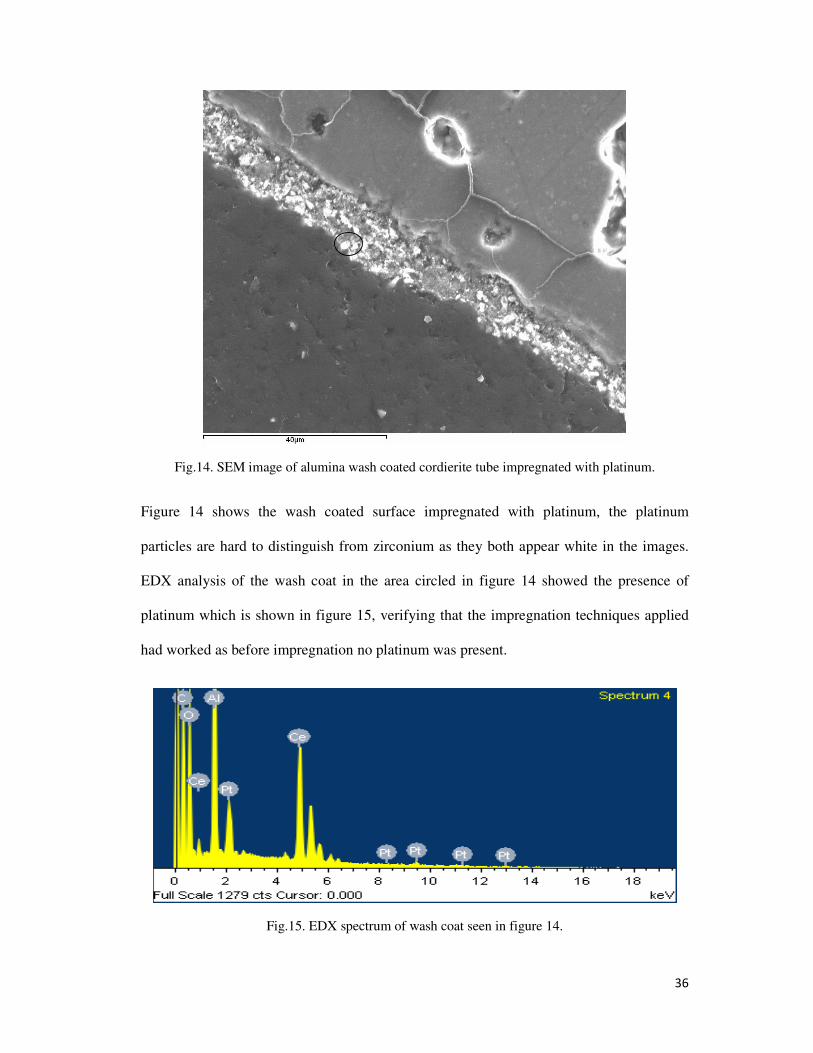
Fig.14. SEM image of alumina wash coated cordierite tube impregnated with platinum.
Figure 14 shows the wash coated surface impregnated with platinum, the platinum
particles are hard to distinguish from zirconium as they both appear white in the images.
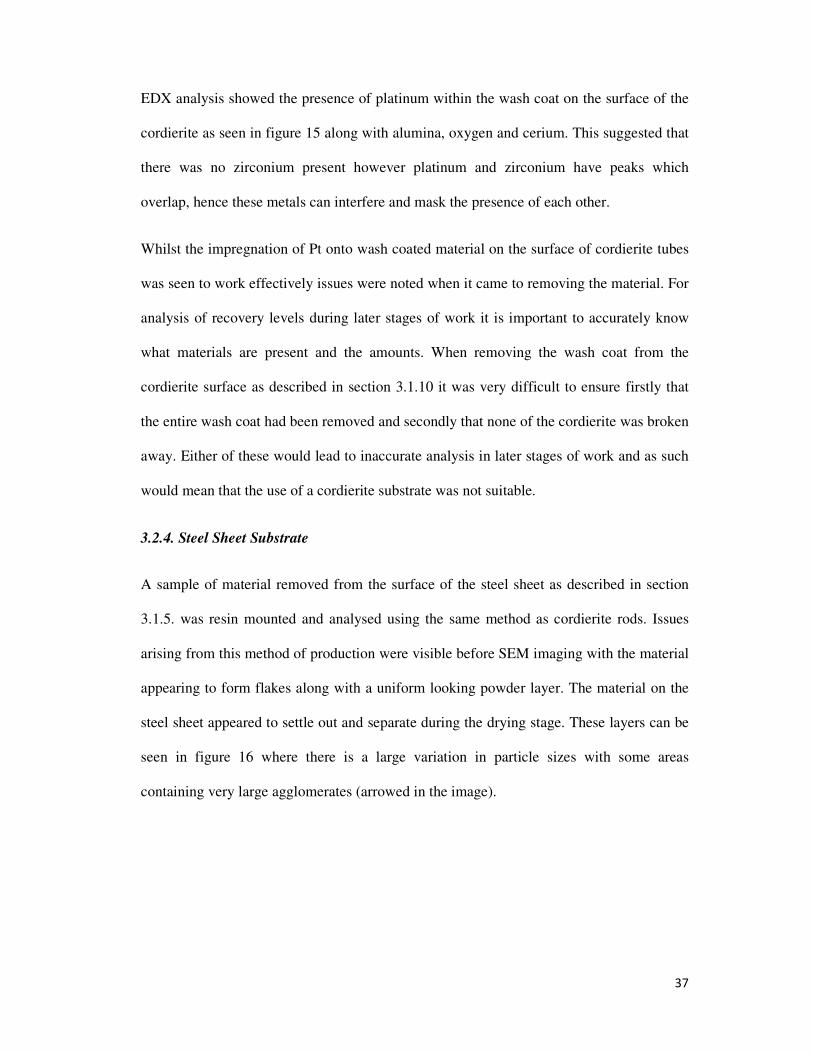
EDX analysis of the wash coat in the area circled in figure 14 showed the presence of
platinum which is shown in figure 15, verifying that the impregnation techniques applied
had worked as before impregnation no platinum was present.
Fig.15. EDX spectrum of wash coat seen in figure 14.
37
EDX analysis showed the presence of platinum within the wash coat on the surface of the
cordierite as seen in figure 15 along with alumina, oxygen and cerium. This suggested that
there was no zirconium present however platinum and zirconium have peaks which
overlap, hence these metals can interfere and mask the presence of each other.
Whilst the impregnation of Pt onto wash coated material on the surface of cordierite tubes
was seen to work effectively issues were noted when it came to removing the material. For
analysis of recovery levels during later stages of work it is important to accurately know
what materials are present and the amounts. When removing the wash coat from the
cordierite surface as described in section 3.1.10 it was very difficult to ensure firstly that
the entire wash coat had been removed and secondly that none of the cordierite was broken
away. Either of these would lead to inaccurate analysis in later stages of work and as such
would mean that the use of a cordierite substrate was not suitable.
3.2.4. Steel Sheet Substrate
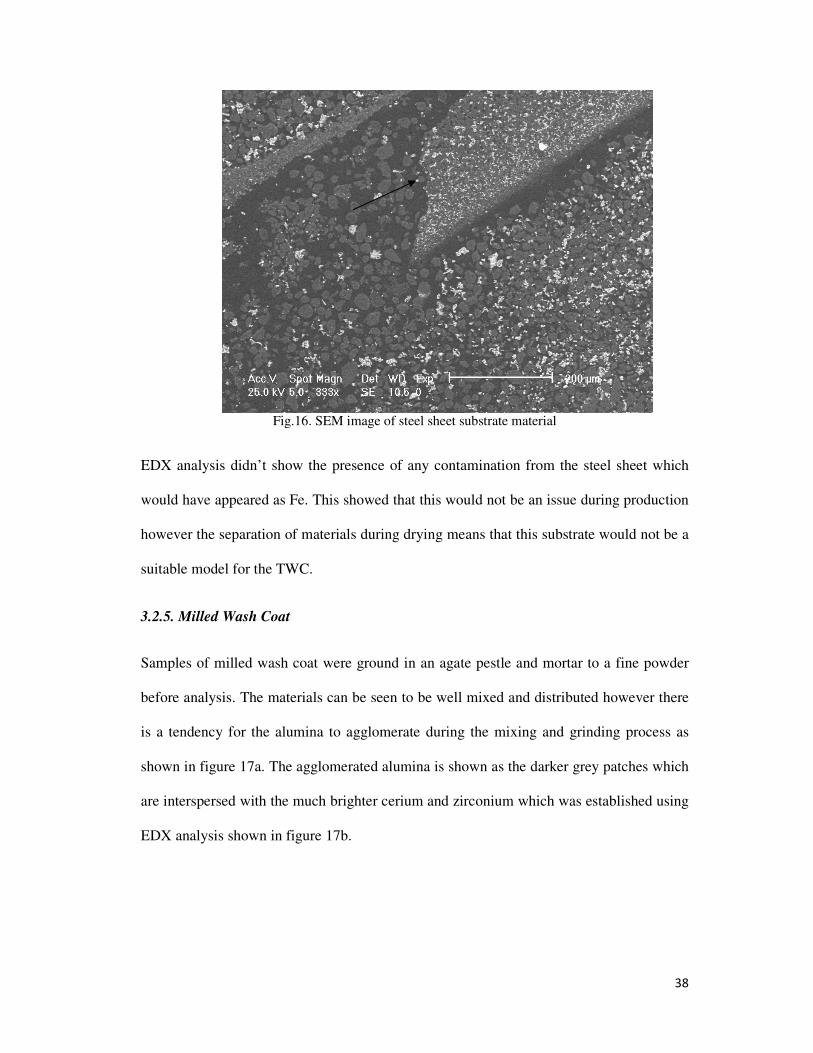
A sample of material removed from the surface of the steel sheet as described in section
3.1.5. was resin mounted and analysed using the same method as cordierite rods. Issues
arising from this method of production were visible before SEM imaging with the material
appearing to form flakes along with a uniform looking powder layer. The material on the
steel sheet appeared to settle out and separate during the drying stage. These layers can be
seen in figure 16 where there is a large variation in particle sizes with some areas
containing very large agglomerates (arrowed in the image).
38
Fig.16. SEM image of steel sheet substrate material
EDX analysis didn’t show the presence of any contamination from the steel sheet which
would have appeared as Fe. This showed that this would not be an issue during production
however the separation of materials during drying means that this substrate would not be a
suitable model for the TWC.
3.2.5. Milled Wash Coat
Samples of milled wash coat were ground in an agate pestle and mortar to a fine powder
before analysis. The materials can be seen to be well mixed and distributed however there
is a tendency for the alumina to agglomerate during the mixing and grinding process as
shown in figure 17a. The agglomerated alumina is shown as the darker grey patches which
are interspersed with the much brighter cerium and zirconium which was established using
EDX analysis shown in figure 17b.
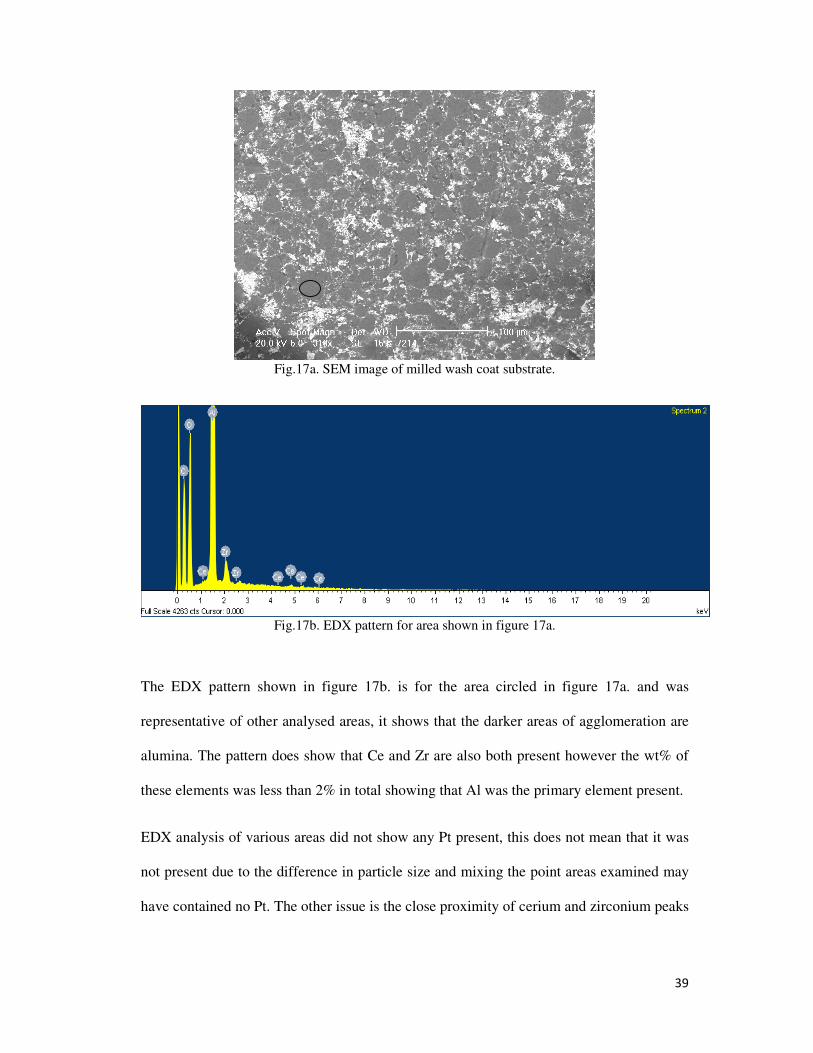
39
Fig.17a. SEM image of milled wash coat substrate.
Fig.17b. EDX pattern for area shown in figure 17a.
The EDX pattern shown in figure 17b. is for the area circled in figure 17a. and was
representative of other analysed areas, it shows that the darker areas of agglomeration are
alumina. The pattern does show that Ce and Zr are also both present however the wt% of
these elements was less than 2% in total showing that Al was the primary element present.
EDX analysis of various areas did not show any Pt present, this does not mean that it was
not present due to the difference in particle size and mixing the point areas examined may
have contained no Pt. The other issue is the close proximity of cerium and zirconium peaks
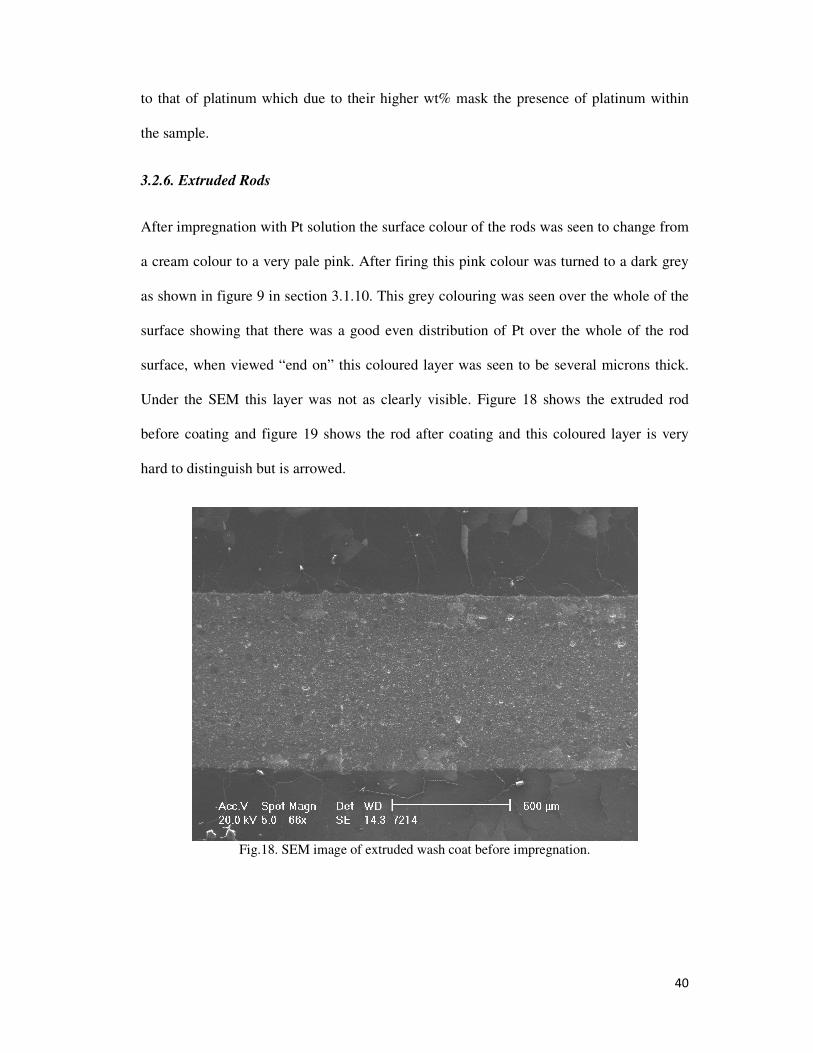
40
to that of platinum which due to their higher wt% mask the presence of platinum within
the sample.
3.2.6. Extruded Rods
After impregnation with Pt solution the surface colour of the rods was seen to change from
a cream colour to a very pale pink. After firing this pink colour was turned to a dark grey
as shown in figure 9 in section 3.1.10. This grey colouring was seen over the whole of the
surface showing that there was a good even distribution of Pt over the whole of the rod
surface, when viewed “end on” this coloured layer was seen to be several microns thick.
Under the SEM this layer was not as clearly visible. Figure 18 shows the extruded rod
before coating and figure 19 shows the rod after coating and this coloured layer is very
hard to distinguish but is arrowed.
Fig.18. SEM image of extruded wash coat before impregnation.
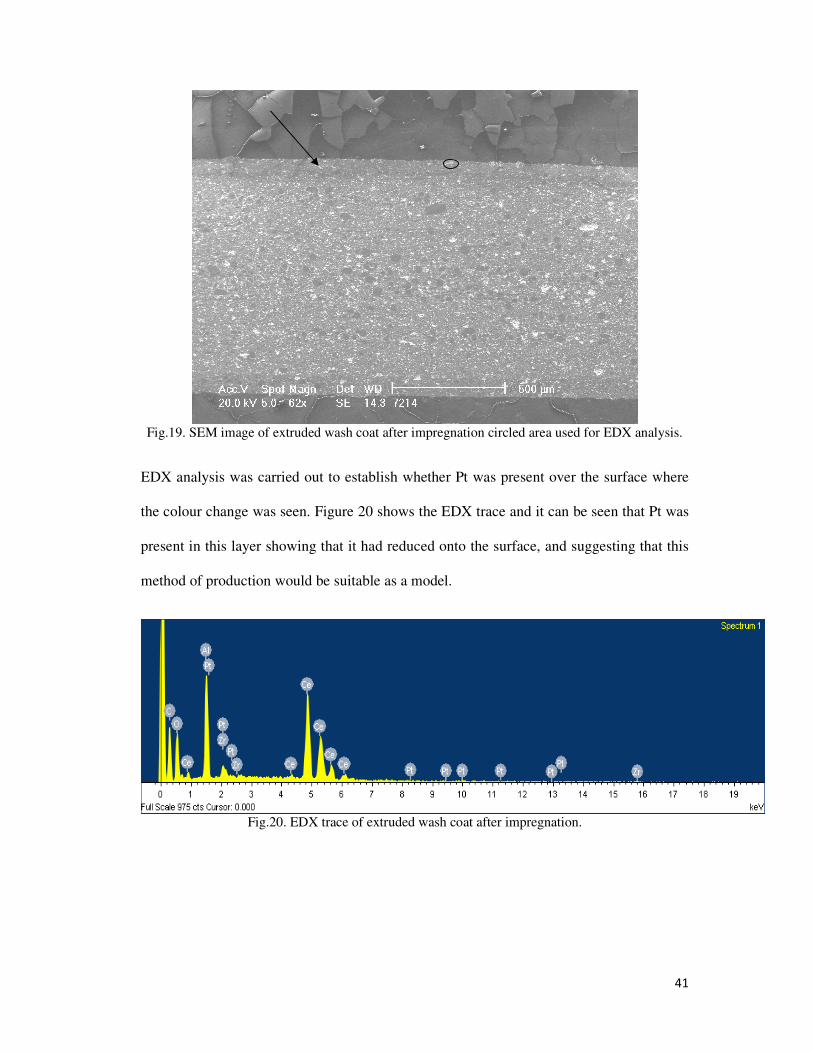
41
Fig.19. SEM image of extruded wash coat after impregnation circled area used for EDX analysis.
EDX analysis was carried out to establish whether Pt was present over the surface where
the colour change was seen. Figure 20 shows the EDX trace and it can be seen that Pt was
present in this layer showing that it had reduced onto the surface, and suggesting that this
method of production would be suitable as a model.
Fig.20. EDX trace of extruded wash coat after impregnation.
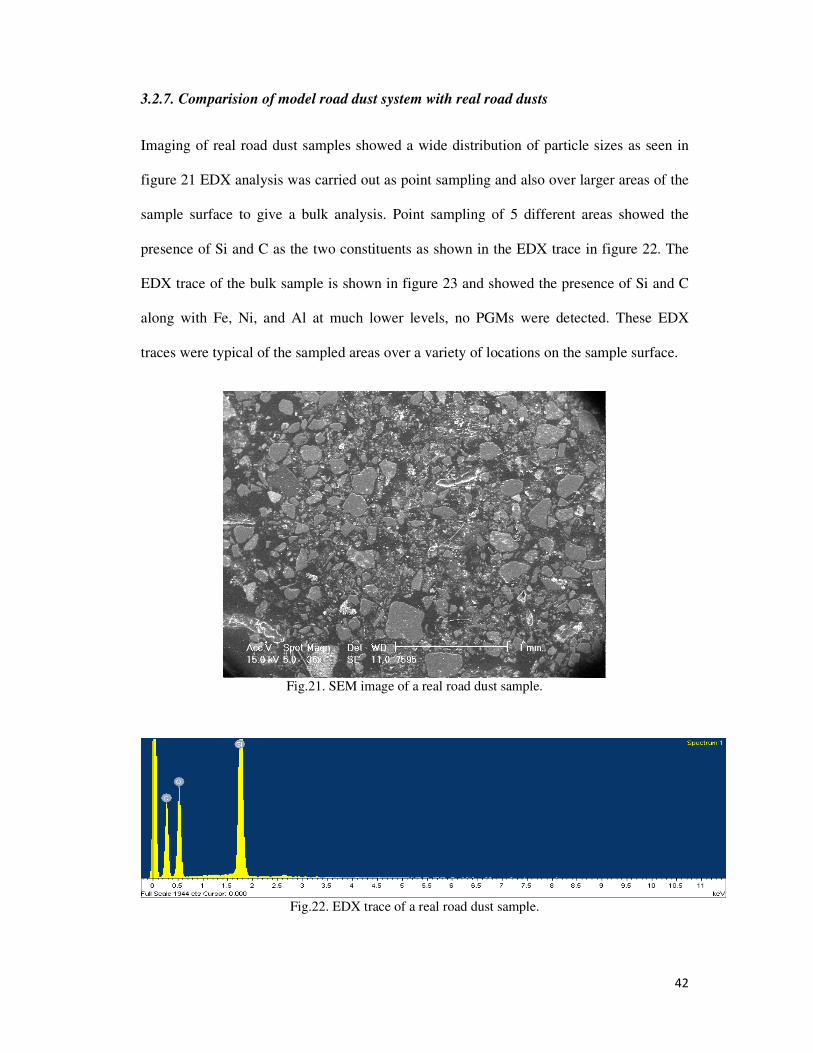
42
3.2.7. Comparision of model road dust system with real road dusts
Imaging of real road dust samples showed a wide distribution of particle sizes as seen in
figure 21 EDX analysis was carried out as point sampling and also over larger areas of the
sample surface to give a bulk analysis. Point sampling of 5 different areas showed the
presence of Si and C as the two constituents as shown in the EDX trace in figure 22. The
EDX trace of the bulk sample is shown in figure 23 and showed the presence of Si and C
along with Fe, Ni, and Al at much lower levels, no PGMs were detected. These EDX
traces were typical of the sampled areas over a variety of locations on the sample surface.
Fig.21. SEM image of a real road dust sample.
Fig.22. EDX trace of a real road dust sample.
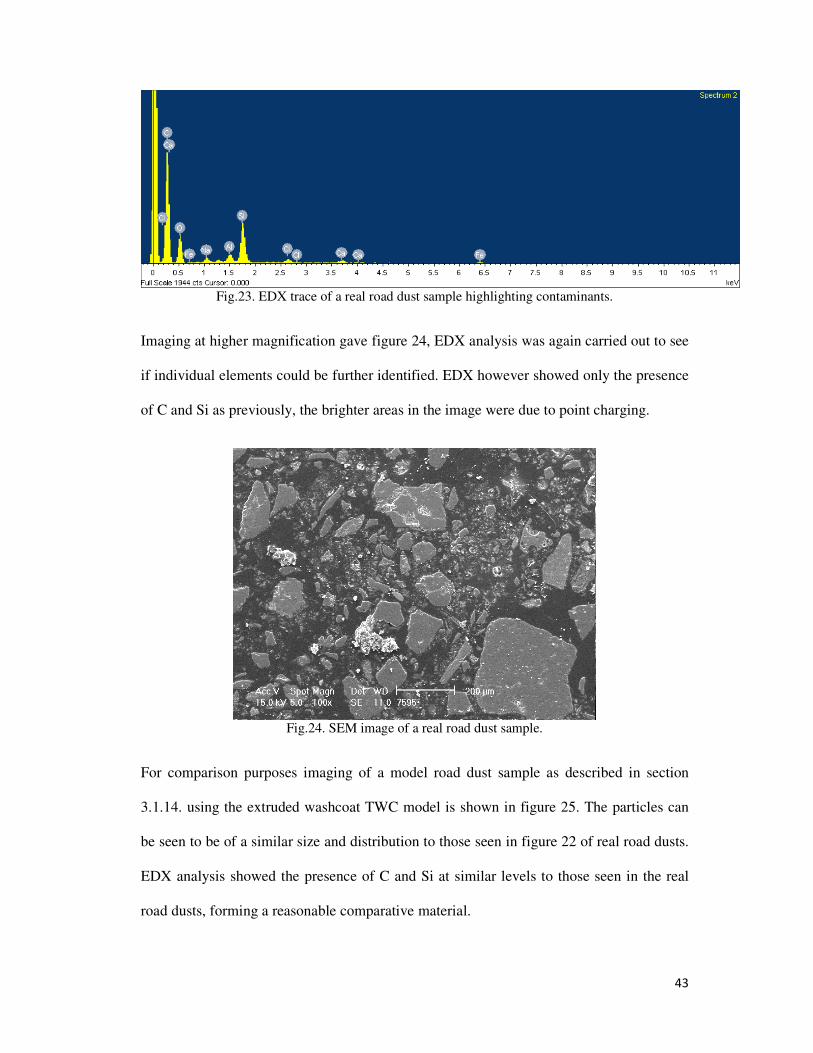
43
Fig.23. EDX trace of a real road dust sample highlighting contaminants.
Imaging at higher magnification gave figure 24, EDX analysis was again carried out to see
if individual elements could be further identified. EDX however showed only the presence
of C and Si as previously, the brighter areas in the image were due to point charging.
Fig.24. SEM image of a real road dust sample.
For comparison purposes imaging of a model road dust sample as described in section
3.1.14. using the extruded washcoat TWC model is shown in figure 25. The particles can
be seen to be of a similar size and distribution to those seen in figure 22 of real road dusts.
EDX analysis showed the presence of C and Si at similar levels to those seen in the real
road dusts, forming a reasonable comparative material.

44
Fig.25. SEM image of a model road dust sample.
Fig.26. EDX trace of a model road dust sample.
Both imaging and EDX analysis highlighted similarities between both real and model road
dusts; suggesting that the model road dust system was a suitably accurate model for that of
a real road dust. The model road dust was formulated to be a very simplified system when
compared to a real road dust i.e. the main constituents were matched but the trace materials
not. The model system appears to meet this requirement. Due to the method of production
extra “contaminants” could easily be added during the mixing process to add complexity to
the materials matrix should that be required during further studies. No PGMs were seen to
be present within either the real or model road dusts, this is due to the highly dispersed
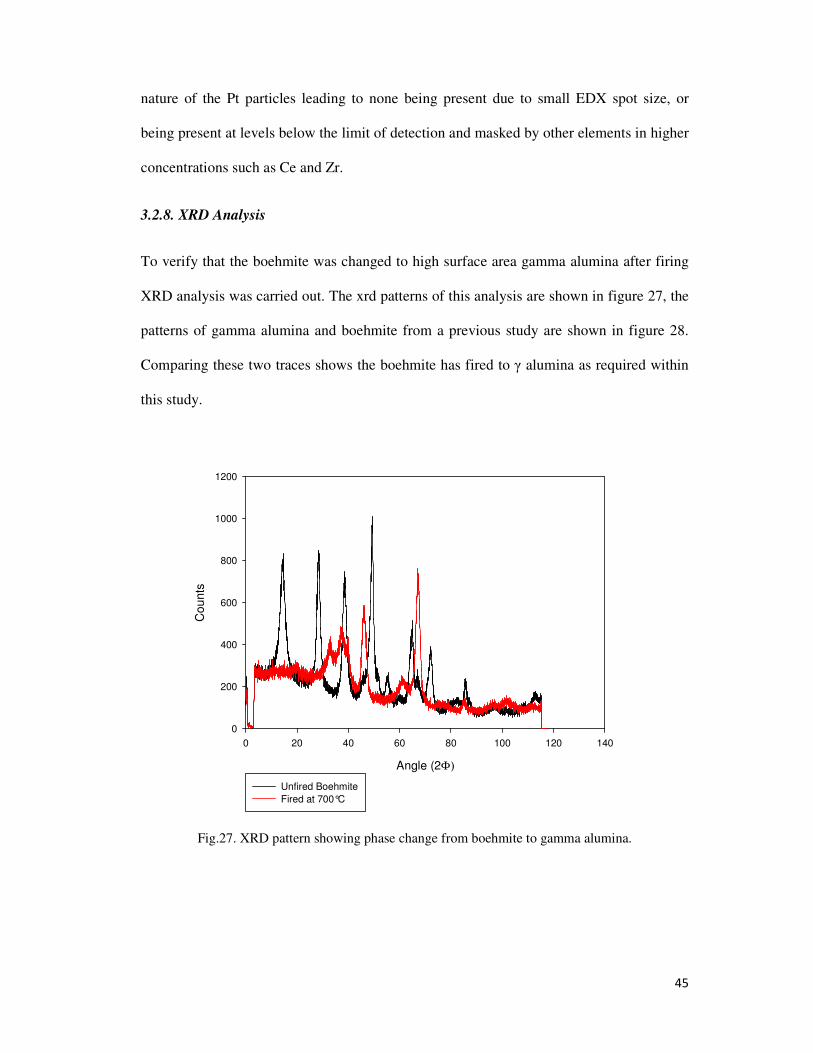
45
nature of the Pt particles leading to none being present due to small EDX spot size, or
being present at levels below the limit of detection and masked by other elements in higher
concentrations such as Ce and Zr.
3.2.8. XRD Analysis
To verify that the boehmite was changed to high surface area gamma alumina after firing
XRD analysis was carried out. The xrd patterns of this analysis are shown in figure 27, the
patterns of gamma alumina and boehmite from a previous study are shown in figure 28.
Comparing these two traces shows the boehmite has fired to γ alumina as required within
this study.
Angle (2Φ)
0 20 40 60 80 100 120 140
Co
un
ts
0
200
400
600
800
1000
1200
Unfired Boehmite
Fired at 700°C
Fig.27. XRD pattern showing phase change from boehmite to gamma alumina.
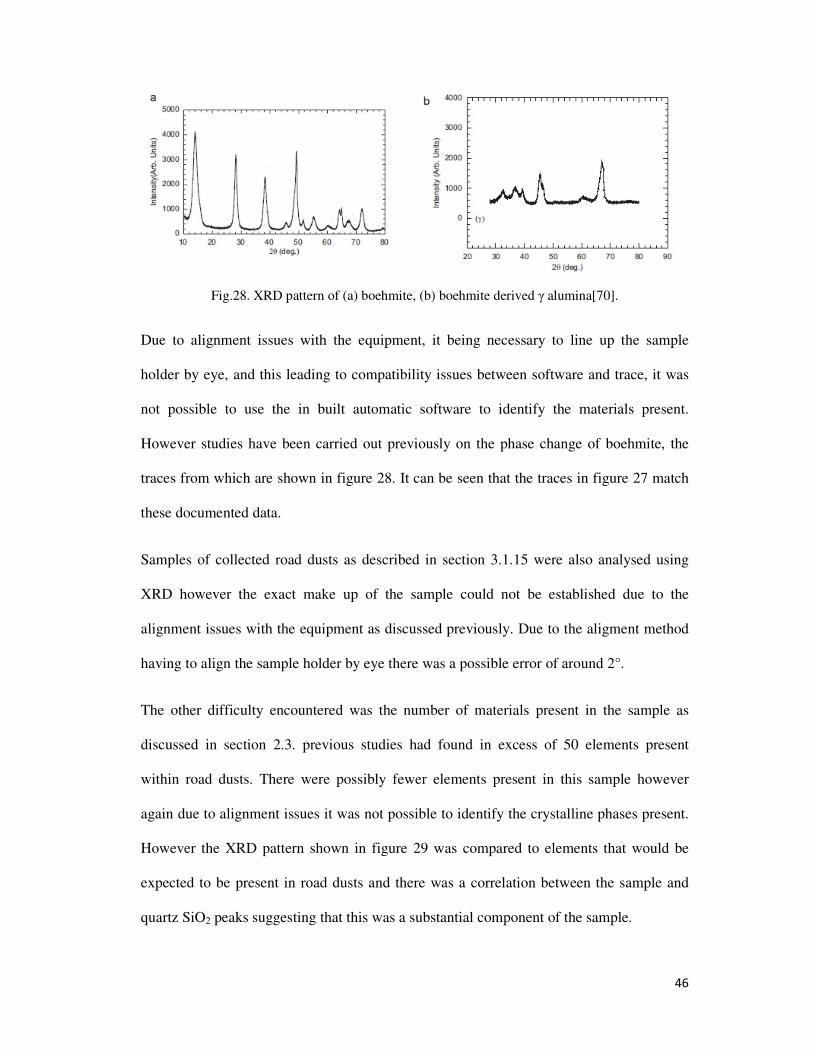
46
Fig.28. XRD pattern of (a) boehmite, (b) boehmite derived γ alumina[70].
Due to alignment issues with the equipment, it being necessary to line up the sample
holder by eye, and this leading to compatibility issues between software and trace, it was
not possible to use the in built automatic software to identify the materials present.
However studies have been carried out previously on the phase change of boehmite, the
traces from which are shown in figure 28. It can be seen that the traces in figure 27 match
these documented data.
Samples of collected road dusts as described in section 3.1.15 were also analysed using
XRD however the exact make up of the sample could not be established due to the
alignment issues with the equipment as discussed previously. Due to the aligment method
having to align the sample holder by eye there was a possible error of around 2°.
The other difficulty encountered was the number of materials present in the sample as
discussed in section 2.3. previous studies had found in excess of 50 elements present
within road dusts. There were possibly fewer elements present in this sample however
again due to alignment issues it was not possible to identify the crystalline phases present.
However the XRD pattern shown in figure 29 was compared to elements that would be
expected to be present in road dusts and there was a correlation between the sample and
quartz SiO2 peaks suggesting that this was a substantial component of the sample.
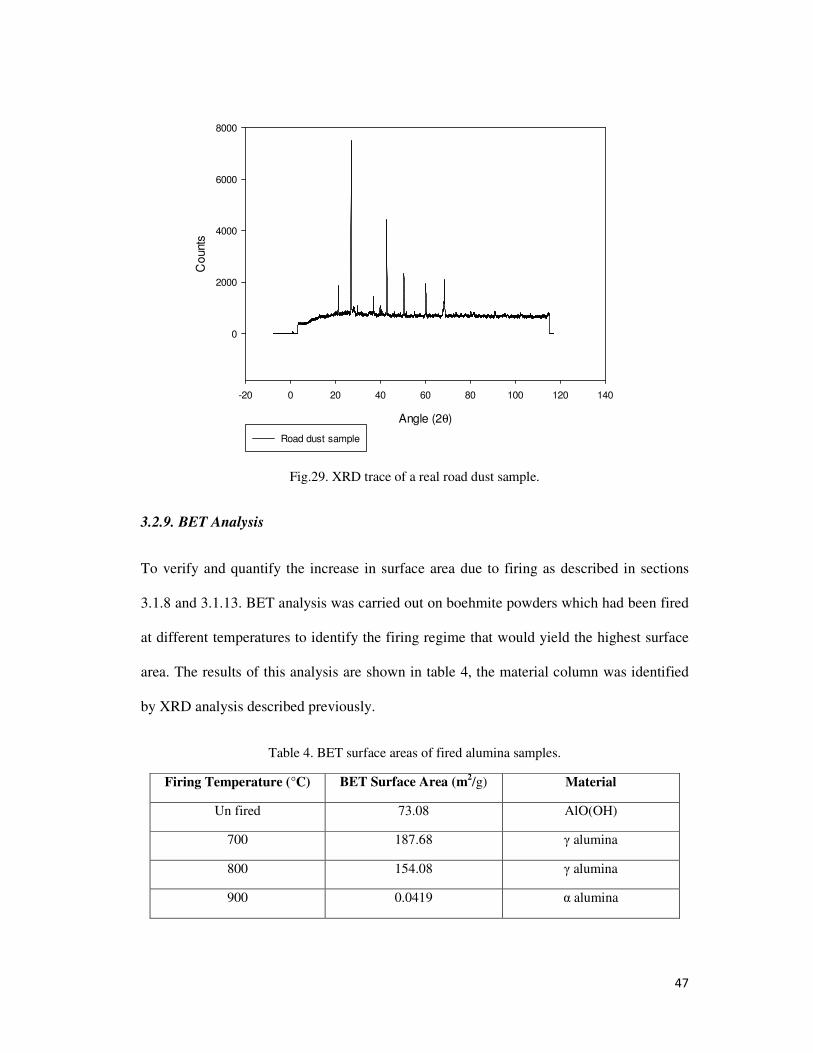
47
Angle (2θ)
-20 0 20 40 60 80 100 120 140
Co
unts
0
2000
4000
6000
8000
Road dust sample
Fig.29. XRD trace of a real road dust sample.
3.2.9. BET Analysis
To verify and quantify the increase in surface area due to firing as described in sections
3.1.8 and 3.1.13. BET analysis was carried out on boehmite powders which had been fired
at different temperatures to identify the firing regime that would yield the highest surface
area. The results of this analysis are shown in table 4, the material column was identified
by XRD analysis described previously.
Table 4. BET surface areas of fired alumina samples.
Firing Temperature (°C) BET Surface Area (m2/g) Material
Un fired 73.08 AlO(OH)
700 187.68 γ alumina
800 154.08 γ alumina
900 0.0419 α alumina
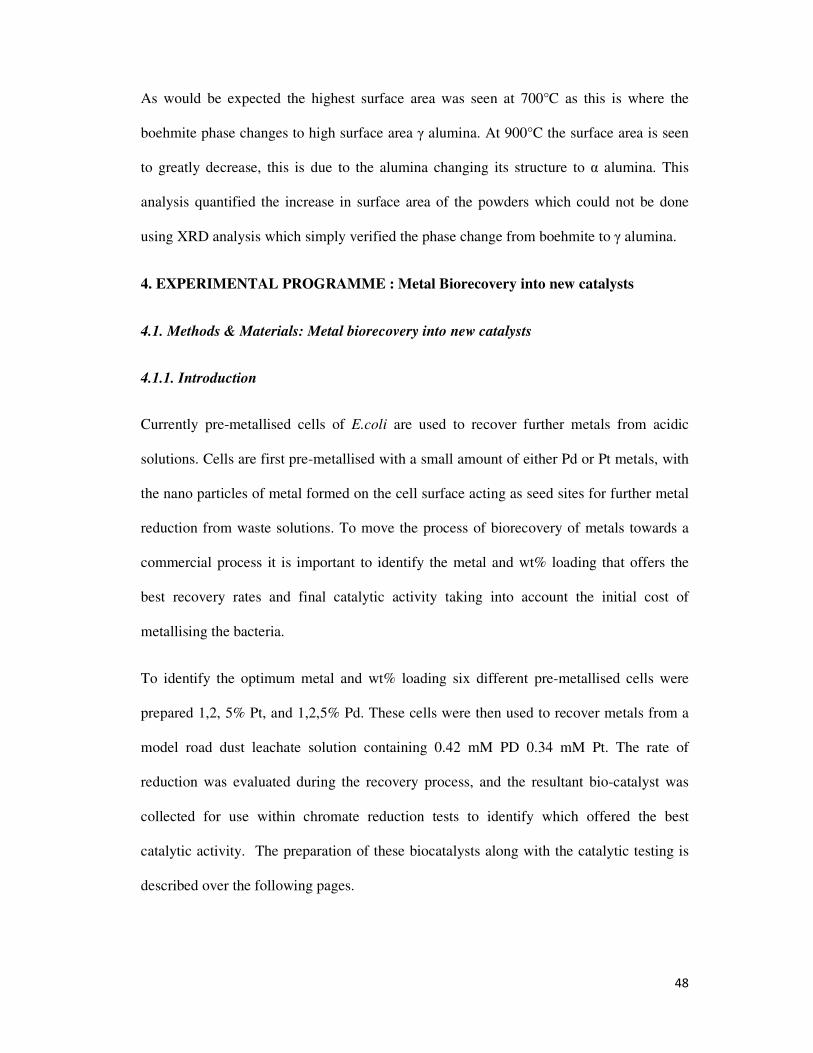
48
As would be expected the highest surface area was seen at 700°C as this is where the
boehmite phase changes to high surface area γ alumina. At 900°C the surface area is seen
to greatly decrease, this is due to the alumina changing its structure to α alumina. This
analysis quantified the increase in surface area of the powders which could not be done
using XRD analysis which simply verified the phase change from boehmite to γ alumina.
4. EXPERIMENTAL PROGRAMME : Metal Biorecovery into new catalysts
4.1. Methods & Materials: Metal biorecovery into new catalysts
4.1.1. Introduction
Currently pre-metallised cells of E.coli are used to recover further metals from acidic
solutions. Cells are first pre-metallised with a small amount of either Pd or Pt metals, with
the nano particles of metal formed on the cell surface acting as seed sites for further metal
reduction from waste solutions. To move the process of biorecovery of metals towards a
commercial process it is important to identify the metal and wt% loading that offers the
best recovery rates and final catalytic activity taking into account the initial cost of
metallising the bacteria.
To identify the optimum metal and wt% loading six different pre-metallised cells were
prepared 1,2, 5% Pt, and 1,2,5% Pd. These cells were then used to recover metals from a
model road dust leachate solution containing 0.42 mM PD 0.34 mM Pt. The rate of
reduction was evaluated during the recovery process, and the resultant bio-catalyst was
collected for use within chromate reduction tests to identify which offered the best
catalytic activity. The preparation of these biocatalysts along with the catalytic testing is
described over the following pages.
49
4.1.2. Petri Dish Agar Plate Preparation
Agar plates for cell culturing were prepared by adding 14 g Nutrient Agar (Sigma Aldrich)
to 500 ml of distilled water in a 500 ml bottle, the mixture was heated (approx 60°C) and
mixed using a magnetic stirrer until the powder was fully dissolved. The bottle was then
sealed (with the lid loosely fitting) and placed into an autoclave, which was allowed to
reach 120°C and left for 15 minutes, the autoclave was then switched off and partially
opened to slowly release the pressure. The bottle was allowed to cool inside the autoclave
to around 50°C at which point it was removed and the contents dispersed into Petri dishes.
A Bunsen burner was lit and all work carried out near to the flame to help keep the area
sterile, the 500 ml bottles contents were distributed evenly between 25 petri dishes. The
dishes were swirled to distribute the contents then closed with their lids and allowed to set
on the bench top for approx 2 hours. After 2 hours the dishes were inverted so that any
condensation collected in the lid and placed into a fridge ready for use.
4.1.3. E.coli Plate Preparation
Glycerol stock of E.coli culture MC4100 was taken from a -80°C freezer, a Bunsen burner
was lit and all work was carried out near to the flame to keep the area sterile. A 200 µl
adjustable pipette with sterile tips was used to take 50 µl from glycerol stock and transfer it
into a glass universal tube with plastic lid containing nutrient broth no.2. The tube was
sealed by passing the neck and lid through the Bunsen flame and then placed in a 37°C
shaking incubator overnight. This process was then repeated with 1ml of the grown culture
being taken from the universal tube and transferred to a fresh universal tube which was
then placed in a 37°C shaking incubator overnight. This was done to “re-activate” the
culture so that it would grow at a useable rate and give reproducible results.
50
A wire loop was passed through a bunsen flame until red hot, then allowed to cool, this
wire loop was then dipped into the universal tube containing the cell culture. A pre-
prepared petri dish with nutrient agar was then opened near to the flame and kept upside
down to reduce chances of contamination. The wire loop was then streaked across the
surface of the nutrient agar, this was repeated with the loop being sterilised in the flame
each time. The streaked plates were then covered with their lids and placed upside down
into a 37°C incubator and left overnight to allow the cultures to grow.
4.1.4. Aerobic Growth Media Preparation
500 ml of aerobic growth media was prepared by adding 7.5 g Nutrient broth no.2 to 500
ml of distilled water, this was mixed using a magnetic mixer until the powder was fully
dissolved. The media was then distributed between a 200 ml flask which was sealed with a
foam bung, and the remaining media distributed between glass universal tubes which were
filled approx. 2/3 and sealed with the supplied lids. These were then placed into an
autoclave, which was allowed to reach 120°C and left for 15 minutes.
4.1.5. Anaerobic Growth Media Preparation
12 L of anaerobic growth media was prepared by adding 15 g/L Nutrient broth no.2, 5
ml/L glycerol and 4 g/L sodium fumarate to 1 L of distilled water in 6 x 2 L bottles then
mixed using a magnetic mixer until the powder was fully dissolved. A further bottle of 1.2
L media was prepared in the same ratio and was distributed between 6 x 200 ml bottles
which were sealed with rubber bungs along with the 6 x 2 L bottles. All bottles were
placed into a fume cupboard connected in series using rubber tubing and the media de-
gassed using a vacuum pump for one hour. They were then placed into an autoclave,
allowed to reach 120°C and left for 15 minutes.
51
4.1.6. Small Inoculation
One universal tube containing aerobic media was taken and a Bunsen burner was lit to
keep the area near the bottle free from contamination by working in close proximity to the
flame. A thin wire with a loop formed on the end was passed through the flame and
allowed to become red hot to sterilise it, allowed to cool and then used to remove a large
culture of E.coli from a Petri dish. The culture was then transferred to the medium
ensuring all of the culture was removed from the wire loop by shaking it in the medium,
the bottle was then sealed with the neck and lid passing through the flame to sterilise it.
The universal tube was then placed into a vibrating incubator at 37°C and 180 rpm and left
overnight for approx 14 hours to allow for culture growth.
4.1.7. Transfer to Larger Batches
20 ml of the initial inoculum was then transferred to the 200 ml flask containing aerobic
growth media using a 20 ml syringe working in proximity to a lit Bunsen burner. The flask
was then placed in a vibrating incubator at 37°C and 180 rpm for 4 hours. Again working
in close proximity to a Bunsen burner a 20 ml syringe was used to transfer 20 ml of
inoculum to each of the 6 x filled 200 ml bottles containing anaerobic media. The bottles
were then left closed overnight in a 37°C environment.
The medium from the 200 ml bottles was then transferred to 6 x 2 litre bottles using
syringe and gas exchange between bottles. Nitrogen was pumped into smaller bottles, with
the larger bottles being de-gassed; this forced the media from smaller bottles into the larger
ones. The large bottles of media were then de-gassed for an hour and gas exchanged with
nitrogen for around 15 minutes then left pressurised under nitrogen to maintain an
anaerobic environment. These were then left overnight in 37°C environment to allow
cultures to grow.
52
4.1.8. Centrifugation of live cells
The bottles containing cultures were split into six centrifuge tubes, accurately weighed and
split into matching pairs then centrifuged at 7000 rpm and 4°C for 10 minutes per batch.
The supernantent was then discarded and the cultures collected, cultures were then re-
suspended in 20 mM MOPS-NaOH buffer pH7.0, centrifuged again at 7000 rpm and 4°C
for 10 minutes. This was repeated three times to wash the cultures. The washed cultures
were collected and finally re-suspended in 150 ml of 20 mM MOPS-NaOH buffer pH7.0.
Three samples were taken from the washed cultures and the optical density at 600 nm
wavelength was established using a spectrophotometer, the cell density was then
calculated using the following formula (established during previous studies)
Average optical density X 0.482 X 100 = Mass of cells (mg) per ml
From previous studies an appropriate value for the cell density should be between 20-30
mg/ml.[71]
The washed 150 ml cultures were then sealed in a 200 ml bottle, de-gassed and then
bubbled with hydrogen for 15 minutes. The bottle was then left pressurised under
hydrogen to allow the cells to become saturated with hydrogen which is used as the
electron donor in the reduction of metals.
4.1.9. Metalisation of live cells
Cells were metalised using either Pt solution or Pd solutions as appropriate to give
different loadings onto the biomass of 1,2 or 5 wt%. Solutions were prepared as 2 mM
solutions in 0.01 mM nitric acid pH 2.0, the cell density was used to establish the amount
of metal required to achieve the desired metal loading.
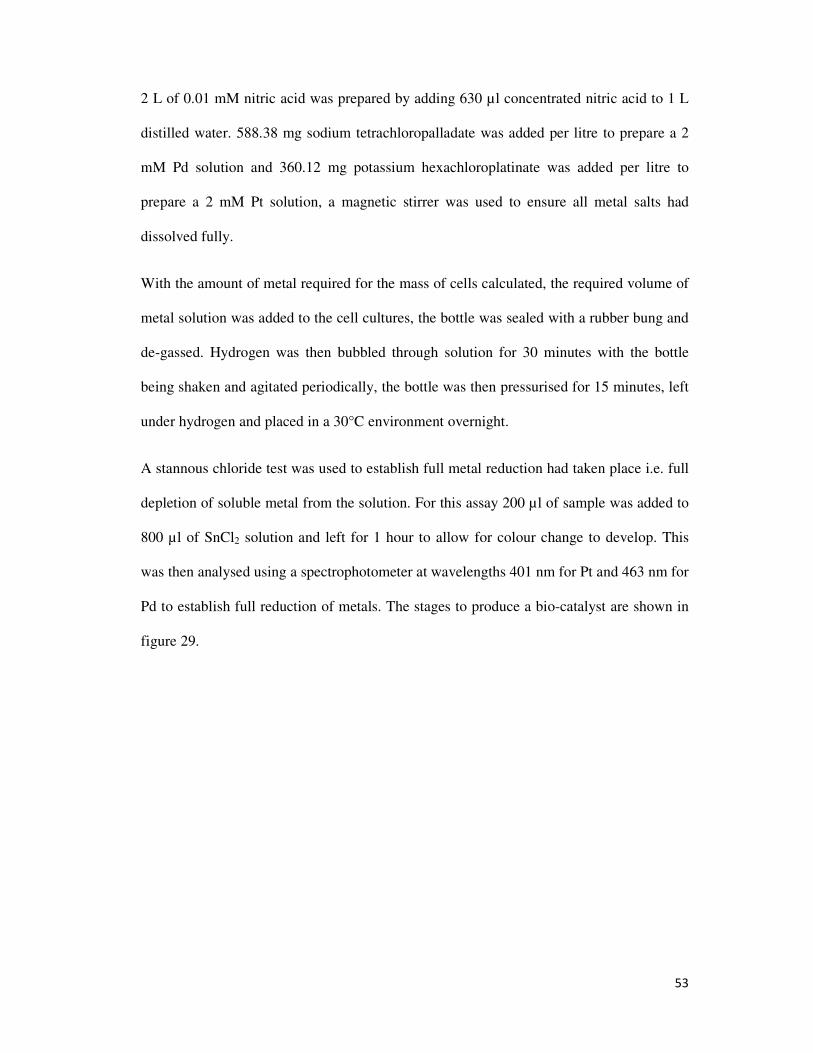
53
2 L of 0.01 mM nitric acid was prepared by adding 630 µl concentrated nitric acid to 1 L
distilled water. 588.38 mg sodium tetrachloropalladate was added per litre to prepare a 2
mM Pd solution and 360.12 mg potassium hexachloroplatinate was added per litre to
prepare a 2 mM Pt solution, a magnetic stirrer was used to ensure all metal salts had
dissolved fully.
With the amount of metal required for the mass of cells calculated, the required volume of
metal solution was added to the cell cultures, the bottle was sealed with a rubber bung and
de-gassed. Hydrogen was then bubbled through solution for 30 minutes with the bottle
being shaken and agitated periodically, the bottle was then pressurised for 15 minutes, left
under hydrogen and placed in a 30°C environment overnight.
A stannous chloride test was used to establish full metal reduction had taken place i.e. full
depletion of soluble metal from the solution. For this assay 200 µl of sample was added to
800 µl of SnCl2 solution and left for 1 hour to allow for colour change to develop. This
was then analysed using a spectrophotometer at wavelengths 401 nm for Pt and 463 nm for
Pd to establish full reduction of metals. The stages to produce a bio-catalyst are shown in
figure 29.
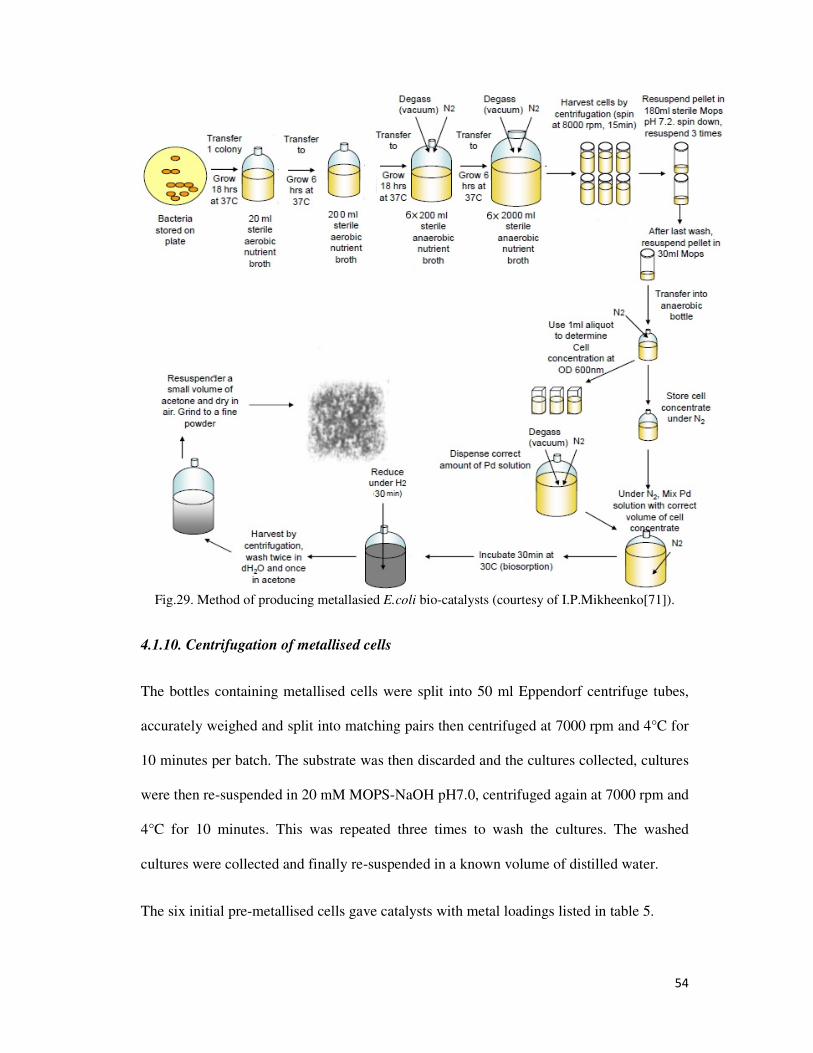
54
Fig.29. Method of producing metallasied E.coli bio-catalysts (courtesy of I.P.Mikheenko[71]).
4.1.10. Centrifugation of metallised cells
The bottles containing metallised cells were split into 50 ml Eppendorf centrifuge tubes,
accurately weighed and split into matching pairs then centrifuged at 7000 rpm and 4°C for
10 minutes per batch. The substrate was then discarded and the cultures collected, cultures
were then re-suspended in 20 mM MOPS-NaOH pH7.0, centrifuged again at 7000 rpm and
4°C for 10 minutes. This was repeated three times to wash the cultures. The washed
cultures were collected and finally re-suspended in a known volume of distilled water.
The six initial pre-metallised cells gave catalysts with metal loadings listed in table 5.
55
Table 5. Loadings of cells after recovery of metals from model solutions.
Initial loading (wt%) Final loading (wt%)
1% Pd 6.6% Pd 8.4% Pt
2% Pd 7.6% Pd 8.4% Pt
5% Pd 11% Pd 9% Pt
1% Pt 5.6% Pd 9.4% Pt
2% Pt 5.6% Pd 10.4% Pt
5% Pt 6% Pd 14% Pt
4.1.11. Recovery of metal from model solution
To initially model a leachate from a road dust sample a mixed metal solution of 0.42 mM
Pd 0.34 mM Pt was prepared. This mixture gave the equivalent of approx 100 ppm metal
content, it also meant approx 60:40 ratio Pt to Pd as platinum is currently more valuable
and so is of more interest from a recovery view point. The volume of mixed metal solution
required to give a final metal loading of 20% on 5% pre-metallised cells was calculated
and this volume added to the cells.
The mixture was then sealed in a bottle using a rubber seal and de-gassed for 15 minutes,
hydrogen gas was then bubbled through the solution for 5 minutes. A stannous chloride
test was again used as previously described to establish full metal recovery, a wavelength
of 419 nm was used as this was the peak for the mixed metal solution.
Figure 30 Shows three bottles, bottle A containing model solution 0.42 mM PD 0.34 mM
Pt, bottle B showing the model solution with pre-metallised cells (as table) added during
the bio-sorption stage which appears as the same colour but opaque due the presence of the
cells. Bottle C shows the pre-metallised cells with recovered metals on the surface after
reduction (total metal loading as shown in table 5) using hydrogen which now appear
black in colour as the final bio-catalyst.

56
Fig.30. Bottles containing PGM solution and E.coli cells.
4.1.12. Effect of Inter Batch Variability
The production of bio-catalysts and their catalytic activity is well documented; the
influence on inter batch variability of these catalysts however has not been fully
investigated. To establish whether different batches of catalysts would offer similar
properties 6 batches were prepared using the afore mentioned methodology. Each batch
was split into 6 smaller batches which were all pre-loaded with different levels and metals
as listed in table 5.
The resultant pre-loaded cells were then used to recover metals from solution as previously
described and the rates of reduction monitored. This allowed the most suitable metal and
loading to be identified, as it meant 5 replicates for each sample, however it also allowed
the difference between batches to be highlighted.
4.1.13. Centrifugation of Bio-Catalysts
After metal recovery from model solutions the bottles containing metallised cells were
split into 50 ml Eppendorf centrifuge tubes, accurately weighed and split into matching
pairs then centrifuged at 7000 rpm and 4°C for 10 minutes per batch. The supernatant was

57
then discarded and the cultures collected, cultures were then re-suspended in distilled
water and centrifuged again at 7000 rpm and 4°C for 10 minutes. This was repeated twice
with distilled water and once with acetone to wash the cultures. The excess acetone was
discarded and the cells were left in a fume cupboard for the remaining acetone to evaporate
and the catalysts to dry.
4.1.14. Preparation of Powdered Bio-catalyst
After the final wash using acetone and drying overnight, the resultant hard pellet of dried
cells was hand ground using an agate pestle and mortar with the powder being passed
through a fine fraction (10µm) sieve. The final powder sample was then collected and
weighed ready for use in catalytic testing.
4.1.15. Transmission Electron Microscopy (TEM)
Samples of cells were prepared for TEM to investigate the reduction of metals from
solution to evaluate where these metallic clusters were forming; over the cells surface or as
independent metal clusters. Samples were prepared by washing twice using distilled H2O,
then fixed in 2.5 wt% glutaraldehyde, they were then centrifuged and resuspended in 1.5
ml of 0.1M Na-cacodylate buffer pH 7.0 and stained in 1% osmium tetroxide for 60
minutes. Cells were then dehydrated using an ethanol series and washed twice in
propylene oxide for 15 minutes, they were then embedded in epoxy resin and left for 24
hours to allow the mixture to polymerise. Sections 100-150nm thick were then cut from
the resin block and placed in a copper grid for examination using a JEOL 1200CX2 TEM
using an accelerating voltage of 80 kV.
58
4.1.16. Chromate Reduction Testing
To identify the best performing catalyst for use within further testing a Cr(VI) test was
carried out on samples of the six different catalysts. 500 µM Chromate (Na2CrO4) solution
was prepared adding 10 mg of Na2CrO4 4H2O to 200 ml MOPS-NaOH buffer pH 7.0 and
stirred with a magnetic stirrer until the powder was fully dissolved. 5 ml of this solution
was added to a 12 ml serum bottle along with 10 mg of catalyst, the bottle was then sealed
with a butyl rubber stopper and degassed for 15 minutes. Nitrogen was then bubbled
through the solution continuously during the reaction to ensure that the environment within
the bottle remained anaerobic, 1 ml of 25 mM sodium formate(electron donor) was then
added to the bottle to initiate the reaction and the bottle placed onto a shaker at 180 rpm to
keep the solution well mixed and prevent the catalyst from settling out of solution.
Samples were taken from the bottle at 30 minute intervals for a 3 hour period, the samples
were then centrifuged at 13000 rpm for 4 minutes to stop the reaction.
The supernatants were analysed for residual CrO42- using a diphenylcarbazide (DPC)
assay test, DPC solution was prepared by adding 37.5 mg of DPC powder to 7.5 ml
acetone 1.25 ml 3M H2SO4 and 7.5 ml distilled water, the solution was heated and stirred
using a magnetic stirrer to fully dissolve the powder. This initial solution was mixed 1:24
with distilled water; this final DPC solution was stored in a covered bottle in a fridge as it
is highly photosensitive and should only be removed when being used.
100 µl of sample was added to 1.4 ml DPC solution within a cuvette and left for 5 minutes
to allow for a colour change to develop. This was then analysed using a spectrophotometer
at wavelength of 540 nm and the concentration of CrO42- estimated by reference to a
standard curve to establish when full reduction had taken place.
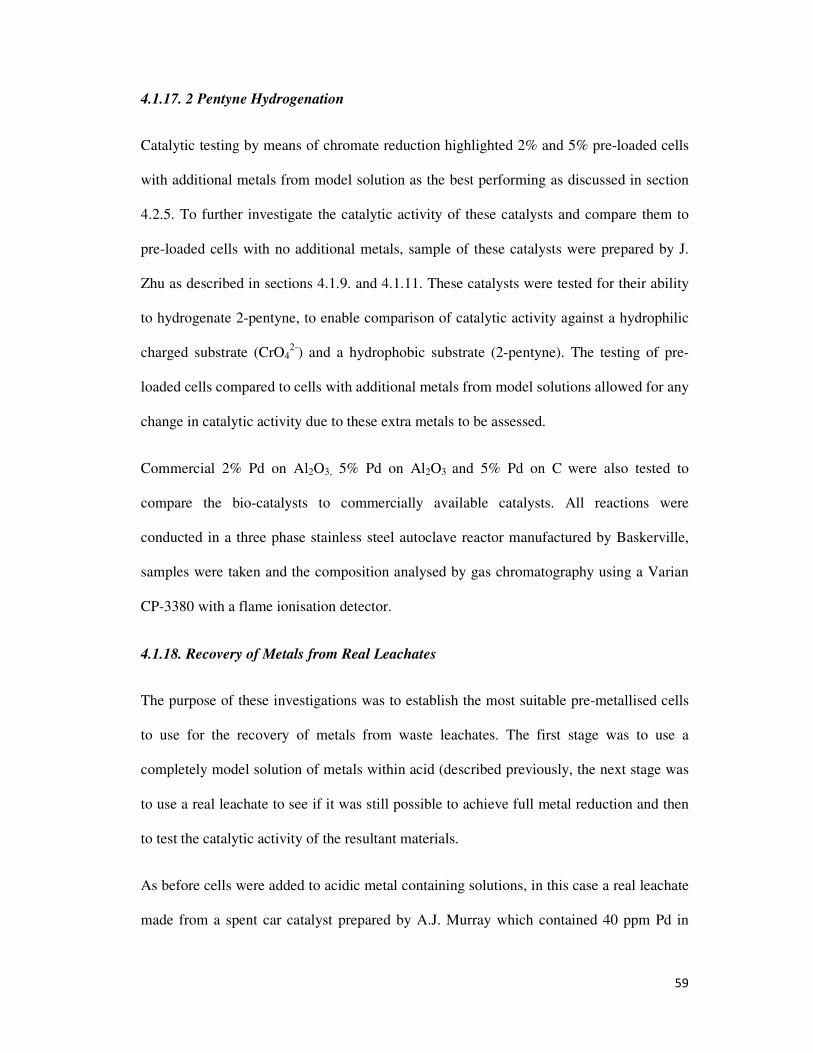
59
4.1.17. 2 Pentyne Hydrogenation
Catalytic testing by means of chromate reduction highlighted 2% and 5% pre-loaded cells
with additional metals from model solution as the best performing as discussed in section
4.2.5. To further investigate the catalytic activity of these catalysts and compare them to
pre-loaded cells with no additional metals, sample of these catalysts were prepared by J.
Zhu as described in sections 4.1.9. and 4.1.11. These catalysts were tested for their ability
to hydrogenate 2-pentyne, to enable comparison of catalytic activity against a hydrophilic
charged substrate (CrO42-) and a hydrophobic substrate (2-pentyne). The testing of pre-
loaded cells compared to cells with additional metals from model solutions allowed for any
change in catalytic activity due to these extra metals to be assessed.
Commercial 2% Pd on Al2O3, 5% Pd on Al2O3 and 5% Pd on C were also tested to
compare the bio-catalysts to commercially available catalysts. All reactions were
conducted in a three phase stainless steel autoclave reactor manufactured by Baskerville,
samples were taken and the composition analysed by gas chromatography using a Varian
CP-3380 with a flame ionisation detector.
4.1.18. Recovery of Metals from Real Leachates
The purpose of these investigations was to establish the most suitable pre-metallised cells
to use for the recovery of metals from waste leachates. The first stage was to use a
completely model solution of metals within acid (described previously, the next stage was
to use a real leachate to see if it was still possible to achieve full metal reduction and then
to test the catalytic activity of the resultant materials.
As before cells were added to acidic metal containing solutions, in this case a real leachate
made from a spent car catalyst prepared by A.J. Murray which contained 40 ppm Pd in
60
67% aqua regia solution. This solution was spiked to 400 ppm using Na2PdCl4 salt. The
solution at this point was too acidic for testing as metals on the cells would dissolve, to
overcome this the solution was diluted 10 times using distilled water and then further
neutralised to pH 2.2 using 6M NaOH. 1ml of cells pre palladised with 5% palladium
were added to 77.57 ml of this solution which gave a final metal loading the same as
catalysts prepared using a model solution as described previously.
The bottle was then sealed with a rubber bung and deg-gassed, hydrogen was then bubbled
through the solution for two hours and the bottle left pressurised under hydrogen. A
stannous chloride test was carried out at 401 nm as only Pd was present in the solution to
establish when full reduction had occurred, samples were taken at 12 hour intervals for 60
hours. Each time a sample was taken from the solution hydrogen was bubbled through
solution for a further 15 minutes and the bottle again left pressurised under hydrogen.
4.1.19. Addition of Contaminants to Model Solutions
To establish possible reasons for the longer recovery rates seen from real leachates (section
4.4.2. and 4.2.7.) compared to those seen with model solutions, contaminant materials
which possibly were present in the real leachates were added to model solutions and
reductions carried out. A model solution of 67% aqua regia was prepared which was
spiked to 400 ppm using Pd salt as previously. This was diluted to 40 ppm using distilled
water and the pH brought up to 2.2 using 2M NaOH as previously. The contaminant
materials used were Al2O3 and SiO2 both of which would expect to be found within a real
leachate, these materials were insoluble in the acid however they were dissolved in the
NaOH before adding it to the solution to increase the pH.
Three different reduction tests were carried out #1 with 2 mg Al2O3 to 10 ml solution, #2
with 2 mg SiO2 to 10 ml solution and #3 with 2 mg Al2O3 and 2 mg SiO2 to 10 ml
61
solution. The solutions were mixed with cells within 12 ml serum bottles and sealed using
butyl rubber seals. Hydrogen was then bubbled through the solution for 1 hour and the
bottles left pressurised under hydrogen. Samples were taken at hourly intervals and
analysed using a stannous chloride assay to establish when full reduction had taken place.
4.1.20. Chromate Testing of Catalyst from Real Leachates
Chromate reduction tests were carried out on catalysts prepared from the real leachates.
These catalysts were prepared using the same method as for model solutions. This was
done to see if the presence of any contaminant materials within the real leachates had any
detrimental effect on the catalytic activity of the resultant catalyst.
4.2. Results & Discussions: Metal biorecovery and catalytic testing
4.2.1. Stannous Chloride Calibration
Due to the levels of metal present within solution being very low the sensitivity of the
assay test used needed to be verified. This was achieved by establishing calibration curves
for Pd and Pt respectively one with 200 µl of sample to 800 µl of SnCl2 and one with 500
µl of sample to 500 µl of SnCl2; the curves are shown in figures 31-34:

62
Fig.31. Palladium calibration curve for 200:800
As can be seen both curves have an r2 value close to 1 however for the lower
concentrations of metal there appears to be a marginally greater scatter for the 500:500
curve. This means that using 200 µl of sample to 800 µl of SnCl2 will give more accurate
results for assay testing of the reduced samples.
Fig.32. Palladium calibration curve for 500:500
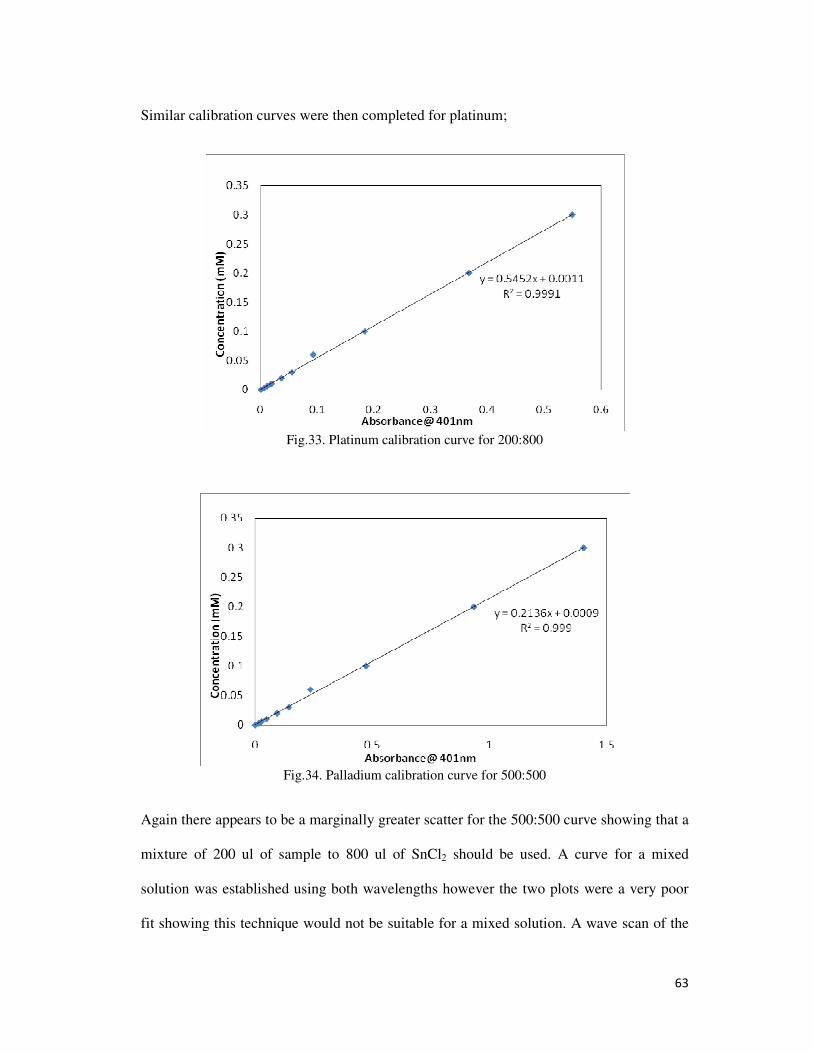
63
Similar calibration curves were then completed for platinum;
Fig.33. Platinum calibration curve for 200:800
Fig.34. Palladium calibration curve for 500:500
Again there appears to be a marginally greater scatter for the 500:500 curve showing that a
mixture of 200 ul of sample to 800 ul of SnCl2 should be used. A curve for a mixed
solution was established using both wavelengths however the two plots were a very poor
fit showing this technique would not be suitable for a mixed solution. A wave scan of the
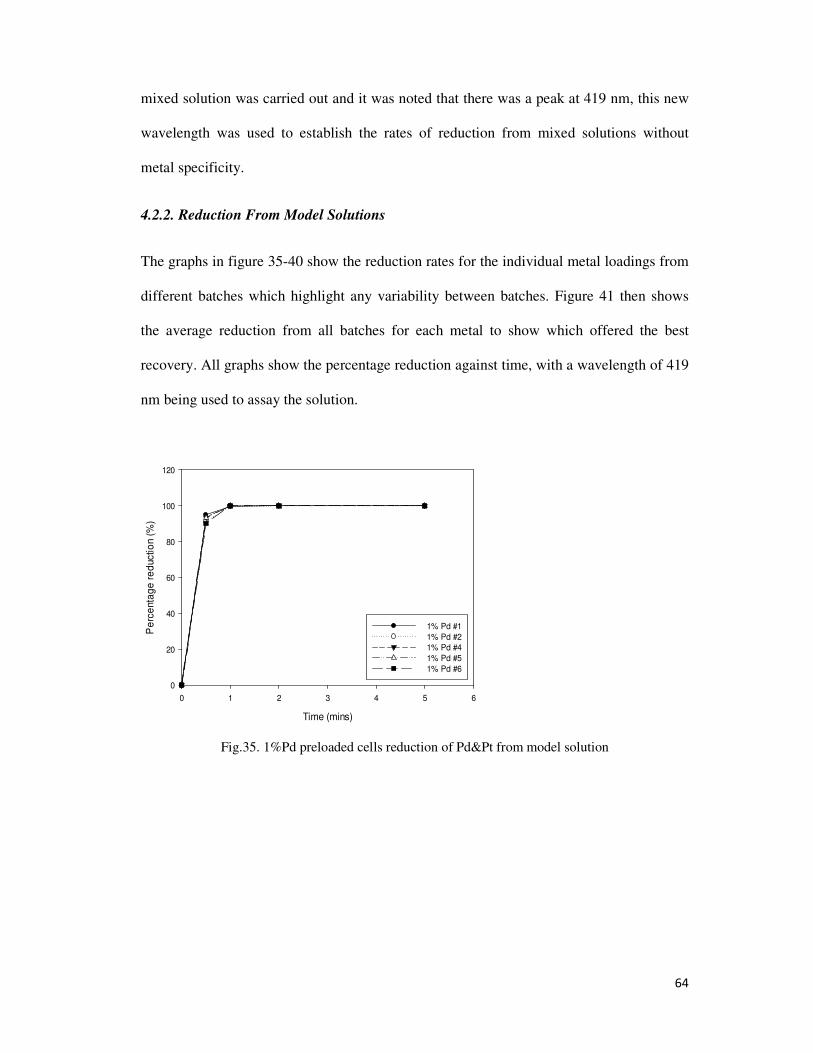
64
mixed solution was carried out and it was noted that there was a peak at 419 nm, this new
wavelength was used to establish the rates of reduction from mixed solutions without
metal specificity.
4.2.2. Reduction From Model Solutions
The graphs in figure 35-40 show the reduction rates for the individual metal loadings from
different batches which highlight any variability between batches. Figure 41 then shows
the average reduction from all batches for each metal to show which offered the best
recovery. All graphs show the percentage reduction against time, with a wavelength of 419
nm being used to assay the solution.
Time (mins)
0 1 2 3 4 5 6
Pe
rce
nta
ge
re
ductio
n (
%)
0
20
40
60
80
100
120
1% Pd #1
1% Pd #2
1% Pd #4
1% Pd #5
1% Pd #6
Fig.35. 1%Pd preloaded cells reduction of Pd&Pt from model solution
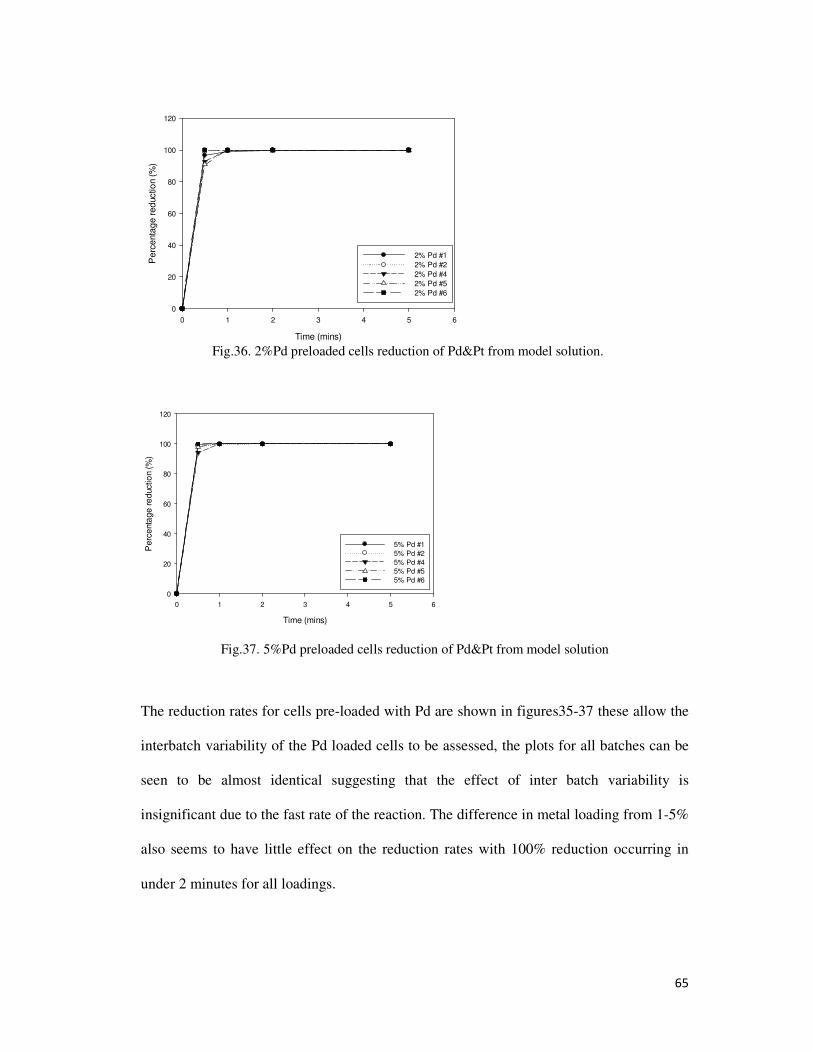
65
Time (mins)
0 1 2 3 4 5 6
Pe
rce
nta
ge
re
ductio
n (
%)
0
20
40
60
80
100
120
2% Pd #1
2% Pd #2
2% Pd #4
2% Pd #5
2% Pd #6
Fig.36. 2%Pd preloaded cells reduction of Pd&Pt from model solution.
Time (mins)
0 1 2 3 4 5 6
Pe
rce
nta
ge
re
ductio
n (
%)
0
20
40
60
80
100
120
5% Pd #1
5% Pd #2
5% Pd #4
5% Pd #5
5% Pd #6
Fig.37. 5%Pd preloaded cells reduction of Pd&Pt from model solution
The reduction rates for cells pre-loaded with Pd are shown in figures35-37 these allow the
interbatch variability of the Pd loaded cells to be assessed, the plots for all batches can be
seen to be almost identical suggesting that the effect of inter batch variability is
insignificant due to the fast rate of the reaction. The difference in metal loading from 1-5%
also seems to have little effect on the reduction rates with 100% reduction occurring in
under 2 minutes for all loadings.
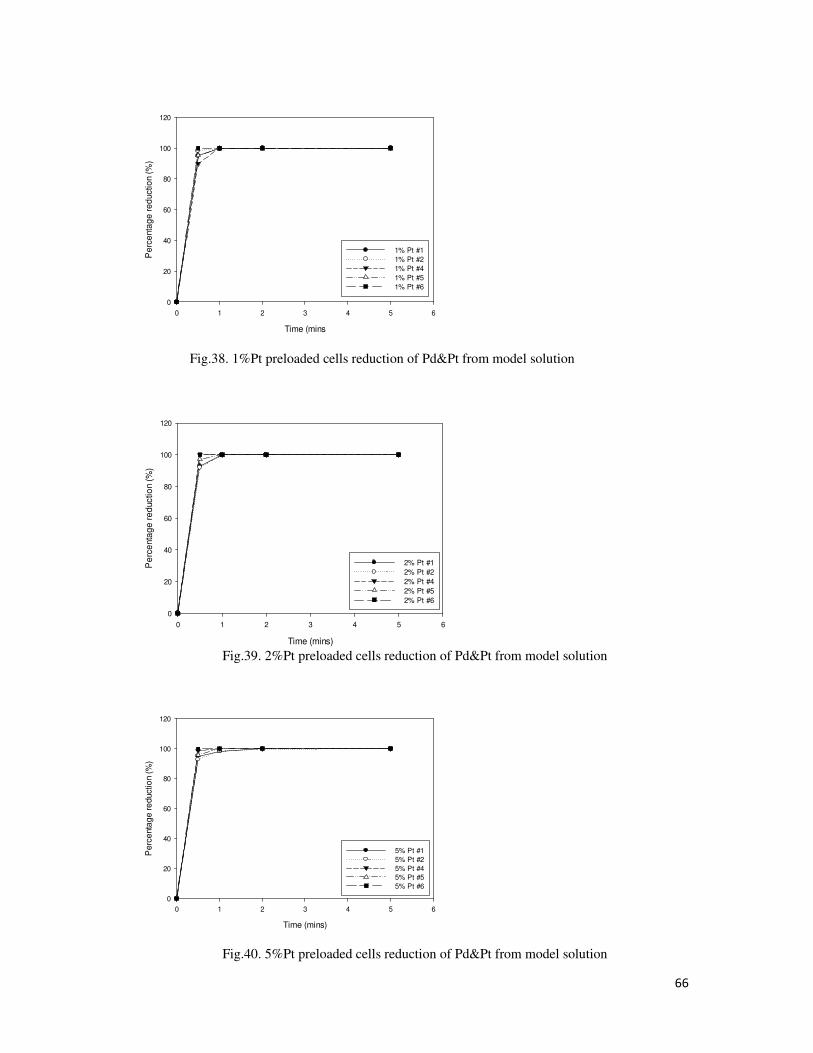
66
Time (mins
0 1 2 3 4 5 6
Pe
rce
nta
ge
re
ductio
n (
%)
0
20
40
60
80
100
120
1% Pt #1
1% Pt #2
1% Pt #4
1% Pt #5
1% Pt #6
Fig.38. 1%Pt preloaded cells reduction of Pd&Pt from model solution
Time (mins)
0 1 2 3 4 5 6
Pe
rce
nta
ge
re
ductio
n (
%)
0
20
40
60
80
100
120
2% Pt #1
2% Pt #2
2% Pt #4
2% Pt #5
2% Pt #6
Fig.39. 2%Pt preloaded cells reduction of Pd&Pt from model solution
Time (mins)
0 1 2 3 4 5 6
Pe
rce
nta
ge
re
ductio
n (
%)
0
20
40
60
80
100
120
5% Pt #1
5% Pt #2
5% Pt #4
5% Pt #5
5% Pt #6
Fig.40. 5%Pt preloaded cells reduction of Pd&Pt from model solution
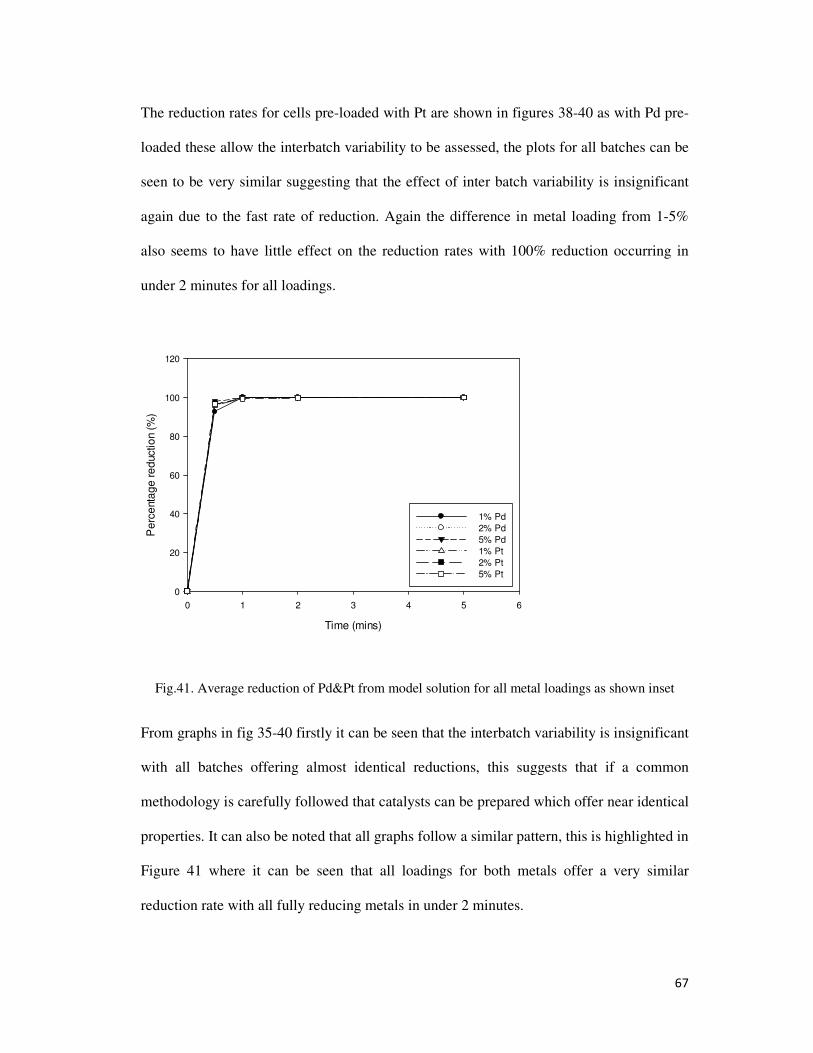
67
The reduction rates for cells pre-loaded with Pt are shown in figures 38-40 as with Pd pre-
loaded these allow the interbatch variability to be assessed, the plots for all batches can be
seen to be very similar suggesting that the effect of inter batch variability is insignificant
again due to the fast rate of reduction. Again the difference in metal loading from 1-5%
also seems to have little effect on the reduction rates with 100% reduction occurring in
under 2 minutes for all loadings.
Time (mins)
0 1 2 3 4 5 6
Pe
rce
nta
ge
re
ductio
n (
%)
0
20
40
60
80
100
120
1% Pd
2% Pd
5% Pd
1% Pt
2% Pt
5% Pt
Fig.41. Average reduction of Pd&Pt from model solution for all metal loadings as shown inset
From graphs in fig 35-40 firstly it can be seen that the interbatch variability is insignificant
with all batches offering almost identical reductions, this suggests that if a common
methodology is carefully followed that catalysts can be prepared which offer near identical
properties. It can also be noted that all graphs follow a similar pattern, this is highlighted in
Figure 41 where it can be seen that all loadings for both metals offer a very similar
reduction rate with all fully reducing metals in under 2 minutes.
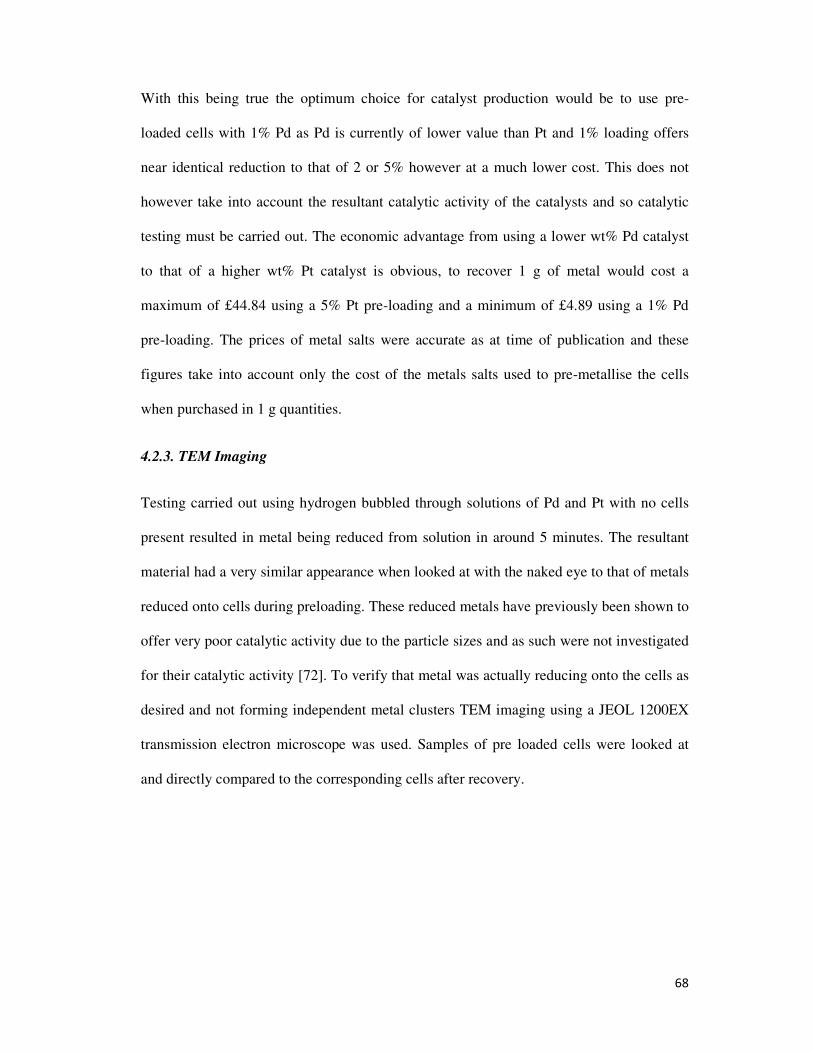
68
With this being true the optimum choice for catalyst production would be to use pre-
loaded cells with 1% Pd as Pd is currently of lower value than Pt and 1% loading offers
near identical reduction to that of 2 or 5% however at a much lower cost. This does not
however take into account the resultant catalytic activity of the catalysts and so catalytic
testing must be carried out. The economic advantage from using a lower wt% Pd catalyst
to that of a higher wt% Pt catalyst is obvious, to recover 1 g of metal would cost a
maximum of £44.84 using a 5% Pt pre-loading and a minimum of £4.89 using a 1% Pd
pre-loading. The prices of metal salts were accurate as at time of publication and these
figures take into account only the cost of the metals salts used to pre-metallise the cells
when purchased in 1 g quantities.
4.2.3. TEM Imaging
Testing carried out using hydrogen bubbled through solutions of Pd and Pt with no cells
present resulted in metal being reduced from solution in around 5 minutes. The resultant
material had a very similar appearance when looked at with the naked eye to that of metals
reduced onto cells during preloading. These reduced metals have previously been shown to
offer very poor catalytic activity due to the particle sizes and as such were not investigated
for their catalytic activity [72]. To verify that metal was actually reducing onto the cells as
desired and not forming independent metal clusters TEM imaging using a JEOL 1200EX
transmission electron microscope was used. Samples of pre loaded cells were looked at
and directly compared to the corresponding cells after recovery.
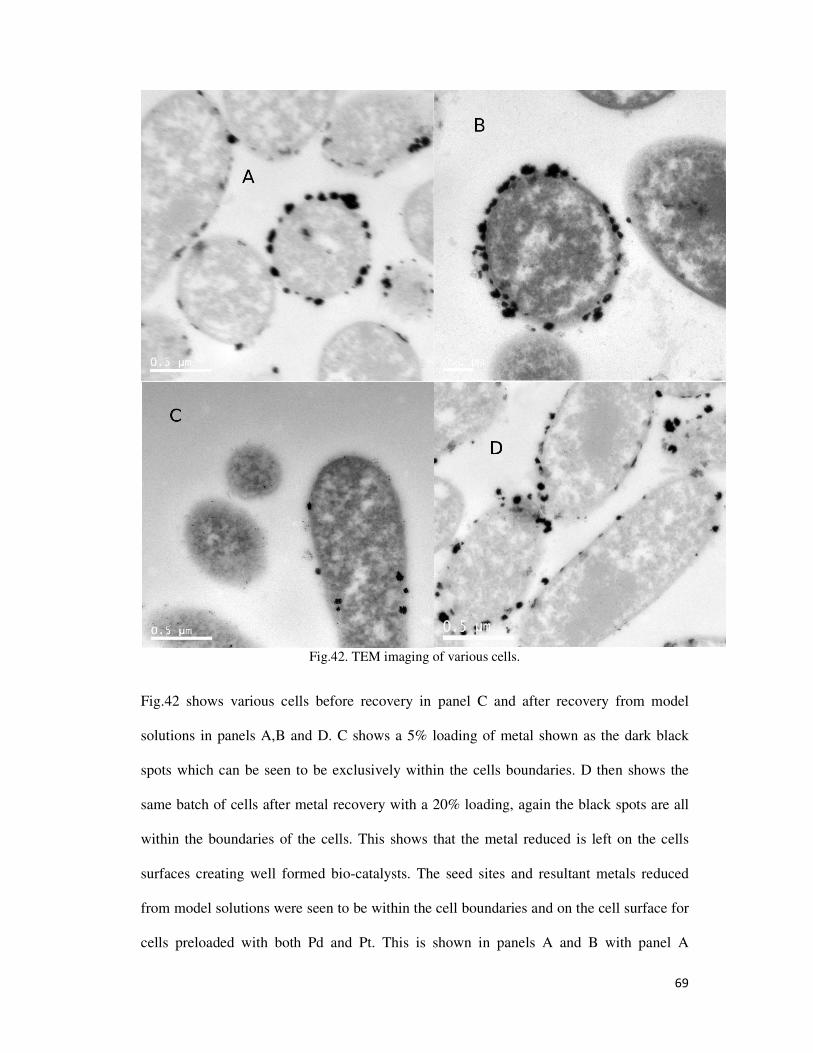
69
Fig.42. TEM imaging of various cells.
Fig.42 shows various cells before recovery in panel C and after recovery from model
solutions in panels A,B and D. C shows a 5% loading of metal shown as the dark black
spots which can be seen to be exclusively within the cells boundaries. D then shows the
same batch of cells after metal recovery with a 20% loading, again the black spots are all
within the boundaries of the cells. This shows that the metal reduced is left on the cells
surfaces creating well formed bio-catalysts. The seed sites and resultant metals reduced
from model solutions were seen to be within the cell boundaries and on the cell surface for
cells preloaded with both Pd and Pt. This is shown in panels A and B with panel A
70
showing catalysts from Pd preloaded cells and panel B showing catalysts from Pt
preloaded cells, both having very similar metal formations.
4.2.4. Maximum Recovery
It was of interest to establish the maximum amount of metals cells could reduce onto their
surface. Solutions were prepared as previously however with 2 mM Pt and 2 mM Pd
mixture rather than the model solution of 0.34 mM Pt and 0.42 mM Pd mix. This led to a
final loading of 82 wt% metal on the cells surface, target metals from solution were again
seen to reduce fully in under 2 minutes. The resultant metal loaded cells were not
catalytically tested as this test was carried out purely as a metal recovery experiment and
cells with loadings of 82% metal have too much metal present for good catalytic activity
[70].
4.2.5. Chromate Reduction
With the issue of inter batch variability having been addressed the samples were grouped
according to metal pre-loading to compare reduction rates and assess the best catalyst. The
results were plotted as percentage reduction of CrO42- against time. The metal loadings on
cells after reduction of target metals from solution are shown in the chart legend.
71
Time (mins)
0 20 40 60 80 100 120 140 160 180 200
Pe
rce
nta
ge
re
ductio
n (
%)
0
20
40
60
80
100
120
Initial loading 1% Pd Final loading 6.6% Pd 8.4% Pt
Initial loading 2% Pd Final loading 7.6% Pd 8.4% Pt
Initial loading 5% Pd Final loading 11% Pd 9% Pt
Initial loading 1% Pt Final loading 5.6% Pd 9.4% Pt
Initial loading 2% Pt Final laoding 5.6% Pd 10.4% Pt
Initial loading 5% Pt Final loading 6% Pd 14% Pt
Fig.43. Average chromate reduction for all cells of differing loadings.
With all preloaded offering near identical metal reducing capabilities from model
solutions, the catalytic activity of the resultant catalysts within the CrO42- reduciton
allowed for the optimum metal and pre-loading to be assessed. All loadings had 5
replicates to check for repeatability. From figure 43 It is seen that cells with Pt as the main
metal on the surface were seen not to reduce the Cr(VI) fully even after 3 hours, with the
exception of the 7.6% Pd 8.4% Pt cells which initially had a Pd 2% loading.
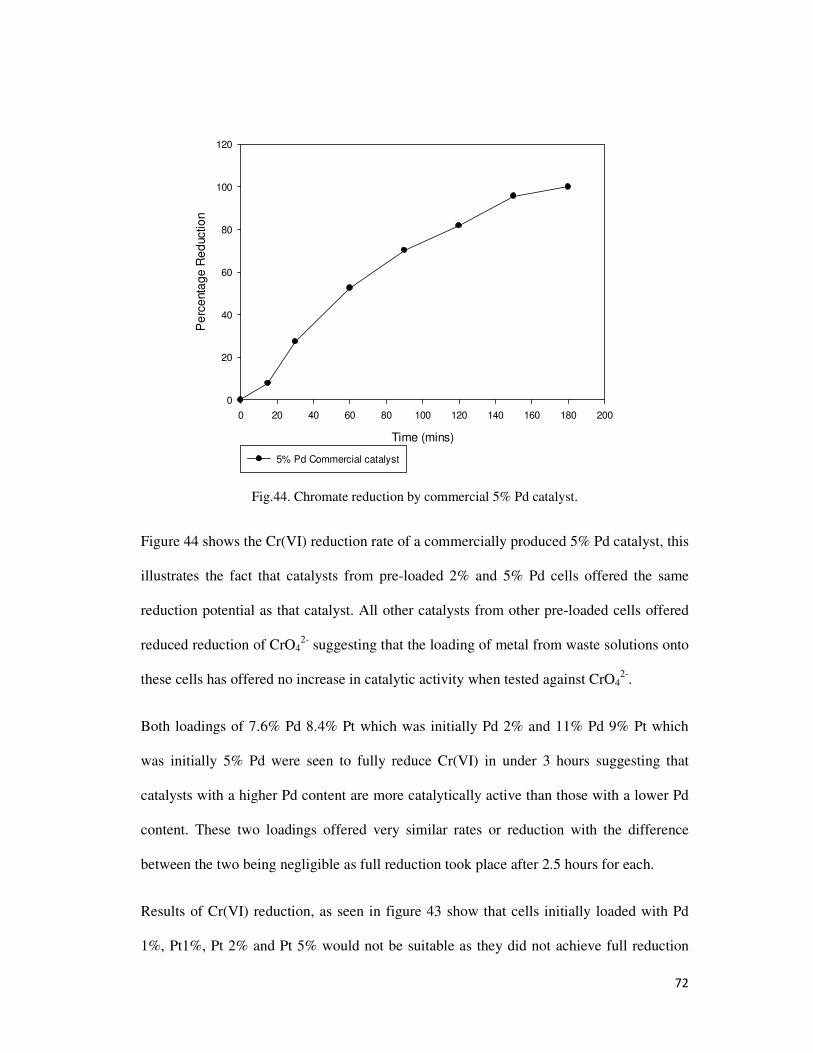
72
Time (mins)
0 20 40 60 80 100 120 140 160 180 200
Pe
rce
nta
ge
Re
ductio
n
0
20
40
60
80
100
120
5% Pd Commercial catalyst
Fig.44. Chromate reduction by commercial 5% Pd catalyst.
Figure 44 shows the Cr(VI) reduction rate of a commercially produced 5% Pd catalyst, this
illustrates the fact that catalysts from pre-loaded 2% and 5% Pd cells offered the same
reduction potential as that catalyst. All other catalysts from other pre-loaded cells offered
reduced reduction of CrO42- suggesting that the loading of metal from waste solutions onto
these cells has offered no increase in catalytic activity when tested against CrO42-.
Both loadings of 7.6% Pd 8.4% Pt which was initially Pd 2% and 11% Pd 9% Pt which
was initially 5% Pd were seen to fully reduce Cr(VI) in under 3 hours suggesting that
catalysts with a higher Pd content are more catalytically active than those with a lower Pd
content. These two loadings offered very similar rates or reduction with the difference
between the two being negligible as full reduction took place after 2.5 hours for each.
Results of Cr(VI) reduction, as seen in figure 43 show that cells initially loaded with Pd
1%, Pt1%, Pt 2% and Pt 5% would not be suitable as they did not achieve full reduction
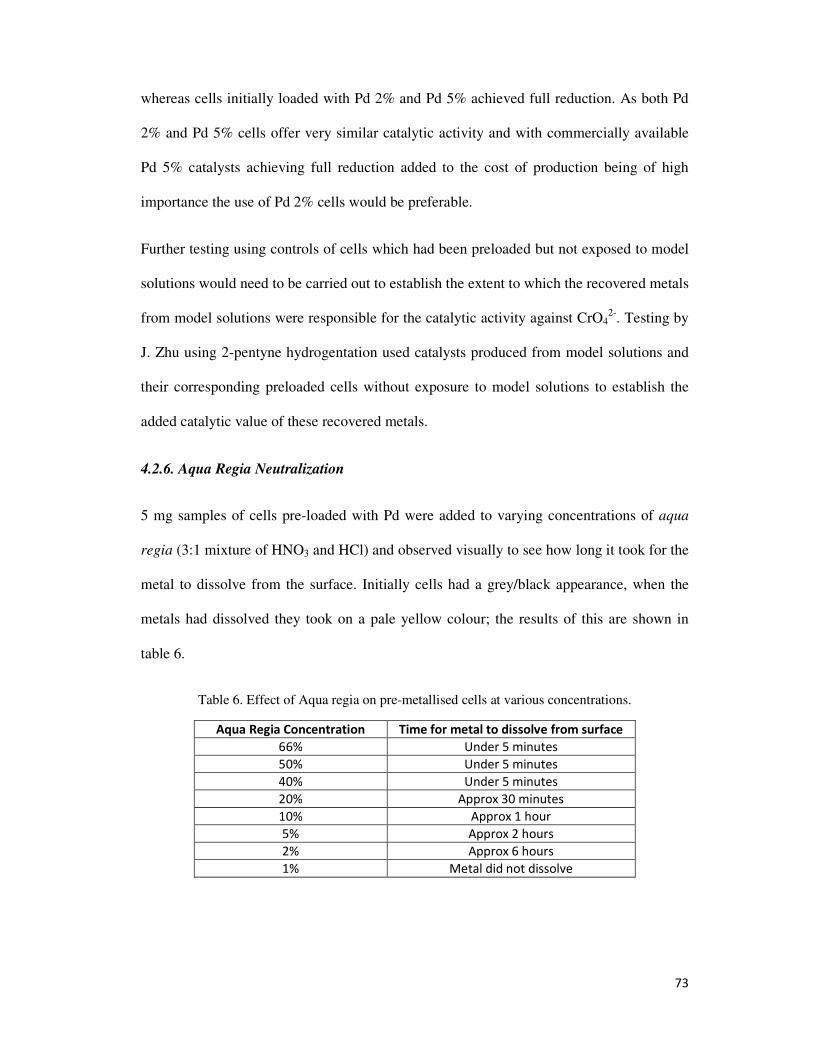
73
whereas cells initially loaded with Pd 2% and Pd 5% achieved full reduction. As both Pd
2% and Pd 5% cells offer very similar catalytic activity and with commercially available
Pd 5% catalysts achieving full reduction added to the cost of production being of high
importance the use of Pd 2% cells would be preferable.
Further testing using controls of cells which had been preloaded but not exposed to model
solutions would need to be carried out to establish the extent to which the recovered metals
from model solutions were responsible for the catalytic activity against CrO42-. Testing by
J. Zhu using 2-pentyne hydrogentation used catalysts produced from model solutions and
their corresponding preloaded cells without exposure to model solutions to establish the
added catalytic value of these recovered metals.
4.2.6. Aqua Regia Neutralization
5 mg samples of cells pre-loaded with Pd were added to varying concentrations of aqua
regia (3:1 mixture of HNO3 and HCl) and observed visually to see how long it took for the
metal to dissolve from the surface. Initially cells had a grey/black appearance, when the
metals had dissolved they took on a pale yellow colour; the results of this are shown in
table 6.
Table 6. Effect of Aqua regia on pre-metallised cells at various concentrations.
Aqua Regia Concentration Time for metal to dissolve from surface
66% Under 5 minutes
50% Under 5 minutes
40% Under 5 minutes
20% Approx 30 minutes
10% Approx 1 hour
5% Approx 2 hours
2% Approx 6 hours
1% Metal did not dissolve
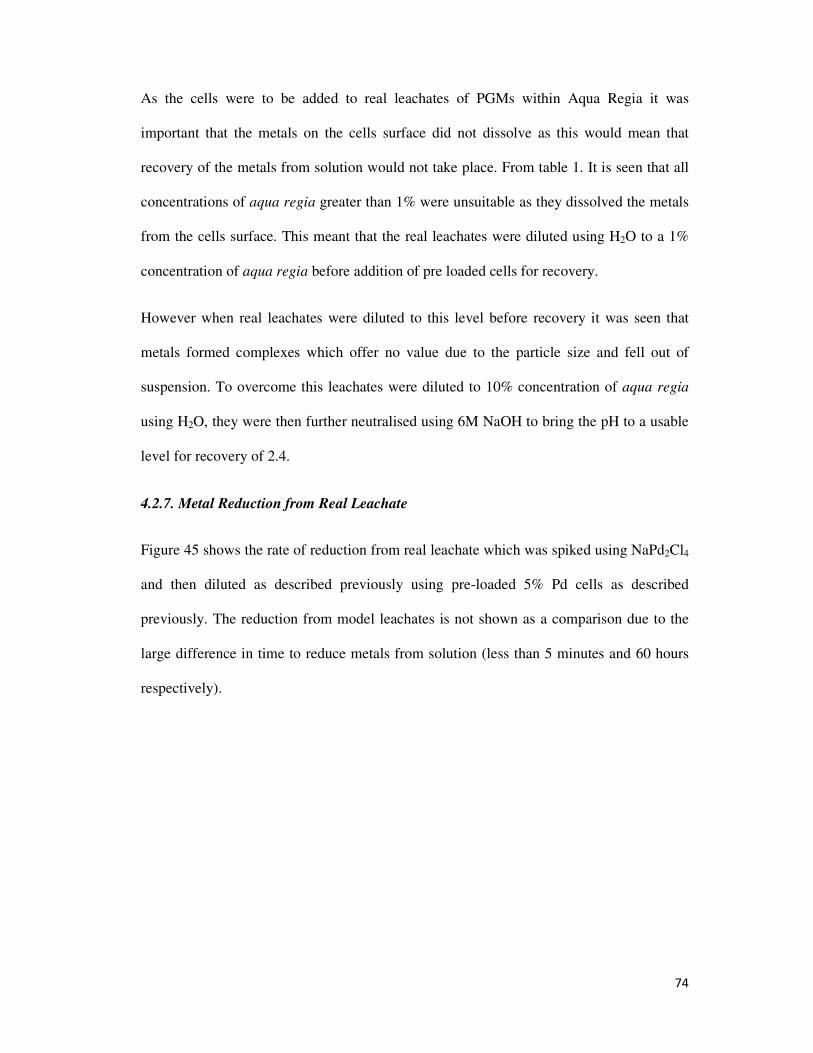
74
As the cells were to be added to real leachates of PGMs within Aqua Regia it was
important that the metals on the cells surface did not dissolve as this would mean that
recovery of the metals from solution would not take place. From table 1. It is seen that all
concentrations of aqua regia greater than 1% were unsuitable as they dissolved the metals
from the cells surface. This meant that the real leachates were diluted using H2O to a 1%
concentration of aqua regia before addition of pre loaded cells for recovery.
However when real leachates were diluted to this level before recovery it was seen that
metals formed complexes which offer no value due to the particle size and fell out of
suspension. To overcome this leachates were diluted to 10% concentration of aqua regia
using H2O, they were then further neutralised using 6M NaOH to bring the pH to a usable
level for recovery of 2.4.
4.2.7. Metal Reduction from Real Leachate
Figure 45 shows the rate of reduction from real leachate which was spiked using NaPd2Cl4
and then diluted as described previously using pre-loaded 5% Pd cells as described
previously. The reduction from model leachates is not shown as a comparison due to the
large difference in time to reduce metals from solution (less than 5 minutes and 60 hours
respectively).
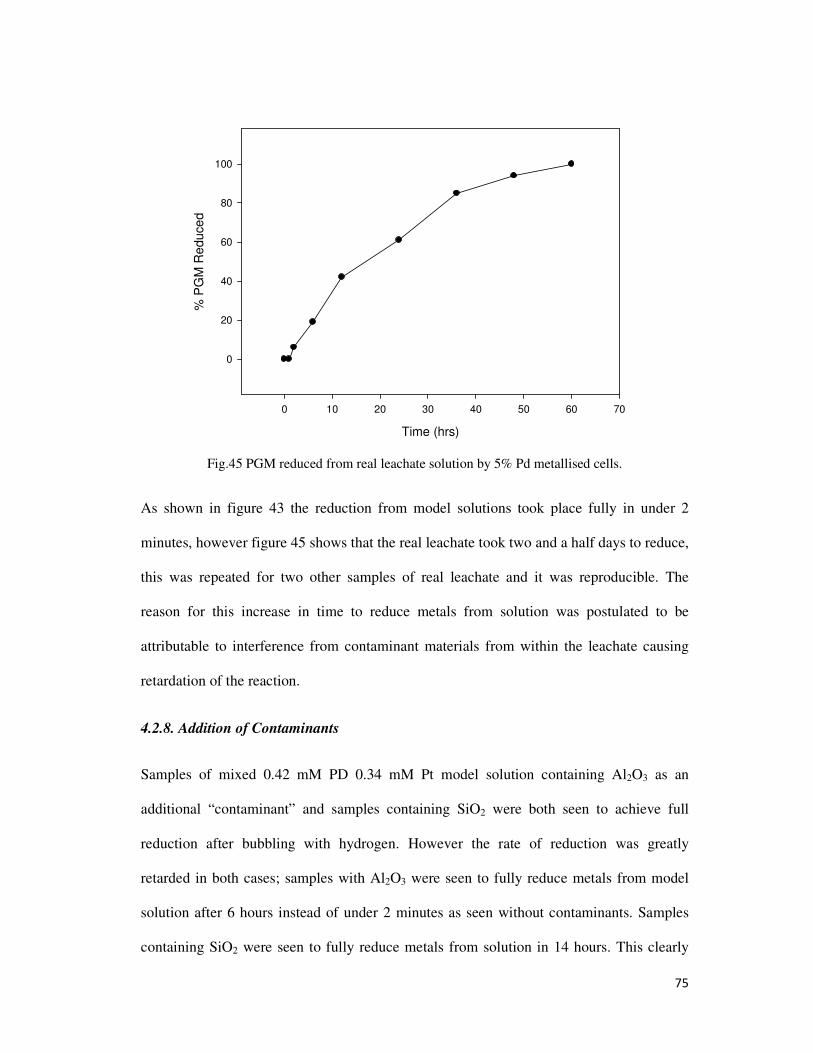
75
Time (hrs)
0 10 20 30 40 50 60 70
% P
GM
Re
du
ce
d
0
20
40
60
80
100
Fig.45 PGM reduced from real leachate solution by 5% Pd metallised cells.
As shown in figure 43 the reduction from model solutions took place fully in under 2
minutes, however figure 45 shows that the real leachate took two and a half days to reduce,
this was repeated for two other samples of real leachate and it was reproducible. The
reason for this increase in time to reduce metals from solution was postulated to be
attributable to interference from contaminant materials from within the leachate causing
retardation of the reaction.
4.2.8. Addition of Contaminants
Samples of mixed 0.42 mM PD 0.34 mM Pt model solution containing Al2O3 as an
additional “contaminant” and samples containing SiO2 were both seen to achieve full
reduction after bubbling with hydrogen. However the rate of reduction was greatly
retarded in both cases; samples with Al2O3 were seen to fully reduce metals from model
solution after 6 hours instead of under 2 minutes as seen without contaminants. Samples
containing SiO2 were seen to fully reduce metals from solution in 14 hours. This clearly
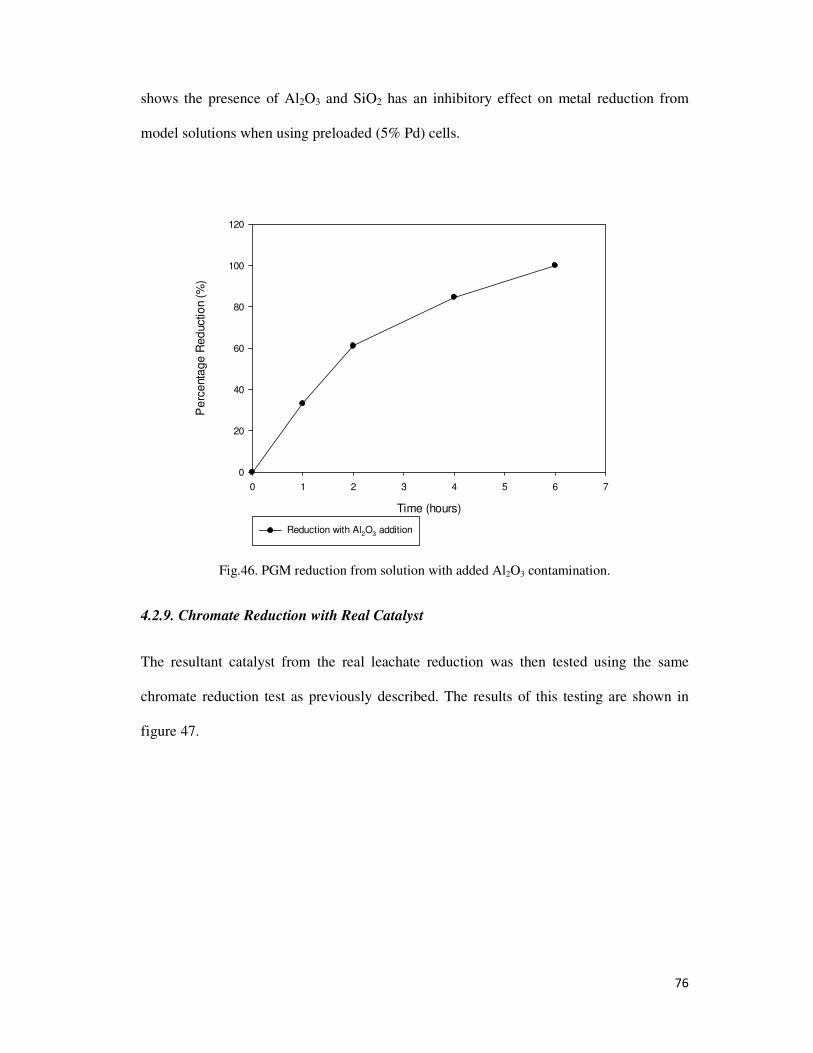
76
shows the presence of Al2O3 and SiO2 has an inhibitory effect on metal reduction from
model solutions when using preloaded (5% Pd) cells.
Time (hours)
0 1 2 3 4 5 6 7
Pe
rcenta
ge
Red
uctio
n (
%)
0
20
40
60
80
100
120
Reduction with Al2O3 addition
Fig.46. PGM reduction from solution with added Al2O3 contamination.
4.2.9. Chromate Reduction with Real Catalyst
The resultant catalyst from the real leachate reduction was then tested using the same
chromate reduction test as previously described. The results of this testing are shown in
figure 47.
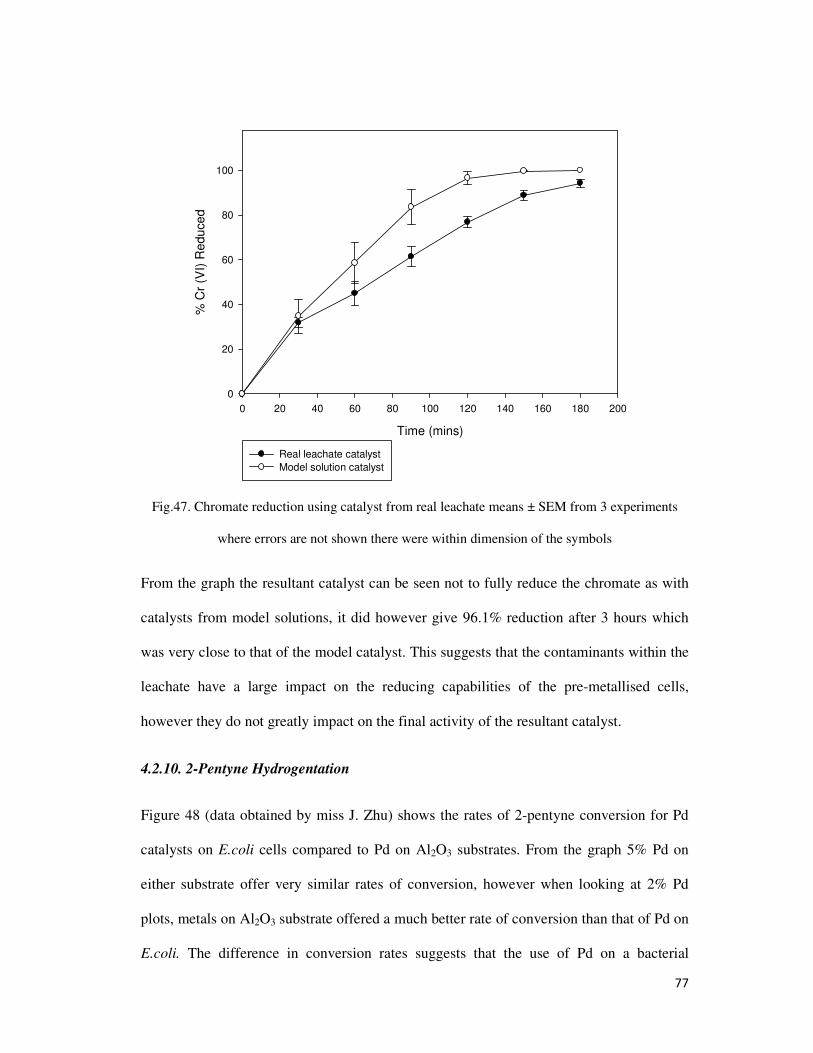
77
Time (mins)
0 20 40 60 80 100 120 140 160 180 200
% C
r (V
I) R
edu
ce
d
0
20
40
60
80
100
Real leachate catalyst
Model solution catalyst
Fig.47. Chromate reduction using catalyst from real leachate means ± SEM from 3 experiments
where errors are not shown there were within dimension of the symbols
From the graph the resultant catalyst can be seen not to fully reduce the chromate as with
catalysts from model solutions, it did however give 96.1% reduction after 3 hours which
was very close to that of the model catalyst. This suggests that the contaminants within the
leachate have a large impact on the reducing capabilities of the pre-metallised cells,
however they do not greatly impact on the final activity of the resultant catalyst.
4.2.10. 2-Pentyne Hydrogentation
Figure 48 (data obtained by miss J. Zhu) shows the rates of 2-pentyne conversion for Pd
catalysts on E.coli cells compared to Pd on Al2O3 substrates. From the graph 5% Pd on
either substrate offer very similar rates of conversion, however when looking at 2% Pd
plots, metals on Al2O3 substrate offered a much better rate of conversion than that of Pd on
E.coli. The difference in conversion rates suggests that the use of Pd on a bacterial
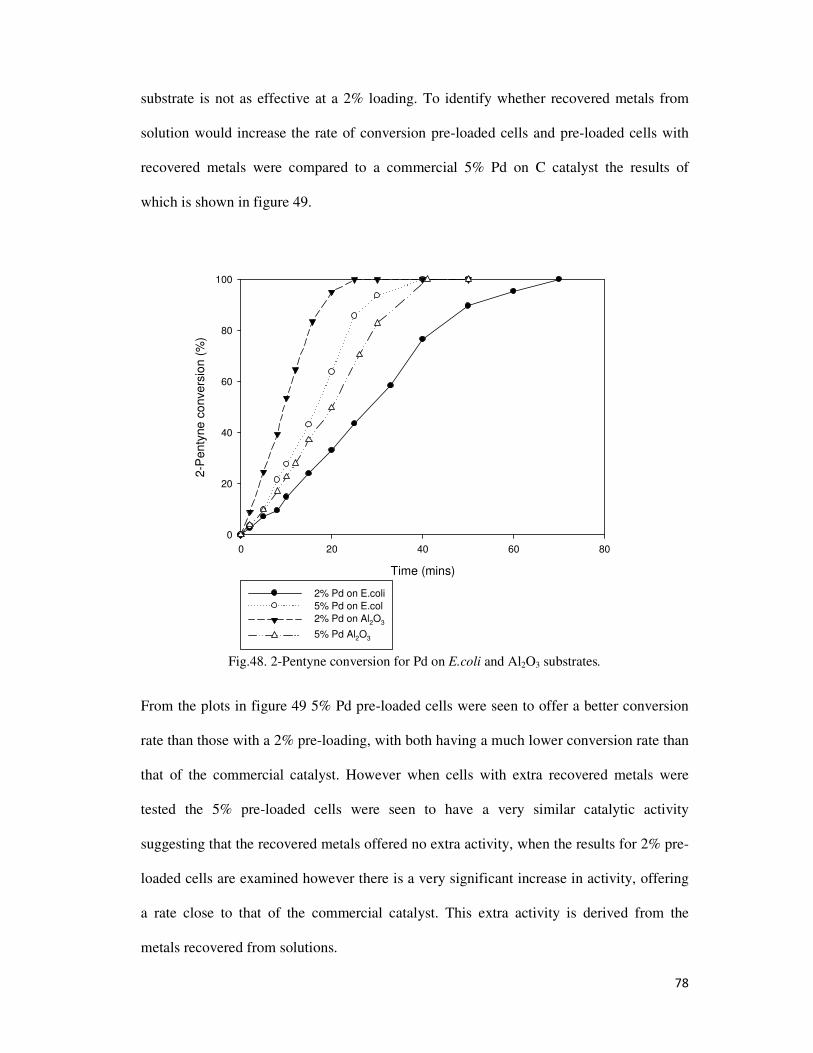
78
substrate is not as effective at a 2% loading. To identify whether recovered metals from
solution would increase the rate of conversion pre-loaded cells and pre-loaded cells with
recovered metals were compared to a commercial 5% Pd on C catalyst the results of
which is shown in figure 49.
Time (mins)
0 20 40 60 80
2-P
en
tyne
co
nvers
ion (
%)
0
20
40
60
80
100
2% Pd on E.coli
5% Pd on E.col
2% Pd on Al2O3
5% Pd Al2O3
Fig.48. 2-Pentyne conversion for Pd on E.coli and Al2O3 substrates.
From the plots in figure 49 5% Pd pre-loaded cells were seen to offer a better conversion
rate than those with a 2% pre-loading, with both having a much lower conversion rate than
that of the commercial catalyst. However when cells with extra recovered metals were
tested the 5% pre-loaded cells were seen to have a very similar catalytic activity
suggesting that the recovered metals offered no extra activity, when the results for 2% pre-
loaded cells are examined however there is a very significant increase in activity, offering
a rate close to that of the commercial catalyst. This extra activity is derived from the
metals recovered from solutions.
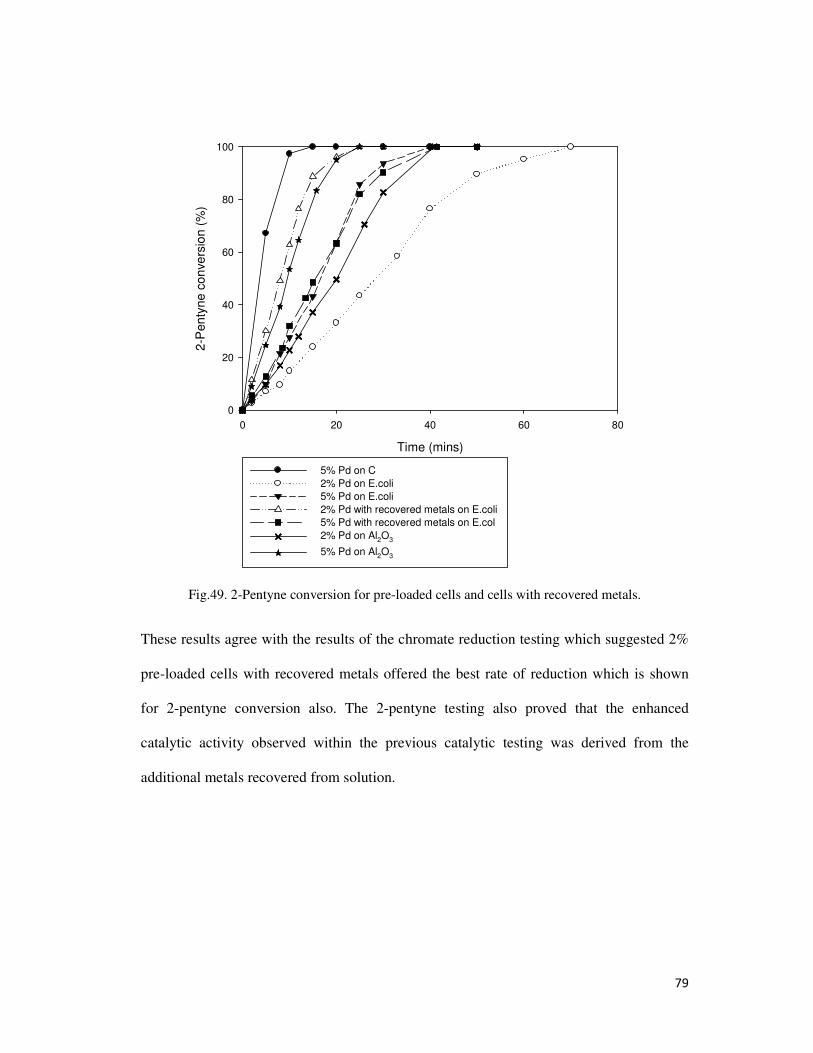
79
Time (mins)
0 20 40 60 80
2-P
en
tyn
e c
on
ve
rsio
n (
%)
0
20
40
60
80
100
5% Pd on C
2% Pd on E.coli
5% Pd on E.coli
2% Pd with recovered metals on E.coli
5% Pd with recovered metals on E.col
2% Pd on Al2O3
5% Pd on Al2O3
Fig.49. 2-Pentyne conversion for pre-loaded cells and cells with recovered metals.
These results agree with the results of the chromate reduction testing which suggested 2%
pre-loaded cells with recovered metals offered the best rate of reduction which is shown
for 2-pentyne conversion also. The 2-pentyne testing also proved that the enhanced
catalytic activity observed within the previous catalytic testing was derived from the
additional metals recovered from solution.
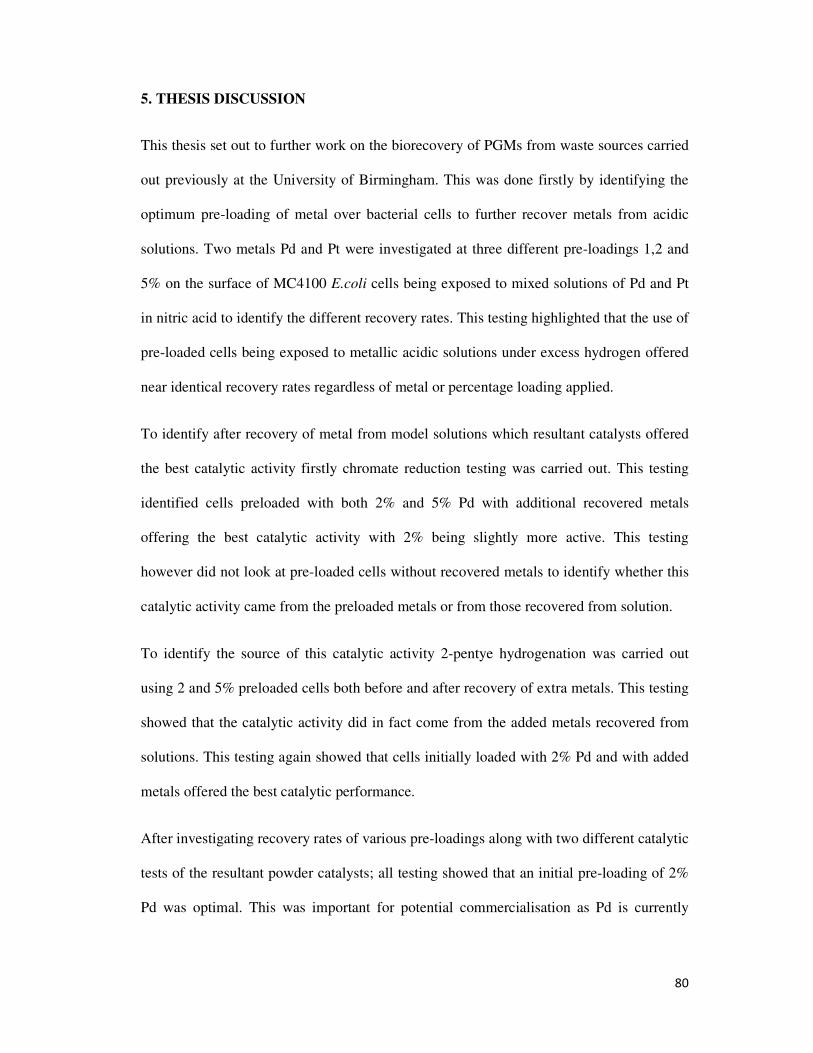
80
5. THESIS DISCUSSION
This thesis set out to further work on the biorecovery of PGMs from waste sources carried
out previously at the University of Birmingham. This was done firstly by identifying the
optimum pre-loading of metal over bacterial cells to further recover metals from acidic
solutions. Two metals Pd and Pt were investigated at three different pre-loadings 1,2 and
5% on the surface of MC4100 E.coli cells being exposed to mixed solutions of Pd and Pt
in nitric acid to identify the different recovery rates. This testing highlighted that the use of
pre-loaded cells being exposed to metallic acidic solutions under excess hydrogen offered
near identical recovery rates regardless of metal or percentage loading applied.
To identify after recovery of metal from model solutions which resultant catalysts offered
the best catalytic activity firstly chromate reduction testing was carried out. This testing
identified cells preloaded with both 2% and 5% Pd with additional recovered metals
offering the best catalytic activity with 2% being slightly more active. This testing
however did not look at pre-loaded cells without recovered metals to identify whether this
catalytic activity came from the preloaded metals or from those recovered from solution.
To identify the source of this catalytic activity 2-pentye hydrogenation was carried out
using 2 and 5% preloaded cells both before and after recovery of extra metals. This testing
showed that the catalytic activity did in fact come from the added metals recovered from
solutions. This testing again showed that cells initially loaded with 2% Pd and with added
metals offered the best catalytic performance.
After investigating recovery rates of various pre-loadings along with two different catalytic
tests of the resultant powder catalysts; all testing showed that an initial pre-loading of 2%
Pd was optimal. This was important for potential commercialisation as Pd is currently
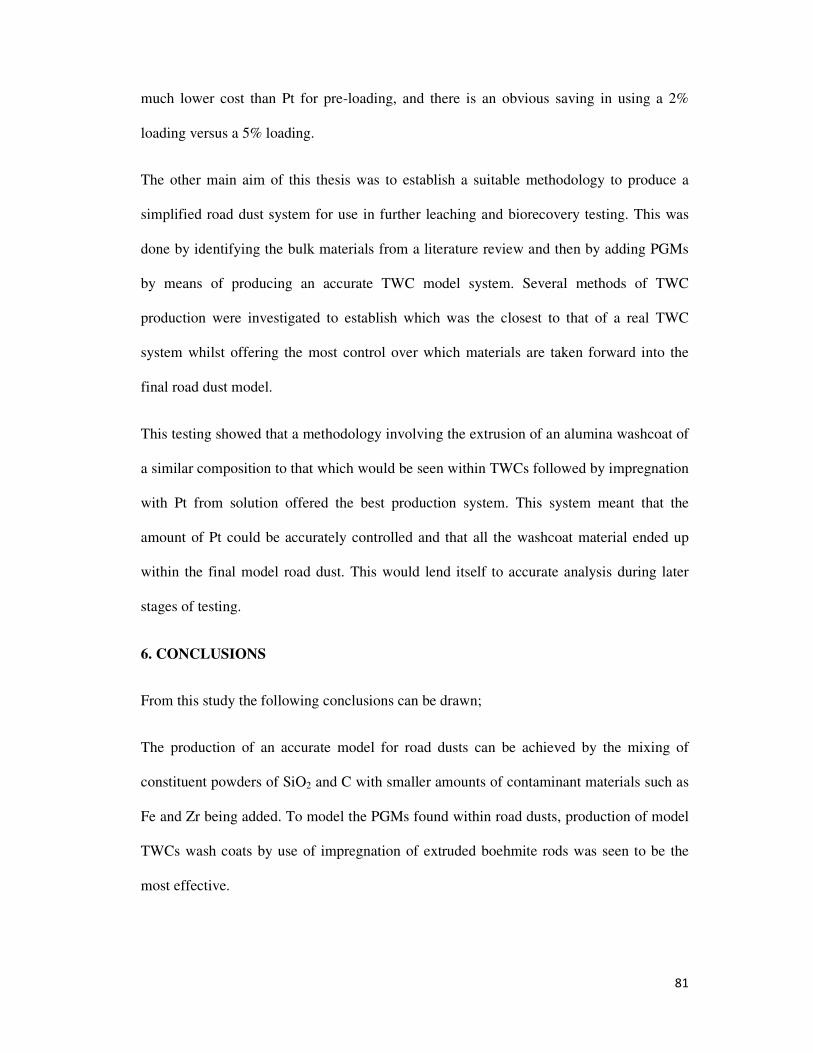
81
much lower cost than Pt for pre-loading, and there is an obvious saving in using a 2%
loading versus a 5% loading.
The other main aim of this thesis was to establish a suitable methodology to produce a
simplified road dust system for use in further leaching and biorecovery testing. This was
done by identifying the bulk materials from a literature review and then by adding PGMs
by means of producing an accurate TWC model system. Several methods of TWC
production were investigated to establish which was the closest to that of a real TWC
system whilst offering the most control over which materials are taken forward into the
final road dust model.
This testing showed that a methodology involving the extrusion of an alumina washcoat of
a similar composition to that which would be seen within TWCs followed by impregnation
with Pt from solution offered the best production system. This system meant that the
amount of Pt could be accurately controlled and that all the washcoat material ended up
within the final model road dust. This would lend itself to accurate analysis during later
stages of testing.
6. CONCLUSIONS
From this study the following conclusions can be drawn;
The production of an accurate model for road dusts can be achieved by the mixing of
constituent powders of SiO2 and C with smaller amounts of contaminant materials such as
Fe and Zr being added. To model the PGMs found within road dusts, production of model
TWCs wash coats by use of impregnation of extruded boehmite rods was seen to be the
most effective.
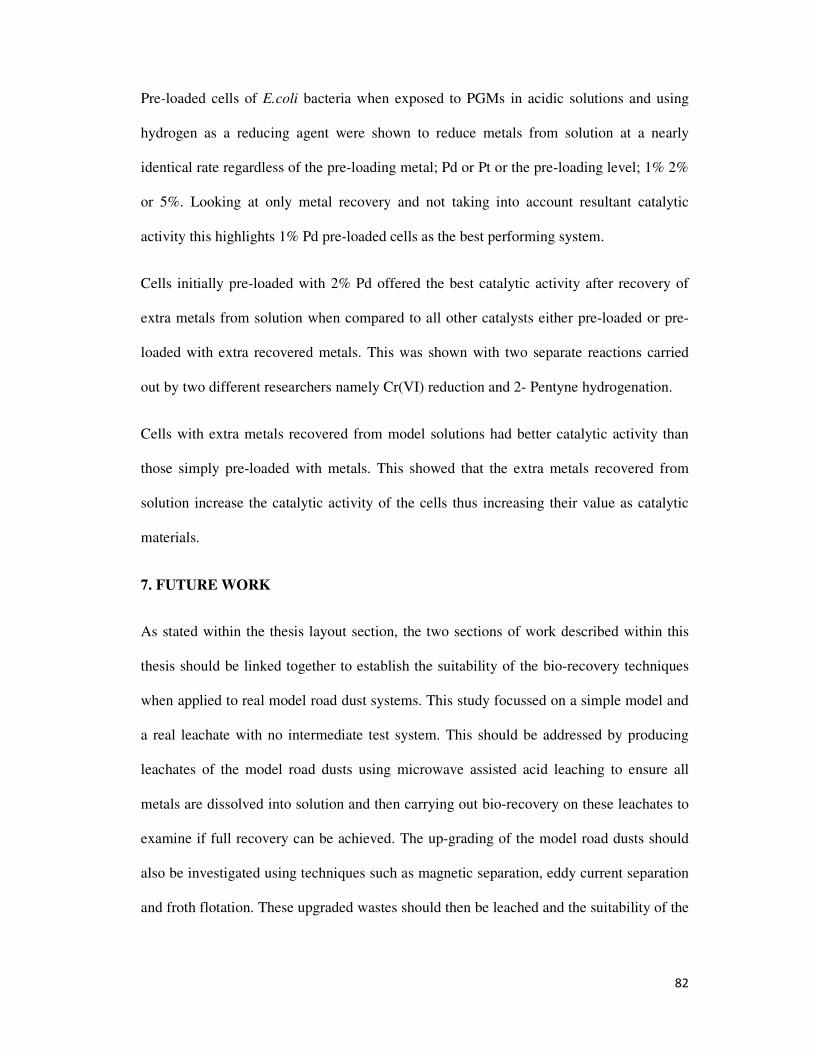
82
Pre-loaded cells of E.coli bacteria when exposed to PGMs in acidic solutions and using
hydrogen as a reducing agent were shown to reduce metals from solution at a nearly
identical rate regardless of the pre-loading metal; Pd or Pt or the pre-loading level; 1% 2%
or 5%. Looking at only metal recovery and not taking into account resultant catalytic
activity this highlights 1% Pd pre-loaded cells as the best performing system.
Cells initially pre-loaded with 2% Pd offered the best catalytic activity after recovery of
extra metals from solution when compared to all other catalysts either pre-loaded or pre-
loaded with extra recovered metals. This was shown with two separate reactions carried
out by two different researchers namely Cr(VI) reduction and 2- Pentyne hydrogenation.
Cells with extra metals recovered from model solutions had better catalytic activity than
those simply pre-loaded with metals. This showed that the extra metals recovered from
solution increase the catalytic activity of the cells thus increasing their value as catalytic
materials.
7. FUTURE WORK
As stated within the thesis layout section, the two sections of work described within this
thesis should be linked together to establish the suitability of the bio-recovery techniques
when applied to real model road dust systems. This study focussed on a simple model and
a real leachate with no intermediate test system. This should be addressed by producing
leachates of the model road dusts using microwave assisted acid leaching to ensure all
metals are dissolved into solution and then carrying out bio-recovery on these leachates to
examine if full recovery can be achieved. The up-grading of the model road dusts should
also be investigated using techniques such as magnetic separation, eddy current separation
and froth flotation. These upgraded wastes should then be leached and the suitability of the
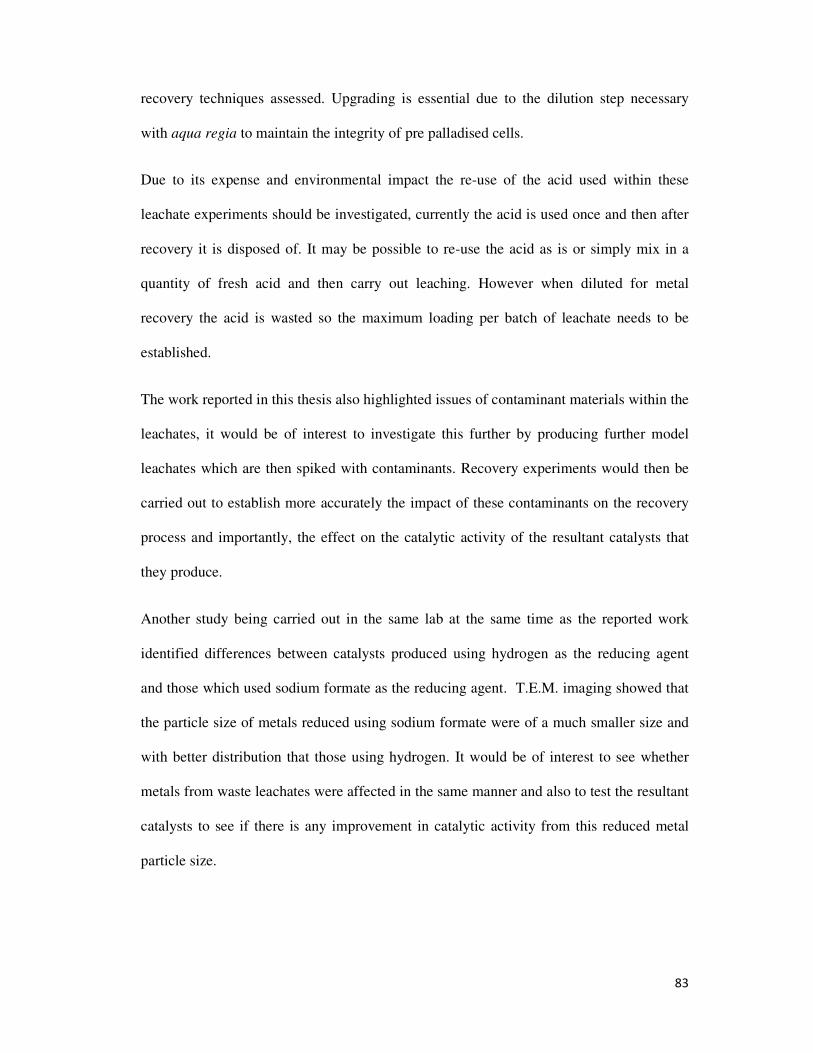
83
recovery techniques assessed. Upgrading is essential due to the dilution step necessary
with aqua regia to maintain the integrity of pre palladised cells.
Due to its expense and environmental impact the re-use of the acid used within these
leachate experiments should be investigated, currently the acid is used once and then after
recovery it is disposed of. It may be possible to re-use the acid as is or simply mix in a
quantity of fresh acid and then carry out leaching. However when diluted for metal
recovery the acid is wasted so the maximum loading per batch of leachate needs to be
established.
The work reported in this thesis also highlighted issues of contaminant materials within the
leachates, it would be of interest to investigate this further by producing further model
leachates which are then spiked with contaminants. Recovery experiments would then be
carried out to establish more accurately the impact of these contaminants on the recovery
process and importantly, the effect on the catalytic activity of the resultant catalysts that
they produce.
Another study being carried out in the same lab at the same time as the reported work
identified differences between catalysts produced using hydrogen as the reducing agent
and those which used sodium formate as the reducing agent. T.E.M. imaging showed that
the particle size of metals reduced using sodium formate were of a much smaller size and
with better distribution that those using hydrogen. It would be of interest to see whether
metals from waste leachates were affected in the same manner and also to test the resultant
catalysts to see if there is any improvement in catalytic activity from this reduced metal
particle size.
84
8. REFERENCES
[1] Johnson Matthey “Platinum 2009” Market Review Press Release
http://www.platinum.matthey.com/uploaded_files/Pt2009/pressrelease070509ozfinal1.pdf
[2] R. H. Borgwardt, Platinum, Fuel Cells and Future US Road Transport. 2001.
[3] Going platinum: trends in platinum supply and demand, Focus on Catalysts
Volume 2007, Issue 9, September 2007, Pages 1-2.
[4] D. Cinti, M. Angelone, U. Masi, C. Cremisini, Platinum levels in natural and urban
soils from Rome and Latium (Italy): significance for pollution by automobile catalytic
converter, The Science of the Total Environment 293 (2002) 47–57.
[5] J. Schafer, H. Puchelt, Platinum-Group-Metals (PGM) emitted from automobile
catalytic converters and their distribution in roadside soils, Journal of Geochemical
Exploration 64 (1998) 307–314.
[6] B. Gomez, M. Gomez, J. L. Sanchez, R. Fernandez, M. A. Palacios, Platinum and
rhodium distribution in airborne particulate matter and road dust, The Science of the Total
Environment 269 (2001) 131-144
[7] A. J. Murray, I. P. Mikheenko, E. Goralska, N. A. Rowson, L. E. Macaskie,
Biorecovery of Platinum Group Metals from Secondary Sources, Advanced Materials
Research. Vols. 20-21 (2007), p. 651.
[8] L. E. Macaskie, I. P. Mikheenko, P. Yong, K. Deplanche, A. J. Murray, M. Paterson-
Beedle, V. S. Coker, C. I. Pearce, R. A. D. Pattrick, D. Vaughan, G. van der Laan, J. R.
Lloyd, Today’s Wastes, Tomorrow’s Materials for Environmental Protection, Advanced
Materials Research (Volumes 71 - 73) (2009) 541-548
85
[9] H. Bode (Ed.), Materials Aspects in Automotive Catalytic Converters, Wiley/VCH,
Weinheim, Germany, (2002) 1–281.
[10] Harris, D. C. Cabri L. J. "Nomenclature of platinum-group-element alloys; review and
revision". The Canadian Mineralogist 29 (2) (1991) 231–237.
[11] A. Conradie, “Platinum Group Metal Mines in South Africa 2009”, Dept. Minerals
and Energy (2009)
[12] http://www.platinum.matthey.com/pgm-prices/price-charts/ Accessed 05.09.11
[13] Williamson, Alan. "Russian PGM Stocks". The LBMA Precious Metals Conference
2003. The London Bullion Market Association.
[14] Merchant Research & Consulting Ltd. “Platinum group metals market review” Feb.
2011.
[15] http://www.resourceinvestor.com/News/2011/6/Pages/Whats-Driving-Platinum.aspx
Accessed 04.09.11.
[16] http://www.oilngold.com/ong-focus/insights/weak-job-data-resumed-golds-rally-
signaled-pgms-will-continue-to-underperform-2011090319040/ Accessed 05.09.11.
[17] Johnson Matthey “Platinum 2011” Market Review Press Release
http://www.platinum.matthey.com/uploaded_files/PT_2011/complete_publication.pdf
[18] J. C. Guibet, E. Faure-Birchem, Fuels and Engines: Technology, Energy,
Environment, vol. 1, Editions Technip, Paris, (1999), 1–385.
[19] K. C. Taylor, Automobile catalytic converters, in: J. R. Anderson, M. Boudart (Eds.),
Catalysis—Science and Technology, Springer, Berlin, (1984), Chapter 2, 119–170.
86
[20] P. Degobert, Automobiles and Pollution, Society of Automotive Engineers, Inc.,
Warrendale, PA, 1995.
[21] R. N. Das, C. D. Madhusoodana, K. Okada, Rheological studies on cordierite
honeycomb extrusion, Journal of the European Ceramic Society 22 (2002) 2893-2900.
[22] http://www.thedailygreen.com/living-green/blogs/cars-transportation/lead-gasoline-
catalytic-converters-pollution-461219 Accessed 03.09.11.
[23] J. Kaspar, P. Fornasiero, N Hickey, Automotive catalytic converters: current status
and some perspectives, Catalysis Today 77 (2003) 419–449.
[24] M. L. Mussman, Single layer high performance catalyst, United States Patent
Application Publication (2001)US 2001/ 0046941A1.
[25] J. P. Cuif, G. Blanchard, O. Touret, A. Seigneurin, M. Marczi, E. Quémeré, SAE
Paper 970463, 1997.
[26] T. N. Angelidis, S. A. Sklavounos, A SEM-EDS study of new and used automotive
catalysts, Applied Catalysis A: General 133 (1995) 121-132.
[27] http://www.waste-management-world.com/index/display/article-
display/0491165612/articles/waste-management-
world/recycling/2011/03/Recycling_Road_Sweeper_Waste_Turns_Cost_into_Opportunity
_.html Accessed 09.04.11.
[28] Hanna Boogaard , Denise R. Montagne, Alexander P. Brandenburg, Kees Meliefste,
Gerard Hoek , Comparison of short-term exposure to particle number, PM10 and soot
concentrations on three (sub) urban locations, Science of The Total Environment, Vol. 408
(2010) 4403-4411.
87
[29] María Laura López, Sergio Ceppi, Gustavo G. Palancar, Luis E. Olcese,
Germán Tirao, Beatriz M. Tosellia, Elemental concentration and source identification of
PM10 and PM2.5 by SR-XRF in Córdoba City, Argentina, Atmospheric Environment,
Vol.45 (2011) 5450-5457.
[30] Menno Keuken, Peter Zandveld, Sef van den Elshout, Nicole A. H. Janssen, Gerard
Hoek, Air quality and health impact of PM10 and EC in the city of Rotterdam, the
Netherlands in 1985–2008, Atmospheric Environment, Vol.45, (2011) 5294-5301.
[31] B. Artı�ñano, P. Salvador, D. G. Alonso, X. Querol, A. Alastuey, Influence of traffic
on the PM10 and PM2.5 urban aerosol fractions in Madrid (Spain), Science of The Total
Environment, Vols. 334-335 (2004), 111-123.
[32] Giovanni Lonati, Michele Giugliano, Size distribution of atmospheric particulate
matter at traffic exposed sites in the urban area of Milan (Italy), Atmospheric
Environment, Vol.40, (2006), 264-274.
[33] Bin Han, Zhipeng Bai, HongLiang Ji, Guanghuan Guo, Fang Wang, Guoliang Shi,
Xiang Li, Chemical characterizations of PM10 fraction of paved road dust in Anshan,
China, Transportation Research Part D, Vol. 14, (2009) 599-603.
[34] K. F. Ho, S. C. Lee, Judith C. Chow, John G. Watson, Characterization of PM10 and
PM2.5 source profiles for fugitive dust in Hong Kong, Atmospheric Environment, Vol. 37,
(2003), 1023-1032.
[35] F. Amato, M. Pandolfi, M. Viana, X. Querol, A. Alastuey, T. Moreno, Spatial and
chemical patterns of PM10 in road dust deposited in urban environment, Atmospheric
Environment, Vol. 43, (2009), 1650-1659.
88
[36] J.D Whiteley, F Murray, Anthropogenic platinum group element (Pt, Pd and Rh)
concentrations in road dusts and roadside soils from Perth, Western Australia, Science of
the Total Environment, Vol. 317, (2003) 121-135.
[37] Farago M. E. ,Kavanagh P., Blanks R.,Kelly J., Kazantzis G, Thornton I, Platinum
concentrations in urban road dust and soil and in blood and urine in the United Kingdom,
The Analyst (1998)Vol. 123, 451–454.
[38] Gomez B, Gomez M, Sanchez J. L., Fernandez R, Palacios M. A., Platinum and
rhodium distribution in airborne particulate matter and road dust, Science of the Total
Environment, (2001), 131–144.
[39] Hutchinson E. J., Farago M. E., Simpson P. R.. Changes in Platinum Emissions from
Motor Vehicles, Anthropogenic platinum-group element emissions, (1999), 57–64.
[40] J. Schäfer, H. Puchelt, Platinum-Group-Metals (PGM) emitted from automobile
catalytic converters and their distribution in roadside soils, Journal of Geochemical
Exploration, Vol. 64, (1998), 307-314.
[41] Jarvis KE, Parry SJ, Piper JM. Temporal and spatial studies ofautocatalyst-derived
platinum, rhodium and palladium and selectedvehicle derived trace elements in the
environment, Environmental Science, Vol. 36,(2001),1031–6.
[42] M.T. Jackson , J. Sampson, H.M. Prichard, Platinum and palladium variations through
the urban environment: Evidence from 11 sample types from Sheffield, UK, Science of the
Total Environment, (2007), 117-131.
[43] Lloyd, J. R., Microbial reduction of metals and radionuclides, FEMS Microbiology
Review, 27 (2003) 411–425.
89
[44] Lloyd, J. R., Yong, P. & Macaskie, L. E., Enzymatic recovery of elemental palladium
by using sulfate-reducing bacteria, Applied Environmental Microbiology 64, (1998) 4607–
4609.
[45] De Luca, G., de Philip, P., Dermoun, Z., Rousset, M. & Verme´ glio, A., Reduction of
technetium(VII) by Desulfovibrio fructosovorans is mediated by the nickel-iron
hydrogenase, Applied Environmental Microbiology, 67, (2001), 4583–4587.
[46] Kevin Deplanche, Isabelle Caldelari, Iryna P. Mikheenko,Frank Sargent & Lynne E.
Macaskie, Involvement of hydrogenases in the formation of highly catalytic Pd(0)
nanoparticles by bioreduction of Pd(II) using Escherichia coli mutant strains,
Microbiology, 156, (2010), 2630–2640
[47] Deplanche, K. & Macaskie, L. E., Biorecovery of gold by Escherichia coli and
Desulfovibrio desulfuricans, Biotechnology Bioengineering, 99, (2008), 1055–1064.
[48] Lovley, D. R., Dissimilatory metal reduction, Annual Review Microbiology, 47,
(1993), 263–290.
[49] Larsson, P., Olka, L. & Tranvik, L. Microbial degradation of xenobiotic, aromatic
pollutants in humic water, Applied Environmental Microbiology, 54,(1988), 1864–1867.
[50] Kashefi, K., Tor, J. M., Nevin, K. P. & Lovley, D. R., Reductive precipitation of gold
by dissimilatory Fe(III)-reducing Bacteria and Archaea, Applied Environmental
Microbiology, 67, (2001), 3275–3279.
[51] Deplanche, K., New nanocatalysts made by Bacteria from metal solutions and
recycling of metal wastes. PhD thesis, The University of Birmingham, UK (2008).
90
[52] Deplanche, K.; Mikheenko, I.P.; Bennett, J.A.; Merroun, M.; Mounzer, H.; Wood, J.
& Macaskie, L.E., Selective Oxidation of Benzyl-Alcohol over Biomass-Supported Au/Pd
Bioinorganic Catalysts, Topics in Catalysis, in press (2010).
[53] Yong, P; Mikheenko, I.P.; Deplanche, K; Redwood, M.D. & Macaskie, L.E.,
Biorefining of precious metals from wastes: an answer to manufacturing of cheap
nanocatalysts for fuel cells and power generation via an integrated biorefinery,
Biotechnology Letters, vol 32, (2010), 1821-1828.
[54] Mabbett, AN; Sanyahumbi, D; Yong, P, Macaskie, LE, Biorecovered precious metals
from industrial wastes: Single-step conversion of a mixed metal liquid waste to a
bioinorganic catalyst with environmental application, Environmental Science and
Technology, vol 40, (2006) 1012-1021.
[55] Bennett, J.A.; Creamer, N.J.; Deplanche, K.; Macaskie, L.E.; Shannon, I.J. & Wood,
J., Palladium supported on bacterial biomass as a novel heterogeneous catalyst: A
comparison of Pd/Al2O3 and bio-Pd in the hydrogenation of 2-pentyne, Chemical
engineering science, Vol 22, (2010) 282-291.
[56] Kubitschek HE, "Cell volume increase in Escherichia coli after shifts to richer
media", Journal of Bacteriology, 172, (1990) 94–101.
[57] Ingledew WJ, Poole RK, "The respiratory chains of Escherichia coli", Microbiology
Review, 48, (1984), 222–271.
[58] Fotadar U, Zaveloff P, Terracio L., "Growth of Escherichia coli at elevated
temperatures". Journal of Basic Microbiology, 45 (2005), 403–404.
91
[59] Murray, A.J.; Mikheenko, I.P.; Goralska, E.; Rowson, N.A. & Macaskie L.E.,
Biorecovery of platinum group metals from secondary sources, Advanced Materials
Research, Vol. 20-21, (2007), 651-654.
[60] Taylor, S.; Murray, A.J.; Blackburn, S. & Macaskie, L.E., The recovery of Platinum
group metals from model solutions and fabrication into new catalysts. Trans Non-ferrous
Metals Society of China, in press (2011).
[61] Creamer, N.J.; Baxter-Plant, V.S.; Henderson, J.; Potter, M. & Macaskie, L.E.,
Palladium and gold removal and recovery from precious metal solutions and electronic
scrap leachates by Desulfovibrio desulfuricans, Biotechnology Letters, Vol. 28,
(2006),1475-1484.
[62] Gauthier, D.; Søbjerg, L. S.; Jensen, K. M.; Lindhardt, A. T.; Bunge, M.; Finster, K.;
Meyer, R. L. & Skrydstrup. T., Environmentally Benign Recovery and Reactivation of
Palladium from Industrial Waste by Using Gram-Negative Bacteria, ChemSusChem, Vol.
3, (2010), 1036–1039.
[63] R. N. Das, C. D. Madhusoodana, K. Okada, Rheological studies on cordierite
honeycomb extrusion, Journal od the European Ceramic Society 22 (2002) 2893-2900.
[64] J. B. R. Neto, R. Moreno, Effect of mechanical activation on the rheology and casting
performance of kaolin/talc/alumina suspensions for manufacturing dense cordierite bodies,
Applied Clay Science, Volume 38, Issues 3-4, February 2008, Pages 209-218
[65] J. Kaspar, P. Fornasiero, N Hickey, Automotive catalytic converters: current status
and some perspectives, Catalysis Today 77 (2003) 419–449.
[66] C. Wan, J. Dettling, K. Jagel, Three Way Catalyst for Lean Exhaust Systems, United
States Patent Application Publication (1997) Patent No. 4,687,770
92
[67] J. Wei, K. Wassermann, Y. Li, Gasoline Engine Emission Systems Having Particulate
Traps, United States Patent Application Publication (2009) US 2009/0193796A1.
[68] L. Mussman, D. Linder, M Votsmeier, E. Lox, T. Kreuzer, Single layer high
performance catalyst, United States Patent Application Publication (2001)US 2001/
0046941A1.
[69] www.multimap.com. Accessed 23.03.11
[70] A.Boumaza, L.Favaro, J.Le´dion, G.Sattonnay, J.B.Brubach, P.Berthet, A.M.Huntz,
P.Roy, Transition alumina phases induced by heat treatment of boehmite: An X-ray
diffraction and infrared spectroscopy study, Journal of Solid State Chemistry, vol 182,
(2009), 1171-1176.
[71] Personal correspondence with I. Mikheenko. 17.05.10
[72] Personal correspondence with K. Deplanche. 09.03.11
93
9. APPENDIX
Appendix 1. Cell Preparation Methodology
Instructions for preparation of 12L of Cells and Subsequent Powdered Catalyst
1. Aerobic Growth Media Preparation
Prepare 500ml of aerobic growth media
Add 7.5g nutrient broth no.2 to 500ml distilled water
Use a magnetic stirrer to ensure powder is fully dissolved
Pour 200ml into one 200ml vial, seal with a foam bung and the rest split into glass universal tubes
approx 2/3 full
Place into an autoclave allow to reach 120°C and leave for 1 hour
2. Anaerobic Growth Media Preparation
Prepare approx 14ltr of anaerobic growth media
Take 7 x 2ltr bottles to each bottle add 15g/L nutrient broth no.2, 5ml/L glycerol and 4g/L sodium
fumarate and approx 1.9ltr of distilled water (this will be below the 2l mark as 200ml of cell
culture will be added later)
Use a magnetic stirred to ensure powder is fully dissolved
Take one 2ltr bottle and distribute it between 6 x 200ml bottles (anaerobic cell starter culture)
Seal all bottles using rubber bungs and caps
Using syringes and rubber tubing connect all bottles in series and degas using a vacuum pump for
1 hour
Place all bottles into an autoclave allow to reach 120°C and leave for 1 hour.
3. Small Inoculation
A Bunsen burner should be lit and all work carried out near to the flame to reduce contamination
A petri dish containing e.coli culture MC4100 should be taken from the fridge
A wire with a loop formed on the end should be taken and passed through the flame of the
Bunsen burner so that it becomes red hot to sterilise it
Allow the loop to cool and use it to remove a large culture of e.coli from the petri dish
Transfer this culture of e.coli into a universal tube containing aerobic media
Seal the universal tube passing the neck through the Bunsen flame to keep free from
contamination
Place the universal tube in a vibrating incubator at 37°C and 180rpm and leave for approx 14
hours
4. Transfer to Larger Batches
A Bunsen burner should be lit and all work carried out near to the flame to reduce contamination
Using a 20ml syringe transfer 20ml of the media from the universal tube to the 200ml flask of
aerobic media
Place the flask into vibrating incubator (T101) at 37°C and 180rpm for 4 hours
After 4 hours using a 20ml syringe transfer 20ml from the flask into each of the 6x200ml
anaerobic bottles
The 6 bottles should then be left overnight in a 37°C environment
94
One 200ml bottle should be placed upside down in a clamp stand and connected to one 2ltr
anaerobic bottle using rubber tubing and needles
Nitrogen should be pumped into the small bottle to force the liquid out
If needed a vacuum pump should be attached to the larger bottle to draw through the last of the
liquid
Repeat this process for all 6 x 2ltr bottles
Connect all 6 x 2 bottles together in series using rubber tubing and degas using a vacuum pump
for 30 minutes (tapping each bottle occasionally with a spatula), then pressurise with nitrogen for
15 minutes
Place bottles in a 37°C environment and leave overnight
5. Centrifugation of live cells
Prepare 2ltr 20μgMOPSPh7.0 buffer(add 8.36g of MOPS to 2ltr distilled water)
Use a magnetic stirrer to ensure it is fully dissolved
Open one 2ltr bottle of cultures and distribute evenly between 6 centrifuge tubes
Weigh each tube and separate into pairs of equal weight (must be exactly equal weights)
Place tubes into centrifuge with pairs opposite each other, centrifuge at 7000rpm and 4°C for 10
minutes
Discard substrate and collect cultures (pour off liquid)
Repeat until all 6 2ltr bottles have been centrifuged
Collect all cultures into one tube and re-suspend in 20μgMOPSPh7.0
Centrifuge at 7000rpm and 4°C for 10 minutes
Discard substrate
Repeat three times to wash the cultures
Suspend washed cultures in 150ml of 20μgMOPSPh7.0
Transfer washed cultures into 200ml bottle and seal with a rubber bung
Take 3 x 1ml samples into cuvettes
Degas 200ml bottle with a vacuum pump
Pressurise bottle with hydrogen for 15 minutes
Calculate the cell density using the following equation (a good value is between 20-30mg/ml)
Average optical density X 0.482 X 100 = Mass of cells (mg) per ml
6. Palladisation of live cells
Prepare 0.01mM nitric acid (add 630µl concentrated nitric acid to 1 litre of distilled water)
Prepare 2mM Pd solution
Add 588.38mg sodium tetrachloropalladate to 1 litre 0.01mM nitric acid (2mM)
Stir with magnetic stirrer until all powder is dissolved
pH should be approximately 2.0
Using the mass of the cells calculate the required amount of Pd solution for the desired metal
loading i.e. 5% (e.g. 5mg of metal to 95mg of cells, etc.)
Transfer the required Pd solution into a glass bottle seal with a rubber bung and silver crimp lid
Degas using a vacuum pump and pressurise with nitrogen
Transfer the Pd solution into the bottle containing the live cells
Suspend the Pd solution bottle upside down in a clamp stand
95
Connect to the culture bottle using rubber tubing
Nitrogen should be pumped into the Pd solution bottle to force the liquid out
Degas the bottle and saturate with hydrogen, bubbling through solution for 30 minutes (shaking
periodically) then leave pressurised under hydrogen
Place bottle in a 30°C environment and leave overnight
A stannous chloride test is used to check full reduction of metal
Prepare stannous chloride (add 29.9g SnCl2 to 500ml concentrated hydrochloric acid)
Use a magnetic stirrer to ensure all powder is dissolved
Take 200µl of sample solution
Add 800µl SnCl2 solution in a cuvette
Leave for one hour for colour change to develop
Analyse in a photspectrometer wavelength 463nm
7. Centrifugation of palladised cells
Transfer palladised cells into centrifuge tubes
Weigh each tube and separate into pairs of equal weight
Place tubes into centrifuge with pairs opposite each other, centrifuge at 7000rpm and 4°C for 10
minutes
Discard substrate and collect cultures
Collect all cultures into one tube and re-suspend in 20μgMOPSPh7.0
Centrifuge at 7000rpm and 4°C for 10 minutes
Discard substrate
Repeat three times to wash the cultures
Re-suspend in a known volume of water (e.g. 30mls)
8. Recovery of metal from model solution
Prepare a mixed solution of 0.42mM Pd and 0.34mM Pt in 0.01mM nitric acid
pH should be 2.0
Calculate the required amount of mixed solution to achieve desired final metal loading e.g. 20%
Add required volume of cell culture to the volume of mixed solution in a glass bottle and sealed
with a rubber bung
Degas the bottle using a vacuum pump
Bubble hydrogen through the solution within the bottle for 5 minutes
A stannous chloride test should be used to establish full reduction of metals from solution using a
wavelength of 419nm
If not fully reduced bubble further hydrogen through solution
9. Centrifugation of Bio-Pd
Transfer palladised cells into centrifuge tubes
Weigh each tube and separate into pairs of equal weight
Place tubes into centrifuge with pairs opposite each other, centrifuge at 7000rpm and 4°C for 10
minutes
Discard substrate and collect cultures
Collect all cultures into one tube and re-suspend in 20μgMOPSPh7.0
Centrifuge at 7000rpm and 4°C for 10 minutes
Discard substrate
96
Repeat twice to wash the cultures
Re-suspend in acetone
Centrifuge at 7000rpm and 4°C for 10 minutes then leave open to dry in a fume cupboard
10. Preparation of Powdered Bio-catalyst
Grind resultant pellet using an agate pestle and mortar
Pass through a fine fraction sieve
Re-grind any larger fractions
Weigh samples
Appendix 2. Outreach Activities
During this study, I also took part in a schools outreach project wasteintoenergy. We
presented an interactive road show to over 600 children in 10 schools around the west
midlands area. This was done to introduce the work and research done at the university to
inner city underprivileged children to help promote science and engineering and increase
the children’s interest in these subjects.
97
Appendix 3. Conference Presentations & Publications
3.1. 2011 International Biohydrometallury Symposium Paper
The recovery of Platinum group metals from model
solutions and fabrication into new catalysts
Scott Taylora, Angela J. Murray
b
[email protected], [email protected],
Stuart Blackburna, Lynne E. Macaskie
b
[email protected], [email protected],
a: School of Chemical Engineering, University of Birmingham, Edgbaston, Birmingham, B15 2TT, U.K. b: School of Biosciences, University of Birmingham, Edgbaston, Birmingham, B15 2TT, U.K.
ABSTRACT
Cells of Escherichia coli were cultured and “pre-metallised” using two different metals (Pd or Pt),
at three different loadings 1wt%, 2wt% and 5wt% dry biomass. With the broad aim to recover
precious metals from wastes, these metallised cells were then exposed to a mixed Pd and Pt
solution under H2 to produce biocatalysts; the ability of the pre-metallised cells to reduce the target
metals from solution was assessed by use of SnCl2 assay. This showed that all cells reduced metals
from solution in less than 2 minutes. The catalytic activity of the resultant biocatalysts was
assessed by Cr (VI) reduction, showing that either a 2% or 5% initial pre-loading of Pd offered the
best catalytic activity. Since moving the process towards commercial metal recovery and
biomanufacture of new catalysts from wastes is the dual goal the economic benefit of using a 2%
pre loading suggests this as the best option.
Keywords: Bioremediation, E. coli, Platinum, PGM, Road dust
INTRODUCTION
Platinum group metals (PGMs) are scarce high value metals with an ever increasing demand and a large range of applications from jewellery to use within car catalytic converters due to their catalytic properties[1]. To ensure future supplies of PGMs it is increasingly important to recover lost metals. All new motor vehicles are fitted with a catalytic converter, and during use the catalytic metals on the surface are abraded away and become deposited within road dust [2,3]. The PGM levels found within some road
98
dusts have been shown to be equivalent to that of an ore from a low grade mine [4]. The ability of Escherichia coli bacteria to reduce metals onto their surface through
hydrogenase activity is well documented [5]; this ability has been exploited to create “biocatalysts” comprising bacterial cells coated with a well distributed layer of metallic nano-particles (NPs) [6]. Both single metal and bi-metallic NPs have previously been investigated [7]; other studies have shown the possibility of using recovered metals from waste sources such as road dust to produce these “biocatalysts”[8].
Pre-metallised cells are used as inorganic catalysts to recover metals from leachates of waste due to the strength of acid required to dissolve PGMs, which is incompatible with biochemical activity. To circumvent this bacteria were allowed to reduce Pd(II) to Pd(0) under physiologically compatible conditions. These pre-metallised cells then functioned as chemical catalysts in the recovery of PGMs from highly acidic solutions [9]. The first aim of this study is to use model solutions to identify the best metal and metal loading for use in the recovery of target metals from solution.
In previous studies it had been noted that Pd(0) NP biocatalysts from different batches of cells had different catalytic activities, however these batches were produced at different times and the inter batch variability could not be assessed as the methods were not closely controlled. This study produced several batches of cells using identical methods at the same time and from the same initial cell culture to investigate whether there were significant differences between batches.
Pre-metallised cells having a loading of 1wt% 2wt% and 5% Pd and 1wt% 2wt% and 5wt% Pt were exposed to solutions of mixed Pd/Pt to establish rates of reduction using five different batches. The second aim of the study was to compare the efficacy of the biocatalysts following target metal recovery, via the reduction of Cr (VI) to Cr (III). Anticipating significant waste upgrading at the upstream metallurgical processing stage [10] solutions were also prepared at higher concentrations than would be experienced in the initial wastes, to establish the cell capacity for higher target metal concentrations.
Materials AND MethodS
Preparation of cells
Escherichia coli MC4100 cells were cultured in 12 litres of nutrient broth under anaerobic conditions [11]. Cells were harvested by centrifugation, washed three times in MOPS-NaOH buffer buffer pH 7.0 and resuspended in a known volume of buffer. The cell density was checked at an optical density (OD) of 600nm; the OD600 was converted to bacterial dry weight by a previously determined calibration. With a dry weight of cells between 20-30 mg/ml the cell cultures were then split into six aliquots in preparation for pre-metallisation
Pre-metallisation of cells
Solutions of 2 mM Pd and Pt were prepared in 1 mM HNO3 using Na2PdCl4 and K2PtCl4 salts respectively. The required volume of solution was calculated then added to aliquots of cells to achieve the desired varied metal loadings, H2 was bubbled through the suspension for 30 minutes and suspensions were incubated at 30ºC to allow reduction of metal onto the cells. Metal reduction was confirmed by sampling the solution, centrifuging and carrying out a SnCl2 assay described previously [12] on the supernatant. Following full reduction of metals cells were harvested by centrifugation, washed once using distilled

99
water and then resuspended in 30 ml of distilled water.
Recovery of target metals from model solution
After cell culturing, batches of cells were split into 6 aliquots and exposed to 2 mM solutions of Pd and Pt in the correct volume as above to give metal loadings of 5% 2% and 1% on the cells. With the cells pre-loaded to the desired levels samples of 16 mg of cells were then exposed to a mixed solution of 0.34 mM Pt and 0.42 mM Pd (target metal solution) which gave final metal loadings after reduction of 15wt%, 16wt% and 20wt%.
Hydrogen was again used as a reducing agent, here via catalysis due to metals already present rather than hydrogenase activity. Samples were taken at 0, 0.5, 1, 2 and 5 minutes, and a SnCl2 assay test was carried out. The results were expressed as percentage target metal reduction against time. Following full reduction the cells were harvested by centrifugation, washed once in H2O and once in acetone, dried and ground in an agate mortar. The resultant powder was passed through a 100 micron sieve to obtain a fine powder catalyst.
Catalytic testing (Chromate reduction)
10 mg of catalyst prepared as described above was accurately weighed and added to a 12 ml serum bottle. 5 ml 0.5 mM NaCrO4.4H2O in 20 mM MOPS-NaOH buffer pH 7.0 was then added; the bottle was then sealed with a butyl rubber stopper. The bottle was degassed under vacuum, sparged with nitrogen for anaerobiosis and placed onto a rotary shaker (10 min) to ensure good mixing and distribution of catalyst. Sodium formate (1 ml; 25 mM as added) was added, the bottle was left bubbling under nitrogen to maintain anaerobic conditions and placed on a shaker (180 rpm). Samples were taken at 30 minute intervals, centrifuged (13000 rpm; 4 min) and then analysed using a diphenylcarbazide (DPC) assay method as described previously [13].
Results and discussion
Metal reduction
The yellow target metal solution before reduction had a peak wavelength of 401 nm and the Pt solution a peak of 463 nm. Hence, A419 nm was used to assess the reduction of metals from solution. The colour of the solution was an accurate representation of metal concentration as established by samples analysed using SnCl2 and cross analysed polarographically and by commercial validation [11]. Figure 1 shows the reduction of the target metals from the mixture.
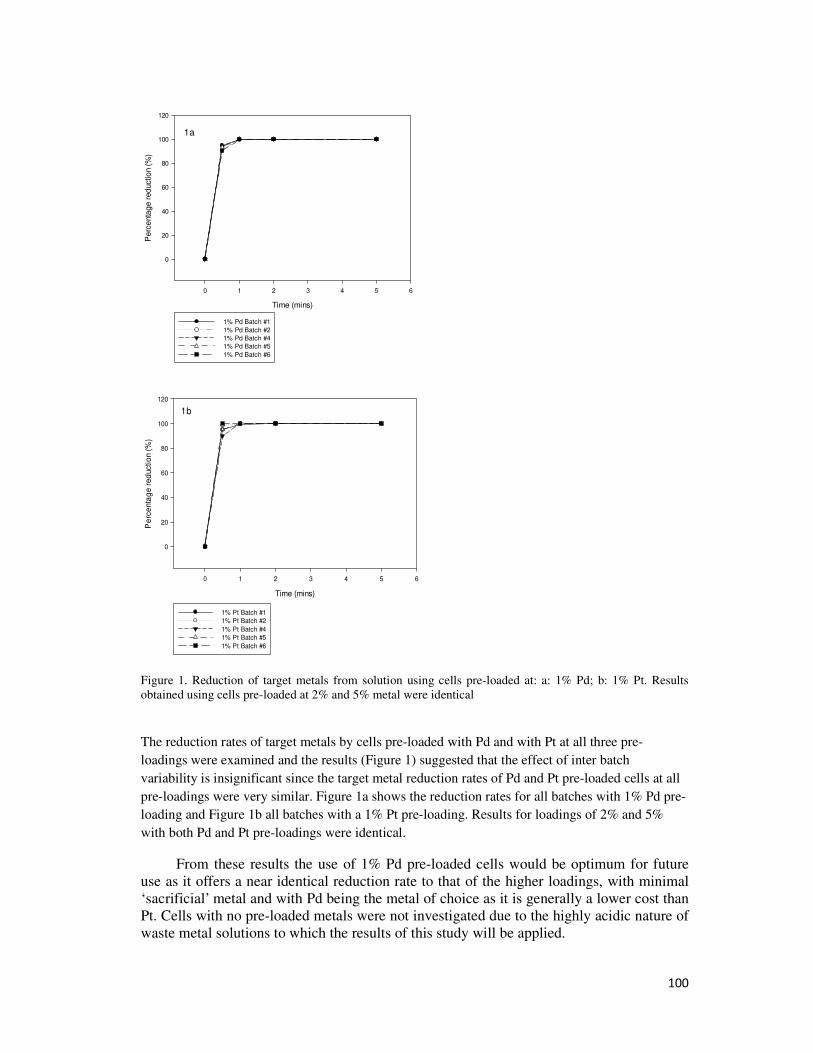
100
Time (mins)
0 1 2 3 4 5 6
Pe
rce
nta
ge
red
uctio
n (
%)
0
20
40
60
80
100
120
1% Pd Batch #1
1% Pd Batch #2
1% Pd Batch #4
1% Pd Batch #5
1% Pd Batch #6
1a
Time (mins)
0 1 2 3 4 5 6
Pe
rce
nta
ge
re
ductio
n (
%)
0
20
40
60
80
100
120
1% Pt Batch #1
1% Pt Batch #2
1% Pt Batch #4
1% Pt Batch #5
1% Pt Batch #6
1b
Figure 1. Reduction of target metals from solution using cells pre-loaded at: a: 1% Pd; b: 1% Pt. Results obtained using cells pre-loaded at 2% and 5% metal were identical
The reduction rates of target metals by cells pre-loaded with Pd and with Pt at all three pre-
loadings were examined and the results (Figure 1) suggested that the effect of inter batch
variability is insignificant since the target metal reduction rates of Pd and Pt pre-loaded cells at all
pre-loadings were very similar. Figure 1a shows the reduction rates for all batches with 1% Pd pre-
loading and Figure 1b all batches with a 1% Pt pre-loading. Results for loadings of 2% and 5%
with both Pd and Pt pre-loadings were identical.
From these results the use of 1% Pd pre-loaded cells would be optimum for future use as it offers a near identical reduction rate to that of the higher loadings, with minimal ‘sacrificial’ metal and with Pd being the metal of choice as it is generally a lower cost than Pt. Cells with no pre-loaded metals were not investigated due to the highly acidic nature of waste metal solutions to which the results of this study will be applied.
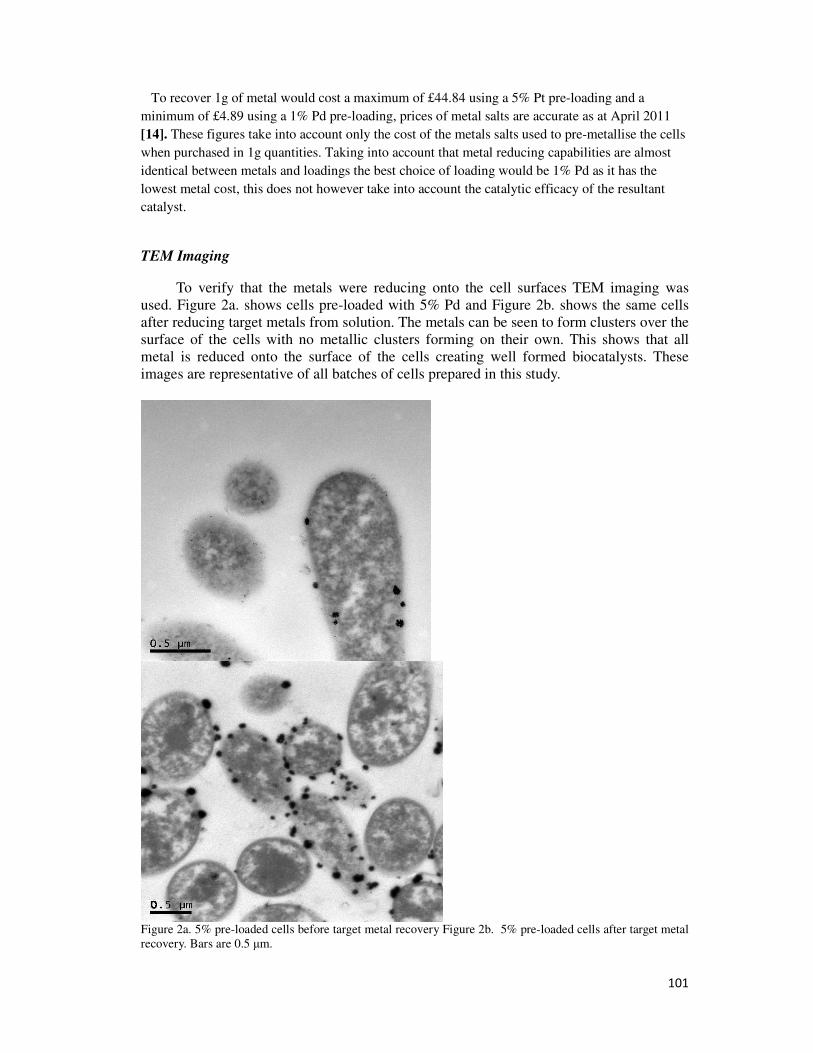
101
To recover 1g of metal would cost a maximum of £44.84 using a 5% Pt pre-loading and a
minimum of £4.89 using a 1% Pd pre-loading, prices of metal salts are accurate as at April 2011
[14]. These figures take into account only the cost of the metals salts used to pre-metallise the cells
when purchased in 1g quantities. Taking into account that metal reducing capabilities are almost
identical between metals and loadings the best choice of loading would be 1% Pd as it has the
lowest metal cost, this does not however take into account the catalytic efficacy of the resultant
catalyst.
TEM Imaging
To verify that the metals were reducing onto the cell surfaces TEM imaging was used. Figure 2a. shows cells pre-loaded with 5% Pd and Figure 2b. shows the same cells after reducing target metals from solution. The metals can be seen to form clusters over the surface of the cells with no metallic clusters forming on their own. This shows that all metal is reduced onto the surface of the cells creating well formed biocatalysts. These images are representative of all batches of cells prepared in this study.
Figure 2a. 5% pre-loaded cells before target metal recovery Figure 2b. 5% pre-loaded cells after target metal recovery. Bars are 0.5 µm.
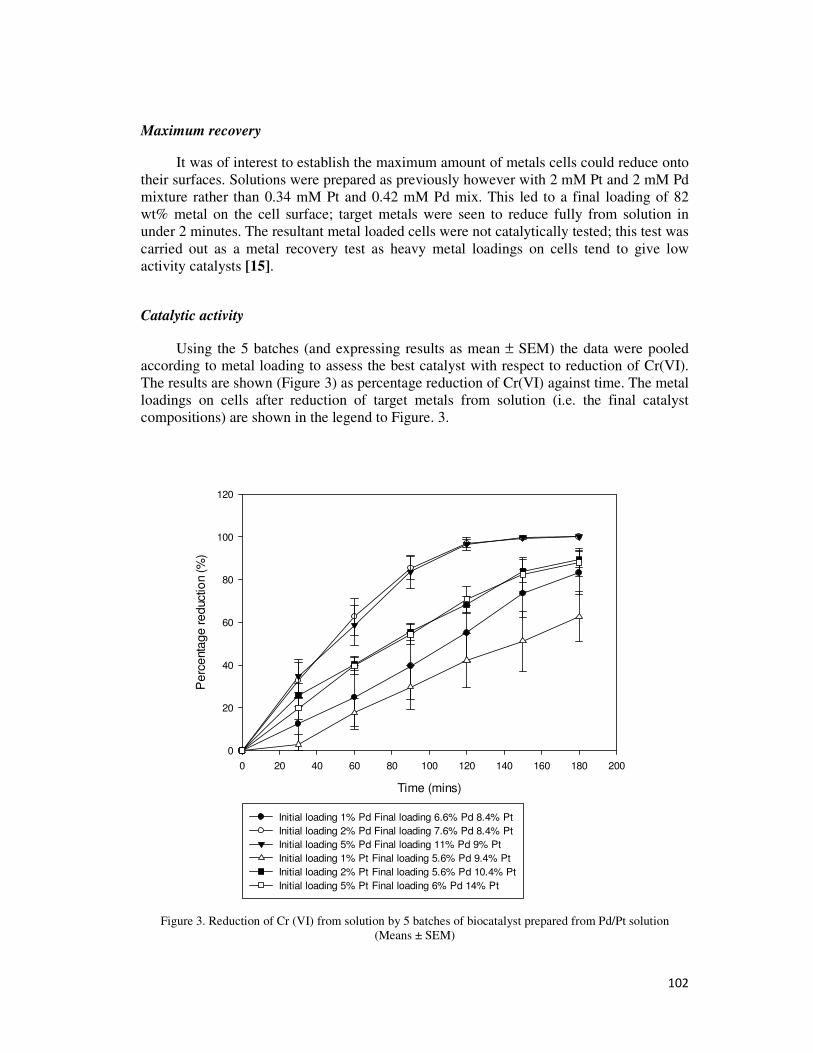
102
Maximum recovery
It was of interest to establish the maximum amount of metals cells could reduce onto their surfaces. Solutions were prepared as previously however with 2 mM Pt and 2 mM Pd mixture rather than 0.34 mM Pt and 0.42 mM Pd mix. This led to a final loading of 82 wt% metal on the cell surface; target metals were seen to reduce fully from solution in under 2 minutes. The resultant metal loaded cells were not catalytically tested; this test was carried out as a metal recovery test as heavy metal loadings on cells tend to give low activity catalysts [15].
Catalytic activity
Using the 5 batches (and expressing results as mean ± SEM) the data were pooled according to metal loading to assess the best catalyst with respect to reduction of Cr(VI). The results are shown (Figure 3) as percentage reduction of Cr(VI) against time. The metal loadings on cells after reduction of target metals from solution (i.e. the final catalyst compositions) are shown in the legend to Figure. 3.
Time (mins)
0 20 40 60 80 100 120 140 160 180 200
Perc
enta
ge re
ductio
n (%
)
0
20
40
60
80
100
120
Initial loading 1% Pd Final loading 6.6% Pd 8.4% Pt
Initial loading 2% Pd Final loading 7.6% Pd 8.4% Pt
Initial loading 5% Pd Final loading 11% Pd 9% Pt
Initial loading 1% Pt Final loading 5.6% Pd 9.4% Pt
Initial loading 2% Pt Final loading 5.6% Pd 10.4% Pt
Initial loading 5% Pt Final loading 6% Pd 14% Pt
Figure 3. Reduction of Cr (VI) from solution by 5 batches of biocatalyst prepared from Pd/Pt solution (Means ± SEM)
103
With all pre-metallised cells offering near identical reducing capabilities in relation to target metals the catalytic activity of the resultant catalysts allowed for the optimum metal and pre-loading to be assessed. From Figure 3 it is seen that cells with Pt as the main metal on the surface were seen not to reduce the Cr(VI) fully even after 3 hours, with the exception of the 7.6% Pd 8.4% Pt cells which initially had a Pd 2% loading.
Both loadings of 7.6% Pd 8.4% Pt (which was initially 2% Pd) and 11% Pd 9% Pt (which was initially 5% Pd) fully reduced Cr(VI) in under 3 hours suggesting that catalysts with a higher Pd content are more catalytically active than those with a lower Pd content. These two loadings offered very similar rates or reduction with the difference between the two being negligible as full reduction took place after 2.5 hours for each.
Both these loadings offered overall rates of reduction of 2.77µmol/min/mg metal
however the 7.6% Pd 8.4% Pt (which was initially 2% Pd) used a lower amount of metal to achieve this reduction. With the metal used taken into account the 7.6% Pd 8.4% Pt (which was initially 2% Pd) rate of reduction was 1.73µmol/min/mg of metal and the 11% Pd 9% Pt (which was initially 5% Pd) rate of reduction was 1.38µmol/min/mg of metal.
The Cr(VI) reduction test (Figure 3) suggests that cells initially loaded with Pd 1%, Pt1%, Pt 2% and Pt 5% would not be suitable as they did not achieve full reduction whereas cells initially loaded with Pd 2% and Pd 5% achieved full reduction. As both Pd 2% and Pd 5% cells offer very similar catalytic activity and the cost of production is important the use of Pd 2% cells would be preferable as the metal cost to pre-metallise them would be greatly reduced without losing the ability to reduce metals from solution initially or losing catalytic activity after reduction.
However these tests were done with Cr(VI). Other studies have shown that the catalytic activity using this charged substrate in aqueous solution is not necessarily predictive of the activity using a hydrophobic substrate in solvent (e.g. hydrogenation of oils) [16] and current studies are aiming to establish the principle shown here in reactions of interest to the fine chemicals industry.
Conclusions
This study identified the most suitable cell pre-loading for the purpose of metal recovery from solutions of mixed target metals as a model system which will then be applied to waste materials primarily road dusts. Cells of E coli MC4100 with a 2wt% Pd pre-loading offered the best performance when taking into account initial metal reduction from solution, the subsequent catalytic activity after target metal recovery from solution and cost of production. This combination achieved full reduction of target metals in under 2 minutes, and it proved to be the most catalytically active using Cr(VI) to assess catalytic activity with a reduction rate of 1.73µmol/min/mg of metal.
ACKNOWLEDGMENT
This work was supported by the BBSRC (studentship to ST and Enterprise Fellowship to AJM).
REFERENCES
[1] Johnson Matthey (2009) “Platinum 2009 Market Review Press Release” (accessed February 10 2011), [available at
104
http://www.platinum.matthey.com/uploaded_files/Pt2009/pressrelease070509ozfinal_1.pdf].
[2] D.Cinti, M. Angelone, U. Masi, C. Cremisini (2002), “Platinum Levels in Natural and Urban Soils from Rome and Latium (Italy): Significance for Pollution by Automobile Catalytic Converter,” The Science of the Total Environment, 293, 47–57.
[3] J. Schafer, H.Puchelt (1998), “Platinum-Group-Metals (PGM) Emitted from Automobile Catalytic Converters and Their Distribution in Roadside Soils,” Journal of
Geochemical Exploration, 64, 307–314.
[4] M.T. Jackson , J. Sampson, H.M. Prichard (2007), “Platinum and Palladium Variations Through the Urban Environment: Evidence from 11 Sample Types from Sheffield, UK,” Science of the Total Environment, 385, 117–131
[5] K. Deplanche, I. Caldelari, I.P. Mikheenko, F. Sargent, L.E. Macaskie (2010), “Involvement of Hydrogenases in the Formation of Highly Catalytic Pd(0) Nanoparticles by Bioreduction of Pd(II) Using Escherichia coli Mutant Strains,” Microbiology, 156, 2630-2640
[6] P.Yong, I.P. Mikheenko, K. Deplanche, M.D. Redwood, L.E. Macaskie (2010), “Biorefining of Precious Metals from Wastes: an Answer to Manufacturing of Cheap Nanocatalysts for Fuel Cells and Power Generation Via an Integrated Biorefinery?,” Biotechnology Letters, 32, 1821-1828
[7] K. Deplanche, R.D. Woods, I.P. Mikheenko, R.E. Sockett, L.E. Macaskie (2008), “Manufacture of Stable Palladium and Gold Nanoparticles on Native and Genetically Engineered Flagella Scaffolds,” Biotechnology and Bioengineering, 101 (5), 873-880.
[8] A.J. Murray, I.P. Mikheenko, E. Goralska, N.A. Rowson, L.E. Macaskie (2007), “Biorecovery of Platinum Group Metals from Secondary Sources,” Advanced
Materials Research, Vols. 20-21, p. 651.
[9] N.J. Creamer, V.S.Baxter-Plant, J. Henderson, L.E. Macaskie (2006), “Palladium and Gold Removal and Recovery from Precious Metal Solutions and Electronic Scrap Leachates by Desulfovibrio desulfuricans,” Biotechnology letters, 28 (18), 1475-1484.
[10] A. J. Murray, unpublished.
[11] Mikheenko, Iryna (2004), Nanoscale Palladium Recovery, Birmingham : School of Biosciences, The University of Birmingham, 2004
[12] N.J. Creamer, K. Deplanche, T.J. Snape, I.P. Mikheenko, P. Yong, D. Saryahumbi, J. Wood, K. Pollmann, S. Selenska-Pobell, L.E. Macaskie (2008), “A biogenic catalyst for hydrogenation, reduction and selective dehalogenation in non-aqueous solvents” Hydrometallurgy, 94, 138-143.
[13] A.N. Mabbett, P.Yong, J. P. G. Farr, L.E. Macaskie (2004), “Reduction of Cr(VI) by ‘‘Palladized’’Biomass of Desulfovibrio desulfuricans ATCC 29577,” Biotechnology and Bioengineering, 87 (1), 104-109.
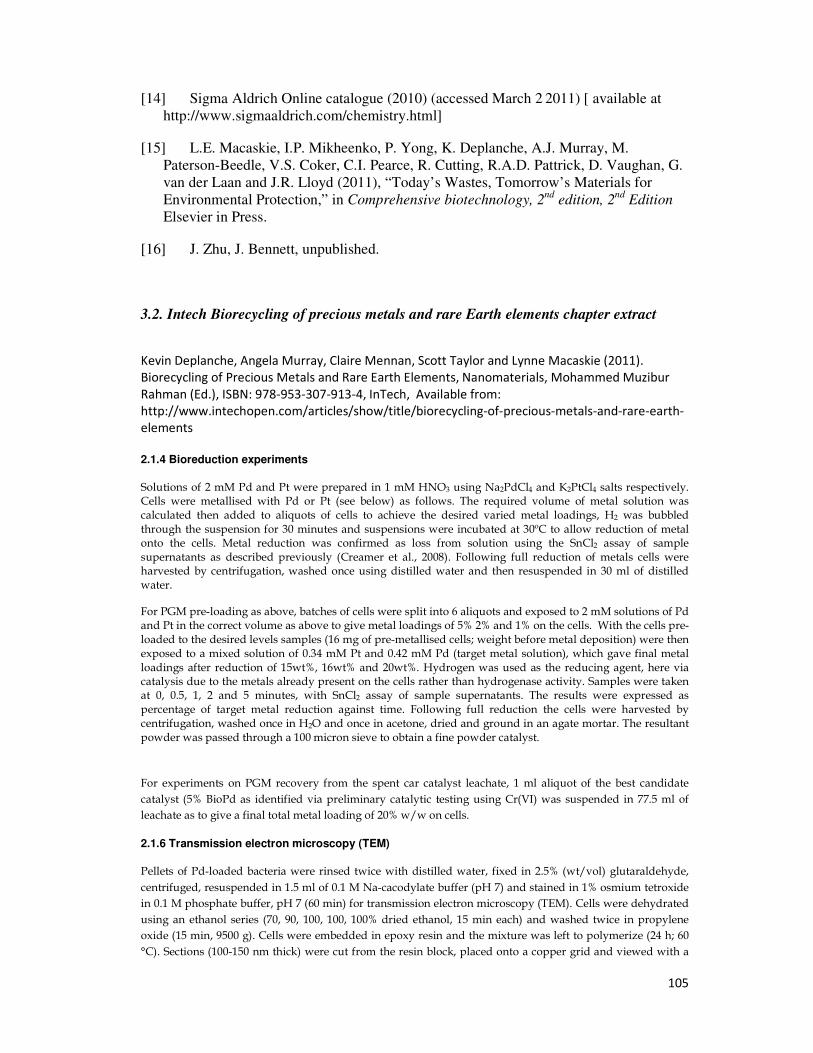
105
[14] Sigma Aldrich Online catalogue (2010) (accessed March 2 2011) [ available at http://www.sigmaaldrich.com/chemistry.html]
[15] L.E. Macaskie, I.P. Mikheenko, P. Yong, K. Deplanche, A.J. Murray, M. Paterson-Beedle, V.S. Coker, C.I. Pearce, R. Cutting, R.A.D. Pattrick, D. Vaughan, G. van der Laan and J.R. Lloyd (2011), “Today’s Wastes, Tomorrow’s Materials for Environmental Protection,” in Comprehensive biotechnology, 2
nd edition, 2
nd Edition
Elsevier in Press.
[16] J. Zhu, J. Bennett, unpublished.
3.2. Intech Biorecycling of precious metals and rare Earth elements chapter extract
Kevin Deplanche, Angela Murray, Claire Mennan, Scott Taylor and Lynne Macaskie (2011).
Biorecycling of Precious Metals and Rare Earth Elements, Nanomaterials, Mohammed Muzibur
Rahman (Ed.), ISBN: 978-953-307-913-4, InTech, Available from:
http://www.intechopen.com/articles/show/title/biorecycling-of-precious-metals-and-rare-earth-
elements
2.1.4 Bioreduction experiments
Solutions of 2 mM Pd and Pt were prepared in 1 mM HNO3 using Na2PdCl4 and K2PtCl4 salts respectively. Cells were metallised with Pd or Pt (see below) as follows. The required volume of metal solution was calculated then added to aliquots of cells to achieve the desired varied metal loadings, H2 was bubbled through the suspension for 30 minutes and suspensions were incubated at 30ºC to allow reduction of metal onto the cells. Metal reduction was confirmed as loss from solution using the SnCl2 assay of sample supernatants as described previously (Creamer et al., 2008). Following full reduction of metals cells were harvested by centrifugation, washed once using distilled water and then resuspended in 30 ml of distilled water.
For PGM pre-loading as above, batches of cells were split into 6 aliquots and exposed to 2 mM solutions of Pd and Pt in the correct volume as above to give metal loadings of 5% 2% and 1% on the cells. With the cells pre-loaded to the desired levels samples (16 mg of pre-metallised cells; weight before metal deposition) were then exposed to a mixed solution of 0.34 mM Pt and 0.42 mM Pd (target metal solution), which gave final metal loadings after reduction of 15wt%, 16wt% and 20wt%. Hydrogen was used as the reducing agent, here via catalysis due to the metals already present on the cells rather than hydrogenase activity. Samples were taken at 0, 0.5, 1, 2 and 5 minutes, with SnCl2 assay of sample supernatants. The results were expressed as percentage of target metal reduction against time. Following full reduction the cells were harvested by centrifugation, washed once in H2O and once in acetone, dried and ground in an agate mortar. The resultant powder was passed through a 100 micron sieve to obtain a fine powder catalyst.
For experiments on PGM recovery from the spent car catalyst leachate, 1 ml aliquot of the best candidate
catalyst (5% BioPd as identified via preliminary catalytic testing using Cr(VI) was suspended in 77.5 ml of
leachate as to give a final total metal loading of 20% w/w on cells.
2.1.6 Transmission electron microscopy (TEM)
Pellets of Pd-loaded bacteria were rinsed twice with distilled water, fixed in 2.5% (wt/vol) glutaraldehyde,
centrifuged, resuspended in 1.5 ml of 0.1 M Na-cacodylate buffer (pH 7) and stained in 1% osmium tetroxide
in 0.1 M phosphate buffer, pH 7 (60 min) for transmission electron microscopy (TEM). Cells were dehydrated
using an ethanol series (70, 90, 100, 100, 100% dried ethanol, 15 min each) and washed twice in propylene
oxide (15 min, 9500 g). Cells were embedded in epoxy resin and the mixture was left to polymerize (24 h; 60
°C). Sections (100-150 nm thick) were cut from the resin block, placed onto a copper grid and viewed with a
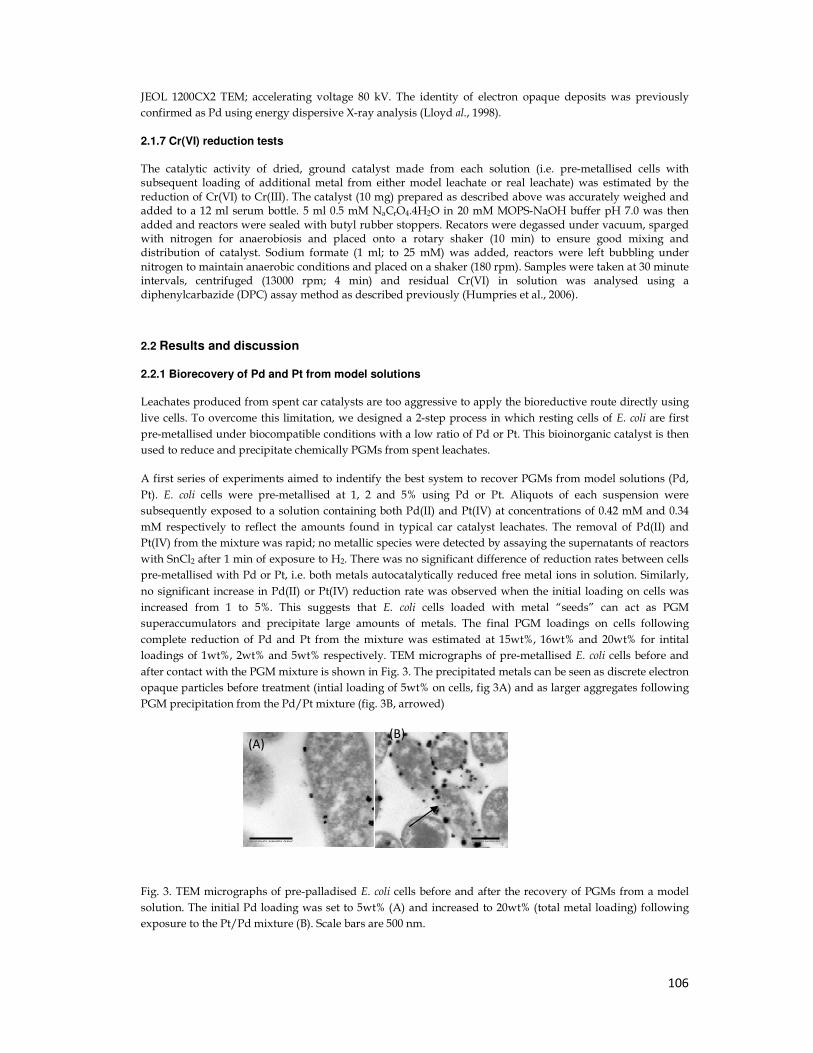
106
JEOL 1200CX2 TEM; accelerating voltage 80 kV. The identity of electron opaque deposits was previously
confirmed as Pd using energy dispersive X-ray analysis (Lloyd al., 1998).
2.1.7 Cr(VI) reduction tests
The catalytic activity of dried, ground catalyst made from each solution (i.e. pre-metallised cells with subsequent loading of additional metal from either model leachate or real leachate) was estimated by the
reduction of Cr(VI) to Cr(III). The catalyst (10 mg) prepared as described above was accurately weighed and added to a 12 ml serum bottle. 5 ml 0.5 mM NaCrO4.4H2O in 20 mM MOPS-NaOH buffer pH 7.0 was then added and reactors were sealed with butyl rubber stoppers. Recators were degassed under vacuum, sparged with nitrogen for anaerobiosis and placed onto a rotary shaker (10 min) to ensure good mixing and distribution of catalyst. Sodium formate (1 ml; to 25 mM) was added, reactors were left bubbling under
nitrogen to maintain anaerobic conditions and placed on a shaker (180 rpm). Samples were taken at 30 minute intervals, centrifuged (13000 rpm; 4 min) and residual Cr(VI) in solution was analysed using a diphenylcarbazide (DPC) assay method as described previously (Humpries et al., 2006).
2.2 Results and discussion
2.2.1 Biorecovery of Pd and Pt from model solutions
Leachates produced from spent car catalysts are too aggressive to apply the bioreductive route directly using
live cells. To overcome this limitation, we designed a 2-step process in which resting cells of E. coli are first
pre-metallised under biocompatible conditions with a low ratio of Pd or Pt. This bioinorganic catalyst is then
used to reduce and precipitate chemically PGMs from spent leachates.
A first series of experiments aimed to indentify the best system to recover PGMs from model solutions (Pd,
Pt). E. coli cells were pre-metallised at 1, 2 and 5% using Pd or Pt. Aliquots of each suspension were
subsequently exposed to a solution containing both Pd(II) and Pt(IV) at concentrations of 0.42 mM and 0.34
mM respectively to reflect the amounts found in typical car catalyst leachates. The removal of Pd(II) and
Pt(IV) from the mixture was rapid; no metallic species were detected by assaying the supernatants of reactors
with SnCl2 after 1 min of exposure to H2. There was no significant difference of reduction rates between cells
pre-metallised with Pd or Pt, i.e. both metals autocatalytically reduced free metal ions in solution. Similarly,
no significant increase in Pd(II) or Pt(IV) reduction rate was observed when the initial loading on cells was
increased from 1 to 5%. This suggests that E. coli cells loaded with metal “seeds” can act as PGM
superaccumulators and precipitate large amounts of metals. The final PGM loadings on cells following
complete reduction of Pd and Pt from the mixture was estimated at 15wt%, 16wt% and 20wt% for intital
loadings of 1wt%, 2wt% and 5wt% respectively. TEM micrographs of pre-metallised E. coli cells before and
after contact with the PGM mixture is shown in Fig. 3. The precipitated metals can be seen as discrete electron
opaque particles before treatment (intial loading of 5wt% on cells, fig 3A) and as larger aggregates following
PGM precipitation from the Pd/Pt mixture (fig. 3B, arrowed)
Fig. 3. TEM micrographs of pre-palladised E. coli cells before and after the recovery of PGMs from a model
solution. The initial Pd loading was set to 5wt% (A) and increased to 20wt% (total metal loading) following
exposure to the Pt/Pd mixture (B). Scale bars are 500 nm.
(A) (B)
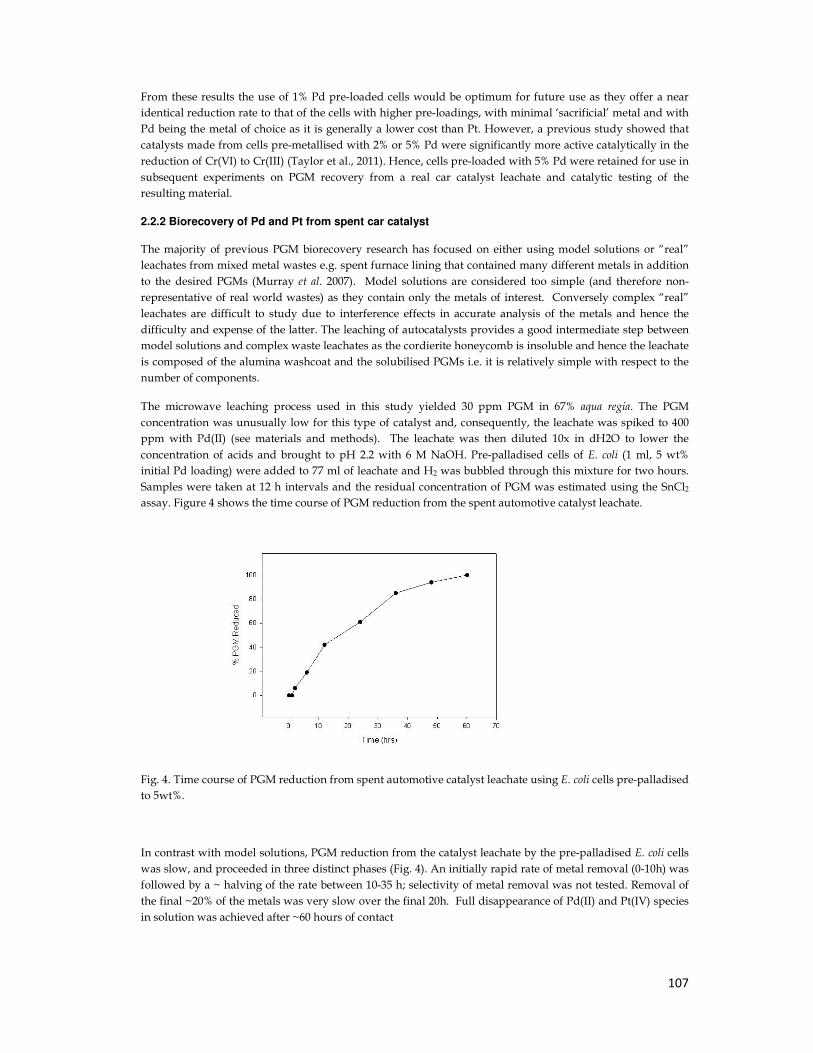
107
From these results the use of 1% Pd pre-loaded cells would be optimum for future use as they offer a near
identical reduction rate to that of the cells with higher pre-loadings, with minimal ‘sacrificial’ metal and with
Pd being the metal of choice as it is generally a lower cost than Pt. However, a previous study showed that
catalysts made from cells pre-metallised with 2% or 5% Pd were significantly more active catalytically in the
reduction of Cr(VI) to Cr(III) (Taylor et al., 2011). Hence, cells pre-loaded with 5% Pd were retained for use in
subsequent experiments on PGM recovery from a real car catalyst leachate and catalytic testing of the
resulting material.
2.2.2 Biorecovery of Pd and Pt from spent car catalyst
The majority of previous PGM biorecovery research has focused on either using model solutions or “real”
leachates from mixed metal wastes e.g. spent furnace lining that contained many different metals in addition
to the desired PGMs (Murray et al. 2007). Model solutions are considered too simple (and therefore non-
representative of real world wastes) as they contain only the metals of interest. Conversely complex “real”
leachates are difficult to study due to interference effects in accurate analysis of the metals and hence the
difficulty and expense of the latter. The leaching of autocatalysts provides a good intermediate step between
model solutions and complex waste leachates as the cordierite honeycomb is insoluble and hence the leachate
is composed of the alumina washcoat and the solubilised PGMs i.e. it is relatively simple with respect to the
number of components.
The microwave leaching process used in this study yielded 30 ppm PGM in 67% aqua regia. The PGM
concentration was unusually low for this type of catalyst and, consequently, the leachate was spiked to 400
ppm with Pd(II) (see materials and methods). The leachate was then diluted 10x in dH2O to lower the
concentration of acids and brought to pH 2.2 with 6 M NaOH. Pre-palladised cells of E. coli (1 ml, 5 wt%
initial Pd loading) were added to 77 ml of leachate and H2 was bubbled through this mixture for two hours.
Samples were taken at 12 h intervals and the residual concentration of PGM was estimated using the SnCl2
assay. Figure 4 shows the time course of PGM reduction from the spent automotive catalyst leachate.
Fig. 4. Time course of PGM reduction from spent automotive catalyst leachate using E. coli cells pre-palladised
to 5wt%.
In contrast with model solutions, PGM reduction from the catalyst leachate by the pre-palladised E. coli cells
was slow, and proceeded in three distinct phases (Fig. 4). An initially rapid rate of metal removal (0-10h) was
followed by a ~ halving of the rate between 10-35 h; selectivity of metal removal was not tested. Removal of
the final ~20% of the metals was very slow over the final 20h. Full disappearance of Pd(II) and Pt(IV) species
in solution was achieved after ~60 hours of contact
108
In order to implicate the compound responsible for the inhibition of PGM reduction a simple test was carried
out. Model leachates (Pd(II) and Pt(IV)) were prepared as before using fresh aqua regia and aliquots were
spiked with Pd(II) (400 ppm final concentration), neutralised and diluted as before. The pH was adjusted to
2.0. Aliquots of model leachates were spiked with silica (SiO2 and Al2O3 to 173 ppm final concentration) and a
mixture of both. The bioinorganic catalyst was added in each reactor and the rates of PGM reduction were
followed as previously. Addition of either Al and Si promoted a significant decrease of the rate of PGM
reduction; Pd(II)/Pt(IV) disappearance from the model solution was observed after 6 and 14 hours of contact
with the bioinorganic catalyst respectively. Full PGM removal was not observed in the solution supplemented
with both Si and Al even after 48 h exposure, whereas metal was removed from the control (leachate + dH2O)
within 5 mins as per the model solutions. These results suggest that the presence of Al and Si inhibit PGM
recovery and are responsible for a more than 30-fold increase in reduction time observed with the spent car
catalyst leachate.
The catalytic activity of the material obtained following PGM recovery from spent car catalyst leachate was
estimated in the reduction of Cr(VI) to Cr(III) in the presence of formate. This was tested alongside the
catalyst made from PGM recovered from model solutions (see above). Both catalysts were manufactured
using E. coli cells pre-palladised to 5wt% and had similar final metal loading (after PGM recovery) estimated
to be 20wt% PGM.
Both catalysts were active in Cr(VI) reduction tests (fig. 6) and showed similar initial reaction rates. Near-
complete Cr(VI) reduction was obtained with the catalyst made from model leachate after 120 min whereas
the catalyst obtained from real leachate showed a slower rate after 30 min, probably attributable to the
presence of non-PGM contaminants (possibly Si and Al) which could partially poison catalytic PGM
nanoparticles. Nevertheless, more than 90% of the Cr(VI) was reduced by 180 min by the biorecovered
material.
Fig. 6. Time course of the catalytic reduction of Cr(VI) to Cr(III) over two bioinorganic catalysts fabricated
from (m) a model leachate and ( l) a spent car catalyst leachate. Results are expressed as percentage Cr(VI)
reduced over time. Data are from two separate experiments. When no error bars are shown, these were within
the dimensions of the symbols.
These experiments demonstrate the potential of bioreductive processes towards PGM recovery and a one-step
conversion of waste material into novel bioinorganic catalysts. The range of reactions amenable to bioPGM
catalysis is constantly being expanded (Table I) and work in our laboratory is on-going to optimise the
formulation of bioinorganic catalysts made from wastes for specific applications. It should be noted that in
some cases (Macaskie et al. 2011 Comprehensive Biotechnology) the presence of metallic impurities in the
biorecovered materials can increase the catalytic activity (c.f. Fig. 6) and a full survey of bionanocatalysts from
wastes for particular applications needs to be approached systematically on a ‘by case’ basis.