Embed Size (px)
Citation preview

Recovery System Performance
of an Oil Refinery
Corpus Christi, Nueces County, Texas
IBRAHIM KAHRAMAN
The University of Texas at Austin
GIS in Water Resources
Dr. David R. Maidment
FINAL PROJECT REPORT
Fall Semester 2012

Contents
1. Introduction
2. Objectives
3. Study Area
4. Geology of the Area
5. Onsite Monitoring, Observation, and Recovery Wells
6. Creating LNAPL and Groundwater Surface Contour
7. Recovery Performance Summary of the Site
8. Conclusion
9. Future Work
Reference

1. Introduction
The Hydrocarbon plume is a legacy issue known to exist since 1960. Any leakage on the tanks
and underground pipelines or dispensing operations could cause plume migration onto the
groundwater. It is important for petroleum companies to prevent the possible migration of
hydrocarbon plume under their refinery site toward offsite. Preventing aquifers to be polluted
by the plume is also another significant point to be taken into account. To control this process,
the refinery sites have to be investigated very carefully. Observation and monitoring processes
are very crucial at this point to figure out if any unexpected situation is happening. Any
prospective oil spill will harm the environment, all the living animals on it, and the human health
that may be exposed to hazardous waste indirectly through various ways.
2. Objectives
The objective of this term project is classified in three caetgories:
- Define the importance of the geology for refineries.
- Emphasize the groundwater surface elevation and LNAPL Thickness by creation the
contour lines.
- Analyze the existing performance of recovery system, which includes both LNAPL
(Light Non-Aqueous Phase Liquids) and Groundwater, in an oil refinery.
3. Study Area
The area is known as Corpus Christi Ship Channel Harbor, which is in Nueces County. Actually, in
that area there are 6 different oil companies that are currently working actively for oil
production. They have separate observation and remediation systems in operation as an
obligation to TCEQ (Texas Commission of Environmental Quality). However, the main focus area
of mine is one of the refineries that I gathered data from. This data consist of stratigraphy of the
soil, LNAPL properties such as density and viscosity, recovery rates for 11 well in selected area.
WE won’t use explicitly all those data in this project, but some conclusion parts are directly
related to them. From the data, the exact locations of wells for all facilities were determined as
the beginning part of this study. The data consist of the easting and northing point, which is also
known as UTM system (Universal Transverse Mercator), for each well in the area. We knew from

the data that the locations are in CGS_North_American_1927 – geographic coordinate system.
To understand which projected coordinate system will be used for locating the wells in ArcGis
took time in the beginning. Finally, NAD_1927_StatePlane_Texas_South_FIPS_4205 is verified as
our projected coordinate system.
For the figures along the report, the World Topographic Map was used as our basemap.
Figure 1. Wells and CPT (Cone Penetrating Testing) Zone
Figure 1 illustrates all the monitoring, observation, and recovery wells along with the CPT zones
for 6 facilities in total. The green ones represent the CPT zone, which I will detail later, and the
red ones represent all types of wells without grouping them specifically. The number of CPTs is
140, while the number of wells is 272. A few of the wells will be plugged and abandoned due to
the fact that no longer remediation or monitoring process will be needed in that specific area.

4. Geology of Area
Geology and soil science have an important role for investigation and resolving the subsurface
contamination problems. For instance, in the Walter Creek watershed in the Central Iowa,
geologists and soil scientists along with environmental engineers gave effort to solve the
groundwater contamination problem (Simpkins and Burkart, 1996)1.
It is good to emphasize the importance of the geologic formations in the area because soil
properties are directly related to these formations. Texture, permeability, porosity, and specific
yield are some important soil properties. They must be considered thoroughly because they
provide the information about the subsurface water flow capabilities, our ability to reach
groundwater and oil by wells, and groundwater contamination as well.
Figure 2 illustrates the geologic formation of the Nueces county and specifically the area where
the wells are located. The figure was provided from the USGS-Texas Water Science Center and
Texas Water Development Board’s study which aimed to make a digital copy of Geologic Atlas of
Texas. The Bureau of Economic Geology at the University of Texas at Austin make some progress
to have and advanced map for this work as well.
The deposits on the figure are known as quaternary (alluvium) deposits. This deposit can be
found near the rivers and streams. Unconsolidated gravel, silt, sand and clay are inundated
regularly in these deposits. The base of this formation is mostly dominated with coarse grain-
sized gravel and finer silt is found upper part of this formation. Poorly sorted gravel particles
result in variable porosity (low to high) in this formation. Low permeability can be seen in some
parts of the formation because of the silty and clayey cement.
1 Simpkins, W. W., and M. R. Burkart, 1996, Hydrogeology and Water Quality of the Walnut
Creek Watershed: Geological Survey Bureau Guidebook Series No. 20, Iowa Geological Survey,
Iowa City, IA, 105 pp

Figure 2. Geologic Map of Nueces County
Qb on the figure represents the Beaumont Formation, known as a class of alluvium deposits as
well, which is beach deposits and barrier islands. This formation comprise of mostly gravel, sand,
silt and clay. The finer grain-sized clay and silt cause low permeability in the formation as well as
high water holding capacity, poor drainage, high compressibility. This formation is emphasized
particularly because most wells are located above this formation.
The thick and long continuous line represents the normal fault in the area.
5. Onsite Monitoring, Observation, and Recovery Wells
First of all, I have to clear that onsite will refer here to the area where I will mainly focus on.
Unlike the injection and production wells in the refinery area; monitoring, observation and
recovery wells are used for controlling and remediating the groundwater by any contamination
regarding to the oil extraction and dispensing processes in the refinery. So, there are 88
recovery, 85 observation, and 24 monitoring wells in the selected area along with 6 CPT zone
wells. These well’s locations are shown in the figure below.
Wa
Qal
Qb
Qb
Qal
Qd
F S
Qal
F S
F S
Wa
Qal SanPatricioSan
Patricio
SanPatricio
Nueces
·
0 1 20.5 Miles

Figure 3. Onsite Well Locations
The purpose of using these wells is:
- CPT (Cone Penetrating Testing): It is considered one of the effective methods to provide
soil properties and delineating the soil stratigraphy.
- Observation Wells: They are used only for gauging. The thickness of hydrocarbon is
determined by using observation wells near to the recovery wells.
- Monitoring Wells: They are used both sampling and gauging. Interim Corrective Actions
(ICA) is very important in case of oil release to minimize the contaminant migration in
lateral extent and reducing the concentration of Phase-Separated Hydrocarbon (PSH).
This topic will not be detailed in this report. However, to determine if the ICA is
proficient for its purpose or remediation is going on well, monitoring process is the way
to measure its efficiency. For understanding its effectiveness, the following parameters
are monitored:
o Hydrocarbon volume that has been recovered
o Phase-Separated Hydrocarbon Thickness

o Benzene Concentration in Dissolved Phase
- Recovery Wells: The main reason for using recovery wells is extracting the groundwater
and LNAPL (Light Non-Aqueous Phase Liquid)
The parameters which are measured in a groundwater sample of an oil refinery area are
shown in the Figure 4 below. Metals, Volatile Organics, and SemiVolatile Organics are listed
in the figure with their critical Protective Concentration Limits (PCLs). Units of PCLs are
mg/L.
Figure 4. Concentration of Concern Parameters in Groundwater Sample

Although the PCL for benzene concentration is 0.5 mg/L in the table, we know from the TCEQ’s
reports that 0.005 mg/L is considered the current PCLs to meet the requirement of Residential
Area Groundwater Class. All the oil facilities in the area are held accountable to provide the
benzene concentration under the PCLs by TCEQ2.
6. Creating LNAPL and Groundwater Surface Contour
Before creating the LNAPL contour lines by using Apparent LNAPL Thickness (ANT), which is
provided from observation wells adjacent to the recovery wells, a point needs to be cleared.
ANT has a huge impact on estimating LNAPL recovery from groundwater.
Figure 5 gives a demonstration of confined and unconfined groundwater / LNAPL and ANT effect
on such mediums.
Figure 5. The effect of ANT on confined/unconfined medium3
Using ANT for estimating the LNAPL thickness in the formation is adequate and feasible for
unconfined groundwater and LNAPL medium because ANT enables us to have the correct
measurement for thickness. On the other hand, confining layer in the confined layer misguides
2 TCEQ UPDATE BULLETIN, Remediation Division, Petroleum Storage Tank Fact Sheet, March
2009
3 Source of Figures are H2A Environmental Ltd.
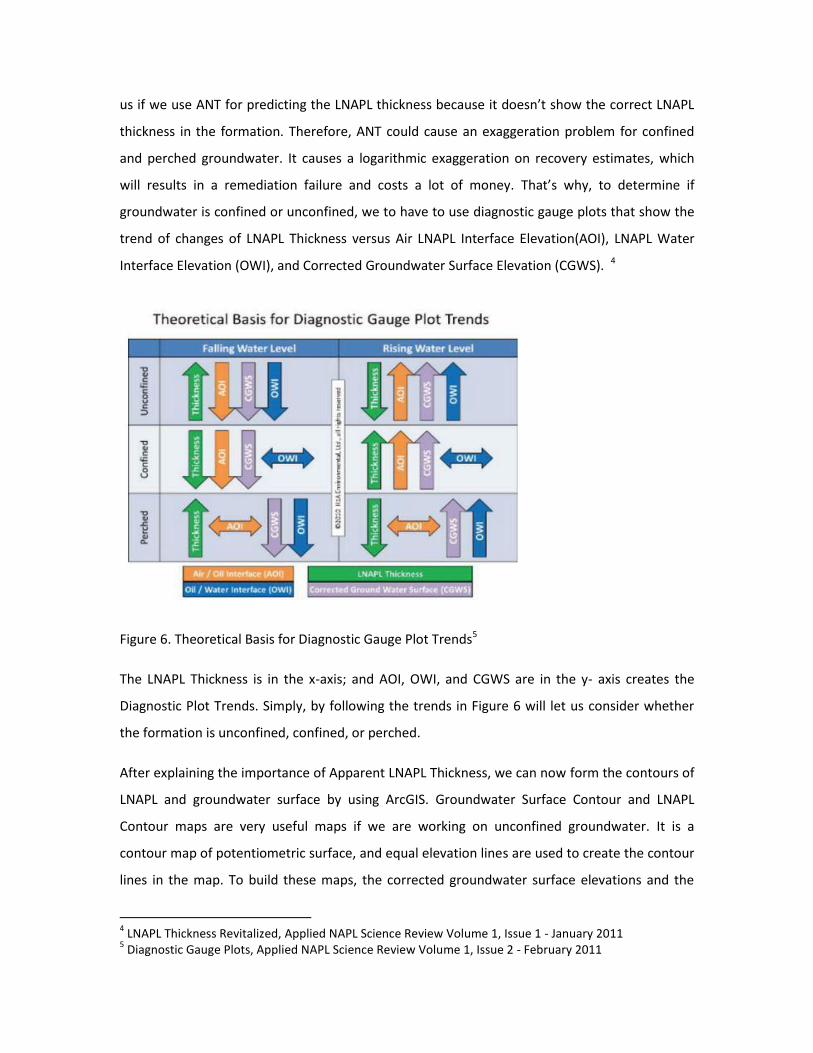
us if we use ANT for predicting the LNAPL thickness because it doesn’t show the correct LNAPL
thickness in the formation. Therefore, ANT could cause an exaggeration problem for confined
and perched groundwater. It causes a logarithmic exaggeration on recovery estimates, which
will results in a remediation failure and costs a lot of money. That’s why, to determine if
groundwater is confined or unconfined, we to have to use diagnostic gauge plots that show the
trend of changes of LNAPL Thickness versus Air LNAPL Interface Elevation(AOI), LNAPL Water
Interface Elevation (OWI), and Corrected Groundwater Surface Elevation (CGWS). 4
Figure 6. Theoretical Basis for Diagnostic Gauge Plot Trends5
The LNAPL Thickness is in the x-axis; and AOI, OWI, and CGWS are in the y- axis creates the
Diagnostic Plot Trends. Simply, by following the trends in Figure 6 will let us consider whether
the formation is unconfined, confined, or perched.
After explaining the importance of Apparent LNAPL Thickness, we can now form the contours of
LNAPL and groundwater surface by using ArcGIS. Groundwater Surface Contour and LNAPL
Contour maps are very useful maps if we are working on unconfined groundwater. It is a
contour map of potentiometric surface, and equal elevation lines are used to create the contour
lines in the map. To build these maps, the corrected groundwater surface elevations and the
4 LNAPL Thickness Revitalized, Applied NAPL Science Review Volume 1, Issue 1 - January 2011
5 Diagnostic Gauge Plots, Applied NAPL Science Review Volume 1, Issue 2 - February 2011
apparent LNAPL thickness will be used. These date gathered from the observation wells around
the recovery wells. To construct the contour maps is important because they provide us the
direction of groundwater and LNAPL plume flow. Another reason that why these maps are
crucial because it gives us the distribution of LNAPL in the site as well.
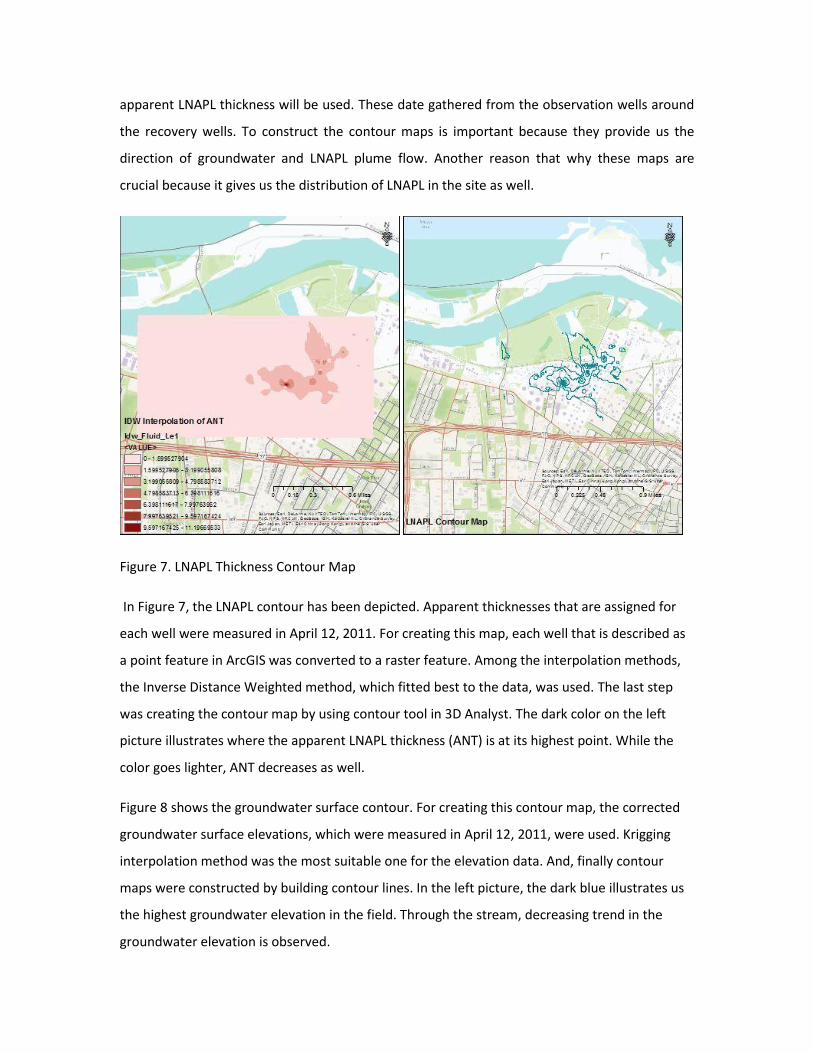
Figure 7. LNAPL Thickness Contour Map
In Figure 7, the LNAPL contour has been depicted. Apparent thicknesses that are assigned for
each well were measured in April 12, 2011. For creating this map, each well that is described as
a point feature in ArcGIS was converted to a raster feature. Among the interpolation methods,
the Inverse Distance Weighted method, which fitted best to the data, was used. The last step
was creating the contour map by using contour tool in 3D Analyst. The dark color on the left
picture illustrates where the apparent LNAPL thickness (ANT) is at its highest point. While the
color goes lighter, ANT decreases as well.
Figure 8 shows the groundwater surface contour. For creating this contour map, the corrected
groundwater surface elevations, which were measured in April 12, 2011, were used. Krigging
interpolation method was the most suitable one for the elevation data. And, finally contour
maps were constructed by building contour lines. In the left picture, the dark blue illustrates us
the highest groundwater elevation in the field. Through the stream, decreasing trend in the
groundwater elevation is observed.

Figure 8. Groundwater Surface Contour
To sum up the last two figures, we end up with that the flow direction for both groundwater and
LNAPL is expected to go toward the Corpus Christi Inner Harbor.
7. Recovery Performance Summary of the Site
The data for recovery rates is very limited to analyze. We have two kinds of data for onsite well
recovery rates to be used in this project. The first one is the recovery rates for the first half of
2011, from January to June, includes all recovery wells rate in the site and the values are in total
with a unit of gallon. Figure 9 shows us the total groundwater recovery rates for previously
mentioned time period. The scale of the points shows how the recovery is higher or lower in
those specific wells.

Figure 9. Total Groundwater Recovery Rates in gallon (January 2011 – June 2011)
Figure 10 is also a demonstration of total hydrocarbon recovered from each wells. The area
which is marked with a red circle has the most recovery rates along the recovery wells. The
future work will be related to this area.
Figure 10. Total Hydracorbon Recovery Rates in gallon (January 2011 - June 2011)
Figure 11 is basically shows how the Interim Corrective Action (ICA) works. Since 1998, the
recovery system for groundwater and hydrocarbon has been in operation. And the last data we
have for the recovery rates relates to 2011. 2011 is the peak year since 1998 for both recoveries.
The values next to the each graph are in barrels.

Figure 11. Total Recovery Rate of Groundwater & Hydrocarbon (1998 – 2011)
8. Conclusion
The fluid level data and hydrocarbon recovery estimates demonstrate the PSH plume
beneath the refinery continues to be recovered. The LNAPL removed from groundwater at
facility is piped to the recovered oil tanks and recycled without exposure to potential
receptors.
9. Future Work
This term paper will be a part of my thesis research, which is referred as the future work.
First thing that will be done for the future work is to make a 3D visualization for borehole
logs for the wells that data are available. This work couldn’t have been done in this project
because lacking of enough data for this particular work. We have some information about
the borehole log, however since it is not clear which part is referred in that logs, it is
preferred not to be used in here. Second thing could be to create time series catalog for all
available data that will be gathered in the future. And, the last future work will be the

simulation results that will be done for the selected area shown in Figure 10 by using LDRM
(LNAPL Distribution and Recovery Model)
Reference
1 Simpkins, W. W., and M. R. Burkart, 1996, Hydrogeology and Water Quality of the Walnut
Creek Watershed: Geological Survey Bureau Guidebook Series No. 20, Iowa Geological Survey,
Iowa City, IA, 105 pp
2 TCEQ UPDATE BULLETIN, Remediation Division, Petroleum Storage Tank Fact Sheet, March
2009
3 Source of Figures are H2A Environmental Ltd.
4 LNAPL Thickness Revitalized, Applied NAPL Science Review Volume 1, Issue 1 - January 2011
5 Diagnostic Gauge Plots, Applied NAPL Science Review Volume 1, Issue 2 - February 2011