Embed Size (px)
Citation preview

Leisure Sciences, 24:i 3-41,2oM0149.0400/02 $1200 + .oO
Recreation and the Environment as CulturalDimensions in Contemporary American Society
H. KEN CORDELLCARTER J. BETZSouthern Research StationUSDA Forest ServiceAthens, Georgia, USA
GARY T. GREENDepartment of Recreation and Leisure StudiesUniversity of GeorgiaAthens, Georgia, USA
This paper broadly explores changing outdoor recreation demands, environmental opin-ions and demographics in the United States. With this country’s population predicted tomore than double by the end of this century, it is imperative that we understand thesetreru.5 and their implications for better managing our natural envimnment and pm-viding opportunities for outdoor recreation in that environment. Using notional survey
dota, we have described differences in recreation behavior (participation) and envi-mtunentat attitudes nationwide across six socio-demographic factors-race, country ofbirth, rural-urban residence, region of the country, age and income. Results indicatethat demographic d@erences, recreation activity choices and people ‘s environmentalpositions ore linked.
Keywords cultural dimensions, demographics, environmental opinions, nat ionalrecreation surveys, outdoor recreaticn participation, population trends
Two of the primary cultural dimensions of contemporary American Society-outdoor recre-ation and environmental opinion-are examined in this paper. Specifically, a contextual, U.S.populat ion-wide descript ion of outdoor recreat ion part icipat ion and environmental at t i tudes,as well as differences across a number of social strata, are provided as a context for readingand reflecting on the important papers that follow in this issue of Leisure Sciences. Ourresearch data came from the National Survey on Recreation and the Environment (NSRE).Like the Census of Populat ion, the National Transportat ion Survey, and a number of others,NSRE is one of the United States’ on-going, nationwide federal surveys. I t dates back to theOutdoor Recreation Resources Review Commission of 1960 (Cordell et al., 1996; Cordell,1999).
In 1960 the federal government conducted the first of i ts nationwide outdoor recreationsurveys. Named the National Recreation Survey (NRS), the results highlighted outdoorrecreation interests and participation in the United States. Since that first “in-the-home”
Received 1.5 August 2001; accepted 21 August 2001.This article is not subject to U.S. copyright law.Address correspondence to H. Ken Cordell, 320 Green Street, Athens, GA 306022044. Email: kcordell@
h.kd.US
1 3

14 H. K. Cordell et al.
survey, seven additional NRSs have been conducted, in 1965, 1970, 1972, 1977, 1982-83,1994-95 and 2000-01. In 1994 the NRS series was renamed the National Survey onRecreation and the Environment (NSRE). This expanded name was introduced to reflectgrowing interest across the U.S. population in the natural environment, including nature-based recreational experiences. Working within the framework of this new name and mis-sion, the scope of questions asked of respondents was broadened to include their wildlifeand wilderness interests , environmental values, at t i tudes regarding public natural lands pol-icy and other environmental dimensions. Additional content pertaining to the recreationalneeds of people with challenging and disab1ing conditions also was added (Cordell et al.,1996; Cordell, 1999).
The most recent NSRE (i.e., 2000-01) was completed in the fall of 2001. Interviewswith 50,000 individuals across all ethnicities and locations throughout the United Statesincluded questions regarding outdoor recreation participation, demographics, householdstructure, lifestyle interests, environmental attitudes, natural resource values (for example,concerning clean water and wildlife), constraints to participation, and attitudes towardpublic land management policies. Thus, this latest version of the NSRE focused in greaterdepth than any of i ts predecessors on the outdoor recreational and environmental interestsof the American people. This greater depth was built upon the recognition that American’sparticipation in outdoor recreation, as well as their feelings toward the natural environmentare two of the more important cultural dimensions of today’s society.
Growing Outdoor Recreation Interest
Continuing research on outdoor recreation participation is important because for manyAmericans recreation is a fundamental, although ever-changing part of their lifestyle. Overthe years, outdoor recreation has remained popular (Douglass, 1999), even gaining inpopularity in recent decades, as measured by percentages of the population who partic-ipate. Both short- and long-term participation trends indicate that this growth in popular-ity continues across most segments of the population (Cordell et al., 1996). With growthin numbers and greater diversity of those who use outdoor recreation sites and facili-ties comes new and different challenges to the managers of our recreational resources,such as those on our public natural lands. These new challenges arise from issues suchas access and accessibility, resource impacts, conflicts from crowding and incompatibleactivities, keeping facility design up to date, and emergence of a wide variety of new ac-tivities. Unprecedented diversification of this country’s population will in all likelihoodmake obsolete many of the approaches successfully used in the past to address suchchallenges.
The current U.S. population, which is comprised of genemtions that have grown upand lived through different social contexts, will undoubtedly have different experiencepreferences, expectations, and participation styles than generations past (Cordell et al.,1996). Thus, a major challenge facing researchefs is trying to understand how past, currentand future populations differ in their recreation demands. One of the primary focuses of theNSRE is tracking recreation participation trends. Population-wide survey research such asthis, that keeps track of how recreation demands are changing as the population changes, issignif icant because i t provides a bet ter understanding of the inevitable evolution of outdoorrecreation demand. Without such forward-looking research, those charged with decidinghow to evolve and realign the outdoor opportunities being offered are forced to guess atwhat new to provide, or what could be worse, continue to provide what always has beenprovided.

Cultural Dimensions 15
Persistent Public Environmental Concern
Another and equally important dimension of the NSRE survey, and seemingly atleast equal to outdoor recreation as a cultural dimension of the American public, is peo-ple’s concern about the natural environment. Over the years, in survey after survey,Americans have expressed their concern for the environment and the sustained welfareof our natural lands (Shabecoff, 2000). In fact, after reviewing available literature andsummarizing what it indicates about Americans’ feelings toward the “enviromnent,”especially toward natural lands as a crucial part of that environment, one cannothelp but conclude that “Americans are an environmental group” (Cordell & Overdevest,2001). The consistency and persistence with which Americans continue to expressconcern over the condition and future of our environment is compelling. It is not aconcern isolated to a few organized, radical groups. It is a concern shared broadlythroughout our society cutting across the cultural diversity that defines the United States(D&&is, 1996; Jones, 1998; Nie, 1999; Shabecoff, 2000; The Recreation Roundtable,1999).
An example of one shared concern is that of environmental regulation. To some, regu-lation seems tantamount to being anti-American. But, clearly, Americans are in support ofgovernment regulations designed to protect the environment. According to Roper surveysconducted over 25 years, from 1973 to 1998, there is a clearly persistent pattern of supportfor such regulat ions (Times Mirror, 1994). In the 1970s and persist ing throughout the 1980sthere was growing support for environmental regulations. By 1989, 55% of Americansfelt that environmental regulations needed to be even stronger than they were at that time.Fifty-five percent also agreed that they would vote against any candidate who did notadvocate stronger government protection of the environment (Roper Organization, 1990).Since then, and following a peak in support for regulation surrounding Earth Day in 1990,there has been a sl ight downward drif t in support . Fifty-three percent of respondents to the1994 Roper survey reported that environmental laws and regulations needed to be stronger(Times Mirror, 1994).
In 1998, the proportion of Americans who felt environmental laws had not gonefar enough to protect the environment dropped just under 50%. But, an additional29% of Americans expressed support for environmental regulation by indicating that thelevel of environmental protection provided by government was just right and that itprovided “just the right balance” (Dujack, 1997). More recently, in 2000 and 2001,41% of Americans suggested that environmental laws have not gone far enough, butonly 14% indicated environmental laws have gone too far (Cordell, Green, & Betz,forthcoming ) .
Obviously, environmental issues such as environmental regulation will continue tobe important topics for debate and concern for the American people and their officialrepresentatives. Thus, the need for ourrepresentatives to be well informed about the posit ionsof those they represent makes survey research, such as the NSRE, all the more important,even essential .
Previous research, including our own, has demonstrated that recreation preferencesand environmental opinions differ in some important ways between social strata (Dwyer &Hutchinson, 1990; Floyd, Shinew, McGuire, & Noe, 1994; Newell & Green, 1997; Virden &Walker, 1999). As proport ions of our national populat ion shif t among these strata over t ime,so too will society-wide demands and attitudes. Keeping up with demographic trends andunderstanding how they influence recreation demand and environmental att i tudes, therefore,needs to be a part of ongoing research.

1 6 H. K. Cmdell et al.
Shifting American Demographics
In addition to revealing current, population-wide conditions, the NSRE also enables us tolook for differences in outdoar recreation participation and environmental opinions amongthe ethnic, country of birth, rural/urban residency, region of country, age and income stratathat make up this nation’s increasingly diverse population. Differences that may existbetween social strata are especially significant in light of continuing major shifts in thedemographic composition of the United States population. These shifts are likely to persistwell into the future thus sustaining our need to know all we can know about how changingsocial composition is likely to affect the recreation demands and environmental opinionsof the future.
Currently, the population of the United States is approximately 284 million men, womenand children, a number the Bureau of Census expects will more than double by the endof this century (U.S. Census Bureau, 2000). By 2020, the U.S. population is projected tobe 325 million, by 2050 almost 404 million, and by 2075 nearly 48 1 million. By 2100, inless than 100 years, the U.S. population is projected to be 571 million. This growth of over300 million, will exceed the total growth of population over the last 10,000 years within thegeogmphic area we now know as the United States.
To reach the projected level of 571 million by 2100, the rate of population growthis expected to accelerate. By 2020, growth will be around 2.4 million added persons peryear. Between 2020 and 2050, growth will accelerate to over 2.6 million people per year.Between 2050 and 2100, population growth is expected to exceed 3.3 million per year. Inthat last year before the beginning of the 22nd Century, almost four million new residentswill be added, more people than currently reside in the state of Colorado.
Not only is population dramatically growing in the United States, so too is socialdiversity. Changes in social composition are driven by a number of factors. Prominentamong these change factors are the aging of the U.S. population, changing percentages ofpopulation among ethnic and racial groups and immigration (U.S. Census Bureau, 2000).America is becoming more ethnically diverse through immigration and differing birth ratesamong ethnic groups (Pollard & O’Hare, 1999).
Ethnic diversity is expected to increase substantially during the first half of the 21stCentury. Between 1990 and 2050, the proportion who are Anglo Americans is expected todecline from its current level of more than 76% toj ust over 50%. Over this same time period,the proportion who are African Americans will increase from 12 to 15%, the proportionwho are Hispanic will increase from 9 to 21%, and the proportion who are of other ethnicorigins (including Asians and other ethnic classifications) will increase from less than 4%to more than 11%.
A major source of growth for minority populations, particularly Hispanics, will befrom natural increases (e.g., birth rates), rather than from immigration (Del Pinal & Singer,1997; Exter, 1993). Ninety-five percent of the projected twenty-year growth in Hispanicpopulations will be due to natural increases. Only five percent will be due to immi-gration. By 2010 the projected propoaion of the country’s population that is Hispanicwill, for the first time, exceed the proportion who are African-American. During just25 years, from 1995 to 2020, the Hispanic population in the United States is expectedto increase by nearly lOO%, going from almost 27 million in 1995 to over 52 millionin 2020. Higher Hispanic birth rates will contribute substantially to the escalatingnational population. Recent estimates indicate that Hispanic birth rates are approx-imately 105 per 1000 women aged 15-44. In comparison, African American andAnglo American women showed birth rates of 71 and 65 per 1000, respectively (Exter,1993).

Cultural Dimerwions 17
Most of the African American population of the country resides in the Southern andNorthern regions of the country, with heaviest concentrations ranging from eastern Texas toNew York City. Over 15 million, or 46.9% of the African American population nationwide,resides in the South. Another 42.6% l ives in the North. These regional populat ions typical lyare clustered around major urban centers, particularly in the South, Midwest, and WestCoast. The current geographic distribution of African Americans is expected to persist forthe foreseeable future with greatest concentrations continuing to reside in the South andNorth .
For the Asian population in the U.S., the greatest concentrations are found along thePacific Coast (particularly around Seattle, San Francisco, Los Angeles, and San Diego).Asian population concentrations are also found in various other major metropolitan areassuch as in the Dallas-Fort Worth metroplex and in Houston, Atlanta, Chicago, Minneapolis-Saint Paul, Washington DC, and New York City. Over 4.4 million Asians currently live inPacific Coast states, representing 42.1% of the national total of this ethnic group. Another30.2%, 3.2 million, live in the North region.
From the above, one can readily see there is a trend toward an increasingly diversepopulation with increasingly diverse cultural roots living in this country. In the followingsections of this paper, we examine l inkages between this increasing diversi ty and Americans’recreation choices and environmental opinions.
Purpose of the Study
The purpose of this paper is to examine a portion of the NSRE survey data in order todescribe differences in recreation behaviors (participation) and environmental attitudesnationwide across the strata for six sociodemographic factors-race, country of birth, rural-urban residence, region of the country, age and income.
Methods
Data and Approach
As mentioned earlier, our source of data was the National Survey on Recreation and theEnvironment (NSRE). NSRE is the United States’ on-going federal survey, the earliest onedating back to the Outdoor Recreation Resources Review Commission of 1960 (Cordellet al., 19%). Several of the modules of questions in the most recent NSRE (e.g., outdoorrecreation participation, demographics) were adopted from well tested applications in earlierversions of the NRS. The format and context of those questions have been kept as consistentas possible over the years so that part icipation and other trend analyses could be executed(Cordell et al., 1996). The activity participation module is a particular focus of this paper. Itsevolution and current design are described briefly below. This paper also draws heavily onthe demographics module of NSRE, which was adopted almost verbatim from the Census2000 questions.
Finally, our module of quest ions concerning American’s environmental at t i tudes drawson the well tested and widely accepted New Ecological Paradigm (formerly known as theNew Environmental Paradigm) (Dunlap et al., 1992). All new modules of questions, in-cluding our adaptation of the NEP, were subjected to rigorous review, pretesting, anal-ysis and refinement before being adopted for final population-wide application. Each ofthe three modules of questions used and presented in this paper are described brieflybelow.

H. K. Cnrdell et al.
Activity Participation Module
In the 1960 National Recreation Survey, 23 outdoor activities ranging from playing out-door sports and games to mountain cl imbing were included (Outdoor Recreation ResourcesReview Commission, 1962). In each successive National Survey, activities were addedas the scope of outdoor activities in which Americans were participating broadened. Thecurrent survey, NSRE 2000-01, includes 77 specific activities that range from walking forpleasure to snowboarding to rock climbing. The recreation itinerary of Americans hasexpanded enormously since the 1960s and the participation module in the NSRE hasbeen broadened accordingly. A full listing of the activities included can be reviewed atwww.srs.fs.fedus/trends.
For this paper, only 10 of the. 77 activit ies are used to analyze differences in part icipationbetween social strata. These include: swirmning, motorized off-road driving, outdoor teamsports , downhil l snow ski ing, big game hunting, walking forpleasure, hiking, motor boat ing,canoeing, and surfing. These were selected because they represent a breadth of land, waterand snow/ice activities, and because they also represent a range of physical exertion andskills required for part icipation. For each of the 77 activit ies, survey respondents were askedwhether they had participated to any extent during the previous 12 months. Thus, the datawe draw upon for this paper are binomial measures for each activity indicating whetherthe respondent had participated (yes = 1) or not (no = 0). Later applications of the NSREalso involved the collect ion of data on days of part icipation and number of tr ips away fromhome for outdoor recreation.
Demographic Profile &iodide
The NSRE demographics module follows the Census 2000 design for generating popula-tion profiles across a variety of social strata (Office of Management & Budget, 1997). Forfederal surveys, alignment with Census designed population descriptors is required, notoptional. To meet this requirement, and more importantly, to permit comparisons of per-centage distr ibutions of NSRE respondents across a range of demographic descriptors withpercentage distr ibutions representat ive of the U.S. populat ion, close al ignment with Censuswas necessary. This alignment allowed us to weight the NSRE data to compensate for overor under representation of age, race, sex, education and urban-rural residency. Questionsasked of respondents included age, household structure, income, race, etbnicity, country ofbirth, income, tenure at current address, and other characteristics. The content and designof the demographics module of the NSRE can be reviewed at www.srs.fs.fedus/trends.
New Ecological Paradigm (NEP)
Human perceptions of the Earth and the human role in it are addressed through the NEP.Mom particularly, people’s level of endorsement of an ecological world view is measured.While other environmental scales were included in NSRE, we felt the NEP was mostappropriate for this paper since it reflects people’s fundamental position on the human-earth relationship. Of the 15 items in the revised NEP (Dunlap et al., 1992), we selected 10for use in the NSRE. Reducing the number of items to 10 was necessary in order to staywithin our allowed minutes of on-line interviewing time per respondent. These 10 itemswere selected based upon a recent analysis of the NEP scale and its items (Bright & Porter,in press) and feedback from the initial pretesting of the modified scale. Minor changes inwording for a few of these i tems were made to improve clari ty based on pre-test results from198 randomly drawn respondents. The 10 items (statements) selected represent all 5 of theprimary NEPdomains-ecologicallimits, balance of nature, anti-anthropocentrism, rejection

Cul tural Dimensions 19
of exemptionalism, and ecological catastrophe-as described by Dunlap et al. (1992). Theyare as follows:
Ecological Limits
We are approaching the limit to the number of people this earth can support.
Balance of Nature
When humans interfere with nature, i t often produces disastrous consequences.The balance of nature is delicate and easily upset.
Anti-Anthropocentim
Humans have the right to modify the natural environment to suit their needs.Humans were meant to rule over nature.
Rejec don of Exemptionalism
Human skill and resources will insure that we do not make the earth unliveable.Humans will eventually learn enough about how nature works to be able to control it.
Ecological Catastrophe
Humans are severely abusing the environment.The socalled “environmental crisis” has been greatly exaggerated.If things continue on their present course, we will soon experience a major catastrophe.
Respondents were asked to react to each of the above 10 items on a 5-point scaleranging from 1 = strongly agree to 5 = strongly disagree. The order of the 10 items wasrandomized for each respondent to avoid order bias to the extent possible.
Operating Procedures for the NSRE
Guided by specifications of sample size and geographic distribution from the overall NSREsampling plan, phone numbers forphone interviewing were obtained from Survey Sampling,Inc (%I), a Connecticut-based phone sampling firm. SSI was chosen because the companysubjects al l numbers to extensive cleaning and validation to ensure that l is ted exchanges arecurrently valid, and can provide customers with a random digit dial (RDD) sample usinga phone number database of working blocks. A block is a set of 100 contiguous numbersidentified by the first two digits of the last four numbers (e.g., in number 5594200,42 isthe block).
These working blocks are entered into a computer-aided telephone interviewing system(CATI). Once the CAT1 system has randomly selected and dialed a telephone number, theinterviewer, upon hearing someone answer, identifies the survey, its main purpose, andthe name of the research laboratory (Presser, Blair & Triple& 1992). The interviewerthen inquires how many people in the household are 16 years or older, and asks to speakto the person 16 or older who had the most recent birthday (Link & Oldendick, 1998;Oldendick, Bishop, Sorenson, & Tuchfarber, 1988). Upon reaching an appropriate personand receiving agreement to be interviewed, the interviewer then reads the survey questionsas they appear on the computer screen. Using a computer to control the progression of thesurvey, programmed skip patterns are executed and data are entered as the survey is beingadministered. As responses are fed through the programmed data entry and managementsystem, they are reviewed to assure they are within the permissible range of values andmissing data problems are resolved. If no person is contacted or an answering machine is
2 0 H. K. Cm-dell et al.
obtained, the interviewer enters a code (e.g., busy or no answer). If the timing of the call isinconvenient, a call back is scheduled for another date and time (Presser et al., 1992).
Sampling
Sampling across the country’s populat ion and locat ions was designed to provide a minimumnumber of interviews for each state so that individual state reports on participation acrossall act ivi t ies could be generated and so that rel iable est imates of act ivi ty part icipat ion couldbe computed for act ivi t ies with less than a 10% national part icipation rate. To achieve theseobjectives, a sampling strategy for a national sample of 50,000 completed interviews wasdeveloped. The strategy combined proportional nationwide population sampling aimingfor 29,400 completed interviews and a quota sample distributing 400 interviews to eachstate and totaling 20,600 completed interviews. Sampling occurred throughout the year(s)during which the NSRE was being conducted to minimize seasonal recall bias to the extentpossible .
Sources of bias were addressed through data weighting and other approaches as nec-essary. For example, equally distributing a quota of 400 across the 50 states results inover-sampling of rural areas (e.g., 65% Urban, 25% Near Urban, and 10% Rural). Thus,we used a sampling strategy that combined the quota of 400 per state with a proportionalnationwide sample (e.g., 64.6% Urban, 27.4% Near Urban, and 8.0% Rural). In addition,random digit dialing reaches a random sample of telephone numbers, rather than of people.Affluent families are virtually certain to have a telephone number (97%), often more thanone. At the other end of the scale, many low-income households do not have a telephone(ranging from 8 to 23% depending on geographic area). As a result, affluent people arelikely to be somewhat over represented in the survey sample (Bowen, 1994; Groves, 1990;Tucker, Lepkowski, Casady, & Groves, 1992). To compensate for these types of samplingbiases, the NSRE data set was weighted based on comparisons with Census data.
Another source of bias comes from language barriers through the undesirable but un-avoidable exclusion of people who cannot speak either English or Spanish. According tothe 2000 Census, 12.5% of the U.S. population is Hispanic. For tire non-English speakingsegment of the Hispanic populat ion, the NSRE was conducted in Spanish. The most diff icul tpart of this process was getting the translation generic enough for overall comprehensionby all the various Hispanic dialects. Other non-English speaking U.S. residents were ex-cluded from the survey. The complexity of the translat ion and interviewing processes madeinterviewing in all languages prohibitively costly.
All results provided within this paper are based upon the number of NSRE survey’scompleted at the time the analysis for this paper was conducted (n = 22,847). As of thewriting of this paper, data collection for the NSRE was on-going. Obviously, then, as moredata are collected final estimates of the percentages and numbers of people participating indifferent activit ies may change sl ightly from those reported in this paper.
Weighting Procedures
As blocks of interviews were completed and compiled, they were examined to identifydifferences in demographic profiles between those surveyed and the overall population ofthe country as described in Bureau of Census website reports. Indeed, sufficient differencesare typically found to require weighting adjustments for over or under sampling. Weightingwas achieved using a composite of multi-variate and multiplicative weights to account forage, race, gender, education, and urban/rural differences. This composite weighting helpedadjust estimates of recreation participation and other NSRE estimates to better represent

Cul tural Dimensions 21
what those est imates would have been had the sample been truly proport ionately distr ibutedacross social strata.
This type of weighting procedure, referred to as post-stratification (Holt & Smith,1979), is the most widely accepted method for adjusting sample proportions to mirrorpopulation distributions (Zhang, 2000). Post-stratification has been successfully applied insimilar national surveys in the U.S. and in other countries (Thomsen & Halmoy, 1998). ForNSRE, a total of 60 strata (6 age x 2 gender x 5 race) were identified to match identicalstrata in the U.S. Census. Each individual strata weight, Swi, is the ratio of the Censuspopulation proportion to the NSRE sample proportion:
SWi = Pi/piwhere Pi = U.S.Censusproportion for strata i
pi =I NSRE 2000 sample proportion for strata i
A weight SW{ > 1.0 indicated that the particular strata was a smaller proportion of thesample than of the U.S. population based on Census estimates. Likewise, weights with avalue less than 1 .O indicated that the strata was randomly sampled in greater numbers thanits proport ion of the U.S. populat ion age 16 and over. A unitary weight ( i .e . , no adjustment)means the sample strata was sampled at the same rate as its proportion of the population.Each individual respondent was assigned to one and only one of the 60 age-gender-racestrata and thus assigned an Swi for that strata
We took an addit ional s tep to account for the sampling proport ions of two other socioe-conomic strata: educational attainment and place of residence (ruraI/urban). Weights foreach of these were calculated separately in a similar fashion to the age-gender-race weight.The education weight, Ewi, is the ratio of Census: sample proportions for nine differentlevels of educational attainment, ranging from “8th grade or less” to “Doctorate Degree.”The residence weight, Rwi, is simply the ratio of the percentage of the U.S. population liv-ing either in metropolitan statistical areas or not divided by their counterparts in the NSREdata. This was adjusted for the fact that urban or metropoli tan residents were sl ightly undersampled in the survey. A single weight , Wi, for each individual survey respondent was thencalculated as the product of the three intermediate weights:
Wi = Swi. Ewi * Rwi
The largest composite weights, therefore, were applied to respondents whose numberswere under represented in the total sample. The smallest weights were applied to stratawhich were over represented. The sample had a potential total of 1,080 (60 x 9 x 2) uniqueweights, with each individual assigned a weight, Wi, depending on his or her combinationof the three intermediate weights.
Data Analysis
After weighting the data as an adjustment for disproportionate sampling , differencesin recreation behavior and environmental attitudes across six sociodemographic factors(i.e., race, age, income, country of birth, place of residence [rural/urban], and region ofresidence [Census divisions]) were compared. Recreation behavior was operationalized asthe percentage of respondents who said they participated in one or more of ten differentoutdoor recreation act ivi t ies one or more t imes in the past year. Hypothesis tests (2 s ta t is t ic)were computed for each strata to see if the strata proportion of participants (HA) differed

22 H. K. Cordell et al.
significantly from the overall sample proportion for that strata (Ho). For example, the per-centage of males in the weighted NSRE sample is 47.5 percent. This was treated as the nullhypothesis. For mountain bikers, however, the proportion who are male was 57.3 percent.This comparison between 47.5 percent and 57.3 percent was highly significant (z = 27.0,p < .OOOl). These pair-wise comparisons were repeated for each demographic strata acrossall 10 of the recreation activities selected
Similar hypothesis tests were conducted on the strata proport ions who agreed with eachof the 10 NEP enviromnental attitude statements (HA) versus the overall sample proportionof that strata (Ho). For example, 51.6% of the respondents who agreed with the statement“Humans have the right to modify the natural environment to suit their needs” were male,compared to 47.4% of the total sample who were male. This was also a significant difference(~~7.43, p < .OOOl). The same hypothesis test was conducted on all demographic strataacross the 10 NEP attitude items. Where significant differences were found, a Bonferroni(familywise) adjustment (i.e., alpha value divided by the number of tests) was applied inorder to identify which comparisons were genuinely significant (Huck & Cormier, 1996).
Finally, two-way Chi-square tests of independence (with associated Phi coefficients ofthe strength of associat ion) were run on the dichotomous variables of yes/no part icipat ion inan act ivi ty versus yes/no agreement with each NEP environmental at t i tude statement (Huck& Cormier, 1996). These tests were run for each enviromnental attitude-by-recreation-activity combination to identify associations between recreation participation and environ-mental a t t i tudes .
ResultsOutdoor Recreation Projiles and Trends
The first dimension explored in this paper is public participation in outdoor recreation.Before examining differences between social strata, we first provide a general overview ofpopulation-wide participation and trends. NSRE results indicated that 97% of respondentspart icipated at some level in at least one outdoor recreat ion act ivi ty over the 12 months justprior to their being interviewed. That percentage translates into approximately 206 millionpeople over age 15 participating in 1 or more of the 77 outdoor activities listed in the NSREsurvey nationwide. Walking is and has continued to be the single most popular activity(83.8% participation, a finding consistent with the 1998 Recreation Roundtable). Otherpopular activities include attending a gathering outdoors with family or friends (73.5%);visiting nature centers, nature trails, visitor centers and zoos (57.2%); picnicking (55.3%);and viewing or photographing natural scenery (54.0%). The least popular activities in theNSRE list include migratory bird hunting (2.3%), scuba diving (1.9%), surfing (1.5%), andwind surfing (0.8%).
Table 1 shows the 10 fastest growing outdoor act ivi t ies for 2000 among the 21 we havebeen ttacking since the 1983 National Recreation Survey. I t also shows the total number andpercent ofpeople aged 16 or older in 2000 who reported part icipating in at least one outdoorrecreation activity in the last 12 months. As was the case for the 1995 NSRE, birding topsthe growth list at a phenomenal rate of over 236% in the 17 years since 1983 (Cordell &Herbert , in press) . Birding is fast becoming one of the more popular act ivi t ies in the countryin terms of number of participants. Rising numbers of seniors, rising interest more broadlyin nature and learning about our natural heritage, and active promotion by birding groupsare major reasons behind this rise in popularity. Following behind birding in terms of the17-year growth trends are 9 activities ranging from hiking (196%) to swimming in natumlwaters (excluding pool swimming) (64%). Growth rates among these nine activities indicatea rapid rise in popularity of trail, motorized, camping and skiing activities.

Cultural Dimensions 23
TABLE 1 The 10 Fastest Growing Activities by Percentage Change in Numberof Participants Aged 16 and Over (1983-2001)
Growth Number of participants Percent of population(o/o) in 2001 (millions) participating in 200 1
Bird watching 235.9 71.2 33.4Hiking 195.9 73.1 34.3Backpacking 165.9 23.4 10.9Snow-mobiling 107.5 66.9 31.4Walking 91.2 179.0 83.9Off-road driving 89.2 27.9 13.1Primitive camping 81.9 32.2 15.1Developed camping 76.0 52.8 24.8Downhill skiing 66.9 17.7 8.3Swimming/river, lake 64.4 78.1 36.6
or ocean
Note. All percentages and figures shown are based upon NSRE data collected (n = 22,847)up to the time this manuscript was written. As data collection proceeds toward the ultimategoal of 50,000 completed interviews, some of the estimates in this table may change slightly.
Public Opinions on the Environment
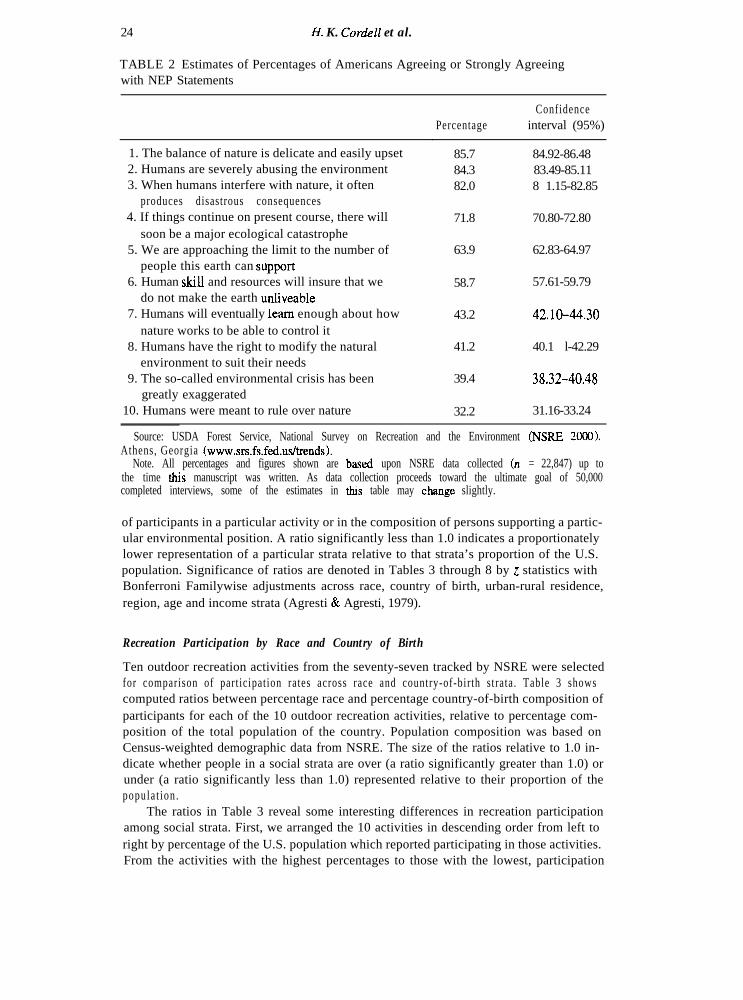
To examine Americans’ opinions on the environment, we summarized results from the mod-ified New Ecological Paradigm scale described earlier (see Dunlap et al., 1992). Estimatesof percentages of the U.S. population “agreeing to strongly agreeing” (from the earlierdescribed five-point scale) with each of the 10 slightly modified NEP items are presentedin Table 2. Items 1 through 5 represent attitudes more empathetic to nature where humansare not put above nature. Items 6 through 10 represent attitudes more anthmpocenticallyoriented and include respondents who tend more to put humans above nature. From theNSRJZ results, it is clear that many more Americans are empathetic toward the environ-ment; that more believe we are significantly impacting our natural environment, and that inthe end a major environmental catastrophe will result. Many fewer believe that our scienceand ingenuity will overcome our impacts on the earth and that we were meant to rule overnature. The three items with the highest percentages “agreeing to strongly agreeing” (1, 2and 3, each with over 80 percent of respondents) represent an opinion that the eaah isfragile and that humans are upsetting its balance. The three items that respondents wereleast likely to agree with (8,9 and 10) represent an opinion that humans have the right todominate nature and that our impacts have been exaggerated. Only 30 to 40% hold this set ofop in ions .
In the following sections, we address recreation participation and environmental opin-ion by social strata (race, country of birth, urban/rural residence, etc). These differencesare expressed as ratios of the percentage of participants (or of respondents agreeing withNEP scale items) who are within a social strata (e.g., American Indian) to the percentageof the total population (i.e.,16 or older) within that strata.. Expressing differences as ratiosenables a reader to quickly scan the tables for numbers over or under 1 .O as indications ofthe differences found. For both recreation participation and environmental opinions (seeTables 3 to 8), a strata ratio close to 1 .O indicates that the percentage of people who partici-pate in an activity (or the percentage who hold a particular environmental opinion) who arein a s trata is about the same as their proport ion of the U.S. populat ion. A rat io signif icantlyabove 1.0 indicates a higher than proportionate representation of a strata in the composit ion
24 H. K. Cordell et al.
TABLE 2 Estimates of Percentages of Americans Agreeing or Strongly Agreeingwith NEP Statements
1. The balance of nature is delicate and easily upset2. Humans are severely abusing the environment3. When humans interfere with nature, it often
produces disastrous consequences4. If things continue on present course, there will
soon be a major ecological catastrophe5. We are approaching the limit to the number of
people this earth can sqport6. Human skill and resources will insure that we
do not make the earth unliveable7. Humans will eventually learn enough about how
nature works to be able to control it8. Humans have the right to modify the natural
environment to suit their needs9. The so-called environmental crisis has been
greatly exaggerated10. Humans were meant to rule over nature
PercentageConfidence
interval (95%)
85.7 84.92-86.4884.3 83.49-85.1182.0 8 1.15-82.85
71.8 70.80-72.80
63.9 62.83-64.97
58.7 57.61-59.79
43.2 42.10-44.30
41.2 40.1 l-42.29
39.4 38.32-40.48
32.2 31.16-33.24
Source: USDA Forest Service, National Survey on Recreation and the Environment @ZXE 2000),Athens, Georgia (www.srs.fs.fed.us/trends).
Note. All percentages and figures shown are baxxi upon NSRE data collected (n = 22,847) up tothe time this manuscript was written. As data collection proceeds toward the ultimate goal of 50,000completed interviews, some of the estimates in this table may change slightly.
of participants in a particular activity or in the composition of persons supporting a partic-ular environmental position. A ratio significantly less than 1.0 indicates a proportionatelylower representation of a particular strata relative to that strata’s proportion of the U.S.population. Significance of ratios are denoted in Tables 3 through 8 by z statistics withBonferroni Familywise adjustments across race, country of birth, urban-rural residence,region, age and income strata (Agresti & Agresti, 1979).
Recreation Participation by Race and Country of Birth
Ten outdoor recreation activities from the seventy-seven tracked by NSRE were selectedfor comparison of participation rates across race and country-of-birth strata. Table 3 showscomputed ratios between percentage race and percentage country-of-birth composition ofparticipants for each of the 10 outdoor recreation activities, relative to percentage com-position of the total population of the country. Population composition was based onCensus-weighted demographic data from NSRE. The size of the ratios relative to 1.0 in-dicate whether people in a social strata are over (a ratio significantly greater than 1.0) orunder (a ratio significantly less than 1.0) represented relative to their proportion of thepopula t ion .
The ratios in Table 3 reveal some interesting differences in recreation participationamong social strata. First, we arranged the 10 activities in descending order from left toright by percentage of the U.S. population which reported participating in those activities.From the activities with the highest percentages to those with the lowest, participation
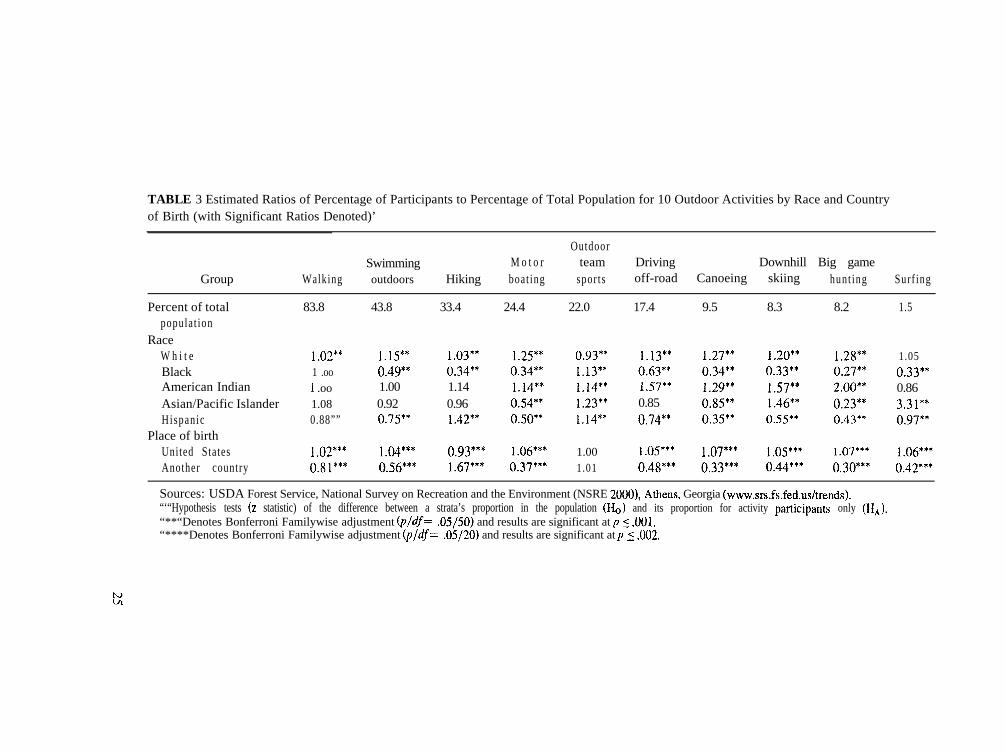
TABLE 3 Estimated Ratios of Percentage of Participants to Percentage of Total Population for 10 Outdoor Activities by Race and Countryof Birth (with Significant Ratios Denoted)’
Group
OutdoorSwimming M o t o r team Driving Downhill Big game
Walking outdoors Hiking boat ing spor ts off-road Canoeing skiing hunt ing Surf ing
Percent of totalpopulat ion
RaceW h i t eBlackAmerican IndianAsian/Pacific IslanderHispanic
Place of birthUnited StatesAnother country
83.8 43.8 33.4 24.4 22.0 17.4 9.5 8.3 8.2 1.5
1.02** 1.15** 1.03** 1.25** 0.93** 1.13** 1.27** 1.20** 1.28*’ 1.051 .oo 0.49** 0.34** 0.3411 1.13** 0.63** 0.34** 0.33** 0.27** 0.33**1 .oo 1.00 1.14 1.14** 1.14** 1.57** 1.29** 1.57** 2.00** 0.861.08 0.92 0.96 0.54** 1.23** 0.85 0.85** 1.46** 0.23** 3.31**0.88”” 0.7.5** 1.42** 0.50** 1.14** 0.74** 0.35** 0.55** 0.43** 0.97**
1.02*** 1.&I*** 0.93*** 1.06*** 1.00 1.05*** 1.07*** 1.05*** 1*07*** 1.06*‘*0.81*** 0.56*** 1.67**’ 0.37*** 1.01 0.48*** 0.33*** 0.44*** 0.30*** 0.42***
Sources: USDA Forest Service, National Survey on Recreation and the Environment (NSRE 2000), Athens, Georgia (www.srs.fs.fed.us/trends).“‘“Hypothesis tests (Z statistic) of the difference between a strata’s proportion in the population (Ho) and its proportion for activity participants only (H,,).“**“Denotes Bonferroni Familywise adjustment @/df= .05/50) and results are significant at p _( .OOl.“****Denotes Bonferroni Familywise adjustment (p/df= .05/20) and results are significant at p _( .002.

K. Cm-dell et al .
becomes increasingly specialized, expensive and/or skill based. Greater differences can beseen between the race strata among the more specialized, expensive and skill-based ac-tivities toward the right side of Table 3. Greater differences can be seen between the racestrata among the more specialized, expensive and skill-based activities toward the rightside of Table 3. Since the z-test statistic is highly sensitive to number of observations, dif-ferent magnitudes of percentage difference as indicated by the ratios show up significantbecause number of observations varies from Whites, with the highest number of obser-vations, to American Indians with the lowest number of observations (Huck & Cormier,1996).
For the most part, walking is popular among members of all strata, from Blacks toNon-Hispanic Whites to Asian/Pacific Islanders. Motor boating is favored more by Whitesand American Indians (they being over represented as proportions of participants rela-tive to their proportion of the national population) than by Asian/Pacific Islanders andHispanics. Motor boating is favored much more among Whites than among Blacks. Surf-ing is especially favored by Asians/Pacific Islanders and much less favored by Blacks(p < .OOl). Across all activities, except outdoor team sports, Blacks are significantly un-der represented. Whites are slightly over represented, and American Indians are slightlyto substantially over represented. Hispanics are under represented across all activities ex-cept for hiking, and Asians/Pacific Islanders are over represented, except for motor boat-ing and hunting (p < .OOl). Whites seem disproportionately to favor motor boating, ca-noeing, and big game hunting. Hispanics seem to favor hiking. Asian/Pacific Islandersfavor downhill skiing and surfing, they do not favor hunting. American Indians favor driv-ing motor vehicles off road, downhill skiing, and big game hunting (p < .OOl). Ratiosfor U.S. and foreign born residents of the country, as presented in Table 3, likewiseindicate some substantial differences. Except for hiking and outdoor team sports, for-eign born residents are significantly (p c .002) under represented as activity participants.As participants in outdoor team sports, foreign-born residents are about proportionatelyrepresented.
Recreation Participation by Urban-Rural Residence and Region of the Country
Table 4 provides computed ratios of percentages part icipating to percentages of total popu-lation for rural-urban and region-of-the-country strata. For the rural strata, there is a signif-icantly (p < .002) greater than proportionate percentage who participate in motor boating,driving motor vehicles off road, and big game hunting. Rural residents are significantly(p c .002) under represented in participation in surfing, and somewhat under representedin participation in outdoor team sports and downhill skiing. Urban residents are somewhatunder represented in off-road driving and hunting.
By region of the country, very little difference is seen in percentages participating inwalking for pleasure, relative to each region’s percentage of the population (See the list ofstates in each Census region in footnote 1 to Table 4). Significantly high ratios (p < .OOOS)for the New England states are found for swimming outdoors, motor boating, canoeingand downhill skiing. The ratio for big game hunting for this region is disproportionatelylow. For the Middle Atlantic region, generally the population is under represented in thecomposition of participants for a number of activities, reflecting the older, more urbanpopulation makeup of the states in this region-New Jersey, New York and Pennsylvania.Participation percentages across activit ies for residents of the East and West North Centralregions are similar, except for motor boating, canoeing, hunting, and driving off-road. Peoplein the western cluster of the Plains states which make up the West North Central regionparticipate significantly (p < .0005) more in hunting, while people in East North Central

TABLE 4 Estimated Ratios of Percentage of Participants to Percentage of Total Population for 10 Outdoor Activities by Rural/Urban Residenceand Region of the Country’
Group
OutdoorSwimming M o t o r team Driving Downhill Big game
Walking outdoors Hiking boat ing spor ts off-road Canoeing skiing Hunt ing Surfing
Percent of totalpopulat ion
ResidenceRuralU r b a n
Region’New EnglandMiddle AtlanticEast North CentralWest North CentralSouth At lan t icEast South CentralWest South CentralMountainPacific
83.8 43.8 33.4 24.4 22.0 17.4 9.5 8.3 8.2 1.5
0.86**1.04**
1.38**0.90**
0.77**1.06”*
0.98 0.94**1.01 1.02**
0.94**1.02+*
1.15**0.96**
1.011 .oo
2.09**0.72”*
0.52**1.12**
0.61*** 0.85***0.85”** 0.65***0.93*** 0.45**+1.54*** 0.36***1.01 1.48***1.32’** 0.19***1.20*** 0.49***1.34*** 0.55***0.56*** 2.63***
1.21***0.80***1.17***1.30***1.010.990.980.980.80***
2.08*“*1.051.38***1 so***0.91***0.68***0.72***0.59***0.59***
1.85***1.071.11***1.060.74***0.39***0.47***1.63***1.11***
1.07 1.44***1.03 1.051.01 1.010.99 0.940.99 1.09***0.99 0.88***0.96 0.81***1.00 0.87***1.00 0.96
1.16*+*0.84*“*0.940.90***0.78***0.78***0.87***1.46***1*37***
0.93 0.931.05 0.80***1.01 0.88***1.01 1.051.03 1.000.90 1.14***0.94 0.990.93 1.49***1.05 0.95
Sources: USDA Forest Service, National Survey on Recreation and the Environment (NSRE 2000), Athens, Georgia (www.srs.fs.fed.us/trends).‘Include states making up each region: New England-CT, ME, MA, NH, RI, VT, Middle Atlantic-NJ, NY, PA; East North Central-IL, IN, MI, OH, WS;
West North Central-IA, KS, MN, MO, NE, ND, SD; South Atlantic-DE, DC, FL, GA, MD, NC, SC, VA, WV, East South Central-AL, KY, MS, TN; WestSouth Central-AR, LA, OK, TX; Mountain-AZ, CO, ID, MT, NV, NM, UT, WY, Pacific-AK, CA, HI, OR, WA.
Sources: Source of U.S. percentages is the Census Bureau. Age, sex, and race estimates are as of November 2000. Foreign born, residence, and Census Divisionestimates are as of July 1999. Age and sex percentages are based on the 16 and over population. All others are based on the total U.S. population.
“‘“IIypothesis tests (z statistic) of the difference between a strata’s proportion in the population (Ho) and its proportion for activity participants only (HA).
f:“**“Denotes Bonferroni Familywise adjustment Cp/df = .05/20) and results are significant at p 5 .002.“***“Denotes Bonferroni Familywise adjustment (p/df = .05/90) and results are significant at p 5 .0005.

H. K. Cordell et al.
participate slightly more in downhill skiing. People in the South Atlantic states, Delawareto Florida, are over represented in swimming outdoors and surfing, but otherwise they areroughly proport ionately represented.
The two southern regions, East and West South Central, are very comparable in per-centages participating in the 10 outdoor recreation activities relative to their composition ofthe U.S. population, except for some difference in driving off road. Generally these regionsare proportionately to under represented across all activities, with the exception of drivingoff road and big game hunting. Historically, smaller percentages of people living in theseregions participate in outdoor activities, especially in downhill skiing and surfing (Cordell,1999). Part icipation percentages among people of the western Mountain region, Montana toArizona, are mixed. They are significantly (p < BOO.5) over represented in hiking, drivingoff road, downhill skiing and hunting. They are significantly (p < BOOS) under representedin participation in canoeing and surfing. People residing in the Pacific Coast states, fromAlaska to California, somewhat favor hiking and downhill skiing, but they are very muchover represented among participants in surfing. They don’t tend to favor motor boating, ca-noeing and hunting. When examining the percentages of people participating in the South,and for that matter for all regions of the country, one must bear in mind mat the availabilityof opportunities to participate in certain outdoor recreation activities (e.g., surfing) mayvary greatly from region to region.
Recreation Participation by Age and Income
Except for hunting, participation percentages relative to population percentages are higherfor the younger age strata and then progressively decrease for the older age strata (Table 5).In addition, participation percentages decrease noticeably for all activities except walkingas one moves from the youngest age group of 16-to-24 year olds down to seniors over 65.This decrease in representation of the older age groups is especially significant (p < BOOS)for the activit ies of outdoor team sports (baseball , football , soccer, etc.) , canoeing, downhillski ing, and surf ing.
The highest disproportionate representation of people under 25 is for participation inthe activities of surfing, team sports, downhill skiing, canoeing, and driving off road. Thegreatest over representation of people between 25 and 34 is in the activities of driving offroad and downhill skiing. People 35 to 44 are slightly over represented across all activitiesexcept surfing. They are substantially over represented as participants in hiking. People45 to 54, deep into their careers and mid-life, are roughly proportionate to their percentageof the population, except for team sports, downhill skiing, driving off-road, and surfing.Only for walking, motor boating and hunting are the percentages of those 5.5 to 64 yearsold close to their proportion of the population. They are significantly (p < .OOOS) underrepresented in all other activities. Very few people over 6.5 are among those who swimoutdoors, play team sports, drive off road, canoe, downhill ski, or surf, relative to theirincreasing numbers as a proport ion of the populat ion.
With regard to differences among income strata, almost all are significant at thep < BOO1 level (Table 5). Generally, persons earning under $25,000 per year are proportion-ally underrepresented as activity part icipants across al l 10 of the selected activit ies. Personsearning between $25,000 and $50,000 are roughly proportionally represented, except forunder representat ion as part icipants in downhil l ski ing and surfing and over representat ionin hunting. People in all income categories above $50,000 are over represented, with minorexceptions. The highest income group is over represented in activities such as motor boat-ing, canoeing, downhill skiing, and surfing. All income groups are roughly proportionallyrepresented as participants in the activity of walking.

TABLE 5 Estimated Ratios of Percentage of Participants to Percentage of Total Population for 10 Outdoor Activities by Age and Income’
Group
OutdoorSwimming M o t o r team Driving Downhill Big game
Walking outdoors Hiking boat ing spor ts off-road Canoeing skiing hunt ing Surf ing
Percent of totalpopulat ion
fee16-2425-3435-4445-5455-6465f
Income<$15,000$15,000-$24,999$25,000-$49,999$50,000-$74,999$75,000-$99,999$100,000+
83.8 43.8 33.4 24.4 22.0 17.4 9.5 8.3 8.2 1.5
1.02 1.37*** 1.11*** 1.24*“* 2.14*** 1.62*** 1.67*‘* 1.89*** 1.17*** 2.70***1.01 1.21*** 1.20*** 1.16*** 1.25*** 1.38*** 1.12*** 1.32’** 1.25*** 1.29***1.03 1.19*** 1.21*** 1.15*** 1.05*** 1.02 1.15*** 1.14*** 1.13*** 0.51***1.01 0.99 1.04 1.00 0.62*‘* 0.81**” 0.96 0.78*** 0.99 0.56***0.98 0.68*** 0.78*** 0.81*** 0.32*** 0.59*** 0.53*** 0.32*** 0.82*** 0.42***0.94*+* 0.37*** 0.55*** 0.51*** 0.16*** 0.32**” 0.28’** 0.12*** 0.54*** 0.09***
0.91 0.62*** 0.88*** 0.57*** 0.57*** 0.58*** 0.48*** 0.48*** 0.38*** 0.75***0.98 0.79*** 0.98 0.63*** 0.81*** 0.83*** 0.59*** 0.41*** 0.81*** 0.36***1.02 1.10*** 1.04 1.07*** 0.92*** 1.09*** 0.99 0.75*** 1.31*** 0.77***1.08”* 1.28*** 1.11*** 1.36*** 1.10*** 1.27*** 1.38**” 1.17*** 1.38*“* 0.85***1.09 1.39*** 1.20*** 1.59*** 1.13*** 1.23*** 1.61*** 1.86*** 1.21*** 1.231.09 1.43*** 1.29*** 1.67*** 1.36*** 1.47*** 1.74*** 2.76*** 1.09 2.52”**
Sources: USDA Forest Service, National Survey on Recreation and the Environment (NSRE 2000), Athens, Georgia (www.srs.fs.fed.uslnds).“‘“Hypothesis tests (z statistic) of the difference between a strata’s proportion in the population (Ho) and its proportion for activity participants only (HA).“***“Denotes Bonferroni Familywise adjustment (p/df= .05/60) and results are significant at p 5 .OOOS.

3 0 H. K. Cordell et al.
Environmental Opinions by Race and Country of Birth
We used the 10 NEP items to examine whether there were opinion differences by raceand country of birth. Ratios of the proportions “agreeing or strongly agreeing” with eachNEP item in each race and country of birth strata relative to the proportions of the U.S.population in those strata are shown in Table 6. What is particularly striking about Table 6is that there are relatively few significant differences. From left to right, the weightedpercentage of respondents “agreeing to strongly agreeing” with the NEP items goes from85.7% to 32.2%. Generally, Whites cast their opinion approximately proportionate to theirpercentage of the population across all NEP items. This is not a particularly surprisingresult since whites make up the majority of the population and this weights the overallpercentages toward their majority positions. Whites as a group tend somewhat more to feelthat the balance of nature is delicate and humans do not have a right to rule over nature.Whites are somewhat under-represented in agreeing that humans can control and have aright to modify the environment (p < .OOl).
Blacks, on the other hand, tend to feel more so than other groups that we have a rightto modify, control, and rule over nature and that we are not approaching the limit to thenumber of people who can inhabit the earth (p < .OOl). American Indians seem to feel morestrongly than al l other races that we are abusing the environment and that humans were notmeant to rule over nature. Asian and Pacific Islanders tend to feel we will ultimately be ableto control nature and avoid ecological catastrophe. Hispanics stand out in the posit ion thatwe will be able to control nature and that we have a r ight to do so. Foreign born respondentsare very similar to Hispanics in their opinions about the human-environment relationship.Generally stated, significantly (p < .002) higher percentages of foreign born residents takethe position that humans have a right to modify the environment and control nature, theenvironmental crisis is exaggerated, and the balance of nature is not all that delicate.
Environment& Opinions by Urban/Rural Residence and Region of the Country
In Table 7, rural residents are shown to indicate in significantly (p < .002) greater percent-ages than their proportion of the population that human skills will insure the future of theearth, the enviromnental crisis is exaggerated and humans were meant to rule over nature.Urban residents, on the other hand, are very close to being proportionately representedacross all NEP items. Across regions, there were significant (p < .OOOS) differences in fourof the five NEP items placing humans over nature. For the most part, fewer residents of theNew England, Mountains, Middle and South Atlantic regions took the positions of agree-ing that the environmental crisis is exaggerated and that humans were meant to rule overnature. Residents of the West North Central (Prairie states), East South Central and WestSouth Central (the deep South), however, indicate more strongly the opinion that humansare meant to rule over nature, the environmental crisis is exaggerated and humans willeventually be able to control nature.
Environmental Opinions by Age and Income
In Table 8, one finds relatively few significant differences among age strata in taking the po-si t ion that humans are responsible for abusing the environment and that human interferencewith nature could be disastrous. More significant (p < .OOOS) differences among age strataare found as one moves right toward NEP positions placing humans over nature, having aright to modify the environment, and feeling that humans were meant to rule over nature.Generally, the older age strata are over represented in NEP environmental positions thatplace humans over nature.

TABLE 6 Estimated Ratios of Percentage Agreeing or Strongly Agreeing to Percentage of Total Population for Environmental Opinions by Raceand Country of Birth’
Human Humans H u m a n sskill will h a v e H u m a n s
Balance of Humans Human Approaching insures eventually right to Environmental meantnature is abuse interference Ecological number of earth control modify cris is to
Group delicate environment disastrous catastrophe people limit Iiveable nature environment exaggerated rule
Percent of total 85.7 84.3 82.0 71.8 63.9 58.7 43.2 41.2 39.4 32.2populat ion
R a c eW h i t e 1.05** 1.02 1.02 0.98 1.02 1 .oo 0.91** 0.90** 0.98 0.92**Black 0.92 0.97 1.02 1.06 0.81** 1.02 1.12** 1.17** 0.94 1.20**American Indian 1.17 1.17 1.17 1.17 1.00 1.00 1 .oo 0.83 0.83 0.67Asian/Pacif icIslander 0.84 0.84 0.84 1.04 0.96 0.88 1 .oo 0.92 0.76** 0.92**Hispanic 0.89”* 0.95 0.92 1.04 1.06 1.03 1.30** 1.33** 1.21** 1.20**
Country of birthUnited States 1.02*** 1.01*** 1.01*** 1.00 1.00 1 .oo 0.97*** 0.96**+ 0.97*** 0.97***Another country 0.81”** 0.89*** 0.88*** 1.01 0.99 0.97 1.32*** 1.42*** 1.31*** 1.28***
Sources: USDA Forest Service, National Survey on Recreation and the Environment (NSRE 2000), Athens, Georgia (www.srs.fs.fed.us/trends).“‘“Hypothesis tests (z statistic) of the difference between a strata’s proportion in the population (Ho) and its proportion for activity participants only (II,),“**“Denotes Bonferroni Familywise adjustment Cp/df = .05/50) and results are significant at p 5 .OOl.“***“Denotes Bonferroni Familywise adjustment @/df = .05/20) and results are significant at p 5 ,002.

TABLE 7 Estimated Ratios of Percentage Agreeing or Strongly Agreeing to Percentage of Total Population for Environmental Opinions byRural/Urban Residence and Region’
Group
Human Humans H u m a n sskill will h a v e H u m a n s
Balance of H u m a n s Human Approaching insures eventually right to Environmental meantnature is abuse interference Ecological number of earth control modify cris is todelicate environment disastrous catastrophe people limit liveable nature environment exaggerated rule
Percent of total 85.7 84.3 82.0 71.8 63.9 58.7 43.2 41.2 39.4 32.2populat ion
ResidenceRuralU r b a n
RegionNew EnglandMiddle AtlanticEast No. CentralWest No. CentralSouth At lan t icEast So. CentralWest So. CentralMountainPacific
1.08**0.98**
1.06 1.06 1.02 1.04 1.10 1.04 0.96 0.940.98 0.93 0.93 0.99 0.94 0.88*** 1.10*** 0.981.05 1.06 1.06 0.98 0.99 1.02 1.07 0.931.10 1.08 1.06 1 .oo 1.08 1.10 0.99 1 .oo1.01 1.03 1.04 1.03 0.97 0.96 0.93 1 .oo1.04 1.03 1.03 1.04 1.04 1.11 0.93 0.960.92 0.95 0.97 1.01 1.00 1.06 1.11*** 1.100.96 0.91 0.9 1 0.91 0.99 0.97 0.85*** 0.920.95 0.99 0.96 1.01 1.03 0.99 0.97 1.08
1.09**0.98**
1.09**0.98**
1.050.99
1.09** 1.13**0.98** 0.97**
1.060.99
1.040.99
1.20** 1.16**0.95** 0.96**
0.79*** 0.79***0.88*** 0.80***1.01 1.021.23*** 0.990.89*** 1.011.23*** 1.18***1.08 1.35***1.05 0.80***0.98 0.96
Sources: USDA Forest Service, National Survey on Recreation and the Environment (NSRE 2000), Athens, Georgia (wwwsrsfsfeduskrends).‘Include states making up each region: New England-CT, ME, MA, NH, RI, VT, Middle Atlantic-NJ, NY, PA; East North Central-IL, IN, MI, OH, WS; West North
Central-IA, KS, MN, MO, NE, ND, SD; South Atlantic-DE, DC, FL, GA, MD, NC, SC, VA, WV; East South Central-AL, KY, MS, TN; West South Central-AR,LA, OK, TX; Mountain-AZ, CO, ID, MT, NV, NM, UT, WY, Pacific-AK, CA, HI, OR, WA.
Sources: Source of U.S. percentages is the Census Bureau. Age, sex, and race estimates are as of November 2000. Foreign born, residence, and Census Divisionestimates are as of July 1999. Age and sex percentages are based on the 16 and over population. Ail others are based on the total U.S. population.
“‘“Hypothesis tests (z statistic) of the difference between a strata’s proportion in the population (Ho) and its proportion for activity participants only (H,).“**“Denotes Bonferroni Familywise adjustment ( p/df = .05/20) and results are significant at p 5 ,002.“***“Denotes Bonferroni Familywise adjustment (p/df= .05/90) and results are significant at p 4 .0005.

TABLE 8 Estimated Ratios of Percentage Agreeing or Strongly Agreeing to Percentage of Total Population for Environmental Opinions by Ageand Income’
Group
Human Humans H u m a n sSkill will h a v e H u m a n s
Balance of H u m a n s Human Approaching insures eventually right to Environmental meantnature is abuse interference Ecological number of earth control modify cris is todelicate environment disastrous catastrophe people limit liveable nature environment exaggerated rule
Percent of totalpopulat ion
Age16-2425-3435-4445-5455-6465+
Income<$15,000$15,000-$24,999$25,000-$49,999$50,000-$74,999$75,000-$99,999$100,000+
85.7 84.3 82.0 71.8 63.9 58.7 43.2 41.2 39.4 32.2
1 .oo 0.99 0.98 1.06 1.07 0.99 1.14*** 1.04 1.01 0.79***1.00 1.01 0.99 1.03 0.96 0.91*** 0.84*** 0.97 0.85*** 0.84***1.02 1.00 0.98 1.01 0.97 1.00 0.89*** 0.93 0.97 0.92***1.03 1.01 1.03 0.98 0.99 1.04 0.93 035*** 0.94 0.991.04 1.03 1.05 1.01 1.03 1.11*** 1.06 1.09 1.22*** 1.24***0.92 0.98 1.01 0.90*** 0.99 1.00 1.15*** 1.14*** 1.09*** 1.36
0.89 0.99 0.95 0.96 0.97 0.91 0.99 1.16*** 1.07 1.1s***1.07 1.13*** 1.13*** 1.13*** 1.17*** 1.21*** 1.20*** 1.16*** 1.20*** 1.131.05 1.05 1.03 1.04 1.04 1.03 0.86*+” 0.79*** 0.95 0.91***1.03 1.01 1.02 1.01 0.98 0.97 035*** 0.93 0.84*** 0.941.04 0.98 0.96 0.96 0.91 1.04 0.91 0.89 0.91 0.981.02 0.97 0.95 0.90 0.86 0.95 0.90 1.08 0.97 0.86
Sources: USDA Forest Service, National Survey on Recreation and the Environment (NSRE 2000), Athens, Georgia (www.srs.fs.fed.us/trends).“‘“Hypothesis tests (z statistic) of the difference between a strata’s proportion in the population (Ho) and its proportion for activity participants only (I-I,).“***“Denotes Bonferroni Familywise adjustment @/df = .05/60) and results are significant at p _( .0008.
2

H. K. Cordell et al.
Generally, an inverse proportional relationship exists between income levels and NEP posi-tions. Especially for the NEP items placing humans over nature, the lower income earners(i.e., under $25,000) tend to be over represented. There are fewer differences between in-come strata for NEP items placing nature and the environment in a more equal status withhumans. The exception is for people earning between $15,000 and $25,000 per year, who,for the most part, are significantly (p < .OOOS) over represented across all NEP items. How-ever, this income strata is especial ly over represented on the NEP i tems stat ing that humanswill insure the future of the earth, have the right to modify the environment, and be ableto control nature. This group is also over represented in the opinion that the environmentalcrisis is exaggerated. People earning between $25,000 and $75,000 tend to be significantly(p < .OOOS) under represented among those feeling the environmental crisis is exaggeratedand humans have the right to modify the environment or that we will eventually be able tocontrol nature.
Linkages Between Recreation Choices and Environmental Attitudes
A number of previous studies have suggested a posi t ive associat ion between part icipat ion inoutdoor recreation activities and pro-environmental behavior (e.g., Jewell, 2000; Theodori,Luloff, & Willits, 1998). Frequency of recreational visits to forest areas and participation inforest recreation activities were found by Nord, Luloff, and Bridger (1998) to be moderatelyassociated with pro-environmental behavior, but only weakly associated with environmen-tal concern. They found, however, that membership in recreation clubs or organizationsis positively correlated with both nature appreciation and environmental concern. In gen-eral, outdoor recreation activities that lead to appreciative leisure behavior are associatedwith attitudes of nature appreciation, which in turn, is associated with environmental con-cern. Environmental concern and appreciative leisure patticipation have been found to besignificant predictors of proenviromnental behaviors (Jewell, 2000).
To look further at possible associations between recreation participation and environ-mental attitudes, as addressed in the most recent NSRE, we computed correlation coef-ficients between recreation activity participation and NEP responses. Phi coefficients for2 x 2 tables of agreement were computed and are shown in Table 9 (Huck & Cormier, 1996).Significant correlations between activity participation (yes/no) and NEP environmental re-sponses (agree/strongly agree or not) revealed four types of respondents:
People who feel humans are not above nature and that an environmental cr is is loomsor is possible are associated with the activities of walking and surfing (from the list of 10activities we selected for this analysis). There is a tendency for Asian/Pacific Islanders andpersons born in this country to be over represented among those who walk and surf. Aswell, there is a tendency for middle-to-high-income persons to be over represented amongpart icipants in both of these act ivi t ies . But, there the demographic l ikeness ends. Part icipantsin these two activities, and thus people falling into this enviromnental position group differconsiderably in age and region of residence.
People who feel humans are not above nature, but to whom no envimnmental crisislooms are associated with the activities of swimming, motor boating, driving off road,canoeing, and downhill skiing. There is a tendency for Whites and American Indians, aswell as persons born in the United States, to be over represented among swimmers, motorboaters, off-road drivers, canoers and downhill skiers. Similarly, younger persons, from 44down to 16 years, and persons earning over $50,000 per year tend to be over represented inthese act ivi t ies , and thus in this environmental posi t ion group.
People who feel humans are above nature and an environmental crisk i s poss ib le areassociated only with hiking. American Indians and Hispanics are over represented among

TABLE 9 Environmental Positions Based on Correlations (Phi Coefficients for 2 x 2 Tables of Agreement) Between NEP Items and RecreationActivity Participation
Description ofenvironmental position
NEP items
Humansnot above
nature,and crisis
looms
Walking
Humansnot abovenature, butno crisis
Swimming
Humansabovenature,
but crisisp o s s i b l e
Hikingoutdoors
Humansnot abovenature, butno crisis
Motorboating
Humansabovenature,b u t n ocrisis
Teamsports
Humansnot
abovenature
DriveOR-road
Humansnot abovenature, butno crisis
Canoeing
Humansnot abovenature, butno crisis
Downhillskiing
No crisis
Big gamehunting
Humansnot abovenature, but
the ba lanceis delicate
Surfing
Human skill and resources will insurethat we do not make the earthunliveable (59%)
-.040*
Humans are severely abusing theenvironment (84Y0)
-.@.?8**
Humans have the right to modify thenatural environment to suit theirneeds (41Yc)
-.051* -.094*
Humans were meant to rule overnature (32Ycc)
-.080*
Humans will eventually learn enoughabout how nature works to be able tocontrol it (434)
-.Ohl*
-.126*
-.070*
If things continue on present coursethere will soon be a major ecologicalcatastrophe (72Yc)
The balance of nature is delicate andeasily upset (86Yc)
.025**
The so-called environmental crisishas been greatly exaggerated (3YYc)
We are approaching the limit to thenumber of people this earth cansupport (64Y~)
-.053*
-.043*
.028**
-.101*
-.027**
When humans interfere with natureit often produces disastrousconsequences (82Yc)
-.028** -.024**
-.065*
.032* -.062* -.030*
-.060* .028**
-.048*
.048*
-.033*
.K?3** -.034* -.032*
-.026**
-.032* -.029** -.033*
-.039*
-.039* -.026**
-.058* -.063* -.0.53*
-.033* -.034* -.029**
-.048* -.030**
-.029**
.026** .023**
-.037* .037*
-.040*
-.047* -.028**
z ‘Chi-square significant at .Ol; “Chi-square significant at .05.

36 H. K. Cordel l e t a l .
hikers, as are persons born in another country. Persons residing in the New England, RockyMountain. and Pacific Coast states, and people in the younger age and higher income groups,tend to be over represented among hikers.
People who feel there is no environmental crisis are associated with participation inteam sports outdoors and hunting for big game. The race of participants in these twoactivities differs substantially, as do the percentages of participants who are foreign born.Their composition by urban-rural residence and by region also differ substantially, as dotheir ages and incomes. Their only similarity is in what they believe about the environment:that is, that there is no looming environmental crisis.
These results and identif icat ion of the above four groupings of enviromrtental pos i t ionspoint out that across the diversity of Americans a number of statistically significant asso-ciations may be observed between recreation activity choices and environmental attitudes.These associations allow us to group participants in different activities by similarity ofpositions on the environment. Such groupings can be highly useful, for example, in de-signing outreach, education and involvement programs, a strong and growing interest andneed among natural resource management agencies from local to federal. An examinationof within-group demographic profiles across activities within the same environmental po-sition group, except for those who feel there is no environmental crisis, reveals a great dealof similarity in social composition.
Summary and ImplicationsAccording to the NSRE results, over 97% of Americans participated in at least one outdooractivity during the year 2000. That percentage translates into approximately 206 millionpeople over age 15 participating in one or more of the 77 outdoor activities in the survey.Walking continues to be the single most popular of these activities, although birding isgrowing fastest and is joining the ranks of act ivi t ies Americans most favor. Fol lowing birdingare a number of other fast growing activities ranging from hiking, which grew 196%, toswimming in natural waters at 64% for the period of 1983-2001. The composition of thesefastest growing activities indicate a rapid rise in popularity of trail, motorized, camping andsnow skiing activities.
Also, it appears that many Americans are concerned about the natural environment.There apparently are many more Americans who believe, than there are who don’t believe,that we are significantly impacting the natural environment and may be heading for a majorenvironmental catastrophe. Fewer believe that our science and ingenuity will overcome ourimpacts or that we were meant to rule over nature. The three NEP items with the highestpercentages “agreeing to strongly agreeing,” each with over eighty percent of respondents,represent an opinion that the earth is fragile and that humans are upsett ing i ts balance. Thethree items with the lowest percentages represent an opinion that humans have the right todominate nature and that our impacts have been exaggerated.
Recreation participation and environmental opinions, the dimensions of focus in thispaper, are obviously important across al l of this country’s diverse populat ion. As we exam-ined these dimensions and compared them across race, residence, age, and income strata,substantial and noteworthy differences were observed. In the following few paragraphs weinterpret the importance of the differences we observed in recreation participation and envi-ronmental opinions inlightof forecasteddemographic trends (Cordell & Overdevest, 2001).
Few would argue against the not ion that the composi t ion of the United States’ popula-tion is rapidly changing. Likewise, few would argue that in all likelihood that compositionwill continue to change. Perhaps, then, our examination of differences in recreation partic-ipation and environmental opinion among those social strata predicted to change (by the

Cultural Dimemions 31
U.S. Census Bureau) might provide insights into future recreation and environmental opin-ion trends. Across the demographic factors of race, country of birth, rural-urban residence,region of residence, age and income, we found a number of differences in recreation partic-ipation and environmental opinions. First, most of the comparisons made were significantand indicate sweeping, significant differences in the recreation choices among people indifferent social strata. Similarly, although somewhat less sweeping, comparisons acrossNEP items indicated significant differences in environmental attitudes between many ofthese same social strata.
Projections from the United States Census Bureau presented earlier in this paper, andfrom other sources, detail the dramatic changes in the demographic composition of theUnited States population that are expected in coming years (U.S. Census Bureau 2000).Given, then, the connections we have observed between demographic characteristics, recre-at ion part icipat ion and environmental posi t ions, i t seems obvious that future recreat ion andenvironmental planning and policy will need to account for these differences. Assumingthat the connections we observed and report in this paper hold, we offer the followingprognostications for the future.
The Rising Proportions of the U.S. Population who are Hi&panic, Black, Asian/PaciJicIsikier and Born in Another Country will Resalt in Shift in the Type ofParticipation in and Attiti Toward Outdoor Recreation
Predictions from all sources indicate that the social changes we are observing now willvery likely continue well into the future. Between 2000 and 2050, the U.S. Census Bureaupredicts the percentage of the population made up by Whites will fall from 76% to 50%.Meanwhile, the percentage who are Black will rise from 12 to 15%, the percentage who areHispanic will rise from 9 to 21%, and the percentage who are Asian or PacificIslander will rise from 4 to 11%. Additionally, unless national immigration policy changes,each year into the foreseeable future there will be around one million additional peo-ple coming to live in the United States from other parts of the world. By 2050, thatwould mean around 50 million residents of foreign origins that wilI have been added since2000.
With these changes in population composition, demand for activities such as walking,hiking, outdoor team sports, downhill skiing and surfing are likely to rise in the future(Cordell et al., 1996). They are likely to rise in popularity much faster than activities suchas swimming, motor boating, driving motor vehicles off road and hunting. The infusionof more people born outside the United States should add demand pressure to hiking andoutdoor team sports .
As ethnic proportions continue to shift, we can also expect a number of shifts in en-vironmental “leanings.” First, the slower-growing population current majority made upmostly of non-Hispanics, most of whom are Whites, along with the American Indiansof this country, will likely continue to feel that humans do not have a right to rule overnature and that our ingenuity and technology will not make an environmentally stressedearth more liveable in the end. But this persistent “majority” opinion will increasingly beoffset by more rapidly increasing populations of Hispanics, Blacks, and Asian/Pacific Is-landers who tend more to feel that we have a right to modify the environment and controlnature, and that our technology will ultimately allow us to correct large-scale impacts ofhuman habitation and activity on the earth. Growing percentages of foreign born residentswho also generally take the position that humans have a right to modify the environ-ment and control nature will add to the decay of this White/American Indian majorityopin ion .

3 8 H. K. Cordell et al.
The Rise in Proportion of the Population Which Lives in Urban Areas will AffectRecreation Participation, But not Environmental Opinion
In 1790, when the earliest U.S. census of population was done, a mere 5% of the country’spopulation lived in urban areas. By 1920, the population balance between rural and urbanshifted and this country became predominantly urban. By 1990,75% of the people in theUnited States lived in urban areas. Since 1990, metropolitan growth has accounted for anestimated 82% of total U.S. population growth, even though metropolitan counties thus faraccount for only 18% of the total U.S. land base (U.S. Census Bureau, 1997). Across regions,the cities with the largest overall predicted population increase include Phoenix, San Diego,Tampa, and Atlanta, all expected to grow 50% or more over their 1995 population by 2020.This country has transformed from one in which almost 40% of its population was rural, toone which now is over 80% urban.
Urban and rural residents differ in the outdoor recreation activities they choose andthe environmental positions they take. Thus, the more rapidly increasing urban populationof the future will likely cause increases in participation in and demand for more vigorousactivities like walking, swimming, hiking, outdoor team sports, canoeing, downhill skiingand surfing. Activities like motor boating, driving off road and hunting are likely to beslower growing.
Both urban and rural populations are expected to grow in the future, with urban growthoutpacing rural growth. While the pro-environmental leaning of this faster growing urbanpopulation will continue to dominate country-wide opinion, it is likely to be mediatedsomewhat by disproport ionately higher representat ion of rural residents among those in thecountry who hold the opinion that human skill will insure the earth’s livability, that theenvironmental crisis is exaggerated, and that humans were meant to rule over nature. Thenet effect of the more human centered position on the environment held by rural residents,however, will not likely have a large effect on society-wide environmental opinion giventhat rural residents make up only about 20% of the population.
Rising Median Age and Proportions in Older Age Groups will Moderate DemandGrowth in Some Outdoor Activities and Move Environmental Opinion a Bit TowardEarth over Humans
Not only are we becoming more urban, we are also growing older. Median age is predictedto rise from around 35 years in 2000 to just over 38 in 2050 (Day, 1996). Most of thisincrease will occur in the next 20 years. The U.S. population age 65 and over is projectedto increase from about 13% to between 16 and 18% by 2020 (Cordell & Overdevest,2001).
Increasing age leads to decreasing percentages of people who participate in outdoorrecreation, especially in activit ies that are more physically challenging. Thus, the general ag-ing of the country’s populat ion wil l moderate future growth of act ivi t ies such as swimming,outdoor team sports, driving off road, canoeing, downhill skiing and surfing. Participationpercentages in activities such as walking and hiking are likely to see some increases indemand pressures due to a more rapidly increasing proportion of people aged 55 and older.
Increasing numbers of people now between 35 and 54, who will be moving into theranks of seniors 55 and older, will tend, over t ime, to move the overall societal environmentalposition toward humans not being over the environment. However, increasing numbers ofyounger people who feel we will eventually be able to control nature and who are movinginto this middle age category will over time tend to moderate the influence of increasingnumbers of older, environmentally leaning people. Dwindling numbers of the current oldestage cohort who feel the environmental crisis is exaggerated and humans were meant to rule

Cultural Dimensions 39
over nature will slowly make a shift in society-wide environmental position toward natureas those now younger move into these older age groups.
Continued Increases in Incomes will Likely Result in Overall Increases in RecreationParticipation and a Greener Environmental Attitade
Finally, i f real income ( inflat ion adjusted) continues to r ise in this country, as i t did between1960 and 2000, gains will be realized by almost all Americans. In 1960, the lowest 20%earned just over $14,000 per year. The highest 5% earned over $68,000. By 2000, the lowest20% were earning almost $22,000 per year and the highest 5% were earning over $145,000.This represents a growing dispari ty, but widespread growth nonetheless.
Over time, as real incomes continue to rise in this country, we can expect upwardpressure for participation in all outdoor activities. This growth pressure can especially beexpected for expensive activities like motor boating, driving off road, canoeing, downhillskiing, and surfing, which require expensive equipment or travel of appreciable distancesfrom home for participation Least affected by rising incomes are likely to be activitiessuch as walking, which are inexpensive, and hunting (i.e., deer, wildfowl, etc) which is nothighly income dependent. Rising incomes may also influence some people’s positions onthe environment. Since lower-income people tend to be less environmentally oriented andmore trusting that humans can eventually control nature, rising incomes may tend to mod-erate these views somewhat since lower income people also tend to feel we are approachingthe limits of human effects on the environment.
In conclusion, continuing diversification of this country’s population matters. As wecontemplate the future for recreation and environmental planning in this country, diversityhas to be adeliberately considered factor. Passing reference to increasing diversi ty without i tsbeing hard l inked to decisions and anticipated outcomes of planning just wil l not suff ice anymore. As the papers in this special issue of Leisure Sciences show, demographic, behavioral,and cultural differences are linked to differences in outdoor recreation participation andenvironmental opinions. Thus, changes in this country’s demographic composition willlikely result in changes in how we engage and how we perceive of the out-of-doors. Howwe Americans use and view our vast natural world has a lot to do with that world’s future.We in the research conmmnity must continue to keep our f ingers on the quickening pace ofthe American pulse and keep this information flowing freely for use in better connectingthe public with those who are charged with the stewardship of our natural resources.
ReferencesAgresti, A., & Agresti, B. F. (1979). Statistical methods for the social sciences. San Franciso, CA:
Dellen Publishing Company.Bowen, G. L. (1994). Estimating the reduction in nonresponse bias from using a mail survey as a
backup for nonrespondents to a telephone interview survey. Research on Social Work Pmctice,4(l), 115-m.
Bright, A. D., & Porter, R. (in press). Wildlife related recreation, meaning, and environmental concern.Human Dimensions of Wildlife, 6(4), 259-276.
Cordell, H. K., & Herbert, N. G. (in press). The popularity of birding is still growing. Birding.CordelI, H. K. (1999). Outdoor recreation in American life: A national assessment of demand and
supply trends. Champaign, IL: Sagamore Publishing.Cordell, H. K., Green, G. T., & Betz, C. J. (forthcoming). Outdoor recreation in 21st century America
State College, PA: Venture Publishing, Inc.Cordell, H. K., McDonald, B. L., Lewis, B., Miles, M., Martin, J., & Bason, J. (1996). United States
of America. In G. Cushman, A. J. Veal, & J. Zuzanek (J.?ds.), World leisure participation: Freetime in the global village (pp. 215-235). Wallingford, UK: CAB InteruationaL

40 K. Cot-dell et al.
Cordell, H. IL, & Overdevest, C. (2001). Footprints on the land: an asse.~sment of demographictrend.v and the future of natural resources in the United States. Champaign, IL: SagamorePublishing.
Day, J. C. (1996). Population projections of the United States by age, sex, race, and Hispanic ori-gin: 1995 to 2050. In U.S. Bureau of the Census (Ed.), Currentpopulation reports, P2S-1130.Washington, DC: U.S. Government Priming Office.
Del Pinal, J., & Singer, A. (1997). Generations of diversity: Latinos in the United States. PopulationBulletin, 52, l-48.
Douglass, R. W. (1999). History of outdoor recreation and nature-based tourism in the United States. InH. K. Cordell et al., Outdoor recreation in American rife (pp.15-24). Champaign, IL: SagamorePublishing.
Dujack, S. R. (1997). Notice & comment: Poll says support for regulation growing. EnvironmentalForum, 14(2), 17.
Dukakis, M. S. (1996). Environmental politics in post-world-war-IT America. Resources Conservationand Recycling, 18(l), 5-9 .
Dunlap, R. I., Van Liere, K. D., Mertig, A. G., Catton, Jr., W. R., & Howell, R. E. (1992). Measuringenabrsement of an ecological worldview: A revised NEP scale Paper presented at the Annualmeeting of the Rural Sociological Society, The Pennsylvania State University, University ParkCollege, PA, August, 1992.
Dwyer, J. E., & Hutchinson, R. (1990). Outdoor recreation participation and preferences by BlackandWhite Chicago households. In J. Vining (Ed.), Social science and natural re.source recreationmanagement (pp. 49-67). Westview Press: Boulder, CO.
Exter, T. G. (1993). The declining majority.Americon Demographics, 15(l), 59.Floyd, M. F., Shinew, K. J., McGuire, F., & Noe. F. (1994). Race, class, and leisure activity preferences:
Marginality and ethnicity revisited Journal of Leisure Research, 26(2), 158-173.Groves, R. M. (1990). Theories and methods of telephone surveys. Annual Review @Sociology, 16,
221-40.Holt, D., & Smith, T. M. F. (1979). Post-stratification. Journal ofthe Royal Statistical Society, A-142,
33-46.Huck, S. W., & Cormier, W. H. (1996). Reading statistics and research (2nd ed.). New York, NY
Addison, Wesley and Longman, Inc.JewelI, T. D. (2OG0). Out&or leisure and envimnmentalism amang college students. Unpublished
master’s thesis, The Pennsylvania State University, University Park College, PA.Jones, R. E. (1998). Black concern for the environment: Myth versus reality. Society & Natural
Resources, 11(3), 209-228.Link, M. W., & Oldendick, R. W. (1998 ). Called-Id: Does it help or hinder survey research Paper
presented at the Annual meeting of the American Association for Public Opinion Research,St. Louis, MO.
Newell, S. J., & Green, C. L. (1997). Racial-differences in consumer environmental concern. Journalof ConsumerA$air.s, 31(l), 53-69.
Nie, M. A. (1999). Environmental opinion in the American West. Society & Natural Resources, J+?(2),163-170.
Nord, M., Luloff, A. E., & Bridger, J. C. (1998). The association of forest recreation with environ-mentalism. Environment and Behavior 32(2), 235-246.
Officeof Management and Budget. (1997) Standards for maintaining, collecting and presenting federaldata on race and ethnicity. U.S. Federal Register, Appendix A, October 30, 1997.
Oldendick, R. W., Bishop, G. F., Sorenson, S. W., & Tuchfarber, A. J. (1988). A comparison of thekish and last birthday methods of respondent selection in telephone surveys. Journal of O$icialStatistics, 4, 307-3 18.
Outdoor Recreation Resources Review Commission. (1962). National Recreation Survey. ORRRCStudy Report 19. Washington, DC: U.S. Government Printing Office.
Pollard. K. M., & O’Hare, W. P (1999). America’s racial and ethnic minorities. Population Bulletin,54(3), l-48.
Presser S., Blair, J., & Triple& T. (1992). Survey sponsorship, response rates, and response effects.Social Science Quarterly 73(3), 698-702.

Cultural Dimensions 41
The Recreation Roundtable. (1998). Outdoor recreation in America 1998. Washington, DC: RoperStarch.
The Recreation Roundtable (1999). Out&or recreation in America 1999: The family and the envi-ronment. Washington, DC: Roper Starch.
Roper Organization (1990). The environment: Public attitudes and individual behavior. New York,NY Roper Organization.
Shabecoff, P. (2ooO). Earth rising: American environmentalism in the 21st century. Washington, DC:Island Press.
Theodori, G. L., Luloff, A. E., & Willits, F. K. (1998). The association of outdoor recreation andenvironmental concern: Reexamining the Dunlap-Heffeman thesis. Rural Sociology, 63(l),94-108.
Thomsen, I., & Halmoy, A. (1998). Combining data from surveys and administrative record systems:The Norwegian experience. International Statistical Review, 66(2), 201-221.
Times Mirror. (1994). From anxiety toward action: A status report on conservation in 1994. Times-Mirror Magazine f National Environmental Forum Survey, June, 58.
Tucker, C., Lepkowski, J., Casady, R., & Groves, R. (1992). Commercial residential telephone lists:Their characteristics anduses in survey design. Social Science ComputerReview, 10(2), 158173.
U.S. Census Bureau (1997). Estimates ofthe population of metropolitan areas: Annual time series,July I, 1991, to July I, 19%. Washington, DC: U.S. Census Bureau, Population Division, Popu-lation Estimates Program.
U.S. Census Bureau. (2000). Populationprojections ofthe total residentpopulation by quarter: middleseries, April I, 1999 to January 1, 2101. Washington, DC: U.S. Census Bureau, PopulationDivision, Population Estimates Program.
Viiden, R. J., & Walker, G. J. (1999). Ethnic/racial and gender variations among meanings given to,and preferences for, the natural environment. Leisure Sciences, 21(3), 219-239.
Zhang, L. C. (2000). Post-stratification and calibration--A synthesis. American Statistician, M(3),178 184.