Embed Size (px)
Citation preview
Recruit, Retain, Retrain , Reassess: The 4 Rs of Health Human
Resource DevelopmentFely Marilyn E. Lorenzo RN, DrPH
College of Public Health, UP Manila
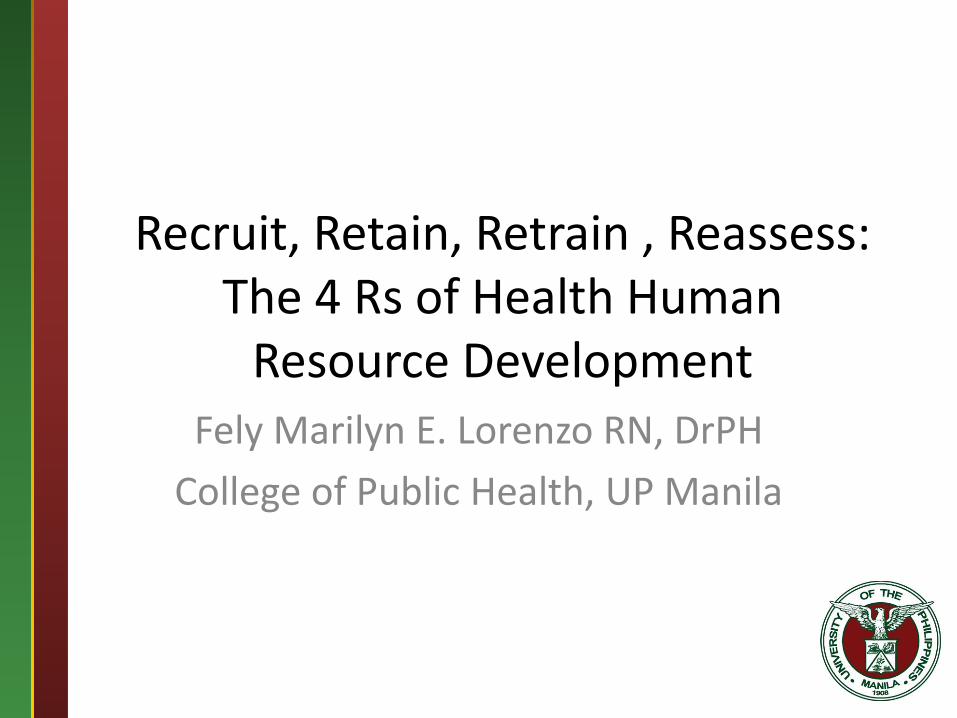
Presentation Outline• Health human resource Situationer :Present
Crisis of HRH in the Philippines• Retention Factors to encourage healthcare
workers to stay in the country• Retrain: Towards OBE and Transformative
Education• Recruit and Reassess: Master Plan results 2005
and 2014• Potential effects of ASEAN integration on the
country’s health human
Message Outline
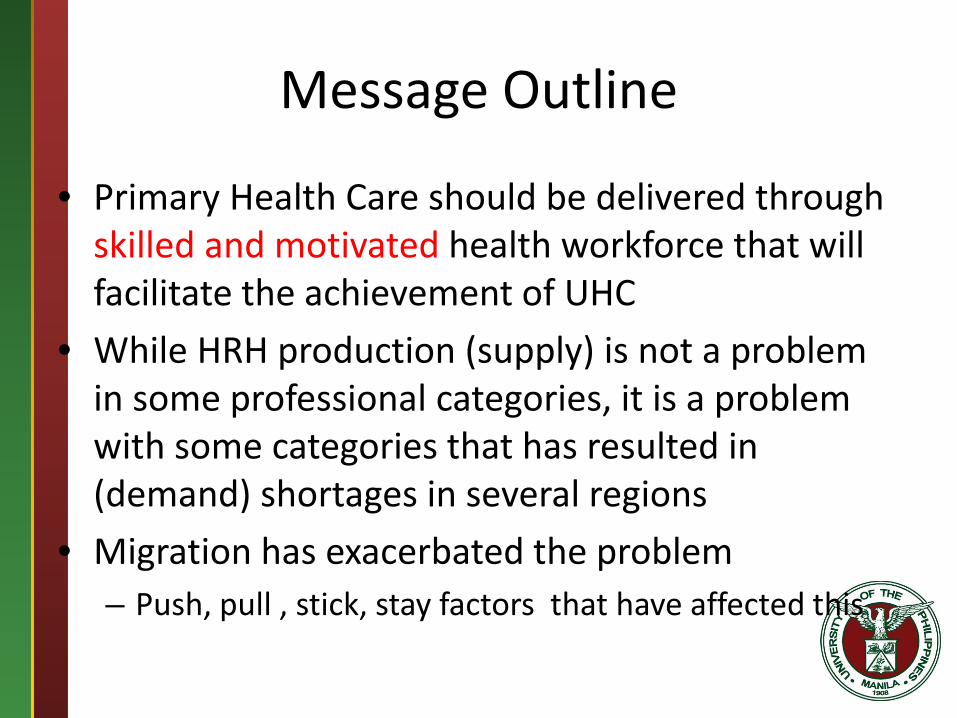
• Primary Health Care should be delivered through skilled and motivated health workforce that will facilitate the achievement of UHC
• While HRH production (supply) is not a problem in some professional categories, it is a problem with some categories that has resulted in (demand) shortages in several regions
• Migration has exacerbated the problem– Push, pull , stick, stay factors that have affected this
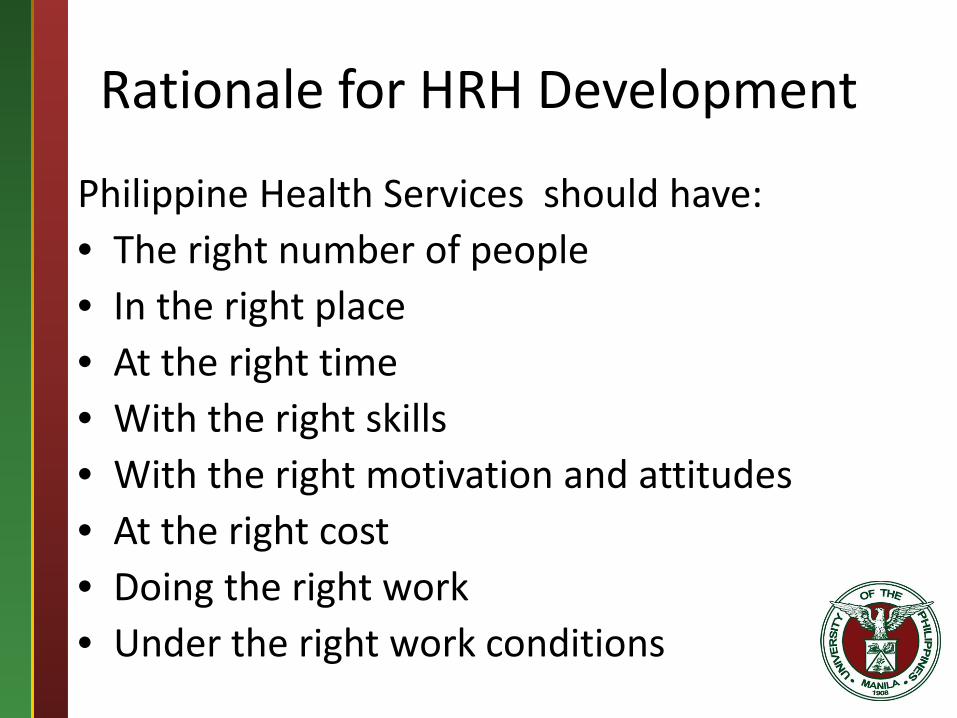
Rationale for HRH Development
Philippine Health Services should have: • The right number of people• In the right place• At the right time• With the right skills• With the right motivation and attitudes• At the right cost• Doing the right work • Under the right work conditions

Global Situation• A critical shortage of health workers in 57
countries (30% of 193 WHO member states): shortage was defined relative to need
• Overproduction and maldistribution in other countries (eg. Philippines, Kenya)
• Underproduction but no shortage in other countries (e.g. US, norway, France)
• Increased production in response to underproduction (eg UK in case of nurses)
• High out-migration (eg India, Philippines, South Africa, Germany, Poland)
• High out-migration high in-migration, relative underproduction eg New Zealand
• Philippines-overprduction, maldistribution, high out-migration, nil in migration, low return migration

Source: WHO (2006). The World Health Report 2006 – Working Together for Health. Geneva, World Health Organization
We need a strong health workforce to achieve the MDGs
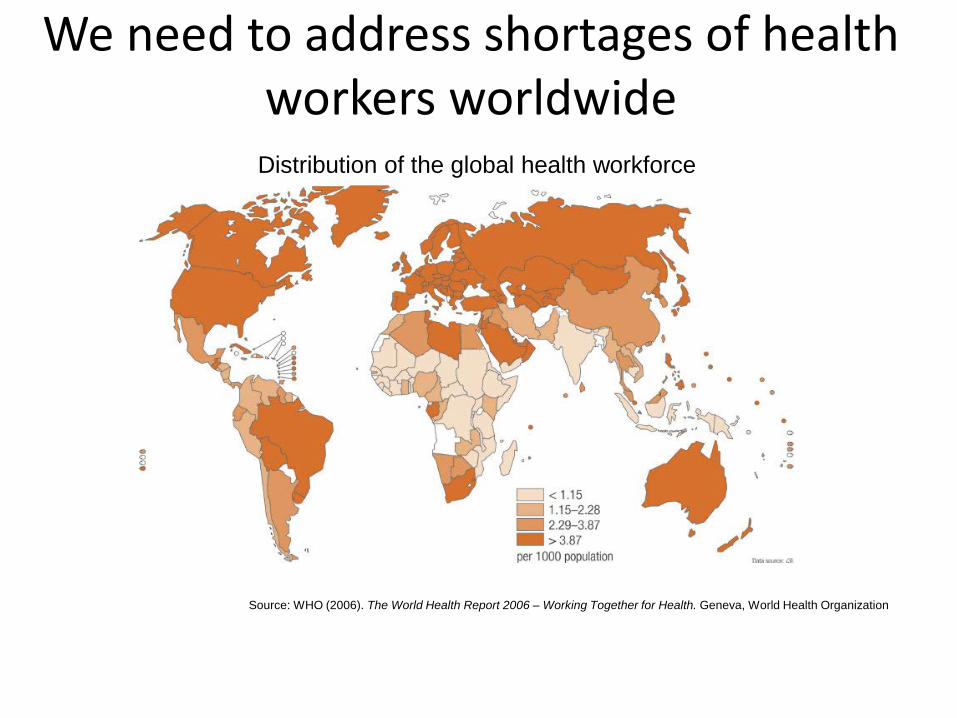
We need to address shortages of health workers worldwide
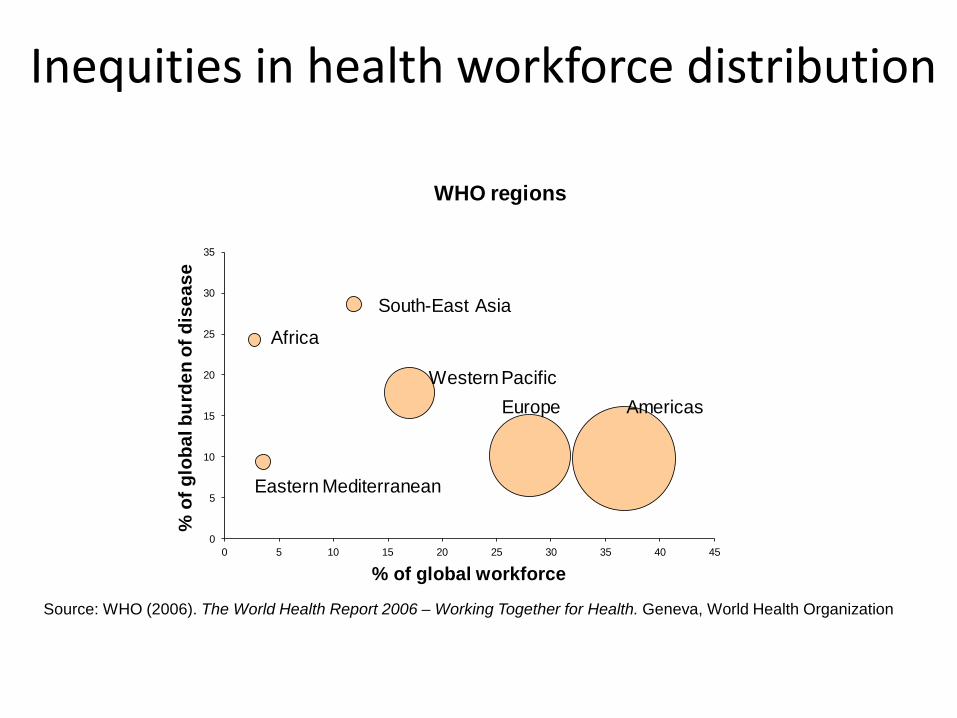
Distribution of the global health workforce
Source: WHO (2006). The World Health Report 2006 – Working Together for Health. Geneva, World Health Organization
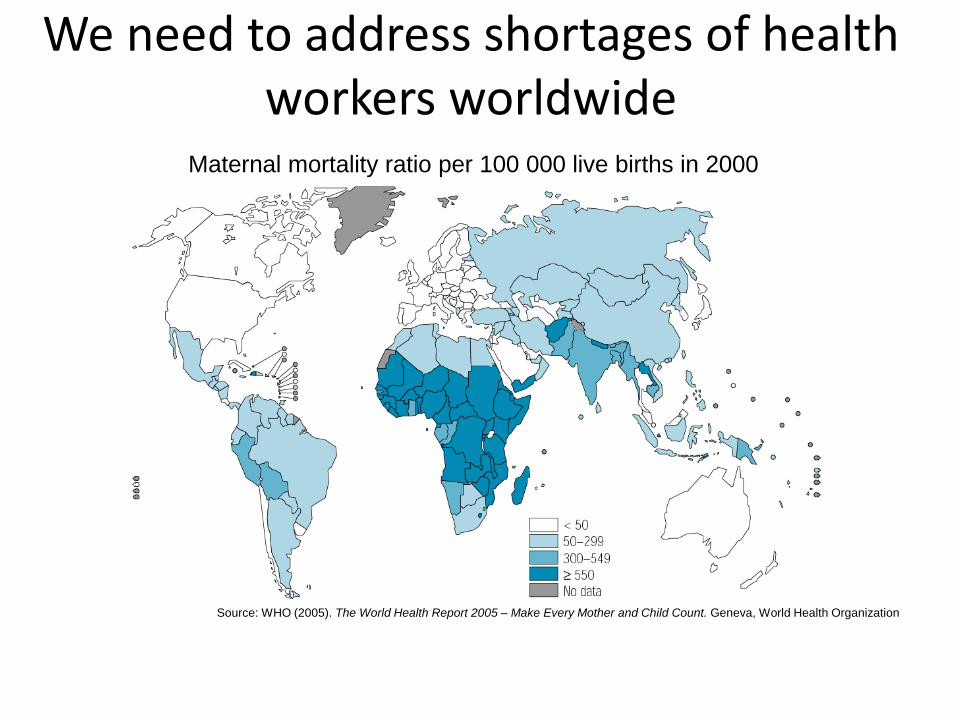
We need to address shortages of health workers worldwide
Source: WHO (2005). The World Health Report 2005 – Make Every Mother and Child Count. Geneva, World Health Organization
Maternal mortality ratio per 100 000 live births in 2000
0
5
10
15
20
25
30
35
0 5 10 15 20 25 30 35 40 45
% o
f glo
bal b
urde
n of
dis
ease
% of global workforce
WHO regions
AfricaSouth-East Asia
Eastern Mediterranean
Western PacificEurope Americas
Inequities in health workforce distribution
Source: WHO (2006). The World Health Report 2006 – Working Together for Health. Geneva, World Health Organization
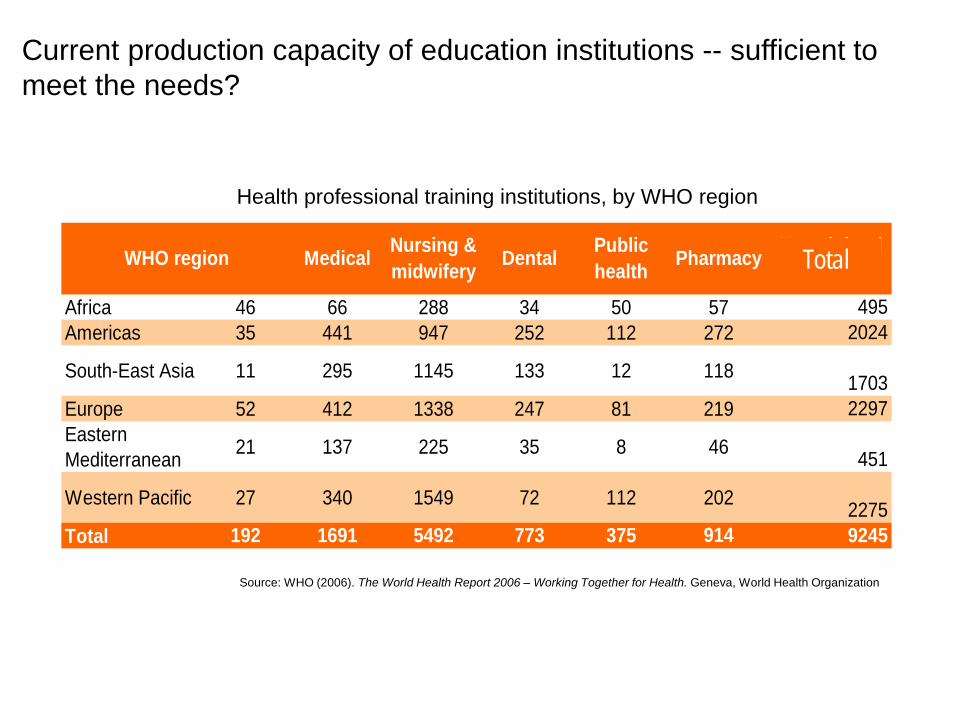
Current production capacity of education institutions -- sufficient to meet the needs?
Health professional training institutions, by WHO region
Africa 46 66 288 34 50 57 495Americas 35 441 947 252 112 272 2024
South-East Asia 11 295 1145 133 12 118 1703Europe 52 412 1338 247 81 219 2297Eastern Mediterranean 21 137 225 35 8 46 451
Western Pacific 27 340 1549 72 112 202 2275Total 192 1691 5492 773 375 914 9245
Pharmacy Unweighted totalDental Public
healthMedical Nursing & midwiferyWHO region Total
Source: WHO (2006). The World Health Report 2006 – Working Together for Health. Geneva, World Health Organization

PHILIPPINE SITUATION
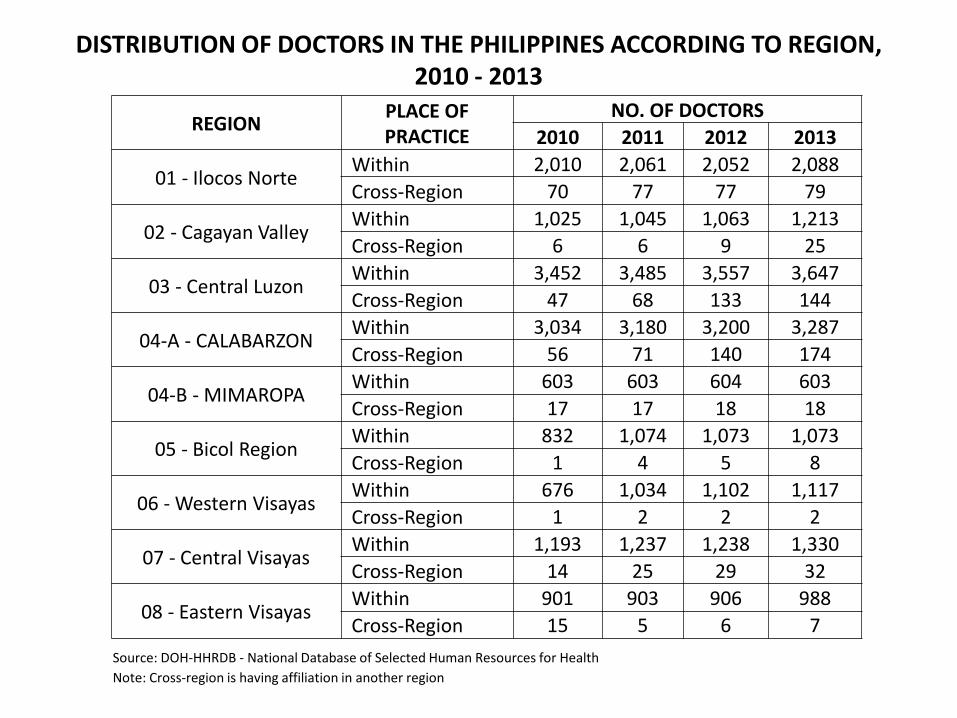
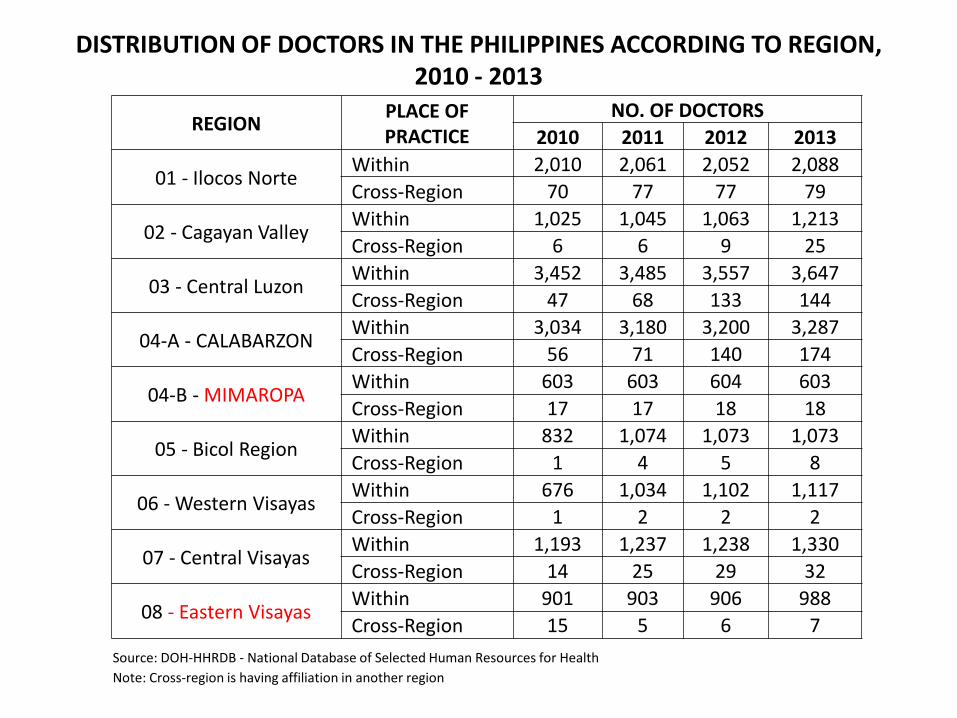
DISTRIBUTION OF DOCTORS IN THE PHILIPPINES ACCORDING TO REGION, 2010 - 2013
REGION PLACE OF PRACTICE
NO. OF DOCTORS2010 2011 2012 2013
01 - Ilocos NorteWithin 2,010 2,061 2,052 2,088Cross-Region 70 77 77 79
02 - Cagayan ValleyWithin 1,025 1,045 1,063 1,213Cross-Region 6 6 9 25
03 - Central LuzonWithin 3,452 3,485 3,557 3,647Cross-Region 47 68 133 144
04-A - CALABARZONWithin 3,034 3,180 3,200 3,287Cross-Region 56 71 140 174
04-B - MIMAROPAWithin 603 603 604 603Cross-Region 17 17 18 18
05 - Bicol RegionWithin 832 1,074 1,073 1,073Cross-Region 1 4 5 8
06 - Western VisayasWithin 676 1,034 1,102 1,117Cross-Region 1 2 2 2
07 - Central VisayasWithin 1,193 1,237 1,238 1,330Cross-Region 14 25 29 32
08 - Eastern VisayasWithin 901 903 906 988Cross-Region 15 5 6 7
Source: DOH-HHRDB - National Database of Selected Human Resources for HealthNote: Cross-region is having affiliation in another region
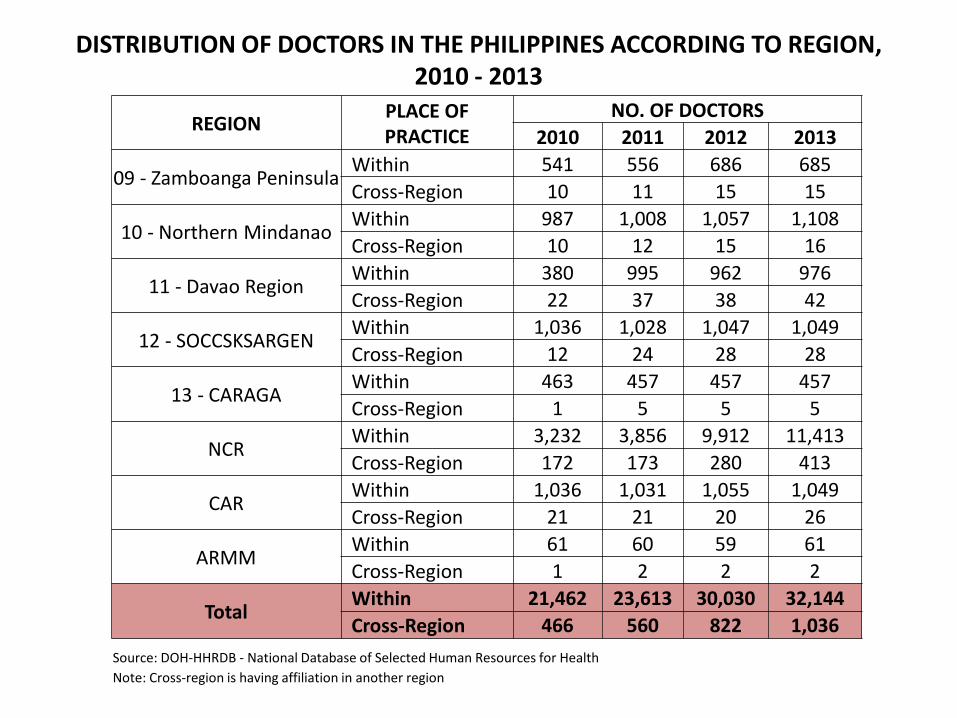
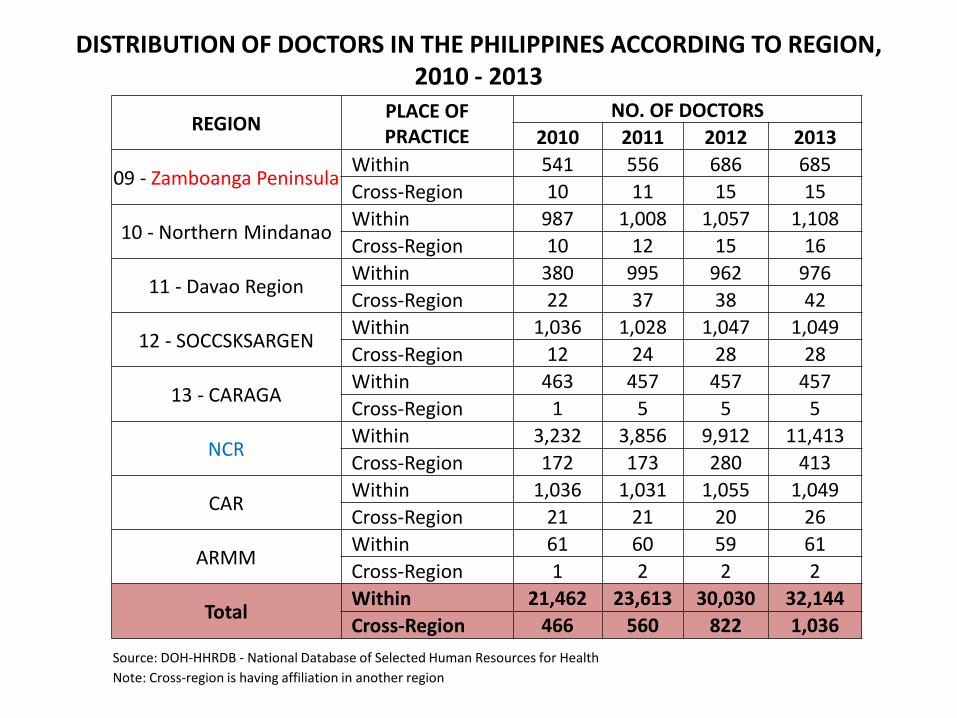
DISTRIBUTION OF DOCTORS IN THE PHILIPPINES ACCORDING TO REGION, 2010 - 2013
REGION PLACE OF PRACTICE
NO. OF DOCTORS2010 2011 2012 2013
09 - Zamboanga PeninsulaWithin 541 556 686 685Cross-Region 10 11 15 15
10 - Northern MindanaoWithin 987 1,008 1,057 1,108Cross-Region 10 12 15 16
11 - Davao RegionWithin 380 995 962 976Cross-Region 22 37 38 42
12 - SOCCSKSARGENWithin 1,036 1,028 1,047 1,049Cross-Region 12 24 28 28
13 - CARAGAWithin 463 457 457 457Cross-Region 1 5 5 5
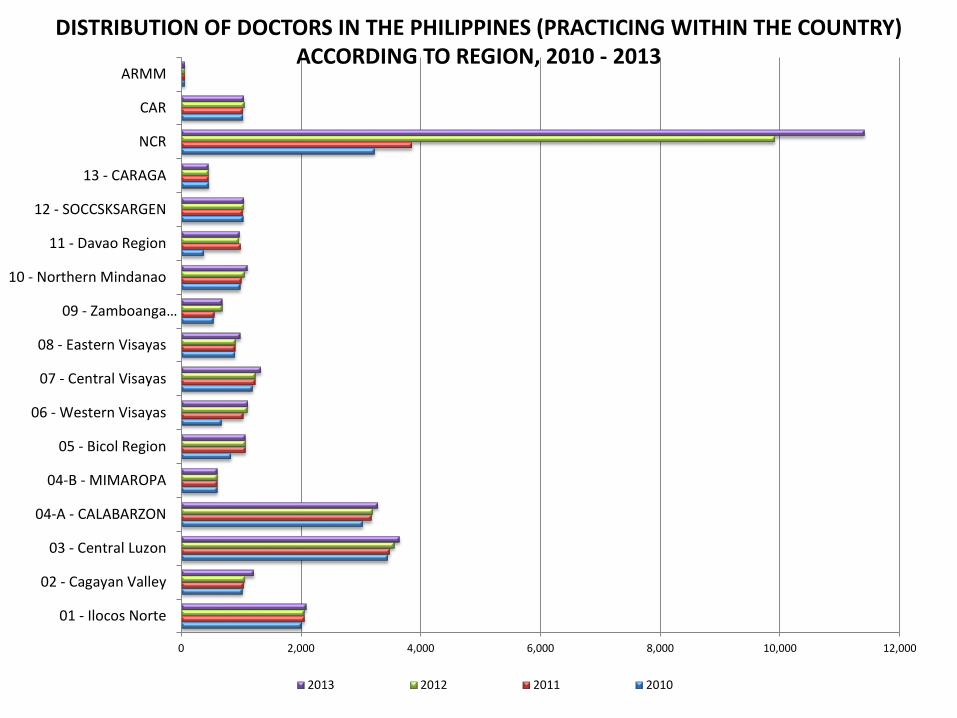
NCRWithin 3,232 3,856 9,912 11,413Cross-Region 172 173 280 413
CARWithin 1,036 1,031 1,055 1,049Cross-Region 21 21 20 26
ARMMWithin 61 60 59 61Cross-Region 1 2 2 2
TotalWithin 21,462 23,613 30,030 32,144Cross-Region 466 560 822 1,036
Source: DOH-HHRDB - National Database of Selected Human Resources for HealthNote: Cross-region is having affiliation in another region
0 2,000 4,000 6,000 8,000 10,000 12,000
01 - Ilocos Norte
02 - Cagayan Valley
03 - Central Luzon
04-A - CALABARZON
04-B - MIMAROPA
05 - Bicol Region
06 - Western Visayas
07 - Central Visayas
08 - Eastern Visayas
09 - Zamboanga…
10 - Northern Mindanao
11 - Davao Region
12 - SOCCSKSARGEN
13 - CARAGA
NCR
CAR
ARMM
2013 2012 2011 2010
DISTRIBUTION OF DOCTORS IN THE PHILIPPINES (PRACTICING WITHIN THE COUNTRY) ACCORDING TO REGION, 2010 - 2013

0 50 100 150 200 250 300 350 400 450
01 - Ilocos Norte
02 - Cagayan Valley
03 - Central Luzon
04-A - CALABARZON
04-B - MIMAROPA
05 - Bicol Region
06 - Western Visayas
07 - Central Visayas
08 - Eastern Visayas
09 - Zamboanga…
10 - Northern Mindanao
11 - Davao Region
12 - SOCCSKSARGEN
13 - CARAGA
NCR
CAR
ARMM
2013 2012 2011 2010
DISTRIBUTION OF DOCTORS IN THE PHILIPPINES (PRACTICING ACROSS THE REGION) ACCORDING TO REGION, 2010 - 2013
Health Teams and UHC• UHC to ensure equitable access to
health care requires PHC HEALTH TEAMS working together
• Critical Level is 23 Doctors , Nurses and Midwives per 10,000 population
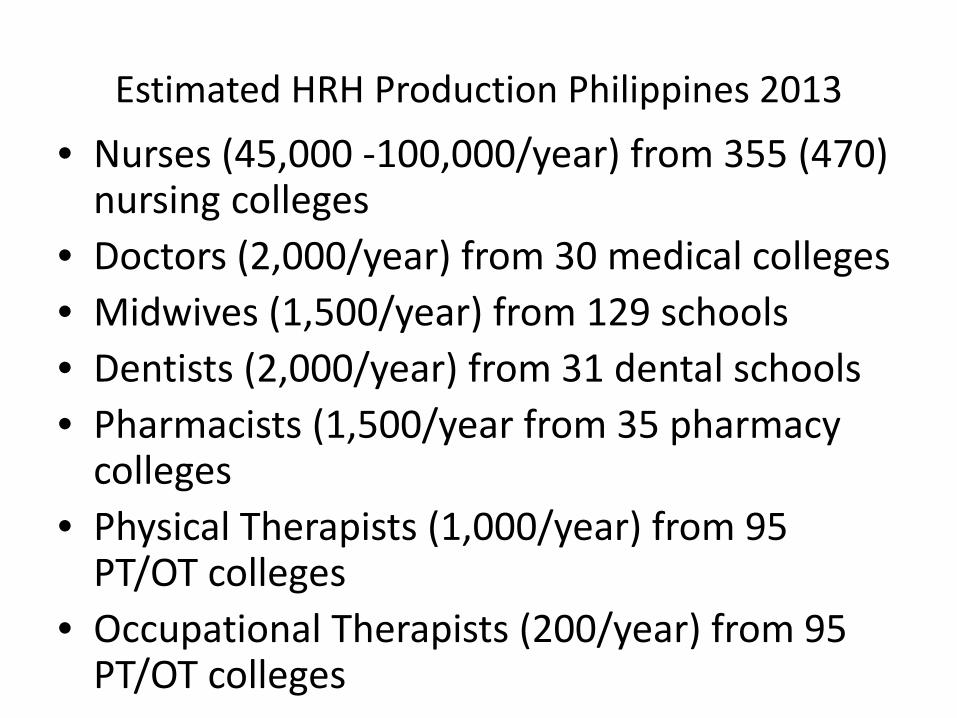
Estimated HRH Production Philippines 2013• Nurses (45,000 -100,000/year) from 355 (470)
nursing colleges• Doctors (2,000/year) from 30 medical colleges• Midwives (1,500/year) from 129 schools• Dentists (2,000/year) from 31 dental schools• Pharmacists (1,500/year from 35 pharmacy
colleges• Physical Therapists (1,000/year) from 95
PT/OT colleges• Occupational Therapists (200/year) from 95
PT/OT colleges

2012 Trends in Passing Percentage /Number of Registered Professional
Data from PRC, 2012
Profession No. of No. of Passing No. of Ratio in PHC / School Graduates/Year Percentage Professionals 10,000 pop
Registered (2012)
1 Dentistry 25 1,210 41.8 27,999 1.97
2 Medical Technology 76 1,600 77 30,891 2.53
3 Medicine 38 4,500 70.4 70,418 4.37
4 Midwifery 252 7,380 43.9 73,682 1.14
5 Nursing 491 89,000 41.3 526,897 9.92
6 Nutrition and Dietetics 36 484 67 6,834 0.35
7 Optometry 9 100 66 4,778
8 Pharmacy 80 3,000 52.2 35,912 2.98
9 Physical/Occupational 90 725 51.5 13,202 0.16Therapy
10 Radiologic Technology 69 2,000 48 8,678
11 Respiratory Therapy 16 321 3
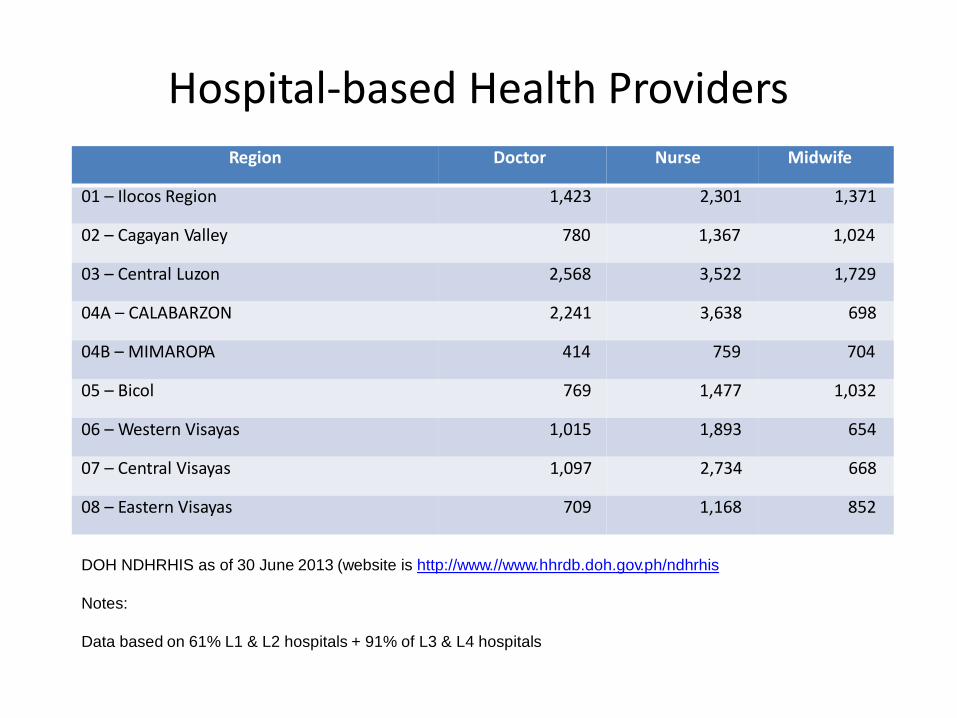
Hospital-based Health Providers
DOH NDHRHIS as of 30 June 2013 (website is http://www.//www.hhrdb.doh.gov.ph/ndhrhis
Notes:
Data based on 61% L1 & L2 hospitals + 91% of L3 & L4 hospitals
Region Doctor Nurse Midwife
01 – Ilocos Region 1,423 2,301 1,371
02 – Cagayan Valley 780 1,367 1,024
03 – Central Luzon 2,568 3,522 1,729
04A – CALABARZON 2,241 3,638 698
04B – MIMAROPA 414 759 704
05 – Bicol 769 1,477 1,032
06 – Western Visayas 1,015 1,893 654
07 – Central Visayas 1,097 2,734 668
08 – Eastern Visayas 709 1,168 852
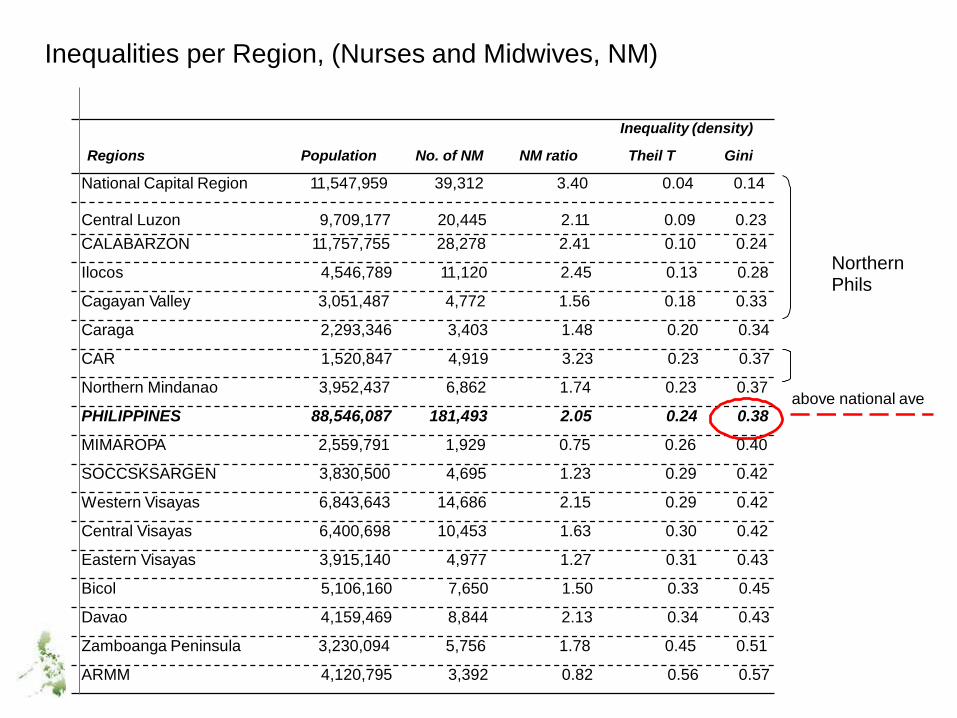
Inequalities per Region, (Nurses and Midwives, NM)
NorthernPhils
above national ave
Inequality (density)
Regions Population No. of NM NM ratio Theil T Gini
National Capital Region 11,547,959 39,312 3.40 0.04 0.14
Central Luzon 9,709,177 20,445 2.11 0.09 0.23CALABARZON 11,757,755 28,278 2.41 0.10 0.24
Ilocos 4,546,789 11,120 2.45 0.13 0.28
Cagayan Valley 3,051,487 4,772 1.56 0.18 0.33
Caraga 2,293,346 3,403 1.48 0.20 0.34
CAR 1,520,847 4,919 3.23 0.23 0.37
Northern Mindanao 3,952,437 6,862 1.74 0.23 0.37
PHILIPPINES 88,546,087 181,493 2.05 0.24 0.38
MIMAROPA 2,559,791 1,929 0.75 0.26 0.40
SOCCSKSARGEN 3,830,500 4,695 1.23 0.29 0.42
Western Visayas 6,843,643 14,686 2.15 0.29 0.42
Central Visayas 6,400,698 10,453 1.63 0.30 0.42
Eastern Visayas 3,915,140 4,977 1.27 0.31 0.43
Bicol 5,106,160 7,650 1.50 0.33 0.45
Davao 4,159,469 8,844 2.13 0.34 0.43
Zamboanga Peninsula 3,230,094 5,756 1.78 0.45 0.51
ARMM 4,120,795 3,392 0.82 0.56 0.57
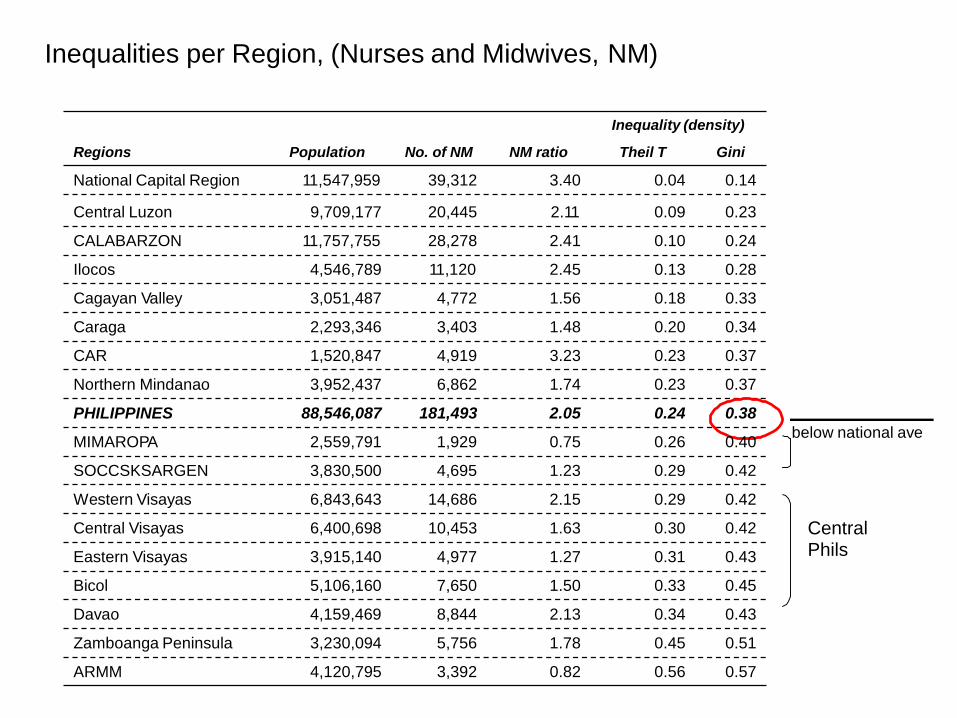
Inequalities per Region, (Nurses and Midwives, NM)
Inequality (density)
Regions Population No. of NM NM ratio Theil T Gini
National Capital Region 11,547,959 39,312 3.40 0.04 0.14
Central Luzon 9,709,177 20,445 2.11 0.09 0.23
CALABARZON 11,757,755 28,278 2.41 0.10 0.24
Ilocos 4,546,789 11,120 2.45 0.13 0.28
Cagayan Valley 3,051,487 4,772 1.56 0.18 0.33
Caraga 2,293,346 3,403 1.48 0.20 0.34
CAR 1,520,847 4,919 3.23 0.23 0.37
Northern Mindanao 3,952,437 6,862 1.74 0.23 0.37
PHILIPPINES 88,546,087 181,493 2.05 0.24 0.38below national aveMIMAROPA 2,559,791 1,929 0.75 0.26 0.40
SOCCSKSARGEN 3,830,500 4,695 1.23 0.29 0.42
Western Visayas 6,843,643 14,686 2.15 0.29 0.42
CentralPhils
Central Visayas 6,400,698 10,453 1.63 0.30 0.42
Eastern Visayas 3,915,140 4,977 1.27 0.31 0.43
Bicol 5,106,160 7,650 1.50 0.33 0.45
Davao 4,159,469 8,844 2.13 0.34 0.43
Zamboanga Peninsula 3,230,094 5,756 1.78 0.45 0.51
ARMM 4,120,795 3,392 0.82 0.56 0.57
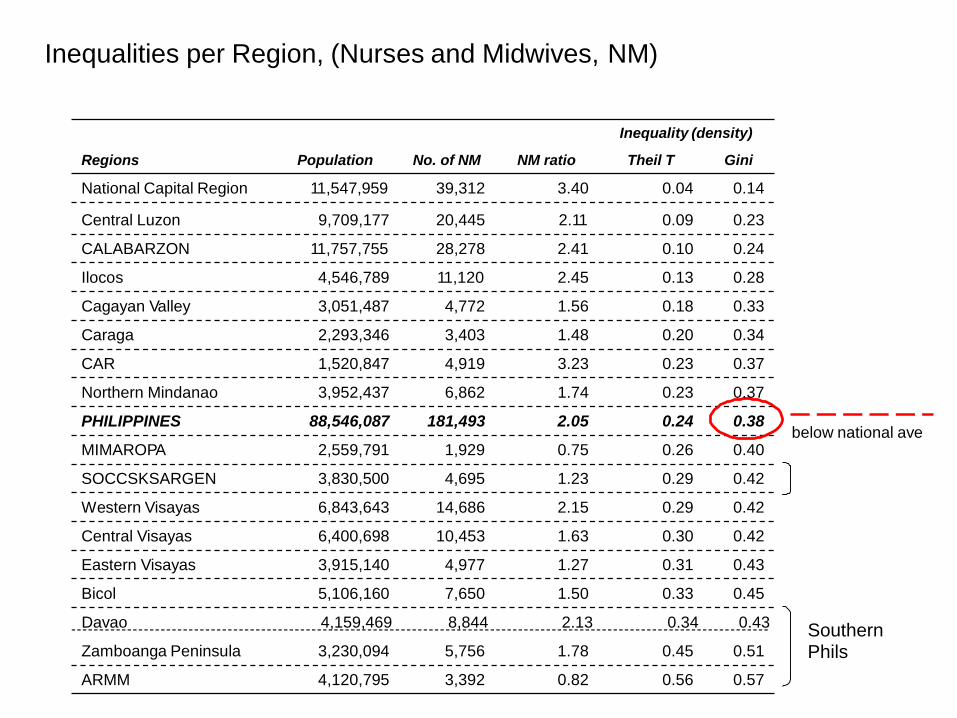
Inequalities per Region, (Nurses and Midwives, NM)
Inequality (density)
Regions Population No. of NM NM ratio Theil T Gini
National Capital Region 11,547,959 39,312 3.40 0.04 0.14
Central Luzon 9,709,177 20,445 2.11 0.09 0.23
CALABARZON 11,757,755 28,278 2.41 0.10 0.24
Ilocos 4,546,789 11,120 2.45 0.13 0.28
Cagayan Valley 3,051,487 4,772 1.56 0.18 0.33
Caraga 2,293,346 3,403 1.48 0.20 0.34
CAR 1,520,847 4,919 3.23 0.23 0.37
Northern Mindanao 3,952,437 6,862 1.74 0.23 0.37
PHILIPPINES 88,546,087 181,493 2.05 0.24 0.38below national ave
MIMAROPA 2,559,791 1,929 0.75 0.26 0.40
SOCCSKSARGEN 3,830,500 4,695 1.23 0.29 0.42
Western Visayas 6,843,643 14,686 2.15 0.29 0.42
Central Visayas 6,400,698 10,453 1.63 0.30 0.42
Eastern Visayas 3,915,140 4,977 1.27 0.31 0.43
Bicol 5,106,160 7,650 1.50 0.33 0.45
Davao 4,159,469 8,844 2.13 0.34 0.43 SouthernPhilsZamboanga Peninsula 3,230,094 5,756 1.78 0.45 0.51
ARMM 4,120,795 3,392 0.82 0.56 0.57
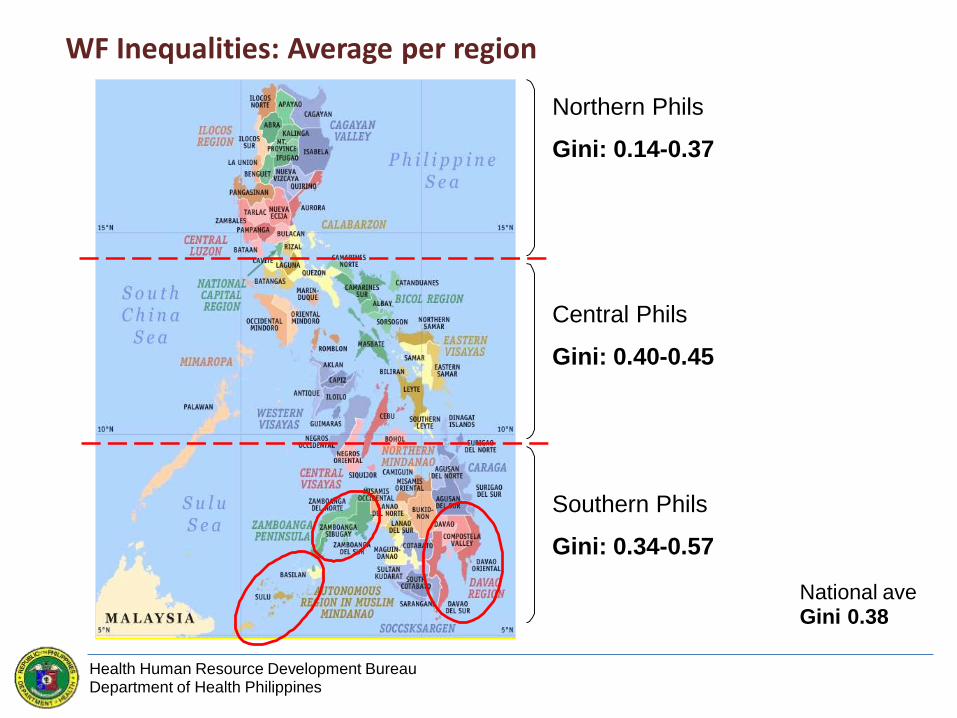
WF Inequalities: Average per region
Northern Phils
Gini: 0.14-0.37
Central Phils
Gini: 0.40-0.45
Southern Phils
Gini: 0.34-0.57
National aveGini 0.38
Health Human Resource Development BureauDepartment of Health Philippines
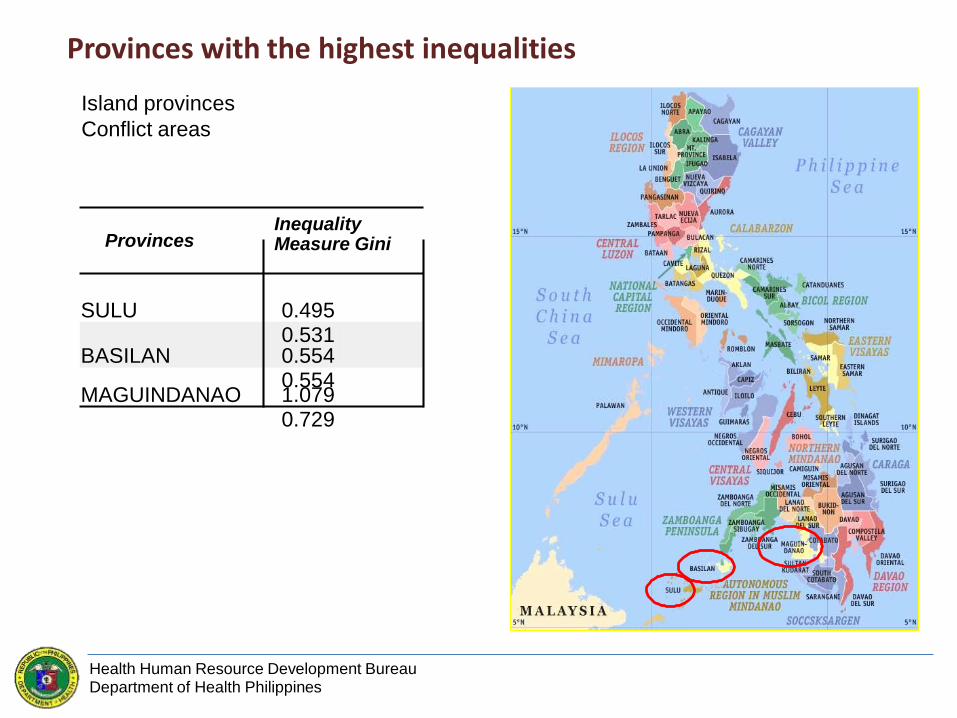
Provinces with
Island provincesConflict areas
the highest inequalities
InequalityMeasure GiniProvinces
Health Human Resource Development BureauDepartment of Health Philippines
SULU 0.495 0.531
BASILAN 0.554 0.554
MAGUINDANAO 1.079 0.729
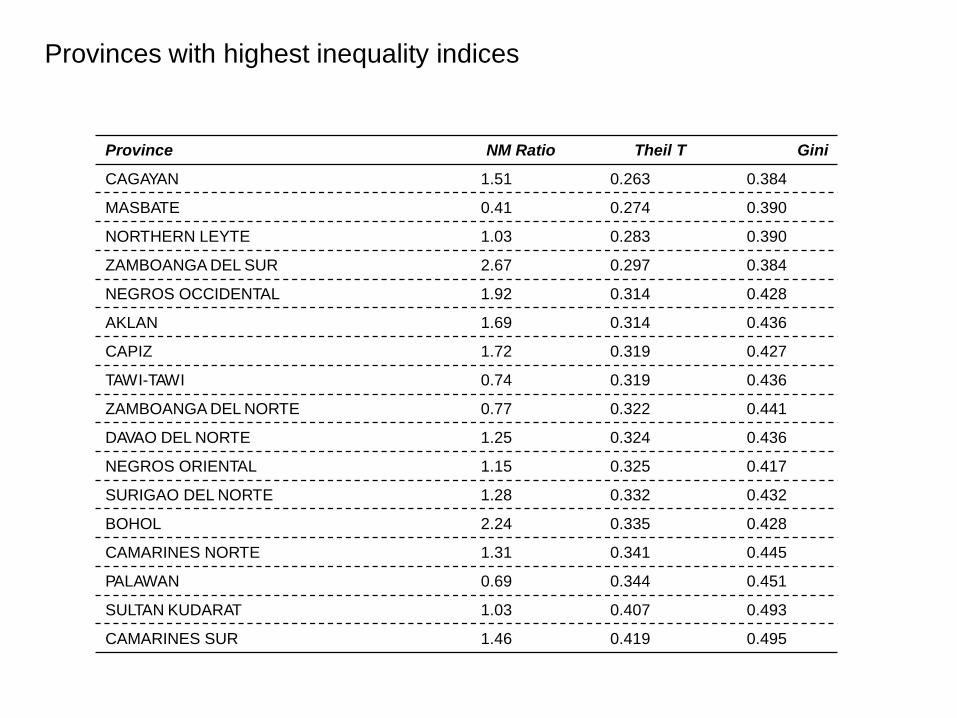
Provinces with highest inequality indices
Province NM Ratio Theil T Gini
CAGAYAN 1.51 0.263 0.384
MASBATE 0.41 0.274 0.390
NORTHERN LEYTE 1.03 0.283 0.390
ZAMBOANGA DEL SUR 2.67 0.297 0.384
NEGROS OCCIDENTAL 1.92 0.314 0.428
AKLAN 1.69 0.314 0.436
CAPIZ 1.72 0.319 0.427
TAWI-TAWI 0.74 0.319 0.436
ZAMBOANGA DEL NORTE 0.77 0.322 0.441
DAVAO DEL NORTE 1.25 0.324 0.436
NEGROS ORIENTAL 1.15 0.325 0.417
SURIGAO DEL NORTE 1.28 0.332 0.432
BOHOL 2.24 0.335 0.428
CAMARINES NORTE 1.31 0.341 0.445
PALAWAN 0.69 0.344 0.451
SULTAN KUDARAT 1.03 0.407 0.493
CAMARINES SUR 1.46 0.419 0.495
DISTRIBUTION OF DOCTORS IN THE PHILIPPINES ACCORDING TO REGION, 2010 - 2013
REGION PLACE OF PRACTICE
NO. OF DOCTORS2010 2011 2012 2013
01 - Ilocos NorteWithin 2,010 2,061 2,052 2,088Cross-Region 70 77 77 79
02 - Cagayan ValleyWithin 1,025 1,045 1,063 1,213Cross-Region 6 6 9 25
03 - Central LuzonWithin 3,452 3,485 3,557 3,647Cross-Region 47 68 133 144
04-A - CALABARZONWithin 3,034 3,180 3,200 3,287Cross-Region 56 71 140 174
04-B - MIMAROPAWithin 603 603 604 603Cross-Region 17 17 18 18
05 - Bicol RegionWithin 832 1,074 1,073 1,073Cross-Region 1 4 5 8
06 - Western VisayasWithin 676 1,034 1,102 1,117Cross-Region 1 2 2 2
07 - Central VisayasWithin 1,193 1,237 1,238 1,330Cross-Region 14 25 29 32
08 - Eastern VisayasWithin 901 903 906 988Cross-Region 15 5 6 7
Source: DOH-HHRDB - National Database of Selected Human Resources for HealthNote: Cross-region is having affiliation in another region
DISTRIBUTION OF DOCTORS IN THE PHILIPPINES ACCORDING TO REGION, 2010 - 2013
REGION PLACE OF PRACTICE
NO. OF DOCTORS2010 2011 2012 2013
09 - Zamboanga PeninsulaWithin 541 556 686 685Cross-Region 10 11 15 15
10 - Northern MindanaoWithin 987 1,008 1,057 1,108Cross-Region 10 12 15 16
11 - Davao RegionWithin 380 995 962 976Cross-Region 22 37 38 42
12 - SOCCSKSARGENWithin 1,036 1,028 1,047 1,049Cross-Region 12 24 28 28
13 - CARAGAWithin 463 457 457 457Cross-Region 1 5 5 5
NCRWithin 3,232 3,856 9,912 11,413Cross-Region 172 173 280 413
CARWithin 1,036 1,031 1,055 1,049Cross-Region 21 21 20 26
ARMMWithin 61 60 59 61Cross-Region 1 2 2 2
TotalWithin 21,462 23,613 30,030 32,144Cross-Region 466 560 822 1,036
Source: DOH-HHRDB - National Database of Selected Human Resources for HealthNote: Cross-region is having affiliation in another region

0 2,000 4,000 6,000 8,000 10,000 12,000
01 - Ilocos Norte
02 - Cagayan Valley
03 - Central Luzon
04-A - CALABARZON
04-B - MIMAROPA
05 - Bicol Region
06 - Western Visayas
07 - Central Visayas
08 - Eastern Visayas
09 - Zamboanga…
10 - Northern Mindanao
11 - Davao Region
12 - SOCCSKSARGEN
13 - CARAGA
NCR
CAR
ARMM
2013 2012 2011 2010
DISTRIBUTION OF DOCTORS IN THE PHILIPPINES (PRACTICING WITHIN THE COUNTRY) ACCORDING TO REGION, 2010 - 2013
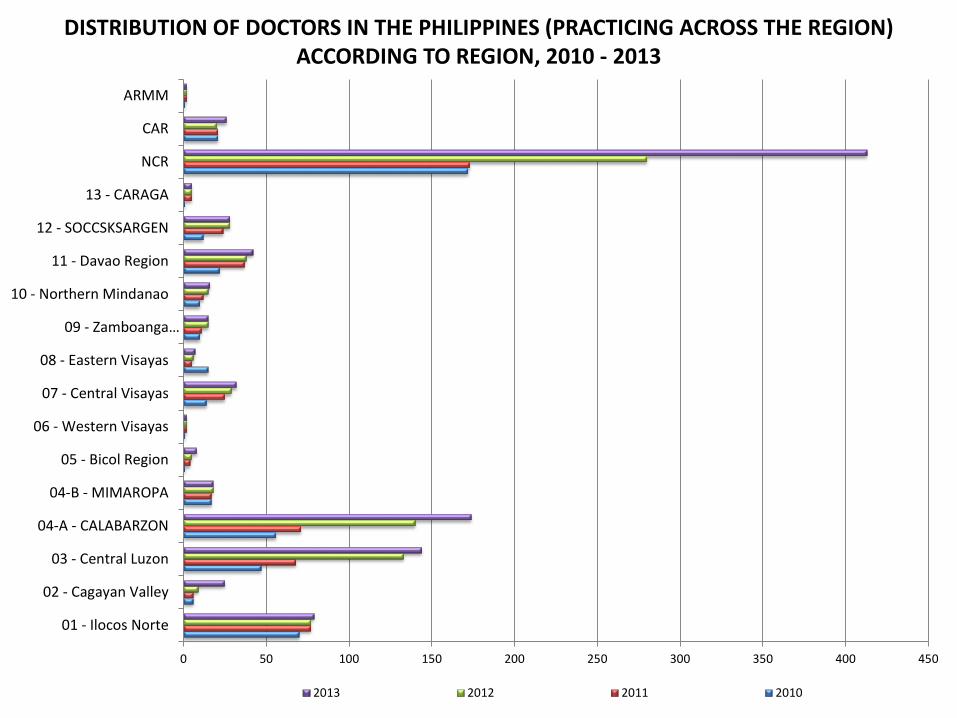
0 50 100 150 200 250 300 350 400 450
01 - Ilocos Norte
02 - Cagayan Valley
03 - Central Luzon
04-A - CALABARZON
04-B - MIMAROPA
05 - Bicol Region
06 - Western Visayas
07 - Central Visayas
08 - Eastern Visayas
09 - Zamboanga…
10 - Northern Mindanao
11 - Davao Region
12 - SOCCSKSARGEN
13 - CARAGA
NCR
CAR
ARMM
2013 2012 2011 2010
DISTRIBUTION OF DOCTORS IN THE PHILIPPINES (PRACTICING ACROSS THE REGION) ACCORDING TO REGION, 2010 - 2013
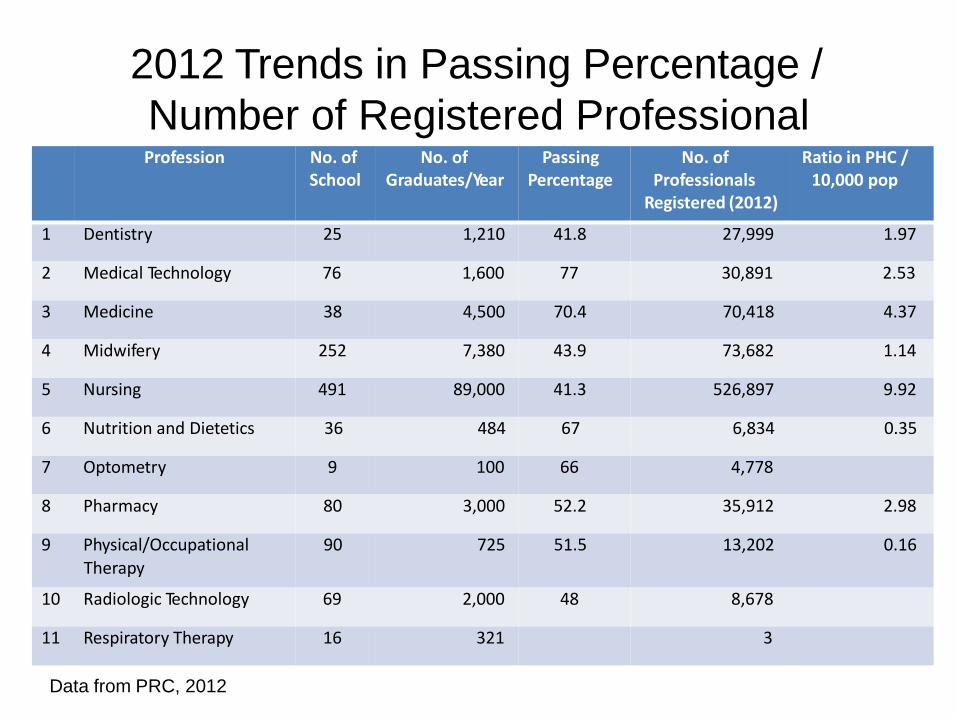
2012 Trends in Passing Percentage /Number of Registered Professional
Data from PRC, 2012
Profession No. of No. of Passing No. of Ratio in PHC / School Graduates/Year Percentage Professionals 10,000 pop
Registered (2012)
1 Dentistry 25 1,210 41.8 27,999 1.97
2 Medical Technology 76 1,600 77 30,891 2.53
3 Medicine 38 4,500 70.4 70,418 4.37
4 Midwifery 252 7,380 43.9 73,682 1.14
5 Nursing 491 89,000 41.3 526,897 9.92
6 Nutrition and Dietetics 36 484 67 6,834 0.35
7 Optometry 9 100 66 4,778
8 Pharmacy 80 3,000 52.2 35,912 2.98
9 Physical/Occupational 90 725 51.5 13,202 0.16Therapy
10 Radiologic Technology 69 2,000 48 8,678
11 Respiratory Therapy 16 321 3

Philippine Profession to Population Ratios
• Rural Health Physician- 1:20,000• Public Health Nurse-1:20,000• Rural Health Midwife-1:5,000• Rural Health Inspector-1:20,000• Rural Health Dentist- 1:50,000
(Revised IRR Magna Carta for Public health Workers)

Professional to Population RatiosHowever, for other health care professionals….
No standard ratio of manpower to population for other health professionals at the primary care level. Profession includes:o Physical Therapistso Medical Technologistso Pharmacistso Other Allied Medical Professionals
Positions are only available at the institutional level (i.e. hospitals)
Most position available are only on a contractual or job order basis
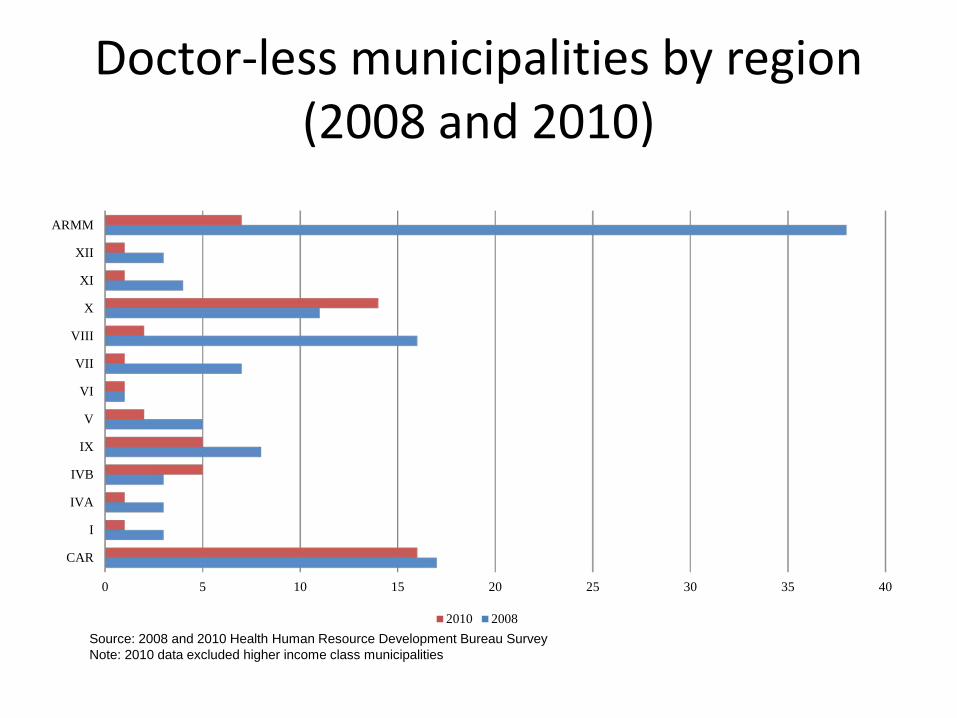
Doctor-less municipalities by region (2008 and 2010)
0 5 10 15 20 25 30 35 40
CAR
I
IVA
IVB
IX
V
VI
VII
VIII
X
XI
XII
ARMM
2010 2008Source: 2008 and 2010 Health Human Resource Development Bureau SurveyNote: 2010 data excluded higher income class municipalities
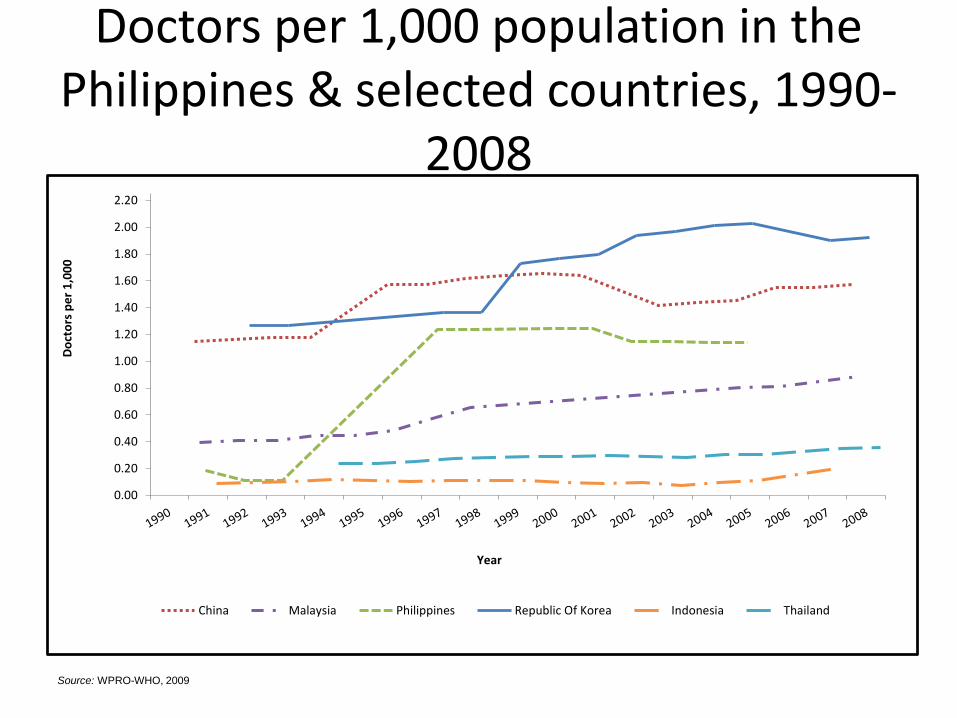
Doctors per 1,000 population in the Philippines & selected countries, 1990-
2008
0.00
0.20
0.40
0.60
0.80
1.00
1.20
1.40
1.60
1.80
2.00
2.20
Doct
ors p
er 1
,000
Year
China Malaysia Philippines Republic Of Korea Indonesia Thailand
Source: WPRO-WHO, 2009
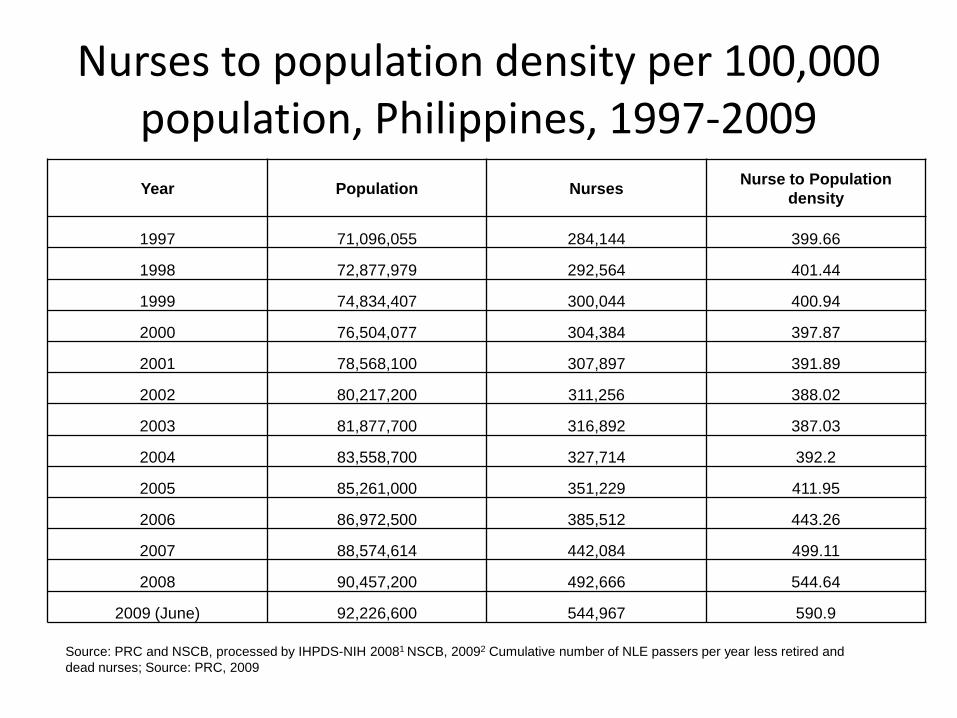
Year Population Nurses Nurse to Population density
1997 71,096,055 284,144 399.66
1998 72,877,979 292,564 401.44
1999 74,834,407 300,044 400.94
2000 76,504,077 304,384 397.87
2001 78,568,100 307,897 391.89
2002 80,217,200 311,256 388.02
2003 81,877,700 316,892 387.03
2004 83,558,700 327,714 392.2
2005 85,261,000 351,229 411.95
2006 86,972,500 385,512 443.26
2007 88,574,614 442,084 499.11
2008 90,457,200 492,666 544.64
2009 (June) 92,226,600 544,967 590.9
Nurses to population density per 100,000 population, Philippines, 1997-2009
Source: PRC and NSCB, processed by IHPDS-NIH 20081 NSCB, 20092 Cumulative number of NLE passers per year less retired and dead nurses; Source: PRC, 2009

• Estimated that only about 32,944 of the registered nurses were locally employed across various government and private health facilities in the country.o Gave rise to about 91,149 nurse surplus in 2009
• Little absorptive capacity for local employment of nurses. o A study of distribution of employed nurses by work
setting in 1998 revealed that only about 15.25% are absorbed locally while 84.75% are employed abroad
Nurse Density
Source: Lorenzo et.al., 2012. Mobility of Health Professionals

Nurses per 1,000 population in the Philippines & selected countries, 1990-
2008
0
0.5
1
1.5
2
2.5
3
3.5
4
4.5
5
1990 1991 1992 1993 1994 1995 1996 1997 1998 1999 2000 2001 2002 2003 2004 2005 2006 2007 2008
Nur
ses p
er 1
,000
Year
China Malaysia Philippines Republic of Korea Indonesia Thailand
Source: WPRO-WHO, 2009
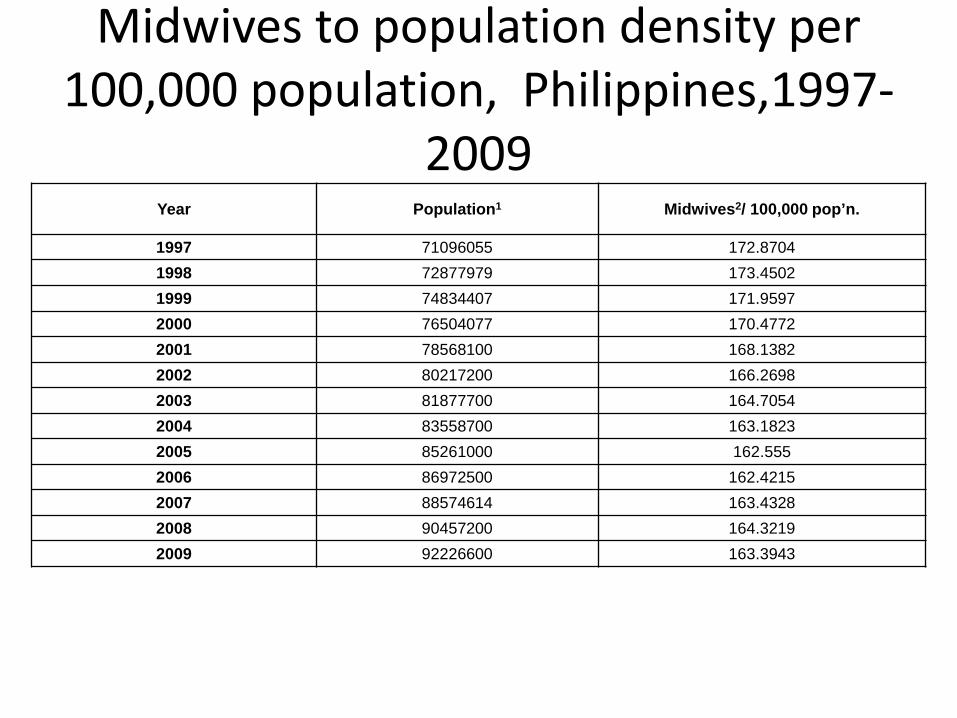
Year Population1 Midwives2/ 100,000 pop’n.
1997 71096055 172.87041998 72877979 173.45021999 74834407 171.95972000 76504077 170.47722001 78568100 168.13822002 80217200 166.26982003 81877700 164.70542004 83558700 163.18232005 85261000 162.5552006 86972500 162.42152007 88574614 163.43282008 90457200 164.32192009 92226600 163.3943
Midwives to population density per 100,000 population, Philippines,1997-
2009
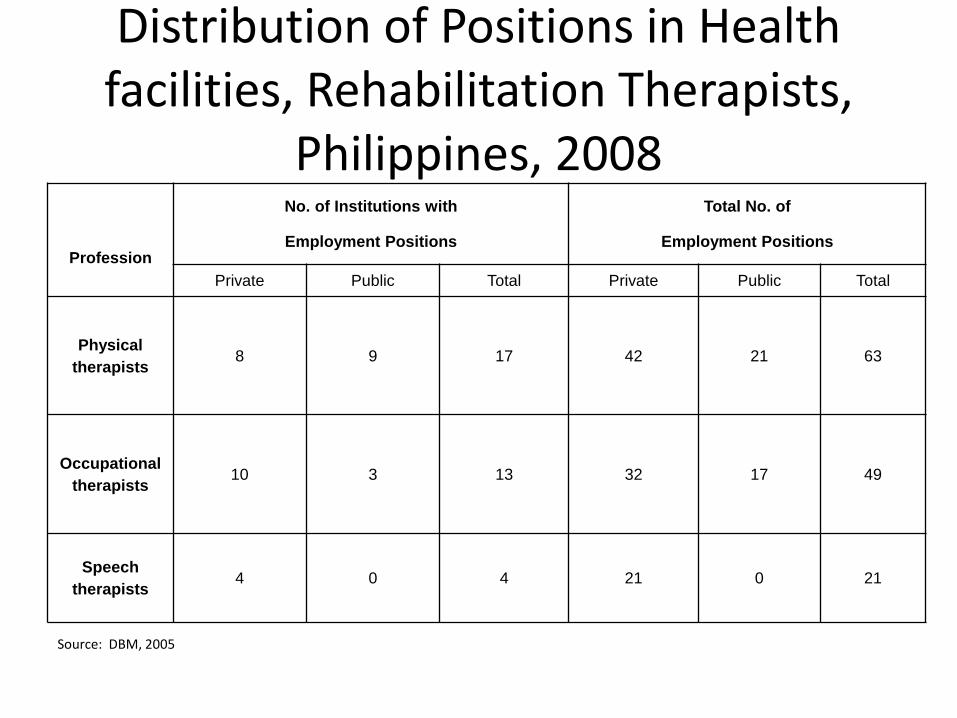
Profession
No. of Institutions with
Employment Positions
Total No. of
Employment Positions
Private Public Total Private Public Total
Physical therapists 8 9 17 42 21 63
Occupational therapists 10 3 13 32 17 49
Speech therapists 4 0 4 21 0 21
Distribution of Positions in Health facilities, Rehabilitation Therapists,
Philippines, 2008
Source: DBM, 2005

RETAIN HEALTH WORKFORCE
Why Retain Health Workers?
• Skill Development Investment and Retention
• Institutional Memory Sustainability• Motivation and loyalty high among long-
standing health workers• If properly motivated, will ensure high
quality and continuity of care
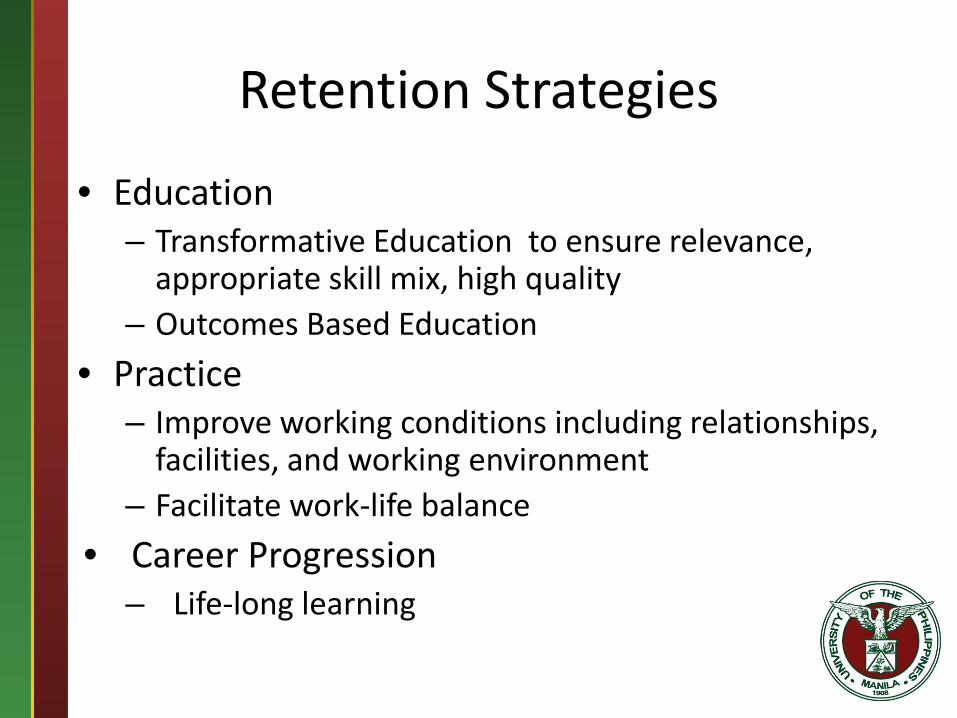
Retention Strategies
• Education – Transformative Education to ensure relevance,
appropriate skill mix, high quality – Outcomes Based Education
• Practice– Improve working conditions including relationships,
facilities, and working environment– Facilitate work-life balance
• Career Progression– Life-long learning

REASSESS: EVALUATION AND REPLANNING
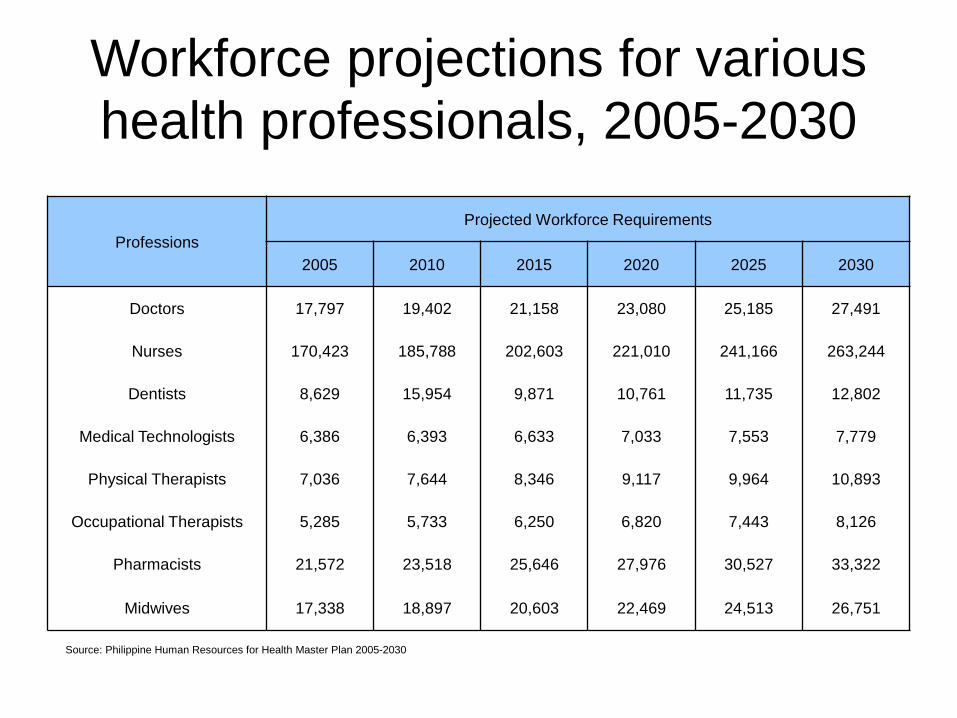
Workforce projections for various health professionals, 2005-2030
ProfessionsProjected Workforce Requirements
2005 2010 2015 2020 2025 2030
Doctors 17,797 19,402 21,158 23,080 25,185 27,491
Nurses 170,423 185,788 202,603 221,010 241,166 263,244
Dentists 8,629 15,954 9,871 10,761 11,735 12,802
Medical Technologists 6,386 6,393 6,633 7,033 7,553 7,779
Physical Therapists 7,036 7,644 8,346 9,117 9,964 10,893
Occupational Therapists 5,285 5,733 6,250 6,820 7,443 8,126
Pharmacists 21,572 23,518 25,646 27,976 30,527 33,322
Midwives 17,338 18,897 20,603 22,469 24,513 26,751
Source: Philippine Human Resources for Health Master Plan 2005-2030

Consider Trends, Competitiveness
• ASEAN 2015 – Mutual Recognition Agreements
• Asian University Networks• Philippine Qualification Framework,
Asian Qualification Framework

Chinese Proverb
If you want to prepare for 1 year Grow Wheat
If you want to prepare for 10 yearsGrow Trees but
If you want to prepare for 100 yearsGrow People!
46
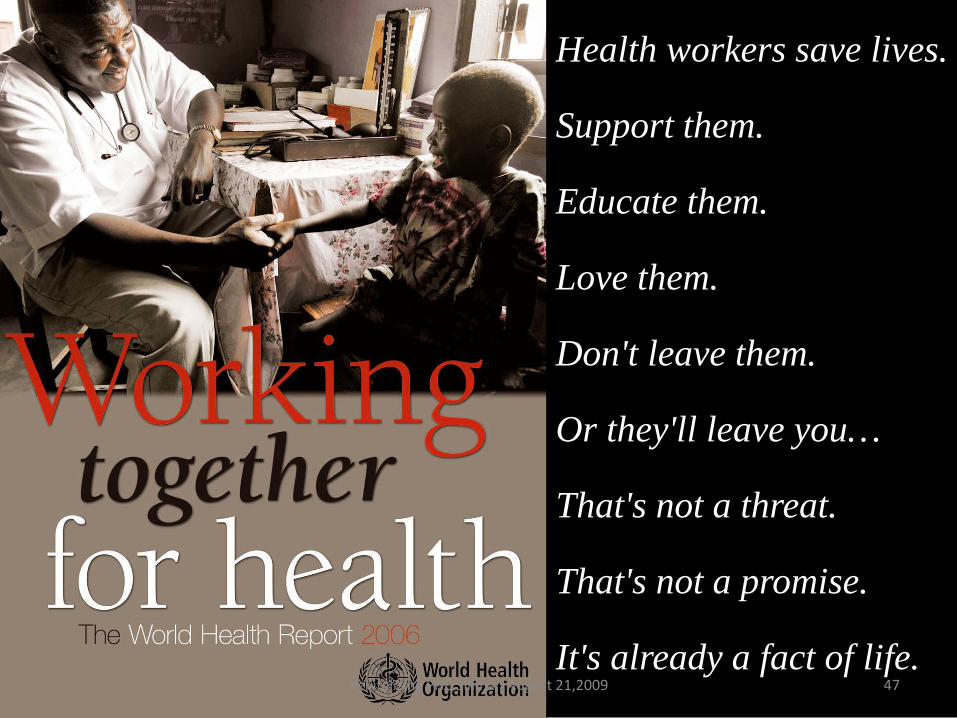
Health workers save lives.
Support them.
Educate them.
Love them.
Don't leave them.
Or they'll leave you…
That's not a threat.
That's not a promise.
It's already a fact of life.47Revitalizing PHC Siliman August 21,2009

THANK YOU SO MUCH!
Maraming Salamat Po!MABUHAY TAYONG LAHAT!
48