Embed Size (px)
Citation preview
Political Science Research and Methodsdoi:10.1017/psrm.2018.28
Recruiting large online samples in the United States andIndia: Facebook, Mechanical Turk, and Qualtrics
Taylor C. Boas*, Dino P. Christenson and David M. Glick
Department of Political Science, Boston University, 232 Bay State Rd, Boston, MA 02215, USA*Corresponding author. Email: [email protected]
AbstractThis article examines online recruitment via Facebook, Mechanical Turk (MTurk), and Qualtrics panelsin India and the United States. It compares over 7300 respondents—1000 or more from each source andcountry—to nationally representative benchmarks in terms of demographics, political attitudes andknowledge, cooperation, and experimental replication. In the United States, MTurk offers the cheapestand fastest recruitment, Qualtrics is most demographically and politically representative, and Facebookfacilitates targeted sampling. The India samples look much less like the population, though Facebookoffers broad geographical coverage. We find online convenience samples often provide valid inferencesinto how partisanship moderates treatment effects. Yet they are typically unrepresentative on suchpolitical variables, which has implications for the external validity of sample average treatment effects.
Online surveys using convenience samples are increasingly popular in the social sciences. Whilesubject recruitment can be outsourced to commercial internet panels, scholars often rely onlower-cost, do-it-yourself methods, such as Facebook advertisements and Amazon.com’sMechanical Turk (MTurk). MTurk is now a common source for survey respondents in Americanpolitics (e.g., Arceneaux 2012; Grimmer, Messing and Westwood 2012; Huber, Hill and Lenz2012; Christenson and Glick 2015a; Christenson and Glick 2015b) and the study of India (e.g.,Ausderan 2014; Charnysh, Lucas and Singh 2015; Dietrich and Winters 2015). Meanwhile,Facebook advertisements have become a popular recruitment method for studies focusing onother countries (e.g., Samuels and Zucco 2014; Boas 2016).
The availability of different recruitment options for online convenience samples posesimportant questions about advantages and disadvantages. Yet, scholars rarely compare sources ofonline respondents to one another, and it is not clear that they actively consider alternatives atthe design stage. In social science research on India and the United States, the two countrieswhere both Facebook and MTurk are viable, we are not aware of any study that used adver-tisements on Facebook as its primary subject recruitment method.
This study presents a comparison of online convenience sampling via Facebook, MTurk, and aQualtrics internet panel in India and the United States. In the fall of 2015, we administered anonline survey to at least 1000 respondents recruited through each method in each country. Weexamine demographics, attitudes, and knowledge by drawing questions from recent gold stan-dard surveys using face-to-face interviews with national probability samples. We also measurerespondent quality, focusing on non-response, attrition, and screener passage rates (Berinsky,Margolis and Sances 2014). Finally, we replicate several survey experiments conducted onprobability samples in each country. The research design and pre-analysis plan (PAP) wereregistered in advance with Evidence in Government and Politics (EGAP).
© The European Political Science Association, 2018.
(2020), 8, 23 2–250
ORIGINAL ARTICLE
Dow
nloa
ded
from
htt
ps://
ww
w.c
ambr
idge
.org
/cor
e. IP
add
ress
: 54.
39.1
06.1
73, o
n 23
Jun
2020
at 0
1:59
:22,
sub
ject
to th
e Ca
mbr
idge
Cor
e te
rms
of u
se, a
vaila
ble
at h
ttps
://w
ww
.cam
brid
ge.o
rg/c
ore/
term
s. h
ttps
://do
i.org
/10.
1017
/psr
m.2
018.
28
This study builds upon existing methodological research on online convenience samples,while also moving beyond it. A growing literature has evaluated MTurk samples in the UnitedStates by comparing them to probability samples and/or traditional, in-person conveniencesamples (Berinsky, Huber and Lenz 2012; Krupnikov and Levine 2014; Clifford, Jewell andWaggoner 2015; Huff and Tingley 2015; Leeper and Mullinix 2015; Mullinix et al. 2015; Levay,Freese and Druckman 2016; Necka et al. 2016). Samuels and Zucco (2013) have done a similarcomparison using Facebook in Brazil. Studies in other disciplines have compared the demo-graphics of MTurk users in India and the United States (e.g., Antin and Shaw 2012; Litman,Robinson and Rosenzweig 2014). Yet, few studies have compared MTurk to alternative onlineconvenience sample sources, and those that have included Facebook have recruited fewrespondents from this source (Leeper and Mullinix 2015; Antoun et al. 2016). Our study is thefirst—of India or the United States—to compare MTurk recruitment to both Facebook and acommercial panel. Moreover, it draws large samples using each of these methods, allowing formore confident comparisons.
The best choice for online convenience sampling will depend on the location of a study and itsobjectives. In the United States, MTurk’s low cost and recruitment speed make it an excellentmethod for pretesting, exploratory research, and designs that depend on current events(Christenson and Glick 2013). It also draws the most attentive and cooperative subject poolswhich is useful for testing the effects of subtle experimental treatments. Meanwhile, for studiesaiming to attract a more representative sample, a Qualtrics panel offers advantages at approxi-mately three times the cost of MTurk. For its part, Facebook offers attractive options for targetedrecruitment via advertisements to particular demographic or political groups.
In India, online recruitment methods tend to draw a less diverse sample than in the UnitedStates, meaning that scholars should be wary of using them to estimate population parameters.All three online samples were disproportionately young, wealthy, male, highly educated andupper-caste. Yet, there are marked differences in geographical diversity. Facebook’s broadnational coverage was indistinguishable from that of a representative sample, whereas MTurkdrew heavily from the two southern states of Kerala and Tamil Nadu. The Qualtrics panel, whilefast and easy, was more expensive than other methods, without the gains in sample diversity.
Finally, our replication of survey experiments offers lessons about the advantages and dis-advantages of online convenience samples as a whole. Using all three recruitment methods, we weremostly successful at replicating patterns of treatment interactions with partisanship in the UnitedStates—namely, experimental prompts to which Republicans respond more substantially thanDemocrats. These results suggest that online convenience samples can often provide valid inferencesregarding treatment heterogeneity. On the other hand, online convenience samples often lackrepresentativeness on the same variables, including partisanship, that generate heterogeneoustreatment effects, which has implications for external validity. Across recruitment methods andcountries, sample average treatment effects in our replicated experiments were often quite far frombenchmarks obtained using nationally representative samples—though always correct in directionand significance. Hence, scholars intending to generalize treatment effect estimates beyond theironline samples should be prepared to carefully defend the validity of these broader inferences.
Recruitment methods for online convenience samplesRecruiting subjects for online convenience samples requires notifying a study population of theavailability of a survey and offering some incentive for participation. Facebook, MTurk, andcommercial internet panels differ significantly in terms of the costs and procedures foraccomplishing these tasks.1
1Emerging alternatives for subject recruitment include Google Consumer Surveys (Santoso, Stein and Stevenson 2016) andSMS text messages (Erlich et al. 2017).
Political Science Research and Methods 233
Dow
nloa
ded
from
htt
ps://
ww
w.c
ambr
idge
.org
/cor
e. IP
add
ress
: 54.
39.1
06.1
73, o
n 23
Jun
2020
at 0
1:59
:22,
sub
ject
to th
e Ca
mbr
idge
Cor
e te
rms
of u
se, a
vaila
ble
at h
ttps
://w
ww
.cam
brid
ge.o
rg/c
ore/
term
s. h
ttps
://do
i.org
/10.
1017
/psr
m.2
018.
28
MTurk is an online labor market in which workers are hired to complete Human IntelligenceTasks (HITs). A HIT announcement conveys the amount of compensation and estimatedcompletion time; those who click on it are redirected to an online survey on an external site.Upon completion, respondents are typically given randomly generated codes that they use toclaim payment, which takes place entirely within the MTurk system. Recruitment costs consist ofa 40 percent commission paid to Amazon.
Recruiting survey respondents via Facebook differs in several respects. While MTurk workersare actively looking for employment, one must reach out to Facebook users by buying adver-tisements that lead them to the online survey. Advertisements can be targeted based ondemographic data, as well as less objective information, such as political sympathies, thatFacebook gleans from users’ online behavior. Payment and the frequency of ad displays are basedon a bid system; one can pay for each click, ad view, or action taken on the target website. Thelatter option allows Facebook to dynamically adjust advertising based on the types of users whoare most likely to complete the survey. Recruiting via Facebook also differs in that there is nobuilt-in mechanism for compensating subjects. A common approach is to offer a raffle prize asan incentive for participation. Upon completion of the survey, those entering the raffle can beredirected to a separate survey where they provide their contact information.
A third popular option for gathering online convenience samples is to outsource recruitmentto an internet panel provider. Internet panels consist of respondents who have signed up to takeonline surveys in exchange for incentives such as cash, airline miles, and gift cards. Recruitmentand compensation are handled by the third-party firm, so researchers have no direct control overhow much subjects are paid or who is targeted, apart from defining the audience and specifyingcertain quotas. Rather, they pay the panel provider a set price per completed survey. This optionis typically the most expensive, but it is fast and easy to manage. We opted for a panel fromQualtrics, which aggregates panel respondents initially recruited by other firms.
Research designWe used the Qualtrics survey platform to administer identical questionnaires to subjectsrecruited through Facebook, MTurk, and Qualtrics internet panels in India and the UnitedStates. We initially recruited approximately 3000 respondents in each country, evenly dividedamong recruitment methods. We subsequently drew another 600 respondents each from Face-book and MTurk in the United States, targeting age ranges that were underrepresented in theinitial sample. The surveys ran from October 26, 2015 through December 14, 2015 (India) andJanuary 16, 2016 (United States). In neither country was there a national election or other majorpolitical event taking place that might be expected to affect responses.2
We made the recruitment methods in each country as similar to one another as possible. Weused a raffle rather than individual payments to Facebook-recruited respondents, but we ensuredthat the expected value of individual compensation was equal to the payments to MTurkworkers, as discussed in Appendix section 1.3 We had no control over the amount of com-pensation offered to Qualtrics participants, and Qualtrics was unable to provide us with com-pensation details. However, we were informed that payments are generally one-third the amountQualtrics charges to the client, or $1.50–$2.50, in both India and the United States Thesepayments are higher—many times so in India—than the compensation offered to MTurk andFacebook respondents.
Other recruitment decisions aimed to balance the goals of drawing a broad, unadulteratedsample, keeping costs manageable, and adhering to standard practice in prior political scienceresearch. For the Qualtrics panel, we opted not to use quotas even though several were included
2Questionnaires are contained in Appendix sections 6 and 7.3In Appendix section 2, we examine whether the raffle attracts more risk-tolerant respondents.
234 Taylor C. Boas et al.
Dow
nloa
ded
from
htt
ps://
ww
w.c
ambr
idge
.org
/cor
e. IP
add
ress
: 54.
39.1
06.1
73, o
n 23
Jun
2020
at 0
1:59
:22,
sub
ject
to th
e Ca
mbr
idge
Cor
e te
rms
of u
se, a
vaila
ble
at h
ttps
://w
ww
.cam
brid
ge.o
rg/c
ore/
term
s. h
ttps
://do
i.org
/10.
1017
/psr
m.2
018.
28
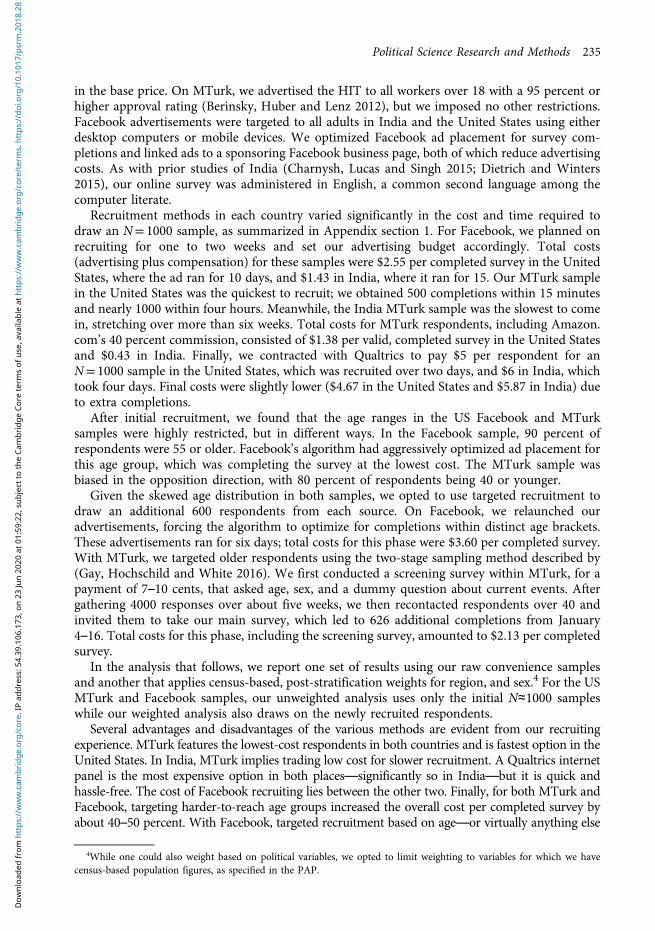
in the base price. On MTurk, we advertised the HIT to all workers over 18 with a 95 percent orhigher approval rating (Berinsky, Huber and Lenz 2012), but we imposed no other restrictions.Facebook advertisements were targeted to all adults in India and the United States using eitherdesktop computers or mobile devices. We optimized Facebook ad placement for survey com-pletions and linked ads to a sponsoring Facebook business page, both of which reduce advertisingcosts. As with prior studies of India (Charnysh, Lucas and Singh 2015; Dietrich and Winters2015), our online survey was administered in English, a common second language among thecomputer literate.
Recruitment methods in each country varied significantly in the cost and time required todraw an N= 1000 sample, as summarized in Appendix section 1. For Facebook, we planned onrecruiting for one to two weeks and set our advertising budget accordingly. Total costs(advertising plus compensation) for these samples were $2.55 per completed survey in the UnitedStates, where the ad ran for 10 days, and $1.43 in India, where it ran for 15. Our MTurk samplein the United States was the quickest to recruit; we obtained 500 completions within 15 minutesand nearly 1000 within four hours. Meanwhile, the India MTurk sample was the slowest to comein, stretching over more than six weeks. Total costs for MTurk respondents, including Amazon.com’s 40 percent commission, consisted of $1.38 per valid, completed survey in the United Statesand $0.43 in India. Finally, we contracted with Qualtrics to pay $5 per respondent for anN= 1000 sample in the United States, which was recruited over two days, and $6 in India, whichtook four days. Final costs were slightly lower ($4.67 in the United States and $5.87 in India) dueto extra completions.
After initial recruitment, we found that the age ranges in the US Facebook and MTurksamples were highly restricted, but in different ways. In the Facebook sample, 90 percent ofrespondents were 55 or older. Facebook’s algorithm had aggressively optimized ad placement forthis age group, which was completing the survey at the lowest cost. The MTurk sample wasbiased in the opposition direction, with 80 percent of respondents being 40 or younger.
Given the skewed age distribution in both samples, we opted to use targeted recruitment todraw an additional 600 respondents from each source. On Facebook, we relaunched ouradvertisements, forcing the algorithm to optimize for completions within distinct age brackets.These advertisements ran for six days; total costs for this phase were $3.60 per completed survey.With MTurk, we targeted older respondents using the two-stage sampling method described by(Gay, Hochschild and White 2016). We first conducted a screening survey within MTurk, for apayment of 7–10 cents, that asked age, sex, and a dummy question about current events. Aftergathering 4000 responses over about five weeks, we then recontacted respondents over 40 andinvited them to take our main survey, which led to 626 additional completions from January4–16. Total costs for this phase, including the screening survey, amounted to $2.13 per completedsurvey.
In the analysis that follows, we report one set of results using our raw convenience samplesand another that applies census-based, post-stratification weights for region, and sex.4 For the USMTurk and Facebook samples, our unweighted analysis uses only the initial N≈1000 sampleswhile our weighted analysis also draws on the newly recruited respondents.
Several advantages and disadvantages of the various methods are evident from our recruitingexperience. MTurk features the lowest-cost respondents in both countries and is fastest option in theUnited States. In India, MTurk implies trading low cost for slower recruitment. A Qualtrics internetpanel is the most expensive option in both places—significantly so in India—but it is quick andhassle-free. The cost of Facebook recruiting lies between the other two. Finally, for both MTurk andFacebook, targeting harder-to-reach age groups increased the overall cost per completed survey byabout 40–50 percent. With Facebook, targeted recruitment based on age—or virtually anything else
4While one could also weight based on political variables, we opted to limit weighting to variables for which we havecensus-based population figures, as specified in the PAP.
Political Science Research and Methods 235
Dow
nloa
ded
from
htt
ps://
ww
w.c
ambr
idge
.org
/cor
e. IP
add
ress
: 54.
39.1
06.1
73, o
n 23
Jun
2020
at 0
1:59
:22,
sub
ject
to th
e Ca
mbr
idge
Cor
e te
rms
of u
se, a
vaila
ble
at h
ttps
://w
ww
.cam
brid
ge.o
rg/c
ore/
term
s. h
ttps
://do
i.org
/10.
1017
/psr
m.2
018.
28
Facebook knows about its users—can be accomplished quickly and easily. On MTurk, targetedrecruitment can be done at even lower cost, and with similar ease, for variables included in a new“premiere qualifications” option, discussed in Appendix section 1.
DemographicsTo compare the demographics of convenience sample respondents to those of the nationalpopulation, we drew questions from recent surveys involving face-to-face interviews withnational probability samples—primarily the 2014 General Social Survey (GSS) in the UnitedStates and the 2014 National Election Study in India. In this section and those that follow, wepresent a number of comparisons between each convenience sample and these nationalbenchmarks. For MTurk and Facebook, most of the unweighted comparisons correspond tospecific pre-registered hypotheses. Analyzing Qualtrics-recruited samples was also included inour PAP, as was the weighted analysis of all three samples, but we did not advance specifichypotheses in these areas. In the analysis below, we present descriptive statistics from eachsample graphically. In Appendix section 3, we present tables of standardized mean differencesand significance tests, indicating which tests were pre-specified and whether they are supportedor rejected (adjusting p-values for multiple comparisons using the method of Benjamini andHochberg 1995).
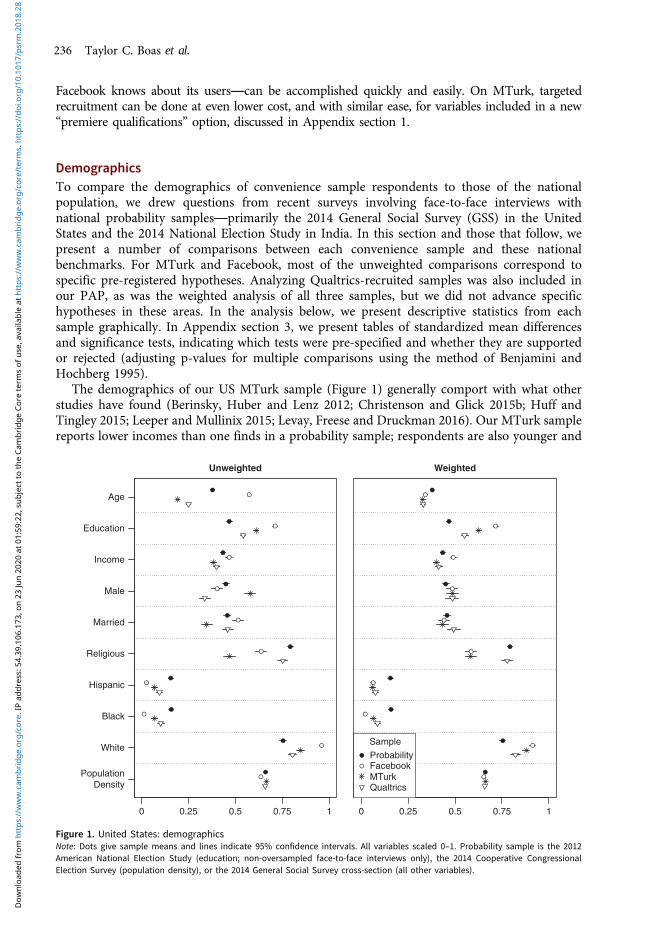
The demographics of our US MTurk sample (Figure 1) generally comport with what otherstudies have found (Berinsky, Huber and Lenz 2012; Christenson and Glick 2015b; Huff andTingley 2015; Leeper and Mullinix 2015; Levay, Freese and Druckman 2016). Our MTurk samplereports lower incomes than one finds in a probability sample; respondents are also younger and
Unweighted
0 0.25 0.5 0.75 1
PopulationDensity
White
Black
Hispanic
Religious
Married
Male
Income
Education
Age
Weighted
0 0.25 0.5 0.75 1
Sample
ProbabilityFacebookMTurkQualtrics
Figure 1. United States: demographicsNote: Dots give sample means and lines indicate 95% confidence intervals. All variables scaled 0–1. Probability sample is the 2012American National Election Study (education; non-oversampled face-to-face interviews only), the 2014 Cooperative CongressionalElection Survey (population density), or the 2014 General Social Survey cross-section (all other variables).
236 Taylor C. Boas et al.
Dow
nloa
ded
from
htt
ps://
ww
w.c
ambr
idge
.org
/cor
e. IP
add
ress
: 54.
39.1
06.1
73, o
n 23
Jun
2020
at 0
1:59
:22,
sub
ject
to th
e Ca
mbr
idge
Cor
e te
rms
of u
se, a
vaila
ble
at h
ttps
://w
ww
.cam
brid
ge.o
rg/c
ore/
term
s. h
ttps
://do
i.org
/10.
1017
/psr
m.2
018.
28
more highly educated. Consistent with this profile, they are also less likely to be married or reporta religious affiliation. As with prior studies, we find that Hispanics and African-Americans aresignificantly underrepresented. We also find no difference in rural versus urban residence(operationalized as the log of the population density of the county associated with the respon-dent’s ZIP code) compared to the Cooperative Congressional Election Study (CCES).5 OurMTurk sample is disproportionately male, whereas prior studies have characterized the MTurkpopulation as primarily female. When applying weights based on age, sex, and region of thecountry, the difference in marriage rate disappears, and the income and religiosity gaps decrease,but the sample becomes less representative in terms of education, race, and ethnicity.
As noted above, our US Facebook sample was unexpectedly old. Accordingly, we find thatFacebook respondents are more likely to be married than those from the GSS. In other respects,the Facebook sample confirms our prior expectations. It is more highly educated, wealthier, morefemale, and less religious than a representative sample. It also has the largest share of whites, andthe fewest blacks and Hispanics, of our US convenience samples. Facebook respondents comefrom less densely populated counties than CCES respondents, though this difference largelydisappears when we weight by age, sex, and region. Weighting also reduces the disparities interms of race, ethnicity, and marriage rate, though it exacerbates differences in income andreligiosity.
In the United States, the Qualtrics-recruited sample came closest to a national probabilitysample on most variables. On age, education, income, race, and ethnicity, it was biased in thesame direction as MTurk, but less severely so. For marriage rate and rural versus urban residence,there were no significant differences, and 75 percent of Qualtrics respondents reported a religiousaffiliation, only slightly less than in the GSS (79 percent). The sample stood out most in terms ofsex; it was only 34 percent male. When applying weights, most of these disparities were elimi-nated or reduced.
We also sought to examine the geographical representativeness of each convenience sample.To do this, we compared the proportion of each sample residing in each state to the corre-sponding proportion of the over-18 US population, calculating the ϕ coefficient as a goodness-of-fit statistic and bootstrapping its sampling distribution.6 As shown in Appendix section 4, ourconvenience samples do not differ significantly from a national probability sample, or from eachother, based on this measure. Moreover, a barplot of state of residence shows that no state isunder- or overrepresented in any online sample by more than about 3 percentage points.
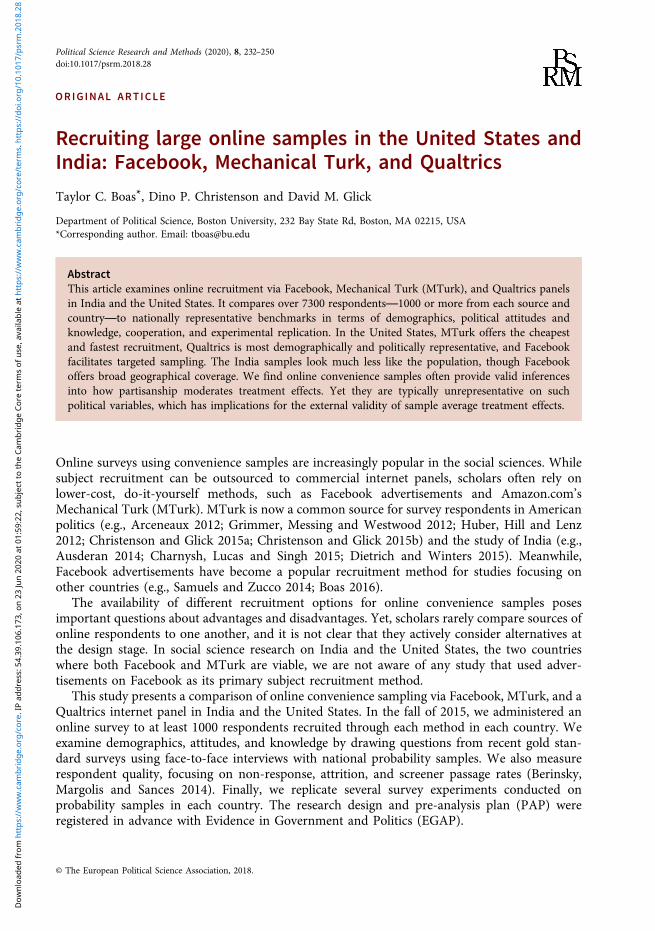
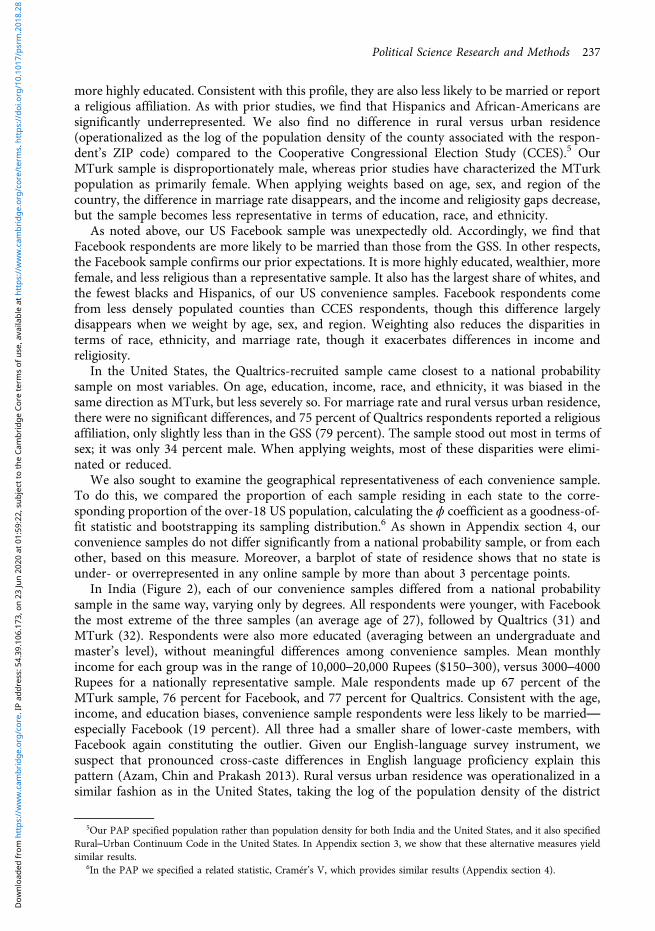
In India (Figure 2), each of our convenience samples differed from a national probabilitysample in the same way, varying only by degrees. All respondents were younger, with Facebookthe most extreme of the three samples (an average age of 27), followed by Qualtrics (31) andMTurk (32). Respondents were also more educated (averaging between an undergraduate andmaster’s level), without meaningful differences among convenience samples. Mean monthlyincome for each group was in the range of 10,000–20,000 Rupees ($150–300), versus 3000–4000Rupees for a nationally representative sample. Male respondents made up 67 percent of theMTurk sample, 76 percent for Facebook, and 77 percent for Qualtrics. Consistent with the age,income, and education biases, convenience sample respondents were less likely to be married—especially Facebook (19 percent). All three had a smaller share of lower-caste members, withFacebook again constituting the outlier. Given our English-language survey instrument, wesuspect that pronounced cross-caste differences in English language proficiency explain thispattern (Azam, Chin and Prakash 2013). Rural versus urban residence was operationalized in asimilar fashion as in the United States, taking the log of the population density of the district
5Our PAP specified population rather than population density for both India and the United States, and it also specifiedRural–Urban Continuum Code in the United States. In Appendix section 3, we show that these alternative measures yieldsimilar results.
6In the PAP we specified a related statistic, Cramér’s V, which provides similar results (Appendix section 4).
Political Science Research and Methods 237
Dow
nloa
ded
from
htt
ps://
ww
w.c
ambr
idge
.org
/cor
e. IP
add
ress
: 54.
39.1
06.1
73, o
n 23
Jun
2020
at 0
1:59
:22,
sub
ject
to th
e Ca
mbr
idge
Cor
e te
rms
of u
se, a
vaila
ble
at h
ttps
://w
ww
.cam
brid
ge.o
rg/c
ore/
term
s. h
ttps
://do
i.org
/10.
1017
/psr
m.2
018.
28
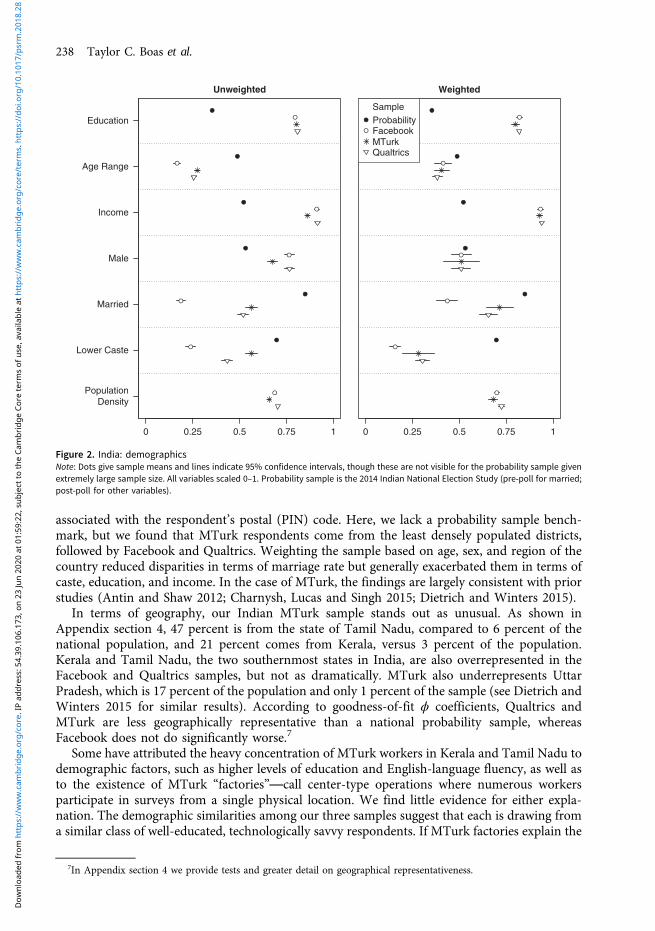
associated with the respondent’s postal (PIN) code. Here, we lack a probability sample bench-mark, but we found that MTurk respondents come from the least densely populated districts,followed by Facebook and Qualtrics. Weighting the sample based on age, sex, and region of thecountry reduced disparities in terms of marriage rate but generally exacerbated them in terms ofcaste, education, and income. In the case of MTurk, the findings are largely consistent with priorstudies (Antin and Shaw 2012; Charnysh, Lucas and Singh 2015; Dietrich and Winters 2015).
In terms of geography, our Indian MTurk sample stands out as unusual. As shown inAppendix section 4, 47 percent is from the state of Tamil Nadu, compared to 6 percent of thenational population, and 21 percent comes from Kerala, versus 3 percent of the population.Kerala and Tamil Nadu, the two southernmost states in India, are also overrepresented in theFacebook and Qualtrics samples, but not as dramatically. MTurk also underrepresents UttarPradesh, which is 17 percent of the population and only 1 percent of the sample (see Dietrich andWinters 2015 for similar results). According to goodness-of-fit ϕ coefficients, Qualtrics andMTurk are less geographically representative than a national probability sample, whereasFacebook does not do significantly worse.7
Some have attributed the heavy concentration of MTurk workers in Kerala and Tamil Nadu todemographic factors, such as higher levels of education and English-language fluency, as well asto the existence of MTurk “factories”—call center-type operations where numerous workersparticipate in surveys from a single physical location. We find little evidence for either expla-nation. The demographic similarities among our three samples suggest that each is drawing froma similar class of well-educated, technologically savvy respondents. If MTurk factories explain the
Unweighted
0 0.25 0.5 0.75 1
PopulationDensity
Lower Caste
Married
Age Range
Male
Income
Education
Weighted
0 0.25 0.5 0.75 1
SampleProbabilityFacebookMTurkQualtrics
Figure 2. India: demographicsNote: Dots give sample means and lines indicate 95% confidence intervals, though these are not visible for the probability sample givenextremely large sample size. All variables scaled 0–1. Probability sample is the 2014 Indian National Election Study (pre-poll for married;post-poll for other variables).
7In Appendix section 4 we provide tests and greater detail on geographical representativeness.
238 Taylor C. Boas et al.
Dow
nloa
ded
from
htt
ps://
ww
w.c
ambr
idge
.org
/cor
e. IP
add
ress
: 54.
39.1
06.1
73, o
n 23
Jun
2020
at 0
1:59
:22,
sub
ject
to th
e Ca
mbr
idge
Cor
e te
rms
of u
se, a
vaila
ble
at h
ttps
://w
ww
.cam
brid
ge.o
rg/c
ore/
term
s. h
ttps
://do
i.org
/10.
1017
/psr
m.2
018.
28
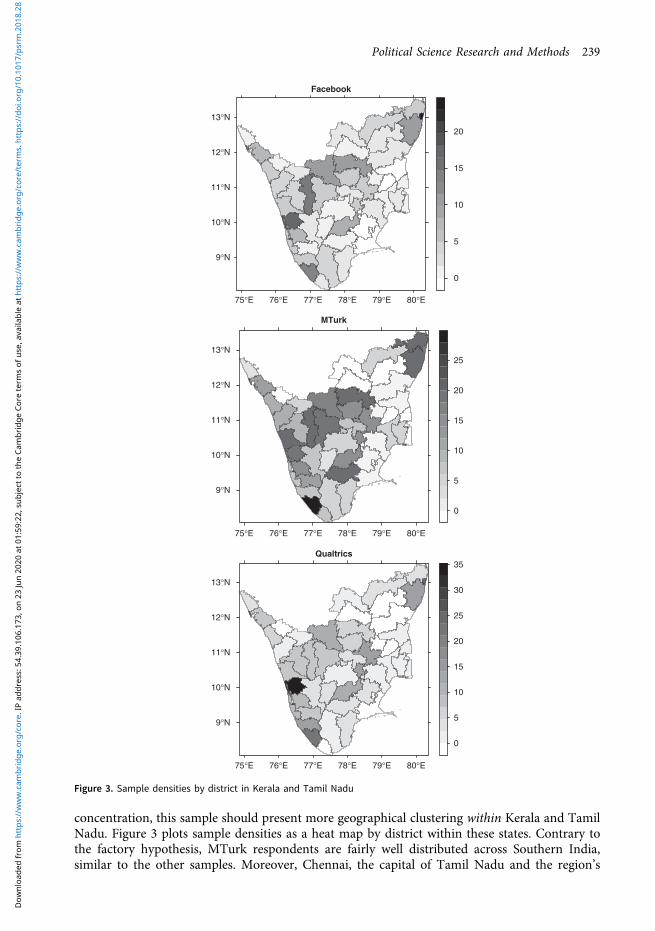
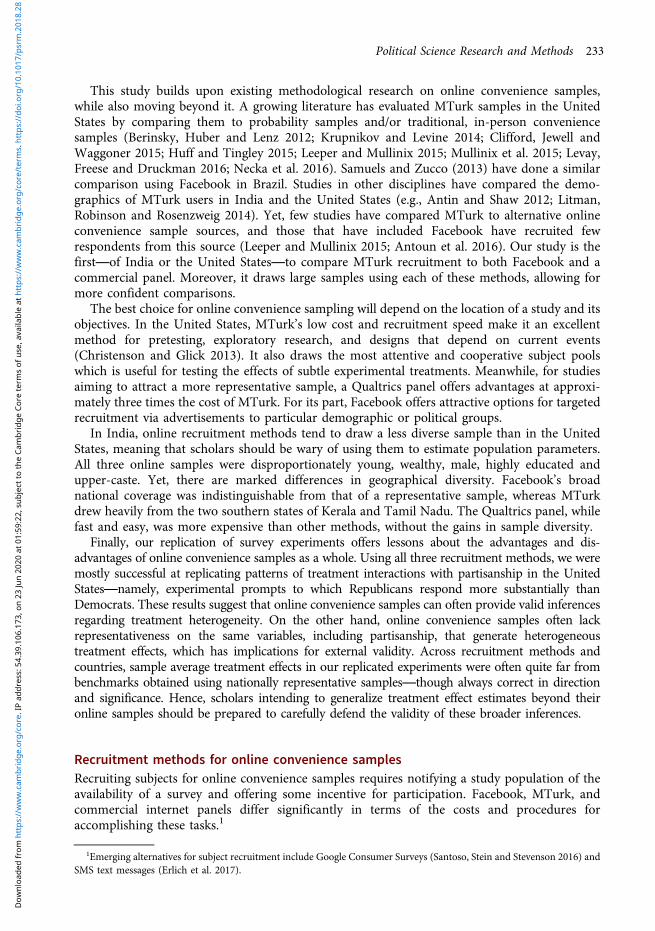
concentration, this sample should present more geographical clustering within Kerala and TamilNadu. Figure 3 plots sample densities as a heat map by district within these states. Contrary tothe factory hypothesis, MTurk respondents are fairly well distributed across Southern India,similar to the other samples. Moreover, Chennai, the capital of Tamil Nadu and the region’s
9°N
10°N
11°N
12°N
13°N
75°E 76°E 77°E 78°E 79°E 80°E
0
5
10
15
20
MTurk
0
5
10
15
20
25
Qualtrics
0
5
10
15
20
25
30
35
9°N
10°N
11°N
12°N
13°N
9°N
10°N
11°N
12°N
13°N
75°E 76°E 77°E 78°E 79°E 80°E
75°E 76°E 77°E 78°E 79°E 80°E
Figure 3. Sample densities by district in Kerala and Tamil Nadu
Political Science Research and Methods 239
Dow
nloa
ded
from
htt
ps://
ww
w.c
ambr
idge
.org
/cor
e. IP
add
ress
: 54.
39.1
06.1
73, o
n 23
Jun
2020
at 0
1:59
:22,
sub
ject
to th
e Ca
mbr
idge
Cor
e te
rms
of u
se, a
vaila
ble
at h
ttps
://w
ww
.cam
brid
ge.o
rg/c
ore/
term
s. h
ttps
://do
i.org
/10.
1017
/psr
m.2
018.
28
major base for call center operations, is only modestly overrepresented in our MTurk sample (9.4percent of the Tamil Nadu respondents, versus 6.4 percent of the state population) but heavilyoverrepresented in the Facebook and Qualtrics samples (37.2 and 25.2 percent, respectively).
One likely explanation for differences in geographical representativeness within India con-cerns modes of internet access. Our online survey could be taken on mobile phones as well asdesktops, but only 4–7 percent of the MTurk and Qualtrics samples accessed the survey viamobile devices, versus 43 percent of the Facebook sample. Internet access via desktop computersis limited in India, and rates vary widely across states, ranging from 1 to 19 percent of householdsin 2011. Mobile telephone access is more common, ranging from 27 to 76 percent.8 A samplethat draws substantially from mobile phone users has greater potential to be geographicallyrepresentative of the Indian population than one that draws almost exclusively from desktopcomputer users.
To summarize our findings on demographics, the convenience samples are mostly biased in asimilar fashion; differences from national probability samples are primarily differences of degreerather than direction. The overrepresentation of older age groups in our US Facebook sample is asurprising exception. In the US, Qualtrics came closest to a national probability sample on amajority of variables. In India, our convenience samples look less like the national populationand a lot more like an elite class of tech-savvy workers. While the three Indian sources deviatefrom population parameters in similar ways, MTurk was often the closest. However, Qualtricsand especially Facebook achieve better geographical coverage in India. We find no such geo-graphic skew in the United States.
Political attitudes and knowledgeOf particular interest to political scientists is how convenience samples deviate from nationalprobability samples with respect to substantive political variables. In this vein, our surveysmeasure interest in politics, ideology, voter registration, turnout, vote in previous elections, partyidentification, news consumption, civics knowledge, identification of political leaders, and, in theUnited States, a policy familiarity question on Medicare.
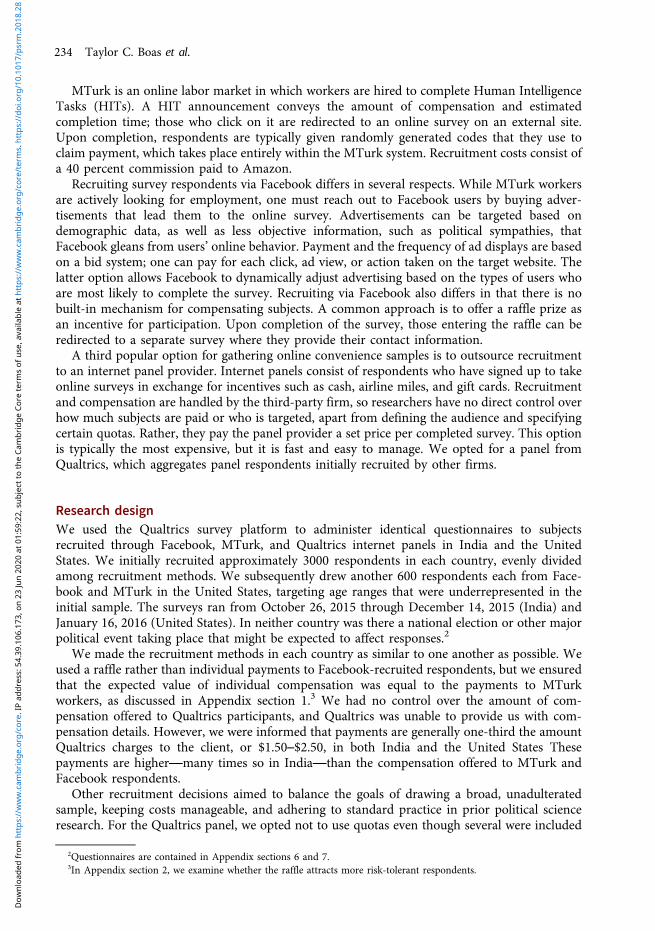
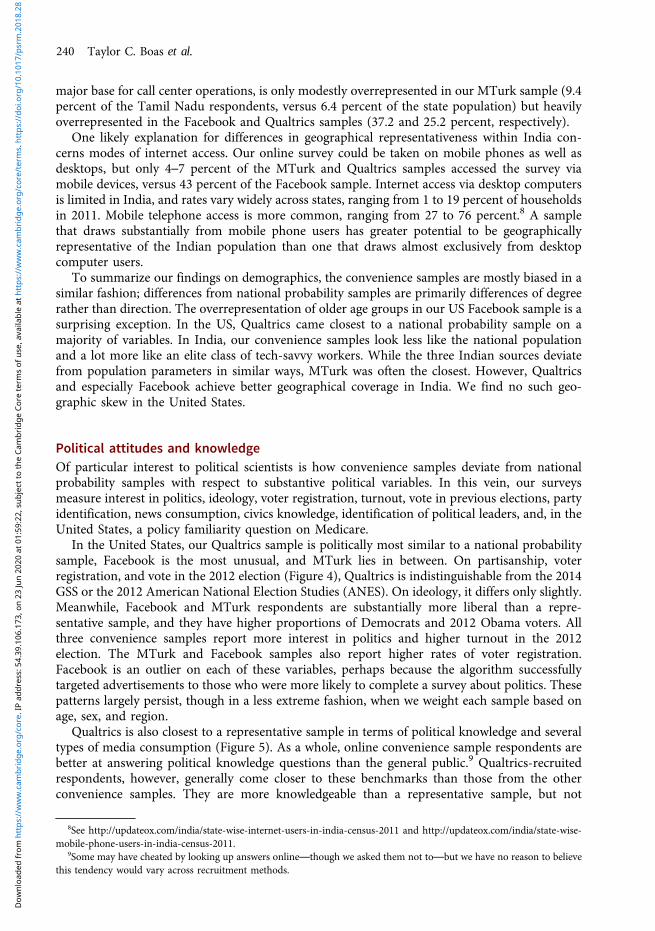
In the United States, our Qualtrics sample is politically most similar to a national probabilitysample, Facebook is the most unusual, and MTurk lies in between. On partisanship, voterregistration, and vote in the 2012 election (Figure 4), Qualtrics is indistinguishable from the 2014GSS or the 2012 American National Election Studies (ANES). On ideology, it differs only slightly.Meanwhile, Facebook and MTurk respondents are substantially more liberal than a repre-sentative sample, and they have higher proportions of Democrats and 2012 Obama voters. Allthree convenience samples report more interest in politics and higher turnout in the 2012election. The MTurk and Facebook samples also report higher rates of voter registration.Facebook is an outlier on each of these variables, perhaps because the algorithm successfullytargeted advertisements to those who were more likely to complete a survey about politics. Thesepatterns largely persist, though in a less extreme fashion, when we weight each sample based onage, sex, and region.
Qualtrics is also closest to a representative sample in terms of political knowledge and severaltypes of media consumption (Figure 5). As a whole, online convenience sample respondents arebetter at answering political knowledge questions than the general public.9 Qualtrics-recruitedrespondents, however, generally come closer to these benchmarks than those from the otherconvenience samples. They are more knowledgeable than a representative sample, but not
8See http://updateox.com/india/state-wise-internet-users-in-india-census-2011 and http://updateox.com/india/state-wise-mobile-phone-users-in-india-census-2011.
9Some may have cheated by looking up answers online—though we asked them not to—but we have no reason to believethis tendency would vary across recruitment methods.
240 Taylor C. Boas et al.
Dow
nloa
ded
from
htt
ps://
ww
w.c
ambr
idge
.org
/cor
e. IP
add
ress
: 54.
39.1
06.1
73, o
n 23
Jun
2020
at 0
1:59
:22,
sub
ject
to th
e Ca
mbr
idge
Cor
e te
rms
of u
se, a
vaila
ble
at h
ttps
://w
ww
.cam
brid
ge.o
rg/c
ore/
term
s. h
ttps
://do
i.org
/10.
1017
/psr
m.2
018.
28
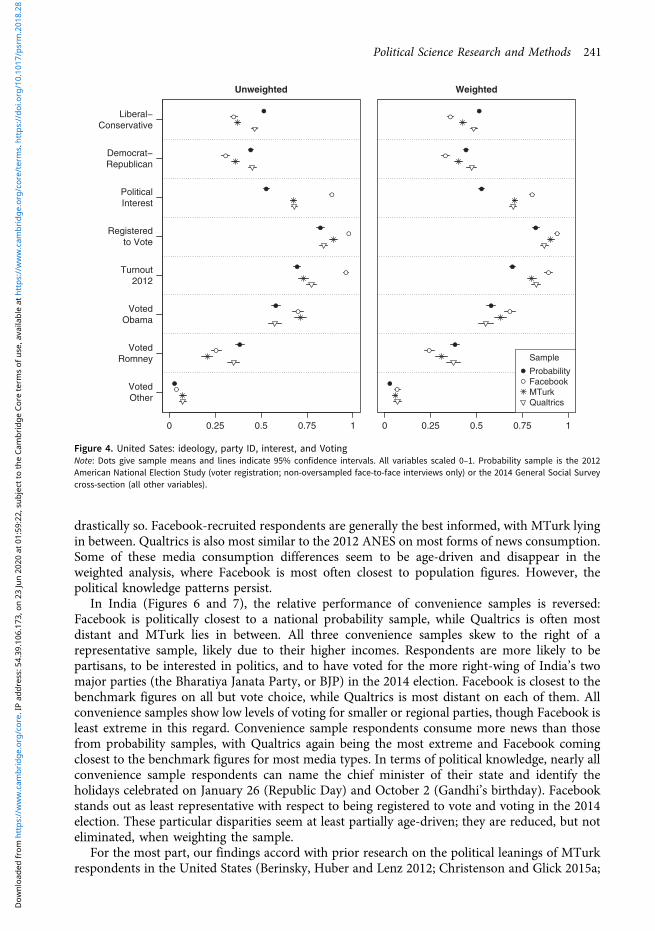
drastically so. Facebook-recruited respondents are generally the best informed, with MTurk lyingin between. Qualtrics is also most similar to the 2012 ANES on most forms of news consumption.Some of these media consumption differences seem to be age-driven and disappear in theweighted analysis, where Facebook is most often closest to population figures. However, thepolitical knowledge patterns persist.
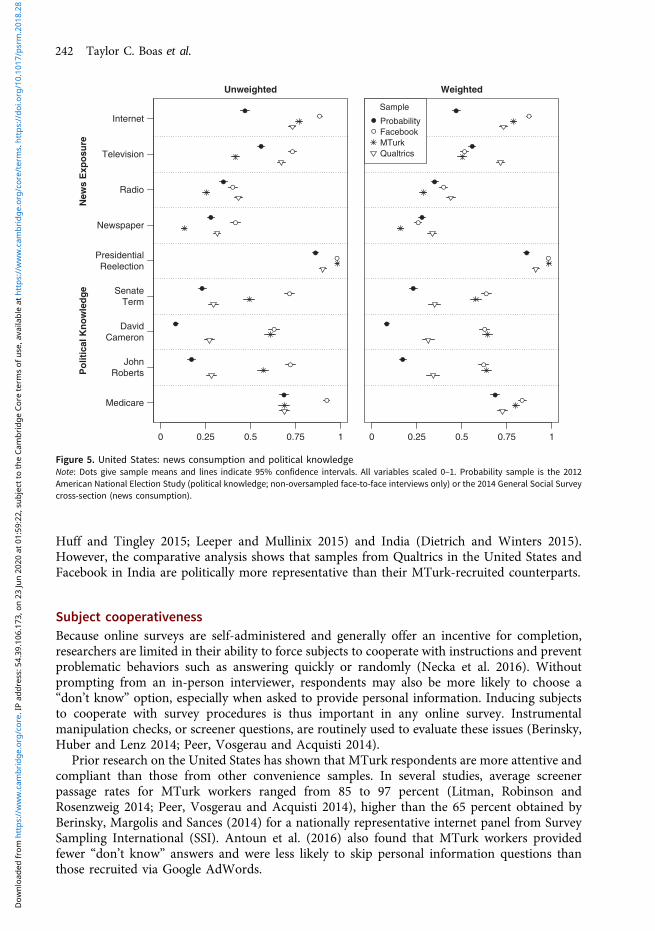
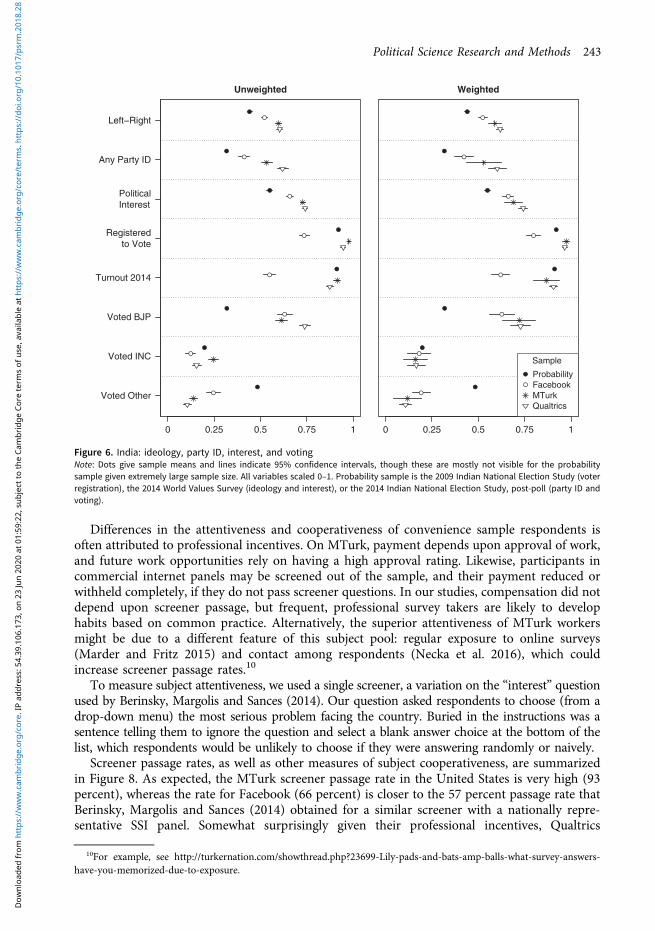
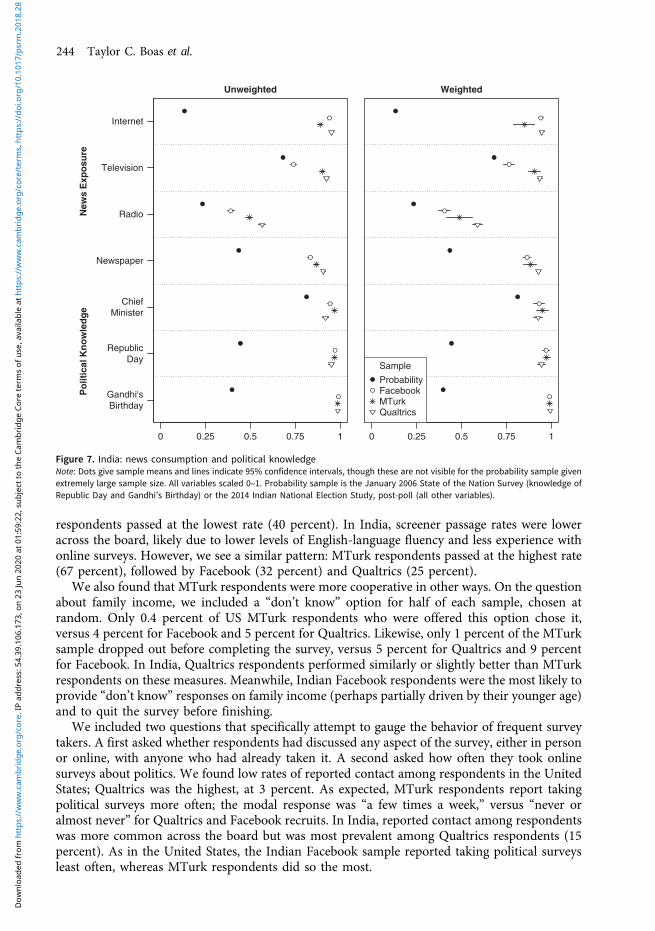
In India (Figures 6 and 7), the relative performance of convenience samples is reversed:Facebook is politically closest to a national probability sample, while Qualtrics is often mostdistant and MTurk lies in between. All three convenience samples skew to the right of arepresentative sample, likely due to their higher incomes. Respondents are more likely to bepartisans, to be interested in politics, and to have voted for the more right-wing of India’s twomajor parties (the Bharatiya Janata Party, or BJP) in the 2014 election. Facebook is closest to thebenchmark figures on all but vote choice, while Qualtrics is most distant on each of them. Allconvenience samples show low levels of voting for smaller or regional parties, though Facebook isleast extreme in this regard. Convenience sample respondents consume more news than thosefrom probability samples, with Qualtrics again being the most extreme and Facebook comingclosest to the benchmark figures for most media types. In terms of political knowledge, nearly allconvenience sample respondents can name the chief minister of their state and identify theholidays celebrated on January 26 (Republic Day) and October 2 (Gandhi’s birthday). Facebookstands out as least representative with respect to being registered to vote and voting in the 2014election. These particular disparities seem at least partially age-driven; they are reduced, but noteliminated, when weighting the sample.
For the most part, our findings accord with prior research on the political leanings of MTurkrespondents in the United States (Berinsky, Huber and Lenz 2012; Christenson and Glick 2015a;
Unweighted
0 0.25 0.5 0.75 1
VotedOther
VotedRomney
VotedObama
Turnout2012
Registeredto Vote
PoliticalInterest
Democrat−Republican
Liberal−Conservative
Weighted
0 0.25 0.5 0.75 1
Sample
ProbabilityFacebookMTurkQualtrics
Figure 4. United Sates: ideology, party ID, interest, and VotingNote: Dots give sample means and lines indicate 95% confidence intervals. All variables scaled 0–1. Probability sample is the 2012American National Election Study (voter registration; non-oversampled face-to-face interviews only) or the 2014 General Social Surveycross-section (all other variables).
Political Science Research and Methods 241
Dow
nloa
ded
from
htt
ps://
ww
w.c
ambr
idge
.org
/cor
e. IP
add
ress
: 54.
39.1
06.1
73, o
n 23
Jun
2020
at 0
1:59
:22,
sub
ject
to th
e Ca
mbr
idge
Cor
e te
rms
of u
se, a
vaila
ble
at h
ttps
://w
ww
.cam
brid
ge.o
rg/c
ore/
term
s. h
ttps
://do
i.org
/10.
1017
/psr
m.2
018.
28
Huff and Tingley 2015; Leeper and Mullinix 2015) and India (Dietrich and Winters 2015).However, the comparative analysis shows that samples from Qualtrics in the United States andFacebook in India are politically more representative than their MTurk-recruited counterparts.
Subject cooperativenessBecause online surveys are self-administered and generally offer an incentive for completion,researchers are limited in their ability to force subjects to cooperate with instructions and preventproblematic behaviors such as answering quickly or randomly (Necka et al. 2016). Withoutprompting from an in-person interviewer, respondents may also be more likely to choose a“don’t know” option, especially when asked to provide personal information. Inducing subjectsto cooperate with survey procedures is thus important in any online survey. Instrumentalmanipulation checks, or screener questions, are routinely used to evaluate these issues (Berinsky,Huber and Lenz 2014; Peer, Vosgerau and Acquisti 2014).
Prior research on the United States has shown that MTurk respondents are more attentive andcompliant than those from other convenience samples. In several studies, average screenerpassage rates for MTurk workers ranged from 85 to 97 percent (Litman, Robinson andRosenzweig 2014; Peer, Vosgerau and Acquisti 2014), higher than the 65 percent obtained byBerinsky, Margolis and Sances (2014) for a nationally representative internet panel from SurveySampling International (SSI). Antoun et al. (2016) also found that MTurk workers providedfewer “don’t know” answers and were less likely to skip personal information questions thanthose recruited via Google AdWords.
Unweighted
0 0.25 0.5 0.75 1
Medicare
JohnRoberts
DavidCameron
SenateTerm
PresidentialReelection
Newspaper
Radio
Television
Internet
Po
litic
al K
no
wle
dg
eN
ews
Exp
osu
reWeighted
0 0.25 0.5 0.75 1
Sample
ProbabilityFacebookMTurkQualtrics
Figure 5. United States: news consumption and political knowledgeNote: Dots give sample means and lines indicate 95% confidence intervals. All variables scaled 0–1. Probability sample is the 2012American National Election Study (political knowledge; non-oversampled face-to-face interviews only) or the 2014 General Social Surveycross-section (news consumption).
242 Taylor C. Boas et al.
Dow
nloa
ded
from
htt
ps://
ww
w.c
ambr
idge
.org
/cor
e. IP
add
ress
: 54.
39.1
06.1
73, o
n 23
Jun
2020
at 0
1:59
:22,
sub
ject
to th
e Ca
mbr
idge
Cor
e te
rms
of u
se, a
vaila
ble
at h
ttps
://w
ww
.cam
brid
ge.o
rg/c
ore/
term
s. h
ttps
://do
i.org
/10.
1017
/psr
m.2
018.
28
Differences in the attentiveness and cooperativeness of convenience sample respondents isoften attributed to professional incentives. On MTurk, payment depends upon approval of work,and future work opportunities rely on having a high approval rating. Likewise, participants incommercial internet panels may be screened out of the sample, and their payment reduced orwithheld completely, if they do not pass screener questions. In our studies, compensation did notdepend upon screener passage, but frequent, professional survey takers are likely to develophabits based on common practice. Alternatively, the superior attentiveness of MTurk workersmight be due to a different feature of this subject pool: regular exposure to online surveys(Marder and Fritz 2015) and contact among respondents (Necka et al. 2016), which couldincrease screener passage rates.10
To measure subject attentiveness, we used a single screener, a variation on the “interest” questionused by Berinsky, Margolis and Sances (2014). Our question asked respondents to choose (from adrop-down menu) the most serious problem facing the country. Buried in the instructions was asentence telling them to ignore the question and select a blank answer choice at the bottom of thelist, which respondents would be unlikely to choose if they were answering randomly or naively.
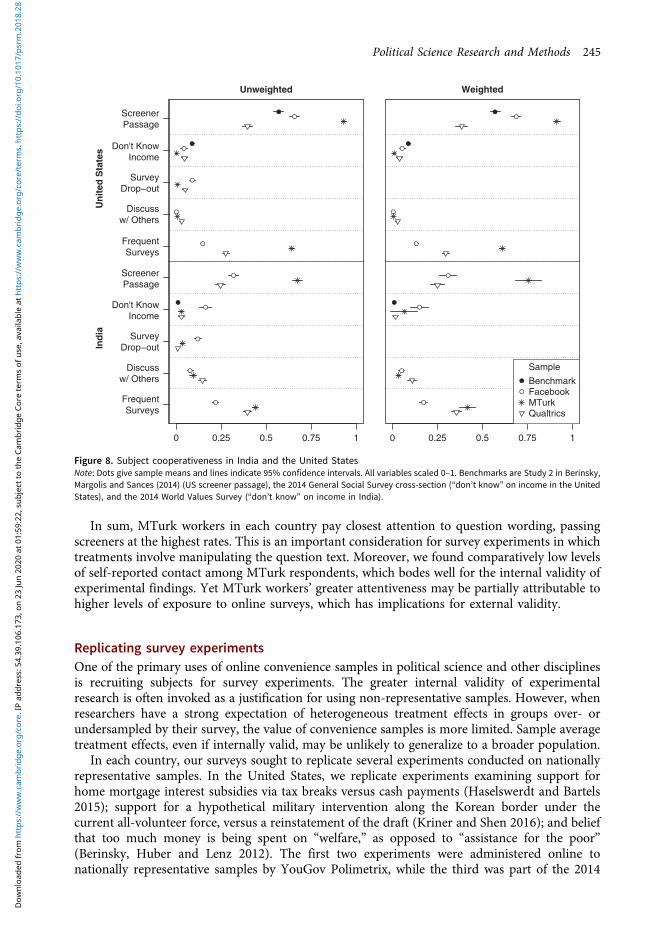
Screener passage rates, as well as other measures of subject cooperativeness, are summarizedin Figure 8. As expected, the MTurk screener passage rate in the United States is very high (93percent), whereas the rate for Facebook (66 percent) is closer to the 57 percent passage rate thatBerinsky, Margolis and Sances (2014) obtained for a similar screener with a nationally repre-sentative SSI panel. Somewhat surprisingly given their professional incentives, Qualtrics
Unweighted
0 0.25 0.5 0.75 1
Voted Other
Voted INC
Voted BJP
Turnout 2014
Registeredto Vote
PoliticalInterest
Any Party ID
Left−Right
Weighted
0 0.25 0.5 0.75 1
Sample
ProbabilityFacebookMTurkQualtrics
Figure 6. India: ideology, party ID, interest, and votingNote: Dots give sample means and lines indicate 95% confidence intervals, though these are mostly not visible for the probabilitysample given extremely large sample size. All variables scaled 0–1. Probability sample is the 2009 Indian National Election Study (voterregistration), the 2014 World Values Survey (ideology and interest), or the 2014 Indian National Election Study, post-poll (party ID andvoting).
10For example, see http://turkernation.com/showthread.php?23699-Lily-pads-and-bats-amp-balls-what-survey-answers-have-you-memorized-due-to-exposure.
Political Science Research and Methods 243
Dow
nloa
ded
from
htt
ps://
ww
w.c
ambr
idge
.org
/cor
e. IP
add
ress
: 54.
39.1
06.1
73, o
n 23
Jun
2020
at 0
1:59
:22,
sub
ject
to th
e Ca
mbr
idge
Cor
e te
rms
of u
se, a
vaila
ble
at h
ttps
://w
ww
.cam
brid
ge.o
rg/c
ore/
term
s. h
ttps
://do
i.org
/10.
1017
/psr
m.2
018.
28
respondents passed at the lowest rate (40 percent). In India, screener passage rates were loweracross the board, likely due to lower levels of English-language fluency and less experience withonline surveys. However, we see a similar pattern: MTurk respondents passed at the highest rate(67 percent), followed by Facebook (32 percent) and Qualtrics (25 percent).
We also found that MTurk respondents were more cooperative in other ways. On the questionabout family income, we included a “don’t know” option for half of each sample, chosen atrandom. Only 0.4 percent of US MTurk respondents who were offered this option chose it,versus 4 percent for Facebook and 5 percent for Qualtrics. Likewise, only 1 percent of the MTurksample dropped out before completing the survey, versus 5 percent for Qualtrics and 9 percentfor Facebook. In India, Qualtrics respondents performed similarly or slightly better than MTurkrespondents on these measures. Meanwhile, Indian Facebook respondents were the most likely toprovide “don’t know” responses on family income (perhaps partially driven by their younger age)and to quit the survey before finishing.
We included two questions that specifically attempt to gauge the behavior of frequent surveytakers. A first asked whether respondents had discussed any aspect of the survey, either in personor online, with anyone who had already taken it. A second asked how often they took onlinesurveys about politics. We found low rates of reported contact among respondents in the UnitedStates; Qualtrics was the highest, at 3 percent. As expected, MTurk respondents report takingpolitical surveys more often; the modal response was “a few times a week,” versus “never oralmost never” for Qualtrics and Facebook recruits. In India, reported contact among respondentswas more common across the board but was most prevalent among Qualtrics respondents (15percent). As in the United States, the Indian Facebook sample reported taking political surveysleast often, whereas MTurk respondents did so the most.
Unweighted
0 0.25 0.5 0.75 1
Gandhi'sBirthday
RepublicDay
ChiefMinister
Newspaper
Radio
Television
Internet
Po
litic
al K
no
wle
dg
eN
ews
Exp
osu
reWeighted
0 0.25 0.5 0.75 1
Sample
ProbabilityFacebookMTurkQualtrics
Figure 7. India: news consumption and political knowledgeNote: Dots give sample means and lines indicate 95% confidence intervals, though these are not visible for the probability sample givenextremely large sample size. All variables scaled 0–1. Probability sample is the January 2006 State of the Nation Survey (knowledge ofRepublic Day and Gandhi’s Birthday) or the 2014 Indian National Election Study, post-poll (all other variables).
244 Taylor C. Boas et al.
Dow
nloa
ded
from
htt
ps://
ww
w.c
ambr
idge
.org
/cor
e. IP
add
ress
: 54.
39.1
06.1
73, o
n 23
Jun
2020
at 0
1:59
:22,
sub
ject
to th
e Ca
mbr
idge
Cor
e te
rms
of u
se, a
vaila
ble
at h
ttps
://w
ww
.cam
brid
ge.o
rg/c
ore/
term
s. h
ttps
://do
i.org
/10.
1017
/psr
m.2
018.
28
In sum, MTurk workers in each country pay closest attention to question wording, passingscreeners at the highest rates. This is an important consideration for survey experiments in whichtreatments involve manipulating the question text. Moreover, we found comparatively low levelsof self-reported contact among MTurk respondents, which bodes well for the internal validity ofexperimental findings. Yet MTurk workers’ greater attentiveness may be partially attributable tohigher levels of exposure to online surveys, which has implications for external validity.
Replicating survey experimentsOne of the primary uses of online convenience samples in political science and other disciplinesis recruiting subjects for survey experiments. The greater internal validity of experimentalresearch is often invoked as a justification for using non-representative samples. However, whenresearchers have a strong expectation of heterogeneous treatment effects in groups over- orundersampled by their survey, the value of convenience samples is more limited. Sample averagetreatment effects, even if internally valid, may be unlikely to generalize to a broader population.
In each country, our surveys sought to replicate several experiments conducted on nationallyrepresentative samples. In the United States, we replicate experiments examining support forhome mortgage interest subsidies via tax breaks versus cash payments (Haselswerdt and Bartels2015); support for a hypothetical military intervention along the Korean border under thecurrent all-volunteer force, versus a reinstatement of the draft (Kriner and Shen 2016); and beliefthat too much money is being spent on “welfare,” as opposed to “assistance for the poor”(Berinsky, Huber and Lenz 2012). The first two experiments were administered online tonationally representative samples by YouGov Polimetrix, while the third was part of the 2014
Unweighted
0 0.25 0.5 0.75 1
FrequentSurveys
Discussw/ Others
SurveyDrop−out
Don't KnowIncome
ScreenerPassage
FrequentSurveys
Discussw/ Others
SurveyDrop−out
Don't KnowIncome
ScreenerPassage
Ind
iaU
nit
ed S
tate
sWeighted
0 0.25 0.5 0.75 1
Sample
BenchmarkFacebookMTurkQualtrics
Figure 8. Subject cooperativeness in India and the United StatesNote: Dots give sample means and lines indicate 95% confidence intervals. All variables scaled 0–1. Benchmarks are Study 2 in Berinsky,Margolis and Sances (2014) (US screener passage), the 2014 General Social Survey cross-section (“don’t know” on income in the UnitedStates), and the 2014 World Values Survey (“don’t know” on income in India).
Political Science Research and Methods 245
Dow
nloa
ded
from
htt
ps://
ww
w.c
ambr
idge
.org
/cor
e. IP
add
ress
: 54.
39.1
06.1
73, o
n 23
Jun
2020
at 0
1:59
:22,
sub
ject
to th
e Ca
mbr
idge
Cor
e te
rms
of u
se, a
vaila
ble
at h
ttps
://w
ww
.cam
brid
ge.o
rg/c
ore/
term
s. h
ttps
://do
i.org
/10.
1017
/psr
m.2
018.
28
GSS cross-section, involving face-to-face interviews. In each case, we examine the effects of abinary treatment on a binary dependent variable, collapsing multiple categories (e.g., “support”and “strongly support”) as in the original analysis. In each original experiment, sample averagetreatment effects are positive, but they differ significantly by partisanship and/or ideology.11
For India, there are few survey experiments that have been conducted on nationally repre-sentative samples. We replicate two list experiments from the 2014–2015 Lok Surveys, whichachieved national coverage but oversampled urban areas (we use weighted figures which correctfor this design). The first list experiment measures family preference for male rather than femalechildren, and the second looks at opposition to political candidates with criminal convictions.Estimates from both experiments vary widely across states (Kapur, Sircar and Vaishnav 2014;Reed and Kapur 2015). Our Indian MTurk sample is particularly unrepresentative in terms ofgeography, and all three are unrepresentative in terms of sex, which might be expected to affectpreference for sons.
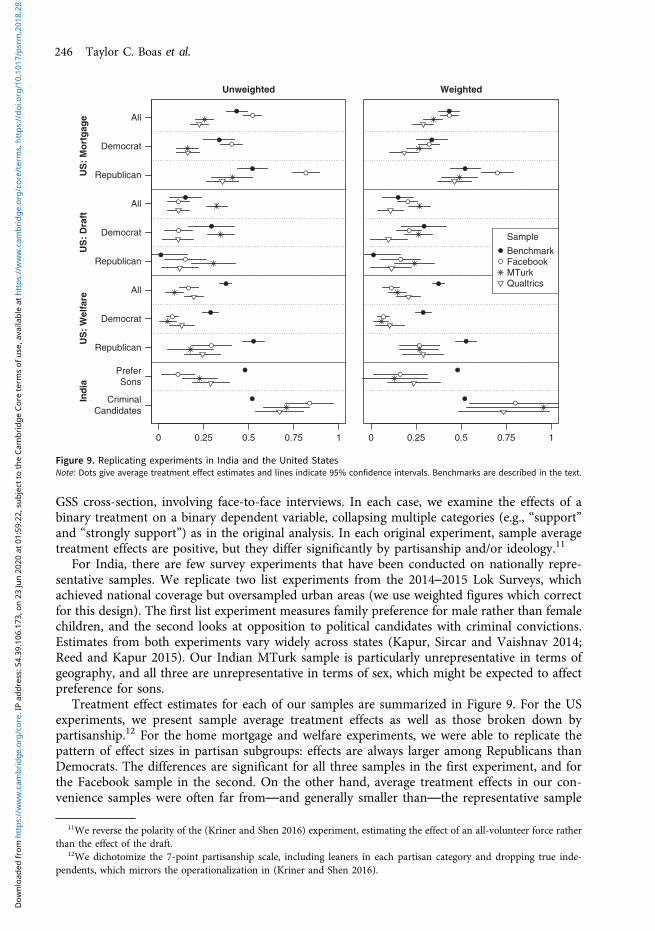
Treatment effect estimates for each of our samples are summarized in Figure 9. For the USexperiments, we present sample average treatment effects as well as those broken down bypartisanship.12 For the home mortgage and welfare experiments, we were able to replicate thepattern of effect sizes in partisan subgroups: effects are always larger among Republicans thanDemocrats. The differences are significant for all three samples in the first experiment, and forthe Facebook sample in the second. On the other hand, average treatment effects in our con-venience samples were often far from—and generally smaller than—the representative sample
Unweighted
0 0.25 0.5 0.75 1
CriminalCandidates
PreferSons
Republican
Democrat
All
Republican
Democrat
All
Republican
Democrat
All
Ind
iaU
S:
Wel
fare
US
: D
raft
US
: M
ort
gag
eWeighted
0 0.25 0.5 0.75 1
Sample
BenchmarkFacebookMTurkQualtrics
Figure 9. Replicating experiments in India and the United StatesNote: Dots give average treatment effect estimates and lines indicate 95% confidence intervals. Benchmarks are described in the text.
11We reverse the polarity of the (Kriner and Shen 2016) experiment, estimating the effect of an all-volunteer force ratherthan the effect of the draft.
12We dichotomize the 7-point partisanship scale, including leaners in each partisan category and dropping true inde-pendents, which mirrors the operationalization in (Kriner and Shen 2016).
246 Taylor C. Boas et al.
Dow
nloa
ded
from
htt
ps://
ww
w.c
ambr
idge
.org
/cor
e. IP
add
ress
: 54.
39.1
06.1
73, o
n 23
Jun
2020
at 0
1:59
:22,
sub
ject
to th
e Ca
mbr
idge
Cor
e te
rms
of u
se, a
vaila
ble
at h
ttps
://w
ww
.cam
brid
ge.o
rg/c
ore/
term
s. h
ttps
://do
i.org
/10.
1017
/psr
m.2
018.
28
benchmarks. This is true not only of the full sample estimates, but also of those broken down byparty. Weighting the samples improves things somewhat, especially for the mortgage experiment,but it is not a panacea. Moreover, in none of our convenience samples do we find the pattern ofresults demonstrated by Kriner and Shen (2016) for the military draft experiment: a large effectamong Democrats and near-zero effect among Republicans.
For the Indian list experiments, each of our convenience samples is biased in the sociallyacceptable direction (no preference for male children, and being bothered by criminal candi-dates), with Qualtrics coming closest to the benchmark. These patterns persist when we weightthe samples, suggesting that unrepresentativeness in terms of geography, age, or sex is not drivingthe bias. Rather, we suspect that traditional attitudes of the sort measured by these list experi-ments are simply less prevalent among the highly educated and comparatively wealthy Indianswho make up our convenience samples.
On the whole, our analysis of experimental replicability does not point to a clear winneramong the convenience samples. Rather, several conclusions arise from the results obtained withall three. Our analysis suggests that online convenience samples may offer good alternatives toprobability samples for testing hypotheses about partisan treatment interactions. In two out ofthree experiments in the United States, we were able to replicate a pattern of heterogeneoustreatment effects by party ID using each of our samples (see also Mullinix et al. 2015, for similarresults using MTurk). This is good news, given that political scientists are often particularlyinterested in these sorts of interactions.
On the other hand, we would caution political scientists regarding the external validity ofsample average treatment effects obtained from convenience samples. In our analysis, pointestimates were often quite far from benchmarks obtained using nationally representative sam-ples, regardless of the country or recruitment method. Several classic psychology experimentshave been replicated on MTurk, with similar point estimates as in the original studies (Paolacci,Chandler and Ipeirotis 2010; Berinsky, Huber and Lenz 2012). But survey experiments inpolitical science are probably more likely than those in psychology to generate heterogeneoustreatment effects according to the same variables on which the survey is unrepresentative, as wefind with party ID in the mortgage and welfare experiments. The combination of unrepre-sentativeness and heterogeneity might explain our failure to replicate sample average treatmenteffects with most of our samples and survey experiments, though other factors, such as pub-lication bias or survey mode effects, could also be at play.
ConclusionOur comparisons of the three recruitment methods underscore that a scholar’s best option foronline convenience samples will depend on where the research is being conducted and what itsobjectives are. A summary table of comparative advantages is in Appendix section 5. In theUnited States, MTurk stands out in terms of the low cost and speed with which one can recruit asample, making it the optimal choice for pretesting or exploratory research. MTurk’s attentiveand compliant subject pool may also be an advantage in some contexts, including subtleexperimental treatments, panel studies, and designs that depend on current events (see alsoChristenson and Glick 2013). For scholars aiming to estimate treatment effects on the treated orto discard respondents who do not pass screeners, an MTurk sample should maximize statisticalpower compared to other alternatives.
We also found that, where scholars are particularly concerned with representativeness orsample diversity on demographic and political variables, a Qualtrics panel offers clear advantages,even without employing the quotas that are included in the base price. At roughly three times thecost of MTurk, but far less than probability samples or the highest-quality online panels such asthose from YouGov, Qualtrics may represent an attractive middle ground to researchers withsomewhat larger budgets. While scholars should be aware of the low levels of attentiveness we
Political Science Research and Methods 247
Dow
nloa
ded
from
htt
ps://
ww
w.c
ambr
idge
.org
/cor
e. IP
add
ress
: 54.
39.1
06.1
73, o
n 23
Jun
2020
at 0
1:59
:22,
sub
ject
to th
e Ca
mbr
idge
Cor
e te
rms
of u
se, a
vaila
ble
at h
ttps
://w
ww
.cam
brid
ge.o
rg/c
ore/
term
s. h
ttps
://do
i.org
/10.
1017
/psr
m.2
018.
28
found among Qualtrics respondents, they should also bear in mind that highly attentive surveyrespondents may themselves be unrepresentative (Berinsky, Margolis and Sances 2014). If asurvey experimenter aims to estimate realistic intent-to-treat effects, including among respon-dents who only minimally process the treatment information, the added cost of Qualtrics may bejustified.
Finally, Facebook recruitment in the United States offers a good alternative for targetedsampling. While less expensive overall, the two-stage approach that we used to recruit olderrespondents on MTurk was relatively slow. Such inefficiency might be exacerbated when tar-geting an even smaller share of the MTurk worker pool, such as residents of a particular city orstate. Targeted recruitment on certain variables, including age, has recently been made availableon MTurk through the “premiere qualifications” option, which eliminates the inefficiencies andmaintains a relatively low cost (see Appendix section 1). At somewhat greater cost, Facebookoffers an easy method for targeted recruitment on virtually any variable, without substantialincreases in recruitment time or demands on the researcher.
In India, Facebook stands out as the best option for drawing a national convenience sample,given its broad geographical dispersion and greater representativeness on many political vari-ables. Targeting Facebook ads by age and sex, which we did not attempt in India, could make thissource of respondents even more attractive. MTurk in India offers some of the same advantagesas in the United States—low-cost recruitment, and a comparatively attentive subject pool—yetits heavy concentration in the two southern states of Kerala and Tamil Nadu make it lessgeographically representative. Moreover, the slow pace of MTurk subject recruitment in Indiaeliminates one of its major advantages in the United States. Finally, a Qualtrics panel seems tooffer few advantages in India other than convenience and speed, given its high cost and distancefrom national benchmarks on many political variables. In other words, while different methodsstill carry relative advantages, scholars working on India face fewer tradeoffs than those studyingthe United States.
While we have emphasized differences and comparative advantages, one commonality acrosscountries and recruitment methods concerns the implications of heterogeneous treatment effectsand unrepresentativeness on political variables. Political scientists are often interested in whethertreatment effects are moderated by variables such as ideology or partisanship, and our replicationof survey experiments suggests that online convenience samples often provide valid inferences inthis regard. However, the fact that our online convenience samples were consistently unrepre-sentative on these same moderators suggests that scholars should exercise caution when inter-preting sample average treatment effects. Point estimates may deviate significantly from thoseobtained using representative samples. A disproportionately wealthy, educated, and cosmopo-litan subject pool in India or a liberal-leaning, politically engaged one in the United States maysometimes behave just like the population, but this will not always be so.
For scholars considering recruitment options for their own online surveys, an importantquestion is whether future studies using the same methods should deliver similar results to thosereported here. As noted above, on most variables for which they can be compared, our findingsfor the MTurk samples in both India and the United States mirror those of numerous priorstudies conducted over nearly a decade. These results suggest that our estimates lie somewhere inthe central part of the distribution rather than the tails. For Facebook and Qualtrics, where thereis no prior basis for comparison, it is more difficult to know whether we drew an outlier sample.However, the fact that we used standard, well-established procedures for recruiting from bothrespondent pools suggests that our findings should not be unusual by virtue of research design.
How might scholars evaluate online recruitment methods in other countries, beyond theUnited States and India? Given its broad global penetration and accessibility via mobile phone,Facebook seems a promising option for drawing samples that are diverse in terms of geographyand, potentially, political variables. Crowdsourced labor markets—MTurk, or alternatives suchas CrowdFlower with broader global coverage—have a much smaller user base. Moreover,
248 Taylor C. Boas et al.
Dow
nloa
ded
from
htt
ps://
ww
w.c
ambr
idge
.org
/cor
e. IP
add
ress
: 54.
39.1
06.1
73, o
n 23
Jun
2020
at 0
1:59
:22,
sub
ject
to th
e Ca
mbr
idge
Cor
e te
rms
of u
se, a
vaila
ble
at h
ttps
://w
ww
.cam
brid
ge.o
rg/c
ore/
term
s. h
ttps
://do
i.org
/10.
1017
/psr
m.2
018.
28
country-specific patterns of adoption, such as the prevalence of South Indians on MTurk, mayrender this user base unrepresentative in unexpected ways. On the other hand, we expect that thecommon advantages of MTurk in both India and the United States—cost and subject atten-tiveness—will be replicated in other crowdsourced labor markets, since they derive from thenature of the recruitment method. While commercial internet panels are a comparatively hassle-free option, one should also price out social media or crowdsourced alternatives, especially inplaces with a low cost of labor where the savings may be large. Finally, whatever method oneuses, it is important to validate online samples by comparing descriptive statistics to those fromprobability samples or the national census, rather than just citing prior research, especially onanother country.
Supplementary Material. To view supplementary material for this article, please visit https://doi.org/10.1017/psrm.2018.28
Acknowledgments. This research has been generously supported by a grant from the Hariri Institute for ComputationalScience and Engineering at Boston University. For helpful comments and suggestions, the authors are grateful to AzerBestavros, Jennifer Bussell, John Byers, Simon Chauchard, Doug Kriner, Michele Margolis, Ryan Moore, Irfan Nooruddin,and Cesar Zucco. Thanks to Neelanjan Sircar for sharing the Lok Surveys instruments. This study is pre-registered withEGAP (ID 20151027AA; http://egap.org/registration/1572). Approval was obtained from the Institutional Review Board ofBoston University (protocol 3891X). Replication data are available via https://dataverse.harvard.edu/dataverse/PSRM.
ReferencesAntin J and Shaw A (2012) Social Desirability Bias and Self-Reports of Motivation: A Study of Amazon Mechanical Turk in
the US and India. Proceedings of the SIGCHI Conference on Human Factors in Computing Systems, pp. 2925–2934.ACM.
Antoun C, Zhang C, Conrad FG and Schober MF (2016) Comparisons of Online Recruitment Strategies for ConvenienceSamples: Craigslist, Google AdWords, Facebook, and Amazon’s Mechanical Turk. Field Methods 28(3), 231–246.
Arceneaux K (2012) Cognitive Biases and the Strength of Political Arguments. American Journal of Political Science 56(2),271–285.
Ausderan J (2014) How Naming and Shaming Affects Human Rights Perceptions in the Shamed Country. Journal of PeaceResearch 51(1), 81–95.
Azam M, Chin A and Prakash N (2013) The Returns to English-Language Skills in India. Economic Development andCultural Change 61(2), 335–367.
Benjamini Y and Hochberg Y (1995) Controlling the False Discovery Rate: A Practical and Powerful Approach to MultipleTesting. Journal of the Royal Statistical Society. Series B (Methodological) 57(1), 289–300.
Berinsky AJ, Huber GA and Lenz GS (2012) Evaluating Online Labor Markets for Experimental Research: Amazon.com’sMechanical Turk. Political Analysis 20(3), 351–368.
Berinsky AJ, Margolis MF and Sances MW (2014) Separating the Shirkers from the Workers? Making Sure RespondentsPay Attention on Self-Administered Surveys. American Journal of Political Science 58(3), 739–753.
Boas TC (2016) Pastors for Pinochet: Authoritarian Stereotypes and Voting for Evangelicals in Chile. Journal ofExperimental Political Science 3(2), 197–205.
Charnysh V, Lucas C and Singh P (2015) The Ties That Bind: National Identity Salience and Pro-Social Behavior Towardthe Ethnic Other. Comparative Political Studies 48(3), 267–300.
Christenson DP and Glick DM (2013) Crowdsourcing Panel Studies and Real-Time Experiments in MTurk. The PoliticalMethodologist 20(2), 27–33.
Christenson DP and Glick DM (2015a) Chief Justice Roberts’s Health Care Decision Disrobed: The Microfoundations of theSupreme Court’s Legitimacy. American Journal of Political Science 59(2), 403–418.
Christenson DP and Glick DM (2015b) Issue-Specific Opinion Change: The Supreme Court and Health Care Reform.Public Opinion Quarterly 79(4), 881–905.
Clifford S, Jewell RM and Waggoner PD (2015) Are Samples Drawn from Mechanical Turk Valid for Research on PoliticalIdeology? Research & Politics 2(4), 1–9.
Dietrich S and Winters MS (2015) Foreign Aid and Government Legitimacy. Journal of Experimental Political Science2(2), 164–171.
Erlich A, Jung DF, Long JD and McIntosh C (2017) The Double-Edged Sword of Mobilizing Citizens Via Mobile Phone inDeveloping Countries. San Diego, CA. Manuscript, McGill University/Emory University/University of Washington/University of California.
Gay C, Hochschild J and White A (2016) Americans’ Belief in Linked Fate: Does the Measure Capture the Concept?The Journal of Race, Ethnicity, and Politics 1(1), 117–144.
Political Science Research and Methods 249
Dow
nloa
ded
from
htt
ps://
ww
w.c
ambr
idge
.org
/cor
e. IP
add
ress
: 54.
39.1
06.1
73, o
n 23
Jun
2020
at 0
1:59
:22,
sub
ject
to th
e Ca
mbr
idge
Cor
e te
rms
of u
se, a
vaila
ble
at h
ttps
://w
ww
.cam
brid
ge.o
rg/c
ore/
term
s. h
ttps
://do
i.org
/10.
1017
/psr
m.2
018.
28
Grimmer J, Messing S and Westwood SJ (2012) How Words and Money Cultivate a Personal Vote: The Effect of LegislatorCredit Claiming on Constituent Credit Allocation. American Political Science Review 106(4), 703–719.
Haselswerdt J and Bartels BL (2015) Public Opinion, Policy Tools, and the Status Quo Evidence from a Survey Experiment.Political Research Quarterly 68(3), 607–621.
Huber GA, Hill SJ and Lenz GS (2012) Sources of Bias in Retrospective Decision Making: Experimental Evidence on VotersLimitations in Controlling Incumbents. American Political Science Review 106(4), 720–741.
Huff C and Tingley D (2015) ‘Who are these People?’ Evaluating the Demographic Characteristics and Political Preferencesof MTurk Survey Respondents. Research & Politics 2(3), 1–12.
Kapur D, Sircar N and Vaishnav M (2014) All in the surname. Times of India, March 23. Available at https://bit.ly/2vaNenQ, accessed 26 July 2018.
Kriner DL and Shen FX (2016) Conscription, Inequality, and Partisan Support for War. Journal of Conflict Resolution 60(8),1419–1445.
Krupnikov Y and Levine AS (2014) Cross-Sample Comparisons and External Validity. Journal of Experimental PoliticalScience 1(1), 59–80.
Leeper TJ and Mullinix KJ (2015) What If You Had Done Things Differently? Testing the Generalizability of FramingEffects with Parallel Experiments. Manuscript, Aarhus University, Aarhus, Denmark/Northwestern University, Evanston,IL, https://dl.dropboxusercontent.com/u/414906/ParallelExperimentsOnFraming.pdf, accessed 6 July 2015.
Levay KE, Freese J and Druckman JN (2016) The Demographic and Political Composition of Mechanical Turk Samples.SAGE Open 6(1), 1–17.
Litman L, Robinson J and Rosenzweig C (2014) The Relationship Between Motivation, Monetary Compensation, and DataQuality Among US-and India-based Workers on Mechanical Turk. Behavior Research Methods 47(2), 519–528.
Marder J and Fritz M (2015) The Internet’s Hidden Science Factory. PBS NewsHour, http://www.pbs.org/newshour/updates/inside-amazons-hidden-science-factory/, accessed 26 July 2018.
Mullinix KJ, Leeper TJ, Druckman JN and Freese J (2015) The Generalizability of Survey Experiments. Journal ofExperimental Political Science 2(2), 109–138.
Necka EA, Cacioppo S, Norman GJ and Cacioppo JT (2016) Measuring the Prevalence of Problematic RespondentBehaviors Among MTurk, Campus, and Community Participants. PloS One 11(6), 1–19.
Paolacci G, Chandler J and Ipeirotis PG (2010) Running Experiments on Amazon Mechanical Turk. Judgment and DecisionMaking 5(5), 411–419.
Peer E, Vosgerau J and Acquisti A (2014) Reputation as a Sufficient Condition for Data Quality on AmazonMechanical Turk. Behavior Research Methods 46(4), 1023–1031.
Reed MN and Kapur D (2015) The Love for Sons and Appropriate Attire. The Hindu, January 26. Available at https://bit.ly/2JXjDnb, accessed 26 July 2018.
Samuels D and Zucco C (2013) Using Facebook as a Subject Recruitment Tool for Survey-Experimental Research. WorkingPaper, Social Science Research Network, https://ssrn.com/abstract=2101458, accessed 26 July 2018.
Samuels D and Zucco C (2014) The Power of Partisanship in Brazil: Evidence from Survey Experiments. American Journalof Political Science 58(1), 212–225.
Santoso LP, Stein R and Stevenson R (2016) Survey Experiments with Google Consumer Surveys: Promise and Pitfalls forAcademic Research in Social Science. Political Analysis 24(3), 356–373.
Cite this article: Boas,TC, Christenson, DP and Glick DM. (2020).Recruiting Large Online Samples in the United States andIndia: Facebook, Mechanical Turk, and Qualtrics. https://doi.org/10.1017/psrm.2018.28
250 Taylor C. Boas et al.
Political Science Research and Methods 8, 232–520552002250.
Dow
nloa
ded
from
htt
ps://
ww
w.c
ambr
idge
.org
/cor
e. IP
add
ress
: 54.
39.1
06.1
73, o
n 23
Jun
2020
at 0
1:59
:22,
sub
ject
to th
e Ca
mbr
idge
Cor
e te
rms
of u
se, a
vaila
ble
at h
ttps
://w
ww
.cam
brid
ge.o
rg/c
ore/
term
s. h
ttps
://do
i.org
/10.
1017
/psr
m.2
018.
28