Embed Size (px)
Citation preview

agriculture
Article
Recycling Improves Soil Fertility Management inSmallholdings in Tanzania
Ariane Krause 1 ID and Vera Susanne Rotter 2
1 Postgraduate program lsquoMicroenergy Systems Research Grouprsquo Center for Technology ampSociety Technische Universitaumlt (TU) Berlin 10623 Berlin Germany
2 Department of Environmental Technology Chair of Circular Economy and Recycling Technology TU Berlin10623 Berlin Germany verarottertu-berlinde
Correspondence krauseztgtu-berlinde Tel +49-179-3274543
Received 21 December 2017 Accepted 21 February 2018 Published 26 February 2018
Abstract Residues from bioenergy and ecological sanitation (EcoSan) can be utilized to sustainsoil fertility and productivity With regard to certain cooking and sanitation technologies used insmallholder households (hh) we systematically analyzed how utilization of the respective potentialsto recover residues for farming affects (i) soil nutrient balances (ii) the potential for subsistenceproduction of composts and (iii) environmental emissions On the example of an intercroppingfarming system in Karagwe Tanzania we studied specific farming practices including (1) currentpractices of using standard compost only (2) a combination of using biogas slurry urine and standardcompost (3) a combination of using so-called ldquoCaSa-compostrdquo (containing biochar and sanitizedhuman excreta Project ldquoCarbonization and Sanitationrdquo) urine and standard compost The systemanalysis combines a soil nutrient balance (SNB) with material flow analysis (MFA) Currently nitrogen(N) and phosphorus (P) are depleted by minus54 plusmn 3 and minus8 plusmn 1 kgmiddothaminus1middotyearminus1 respectively Ouranalysis shows however a clear potential to reduce depletion rates of N and to reverse the SNBof P to bring about a positive outcome Composts and biogas slurry supply sufficient P to cropswhile urine effectively supplements N By using resources recovered from cooking and sanitationsufficient compost for subsistence farming may be produced Human excreta contribute especiallyto total N and total P in CaSa-compost whilst biochar recovered from cooking with microgasifierstoves adds to total carbon (C) and total P We conclude that the combined recycling of householdresidues from cooking and from sanitation and CaSa-compost in particular is especially suitable forsustainable soil management as it mitigates existing P-deficiency and soil acidity and also restoressoil organic matter
Keywords integrated plant nutrient management counteracting soil nutrient depletion biocharbiogas slurry carbon recovery ecological sanitation vegan organic farming
1 Introduction
11 The Challenge of Closing the Loop
Managing soil appropriately requires replacing those nutrients which have been taken fromthe soil during cultivation [1] The International Assessment of Agricultural Knowledge Scienceand Technology for Development (IAASTD) sees ldquoAgriculture at a crossroadsrdquo and calls forfocusing on efficient small-scale agroecosystems with material cycles that are as closed as practicablypossible [2] Agroecology nutrient recycling within the agroecosystem and the use of locally availableresources represent therefore agreed prerequisites for soil conservation and amelioration and alsoas a consequence for long-term food production [3ndash9] As a holistic farming approach to jointly managesoil nutrients water crops and vegetation in the context of sub-Saharan Africa (SSA) the IAASTD
Agriculture 2018 8 31 doi103390agriculture8030031 wwwmdpicomjournalagriculture
Agriculture 2018 8 31 2 of 31
and the Food and Agricultural Organisation of the United Nations (FAO) further promote integratedplant nutrient management (IPNM) [1011] When tailored to a particular cropping system IPNM aims toprovide a solution to the triple challenge of (i) sustaining soil fertility (ii) improving land productivityand (iii) reducing environmental degradation [11]
Applied IPNM combines the use of organic inputs such compost farmyard manure mulchetc with mineral inputs such as synthetic fertilizers alongside practices including intercroppingagroforestry liming low-tillage crop rotation etc [12] Composting is a widespread and commonmethod whereby various organic residues mixed with mineral components are aerobically andbiochemically decomposed by macro- and microorganisms The composting process eg [13ndash15]as well as the combined use of compost with inorganic nutrient sources cf [16] has been well studiedin the context of SSA Regular input of organic matter to agricultural soils is needed to restore soilorganic matter (SOM) and maintain soil humus Pursuant to [17] however on-farm availability oforganic matter is often restricted in the case of many farmers in SSA due to poor land productivityAs a consequence SSA has been identified as a hotspot for the depletion of SOM [18] Moreoverexisting organic materials tend to be characterized by comparatively low contents of phosphorus(P) [19] Pig and poultry manure which constitute a possible P-rich resource however are notsufficiently available especially to structurally poor farming households [20] For these reasons a lackof P is a very common factor in limiting plant growth in SSA [17] Consequently many smallholdersface being locked into a vicious circle of low soil P resulting in low production of food crops and thena limited supply of organic material for soil fertility management [17]
12 Monitoring and Assessing Soil Fertility Management Practices
To effectively enhance soil fertility the FAO recommends the development of IPNM approachesalongside the identification of existing soil nutrient balances [2122] The concept of soil nutrient balance(SNB) was introduced by [23] in order to analyze and monitor changes in soil fertility particularly inSSA The methodology aims at measuring calculating and balancing various input and output flowsof nutrients to and from agricultural land
For the wider Lake Victoria region (East Africa) however existing annual rates of soil nutrientmining and replenishing remain mostly unknown [24] As an exception [25] identified existing annualnutrient depletion rates on arable land in Eastern Uganda with 33 kgmiddothaminus1middotyearminus1 and 6 kgmiddothaminus1middotyearminus1
for nitrogen (N) and P respectively For Tanzania (TZ) estimated average annual losses of N and Prange from 20 to 40 kgmiddothaminus1middotyearminus1 and 35 to 66 kgmiddothaminus1middotyearminus1 respectively [26] Furthermore [27]estimated SNBs for N and P of banana-based farming in Northwest TZ as ranging from minus30 to+11 kgmiddothaminus1middotyearminus1 and minus3 to +9 kgmiddothaminus1middotyearminus1 respectively According to [27] nutrients areincreasingly exported out of farmland in the region since the market economy has intensifiedsales and trading of food products and since the use of pit latrines has increased which act assinks for nutrients The most significant nutrient inputs to home gardens derive from imports offodder grasses from off-farm grassland or bought bananas and brewing grasses respectively [17]The worst depletion rates were therefore identified for structurally poor households without livestockAs a countermeasure [27] recommend the rigorous recycling of all household refuse includinghuman excreta alongside an increased application of composting
13 Intersectional Resource Management for Subsistence Fertilizer Production
Hence the recovery of resources from the farming household could effectively promote on-farmnutrient cycling Especially the use of residues from cooking with bioenergy and from ecologicalsanitation (EcoSan) provides a viable option to increase subsistence production of soil amenders forIPNM Residues available after cooking depend on the technology applied and include (i) ash fromthree-stone fires charcoal stoves or rocket stoves (ii) biochar from microgasifier stoves or (iii) biogasslurry from anaerobic fermentation of organic wastes to produce biogas The latter is particularly richin nutrients and is well known for its suitability as a fertilizer for organic farming [28] The term
Agriculture 2018 8 31 3 of 31
ldquobiocharrdquo refers specifically to carbonised organic mattermdashie (powdery) charcoal with significantcarbon (C) contentmdashthat is used for soil amelioration [2930] Biochar has attracted significant interestfrom scientists and practitioners within the last decade largely due to the findings of Terra Pretaan Anthrosol in the Amazon basin with exceptional soil fertility [3132] Using biochar as a compostadditive is the most promising approach for maximising the positive effects of biochar applicationsas demonstrated by [33]
Residues available from EcoSan facilities include urine and faeces that can be collected separatelyin a urine-diverting dry toilet (UDDT) In order to prevent the transmission of disease additionaltreatment of human excreta is vital in order to inactivate pathogens [3435] Treatment should becarried out at as early a stage as possible during the process [36] Urine must simply be stored fora period of at least two months after collection in the UDDT [3637] After this period stored urineis a fast-acting and rapidly available N-fertilizer [38] Urine is often diluted with water in a ratio offrom 13 to up to 15 parts urine to water in order to avoid over-application and to reduce odour [38]For balancing nutrient doses urine should be complemented with either mineral P and potassium(K) additives or an organic amendment such as compost Sanitation of human faeces is possibleby different means [3639] In this study we focus on thermal sanitation of faeces which is based onan appropriate combination of time and temperature [40] As an example pasteurization can take placeat temperatures between 65 to 75 C over periods ranging from 30 to 120 min Here pasteurization isrealized before composting and takes place in a loam oven whereby a microgasifier stove providesthe heat required [39] The use of a microgasifier means that additional biochar is potentially availableas an output of this sanitation process [41] For the subsequent composting it is recommendedto mix human faces with other organic residues such as kitchen wastes harvest residues ashesor biochar [42] This mixing of various types of waste aims to create a well-balanced content of C andother nutrients as well as of dry and wet matter which in turn sustains a well-functioning compostingprocess [43]
Studies observing plant response to biogas slurry eg [2844ndash47] or (composted) biochareg [3348ndash55] have often revealed positive results in terms of stimulated crop productivityFurthermore co-composting of source-separated human faeces has also been empirically studiedcf [34353856] In the SSA context however plant responses to applications of biogas slurry eg [57]biochar eg [58] human urine eg [59] or faeces eg [3760] have to date only rarely been studiedNevertheless existing scientific studies can be used to extrapolate overall improved soil properties andstimulated biomass growth with for example increasing maize grains yields to 200ndash400 comparedto plants grown on unamended soil This given we reason that studies observing the combined use ofhousehold residues such as biogas slurry urine and co-composted biochar and human faeces are ofa strong interest for contemporary scientific studies
14 Research Objectives and Questions
To the best of our knowledge analytical studies focusing on IPNM potentials around the nexusenergyndashsanitationndashagriculture and based on SNB have not yet been scientifically targeted for smallholdersystems in SSA in general or in East Africa in particular Moreover the SNB has to date in the vastmajority of studies been applied for ex-post analyses of existing depletion or replenishment of soilnutrients Nonetheless SNB could also be used as analytical ex-ante evaluation or assessment methodconsidering potential effects of technology-related changes in farming systems on soil fertility
Against this background it is the objective of the present work to develop a model that enablesan ex-ante assessment of integrating residues from cooking and EcoSan into soil fertility managementin the context of smallholder farming in SSA In prior studies focusing on a household level we alreadyintroduced [39] demonstrated [61] and analyzed in detail the recycling potentials of an intersectionalresource management for the example of smallholdings in Karagwe TZ [41] In the present work focusingon a farm level we systematically compare specific approaches to recover residues as resourcesfor IPNM such as biogas slurry urine or co-composted human faeces and biochar Therefore
Agriculture 2018 8 31 4 of 31
the following research question has been formulated How do identified modifications in the farmingsystem (ie technology use and residue recovery) affect (i) soil nutrient balances (ii) availability ofresources for subsistence production of compost and (iii) environmental emissions assessed with globalwarming potential (GWP) and eutrophication potential (EP) In addition we estimate the potentialfor counteracting existing soil degradation and sustain soil fertility and food production throughrecycling of nutrient and restoration of SOM
2 Materials and Methods
In this section we firstly introduce the study area (Section 21) and the research methodologies(Section 22) Then we describe how we define the system analyzed (Section 23) and the tailoredmodelling approach (Section 24) The appendix of the present article presents further details of (i)those IPNM alternatives analyzed including descriptions and pictures of the substrates in question(Supplementary 1) (ii) the modelling including equations and assumptions made regarding to specificmetabolisms and processes and (iii) a summary of all data collected (Supplementary 5) Furtherinformation on the study area the case study projects and the technologies studied is presentedin [3941] and in the supplements to this article
21 Study Area amp Case Studies
The study area of this work is Karagwe one of eight districts in Kagera region Northwest TZpart of the Lake Victoria basin and located near to the volcanic areas of the East African Rift zone(lat 0133prime S long 3107prime E alt 1500ndash1600 masl) Rainfall is bi-modal (March to May and Octoberto November) and varies between 500 and 2000 mm yearminus1 the mean temperature ranges from 20to 28 C [50] Hence local climate conditions allow harvesting twice a year for most annual cropsHouseholds in Karagwe consist on average of six people including adults and children [62]
The regional economy is dominated by smallholder agriculture and about 90 of households sellagricultural products grown on their farms [17] Banana is the most prominent perennial crop andstaple food in Kagera while beans and maize dominate annual cropping Karagwe is also an importantproducer of onions and cabbage within Kagera (cf Supplementary Table S1) Approximately 40of agricultural land in Karagwe is occupied by banana-based home gardens surrounding farmersrsquohouses [17] named shamba in Swahili (Supplementary Figure S1) The shamba (Supplementary 6)is a mixed cultivation system of perennial crops such as bananas coffee etc annual crops such asbeans cassava etc and fruit trees including mango orange etc [27] Fields used for intercroppingof annual crops are called msiri in Swahili [27] (Supplementary Figure S2) and cover approximately20 of the planted land in Karagwe [62] Other types of land use comprise mono-cropping of annualcrops tree planting fallow land and animal husbandry Cattle are kept by one sixth of the householdsmostly in herds of less than five animals [17]
As for many smallholders in SSA farmers in Karagwe are challenged by soil constraints includingnutrient deficiencies and soil acidity with pH lt 40 [39] (In addition unusual rainfall patterns indicatethe approaching effects of climate change and increasingly threaten the predominantly rain-fedagriculture in Karagwe) Andosols the predominant soil type in Karagwe [61] typically suffer fromP deficiency [17] as P retention potential is relatively high [63] Crop productivity and sustainableland use therefore requires constant replenishment of P Unbalanced inputs of N with organic andormineral fertilizers and uptake of N by crops often contribute to the problem [6465] As an initiativetowards soil improvement and as a countermeasure against deforestation two Karagwe farmerrsquosorganisations recently initiated a set of projects that deal with the development of ldquosustainablerdquocooking (cf Supplementary Table S2) and sanitation technologies (cf Supplementary Table S3) as wellas with the promotion of the use of residues in agriculture [39] The three projects and respectivetechnologies act as case studies for our work Assessing the use of residues for IPNM and potentialeffects on local SNBs are subjects of the present system analysis
Agriculture 2018 8 31 5 of 31
22 Research Methods MFA amp SNB
In order to answer our research questions we applied SNB methodology in combination withmaterial flow analysis (MFA) This paragraph introduces the conceptual background of these twomethods with fundamental terms given in italics
According to the definition of the MFA [6667] a system is a group of interacting processes that causeeither a chemical or a physical transformation transportation or storage of materials A material flow(
m) is a mass flow of a good (economic entity) or substance (chemical element or compound) per unit of
time (eg kgmiddotyearminus1) The systems in question are generally open systems as
m are exchanged betweenthe anthroposphere and the ecosystem Material stocks describe the accumulation storage or depletion ofmaterials within the anthroposphere Likewise following the SNB one calculates and then balances fiveinput flows (IN) and five output flows (OUT) to and from agricultural land [23] Both methods followthe same mathematical law known as ldquothe principle of mass conservationrdquo (Equation (1)) and assumea linear function between
mIN and
mOUT to simplify calculations
k
sumi=1
mIN i =
l
sumj=1
mOUT j plusmn
mstock (1)
where sumki=1
mIN i and suml
j=1
mOUT j are the total mass of k input and j output material flows and
mstockcauses plusmn∆ stock
To effectively support local soil fertility interventions [68] emphasize downscaling SNB tosite-specific balances and recommend focusing on a specific cropping system When applying SNBto the farm level [69] further suggest splitting the analysis into a natural balance (NB) and a partialbalance (PB) The NB comprises all inputs and emissions from and to the environment The PB reflectsthe ldquoway of farmingrdquo and solely consists of organic and mineral fertilizer inputs and nutrient removalsthrough food products and crop residues The combination of the NB and the PB results in the fullSNB
A negative result of the SNB indicates nutrient depletion and declining soil fertility A positivenet balance can be interpreted positively for example when P in surplus replenishes P-stocks inP-deficient soils or negatively when for example heavy metals accumulate in the soil Apart fromspecific cases in which soils are deficient in certain essential nutrients it is most preferable that IN andOUT are balanced
23 Systems Defined amp Scenarios Studied
For our analyses we divided the anthroposphere of an integrated farming system into (i) the farminghousehold and (ii) the agro-ecosystem (AES) (Figure 1) The former consists of the micro energysystem for cooking (MES) and the micro sanitation system (MSS) (referring to a micro-perspectiverespectively a focus on smallholder households) Both are systematically studied in [41] by comparingselected technologies that are available to smallholders in Karagwe (cf Supplementary Tables S2and S3) with respect to relevant material flows The latter represents the farmland compostingand the disposal of residues through burning Composting constitutes the central process linkingsmallholder households to farmland In our model we consider two ways of composting (i)Karagwe-standard composting (Figure 2a) and (ii) CaSa-composting (Figure 2b) (cf Supplementary26) The composition of Karagwe-standard compost follows local practices [39] The so-calledldquoCaSa-compostrdquo is based on the approach of the local project ldquoCarbonization and Sanitationrdquo (CaSa) tojointly exploit biochar stored urine sanitized faeces and harvest and kitchen residues
The functional unit of the system analysis is ldquoto cultivate nutritious and market relevant annualfood crops for subsistence farming on a total of 0125 ha of msiri-land (spatial system boundary) overone year with two cropping seasons (temporal system boundary)rdquo The crops chosen include maize asa staple food beans as a source of protein and onion and cabbage as vegetables These crops areinter-cropped following local practices Indicator elements of the analysis are C and the macronutrients
Agriculture 2018 8 31 6 of 31
N and P The atmosphere the pedosphere and the hydrosphere are all located outside the spatialsystem boundaries
To identify the contribution of residues from cooking and sanitation to managing soil fertilityon the farmland two scenarios are compared (i) the most common current practices for smallholderfarming in Karagwe and (ii) alternative farming practices based on IPNM utilizing resources capturedfrom different technologies that are potentially used for cooking and sanitation (Table 1) In totalthe analysis comprises five alternatives for msiri cultivation (AM) that mainly differ from one anotherin respect to their organic and mineral IN to maize and beans when compared to the current state ofaffairs (AM1) the further scenarios represent a shift of technologies used in the household towardseither using a biogas system for cooking and a UDDT for sanitation (AM2) or using a microgasifierfor cooking and as sanitation system a combination of the UDDT with thermal treatment of faeceson a loam oven following the approach of the CaSa-project (AM3ndash5) In AM2 we only consideredthe use of urine as mineral IN not the use of faeces We reason that in the case of simply usinga UDDT faeces are not thermally sanitized and thus not ldquosaferdquo to be used in crop productionIn accordance with omushote practice faeces could rather be used in the shamba which is howeverout of the scope of the present model (Omushote was a common practice in Karagwe before pitlatrines were implemented and entails adding faecal matter on a rotation basis into the plantingholes for trees or cuttings of banana plants [70]) Cabbage and onion receive nutrient inputs throughapplication of standard compost in all scenarios This is also because application of composts thatcontain human faeces such as the CaSa-compost should in general not be used for crops growingunderground [38] We further followed [17] who recommended that in order to restore soil P stocksefficiently there are two principal types of organic fertilizer application either (i) seasonal moderateapplications (AM1ndash4) or (ii) a one-off large application that is repeated every three years (AM5) In allalternatives studied biogas slurry (AM2) and urine (AM2ndash5) are used with seasonal applicationsThe annual recovery potentials of biogas slurry biochar urine and sanitized faeces derive froman earlier MFA presented in [41] Table 2 summarizes the quantities identified to be available annuallyas well as the respective C and nutrient contents estimated
Agriculture 2018 8 31 7 of 31
Agriculture 2018 8 x FOR PEER REVIEW 7 of 31
Figure 1 The integrated farming system analyzed comprises the farming household (white) and the agro-ecosystem (AES green) Processes are indicated with
boxes material flows with arrows the dotted line represents the system boundaries Material flows in green were part of the present work red and blue
flowsarrows were part of [41] grey flowsarrows were not considered in the system analysis AM Abbreviation part of the scenarios indicating the agroecosystem
of a msiri
Figure 1 The integrated farming system analyzed comprises the farming household (white) and the agro-ecosystem (AES green) Processes are indicated with boxesmaterial flows with arrows the dotted line represents the system boundaries Material flows in green were part of the present work red and blue flowsarrows werepart of [41] grey flowsarrows were not considered in the system analysis AM Abbreviation part of the scenarios indicating the agroecosystem of a msiri
Agriculture 2018 8 31 8 of 31
Agriculture 2018 8 x FOR PEER REVIEW 8 of 31
(a) (b)
Figure 2 Flow charts showing in- and output flows of materials considered in modelling Karagwe standard composting (a) and CaSa-composting (b) Processes are
indicated with boxes material flows with arrows A ash AC ash and char CaSaC CaSa-compost EmVC emissions of carbon through volatilization EmVN
emissions of nitrogen through volatilization EmLP emissions of phosphorus through leaching F faeces HR harvest residues KSC Karagwe standard compost
KW kitchen waste S soil SD sawdust U urine
Figure 2 Flow charts showing in- and output flows of materials considered in modelling Karagwe standard composting (a) and CaSa-composting (b) Processesare indicated with boxes material flows with arrows A ash AC ash and char CaSaC CaSa-compost EmVC emissions of carbon through volatilization EmVNemissions of nitrogen through volatilization EmLP emissions of phosphorus through leaching F faeces HR harvest residues KSC Karagwe standard compost KWkitchen waste S soil SD sawdust U urine
Agriculture 2018 8 31 9 of 31
Table 1 Alternatives defined to compare different integrated plant nutrient management (IPNM) strategies (AM2ndash5) to the current practice (AM1) in an intercroppingsystem in Karagwe TZ
No Organic Input toMaize amp Beans
Organic Input toOnion amp Cabbage
Mineral Input toall Crops
CookingAlternative
SanitationAlternative Comment
AM1 None Standard compost(cabbage only) None Three-stone fire Pit latrine
AM2 Biogas slurry Standard compost Urine Biogas digester ampburner UDDT
AM3 CaSa-compost Standard compost Urine Microgasifier UDDT amp thermalsanitation
AM4 CaSa-compost Standard compost Urine Microgasifier UDDT amp thermalsanitation
like AM3 but with loweryield prognosis
AM5 CaSa-compost Standard compost Urine Microgasifier UDDT amp thermalsanitation
like AM3 but with largerapplication of composts
every 3 years
AM agroecosystem msiri (abbreviation used to name the alternatives studied) CaSa-compost compost prepared according to practices of the project ldquoCarbonization and Sanitationrdquo(CaSa) EcoSan ecological sanitation IPNM integrated plant nutrient management TZ Tanzania
Table 2 Quantities and qualities of the organic organo-mineral and mineral inputs used in the IPNM strategies analyzed
SubstratesRecovery Potential Subsistence Production Total C Total N Total P
kgmiddotyearminus1 kgmiddotyearminus1 gmiddotkgminus1 (in FM) gmiddotkgminus1 (in FM) gmiddotkgminus1 (in FM)
Biogas slurry 14955 plusmn 4409 153 plusmn 03 09 plusmn 00 03 plusmn 00Biochar amp ash (from cooking) 301 plusmn 29 751 plusmn 296 29 plusmn 22 19 plusmn 08
Biochar amp ash (from sanitation) 15 plusmn 6 694 plusmn 461 31 plusmn 12 52 plusmn 27Stored urine 780 plusmn 80 79 plusmn 32 50 plusmn 12 05 plusmn 02
Sanitized solids 506 plusmn 186 106 plusmn 51 75 plusmn 35 21 plusmn 10Standard compost 292 plusmn 20 60 plusmn 11 35 plusmn 06 08 plusmn 01
CaSa-compost 2350 plusmn 132 78 plusmn 9 40 plusmn 04 21 plusmn 02
Note Data for the recovery potentials of biogas slurry biochar stored urine and sanitized faeces stem from [41] The potential for subsistence production of Karagwe standard compostand CaSa-compost are estimated in the present study Values represent the mean percentage calculated for all scenarios Water contents are 956 plusmn 05 336 plusmn 53 and 325 plusmn 19 gmiddotkgminus1 inFM (Fresh matter) of biogas slurry standard compost and CaSa-compost respectively
Agriculture 2018 8 31 10 of 31
24 Specific Modelling Approach amp Equations Applied
In the present study we combined SNB with MFA in order to (i) estimate the potentialfor C recovery available for restoration of SOM (ii) model the potentials for subsistenceproduction of composts by using household and farming residues and (iii) assess environmentalemissions The following paragraph describes the manner in which we applied the two methods(cf Supplementary Figure S3 with plot data in Table S17) The SNB largely follows the basic conceptslaid down by [23] with modifications pursuant to [26686971] At the outset of this study we carriedout an intensive literature review in order to collect data (cf Supplementary 5) and to plan anddesign the system to be analyzed (cf Supplementary Table S4) In reference to [67] we collecteddata for determining flows and stocks from various sources including (i) primary data from casestudy projects our own experiments and previous studies including household surveys field testslaboratory analysis material flow modelling etc (ii) secondary data including literature reviewstatistics from private and public organizations etc and (iii) estimationsjudgements of expertsThe latter was specifically used if no sufficient data was available or not available for the specificcontext Finally those IN and OUT that are most relevant and quantifiable to the specific context wereselected (Table 3)
Table 3 Selected flows considered in soil nutrient balance
Input flows of partial balance
IN1c UrineIN2a Grass carpetIN2b Mulching with crop residuesIN2c Standard compostIN2d CaSa-compostIN2e Biogas slurry
Input flows of natural balance
IN3a Atmospheric depositionIN4a Symbiotic BNFIN4b Non-symbiotic BNF
Output flows of partial balance
OUT1a Food products for self-consumptionOUT1b Food products sold to marketOUT2 Crop residues
Output flows of natural balance
OUT3 LeachingOUT4a Gaseous losses (from denitrification)
Abbreviations BNF biological nitrogen fixation
Calculations were made through a series of steps (cf Supplementary 2) The first step was tocalculate total biomass production including crop yields and plant residues and the respective totalnutrient uptake by plants (OUTcrops) Grass carpeting and mulching with residues are consideredlocal standard practices and are therefore included as organic IN into ldquoPB I without fertilizationrdquo(Equation (2)) It follows therefore that PB I reflects the ldquonet nutrient requirementsrdquo of crops Applicationof organic (ie Karagwe standard compost and CaSa-compost) organo-mineral (ie biogas slurry)and mineral (ie urine) fertilizers are considered in ldquoPB II with organic fertilizationrdquo (Equation (3))and ldquoPB III with organic and mineral fertilizationrdquo (Equation (4)) respectively Organic and mineralINs are quantified based on PB I As suggested by [1772] if the ratio of NP of the cropsrsquo nutrientrequirement is higher than the NP ratio found in organic amendmentsmdashwhich is the case in ourmodel (Supplementary Table S26)mdashthen organic matter should be used first to balance the P uptakeof crops In this way the underlying fertilization approach aims to avoid over-fertilization with P
Agriculture 2018 8 31 11 of 31
and under-fertilization with N whilst optimizing P-use efficiency Mineral fertilizer can also be usedto meet cropsrsquo N requirements As part of the NB biological nitrogen fixation (BNF) is estimated fromthe N uptake determined for beans Values of other IN and OUT for the NB derive from literature(Supplementary Table S27) Finally the ldquofull SNB I with organic fertilizationrdquo (Equation (5)) and ldquofullSNB II with organic and mineral fertilizationrdquo (Equation (6)) are calculated
PBI = INcarpeting + INmulching minus OUTcrops = IN2a + IN2b minus sum(OUT1a + OUT1b + OUT2)
=∣∣∣nutrient requirementcrops
∣∣∣ (2)
PB IIPB I + INcompost + INCaSa minuscompost + INbiogas slurry = PB I + IN2c + IN2d + IN2e (3)
PB III = PB II + INurine = PB II + IN1c (4)
SNB I = NB + PB II (5)
SNB II = NB + PB III (6)
where IN is the nutrient input flows OUT is the nutrient output flows PB is the partial balance NB isthe natural balance and SNB is the full soil nutrient balance
Furthermore several gaseous and liquid emissions are considered in the analysis (Figure 1)which originate from covering soil with carpeting grasses and mulching material from applying urineor biogas slurry from burning agricultural residues and from composting processes We assessedthe climate-relevant gas emissions with those GWP-factors provided by [73] (Supplementary Table S30)Emissions with eutrophying effects were assessed with EP-equivalence factors suggested by [7475](Supplementary 3 Supplementary Table S31)
In aggregating the data we assumed that all parameters were normally distributed andindependent of variables [76] We also applied Gaussrsquos law of error propagation (FAU physics nd) [77]The resulting uncertainty of data is expressed by presenting the statistical variance of the collecteddata set with its arithmetic mean value (x) the standard error (∆x) and the relative uncertainty (RU)defined as ∆x in of x [67] Further information on data collected is summarized in Supplementary4 Data collection the equation-based model and all auxiliary calculations were combined in oneExcel spreadsheet
3 Results and Discussion
The following chapter contains (i) a presentation of selected results checked for plausibilityand briefly discussed in relation to relevant factors (ii) a synthesis of results from a sustainabilityperspective and (iii) a brief discussion of the applied methodology
31 Soil Nutrient Balances
Currently the intercropping system analyzed for Karagwe results in nutrient depletion of the soil(Figure 3) This Table 4 refers to the full SNB with organic input and not including (SNB I) but with(SNB II) additional mineral fertilization The results identified for the SNB II in the current situationreflect the state-of-knowledge on SNBs in the region very well [25ndash27] Means of AM1 howeversignificantly differ from means of AM2ndash5 for both N and P as overlapping error bars for the SNB IIin Figure 3ab indicate respectively [78] Hence integrating resources recovered from cooking andsanitation into agriculture has the potential to clearly improve the net SNBs
Agriculture 2018 8 31 12 of 31
Table 4 Results of the SNB for intercropping of annual crops (maize beans cabbage and onion) on msiri land sized 0125 ha located in Karagwe TZ
Nutrient Requirement ofCrops
Nutrient Supply withOrganic Fertilization
Nutrient Supply with Organicand Mineral Fertilization Natural Balance Full SNB with Organic
FertilizationFull SNB with Organic and
Mineral Fertilization
PB I PB IIndashPB I PB IIIndashPB I NB SNB I SNB II
Kgmiddothaminus1 yearminus1
Alternatives N P N P N P N P N P N P
AM1 minus46 plusmn 2 minus11 plusmn 1 41 plusmn 01 15 plusmn 00 41 plusmn 01 15 plusmn 00 minus13 plusmn 2 09 plusmn 03 minus54 plusmn 3 minus8 plusmn 1 minus54 plusmn 3 minus8 plusmn 1AM2 minus87 plusmn 3 minus20 plusmn 2 57 plusmn 7 22 plusmn 2 88 plusmn 14 25 plusmn 4 minus11 plusmn 2 09 plusmn 03 minus41 plusmn 10 2 plusmn 3 minus11 plusmn 14 6 plusmn 3AM3 minus139 plusmn 5 minus38 plusmn 3 87 plusmn 5 38 plusmn 2 105 plusmn 9 39 plusmn 5 9 plusmn 2 09 plusmn 03 minus43 plusmn 10 1 plusmn 5 minus25 plusmn 10 2 plusmn 4AM4 minus104 plusmn 8 minus25 plusmn 4 58 plusmn 4 25 plusmn 2 97 plusmn 18 37 plusmn 7 minus8 plusmn 5 09 plusmn 03 minus54 plusmn 13 1 plusmn 6 minus15 plusmn 17 12 plusmn 5AM5 minus139 plusmn 5 minus38 plusmn 3 88 plusmn 9 38 plusmn 5 108 plusmn 12 41 plusmn 6 9 plusmn 2 09 plusmn 03 minus41 plusmn 7 1 plusmn 4 minus22 plusmn 11 3 plusmn 6
PB partial balance NB natural balance SNB soil nutrient balance TZ Tanzania Alternatives AM1ndashAM5 are defined in Table 1
Agriculture 2018 8 31 13 of 31Agriculture 2018 8 x FOR PEER REVIEW 13 of 31
(a) (b)
Figure 3 The estimated SNB II for N (a) left) and P (b) right) comprises natural input (IN3a 4a 4b) and natural output (OUT3 4a) flows organic (IN2a-2e) and
mineral (IN1c) input flows and output flows (Out1a 1b 2) with agricultural products Mean values for the estimated SNB II are indicated with black dashes
standard errors of the means with grey error bars Scenarios are defined in Table 1 the IN and OUT flows are in Table 3 Plot data is provided in Supplementary
Table S12
Figure 3 The estimated SNB II for N (a) left) and P (b) right) comprises natural input (IN3a 4a 4b) and natural output (OUT3 4a) flows organic (IN2a-2e) andmineral (IN1c) input flows and output flows (Out1a 1b 2) with agricultural products Mean values for the estimated SNB II are indicated with black dashes standarderrors of the means with grey error bars Scenarios are defined in Table 1 the IN and OUT flows are in Table 3 Plot data is provided in Supplementary Table S12
Agriculture 2018 8 31 14 of 31
As shown for the example of Karagwe IPNM strategies that utilize residues from the farminghousehold can reverse results of net P balance to positive figures and mitigate but not completelyavoid depletion rates of N When compared to the current state (AM1 = 100) the total N deficit(ie referring to SNB II) is only one fifth that of the biogas-scenario (AM2asymp 20) and less than half thatof the CaSa-scenarios (AM3ndash5 asymp 30ndash45) Differences identified between analyzed IPNM alternatives(AM2ndash5) are however not significant because error bars (Figure 3) do not overlap [78]
Nutrient requirements of crops (PB I) vary according to the yield assumptions for each alternativeThey are lowest for the scenario reflecting the current state of affairs (AM1) and highest for AM3and AM5 Note that as yield assumptions are equivalent in AM3 and AM5 we further refer to thesealternatives jointly as AM35 for results depending on this shared equal parameter
The balances of organic and mineral INs and OUTs relevant for the PB vary across IPNMalternatives for both N and P (Figure 3) For example nutrient inputs with mulching (In2b) correspondto the availability of harvest residues (Supplementary Tables S10 and S23) and thus also to underlyingyield assumptions After carpeting and mulching the limited use of organic IN (because compost isused only for cabbage) and the exclusion of mineral IN results in a deficient supply of nutrients inthe current state Specifically in AM1 N and P requirements are in total compensated by only 10and 15 of their demand respectively
Organic soil amendments such as biogas slurry standard compost and CaSa-compost completelymeet the P demand of crops (ie PB II of AM2ndash5) while N demand of crops is met by 55ndash65 ofrequirements After organic and mineral fertilization the total compensation of P in PB III of AM2ndash5 isapproximately 105 to 145 of requirements The use of urine ultimately satisfies crop N demand inPB III of AM2 by approximately 100 while N requirements are only partially compensated in PBIII of AM3ndash5 by 75ndash95 of requirements Despite biogas slurry and urine fully balancing N demandof crops in AM2 SNB II for N is negative due to additional N losses through natural flows Finallywe emphasize the need to consider the fact that nutrients contained in biogas slurry were previouslyrecycled to banana-based homegardens together with the feeding material of the biogas digesteritself [41] Thus when switching to a biogas system and using the slurry for fertilizing crops cultivatedon msiri fields compensation or replacement of nutrients in the shamba is required to avoid amplifyingexisting nutrient deficits there [27]
The balance of natural IN and OUT relevant for the NB for N differs between the alternativesanalyzed due to varying BNF In our model BNF is 12 plusmn 3 kgmiddotNmiddothaminus1middotyearminus1 in AM1 comparedto 17 plusmn 4 29 plusmn 7 and 85 plusmn 17 kgmiddotNmiddothaminus1middotyearminus1 in AM2 AM4 and AM35 respectively The BNFestimated for the current state is therefore appropriate compared to a typical value of approximately12ndash16 kgmiddotNmiddothaminus1middotyearminus1 for East African farming systems [25ndash27687980] The amount of N fixed byleguminous beans meanwhile depends on assumed crop yields Only in AM35 where we assumethe highest level of bean productivity does the NB estimated for N reveal a positive result A regressionanalysis comparing results of NB and the BNF of AM1ndash5 shows that at least 55 kgmiddotNmiddothaminus1middotyearminus1 arerequired in order to reverse the net balance of all natural N flows from a negative to a positive result(Supplementary Figure S5) Given that this BNF value falls between the estimated BNF for scenariosAM4 and AM35 we deduce that a seasonal biomass growth of beans of at least 30 tonmiddothaminus1 in FM isneeded to reach the break-even threshold where the NB turns from a net negative to a net positiveresult This corresponds to a crop yield of about 38 tonmiddothaminus1 air-dry beans The NB for P is positivein all scenarios as its quantification was based on data collected from literature only This data wasequivalent for all alternatives
32 Potential for Subsistence Production of Compost
The total amount of CaSa-compost produced is comparable in AM3ndash5 while quantities of standardcompost prepared vary over scenarios (Supplementary Table S10) (Note that results are presentedin terms of fresh matter (FM) We consider this to be the more practice-oriented unit as it refers tothe material that farmers actually need to transport when performing agricultural activities) Annual
Agriculture 2018 8 31 15 of 31
compost production is projected to be equivalent to about 03ndash09 m3 for standard compost and26ndash28 m3 for CaSa-compost (Table 2) which is overall an adequate and feasible amount for annualapplications [81] The variation regarding standard compost depend (i) on the general availabilityof harvest residues (and thus on yield assumption as discussed above) and (ii) whether or notthe CaSa-compost is additionally produced because then residues are divided between the twocomposting processes (cf Supplementary 26) The average compositions of both composts in terms ofrelative volumes (Figure 4) fit well with local practices [39]
Recovering residues from cooking and sanitation can contribute clearly to C and nutrient contentsin composts By way of an example P in ashes recovered from three-stone fires contributes gt60 oftotal P in standard compost for AM1 (Figure 4a) However in AM2ndash5 where a switch in cookingtechnology has been assumed the use of three-stone fires and the subsequent recovery of ashesfor standard composting are no longer considered in the calculation Instead biogas slurry fromsmall-scale biogas digesters and biochar recovered from microgasifier stoves are available as directorganic fertilizer in AM2 or as additive to CaSa-composting in AM3ndash5 respectively Taking a closerlook at the CaSa-compost (Figure 4b) it reveals that approximately 38 of total C and 14 of the totalP content originate from biochar recovered after cooking In addition stored urine sanitized faeces(also referred to as ldquosanitized solidsrdquo (Figure 4b) as a mix of materials collected from the UDDT whichinclude human faeces and some sort of dry material such as dry soil sawdust ash etc that is addedafter defecation to enhance the drying of faeces and to reduce smelling) and biochar recovered fromsanitation add approximately 52 and 38 of total N and of total P in CaSa-compost respectively
Furthermore the total amount of biochar recovered from cooking and from sanitation andsanitized faeces are both available in comparable amounts in terms of volume (ie about 12 and10 m3middotyearminus1 of FM of biochar and sanitized faeces respectively) This fits very well with the typicalcomposition of CaSa-compost in the CaSa pilot project which includes approximately 017 m3middotmminus3
biochar and 015 m3middotmminus3 sanitized faeces [39] In addition about 08 m3middotyearminus1 or approximately 60of stored urine is used for CaSa-composting This means that the total amount of urine available asmineral IN is higher in AM2 (without CaSa-composting) as compared to AM3ndash5 (with CaSa-composting)(Supplementary Table S10)
Yearly application rates for standard compost are estimated at 20 plusmn 05 in AM4 and44 plusmn 14 kgmiddotmminus2middotyearminus1 of FM in AM1 those for the CaSa-compost are within the range of17ndash18 kgmiddotmminus2middotyearminus1 in AM3 and AM4 (Supplementary Table S5) Overall annual application ratesestimated for both composts are consistent with relevant literature [8283] The triennial applicationrates calculated in AM5 however are significantly higher with 113 plusmn 18 and 55 plusmn 05 kgmiddotmminus2middotyearminus1
of the standard and the CaSa-compost respectively a figure also appropriate according to [17] Seasonalapplication rates of urine vary over each of the scenarios and range from 01 to 03 dm3middotmminus2 yearminus1
for maize and from 05 to 20 dm3middotmminus2middotyearminus1 for vegetables which is also fully consistent withcommon recommendations for urine fertilization [38] Furthermore urine application rates estimatedfor maize in particular are appropriate for one-dose fertilization per cultivation period which ensuresworkloads are manageable The appropriate timing for urine fertilization would be at week five aftersowing when crops demand most N for growing [82]
Finally we acknowledge that not all potentials of input materials available are exhausted(Supplementary Table S11) even though nutrient deficits remain in the full SNB for N (Table 4)For example standard compost remains available after fertilizing vegetables in most scenariosThis leftover compost could be used therefore to improve PB for maize and beans
Agriculture 2018 8 31 16 of 31
Agriculture 2018 8 x FOR PEER REVIEW 16 of 31
(a) (b)
Figure 4 Relative contribution of the different resources used for standard composting ((a) left) and for CaSa-composting ((b) right) to the total input flow in terms
of volume (Vol) and content of carbon (C) nitrogen (N) and phosphorus (P) prior to the composting process (values represent the mean percentage calculated for
all scenarios) Scenarios are defined in Table 1 Plot data provided in Supplementary Tables S18 (for Figure 4a) and S19 (for Figure 4b)
Figure 4 Relative contribution of the different resources used for standard composting ((a) left) and for CaSa-composting ((b) right) to the total input flow in terms ofvolume (Vol) and content of carbon (C) nitrogen (N) and phosphorus (P) prior to the composting process (values represent the mean percentage calculated for allscenarios) Scenarios are defined in Table 1 Plot data provided in Supplementary Table S18 (for Figure 4a) and Table S19 (for Figure 4b)
Agriculture 2018 8 31 17 of 31
33 Environmental Emissions
Environmental emissions of greenhouse gases (GHG) increase in all IPNM strategies analyzedwhen compared to current state practices (Figure 5a) GWPs in alternatives AM2ndash5 are around fourto five times higher than the GWP of the current state while the overall results of analyzed IPNMalternatives are generally comparable The most significant contributions to GWP in AM2 can betraced back to N2O emissions from biogas slurry application (asymp60 of the total GWP assessed inAM2) In the CaSa-scenarios AM3ndash5 CO2 and N2O emissions from CaSa-composting bring aboutrespectively approximately 65 and 13 of the total GWP assessed for these alternatives
Similarly environmental emissions with eutrophying effects potentially increase through IPNM(Figure 5b) Numerically EP assessed in AM2 AM4 and AM35 is approximately 160 430and 500 of the current EP in AM1 respectively Overall EPs of AM1ndash5 correspond closelyto NH3 emissions from composting and thus to the intensity of the total compost productionThe comparatively higher EPs estimated for AM3ndash5 are mainly attributable to NH3 emissions and Pleaching from CaSa-composting contributing on average about 60 and 20 to the EPs in AM3ndash5respectively In AM2 those emissions assessed with EP that exceed those estimated for AM1 mainlystem from N leaching after applying biogas slurry and urine and comprise in total approximately15 of the total EP in AM2 The contribution of NH3 emissions after slurry application to the EPassessed for AM2 meanwhile is negligible
Finally we add some practical recommendations to reduce environmental emissions For exampleapplying biogas slurry preferably to dry soil and incorporating biogas slurry into soil within the firstfew minutes after application can avoid nutrient leaching and N2O and NH3 emissions as advisedby [4484] Farmers may do so using a simple hand hoe Also [85] emphasize the importance of biogasslurry entering soil as rapidly as possible after application and therefore recommend a high watercontent in the slurry or additional dilution of slurry with water According to prior research presentedin [39] water content of biogas slurry studied stands at approximately 95 of FM and should thusbe adequate for rapid infiltration Likewise [38] recommend applying urine into a furrow or holeand closing the furrowhole with soil afterwards in order to reduce N2O and NH3 emissions afterurine application In addition biochar additions to composting can potentially decrease N2O and CH4
emissions eg [86ndash89] whilst NH3 emissions potentially increase (eg [87]) Other studies [3390]showed that biochar captures nitrate and phosphate during composting which is promising in orderto reduce nutrient leaching However such potentially beneficial effects of co-composting biocharhave not yet been included in our model (Section 35)
Before synthesizing our results we want to shortly comment on the certaintyuncertainty of (i)data that have been collected from literature and used for the modelling and (ii) values that have beenpresented as results According to [91] a relative uncertainty (RU) of lt30 plusmn50 or gt90 indicatesldquolowrdquo ldquoaveragerdquo or ldquohighrdquo uncertainty respectively The uncertainty of most flows considered inand calculated by our model can be classified as low Nevertheless there are some flows that showaverage or high uncertainty such as respectively atmospheric deposition total N and P in rainfallN in cabbage or onion (for both food product and harvest residue) total C in kitchen waste P instored urine collected from UDDT and density of (generic) organic waste or emission factor for COfrom burning agricultural residues (Supplementary Table S32) Also with respect to the results of SNB(Supplementary Table S24) the uncertainty of most flows calculated can be classified as low Especiallyvalues estimated for the PB ie nutrient requirements and nutrient supplies show an RU of lt20For the NB the uncertainty is low for N in AM1ndash3 and AM5 and average for N in AM4 and for P inall alternatives The uncertainty of results estimated for the full SNB in AM1 is low For the IPNMalternatives the uncertainties range from average (for N in AM35 and P in AM24) to high (for Nin AM24 and P in AM35) which is also indicated with grey error bars for the standard errors ofthe means in Figure 3
Agriculture 2018 8 31 18 of 31
Agriculture 2018 8 x FOR PEER REVIEW 18 of 31
(a) (b)
Figure 5 Estimated environmental impacts of the analyzed IPNM strategies the global warming potential ((a) left) and the eutrophication potential ((b) right)
Scenarios are defined in Table 1 Plot data provided in Supplementary Tables S13 (Figure 5a) and S14 (Figure 5b) comp composting EP eutrophication potential
GWP gobal warming potential hh household leach leaching min fert mineral fertilization
Figure 5 Estimated environmental impacts of the analyzed IPNM strategies the global warming potential ((a) left) and the eutrophication potential ((b) right)Scenarios are defined in Table 1 Plot data provided in Supplementary Table S13 (Figure 5a) and Table S14 (Figure 5b) comp composting EP eutrophication potentialGWP gobal warming potential hh household leach leaching min fert mineral fertilization
Agriculture 2018 8 31 19 of 31
34 Sustainability Aspects of Intersectional Resource Management
When evaluating our results our main focus is on the potential for sustainable soil fertilitymanagement In particular we aim at taking the specific vulnerability of smallholders intoconsideration and the importance of the soil as a basis of existence and subsistence Hence in orderto be considered ldquosustainablerdquo soil management should among other factors maintain or improvecrop productivity and mitigate existing soil constraints such as nutrient depletion and soil acidity(Section 21) In the contemporary context it should also promote resilience in farming in the faceof climate change as a local and global threat Therefore SOM which contributes to the soilrsquos waterholding capacity and erosion resistance and the restoration of SOM are of utmost importance asclimate adaptation measures Furthermore adequate soil P levels support climate mitigation andadaptation due to the fact that a sufficient supply of soil P supports plants to root more deeply whichin turn makes crops less vulnerable to drought [92] To sum up the focus of our final evaluation is onthe potential of IPNM practices to (i) replenish soil P (ii) combat soil acidification (iii) restore SOM and(iv) sequester C In addition (v) we briefly discuss integrated environmental emissions accumulatedfor smallholder household and farmland (Effects on crop productivity as a consequence to improvedsoil fertility is not further discussed here Estimated figures of food products for self-consumption(OUT1a) and food products sold to market (OUT1b) are displayed in Supplementary Tables S20ndashS22)
341 Replenishing Soil P
In AM1ndash4 phosphate is applied with annual rates of around 20ndash60 kgmiddotPmiddothaminus1middotyearminus1
(Supplementary Table S6) Within this range per hectare P applications estimated for CaSa-compost asapplied to maize and beans and those for standard compost as applied to vegetables are very similarWhen considering amendments to soil cultivated with maize and beans CaSa-compost used in AM3ndash5accounts for about 175 of total P provided in the form of biogas slurry in AM2 Compared to ourresults [17] consider 10ndash20 kgmiddotPmiddothaminus1 as a sufficient seasonal P application to degraded soils in EastAfrica that are characterized by strong P-fixation as is the case for Karagwe Andosols In addition [93]found that application rates of gt25 kgmiddotPmiddothaminus1middotseasonminus1 over the course of four seasons were capableof replenishing levels of P in a P deficient soil in Western Kenya In contrast the application of 40or 70 kgmiddotPmiddothaminus1 in the form of biogas slurry or standard compost respectively was not sufficientto increase extractable soil P as demonstrated in a short-term field trial on the local Andosol [61]Adding about 140 kgmiddotPmiddothaminus1 with CaSa-compost however significantly increased levels of availableP in the soil after the experiment and thus immediately contributed to mitigating P deficiency [17]The latter P amendment is comparable to our present results in AM5 where P is supplied trienniallyin the range of around 100ndash200 kgmiddotPmiddothaminus1middotyearminus1 for both composts analyzed In comparison [17]suggests 100ndash500 kgmiddotPmiddothaminus1 for one large application repeated ldquoevery few yearsrdquo
When considering application frequency and subsequent plant response [94] emphasize thata seasonal and moderate application of P is more effective in increasing crop yields than a largeone-off application This contradicts [17] who recommends both strategies In addition [94] reasonthat a lower input of P is preferable as the residual effect of a single fertilization dose is far lowerthan the initial and direct effect of the seasonal fertilizer application In other words P-use efficiencyof fertilizers is higher at comparatively lower inputs of P [17] By contrast a model-based simulationof [95] supports an appropriate supply of plant available P to crops originating in residual soil Ppools The authors promote substantial efforts to build up soil P whilst being patient with respect tothe known hysteric response of plants to fertilizer application [17] The specific hysteric characteristicsof local Karagwe Andosol have not to the best of our knowledge yet been studied Finally [94]argue against large P applications as farmers often lack the capital as well as the machinery to applythe large quantities required for appropriate fertilization In the present work we have demonstratedthe potential to provide P-rich inputs to agriculture on-farm at no additional cost and in suchquantities that are feasible to apply with standard tools such as a wheelbarrow and hand hoe
Agriculture 2018 8 31 20 of 31
342 Combating Soil Acidification
In order to strengthen nutrient cycling processes acidity management through liming isan important practice [92] Nutrient availability in the soil is among other factors a function ofsoil pH [96] This means that an increase in soil pH through liming promotes plant uptake of P andN from organic and mineral fertilizers and thus renders on-farm nutrient recycling more efficientOrganic material has an equivalent potential to neutralize soil acidity levels as lime (CaO) [9798]
In an earlier study we quantified the potential liming effect of the substrates analyzed [39]We have integrated this data into the present study to deduce the following results In AM1ndash4the liming effects of annual organic INs are equivalent to around 200ndash650 kgmiddotCaOmiddothaminus1middotyearminus1
(Supplementary Table S7) All treatments studied therefore meet the minimum requirements of50 kgmiddotCaOmiddothaminus1middotyearminus1 to avoid Al toxicity and to neutralize acid deposition from the atmosphereonto agricultural soils [96] Within the ranges presented however amendments with biogas slurryand standard compost have significantly lower liming potentials (asymp 200ndash400 kgmiddotCaOmiddothaminus1middotyearminus1) ascompared to the CaSa-compost (lt600 kgmiddotCaOmiddothaminus1middotyearminus1) In AM5 the liming effect is estimated inthe range of around 1000ndash2300 kgmiddotCaOmiddothaminus1 and refers to the same soil amended every three yearsThis treatment is therefore adequate to maintain or even improve soil pH in accordance with [82]who recommends a triennial application of 1250ndash2250 kgmiddotCaOmiddothaminus1 Empirically an immediate rise ofsoil pH within one cropping season was only possible with CaSa-compost not with standard compostor biogas slurry and at an application rate of about 2000 kgmiddotCaOmiddothaminus1 [61]
343 Restoring SOM
The capacity to restore SOM generally depends on the form in which C is recovered andapplied to soil Compost and biogas slurry typically provide respectively about 50 and 25of total organic C content for reproducing SOM [83] For this reason amendments of total Cwith standard compost (Supplementary Table S8) correspond to SOM reproduction potentials onsoil cultivated with vegetables varying approximately 14ndash19 tonmiddotSOM-Cmiddothaminus1middotyearminus1 in AM1ndash4(Supplementary Table S9) In comparison cabbage and onion consume approximately 21 and07 tonmiddotSOM-Cmiddothaminus1middotyearminus1 respectively Moreover on soil cultivated with maize and beansthe amendment of total C with CaSa-compost is about two and a half times higher than comparedto biogas slurry Hence inputs of biogas slurry and CaSa-compost consequently correspond toSOM reproduction potentials of about 03 and 12ndash13 tonmiddotSOM-Cmiddothaminus1middotyearminus1 respectively Maizemeanwhile consumes approximately 14 tonmiddotSOM-Cmiddothaminus1middotyearminus1 while beans replenish SOM-C atthe rate of about 04 tonmiddotSOM-Cmiddothaminus1middotyearminus1 [99] In scenario AM5 the SOM reproduction potentialsof standard compost and CaSa-compost are approximately 91 and 39 tonmiddotSOM-Cmiddothaminus1middotyearminus1respectively which then has to serve for three years of continuous cropping To sum up the potentialfor reproducing SOM for large applications of standard compost in AM5 or for general applications ofCaSa-compost in AM3ndash5 is estimated at slightly higher than the accumulated C consumption of cropsThis finding indicates a potential for replenishing SOM and even for sequestering it
344 Sequestering C
Carbon sequestration refers to long-term storage of CO2 in the form of SOM in order to mitigateglobal warming and also in principle to an increase of SOM Furthermore the addition of phosphateand lime promotes a stable increase in SOM in deeply weathered tropical soils [76] such as the local soilFor this reason sequestering C is possible in the present system analysis through the use of compostand particularly the CaSa-compost which simultaneously promotes restoring SOM replenishingsoil P and liming The context of the present analysis further promotes C sequestration as localsoil is known for its outstanding capacity to accumulate organic C Andosols tend to protect organicmatter from degradation by forming either metalndashhumus (ie often AlndashFe) or allophanendashorganocomplexes [100] Thus Andosols can act as a CO2 sink [101]
Agriculture 2018 8 31 21 of 31
Furthermore CaSa-compost contains biochar recovered from cooking and sanitation Biocharpotentially renders C sequestration possible because (i) it originates from renewable biomasses [102]and (ii) it is characterized by relatively recalcitrant organic compounds which promise the long-termldquostabilityrdquo of biochar in the soil [29] In regard to the latter [103] recently criticised the traditionalmodel of ldquolabile and stable organic compoundsrdquo and their role in the genesis of long-term ldquostablerdquoSOM The degradation of SOM and other organic matter in the soil is rather a continuum and dependson many factors including accessibility of matter microbial ecology energy transportation processesprevailing temperatures affecting enzymes etc [17] To the best of our knowledge however long-termstudies observing the effect of compost amendmentsmdashwith and without biocharmdashon SOM in tropicalAndosols do not exist We are therefore unable to quantify the general potential for C sequestrationwith existing data and any further discussion would enter into the realms of speculation
Nonetheless we may at least compare our modelling results for CaSa-scenarios with data availablefrom empiric studies in the region on biochar applications and effects According to our modelbiochar is applied at rates of approximately 27 tonmiddothaminus1middotyearminus1 in AM3 or AM4 and of about 80tonmiddothaminus1middotyearminus1 in AM5 which is presumably equivalent to rates of 20 tonmiddotCmiddothaminus1middotyearminus1 and 60tonmiddotCmiddothaminus1middotyearminus1 respectively In comparison [50] generally identified a minimum applicationrate of biochar leading to a significant increase in SOM and thus to C sequestration of 50 tonmiddothaminus1On highly degraded soil in Kenya [58] empirically demonstrated that biochar amendments equivalentto 6 tonmiddotCmiddothaminus1 applied in three consecutive seasons increased SOM by 45 as compared tothe unamended control soil
345 Integrated Environmental Emissions
Finally we estimate the overall environmental impact of the intersectional resource managementanalyzed We have therefore aggregated environmental emissions of the entire smallholder farmingsystem including MES MSS and AES With respect to overall climate balance (Supplementary FigureS4a with plot data in Tables S15 and S18) integrated GWP in AM2 when shifting to a biogas systemand an UDDT and while utilizing biogas slurry and stored urine as inputs to the farm land is morethan 250 of the integrated GWP in AM1 This is caused by (i) extremely high levels of GWP identifiedfor operating biogas systems [41] propagating into the integrated perspective and (ii) comparativelyhigher levels of GWP identified for the AES (Figure 5a) By contrast [104] estimated that overall GHGemissions decrease when integrating biogas digestion to organic farming systems through a lifecycleassessment methodology However the net reduction originates from offsetting fossil fuels consumedfor producing electrical energy which lie outside the scope of the present analysis [17] The total GWPsof CaSa-scenarios are generally comparable to the current state In AM3ndash5 GWP assessed for the MESdecreased when shifting from three-stone fires to microgasifier stoves [41] This is offset howeverby increased GWP assessed for the AES (Figure 5a) With respect to emissions with eutrophyingeffects (Supplementary Figure S4b with plot data in Tables S16 and S19) the integrated EPs for allIPNM strategies studied in AM2ndash5 is only about half of the total EP in AM1 This general decrease ofintegrated EP is attributable mainly to lower EP levels assessed for using an UDDT instead of a pitlatrine [17] In AM2 and AM3ndash5 a proportion of the EP reduced in the MSS are however offset byhigher EP analyzed for biogas production or for CaSa-compost production respectively
Results of the synthesis above refer to our case study in Karagwe and are summarized in Table 5
Agriculture 2018 8 31 22 of 31
Table 5 Summarized effects estimated for the IPNM strategies analyzed with regard to selectedsustainability aspects
IPNM Based on the Use of ReplenishingSoil P Liming Potential SOM Reproduction
PotentialC-Sequestration
PotentialIntegratedEmissions
Standard compost ++++ =+ =+ naBiogas slurry and urine + = minus minus GWP minus EP =CaSa-compost and urine ++++ ++++ ++ GWP amp EP =
++ Strong improvement + improvement = constantminus declineminusminus strong decline not clear na not analyzed Note that results refer only to a small share of the land whilst the larger part of the farmland remains unamendedWhen two results are indicated for example =+ the first result refers to the regular annual amendments analyzedin AM1 and AM3ndash4 whilst the second result refers to the one-off large amendments analyzed in AM5 (Scenariosare defined in Table 1)
35 Discussion of Methodology
Overall we consider the combination of MFA and SNB as a highly appropriate methodologyfor conducting a holistic ex-ante assessment of soil management practices in SSA smallholdingsBoth methods generally aim at a structured analysis of certain substances flowing in an arbitrarycomplex system and therefore follow comparable principles and procedures Selecting certain INand OUT which are generally considered in SNB allowed us to describe the real farming system inas simple a manner as possible yet also in as complex a manner as necessary for the scope of thisstudy MFA supplemented our analysis by providing a framework (i) to expand our investigationsby incorporating both private households and the environment into a single system analysis (ii)to compute our analyses with uncertainties incorporated into it and (iii) to illustrate the results ofcomposting processes into flow diagrams The first point in particular allowed us to derive additionalinformation such as C content or liming potentials of the substrates analyzed composition of compostsemissions from composting etc
Despite obvious strengths we identify the following limitations in the applied methodology(I) Data used to assume biomass production and crop yields in AM2ndash5 derive from a field trial
conducted in Karagwe [61] The experiment was well adapted to local practices but only lasted forone cropping season The results still need therefore to be replicated for validation Neverthelesspractical experiences from the case study underline existing scientific results so far
(II) The time needed for mineralization the form of applied nutrients (ie organic versus mineralN or P) and the transfer of the applied nutrients to the various nutrient pools in the soil (eg labileand stable pools of P) is not taken into account in our model This simplification is accounted for bythe fact that our model is a static one and it was not possible to include dynamic effects Insteadwe simply assumed that the treatments analyzed would be applied repeatedly and thus constantlyrelease nutrients to various pools The total nutrient uptake of plants in one season is rather the sum ofcontributions from different previous cultivation periods Our model however suggests that plantuptake is equivalent to the contributions applied over one single season
(III) Soil and nutrient losses through wind and water erosion are not considered in our modelWe reason that (i) [27] also neglected soil erosion as a natural OUT when conducting SNB for shambasystems in Karagwe (ii) available data on slopes and erosion sensitivity of the local soil are notsufficient and (iii) many farmers in Karagwe apply erosion control measures such as contour plantingcatching water in trenches mulching intercropping with cover-crops and agroforestry to controlsoil erosion According to local expert judgment efforts to implement countermeasures are widelyadopted by farmers in Karagwe However [69] report a possible range of 0ndash28 kgmiddothaminus1middotyearminus1 forerosion induced N-losses from arable land in East Africa Other SNB studies conducted for Ugandaestimated N- and P-losses with 5ndash14 and 15ndash100 kgmiddothaminus1middotyearminus1 respectively [257980]
(IV) Sequestered C could have been subtracted from total GWP according to the Kyoto ProtocolHowever C sequestration rates of local soils are to the best of our knowledge largely unknownHence we excluded C sequestration in GWP accounting which according to [102] is valid if biogenic
Agriculture 2018 8 31 23 of 31
CO2 emissions are included in the assessment which is the case in our model for CO2 emissionsfrom composting
(V) Environmental emissions with EP are likely to be over-estimated We assessed the EP after [74]and consequently included both total P and total N contained in liquid emissions Given that highlevels of P fixation can be expected for the local soil [101] and given that P is relatively immobile inthe soil [94] we presume that phosphate would most likely remain in the soil surrounding pit latrinesBy contrast pollution of underground water resources is more likely from ammonium emissions If wewere to exclude P leaching from our assessment our EP estimations could possibly be reduced toabout 70ndash90 of the EP (Figure 5b)
(VI) Possible biochar-related effects are not considered when quantifying GHG emissionsor nutrient leaching from the composting process We rather assumed equal processes and emissionfactors for standard compost and biochar-containing CaSa-compost We reason that existing scientificdata on using biochar as a soil amendment are contradictory cf [105106] Overall availabledata expose existing uncertainties in various areas knowledge gaps in underlying principlesand mechanisms and the admission that possible effects of biochar amendments are highlysite-specific [105] For these reasons we judge that it is not yet possible to depict biochar effectsin a model such as the present one
(VII) The model developed in this study does not yet depict soil dynamics such as nutrientdynamics or SOM transformations Further empiric studies are therefore required to study for examplein situ interactions of biochar soil nutrient pools and SOM in long-term field experiments andthe effects of amending selected treatments such as biochar-compost to tropical Andosols Empiricdata collected would help quantify the relationship between compost applications and replenishmentrates of soil nutrients turnover rates of SOM and accumulation rates of SOM for C sequestrationAnalytical work such as dynamic modelling could then follow in order to estimate the timeframesassociated with soil effects
Despite all limitations discussed we consider the present model to be complex enough andtherefore adequate to sufficiently answer our research questions
4 Conclusions
By adopting an integrated perspective on farming and households we draw the followingconclusions with respect to the research objectives and for the example of smallholdings in KaragweTZ
bull The IPNM strategies analyzed ie utilizing resources recovered from cooking and sanitationshow a clear potential to decrease currently existing soil nutrient deficits Specifically net Pbalance is reversed giving a positive result This means that P depletion is avoided whiledepletion rates of N are mitigated but not avoided completely
bull Biogas slurry standard compost or CaSa-compost are all feasible for completely meeting Pdemand of crops All organic inputs analyzed require application in combination with a mineralfertilizer such as urine to compensate crop N-demand
bull Recovering and utilizing residues from households for composting allows for the productionof adequate quantities of compost on-farm Biochar recovered from cooking andor sanitationspecifically contributes to C contained in CaSa-compost while residues from EcoSan significantlycontribute to nutrient content of CaSa-compost
bull Environmental emissions greatly increase with the production and use of organic fertilizerswhereby the climate balance declines for all IPNM scenarios analyzed The EP also demonstratesan increase in association with intensive subsistence production of composts
When considering the analyzed IPNM practices with respect to certain relevant sustainabilityaspects we emphasise that
Agriculture 2018 8 31 24 of 31
bull Using the CaSa-compost is a suitable method for sustainable soil fertility management due tothe following factors (i) applied P amendments are appropriate to replenish P in exhausted soils(ii) estimated liming effects are suitable for mitigating existing soil acidification (iii) C inputscontribute to restoring the SOM and (iv) potentially also to C sequestration while (v) the overallGWP is maintained and total EP is reduced
bull Regarding the aforementioned benefits identified for compost amendments the potential ofthe CaSa-compost is superior to the standard compost especially with respect to liming andSOM restoration By contrast the use of biogas slurry is inferior in all aspects when compared tocompost amendments especially for liming SOM restoration and emissions with GWP
Conceptually combining SNB with MFA was beneficial because it enabled us to
bull Conduct an analysis from a system perspective around the nexus of energy-sanitation-agricultureinstead of focusing only on farming products and processes
bull Create a functional link between smallholder households farming practices soil nutrient stocksand the environment
bull Shed light on how IPNM strategies that combine use of residues from cooking and sanitationaffect local soil nutrient budgeting in comparison to the current state
To sum up we found that switching household technologies to locally adopted alternativessuch as biogas digesters microgasifiers and UDDTs combined with the consequent recovery anduse of residues has a strong potential to improve SNBs in farming Moreover both of the prevailingchallenges for the agricultural production in KaragwemdashP-scarcity and soil aciditymdashcan be mitigatedthrough the use of biocharndashfaecal-compost We judge that our results are transferable to comparablesmallholder systems in other regions of SSA where similar technologies are available Moreoverestimated results from this study which focus at the farm level may serve as a starting pointfor upscaling analyses from the farm level to the community or district level In addition theyhelp estimate potential positive environmental and agronomic impacts which in turn support localinitiatives aimed at sustainable farming and soil improvement We maintain that a socio-economicassessment should follow up on this study
Overall we conclude that integrating residues from farming households into agricultural practicesis a promising path for subsistence farmers wishing to escape the vicious circle of insufficientproduction of food crops and therefore residual matter leading to poor soil fertility Neverthelessefficient recycling of all available domestic refuses is required to offset those local soil nutrient deficitsidentified in this study Exploiting the potentials of the analyzed recycling practices therefore requiresa considerable effort on the part of local farmers affecting processes including transportation ofmaterials making compost collecting and using urine (or other mineral fertilizer) etc Smallholdersneed to pursue multiple practical aims including optimizing nutrient recovery efficiency maintainingsound composting processes minimizing workload reducing GHG emissions etc For thesereasons various (objective) criteria and subjective preferences need to be considered jointly froman intersectional and transdisciplinary perspective We must therefore consider the possibility thata single ldquooptimum solutionrdquo may not exist but rather pursue a ldquobest optionrdquo that measures the delicatebalance of all these different objectives against one another For example the multi-disciplinaryapproach of a multi-criteria analysis (MCA) can be applied for selecting and considering the objectivesof the evaluation identifying the preferences of all the people involved and ensuring transparencywithin the group of decision makers
Supplementary Materials The following are available online at wwwmdpicom2077-04728331s1 FigureS1 Example of a shamba the agricultural land surrounding farming houses also called ldquobanana-based homegardenrdquo used for inter-cropping of perennial crops like fruit banana and coffee trees and annual crops includingbeans cassava African eggplant etc Figure S2 Example of a msiri former grassland used for the cultivationof annual crops including maize beans millet and vegetables like tomatoes cabbage onion etc Figure S3Proceeding of the applied system analysis combining the material flow analysis (MFA) with the soil nutrient
Agriculture 2018 8 31 25 of 31
balance (SNB) for an annual intercropping system in Karagwe TZ Figure S4 Integrated environmental impacts ofthe micro energy systems (MESred) the micro sanitation system (MSSblue) and the agroecosystem AESgreen)for the global warming potential (a) and the eutrophication potential (b) Figure S5 Regression analysis forestimating the relationships between the N flows in the natural balance (NB) and the biological nitrogen fixation(BNF) for all of the five analyzed scenarios values are displayed in kg of N per hectare and year Table S1Production of main crops in Kagera region and Karagwe district based on the national sample census of agriculture20072008 Table S2 Pictures and short description of the analyzed cooking alternatives that are locally availablein Karagwe TZ Table S3 Pictures and short description of the analyzed sanitation alternatives that are locallyavailable in Karagwe TZ Table S4 Definition of the system analyzed Table S5 Estimated application rates ofthe organic and mineral inputs studied in scenarios AM1ndashAM5 in kg of FM per household and year Table S6Estimated P-inputs with organic and mineral inputs studied in scenarios AM1ndashAM5 in kg of P per hectare andyear Table S7 Estimated liming effects of the organic material expressed in equivalent application in kg of CaOper hectare and year calculated with liming potentials presented in Krause et al (2015) Table S8 Estimated Cinputs with organic and mineral inputs studied in scenarios AM1ndashAM5 in kg of C per hectare and year Table S9Estimated SOM reproduction potentials with organic and mineral inputs studied in scenarios AM1ndashAM5 in kg ofC in SOM per hectare and year Table S10 Available materials for organic and mineral fertilization in kg yearminus1
of FM Table S11 Utilization of the matter as input material in of available FM Table S12 Estimated SNB forN and P comprising natural input (IN3a 4a 4b) and natural output (OUT3 4a) flows organic (IN2andash2e) andmineral (IN1c) input flows and output flows (Out1a 1b 2) with agricultural products in kg of N and P perhousehold and year plot data for Figure 3 Table S13 Estimated environmental impacts of the analyzed IPNMstrategies the global warming potential in kg of CO2 equivalents per household and year plot data for Figure 5aTable S14 Estimated environmental impacts of the analyzed IPNM strategies the eutrophication potential in kgof PO4 equivalents per household and year plot data for Figure 5b Table S15 Integrated environmental impactswith GWP of the MES the MSS and the AES in kg of CO2 equivalents per household and year plot data forSupplementary Figure S4a Table S16 Integrated environmental impacts with EP of the MES the MSS and the AESin kg of PO4 equivalents per household and year plot data for Supplementary Figure S4b Table S17 EvaluationSNBmdashregression analysis estimated biological N fixation and estimated natural balance in kg of N per householdand year plot data for Supplementary Figure S3 Table S18 Relative contribution of the different resources usedfor standard composting and for CaSa-composting to the total input flow in terms of volume and content of C Nand P prior to the composting process in plot data for Figure 4a Table S19 Relative contribution of the differentresources used for standard composting and for CaSa-composting to the total input flow in terms of volumeand content of C N and P prior to the composting process in plot data for Figure 4b Table S20 Materialoutput flows of food products (ie maize and beans grains cabbage heads and onion bulbs) in kg of FM (afterair-drying for maize beans and onion) per household and year Table S21 Material output flows of food productsfor self-consumption in kg of FM (after air-drying for maize beans and onion) per household and year Table S22Material output flows of food products sold to market in kg of FM (after air-drying for maize beans and onion) perhousehold and year Table S23 Material output flows of harvest residues in kg of FM (at time of harvesting) perhousehold and year Table S24 Relative uncertainties (RU) of results calculated defined as the standard error in of the arithmetic mean value Supplementary S1 General information Supplementary 2 Specific equationsapplied for modelling Supplementary 3 Assessment of emissions to the environment Supplementary 4 ShortDiscussion Supplementary 5 Data collection of material and process values Supplementary 6 Terminology
Acknowledgments We would like to express our sincere thanks to the teams of the case study projects andthe MAVUNO staff for their support to this work by sharing project data and information on the cropping systemsand ways of farming Sincere thanks to Richard Aslan for professional editing service We also thank the HansBoumlckler Foundation and the Central Womenrsquos Representative of TU Berlin for financially supporting ArianeKrausersquos PhD scholarship We acknowledge support by the German Research Foundation and the Open AccessPublication Funds of TU Berlin
Author Contributions Ariane Krause conceived and designed the system analysis Ariane Krause performedthe data collection data evaluation and modelling Ariane Krause and Vera Susanne Rotter discussed findingsresults and conclusions as well as visual presentation of results Ariane Krause prepared the manuscript includingdrafting the text and preparing figures and tables Vera Susanne Rotter cooperated by correcting the text andpromoting professional discussions
Conflicts of Interest The authors declare no conflict of interest The founding sponsors had no role in the designof the study in the collection analyses or interpretation of data in the writing of the manuscript and inthe decision to publish the results
References
1 Von Liebig JF Playfair LPB Webster JW Organic Chemistry in Its Applications to Agriculture and PhysiologyOwen J Ed Printed for Taylor and Walton London UK 1841
2 McIntyre BD Herren HR Wakhungu J Watson RT Agriculture at a crossroads In Synthesis Report ofthe Global and Sub-Global IAASTD Reports Island Press Washington DC USA 2009 106p
Agriculture 2018 8 31 26 of 31
3 De Schutter Agroecology and the Right to Food Report by the Special Rapporteur on the Right to Food 16thSession of the United Nations Human Rights Council (AHRC1649) United Nations General AssemblyGeneva Switzerland 2011 Available online httpwwwsrfoodorgenreport-agroecology-and-the-right-to-food (accessed on 11 May 2017)
4 FAO A Statement by FAO Director-General Joseacute Graziano da Silva 24th Session of the Committee on Agriculture(COAG) Opening Statement Food and Agriculture Organization of the United Nations (FAO) Rome Italy2014 Available online httpwwwfaoorgaboutwho-we-aredirector-genfaodg-statementsdetailenc250139 (accessed on 24 October 2016)
5 La Via Campesina Declaration of the International Forum for Agroecology Available onlinehttpsviacampesinaorgenindexphpmain-issues-mainmenu-27sustainable-peasants-agriculture-mainmenu-421749-declaration-of-the-international-forum-for-agroecology (accessed on 15 November 2016)
6 Lal R Managing soils for feeding a global population of 10 billion J Sci Food Agric 2006 86 2273ndash2284[CrossRef]
7 Lal R Soils and world food security Soil Till Res 2009 102 1ndash4 [CrossRef]8 Tittonell P Feeding the world with soil science embracing sustainability complexity and uncertainty SOILD
2016 [CrossRef]9 Kiers ET Leakey RR Izac AM Heinemann JA Rosenthal E Nathan D Jiggins J Agriculture at
a crossroads Science 2008 320 320ndash321 [CrossRef] [PubMed]10 Markwei C Ndlovu L Robinson E Shah WP International Assessment of Agricultural Knowledge Science
and Technology for Development (IAASTD) Sub-Saharan Africa Summary for Decision Makers Island PressWashington DC USA 2008
11 FAO What is Integrated Plant Nutrient Management FAO Rome Italy 2016 Available onlinehttpwwwfaoorgagriculturecropsthematic-sitemapthemespiscpi-homemanaging-ecosystemsintegrated-plant-nutrient-managementipnm-whaten (accessed on 24 October 2016)
12 Roy RN Finck A Blair GJ Tandon HL Plant Nutrition for Food Security A Guide for Integrated NutrientManagement FAO Fertilizer and Plant Nutrition Bulletin 16 FAO Rome Italy 2006
13 Amoding A Tenywa JS Ledin S Otabbong E Agronomic effectiveness of urban market crop wastecompost on-farm in Uganda In Proceedings of the African Crop Science Conference Entebbe Uganda5ndash9 December 2005 African Crop Science Society Kampala Uganda 2005 pp 1133ndash1138
14 Karungi J Kyamanywa S Ekbom B Organic soil fertility amendments and tritrophic relationships oncabbage in Uganda Experiences from on-station and on-farm trials Afr J Agric Res 2010 5 2862ndash2867
15 Tumuhairwe JB Tenywa JS Otabbong E Ledin S Comparison of four low-technology compostingmethods for market crop wastes Waste Manag 2009 29 2274ndash2281 [CrossRef] [PubMed]
16 Palm CA Myers RJK Nandwa SM Combined Use of Organic and Inorganic Nutrient Sources for SoilFertility Maintenance and Replenishment In Replenishing Soil Fertility in Africa Buresh RJ Sanchez PACalhoun F Eds Soil Science Society of America (SSSA) Special Publication 51 Madison WI USA 1997p 217 [CrossRef]
17 Buresh RJ Smithson PC Hellums DT Building soil phosphorus capital in Africa In Replenishing SoilFertility in Africa Buresh RJ Sanchez PA Calhoun F Eds SSSA Special Publication 51 Madison WIUSA 1997 pp 111ndash149 [CrossRef]
18 Montanarella L Pennock DJ McKenzie N Badraoui M Chude V Baptista I Vargas R Worldrsquos soilsare under threat SOIL 2016 2 79ndash82 [CrossRef]
19 Sanginga N Woomer PL (Eds) Integrated Soil Fertility Management in Africa Principles Practices andDevelopmental Process Tropical Soil Biology and Fertility Institute of the International Centre for TropicalAgriculture Nairobi Kenya 2009 263p
20 Nziguheba G Zingore S Kihara J Merckx R Njoroge S Vanlauwe B Phosphorus in smallholderfarming systems of sub-Saharan Africa Implications for agricultural intensification Nutr Cycl Agroecosys2016 104 321ndash340 [CrossRef]
21 De Jager A Nandwa SM Okoth PF Monitoring nutrient flows and economic performance inAfrican farming systems (NUTMON) I Concepts and methodologies Agric Ecosyst Environ 199871 37ndash48 [CrossRef]
Agriculture 2018 8 31 27 of 31
22 Roy RN Misra RV Lesschen JP Smaling EMA Chapter 2 Methodologies for assessing soil nutrientbalancesmdashsection ldquomicrolevelrdquo In Assessment of Soil Nutrient Balance Approaches and Methodologies FAORome Italy 2003 Volume 14 pp 46ndash70
23 Stoorvogel JJ Smaling EM Assessment of Soil Nutrient Depletion in Sub-Saharan Africa 1983ndash2000 VolumeII Nutrient Balances per Crop and per Land Use Systems Winand Staring Centre for Integrated Land Soiland Water Research Wageningen The Netherlands 1990
24 Zhou M Brandt P Pelster D Rufino MC Robinson T Butterbach-Bahl K Regional nitrogen budget ofthe Lake Victoria Basin East Africa Syntheses uncertainties and perspectives Environ Res Lett 2014 9105009 [CrossRef]
25 Lederer J Karungi J Ogwang F The potential of wastes to improve nutrient levels in agricultural soilsA material flow analysis case study from Busia District Uganda Agric Ecosyst Environ 2015 207 26ndash39[CrossRef]
26 Stoorvogel JJ Smaling EA Janssen BH Calculating soil nutrient balances in Africa at different scales ISupra-national scale Fertil Res 1993 35 227ndash235 [CrossRef]
27 Baijukya FP de Steenhuijsen PB Nutrient balances and their consequences in the banana-based land usesystems of Bukoba district northwest Tanzania Agric Ecosyst Environ 1998 71 147ndash158 [CrossRef]
28 Moumlller K Muumlller T Effects of anaerobic digestion on digestate nutrient availability and crop growthA review Eng Life Sci 2012 12 242ndash257 [CrossRef]
29 Lehmann J Joseph S Biochar for Environmental Management Science and Technology Earthscan London UK2009 p 449 ISBN 978-1844076581
30 Taylor P (Ed) The Biochar Revolution In Transforming Agriculture amp Environment Global Publishing GroupMt Evelyn Victoria Australia 2010 ISBN 978-1921630415
31 Glaser B Lehmann J Zech W Ameliorating physical and chemical properties of highly weathered soils inthe tropics with charcoal A review Biol Fertil Soils 2002 35 219ndash230 [CrossRef]
32 Sombroek W Amazon Soils A Reconnaissance of Soils of the Brazilian Amazon Region Dissertation AgriculturalState University of Wageningen Centre for Agricultural Publications and Documentation WageningenThe Netherlands 1996
33 Kammann CI Schmidt HP Messerschmidt N Linsel S Steffens D Stephen J Plant growthimprovement mediated by nitrate capture in co-composted biochar Nat Sci Rep 2015 5 11080 [CrossRef][PubMed]
34 Esrey SA Andersson I Hillers A Sawyer R Closing the LoopmdashEcological Sanitation for Food SecurityPublications on Water Resources No 18 Swedish International Development Cooperation Agency (SIDA)Tepoztlaacuten Mexico 2001 ISBN 91-586-8935-4
35 Winblad U Simpson-Heacutebert M Calvert P Morgan P Rosemarin A Sawyer R Xiao J EcologicalSanitationmdashRevised And Enlarged Edition SEI Stockholm Sweden 2004
36 WHO WHO guidelines for the safe use of wastewater excreta and greywater In Excreta and GreywaterUse in Agriculture World Health Organization (WHO) Press Geneva Switzerland 2006 Volume 4 p 222ISBN 92-4-154685-9
37 Niwagaba C Nalubega M Vinnerarings B Sundberg C Joumlnsson H Bench-scale composting ofsource-separated human faeces for sanitation Waste Manag 2009 29 585ndash589 [CrossRef] [PubMed]
38 Richert A Gensch R Joumlnsson H Stenstroumlm TA Dagerskog L Practical Guidance on the Use of Urine inCrop Production Stockholm Environment Institute (SEI) Stockholm Sweden 2010 ISBN 978-918-612-521-9
39 Krause A Kaupenjohann M George E Koumlppel J Nutrient recycling from sanitation and energy systemsto the agroecosystemmdashEcological research on case studies in Karagwe Tanzania Afr J Agric Res 2015 104039ndash4052 [CrossRef]
40 Feachem RG Bradley DJ Garelick H Mara DD Sanitation and DiseasemdashHealth Aspects of Excreta andWastewater Management World Bank Studies in Water Supply and Sanitation No 3 John Wiley amp SonsChichester UK 1983 p 534
41 Krause A Rotter VS Linking energy-sanitation-agriculture Intersectional resource management insmallholder households in Tanzania Sci Total Environ 2017 590 514ndash530 [CrossRef] [PubMed]
42 Heinonen-Tanski H van Wijk-Sijbesma C Human excreta for plant production Bioresource Technol 200596 403ndash411 [CrossRef] [PubMed]
Agriculture 2018 8 31 28 of 31
43 Amlinger F Peyr S Cuhls C Green house gas emissions from composting and mechanical biologicaltreatment Waste Manag Res 2008 26 47ndash60 [CrossRef] [PubMed]
44 Moumlller K Stinner W Deuker A Leithold G Effects of different manuring systems with and withoutbiogas digestion on nitrogen cycle and crop yield in mixed organic dairy farming systems Nutr CyclAgroecosys 2008 82 209ndash232 [CrossRef]
45 Baba Y Tada C Watanabe R Fukuda Y Chida N Nakai Y Anaerobic digestion of crude glycerol frombiodiesel manufacturing using a large-scale pilot plant Methane production and application of digestedsludge as fertiliser Bioresource Technol 2013 140 342ndash348 [CrossRef] [PubMed]
46 Clements LJ Salter AM Banks CJ Poppy GM The usability of digestate in organic farming Water SciTechnol 2012 66 1864ndash1870 [CrossRef] [PubMed]
47 Garfiacute M Gelman P Comas J Carrasco W Ferrer I Agricultural reuse of the digestate from low- costtubular digesters in rural Andean communities Waste Manag 2011 31 2584ndash2589 [CrossRef] [PubMed]
48 Herath HMSK Camps-Arbestain M Hedley M Effect of biochar on soil physical properties in twocontrasting soils An Alfisol and an Andisol Geoderma Geoderma 2013 209 188ndash197 [CrossRef]
49 Kammann CI Linsel S Gosling JW Koyro HW Influence of biochar on drought tolerance ofChenopodium quinoa Willd and on soil-plant relations Plant Soil 2011 345 195ndash210 [CrossRef]
50 Liu J Schulz H Brandl S Miehtke H Huwe B Glaser B Short-term effect of biochar and compost onsoil fertility and water status of a Dystric Cambisol in NE Germany under field conditions J Plant Nutr SoilSci 2012 175 698ndash707 [CrossRef]
51 Major J Rondon M Molina D Riha SJ Lehmann J Maize yield and nutrition during 4 years afterbiochar application to a Colombian savanna oxisol Plant Soil 2010 333 117ndash128 [CrossRef]
52 Nehls T Fertility Improvement of a Terra Firme Oxisol in Central Amazonia by Charcoal Applica-TionsMasterrsquos Thesis University of Bayreuth Bayreuth Germany 2002
53 Petter FA Madari BE Silva MASD Carneiro MAC Carvalho MTDM Junior M Pacheco LPSoil fertility and upland rice yield after biochar application in the Cerrado Pesqui Agropecu Bras 2012 47699ndash706 [CrossRef]
54 Schmidt HP Pandit BH Martinsen V Cornelissen G Conte P Kammann CI Fourfold increase inpumpkin yield in response to low-dosage root zone application of urine-enhanced biochar to a fertile tropicalsoil Agriculture 2015 5 723ndash741 [CrossRef]
55 Schulz H Dunst G Glaser B Positive effects of composted biochar on plant growth and soil fertilityAgron Sustain Dev 2013 33 817ndash827 [CrossRef]
56 SUSANA (nd) Sanitation Case Studies an Online Collection of Fact Sheets on 95 Case Studies of EcoSanSustainable Sanitation Alliance (SuSanA) Available online httpwwwsusanaorgenresourcescase-studies (accessed on 22 May 2017)
57 Komakech AJ Zurbruumlgg C Semakula D Kiggundu N Vinnerarings B Evaluation of the Performance ofDifferent Organic Fertilisers on Maize Yield A Case Study of Kampala Uganda J Agric Sci 2015 7 28[CrossRef]
58 Kimetu JM Lehmann J Ngoze SO Mugendi DN Kinyangi JM Riha S Pell AN Reversibility ofsoil productivity decline with organic matter of differing quality along a degradation gradient Ecosystems2008 11 726ndash739 [CrossRef]
59 Andersson E Turning waste into value Using human urine to enrich soils for sustainable food productionin Uganda J Clean Prod 2015 96 290ndash298 [CrossRef]
60 Ogwang F Tenywa JS Otabbong E Tumuhairwe JB Amoding-Katusabe A Faecal Blending forNutrient Enrichment and Speedy Sanitisation for Soil Fertility Improvement ISRN Soil Sci 2012 2012424171 [CrossRef]
61 Krause A Nehls T George E Kaupenjohann M Organic wastes from bioenergy and ecological sanitationas a soil fertility improver A field experiment in a tropical Andosol SOIL 2016 2 147ndash162 [CrossRef]
62 Tanzania National Sample Census of Agriculture 20072008 Regional ReportmdashKagera Region United Republic ofTanzania Ministry of Agriculture Food Security and Cooperatives The National Bureau of Statistics andthe Office of the Chief Government Statistician Zanzibar Tanzania 2012 Volume Vh
63 Batjes NH Global Distribution of Soil Phosphorus Retention Potential ISRIC Report Wageningen Universityand Research Centre Wageningen The Netherlands 2011 p 41
Agriculture 2018 8 31 29 of 31
64 Baijukya FP De Ridder N Giller KE Nitrogen release from decomposing residues of leguminous covercrops and their effect on maize yield on depleted soils of Bukoba District Tanzania Plant Soil 2006 27977ndash93 [CrossRef]
65 UNEP Reactive Nitrogen in the Environment Too Much or Too Little of a Good Thing United Nations EnvironmentProgramme (UNEP) Paris France 2007 56p
66 Baccini P Brunner PH Metabolism of the Anthroposphere Analysis Evaluation Design MIT Press CambridgeMA USA 2012 408p
67 Brunner PH Rechberger H Practical handbook of material flow analysis CRC Press Boca Raton FL USA2004 336p
68 Lesschen JP Stoorvogel JJ Smaling EM Heuvelink GB Veldkamp A A spatially explicit methodologyto quantify soil nutrient balances and their uncertainties at the national level Nutr Cycl Agroecosys 200778 111ndash131 [CrossRef]
69 Van den Bosch H Gitari JN Ogaro VN Maobe S Vlaming J Monitoring nutrient flows and economicperformance in African farming systems (NUTMON) III Monitoring nutrient flows and balances in threedistricts in Kenya Agric Ecosyst Environ 1998 71 63ndash80 [CrossRef]
70 Rugalema GH OktingrsquoAti A Johnsen FH The homegarden agroforestry system of Bukoba districtNorth-Western Tanzania 1 Farming system analysis Agrofor Syst 1994 26 53ndash64 [CrossRef]
71 Smaling EM Fresco LO Jager AD Classifying monitoring and improving soil nutrient stocks and flowsin African agriculture Ambio 1996 25 492ndash496
72 Eghball B Power JF Phosphorus-and nitrogen-based manure and compost applications corn productionand soil phosphorus Soil Sci Soc Am J 1999 63 895ndash901 [CrossRef]
73 Myhre G Shindell D Breacuteon F-M Collins W Fuglestvedt J Zhang H Anthropogenic and NaturalRadiative ForcingmdashClimate Change 2013 The Physical Science Basis Contribution of Working Group I tothe Fifth Assessment Report of the IPCC Stocker TF Qin D Plattner G-K Tignor M Midgley PM EdsCambridge University Press Cambridge UK New York NY USA 2013
74 Heijungs R Guineacutee JB Huppes G Lankreijer RM Udo de Haes HA De Goede HP EnvironmentalLife Cycle Assessment of Products Guide and Backgrounds (Part 1) Available online httpsopenaccessleidenunivnlhandle18878061 (accessed on 3 September 2016)
75 Guineacutee JB Handbook on life cycle assessment Operational guide to the ISO standards Int J Life CycleAssess 2002 7 311ndash313 [CrossRef]
76 Laner D Rechberger H Astrup T Systematic evaluation of uncertainty in material flow analysis J Ind Eng2014 18 859ndash870 [CrossRef]
77 FAU Physics (nd) Anleitung zur Fehlerrechnung Friedrich Alexander Universitaumlt (FAU)Erlangen-Nuremberg Department of Physics Available online httpwwwphysikuni-erlangendelehredatenNebenfachPraktikumAnleitung20zur20Fehlerrechnungpdf (accessed on 15 June 2016)
78 Cumming G Fidler F Vaux DL Error bars in experimental biology J Cell Biol 2007 177 7ndash11 [CrossRef][PubMed]
79 Nkonya E Kaizzi C Pender J Determinants of nutrient balances in a maize farming system in easternUganda Agric Syst 2005 85 155ndash182 [CrossRef]
80 Wortmann CS Kaizzi CK Nutrient balances and expected effects of alternative practices in farmingsystems of Uganda Agric Ecosyst Environ 1998 71 115ndash129 [CrossRef]
81 Sanchez PA Shepherd KD Soule MJ Place FM Buresh RJ Woomer PL Soil fertility replenishmentin Africa An investment in natural resource capital In Replenishing Soil Fertility in Africa Buresh RJSanchez PA Calhoun F Eds Soil Science Society of America and American Society of AgronomyMadison WI USA 1997 pp 1ndash46
82 Finck A Pflanzenernaumlhrung und Duumlngung in Stichworten (Plant Nutrition and Fertilization in Keywords) 6th edBorntraeger Stuttgart Germany 2007
83 Mafongoya PL Bationo A Kihara J Waswa BS Appropriate technologies to replenish soil fertilityin southern Africa In Advances in Integrated Soil Fertility Management in Sub-Saharan Africa Challenges andOpportunities Springer Dordrecht The Netherlands 2007 Volume 1 pp 29ndash44
84 Moumlller K Stinner W Effects of different manuring systems with and without biogas digestion on soilmineral nitrogen content and on gaseous nitrogen losses (ammonia nitrous oxides) Eur J Agron 2009 301ndash16 [CrossRef]
Agriculture 2018 8 31 30 of 31
85 Amon B Kryvoruchko V Amon T Zechmeister-Boltenstern S Methane nitrous oxide and ammoniaemissions during storage and after application of dairy cattle slurry and influence of slurry treatmentAgric Ecosyst Environ 2006 112 153ndash162 [CrossRef]
86 Agyarko-Mintah E Cowie A Singh BP Joseph S Van Zwieten L Cowie A Harden S Smillie RBiochar increases nitrogen retention and lowers greenhouse gas emissions when added to compostingpoultry litter Waste Manag 2016 61 138ndash143 [CrossRef] [PubMed]
87 Larsen O Horneber D Einfluss von Biokohle auf Treibhausgasemissionen waumlhrend der KompostierungIn Book of Abstracts of the scientific Workshop Biokohle im GartenbaundashVerwertung von Organischen Reststoffen zurSchlieszligung von Energiemdashund Stoffkreislaumlufen Terytze K Ed Freie Universitaumlt Berlin Berlin Germany 2015pp 33ndash34
88 Sonoki T Furukawa T Jindo K Suto K Aoyama M Saacutenchez-Monedero MAacute Influence of biocharaddition on methane metabolism during thermophilic phase of composting J Basic Microb 2013 53 617ndash621[CrossRef] [PubMed]
89 Vandecasteele B Mondini C DrsquoHose T Russo S Sinicco T Quero AA Effect of biochar amendmentduring composting and compost storage on greenhouse gas emissions N losses and P availabilityIn Proceedings of the 15th RAMIRAN International Conference Recycling of Organic Residues in AgricultureVersailles France 3ndash5 June 2013 Institut National de la Recherche Agronomique (INRA) Thiverval-GrignonFrance 2013
90 Gronwald M Don A Tiemeyer B Helfrich M Effects of fresh and aged biochars from pyrolysis andhydrothermal carbonization on nutrient sorption in agricultural soils SOILD 2015 2 29ndash65 [CrossRef]
91 Laner D Cencic O Lederer J Quantification and Handling of Uncertainties in MFA Class Notes CoursesbquoMaterial Flow Analysis of Resource and Recycling Systemsrsquo Vienna University of Technology ViennaAustria 2013
92 Batjes NH Sombroek WG Possibilities for carbon sequestration in tropical and subtropical soilsGlob Chang Biol 1997 3 161ndash173 [CrossRef]
93 Nziguheba G Improving Phosphorus Availability and Maize Production through Organic and InorganicAmendments in Phosphorus Deficient Soils in Western Kenya PhD Thesis Katholieke Universiteit LeuvenLeuven Belgium 2011
94 Van der Eijk D Janssen BH Oenema O Initial and residual effects of fertilizer phosphorus on soilphosphorus and maize yields on phosphorus fixing soils A case study in south-west Kenya Agric EcosystEnviron 2006 116 104ndash120 [CrossRef]
95 Sattari SZ Bouwman AF Giller KE van Ittersum MK Residual soil phosphorus as the missing piecein the global phosphorus crisis puzzle Proc Natl Acad Sci USA 2012 109 6348ndash6353 [CrossRef] [PubMed]
96 Horn R Bruumlmmer GW Kandeler E Koumlgel-Knabner I Kretzschmar R Stahr K Wilke BMSchefferSchachtschabelmdashLehrbuch der Bodenkunde (Textbook of Soil Science) 16th ed Springer HeidelbergGermany 2010 570p
97 Van Breemen N Mulder J Driscoll CT Acidification and alkalinization of soils Plant Soil 1983 75283ndash308 [CrossRef]
98 Wong MTF Nortcliff S Swift RS Method for determining the acid ameliorating capacity of plant residuecompost urban waste compost farmyard manure and peat applied to tropical soils Commun Soil Sci PlantAnal 1998 29 2927ndash2937 [CrossRef]
99 KTBL Faustzahlen fuumlr die Landwirtschaft (Rule-of-Thumb Figures for Agriculture) 14th ed Kuratorium fuumlrTechnik und Bauwesen in der Landwirtschaft (KTBL) Darmstadt Germany 2009
100 Zakharova A Beare MH Cieraad E Curtin D Turnbull MH Millard P Factors controlling labilesoil organic matter vulnerability to loss following disturbance as assessed by measurement of soil-respiredδ13CO2 Eur J Soil Sci 2015 66 135ndash144 [CrossRef]
101 Chesworth W (Ed) Encyclopedia of Soil Science Springer Dordrecht The Netherlands 2008 p 902102 Christensen TH Gentil E Boldrin A Larsen A Weidema B Hauschild M C balance carbon dioxide
emissions and global warming potentials Waste Manag Res 2009 27 707ndash715 [CrossRef] [PubMed]103 Lehmann J Kleber M The contentious nature of soil organic matter Nature 2015 528 60ndash68 [CrossRef]
[PubMed]
Agriculture 2018 8 31 31 of 31
104 Michel J Weiske A Moumlller K The effect of biogas digestion on the environmental impact and energybalances in organic cropping systems using the life-cycle assessment methodology Renew Agric Food Syst2010 25 204ndash218 [CrossRef]
105 Mukherjee A Lal R The biochar dilemma Soil Res 2014 52 217ndash230 [CrossRef]106 Van Zwieten L Kammann C Cayuela M Singh BP Joseph S Kimber S Donne S Clough T
Spokas KA Biochar effects on nitrous oxide and methane emissions from soil In Biochar for EnvironmentalManagement Lehmann J Joseph S Eds Routledge London UK 2015 pp 489ndash520
copy 2018 by the authors Licensee MDPI Basel Switzerland This article is an open accessarticle distributed under the terms and conditions of the Creative Commons Attribution(CC BY) license (httpcreativecommonsorglicensesby40)
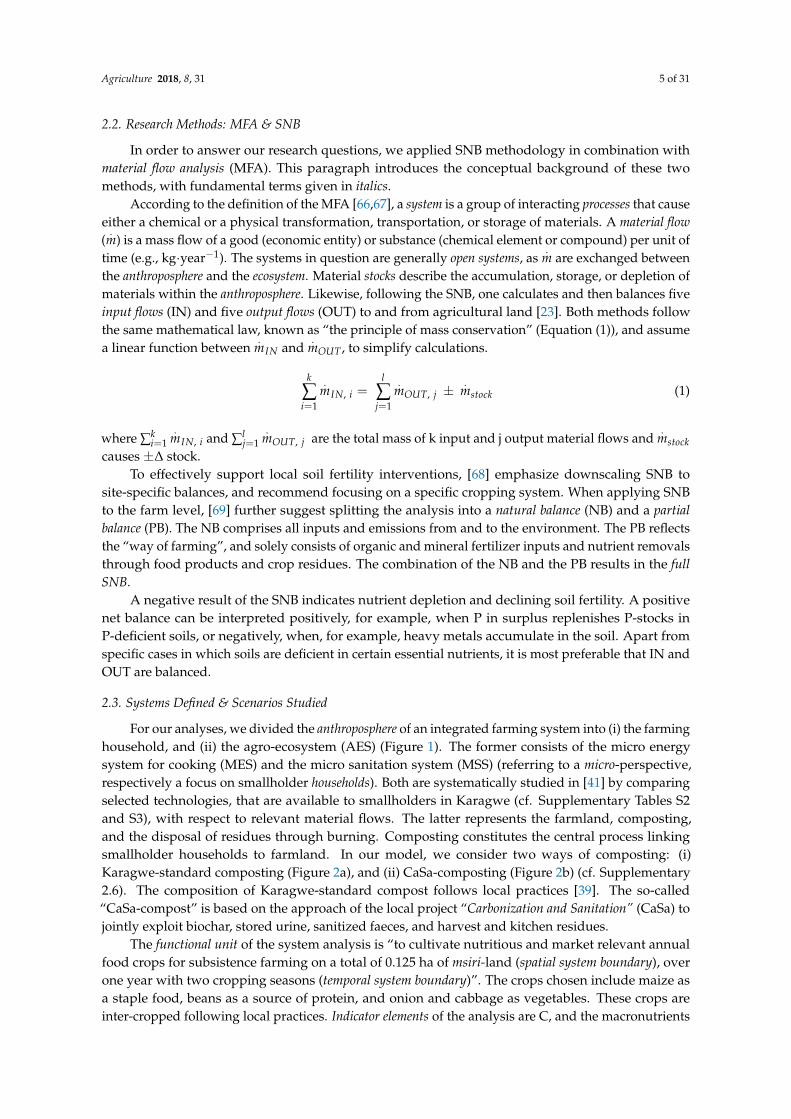
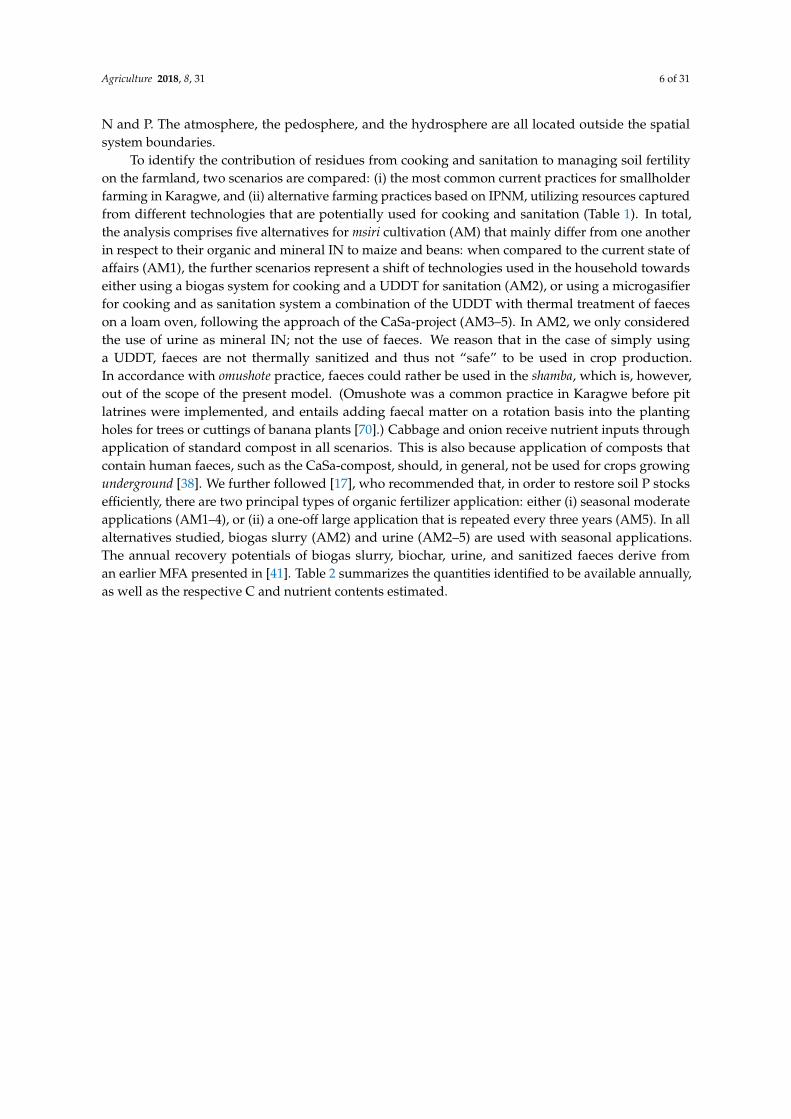
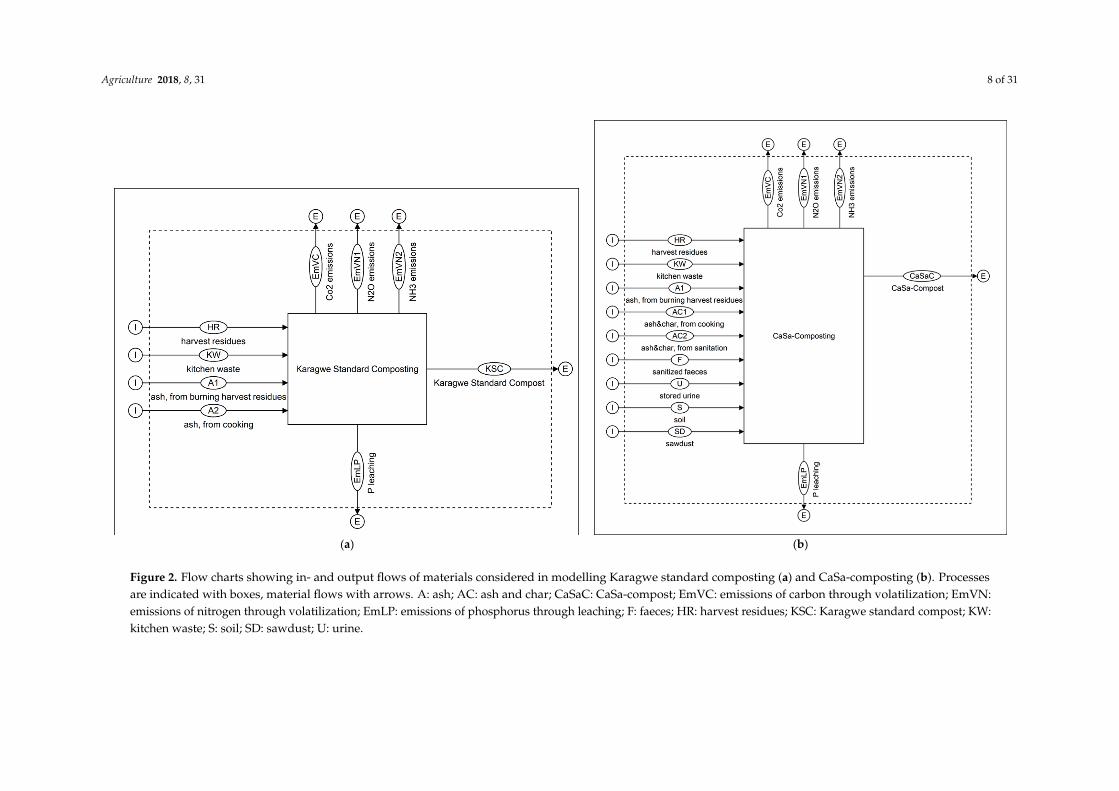
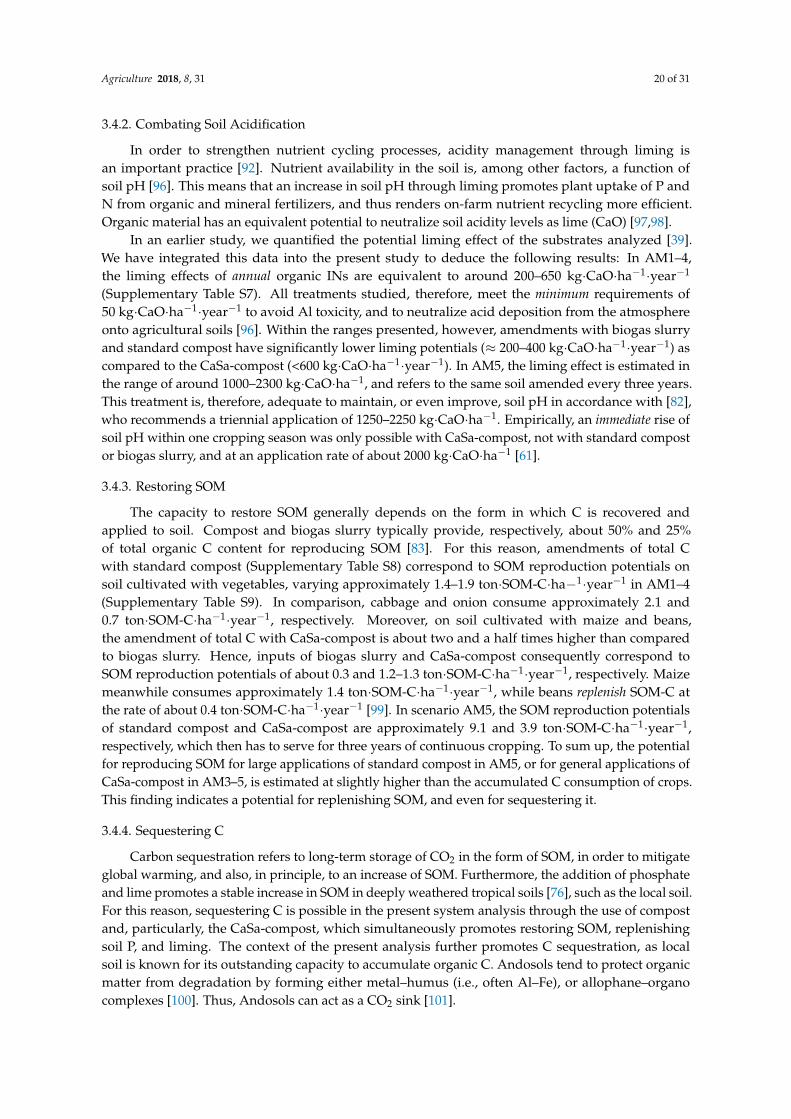