Embed Size (px)
Citation preview
Recycling Technical Assistance
Project # 523
Borough of Swissvale, Allegheny County, PA
Borough of Swissvale Municipal Recycling
March 2013
Sponsored by the Pennsylvania Department of Environmental Protection through
the Pennsylvania State Association of Township Supervisors
1
Prepared by:
Pittsburgh Office
64 S. 14th
Street
Pittsburgh, PA 15203
www.prc.org
412-488-7490
2
Problem Statement
The Borough of Swissvale requested the following Scope of Work:
“Provide assistance to the Borough in planning a municipal recycling program that is of greater
financial benefit to the Borough and achieves greater diversion rates. This will include exploring
options and recommending strategies to identify hauler and materials recovery facility that will
maximize financial benefit to the Borough and achieve greater diversion rates.”
PRC staff met with Borough of Swissvale Manager Amanda Ford, Borough Council Member Darryl
Rapp, and Public Works Manager Carmine Russo to gather information for this report. PRC staff
requested, received and reviewed weight slips and receipts for recyclables; truck mileage and fuel
purchase logs; current recycling collection crew hours, salaries and benefits; past and current contracts
and bids from commercial haulers; and, revenue sharing contracts with two other municipalities.
Findings were reviewed with the Borough Manager, Public Works Manager and members of Borough
Council before preparing this final report.
Findings
Summary of Current Recycling Program
The Borough of Swissvale established their municipal recycling program on September 12, 1990 in
Borough Ordinance 90-6. The Borough is divided into 5 routes, with pick-up provided weekly,
utilizing one truck and two Public Works Department staff. While the Solid Waste/Recycling
Ordinance does not specify which materials are accepted for residential recycling, the practice has been
to collect newspaper, mixed paper, aluminum, tin/steel/bimetal, and mixed glass. The recycling
collection vehicle currently in use is divided into four compartments, and recycling collection workers
hand-sort materials into these compartments. When the truck is at capacity, it is driven to: the nearest
of four Abitibi-Bowater bins to deposit paper; and, to Pittsburgh Recycling Services, Inc. (50
Vespucius Street, Pittsburgh, PA 15207) to deposit the aluminum, bimetal and glass. Typically, the
paper compartment reaches capacity before any of the other containers. For this reason, on heavier
routes, multiple trips are often made to a bin to unload paper and then the truck is returned to the route
to continue pick-up.
Recent tonnages and diversion rates
A municipality’s recycling rate (MRR) is the weight of recycled material collected in the municipality
as a percentage of the total solid waste generated in the municipality. The Pennsylvania Department of
Environmental Protection (PA DEP) calculates this rate as follows:
MRR = Approved Residential Tons + Approved Commercial Tons
Municipal population x 0.87
How does Swissvale’s recycling diversion rate compare to other Allegheny County municipalities, as
well as to the established state-wide goal? According to information provided by mandated
municipalities to the Allegheny County Recycling Coordinator via annual reports, the average
recycling diversion rate of mandated municipalities in the County between 2002 and 2008 was 13%.
Swissvale’s average rate over the same time period was 4.9%. PA DEP’s current statewide goal for
mandated municipalities is a diversion rate of 35%. Swissvale’s recycling diversion rate is lower than
both the County average and the PA DEP established statewide goal.
Current Program Financials
Table 1 shows the expenses and income of the current recycling program as determined from the
records provided to PRC by the Borough. Three things are striking. First, the Borough is running the
program at a significant net expense: nearly $100,000 per year. While all but a very few municipalities
3
in the region run their recycling program at a net loss, the net expense of nearly $100,000 is
particularly large, especially given Swissvale’s size. Second, some 96% of gross expenses are Public
Works salaries and benefits. Third, the Borough obtains minimal revenue from the program.
Table 1: Average Annual Financials of Recycling Program, 2010 through 2012
Labor Expenses
Total for 2 Public Works staff $125,144
% of time allocated for recycling 80% (32 hrs/wk)
PW Staff for recycling per year $100,115 (80%)
Fuel Expenses
Gallons per year 1, 009.8
Diesel price per gallon $3.71
Diesel cost per year $3,746
Total Expenses per Year $103,861
Income
DEP Performance Grant $3,000
Abitibi Paper Retriever Bin Reimbursement $1,669
Total Income per year $4,669
Total Net Expenses per Year $99,192
Dimensions of Improvement and Relevance to Key Decisions
The Borough faces two basic system choices: 1) to continue with the municipal collection of curbside
residential recyclables or 2) contract the service to a commercial hauler. Several considerations will
influence this decision: net financial impact for the Borough and its taxpayers; strength of internal (i.e.
Borough and Public Works management and staff) incentives to encourage increased recycling;
employment within the Borough; and flexibility of the system to utilize future opportunities. While this
analysis focuses on financial impacts, some discussion of other considerations is included.
An additional major decision is whether or not to purchase a new truck for recycling collection, if the
Borough decides to continue with the municipal collection system. PA DEP awarded the Borough a
902 Program Grant in 2012 that included 75% of the quoted purchase price of a new recycling
collection truck. The proposed new truck is a Loadmaster XLS, a 20 cubic yard rear-loading
compactor truck. The Borough will have two years (i.e. until Dec. 31, 2015) to decide whether to make
this purchase. PA DEP would then reimburse the Borough $105,266, leaving the Borough with an
amount of $35,089 to contribute towards the purchase. Also included in this grant is $8,160 for the
purchase of recycling containers and $20,000 for outreach/education (with a $3,284 total Borough
match).
Deciding between municipal or contract collections and allocation of funds are best understood in
terms of three areas of improvement: 1) increasing income per ton of recycled material; 2) increasing
efficiency of collection/maximizing the value of collection crew time and vehicles; and 3) increasing
the volume of recyclable material collected. The bulk of this report is organized around these areas of
improvement. Table 2 indicates which of these areas are relevant to each of the collection system
choices.
Increasing Income per Ton
While the environmental benefits of recycling are real (see A Note on Environmental Benefits on the
next page), program growth and even long-term survival are threatened if the collection system is not
financially sustainable. There are two possible methods to increase the per ton income from the
recycling program: via annual PA DEP 904 Performance Grants by submitting timely, thorough and
4
accurate applications with tonnage reports; and, via revenue sharing contracts, most commonly with a
material recovery facility (MRF) using the most beneficial mix of materials. A discussion on how
each method is calculated and their requirements follows.
One of the chief advantages of maintaining municipal residential collection is that it can include
revenue sharing, unlike contracted collection services. A good revenue sharing contract is essential for
the financial sustainability of the program. An exemplary municipal recycling program is structured so
that the municipality receives financial benefit as diversion rates increase. The stronger this financial
incentive to increase recycling, the stronger the motivation on the part of Borough managers and staff
to educate and inspire increased recycling among residents and businesses.
Table 2: Summary of Relevant Dimensions of Improvement
Improvement
Municipal Collection
Contracted Collection
Increase Income per Ton
- via DEP Performance Grants
- via revenue sharing
Yes to both
Yes to DEP Performance Grant,
revenue sharing is unlikely
Increase Efficiency of Collection;
Gain Maximum Value of Public
Works time and Borough Vehicle(s)
Yes
Not directly relevant (based on a flat,
per household fee)
Increase Tons Recycled
-via materials accepted
-via diversion of those recycling
-via % households that recycle
Yes to all 3
Yes to all 3, but less incentive
without revenue sharing
Increasing Efficiency of Collection
Increasing efficiency is the cost dimension of the program. The cost variables that drive system choice
are how the annual cost of contract compares to the annual cost of municipal collection (i.e. labor,
diesel and vehicle depreciation). With municipal collection there are several subsequent items to
consider: the capacity of the vehicle(s); the most efficient organization of routes; collection frequency
(i.e. weekly or biweekly); and, potential complementary uses of both vehicle and labor that are made
possible by improved route efficiency, providing additional revenue and/or other benefits to the
Borough.
Increasing Tons Recycled
The final dimension of improvement is increasing annual tons of recyclables collected in the Borough.
Any increase in recycling rates will be of environmental benefit and can and should be of financial
benefit (i.e. via increased income per ton of recyclables, avoided landfill tipping fees and increased
efficiency of collection).
This report ends with estimates of the annual net cost impacts of a wide range of options available to
the Borough for its residential recycling collections, contracting and municipal collection, weekly and
biweekly collections, and varying target rates of increased recycling.
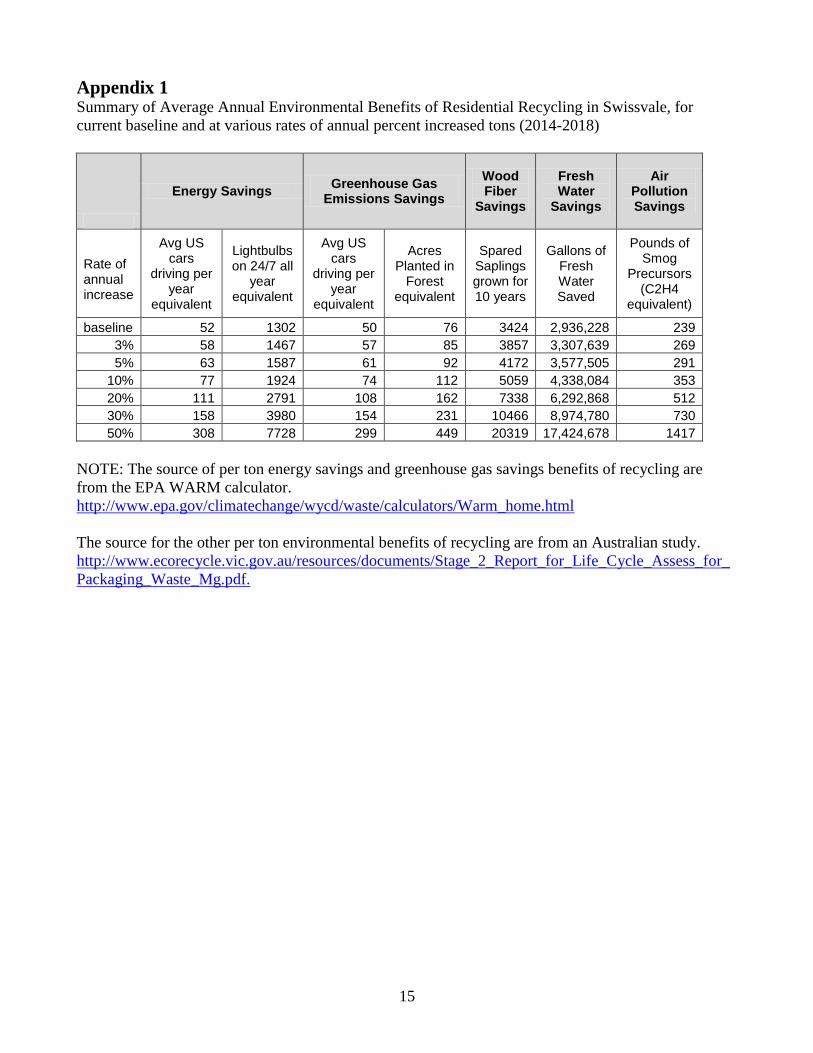
A Note on Environmental Benefits
Environmental benefits increase via increased diversion rates. Although the remainder of this analysis
focuses on financials, environmental benefits should not be ignored. Wider communication and
understanding of these benefits have motivational potential for residents, businesses and staff to
increase recycling. Appendix 1 summarizes the estimated average annual environmental benefits of
5
residential recycling in Swissvale, based on current recycling rates, as well as on a range of target
annual percent increases in recycling. Also included is a spreadsheet that allows the Borough to track
how increased diversion increases these benefits.
Increasing Income per Ton of Recyclables
As stated above, there are two possible ways that increasing tons of recycled materials can increase the
net financial benefits of a municipal recycling program: via annual PA DEP 904 Performance Grants
and via revenue sharing contracts, most commonly with a material recovery facility (MRF).
PA DEP Performance Grants
For several years, the Borough was inconsistent in submitting 904 Performance Grant applications to
PA DEP. Between 2003 and 2012 the Borough received these grants in only two years: $1,499 in 2005
for a total reported 198 tons and $5,098 in 2012 for a reported 890 tons. To obtain the maximum
income from the 904 Performance Grant program, the Borough must: submit timely, thorough and
accurate tonnage reports to the Allegheny County Recycling Coordinator; maintain compliance with
PA Act 101; and, submit timely, thorough and accurate applications to PA DEP. A spreadsheet for the
Borough to estimate how 904 Performance Grant income could increase with increased diversion rates
is included as Appendix 3.
Revenue Sharing for Materials Collected
Revenue sharing is a contractual system in which a municipality (or commercial hauler) receives
income from a MRF for every ton of recyclables delivered. While Performance Grants can provide
some income to the program, revenue sharing offers the potential for significantly increased income. In
order to obtain maximum income from revenue sharing, the Borough needs to contact MRFs that
operate in Allegheny County, request composition analysis and bids from each, based on the most
financially-beneficial mix of materials; and negotiate towards the best possible contract. The following
is the contact information for two of the largest MRF’s currently operating in Allegheny County:
Green Star Recycling: 4100 Grand Ave, Neville Island, PA 15225.
Scott Dellinger, Sales Manager (412) 250-0275 x 3807 [email protected]
Pittsburgh Recycling Services, Inc: 50 Vespucius Street, Pittsburgh, PA 15207.
Mike Lyons, Plant Manager (412) 589-7325. [email protected]
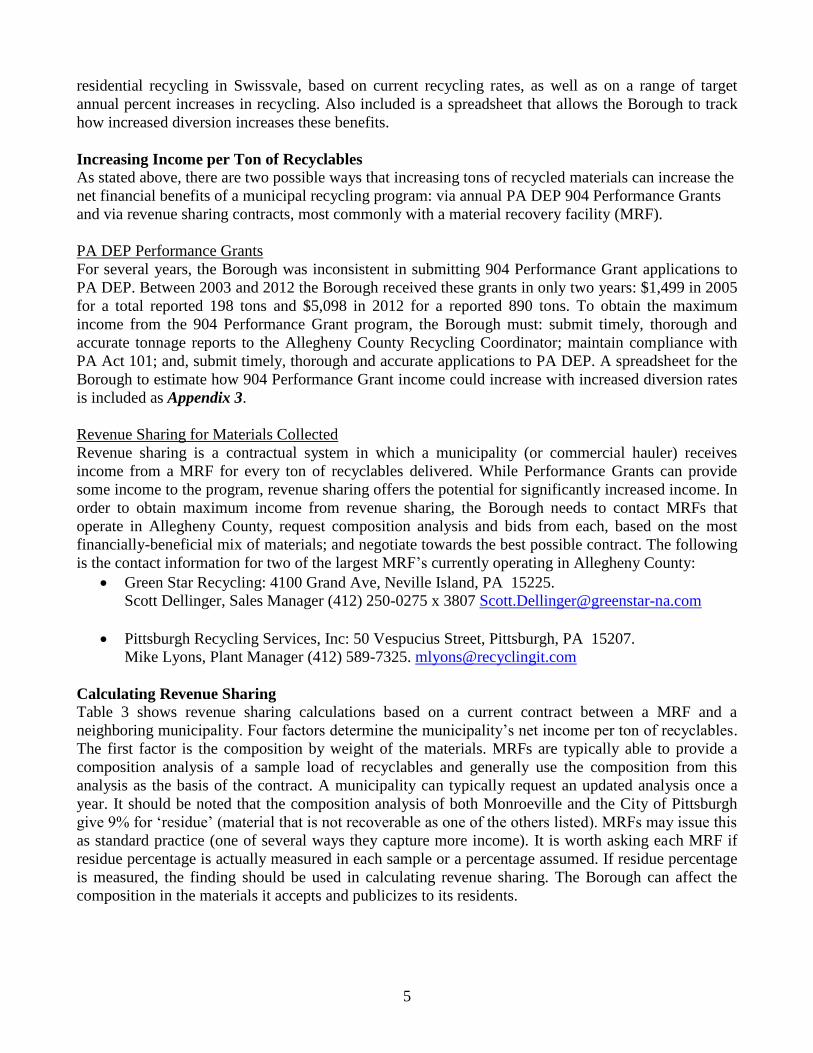
Calculating Revenue Sharing
Table 3 shows revenue sharing calculations based on a current contract between a MRF and a
neighboring municipality. Four factors determine the municipality’s net income per ton of recyclables.
The first factor is the composition by weight of the materials. MRFs are typically able to provide a
composition analysis of a sample load of recyclables and generally use the composition from this
analysis as the basis of the contract. A municipality can typically request an updated analysis once a
year. It should be noted that the composition analysis of both Monroeville and the City of Pittsburgh
give 9% for ‘residue’ (material that is not recoverable as one of the others listed). MRFs may issue this
as standard practice (one of several ways they capture more income). It is worth asking each MRF if
residue percentage is actually measured in each sample or a percentage assumed. If residue percentage
is measured, the finding should be used in calculating revenue sharing. The Borough can affect the
composition in the materials it accepts and publicizes to its residents.
6
Table 3: Sample Calculation of Revenue Sharing
Material
% Recovered
Market Price per Ton
Total Revenue per Ton
Aluminum 2% $ 1,315.00 $ 26.30
Steel 8% $ 240.00 $ 19.20
#1 plastic 7% $ 120.00 $ 8.40
#2 plastic 6% $ 120.00 $ 7.20
Mixed Glass 22% $ (16.00) $ (3.52)
Newspaper 29% $ 130.00 $ 37.70
Mixed paper 10% $ 120.00 $ 12.00
Corrugated 7% $ 165.00 $ 11.55
Residue 9% $ (40.00) $ (3.60)
TOTAL 100% $ 115.23
Processing Costs/Ton $ 66.50
Profit/Ton $ 48.73
% of Profit to Municipality 60%
% of Profit to MRF 40%
Borough Net Income/Ton $ 29.24
The composition affects net income per ton via the second factor: the most current market price for
each material. Two of the most common sources of material pricing are the Yellow Sheet of the
Chicago Board of Trade and Recycling Markets Limited. Each publish and make available on-line (to
subscribers) weekly high, low and average pricing for a wide range of recyclable materials for several
US regions. The local MRFs use the Midwest/Chicago Region. The contract should specify the level of
pricing: high is the most common reference, and should certainly be expected. Three things are striking
from the above (based on Summer 2012 pricing): aluminum is priced higher than any other material;
most plastic and fiber materials are in the same basic pricing range; and, residue and glass are currently
given negative pricing. The negative pricing of mixed glass is discussed below.
When the percentage weight contribution of each material is multiplied by its current pricing, the result
is the material’s contribution to each ton of mixed materials delivered (last column). When this column
is summed the result is the total value per ton of the mix to the MRF (in the above, $115.23). The MRF
deducts a per ton processing cost, the third key factor. The lower this charge, the more revenue is
available to the municipality. In current contracts, Monroeville is charged $66.50 per ton for
processing and the City of Pittsburgh is charged $65.00.
When the per-ton processing costs are subtracted from the per-ton value of the materials, the per-ton
profit for the materials is calculated. This figure is divided between the MRF and the municipality
according to percentages specified in the contract. This is the fourth and final key factor: the greater
the percentage to the municipality, the greater the income. In current contracts, Monroeville receives
60% of the per-ton profit and the City of Pittsburgh receives 80%. In negotiations over revenue
sharing, the Borough should bear in mind that larger sources typically command better terms.
Decisions Posed by Revenue Sharing
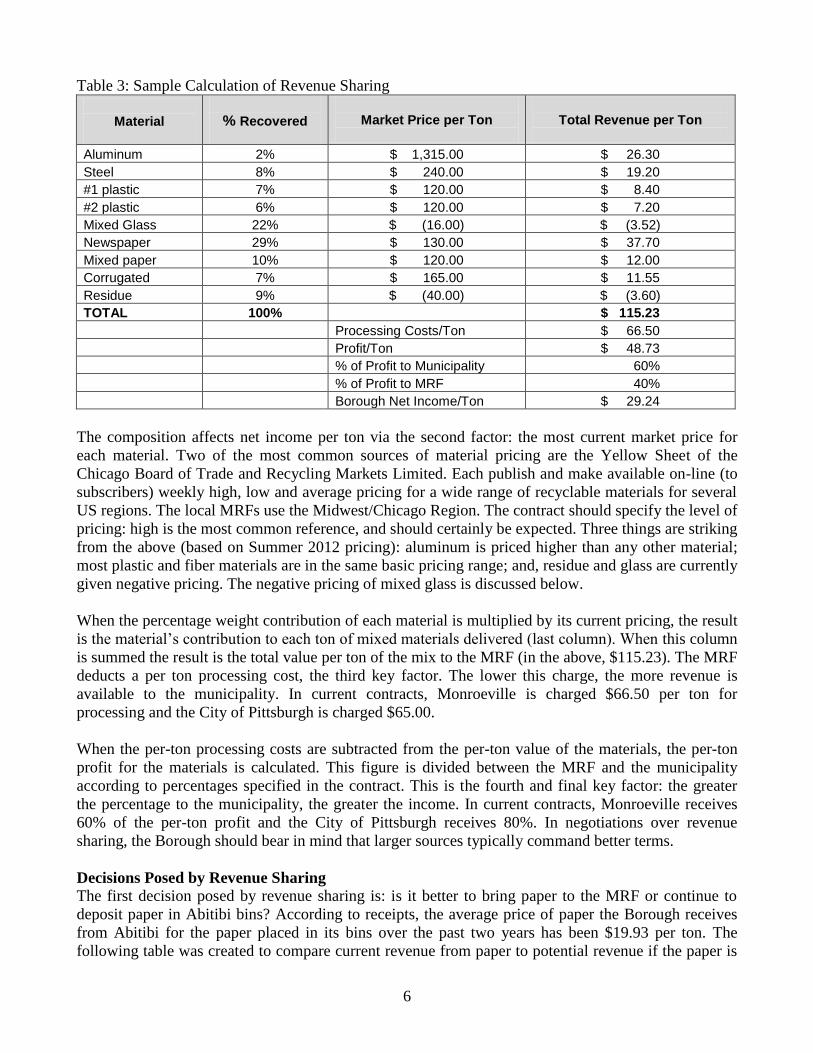
The first decision posed by revenue sharing is: is it better to bring paper to the MRF or continue to
deposit paper in Abitibi bins? According to receipts, the average price of paper the Borough receives
from Abitibi for the paper placed in its bins over the past two years has been $19.93 per ton. The
following table was created to compare current revenue from paper to potential revenue if the paper is
7
delivered to a contracted MRF. Net income per ton to the Borough in Table 4 is estimated at 60% of
the revenue per ton as demonstrated in Table 3.
Table 4: Estimating per ton income from Revenue Sharing with a MRF
Material
% Recovered Market Price Total Revenue
per ton Processing
Costs Revenue per ton
Net income per ton
ONP 76.06% $ 130.00 $ 98.88
Mixed Paper 14.94% $ 120.00 $ 17.93
Residue 9% $ (40.00) $ (3.60)
Total 100.00% $ 113.21 $ 66.50 $ 46.71 $28.02
According to this table, a contract with a MRF could provide the Borough an additional $8 per ton of
paper (mixed + newspaper) over current Abitibi rates. Based on the average paper tonnage per year
over 2010-2012 (78.9), this would give the Borough an additional $638 in revenue per year. This
estimated benefit does not include savings in both staff hours and diesel costs in avoided trips to the
Abitibi dumpsters.
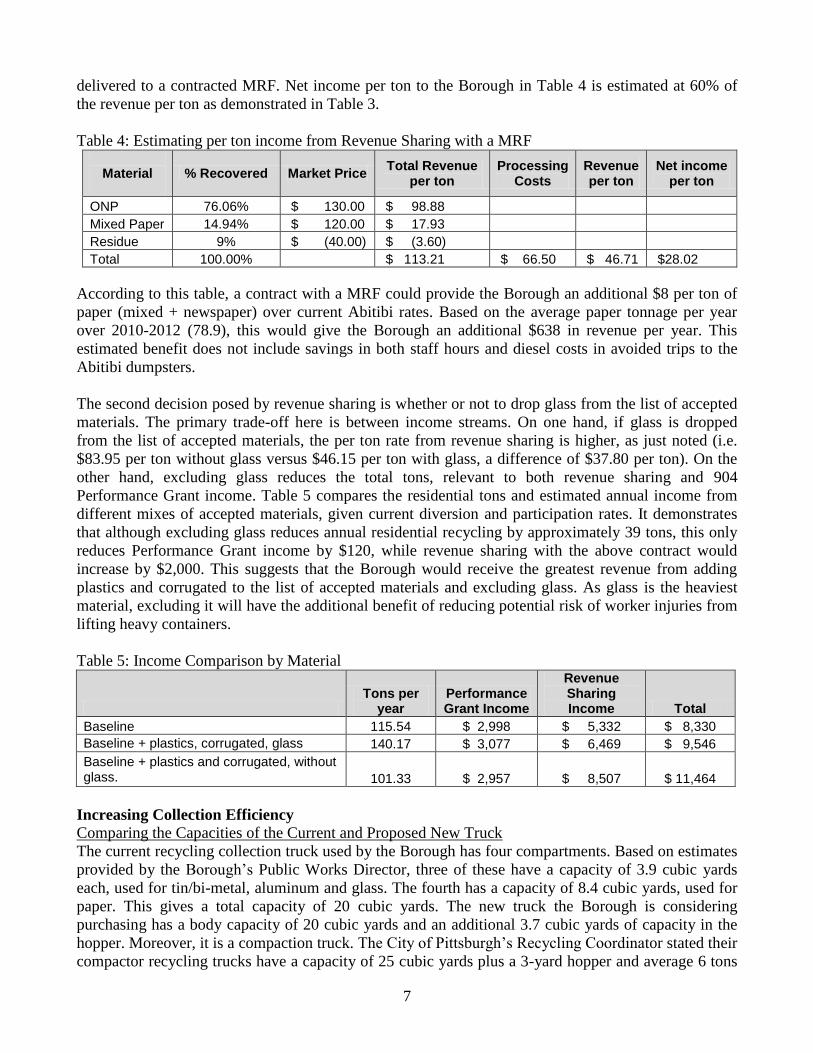
The second decision posed by revenue sharing is whether or not to drop glass from the list of accepted
materials. The primary trade-off here is between income streams. On one hand, if glass is dropped
from the list of accepted materials, the per ton rate from revenue sharing is higher, as just noted (i.e.
$83.95 per ton without glass versus $46.15 per ton with glass, a difference of $37.80 per ton). On the
other hand, excluding glass reduces the total tons, relevant to both revenue sharing and 904
Performance Grant income. Table 5 compares the residential tons and estimated annual income from
different mixes of accepted materials, given current diversion and participation rates. It demonstrates
that although excluding glass reduces annual residential recycling by approximately 39 tons, this only
reduces Performance Grant income by $120, while revenue sharing with the above contract would
increase by $2,000. This suggests that the Borough would receive the greatest revenue from adding
plastics and corrugated to the list of accepted materials and excluding glass. As glass is the heaviest
material, excluding it will have the additional benefit of reducing potential risk of worker injuries from
lifting heavy containers.
Table 5: Income Comparison by Material
Tons per
year Performance Grant Income
Revenue Sharing Income Total
Baseline 115.54 $ 2,998 $ 5,332 $ 8,330
Baseline + plastics, corrugated, glass 140.17 $ 3,077 $ 6,469 $ 9,546
Baseline + plastics and corrugated, without glass. 101.33 $ 2,957 $ 8,507 $ 11,464
Increasing Collection Efficiency
Comparing the Capacities of the Current and Proposed New Truck
The current recycling collection truck used by the Borough has four compartments. Based on estimates
provided by the Borough’s Public Works Director, three of these have a capacity of 3.9 cubic yards
each, used for tin/bi-metal, aluminum and glass. The fourth has a capacity of 8.4 cubic yards, used for
paper. This gives a total capacity of 20 cubic yards. The new truck the Borough is considering
purchasing has a body capacity of 20 cubic yards and an additional 3.7 cubic yards of capacity in the
hopper. Moreover, it is a compaction truck. The City of Pittsburgh’s Recycling Coordinator stated their
compactor recycling trucks have a capacity of 25 cubic yards plus a 3-yard hopper and average 6 tons
8
per full load or route. This gives an average post-compaction density of approximately 460 pounds per
cubic yard. With this compacted density, it is estimated that the proposed new truck would have a full-
load capacity of 5.5 tons. Current average per-day loads in Swissvale are 925 pounds.
The above analysis suggests the following: 1) the existing truck is not currently being used to capacity
as staff needs to deposit paper before the other bins are filled; 2) the proposed new truck has an even
greater capacity with its single compartment and its compactor [if current weekly collections were
continued and diversion tons did not increase, the new truck would be less than 10% full even if the
Borough continues collecting glass (925 pounds = 0.46 tons, or 8% of 5.5 tons)]; and, 3) The Borough
has the option, especially with the new truck, of collecting recyclables once every two weeks, thereby
recognizing potential savings in both labor and vehicle operation costs.
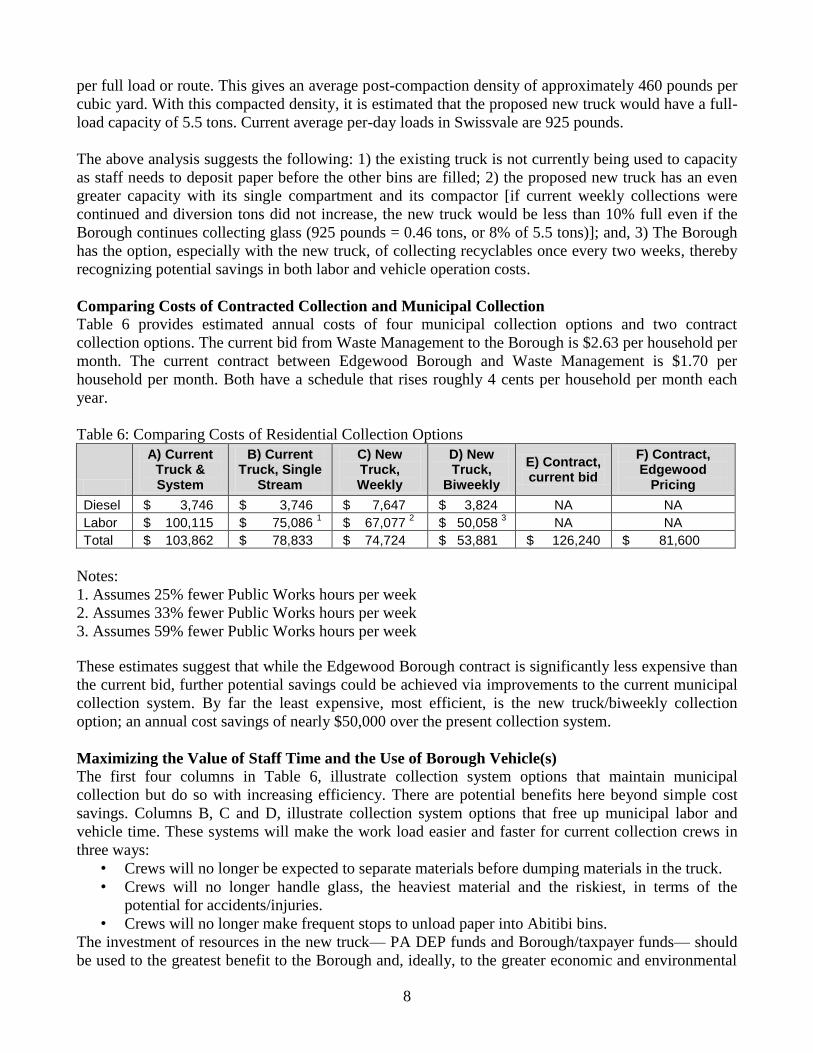
Comparing Costs of Contracted Collection and Municipal Collection
Table 6 provides estimated annual costs of four municipal collection options and two contract
collection options. The current bid from Waste Management to the Borough is $2.63 per household per
month. The current contract between Edgewood Borough and Waste Management is $1.70 per
household per month. Both have a schedule that rises roughly 4 cents per household per month each
year.
Table 6: Comparing Costs of Residential Collection Options
A) Current Truck & System
B) Current Truck, Single
Stream
C) New Truck, Weekly
D) New Truck,
Biweekly
E) Contract, current bid
F) Contract, Edgewood
Pricing
Diesel $ 3,746 $ 3,746 $ 7,647 $ 3,824 NA NA
Labor $ 100,115 $ 75,086 1 $ 67,077
2 $ 50,058
3 NA NA
Total $ 103,862 $ 78,833 $ 74,724 $ 53,881 $ 126,240 $ 81,600
Notes:
1. Assumes 25% fewer Public Works hours per week
2. Assumes 33% fewer Public Works hours per week
3. Assumes 59% fewer Public Works hours per week
These estimates suggest that while the Edgewood Borough contract is significantly less expensive than
the current bid, further potential savings could be achieved via improvements to the current municipal
collection system. By far the least expensive, most efficient, is the new truck/biweekly collection
option; an annual cost savings of nearly $50,000 over the present collection system.
Maximizing the Value of Staff Time and the Use of Borough Vehicle(s)
The first four columns in Table 6, illustrate collection system options that maintain municipal
collection but do so with increasing efficiency. There are potential benefits here beyond simple cost
savings. Columns B, C and D, illustrate collection system options that free up municipal labor and
vehicle time. These systems will make the work load easier and faster for current collection crews in
three ways:
• Crews will no longer be expected to separate materials before dumping materials in the truck.
• Crews will no longer handle glass, the heaviest material and the riskiest, in terms of the
potential for accidents/injuries.
• Crews will no longer make frequent stops to unload paper into Abitibi bins.
The investment of resources in the new truck— PA DEP funds and Borough/taxpayer funds— should
be used to the greatest benefit to the Borough and, ideally, to the greater economic and environmental
9
benefit of the municipal recycling program. If the Borough decides to purchase the new truck, it might
be advisable to stay with existing days and routes, but switch to biweekly collection. There is
significant variability between days. Reviewing per day weight slips for 2010, 2011 and the first nine
months of 2012, on the heaviest day (Monday), Public Works staff collects on average 2.18 times the
amount of material they collect on the lightest day (Wednesday). While participation surveys on
Swissvale routes have not been performed recently, information gathered from a participation survey
from a neighboring community, Wilkinsburg, was utilized for comparison. It was found that a route
ranked as heaviest by collection crews had 2.3 times the average weight as materials on the route they
ranked as lightest. The participation survey revealed that on the heavier route, 68% of all occupied
households put out recyclables, while on the lightest route, only 26% of occupied households put out
recyclables.
The Borough should take steps to encourage residents to increase their recycling participation. The
lighter the day’s route, the more these households need reminders to recycle. In lower participation
areas the Borough could provide reminders via affixing small placards, or door hangers, to the front
doorknobs of non-participating households.
Two possible options to maximize the efficiency and use of the existing labor and truck are as follows.
First, consider offering recycling collection to commercial businesses in the Borough. These
businesses could be serviced as part of existing residential routes with minimal extra labor and vehicle
costs to the Borough. A second possible option would be to offer to explore a multi-municipal
agreement to provide contract residential curbside collections to a neighboring Borough of roughly the
same, or similar, size. Two neighboring municipalities that currently contract for curbside recycling
collection are Edgewood (with 2010 population of 1,680, and 608 occupied households, according to
the US Census) and Forest Hills (with a 2010 population of 6,518 and 3,304 occupied households).
Offering a per-household per month collection rate of $1.60 would save Edgewood about $1,500 per
year and Forest Hills about $8,000 per year (compared to current collection contracts).
Increasing Recycling
There continue to be environmental benefits to recycling (summarized in Appendix 1). Recycling is
one of the easiest ways the average person can have a positive impact on the environment and is one
factor that motivates people to recycle. Increasing recycling (per week, month or year) increases these
environmental benefits from each household, from each block, and from the entire municipality. If
revenue sharing and PA DEP 904 Performance Grants are pursued carefully and diligently, increasing
recycling rates can also increase the net financial benefits of the municipal program.
Ways to Increase Tons of Recycled Materials
There are three ways to increase the tons recycled. While only residential recycling is discussed in this
report, these hold true for commercial recycling as well.
Increase the range of materials that are accepted for residential recycling.
Currently, the Borough accepts aluminum, tin/bi-metal, glass, and mixed paper from residents, but
does not accept plastics or corrugated. Both of these materials are accepted in tonnages for PA DEP
904 Performance Grant applications and are accepted by, and revenue sharing may be obtained with,
one and or both of the local MRFs. The recycling of plastics and cardboard can add to the
environmental benefits of a recycling program.
In either the municipal or contract strategy, the range of acceptable materials can increase. In the
former, the truck that would be purchased is a single-stream vehicle. There are no separate
10
compartments for paper vs. glass, etc. In the latter, most local haulers currently offer single-stream
collections of recyclables. As discussed below, the Borough may decide not to accept all possible
recyclable materials if one or more cost significantly more to collect than the net revenue benefit.
Regardless of the decisions and efforts it makes in other aspects of the program, the Borough should
take steps to educate/inform residents about the expanded range of accepted materials as soon as it
determines the best mix of these accepted materials.
Increase the diversion rates of those who already recycle
Households who already recycle may not put out recycling for each curbside collection and/or may not
collect and put out the full range of materials accepted. The Borough might consider communications
to encourage expanded participation from currently recycling households (in the form of an annual
mailing, door-knob placard, or both) thanking them for their participation; informing them of both the
environmental and economic benefits of recycling; and reminding them of the full range of materials
that are currently accepted.
Increase the number of households who recycle (participation rate)
Every municipality has households which do not currently recycle or do not recycle regularly. Given
the Borough’s low residential tonnages, it is possible that less than one out of every five households
now recycle regularly. Targeting currently non-participating households with friendly and effective
communications should be a priority for the Borough. As stated above, affixing placards to doorknobs
of non-participating households might be a way to encourage participation.
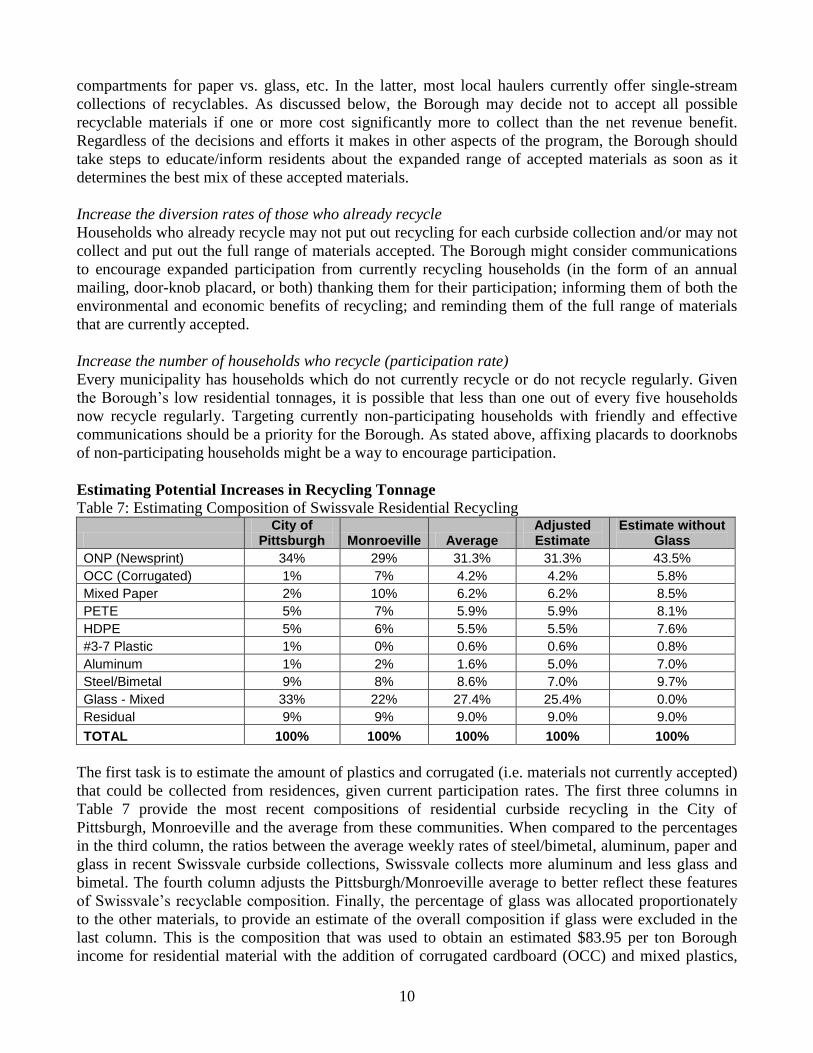
Estimating Potential Increases in Recycling Tonnage
Table 7: Estimating Composition of Swissvale Residential Recycling
City of
Pittsburgh Monroeville Average Adjusted Estimate
Estimate without Glass
ONP (Newsprint) 34% 29% 31.3% 31.3% 43.5%
OCC (Corrugated) 1% 7% 4.2% 4.2% 5.8%
Mixed Paper 2% 10% 6.2% 6.2% 8.5%
PETE 5% 7% 5.9% 5.9% 8.1%
HDPE 5% 6% 5.5% 5.5% 7.6%
#3-7 Plastic 1% 0% 0.6% 0.6% 0.8%
Aluminum 1% 2% 1.6% 5.0% 7.0%
Steel/Bimetal 9% 8% 8.6% 7.0% 9.7%
Glass - Mixed 33% 22% 27.4% 25.4% 0.0%
Residual 9% 9% 9.0% 9.0% 9.0%
TOTAL 100% 100% 100% 100% 100%
The first task is to estimate the amount of plastics and corrugated (i.e. materials not currently accepted)
that could be collected from residences, given current participation rates. The first three columns in
Table 7 provide the most recent compositions of residential curbside recycling in the City of
Pittsburgh, Monroeville and the average from these communities. When compared to the percentages
in the third column, the ratios between the average weekly rates of steel/bimetal, aluminum, paper and
glass in recent Swissvale curbside collections, Swissvale collects more aluminum and less glass and
bimetal. The fourth column adjusts the Pittsburgh/Monroeville average to better reflect these features
of Swissvale’s recyclable composition. Finally, the percentage of glass was allocated proportionately
to the other materials, to provide an estimate of the overall composition if glass were excluded in the
last column. This is the composition that was used to obtain an estimated $83.95 per ton Borough
income for residential material with the addition of corrugated cardboard (OCC) and mixed plastics,
11
but without glass. Using this final estimated composition, demonstrates how increasing residential
tonnages could affect annual municipal revenue. These findings are referenced in the next section.
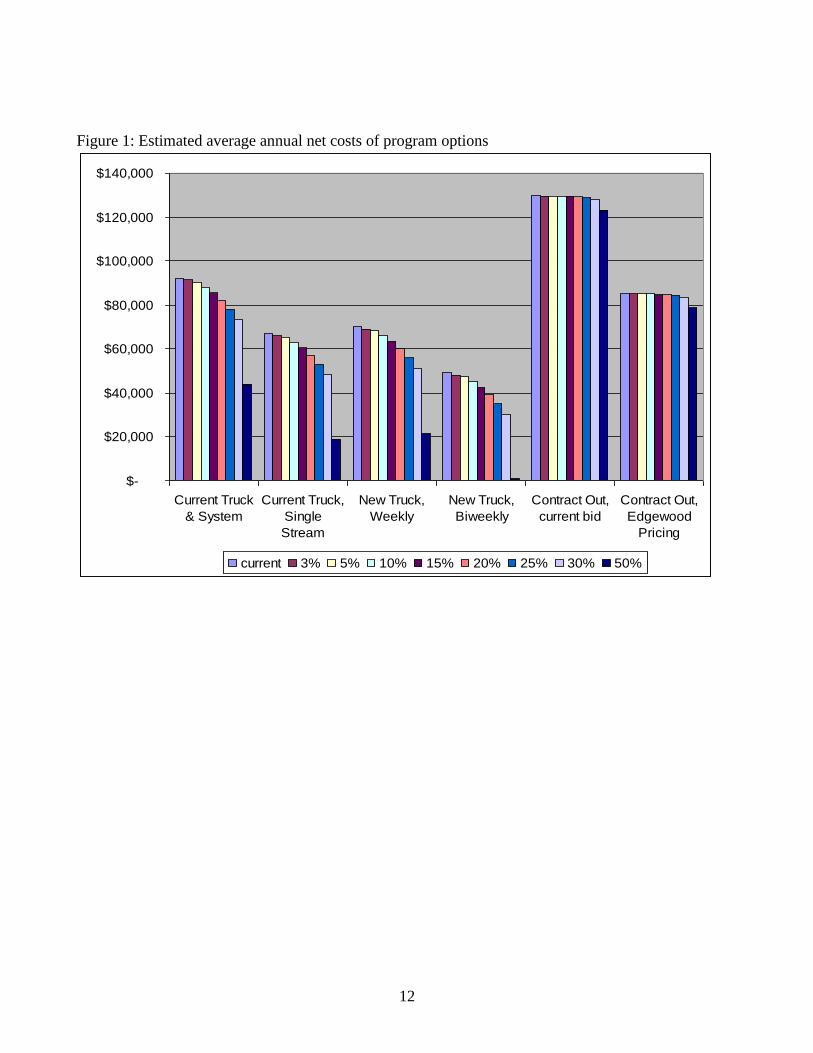
Comparing Potential Costs and Benefits
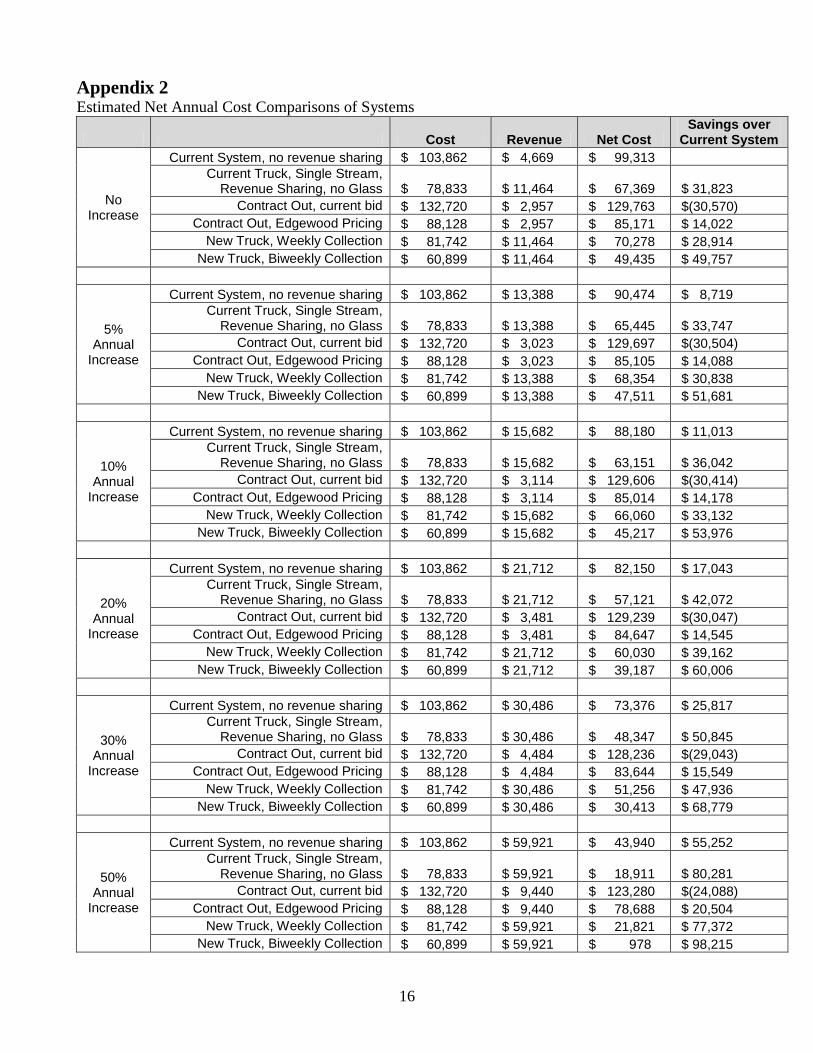
Appendix 2 provides an overall comparison of estimated net annual costs of Swissvale’s recycling
program across all of the options discussed in this report and across a range of targeted annual percent
increases of residential tons. These estimates are annual averages over five years, incorporating the
impacts of these varying rates of increase. The system with the greatest estimated annual savings over
the current system is the new truck, biweekly collection. Without complementary uses (Swissvale
commercial and/or neighboring municipality residential), this would provide estimated annual savings
over the current system ranging from $50,000 with no annual increase in tons to $98,000 (very close to
cost-neutral) with a 50% annual increase in tons. If complementary uses are included, cost-neutrality
could be achieved with more modest annual increases. The same is true after the first five years, in
which the Borough’s matching share of the new truck’s purchase price is recouped. Figure 1 presents
these in graphic form. Figure 2 presents these estimated annual costs for the two options utilizing the
new truck, after the Borough has recouped its matching funds for its purchase.
Summary of Options
A: Continue with Current Truck and System
The first option is for the Borough to make no changes to the current system. The current system
results in a very low recycling rate (about 5% compared to an average of 13% among mandated
municipalities in Allegheny County and a current PA DEP target of 35%) and very high net annual
costs (over $99,000).
B: Current Truck, single-stream, revenue-sharing, weekly
The Borough might consider keeping the current truck, but: a) entering into a revenue-sharing contract
with a MRF; and, b) shifting to a single-stream collection (no separation of materials). The first should
significantly increase program income; the second should reduce collection crew labor costs. Using the
current contract structure of a neighboring municipality, estimated composition (including corrugated
cardboard (OCC) and plastics, but excluding glass), current residential recycling rates, and bringing all
paper directly to the MRF, it is estimated that the Borough could gain $11,464 in annual income using
this option compared to $4,700 currently. Assuming a 25% increased efficiency in collection crew
labor by eliminating hand sorting of material, trips to Abitibi bins, and lifting glass, this presents a
potential annual cost savings of $25,000. The overall annual net cost benefit compared to the current
system is estimated at $31,800.
12
Figure 1: Estimated average annual net costs of program options
$-
$20,000
$40,000
$60,000
$80,000
$100,000
$120,000
$140,000
Current Truck
& System
Current Truck,
Single
Stream
New Truck,
Weekly
New Truck,
Biweekly
Contract Out,
current bid
Contract Out,
Edgewood
Pricing
current 3% 5% 10% 15% 20% 25% 30% 50%
13
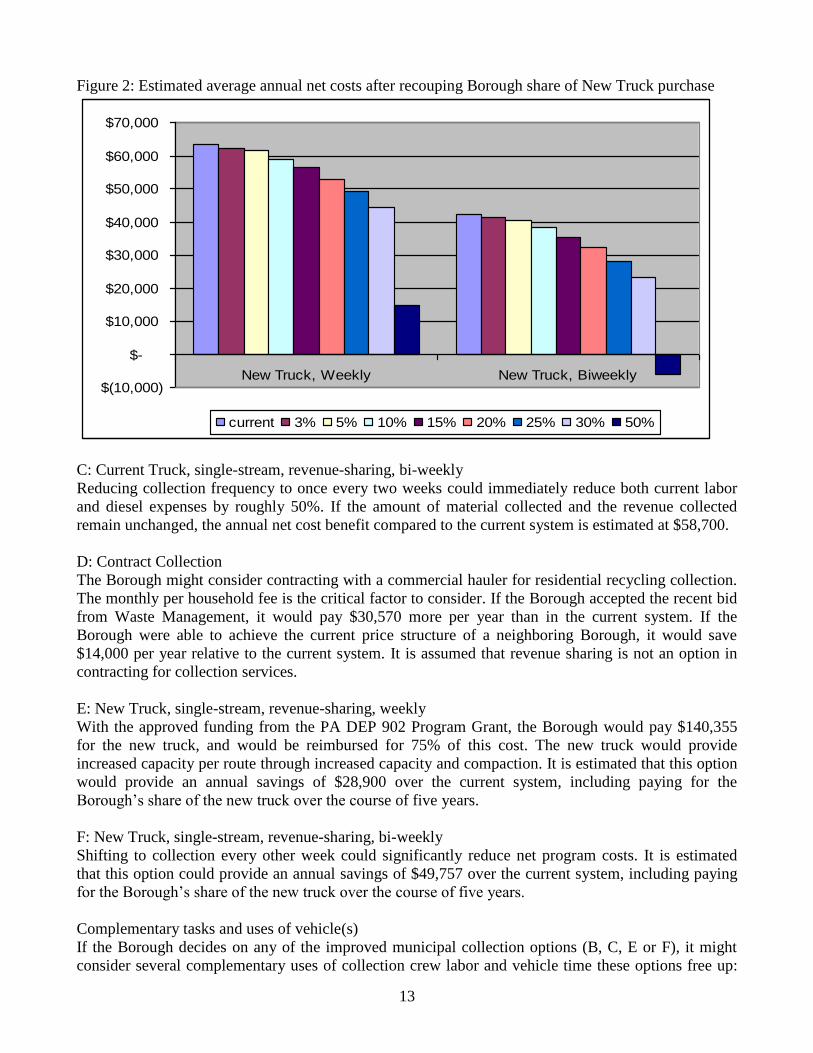
Figure 2: Estimated average annual net costs after recouping Borough share of New Truck purchase
$(10,000)
$-
$10,000
$20,000
$30,000
$40,000
$50,000
$60,000
$70,000
New Truck, Weekly New Truck, Biweekly
current 3% 5% 10% 15% 20% 25% 30% 50%
C: Current Truck, single-stream, revenue-sharing, bi-weekly
Reducing collection frequency to once every two weeks could immediately reduce both current labor
and diesel expenses by roughly 50%. If the amount of material collected and the revenue collected
remain unchanged, the annual net cost benefit compared to the current system is estimated at $58,700.
D: Contract Collection
The Borough might consider contracting with a commercial hauler for residential recycling collection.
The monthly per household fee is the critical factor to consider. If the Borough accepted the recent bid
from Waste Management, it would pay $30,570 more per year than in the current system. If the
Borough were able to achieve the current price structure of a neighboring Borough, it would save
$14,000 per year relative to the current system. It is assumed that revenue sharing is not an option in
contracting for collection services.
E: New Truck, single-stream, revenue-sharing, weekly
With the approved funding from the PA DEP 902 Program Grant, the Borough would pay $140,355
for the new truck, and would be reimbursed for 75% of this cost. The new truck would provide
increased capacity per route through increased capacity and compaction. It is estimated that this option
would provide an annual savings of $28,900 over the current system, including paying for the
Borough’s share of the new truck over the course of five years.
F: New Truck, single-stream, revenue-sharing, bi-weekly
Shifting to collection every other week could significantly reduce net program costs. It is estimated
that this option could provide an annual savings of $49,757 over the current system, including paying
for the Borough’s share of the new truck over the course of five years.
Complementary tasks and uses of vehicle(s)
If the Borough decides on any of the improved municipal collection options (B, C, E or F), it might
consider several complementary uses of collection crew labor and vehicle time these options free up:
14
communicating with residents to encouraging increased participation (e.g. via affixing door-knob
placards); servicing businesses within the Borough as part of residential collection routes; and/or in
servicing households in a neighboring municipality of comparable size via a contract between the
municipalities. Option B should increase recycling rates along with 904 Performance Grant and
revenue sharing income. Option C should increase municipal revenue through contracts, 904
Performance Grants and revenue sharing, and options E and F should increase revenue through
contracts and revenue sharing. If a revenue sharing contract is in place, the effective promotion of
residential recycling should, over the course of several years, offer annual net cost savings relative to
the current system.
Recommendations in Chronological Order
1) Approach each of the two MRFs (Pittsburgh Recycling Services and Greenstar Recycling) to
request a composition analysis of the Borough’s residential recycling and prepare a bid that includes
revenue sharing. Ask commercial haulers if they are willing to include revenue sharing. If they are, ask
them to submit a bid which includes revenue sharing. Place the resulting compositions and terms of
each bid into the appropriate cells in the recycling calculator included in Appendix 3 and identify the
one that offers the greatest revenue.
2) Decide if the Borough will continue municipal collections or opt for contracted collection services.
If the Borough decides to continue with municipal collections, select the better revenue sharing bid
from the two MRFs, and sign a contract. If the Borough decides to contract for collections, select the
best bid, and sign a contract.
If the Borough continues with municipal collection:
3) Decide if the Borough will proceed with purchase of the new recycling compactor truck.
4) Monitor the collection staff hours, truck mileage and tons collected over each of the five residential
routes in a single-stream collection, using either the old or the new truck.
5) Design two door-knob placards: one for households which currently recycle; the other for
households not currently recycling. Select one route for a pilot. Affix placards on the appropriate
doorknobs along the pilot route. Monitor the volume collected along this route over several weeks to
determine if there has been any significant increase since affixing placards. If there has been a
significant increase, affix appropriate placards along this route for another week about one month later
and along a second pilot route. Continue to monitor and expand this approach until each household has
received two placards over the course of a year.
6) Evaluate the costs and benefits of moving to biweekly collection, based on ongoing monitoring of
staff hours, truck mileage, tons collected and income generated.
7) Submit timely, accurate and thorough tonnage reports to the County Recycling Coordinator and
timely, accurate and thorough applications for PA DEP 904 Performance Grants.
8) Investigate the legality, economics and logistics of servicing Swissvale businesses and servicing
households in one or more neighboring municipalities. Consider offering either or both of these
services if there is adequate capacity, adequate interest, and if they offer net benefits to the Borough
and its program.
15
Appendix 1 Summary of Average Annual Environmental Benefits of Residential Recycling in Swissvale, for
current baseline and at various rates of annual percent increased tons (2014-2018)
Energy Savings Greenhouse Gas
Emissions Savings
Wood Fiber
Savings
Fresh Water
Savings
Air Pollution Savings
Rate of annual increase
Avg US cars
driving per year
equivalent
Lightbulbs on 24/7 all
year equivalent
Avg US cars
driving per year
equivalent
Acres Planted in
Forest equivalent
Spared Saplings grown for 10 years
Gallons of Fresh Water Saved
Pounds of Smog
Precursors (C2H4
equivalent)
baseline 52 1302 50 76 3424 2,936,228 239
3% 58 1467 57 85 3857 3,307,639 269
5% 63 1587 61 92 4172 3,577,505 291
10% 77 1924 74 112 5059 4,338,084 353
20% 111 2791 108 162 7338 6,292,868 512
30% 158 3980 154 231 10466 8,974,780 730
50% 308 7728 299 449 20319 17,424,678 1417
NOTE: The source of per ton energy savings and greenhouse gas savings benefits of recycling are
from the EPA WARM calculator.
http://www.epa.gov/climatechange/wycd/waste/calculators/Warm_home.html
The source for the other per ton environmental benefits of recycling are from an Australian study.
http://www.ecorecycle.vic.gov.au/resources/documents/Stage_2_Report_for_Life_Cycle_Assess_for_
Packaging_Waste_Mg.pdf.
16
Appendix 2 Estimated Net Annual Cost Comparisons of Systems
Cost Revenue Net Cost Savings over
Current System
No Increase
Current System, no revenue sharing $ 103,862 $ 4,669 $ 99,313
Current Truck, Single Stream, Revenue Sharing, no Glass $ 78,833 $ 11,464 $ 67,369 $ 31,823
Contract Out, current bid $ 132,720 $ 2,957 $ 129,763 $(30,570)
Contract Out, Edgewood Pricing $ 88,128 $ 2,957 $ 85,171 $ 14,022
New Truck, Weekly Collection $ 81,742 $ 11,464 $ 70,278 $ 28,914
New Truck, Biweekly Collection $ 60,899 $ 11,464 $ 49,435 $ 49,757
5% Annual
Increase
Current System, no revenue sharing $ 103,862 $ 13,388 $ 90,474 $ 8,719
Current Truck, Single Stream, Revenue Sharing, no Glass $ 78,833 $ 13,388 $ 65,445 $ 33,747
Contract Out, current bid $ 132,720 $ 3,023 $ 129,697 $(30,504)
Contract Out, Edgewood Pricing $ 88,128 $ 3,023 $ 85,105 $ 14,088
New Truck, Weekly Collection $ 81,742 $ 13,388 $ 68,354 $ 30,838
New Truck, Biweekly Collection $ 60,899 $ 13,388 $ 47,511 $ 51,681
10% Annual
Increase
Current System, no revenue sharing $ 103,862 $ 15,682 $ 88,180 $ 11,013
Current Truck, Single Stream, Revenue Sharing, no Glass $ 78,833 $ 15,682 $ 63,151 $ 36,042
Contract Out, current bid $ 132,720 $ 3,114 $ 129,606 $(30,414)
Contract Out, Edgewood Pricing $ 88,128 $ 3,114 $ 85,014 $ 14,178
New Truck, Weekly Collection $ 81,742 $ 15,682 $ 66,060 $ 33,132
New Truck, Biweekly Collection $ 60,899 $ 15,682 $ 45,217 $ 53,976
20% Annual
Increase
Current System, no revenue sharing $ 103,862 $ 21,712 $ 82,150 $ 17,043
Current Truck, Single Stream, Revenue Sharing, no Glass $ 78,833 $ 21,712 $ 57,121 $ 42,072
Contract Out, current bid $ 132,720 $ 3,481 $ 129,239 $(30,047)
Contract Out, Edgewood Pricing $ 88,128 $ 3,481 $ 84,647 $ 14,545
New Truck, Weekly Collection $ 81,742 $ 21,712 $ 60,030 $ 39,162
New Truck, Biweekly Collection $ 60,899 $ 21,712 $ 39,187 $ 60,006
30% Annual
Increase
Current System, no revenue sharing $ 103,862 $ 30,486 $ 73,376 $ 25,817
Current Truck, Single Stream, Revenue Sharing, no Glass $ 78,833 $ 30,486 $ 48,347 $ 50,845
Contract Out, current bid $ 132,720 $ 4,484 $ 128,236 $(29,043)
Contract Out, Edgewood Pricing $ 88,128 $ 4,484 $ 83,644 $ 15,549
New Truck, Weekly Collection $ 81,742 $ 30,486 $ 51,256 $ 47,936
New Truck, Biweekly Collection $ 60,899 $ 30,486 $ 30,413 $ 68,779
50% Annual
Increase
Current System, no revenue sharing $ 103,862 $ 59,921 $ 43,940 $ 55,252
Current Truck, Single Stream, Revenue Sharing, no Glass $ 78,833 $ 59,921 $ 18,911 $ 80,281
Contract Out, current bid $ 132,720 $ 9,440 $ 123,280 $(24,088)
Contract Out, Edgewood Pricing $ 88,128 $ 9,440 $ 78,688 $ 20,504
New Truck, Weekly Collection $ 81,742 $ 59,921 $ 21,821 $ 77,372
New Truck, Biweekly Collection $ 60,899 $ 59,921 $ 978 $ 98,215
17
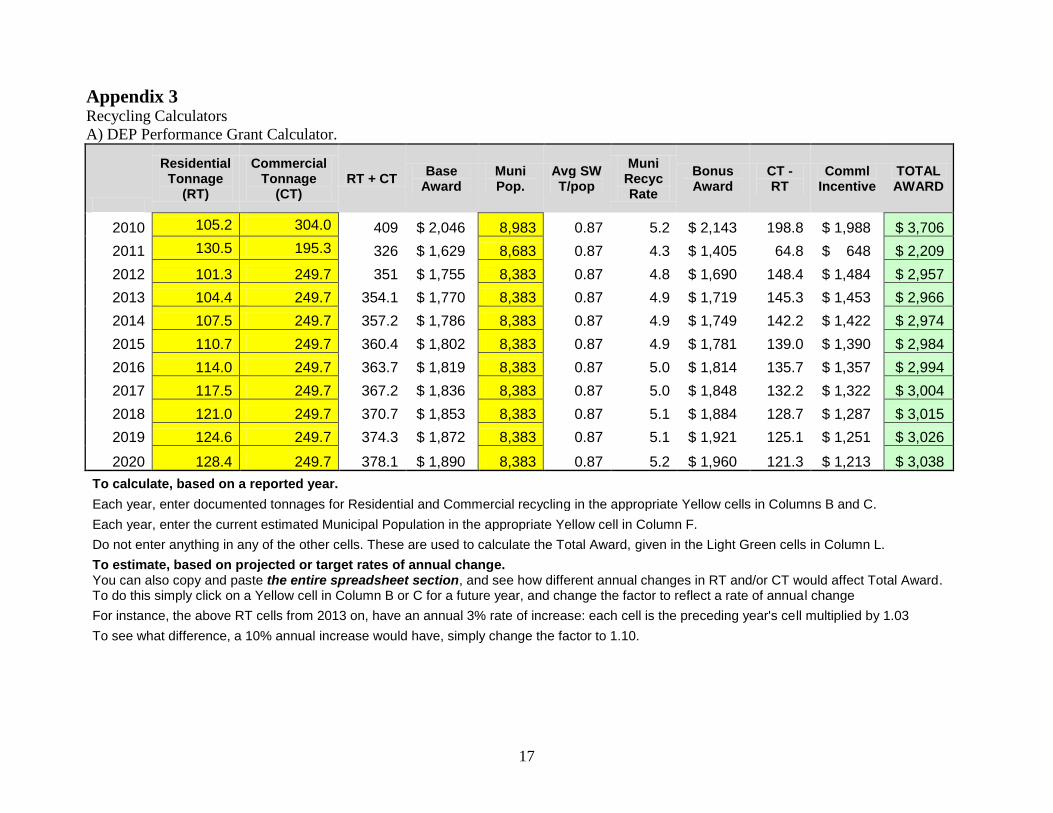
Appendix 3 Recycling Calculators
A) DEP Performance Grant Calculator.
Residential Tonnage
(RT)
Commercial Tonnage
(CT) RT + CT
Base Award
Muni Pop.
Avg SW T/pop
Muni Recyc Rate
Bonus Award
CT - RT
Comml Incentive
TOTAL AWARD
2010 105.2 304.0 409 $ 2,046 8,983 0.87 5.2 $ 2,143 198.8 $ 1,988 $ 3,706
2011 130.5 195.3 326 $ 1,629 8,683 0.87 4.3 $ 1,405 64.8 $ 648 $ 2,209
2012 101.3 249.7 351 $ 1,755 8,383 0.87 4.8 $ 1,690 148.4 $ 1,484 $ 2,957
2013 104.4 249.7 354.1 $ 1,770 8,383 0.87 4.9 $ 1,719 145.3 $ 1,453 $ 2,966
2014 107.5 249.7 357.2 $ 1,786 8,383 0.87 4.9 $ 1,749 142.2 $ 1,422 $ 2,974
2015 110.7 249.7 360.4 $ 1,802 8,383 0.87 4.9 $ 1,781 139.0 $ 1,390 $ 2,984
2016 114.0 249.7 363.7 $ 1,819 8,383 0.87 5.0 $ 1,814 135.7 $ 1,357 $ 2,994
2017 117.5 249.7 367.2 $ 1,836 8,383 0.87 5.0 $ 1,848 132.2 $ 1,322 $ 3,004
2018 121.0 249.7 370.7 $ 1,853 8,383 0.87 5.1 $ 1,884 128.7 $ 1,287 $ 3,015
2019 124.6 249.7 374.3 $ 1,872 8,383 0.87 5.1 $ 1,921 125.1 $ 1,251 $ 3,026
2020 128.4 249.7 378.1 $ 1,890 8,383 0.87 5.2 $ 1,960 121.3 $ 1,213 $ 3,038
To calculate, based on a reported year.
Each year, enter documented tonnages for Residential and Commercial recycling in the appropriate Yellow cells in Columns B and C.
Each year, enter the current estimated Municipal Population in the appropriate Yellow cell in Column F.
Do not enter anything in any of the other cells. These are used to calculate the Total Award, given in the Light Green cells in Column L.
To estimate, based on projected or target rates of annual change. You can also copy and paste the entire spreadsheet section, and see how different annual changes in RT and/or CT would affect Total Award. To do this simply click on a Yellow cell in Column B or C for a future year, and change the factor to reflect a rate of annual change
For instance, the above RT cells from 2013 on, have an annual 3% rate of increase: each cell is the preceding year's cell multiplied by 1.03
To see what difference, a 10% annual increase would have, simply change the factor to 1.10.
18
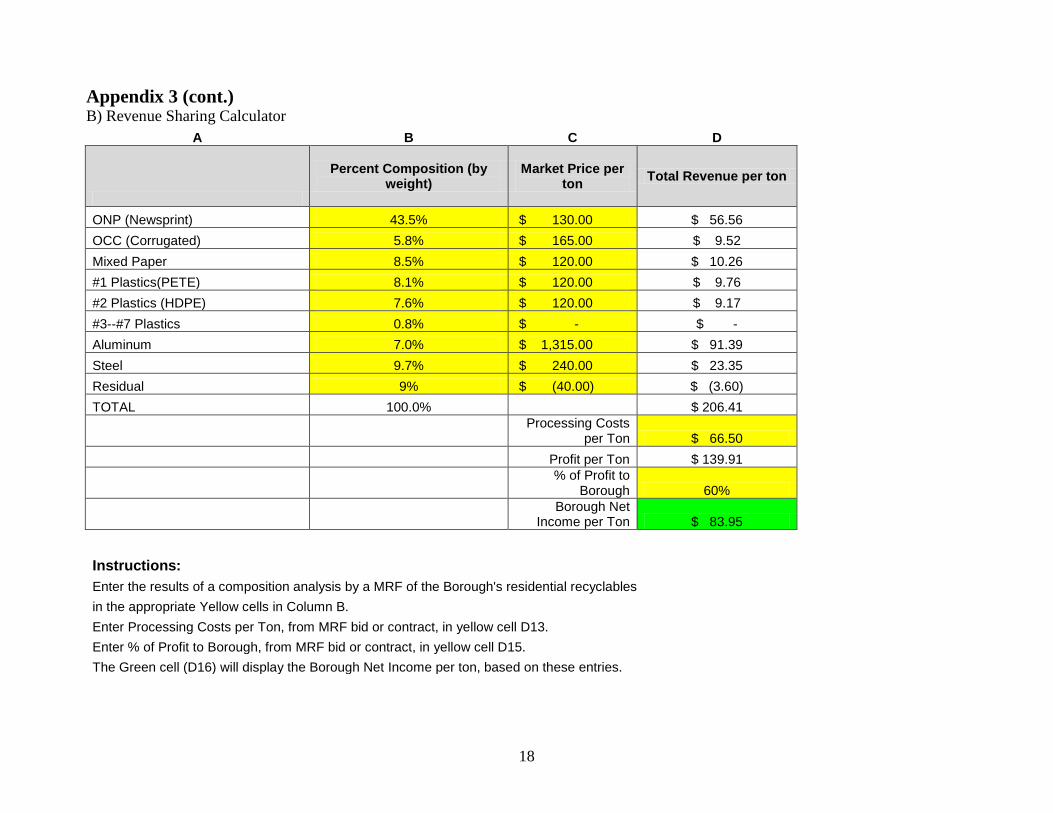
Appendix 3 (cont.) B) Revenue Sharing Calculator
A B C D
Percent Composition (by weight)
Market Price per ton
Total Revenue per ton
ONP (Newsprint) 43.5% $ 130.00 $ 56.56
OCC (Corrugated) 5.8% $ 165.00 $ 9.52
Mixed Paper 8.5% $ 120.00 $ 10.26
#1 Plastics(PETE) 8.1% $ 120.00 $ 9.76
#2 Plastics (HDPE) 7.6% $ 120.00 $ 9.17
#3--#7 Plastics 0.8% $ - $ -
Aluminum 7.0% $ 1,315.00 $ 91.39
Steel 9.7% $ 240.00 $ 23.35
Residual 9% $ (40.00) $ (3.60)
TOTAL 100.0% $ 206.41
Processing Costs
per Ton $ 66.50
Profit per Ton $ 139.91
% of Profit to
Borough 60%
Borough Net
Income per Ton $ 83.95
Instructions:
Enter the results of a composition analysis by a MRF of the Borough's residential recyclables
in the appropriate Yellow cells in Column B.
Enter Processing Costs per Ton, from MRF bid or contract, in yellow cell D13.
Enter % of Profit to Borough, from MRF bid or contract, in yellow cell D15.
The Green cell (D16) will display the Borough Net Income per ton, based on these entries.