Embed Size (px)
Citation preview

RECYCLING &SUSTAINABLEDEVELOPMENTRECIKLAŽA I ODRŽIVI RAZVOJ
Editor-in-Chief:
MILAN TRUMIĆ
Publisher:Technical Faculty in Bor, University of Belgrade, Serbia
Vol. 11 No. 1 (2018) www.rsd.tfbor.bg.ac.rs
RISSN 1820-7480
SD

RECYCLING & SUSTAINABLE DEVELOPMENT Journal info:
The Journal is issued one time a year, indexed and abstracted in Chemical Abstracts and SCIndeks, DOAJ digitally archived at the National Library of Serbia and in the Repository of SCIndeks - The Serbian Citation Index as the primary full text database.
ISSN 1820-7480 Print; ISSN 2560-3132 Online
www.rsd.tfbor.bg.ac.rs
Editor-in-Chief:
Milan Trumić
University of Belgrade, Technical Faculty in Bor Department of Mineral and Recycling Technologies V.J. 12, 19210 Bor, Serbia Phone/Fax: +381 30 421 749 E-mail: [email protected]
Field Editor: Waste processing and recycling technologies
Maja Trumić
University of Belgrade, Technical Faculty in Bor Department of Mineral and Recycling Technologies V.J. 12, 19210 Bor, Serbia Phone/Fax: +381 30 424 555 (186) E-mail: [email protected]
Field Editor: Environmental analysis and waste management
Nemanja Stanisavljević
University of Novi Sad, Faculty of Technical Sciences Department of Environmental Engineering and Occupational Safety and Health Trg Dositeja Obradovića 6, Novi Sad, Serbia Phone: +381 21 450 810 E-mail: [email protected]
Technical Editors:
Vladimir Nikolić
University of Belgrade, Technical Faculty in Bor Department of Mineral and Recycling Technologies V.J. 12, 19210 Bor, Serbia
Dragana Marilović
University of Belgrade, Technical Faculty in Bor Department of Mineral and Recycling Technologies V.J. 12, 19210 Bor, Serbia
Editorial Board:
Aleksandar Jovović, University of Belgrade, Faculty of Mechanical Engineering, Serbia
David Laner, University of Technology, Vienna, Austria
Dušan Stanojević, High Technology School of Professional Studies, Šabac, Serbia
Gábor Mucsi, University of Miskolc, Faculty of Earth Science & Engineering, Hungary
Publisher: Technical Faculty in Bor, University of Belgrade, Serbia
Print: EPOHA DOO, Požega, Serbia
Georgios N. Anastassakis, National Technical University of Athens (NTUA), School of Mining Engineering and Metallurgy, Greece
Goran Vujić, University of Novi Sad, Faculty of Technical Sciences, Serbia
Grozdanka Bogdanović, University of Belgrade, Technical Faculty in Bor, Serbia
Helena MVM Soares, University of Porto, Faculty of Engineering, Porto, Portugal
Hristina Stevanović Čarapina, EDUCONS University Sremska Kamenica, Faculty of Environmental Protection, Serbia
Ilhan Bušatlić, University of Zenica, Faculty of Metallurgy and Technology, Bosnia and Herzegovina
Irena Grigorova, University of Mining and Geology “St. Ivan Rilski”, Sofia, Bulgaria
Johann Fellner, University of Technology, Vienna, Austria
Ljubiša Andrić, Institute for Technology of Nuclear and other Raw Materials, Belgrade, Serbia
Maurício Leonardo Torem, Pontifical Catholic University of Rio de Janeiro, Brazil
Mile Dimitrijević, University of Belgrade, Technical Faculty in Bor, Serbia
Miodrag Žikić, University of Belgrade, Technical Faculty in Bor, Serbia
Nada Štrbac, University of Belgrade, Technical Faculty in Bor, Serbia
Neset Acarkan, Technical University of Istanbul, Faculty of Mines, Turkey
Slavomír Hredzák, Institute of Geotechnics of the Slovak Academy of Sciences, Slovak Republic
Snežana Milić, University of Belgrade, Technical Faculty in Bor, Serbia
Vlada Veljković, University of Niš, Faculty of Tachnology, Leskovac, Serbia
Xiaoming Wang, Chongqing University (CQU), Chongqing, China
Yamasue Eiji, Ritsumeikan University, Japan

RECYCLING & SUSTAINABLE
DEVELOPMENT
RECIKLAŽA I ODRŽIVI RAZVOJ
Editor-in-Chief:
MILAN TRUMIĆ
www.rsd.tfbor.bg.ac.rs
Journal Recycling & Sustainable Development is financially supported by the Ministry of Education,
Science and Technological Development, Republic of Serbia


Editor-in-Chief Recycling and Sustainable Development 11 (2018) i
i
Recycling and Sustainable Development
Special Issue Introduction
Introduction to the 10th Anniversary Issue of the
Recycling & Sustainable Development Journal
With the opening of this issue, we mark the 10th
anniversary of the journal of Recycling & Sustainable
Development (RSD).
Ten years ago, the first issue was launched on the basis
of the simple assumption that the authors of the articles
published in the Conference proceeding "Recycling
Technologies and Sustainable Development" would like
to have their expanded and revised articles published in
the journal within the same scientific field. In 2011, with
the change of Editor-in-Chief, the editorial policies
changed and the journal became a peer-reviewed journal
where original research articles, expended conference
articles and review articles have been published since.
Figures which show the number of online accesses,
downloads and citations have reached satisfied levels and
they continue to increase. Today, as we look back over
our first decade, we can see that the premise was correct.
Ten years is a long time but a short period for a new
journal and we thank all the dedicated researchers,
reviewers and editors who have powered this trajectory.
This special issue is composed of invited review
articles from a number of eminent authors, who have
surveyed a broad range of topics, with a special emphasis
on matters of current interest. We hope you will
appreciate these contributions, and enjoy the next decade
of the journal Recycling & Sustainable Development as
well.
I would like to take the opportunity of the fact that this
is our 10th anniversary issue to sincerely thank all those
members of the Editorial team who actively supported
RSD journal from its inception and contributed to the
high quality of our journal, both online and in printed
version.
Of course, all this is only achieved through hard work
and dedication of our Editorial board members and
reviewers who have unselfishly given their expertise and
time to peer-review manuscripts.
On behalf of the editorial and publication teams,
we wish a very happy 10th birthday to the RSD
Journal and we wish all our readers and colleagues a
very fruitful and happy New Year 2019 and hope that
the journal will continue on its way and become the
highest ranking journal in the scientific publication
world.
Editor-in-Chief
www.rsd.tfbor.bg.ac.rs
RSD Online ISSN 2560-3132 Print ISSN 1820-7480


Recycling and Sustainable Development 11 (2018) 1-7
Corresponding autor: [email protected]
doi: 10.5937/ror1801001H
Recycling and Sustainable Development
Functionalized geopolymers - a review
Nóra Halyag #, Gábor Mucsi
University of Miskolc, Institute of Raw Material Preparation and Environmental Processing, Hungary
A R T I C L E I N F O A B S T R A C T
Received 01 June 2018
Accepted 31 July 2018
Review Article
Keywords: Geopolymer
Alkali activated aluminosilicate
Geopolymer foam
Surface functionalization
1. Introduction
Geopolymers are amorhpous aluminosilicate materials
with three dimensional frameworks of SiO4 and AlO4
tetrahedra that can be produced by alkali activation even
at ambient temperature and low pressure. It was first
developed by Davidovits in 1978 (Davidovits, 1989).
After the mechanical activation (Kumar et al., 2017;
Mucsi et al., 2015; Temuujin et al., 2017) of the
aluminosilicate powder with appropriate parameters
(particle size distribution, specific surface area) it has to
be mixed with alkali solution (NaOH, KOH, water glass)
to produce amorphous gel-like substance that quickly
solidifie into hard geopolymer (Barbsa et al., 1999). This
alkali activated material possess excellent physical,
chemical and mechanical attribution such as low density,
micro and nanoporosity, high mechanical strength, heat
stability, fire resistance and chemical resistance.
Geopolymers can be prepared from reactive industrial
by-products: granulated blast furnace slag, iron ore
tailing, power station fly ash, slag, red mud and
agricultural waste (rice husk ash, palm fuel ash), from
primary raw material such as kaolin. After the suitable
geopolymer structure is balanced, geolopolymer foam
can be produced by adding foaming agent to the
geopolymeric gel (Kumar et al., 2017; Mucsi et al., 2015;
Temuujin et al., 2017), that can be used for various
purposes such as heat insulator material or adsorbing
material. The produced highly porous gepolymer foam
structure ensures active surfaces for adsorption of heavy
metals from aqueous solution due to the high specific
surface area and the surface bonded hydroxyl-groups due
to the alkali activation. This high specific surface area
can be chemically modified to produce more adsorption
site.
2. Functionalization
2.1. Factors influencing the mechanical properties
The quality of the geopolymers is influenced by the
amorphous nature of geopolymers (amount of
geopolymer gel), the type and concentration of alkali
activating solution, the ratio of the NaOH/ Na2SiO3, Si/Al
The geopolymer technology provides an alternative good solution for the
utilization of industrial waste and the preservation of primary minerals to produce
an economically valuable product that can be used for several purposes. This
review summarizes the preparation, the structure modifications and
functionalization of geopolymers for adsorbing purposes. The mechanical
performances of the geopolymers (compressive strength, flexural strength,
durability such as resistance to sulfate, acid, thermal effect) are the primary
concerns that depend on the chemical composition.
www.rsd.tfbor.bg.ac.rs
RSD Online ISSN 2560-3132 Print ISSN 1820-7480

N. Halyag and G. Mucsi Recycling and Sustainable Development 11 (2018) 1-7
2
Figure 1. Geopolymer synthesis (Zhuang, 2016)
ratio, water content in the mixture, the curing time and
temperature, the initial solid/liquid ratio, and the CaO
content of the raw material (Barbsa et al., 1999).
The final structure of the geopolymer is influenced by
the porosity depend on the composition of geopolymer.
The high Si/Al ratio increases the compressive strength
of the geopolymer that can be reached by adding
Na2SiO3, slag, rice husk ash and red mud. The addition
of water glass results in finer pore structure and lower
porosity. The silica fume makes the geopolymerisation
faster, decrease the porosity and increase the compressive
strength.
After the formation of geopolymer structure (Xu and
Van Deventer, 2000) having the appropriate mechanical
properties and a stable structure, the use of a special
chemical foaming agent can be used to produce a porous
geopolymer foam suitable for further use, which have a
high physical, chemical and mechanical properties to
ensure low density, high strength, heat stability,
depending on the parameters used in the production. To
produce macroporous geopolymer aluminium powder,
silicium powder (FeSi, SiC), sodium-perborat, sodium
hypochlorit (NaOCl) or hydrogen-peroxid react with the
alkali solution in which oxygen gas is formed.
The foam formation is based on the fact that H2O2 is
thermodynamically unstable and easily separates into
water and oxygen gas (Szabó et al., 2017). Increasing
H2O2 concentration increases the amount of oxygen
resulting in increased bubble formation, which is greatly
influenced by the pH of the solution. The pore size
distribution of the geopolymers depends on the hydrogen
peroxide separation reaction and the geopolymerization
reaction. Narrow pore size distribution improves
insulating ability, while the wider pore size interval leads
to complex air conduction channels and improves the
acoustic resistance of the foams. Varying amount of
foaming agent (1, 2, 4, 6 wt %) produces geopolymers
with varying pore size. The addition of 6 % H2O2 seems
to be an upper limit since H2O2 above this amount cause
the very porous structure to collapse (Palmero et al.,
2015). The created geopolymer foams can reach
relatively high compressive strength values 5.5 to 10.9
MPa, which is highly dependent on the liquid/solid ratio
and the added foaming agents, the increase of which
reduces the strength values, with lower density (0.4-1.2
g/cm3). Increasing H2O2 leads to decrease in density,
thermal conductivity, increase in macroporosity,
decrease in flexural and compressive strength values.
The porosity and specific surface of the geopolymer
foams can be increased by using the combined method of
saponification/peroxide/gelcasting (Cilla et al., 2014),
which is nowadays increasingly used for the production
and development of micro and mesoporous geopolymers
with high specific surface. According to the
saponification method sunflower oil react with the
alkaline geopolymer and results in the formation of
carboxylate surfactant (soap) molecules. This combined
method produces high porosity with open pores and with
regular morphology and spherical cells. Saponification
leads to the formation of smaller cells with fewer open
pores, while the use of peroxide leads to the formation of
large but predominantly closed cells. The advantage of
these method is that the open porosity can be increased
by approximately 10 %. The open pore morphology play
a significant role on the thermal conductivity and water
absorption of geopolymers.

N. Halyag and G. Mucsi Recycling and Sustainable Development 11 (2018) 1-7
3
Figure 2. Geopolymer foams with different a) Al content c1-c4=5, 10, 15, 20 mg Al powder, 100 ml alkali solution, c4=70 % porosity (Zhang et
al., 2014), b) H2O2 content, 1,2,4,6 wt %, H2O/Na2O=13 (Palmero et al., 2015)
Figure 3. The relation of the compressive strength, density, heat conductivity, macroporosity and the added Al powder (based on Rickard, 2013)
After the formation of a stable foam structure, the
surface of the pores can be modified with various
chemical compounds, which gives the properties of the
geopolymer matrix better. Previous studies have put great
emphasis on modifying the geopolymer matrix with
various organic compounds (Zhang et al., 2009; Ricciotti
et al., 2013) such as polyvinyl acetate, polypropylene,
polyvinyl alcohol or water soluble organic compounds.
In the geopolymerization process, the added organic
material interacts chemically with the geopolymer gel,
during which hydroxyl groups develop.
2.2. Heavy metal ion adsorption of the functionalized
geopolymer
Geopolymer preparation is a new technology for
the removal of heavy metal ions from
contaminated water. Different natural minerals
normally have lower adsorption capability that can be
increased by surface treatment due to the hydroxylation
of the waste (for example fly ash) that transforms the
non-porous hydrophobic material into mesoporous
hydrophilic material with a large number of ion exchange
sites. The heavy metal ion adsorption is performed on the
functionalized material through ion exchange and
physisorption processes due to the difference in chemical
potential between the light and heavy metal ions. One of
the most characteristic features of the inorganic polymers
is the exchangeable K+ and Ca2+ cations in the structure
that can be subsituted with heavy metal ions and can
migrate in the mesoporous structure of the
aluminosilicate material.
2.3. Metakaolin based geopolymer
Svingala and Varela (2009) used a mixture of
metakaolin and slag for geopolymer synthesis reaching
2.9-9.5 MPa compressive strength and 1.2 g/cm3
specimen density. The mechanical properties of the
geopolymers can be enhanced with chitosan and fibers,
such ash polypropylene, which improves the dehydration
resistance of the material at high temperature due to the
formation of hydrogen bonds that connects the formed
microcracks and delay the formation of them and fibers
can increase the permeability of the material at high
temperature. The foam structure was made from a

N. Halyag and G. Mucsi Recycling and Sustainable Development 11 (2018) 1-7
4
geopolymer matrix having an average compressive
strength of 54 MPa and a specimen density of 1.61 g/cm3.
The polypropylene fiber (1 wt %) was added to the
geopolymer with these parameters reduces the
compressive strength to 36 MPa. The addition of foam-
forming aluminium powder (Rickard et al., 2013) (0.02,
0.04, and 0.06 wt. %) changed the compressive strength
to 9.5 MPa, 7.9 MPa and 4.4 MPa with increasing
porosity and decreasing densities between 0.7 and 1
g/cm3. The higher amount of aluminium powder caused
increased presence of large pores. Without fibres the pore
structure was significantly unstable leading to pore
collapse after foam formation.
In metakaolin based geopolymers the evaporation of
large volumes of water added to the activating solution
leads to the formation of micro cracks, that can be
delayed by adding resin to the gel. The resin of 20 wt %
can increase the compressive strength up to 60 MPa.
Autef et al., (2012) investigated the source of silicon
and its effect on the formation of mechanical properties
(quartz or amorphous silicon) in the geopolymerization
process, according to which the growing amount of
amorphous material increases the formation of well-
consolidated geopolymer. The addition of amorphous
nano grain sized (0.5-2 wt %) SiO2 with 670 m2/g specific
surface area covered with hydroxyl surface (Autef et al.,
2012) to the metakaolin increased the compressive
strength from 58.9 MPa up to 71.1 MPa after 56 days.
Adsorbent material can be prepared from a mixture of
organic and inorganic substances where the linkage
between the organic sodium alginate and the inorganic
metakolin was ensured by Ca2+ with soaking the sample
into CaCl2 solution. The beneficial physical and chemical
properties of the organic material serve to improve the
adsorption capacity while the inorganic phase increases
the mechanical strength and heat stability. The adsorption
capacity of the produced blended material is 60.8 mg/g
(Yuanyuan et al., 2017).
Porous metakaolin (9.56 m2/g specific surface area)
based inorganic spheres can be formed by adding sodium
dodecyl suplhate and (K12) foaming agent (1.5 wt %).
According to the pore structure studies, BET indicates a
high specific surface area with mesoporous property
(53.95 m2/g), low density (0.79 g/cm3), 60 % porosity
that serves as an active surface for binding Cu2+, Pb2+,
Ca2+ and other ions. The adsorbed Cu(II) with the
increase the contact time reached a maximum of 34.5
mg/g.
Metakaolin-based geopolymer is also effective in the
removing of Ni2+ from aqueous solution (Yuanyuan et al.,
2015). The BET specific surface area is the highest at
H2O/Na2O=19 with 39.66 m2/g adsorption capacity and
18.67 MPa compressive strength. López et al., (2014)
produced metakaolin and rice husk based geopolymer
foams with 50.8 mg/g adsorption capacity.
Yousef et al., (2009) prepared metakaolin based
geopolymers with the addition of zeolitic tuff. The
resulting geopolymer has good mechanical properties
and adsorption capability for methylene-blue and Cu2+.
The affinity, the attractive force between the hydrated ion
and the metal is affected by the size of the hydrated
cation, the lower the hydrated radius, the greater the
affinity. According to the heavy metal adsorption studies,
the results are: Pb2+=86.2 mg/g, Cu2+=40.9 mg/g,
Cr3+=9.8 mg/g and Cd2+ =68.9 mg/g.
2.4. Fly ash based geopolymer
Yang et al., (2014) examined a mixture of fly ash and
high magnesium nickel slag (HMNS) with the activation
of Na2SiO3 (water glass), and stated that the HMNS was
functionalized as micro aggregate making smaller the
pores. Using 20 % HMNS results in 60 MPa compressive
strength. The results indicate that the higher the amount
of slag the higher the compressive strength that lead to
the formation of cracks due to the shrinkage of the slag.
By activating the mixture of fly ash and iron ore tailing
(30 wt % iron ore tailing) with multi-component alkali
solution, higher compressive strength values can be
achieved compared with the activation only in NaOH
solution. The result after the addition of H2O2 foaming
agent is a highly porous geopolymer foam showing
113.41 mg/g Cu2+ adsorption capacity at 40 °C and pH=6
(Duan et al., 2016).
According to recent researches, the geopolymer
made from rice husk ash and fly ash mixture can
be widely used as a functional material with
compressive strength of 15-20 MPa after 7 days.
Organic melamine resin given to the geopolymer
shows a good incorporation in the inorganic
geopolymer frame in nanometric scale, improving the
mechanical properties and thermal stability. The organic
phase provides physical reinforcement to the
geopolymer, improving mechanical stability and
reducing fracture. The silane-derived APTES also
improves the interaction between organic and inorganic
material, which in small amounts, also serves a
significant structural improvement of the substance,
because resin-containing panels are less rigid, thus
reduce the chance of fracture.
Al-Zboon et al., (2011) investigated the Pb2+
adsorption capacity of the fly ash based geopolymer that
produced 90.6 % removal efficiency compared to the
raw fly ash with 39.87 %. Lee et al., (2017) used a fly
ash/slag mixture with nano-crystalline zeolite to
investigate the cezium-adsorption capacity that reach
15.24 mg/g. This material possess high compressive
strength (16.57 MPa) and high specific surface area
(114.16 m2/g).
Fly ash based geopolymer (Javadian et al., 2015)
can be applied for removing cadmium nitrate from water.
For comparison, the adsorption capacity of Cd2+ by the
raw fly ash at pH=5 was 7 mg/g, while the fly ash based
geopolymer is 14.431 mg/g.

N. Halyag and G. Mucsi Recycling and Sustainable Development 11 (2018) 1-7
5
Figure 4. Surface functionalization (Hadi et al., 2016), fly ash and iron ore tailing without and with H2O2 (Duan et al., 2016)
2.5. Zeolite
For the construction of water storage facilities,
functionalized geopolymer can be prepared from the
mixture of zeolite tuff and kaolinite (Alshaaer et al.,
2016). The kaolinite-based geopolymer mixed with
zeolite tuff has high compressive strength, density and
adsoption capacity for cadmium. Zeolite as reactive filler
material may be involved in the geopolymerization
process as functional reactive fillers, so it is important to
properly investigate the geopolymers. The most
important test is to determine the optimal amount of
water to produce the geopolymer which provides
adequate mechanical properties for water retention and
high adsorption capacity for water purification. Zeolite
tuff increased the adsorption capacity of metakaolin
towards micro contaminants as a reactive filler. The
optimal amount of water is close to the plasticity limit for
high quality building materials.
After hydrothermal treatment, the geopolymer can be
transformed into faujasite, which has a nano-sized pore
structure and good heavy metal ion adsorption capability.
Zeolite consists of pores of a given size that pass through
certain metals, which allows for selective separation. The
Pb2+ at pH=3-6 adsorbed is 74.83 mg/g. The adsorption
capacity of faujasite (pH=3) is 143.3 mg/g, for
geopolymer is 118.6 mg/g. The increase in pH increases
the amount of adsorbed heavy metal ion. The best
adsorption capability was reached at pH=6 is 45 °C 152
mg/g.
Zeolite has a good adsorption ability to remove metals,
phosphates, ammonium and petroleum derivatives,
which can be enhanced by various modifications. The
adsorption nature of chitosan (Li et al., 2013) in
removing heavy metals and dyes is that the amino and
hydroxyl groups serve as active surfaces for heavy metal
ions. In the presence of higher amounts of H+ the surface
of the adsorbent is covered with protons, the decrease in
electrostatic attraction results in less adsorption.
Mesoporous silica modifies (Pizarro et al., 2015) the
surface properties of raw fly ash that can be
functionalized with 3-aminopropyl-triethoxysilane to
achieve better adsorption capacity of Cu2+. The specific
surface area of mesoporous silica modified and APTS -
functionalized fly ash is 415.25 m2/g.
According to the results (Duan et al., 2016) the porous
geopolymer Cu2+ removal efficiency is 90.7 %, while for
the reference geopolymer is only 33.9 % depending on
the pH. It ranges from pH=1 is 4.95 % to pH=5 is 93.5
%. Compared to the reference geopolymer and the porous
geopolymer, the adsorption trend is similar, but the
porous geopolymer exhibits higher values due to the
increased number of active surfaces.
3. Summary
Geopolymers can be prepared from different
aluminosilicate materials by alkali activation. The
mechanical properties of the geopolymers depend on
the chemical composition but it can be increased
by mixing different materials with different nature.
When compared with the initial raw material,
the synthesized geopolymer foams showed a
great number of active sites with large specific
surface area due to the porous structure.
The geopolyemer with appropriate attribution can be
functionalized as a highly porous geopolymer foam
structure for which its high specific surface area can be
increased by adding nano-silica or after chemical
modifications. The adsorption can be enhanced by
modifications. The so-produced geopolymer foams with
large specific surface area are suitable for the adsorption
of heavy metals from aqueous solution. The produced
geopolymer foams are not flammable and possess low
thermal conductivity.
Acknowledgments
The described work/article was carried out as part of
the „Sustainable Raw Material Management Thematic

N. Halyag and G. Mucsi Recycling and Sustainable Development 11 (2018) 1-7
6
Network – RING 2017”, EFOP-3.6.2-16-2017-00010
project in the framework of the Széchenyi2020 Program.
The realization of this project is supported by the
European Union, co-financed by the European Social
Fund.
References
Alshaaer M., El-Eswed B., Yousef R. I., Khalili F.,
Rahier H., Development of functional geopolymers
for water purification, and construction purposes,
Journal of Saudi Chemical Society, 20, 2016, 585-
592,
Al-Zboon K., Al-Harahsheh M. S., Hani F. B., Fly ash-
based geopolymer for Pb removal from aqueous
solution, Journal of Hazardous Materials, 188 (1-3),
2011, 414-421,
Autef E., Joussein G., Gasgnier S., Rossignol S., Role of
the silica source on the geopolymerization rate,
Journal of Non-Crystalline Solids, 358 (21), 2012,
2886-2893,
Barbsa V. F. F., MacKenzie K. J. D., Thaumaturgo C. D.,
Synthesis and Characterization of sodium polysialate
inorganic polymer based on alumina and silica,
Proceedings - '99 Geopolymer International
Conference, 2nd ed., Saint-Quentin, France, June 30
- July 2, 1999, 65-78, Editors: Davidovits J. and
Orlinski J., Publisher: Geopolymer Institute, Saint-
Quentin, France, ISBN: 2902933142 9782902933143
Cilla M. S., Morelli M. R., Colombo, P., Open cell
geopolymer foams by a novel
saponification/peroxide/gelcasting combined route,
Journal of the European Ceramic Society, 34, 2014,
3133-3137,
Davidovits J., Geopolymers and geopolymeric new
materials, Journal of thermal analysis, 35 (2), 1989,
429-441,
Duan P., Yan C., Zhou W., Ren D., Development of fly
ash and iron ore tailing based porous geopolymer for
removal of Cu (II) from wastewater, Ceramics
International, 42, 2016, 13507-13518,
Hadi P., Kubicki C. N. J. D., Mueller K., Fagan J. W.,
Luo Z., Weng L., McKay G., Sustainable
development of a surface-functionalized mesoporous
aluminosilicate with ultra-high ion exchange
efficiency, Inorganic Chemistry Frontiers, 3 (4),
2016, 502-513,
Javadian H., Ghorbani F., Tayebi H., Hosseini S. F.,
Study of the adsorption of Cd (II) from aqueous
solution using zeolite-based geopolymer, synthesized
from coal fly ash; kinetic, isotherm and
thermodynamic studies, Arabian Journal of
Chemistry, 8 (6), 2015, 837-849,
Kumar S., Mucsi G., Kristály F., Pekker P., Mechanical
activation of fly ash and its influence on micro and
nano-structural behaviour of resulting geopolymers,
Advanced Powder Technology, 28 (3), 2017,
805-813,
Lee N. K., Khalid H. R., Lee H. K., Adsorption
characteristics of cesium onto mesoporous
geopolymers containing nano-crystalline zeolites,
Microporous and Mesoporous Materials, 242, 2017,
238-244,
Li Z., Chen R., Zhang L.Y., Utilization of chitosan
biopolymer to enhance fly ash-based geopolymer,
Journal of Materials Science, 48 (22), 2013, 7986-
7993,
López F. J., Sugita S., Tagaya M., Kobayashi T.,
Geopolymers Using Rice Husk Silica and Metakaolin
Derivatives; Preparation and Their Characteristics,
Journal of Materials Science and Chemical
Engineering, 2 (5), 2014, 35-43,
Mucsi G., Kumar S., Csőke B., Kumar R., Molnár Z.,
Rácz Á., Mádai F., Debreczeni Á., Control of
geopolymer properties by grinding of land filled fly
ash, International Journal of Mineral Processing, 143,
2015, 50-58,
Palmero P., Formia A., Antonacib P., Brinic S., Tulliani
J. M., Geopolymer technology for application-
oriented dense and lightened materials. Elaboration
and characterization, Ceramics International, 41 (10,
Part A), 2015, 12967-12979,
Pizarro J., Castillo X., Jara S., Ortiz C., Navarro P., Cid
H., Rioseco H., Barros D., Belzile N., Adsorption of
Cu2+ on coal fly ash modified with functionalized
mesoporous silica, Fuel, 156, 2015, 96-10,
Ricciotti L., Roviello G., Tarallo O., Borbone F., Ferone
C., Colangelo F., Synthesis and characterizations of
melamine-based epoxy resins, International Journal
of Molecular Sciences, 14 (9), 2013, 18200-18214,
Rickard W. D. A., Vickers L., Riessen A. V.,
Performance of fibre reinforced, low density
metakaolin geopolymers under simulated fire
conditions, Applied Clay Science, 73, 2013, 71-77,
Svingala F., Varela B., Alkali Activated Aerogels,
Mechanical Properties and Performance of
Engineering Ceramics and Composites IV, 30 (2),
2009, 325-333,
Szabó R., Gombkötő I., Svéda M., Mucsi G., Effect of
grinding fineness of fly ash on the properties of
geopolymer foam, Archives of Metallurgy and
Materials, 62 (2B), 2017, 1257-1261,
Temuujin J., Minjigmaa A., Bayarzul U., Kim D. S., Lee
S-Ho., Ruescher C. H., MacKenzie K. J. D.,
Properties of geopolymer binders prepared from
milled pond ash, Materiales De Construccion, 67
(328), 2017, 1-11,
Xu H., Van Deventer J. S. J., The geopolymerisation of
aluminosilicate minerals, International Journal of
Mineral Processing 59 (3), 2000, 247-266,
Yang T., Yao X., Zhang Z. H., Geopolymer prepared
with high-magnesium nickel slag: characterization of
properties and microstructure, Construction and
Building Materials, 59, 2014, 188-194,

N. Halyag and G. Mucsi Recycling and Sustainable Development 11 (2018) 1-7
7
Yousef R. I., El-Eswed B., Alshaaer M., Khalili F.,
Khoury H., The influence of using Jordanian natural
zeolite on the adsorption, physical, and mechanical
properties of geopolymers products, Journal of
Hazardous Materials, 165 (1–3), 2009, 379-387,
Yuanyuan G., Xuemin C., Chunli L., Zhili L., Facile
fabrication of green geopolymer/alginate hybrid
spheres for efficient removal of Cu(II) in water: Batch
and column studies, Chemical Engineering Journal,
311, 2017, 126-134,
Yuanyuan G., Yuan Y., Kaituo W., Yan H., Xuemin C.,
Preparation of geopolymer-based inorganic
membrane for removing Ni2+ from wastewater,
Journal of Hazardous Materials, 299, 2015, 711-718,
Zhang Z., Provis J. L., Reid A., Wang H., Geopolymer
foam concrete: An emerging material for sustainable
construction, Construction and Building Materials,
56, 2014, 113-127,
Zhang Z., Yao X., Zhu H., Hua S., Chen Y., Preparation
and mechanical properties of polypropylene fiber
reinforced calcined kaolin-fly ash based geopolymer,
Journal of Central South University of Technology,
16 (1), 2009, 49-52,
Zhuang X. Y., Chen L., Komarneni S., Zhou C. H., Tong
D. S., Yang H. M., Yu W. H., Wang H., Fly ash-based
geopolymer: clean production, properties and
applications, Journal of Cleaner Production, 125,
2016, 253-267.
Funkcionalizovani geopolimeri - pregled
Nóra Halyag #, Gábor Mucsi
Univerzitet u Miškolcu, Institut za pripremu sirovina i zaštitu životne sredine, Mađarska
INFORMACIJE O RADU I Z V O D
Primljen 01 jun 2018
Prihvaćen 31 jul 2018
Pregledni rad
Ključne reči:
Geopolimer
Alkalno aktivirani aluminosilikat
Geopolimerna pena
Funkcionalizacija površina
Tehnologija geopolimera predstavlja alternativno dobro rešenje za proizvodnju
ekonomsko isplativog i višenamenski primenljivog proizvoda korišćenjem
industrijskog otpada, doprinoseći ujedno i očuvanju primarnih minerala. U radu su
dati postupci pripreme, strukturne modifikacije i funkcionalizacije geopolimera u
svrhu adsorbovanja. Mehaničke karakteristike geopolimera (dinamička čvrstoća -
otpornost na savijanje, otpornost na pritisak, dinamička izdržljivost - otpornost na
sulfate, kiseline, termalni efekat) zavise od hemijskog sastava i igraju veoma važnu
ulogu u oceni kvaliteta geopolimera.


Recycling and Sustainable Development 11 (2018) 9-19
Corresponding autor: [email protected]
doi: 10.5937/ror1801009K
Recycling and Sustainable Development
Assessment of construction and demolition waste management in
the city of Aveiro, Portugal
Nikola Karanović a, #, Ana Paula Gomes a, Nemanja Stanisavljević b
a University of Aveiro, CESAM, Aveiro, Portugal b University of Novi Sad, Faculty of Technical Sciences, Novi Sad, Serbia
A R T I C L E I N F O A B S T R A C T
Received 06 June 2018
Accepted 13 August 2018
Research Article
Keywords: Waste
Construction
Demolition
1. Introduction
Construction industry is the third-largest CO2 emitting
industrial sector, and representing 10 % of the total
anthropogenic CO2 emissions in the European Union
(EU) (Habert et al., 2009). Waste stream from the
construction and demolition processes was identified as
a priority waste stream by the EU, as it constitutes one of
the largest waste streams, since it represents
approximately 49 % of the total waste generation in the
EU. It is estimated that 887 million tons of construction
and demolition waste is generated in the EU in the year
2008 (Eurostat, 2011).
Only small amount of construction and demolition
(C&D) waste is recovered in EU (in general), despite the
fact that C&D waste has a very high recovery potential
(it is assumed that 80 % of waste can be recycled) (Ortiz
et al., 2010).
The amount of waste at construction site is in extent. In
Brasil, the amount of waste in the Brazilian construction
materials on site (Pinto and Agopayan, 1994). In the
Netherlands an average is 9 % of the construction
materials ends up as site waste in the Netherlands
(Bossink and Brouwers, 1996). Besides waste which is
found on the construction sites, there is waste generated
from the process of renovation and demolition (Table 1).
Construction authorities have to implement new
regulations in order to stimulate the use of low-waste
building technology, to adopt better waste management
(WM) practices, recording quantitative data, and make
useful guidelines and measures in order to a more
manageable and minimized construction waste
generation (Jaillon et al., 2009).
2. Objective
The objective of this paper is to present a model for
quantification of C&D waste yearly in urban areas for a
period 2015-2020, particularly analyzing single-family
residential areas in Aveiro, which also provides current
Quantification is very important for construction and demolition waste
management. Estimation of C&D can be reached by establishing waste
quantification model for C&D waste that is applicable in urban areas. In this paper,
it is presented model for quantification of C&D waste considering Aveiro. The
analysis is done for single-family urban sector. In this paper, it is combined
empirical data given from Portuguese Statistical Bureau (INE) considering
construction activities and C&D waste. Estimations provide data and yearly
estimation for C&D waste generation for a period 2015 until 2020 in Aveiro. LCA
tool is applied in order to calculate environmental impact of certain C&D waste
materials.
www.rsd.tfbor.bg.ac.rs
RSD Online ISSN 2560-3132 Print ISSN 1820-7480

N. Karanović et al. Recycling and Sustainable Development 11 (2018) 9-19
10
Table 1
Percentage of waste generated per activity (Bossink and Brouwers, 1996; Vanderley, 2000; Statistics Norway, 2006)
Type of activity % of waste per activity
Western Europe Norway USA
Construction 20 20 8
Renovation 80
44 44
Demolition 36 48
and comprehensive information concerning the
characterization and management of C&D waste using
tools such as material flow analysis (MFA) and life-cycle
assessment (LCA). The aim of this paper is reflected in
the following:
- Detailed elaboration of the basic theoretical
postulates considering C&D waste,
- Development of a theoretical model for determining
the amount of C&D waste in urban areas of Aveiro,
- Estimation of C&D waste in Aveiro,
- Development MFA approach,
- LCA approach concerning environmental impacts
of C&D waste.
3. Available methods for C&D quantification
Recent research trend in this field signalize that surveys
and case studies are the main methodologies for data
collection (Yuan and Shen, 2011). By Associates (1998),
sampling and weighing at landfills, would be the most
appropriate method for this study if sufficient time and
funds were available. However, even on the local level
there may be significant barriers to this method. Early
efforts to estimate C&D waste have employed the same
methods used to estimate municipal solid waste, which is
by using per capita multipliers (Yost and Halstead,
1996). Per capita multipliers, do not reflect C&D
activity.
Characterization of C&D waste is the initial stage of
data collection and it is crucial (Gheewala and
Kofoworola, 2009). This process consists of identifying
type of waste materials being generated. Most authors
conducted detailed study for characterization of various
types of C&D waste materials. Most studies (Associates,
1998; Fatta et al., 2003; Bergsdal et al., 2007; Cochran et
al., 2007; Gheewala and Kofoworola, 2009; Martinez
Lage et al., 2010) focus on the major type of C&D waste
with significant amount, such as concrete, bricks, timber,
steel and drywall. Data gathered from C&D sites are
described as ‘waste assessment data’.
These data were utilized to produce the average C&D
waste generation rate per area, which is usually expressed
in unit of amount (weight or volume) per area of activity.
The outcome is the quantity of national C&D waste
generation in particular year.
The methodology should be well prepared for updating
or predicting (Associates, 1998).
Yost and Halstead (1996) and Associates (1998), used
National Statistical data and C&D waste assessment data
from different sites in the USA. Yost and Halstead
(1996), carried out a case study concerning gypsum
wallboard waste generation in the USA, in order to assess
the feasibility of wallboard recycling program, while
Associates (1998) carried out a study for national C&D
waste generation rate.
Total waste generation of certain year (tons/year),
presents the product of total area (m2) multiplied by the
average waste generation (kg/m2), given from the waste
sampling. Estimation accuracy is related to the data
accuracy (Cochran et al., 2007).
Model of quantification for C&D waste, which is also
presented by Cochran et al., (2007) and Bergsdal et al.,
(2007), is given below: Waste produced in a region =
[Activity level of construction; demolition or renovation
in a region] x [Waste produced per activity].
By Associates (1998), an average C&D waste rate of
generation for residential construction, non-residential
construction, residential demolition, non-residential
demolition, and non-residential renovation are 21.38
kg/m2, 18.99 kg/m2, 561.47 kg/m2, 844.66 kg/m2, and
86.27 kg/m2.
The surveys conducted at the sites present main source
of data for waste assesment in this case. By Bergsdal et
al., (2007), concrete, bricks and wood are the main waste
materials for new construction projects in Norway with
67 % and 15 %, and for demolition projects, 85 % present
concrete.
Gheewala and Kofoworola (2009), presented results for
new residential and non-residential projects in Thailand.
This model is not taking into account demolition and
renovation process. Quantification model presented in
this case was developed to evaluate the capacity of
national C&D waste recycling program. Gheewala and
Kofoworola (2009), found that waste generation rate for
new residential and non-residential projects were 21.38
kg/m2 and 18.99 kg/m2.
The quantification model:
Qx = A · Gav · Px (1)
Qx = quantity in tons; A = area of activity in m2; Gav
= waste generation rate; Px = percentage of waste
material. Fatta et al., (2003), presented the model with
waste generation rate and density of C&D waste which
shows the average value from Greek Statistical Bureau.

N. Karanović et al. Recycling and Sustainable Development 11 (2018) 9-19
11
Quantification model is expressed as:
CW = [NC + EX ] · VD · D (2)
CW = construction waste in tons; NC = new construction
in m2 (from NSSG); EX = extension infrastructure in m
(from NSSG); VD = volume of generated waste per 100
m2 = 6 m3/1000 m2 (national average); D = density of
waste = 1.6 ton/m3 (national average).
DW = ND · NF · SD · WD · D (3)
DW = demolition waste in tons; ND = No. of demolitions
(from NSSG); NF = mean value of no. of floors
that building has = 1.3; SD = surface of each building
being demolished = 130 m2 (national average); WD =
generation rate of each demolition = 0.8 m3/m2 (national
average); D = density of waste = 1.6 ton/m3 (national
average).
Martinez Lage et al., (2010), presented a model of the
generation and composition of C&D waste in any region.
Martinez Lage et al., (2010), used historical data
concerning new constructions, renovation and
demolitions. This model was applied in the case of
Galicia. Several presumptions were considered in this
case:
- The number of construction, renovation, and
demolition works may be adjusted to a theoretical
function (linear, parabolic, exponential) that varies
over time (if data from a time series is known),
- Construction activities distribution in the whole
region is assumed to be the same every year,
- Surface area of construction, renovation, or
demolition project can also be adjusted for a
variable function over time,
- Quantity of waste generated per area is assumed to
be the same for each type of construction.
Quantification model is presented as:
Rbuild = ∑counties(RCi + RRi + RDi) = ∑counties(CC · SCi + CR · SRi + CD · SDi) (4)
Rbuild = C&D debris generated during a given year or
horizon year (HY) distributed over counties; RC = waste
from new construction; RR = waste from renovation; RD
= waste from demolition; SC = total surface area for new
construction; SR = surface area for renovation; SD =
surface area for demolition; CC = waste quantity per
surface area of new construction; CR = waste per area for
renovation; CD = waste per area for demolition.
Minimum data needed includes the number of buildings
constructed in the whole area over sufficient number of
year to be able to establish correlation between year and
number of building constructed, and an indicator on
which to base the calculation of the mean area of existing
construction. In this study, new construction work
generates 80 kg of waste per m2, which is equivalent to
0.11 m3 of waste per m2 (density = 700 kg/m3).
Demolition work generates 1350 kg of waste per m2,
while renovation process generates 90 kg/m2.
Llatas (2011), is using method which involves:
identifying building elements of the project
and their construction processes, waste
classification system (including remains, soil, and
packaging) and modeling. Suggested model is presented
as:
CWB = ∑jCWSBEj = ∑jiCWBEi = ∑jiCWPi + ∑CWRi + ∑jiCWSi (5)
CWB = volume of waste expected; CWSBEj = volume of
waste expected in the system building element ‘j’;
CWBEi = volume of expected waste from building
element ‘i’; CWPi = volume of expected packaging waste
element ‘i’; ΣCWRi = volume of remains expected from
building element ‘i’; CWSi = volume of expected soil in
building element ‘i’.
CWPi = ∑k(EWL)pk · Qi · FP · FC · FI (6)
CWRi = ∑k(EWL)Rk · Qi · FR · FC · FI (7)
CWSi = ∑k(EWL)Sk · Qi · FS · FC · FI (8)
(EWL)pk = code of packaging; (EWL)Rk = code of
remains (EWL)Sk = code of soil; Qi = amount of building
element ‘i’; FP = packaging waste factor; FC =
conversion factor; FR = remains factor; FS = soil factor;
FI = increased volume factor.
Waste generation rate (without soil) is assumed to be
0.1388 m3/m2 in this case.
Hsiao et al., (2002), consider dynamic model of
materials flow (waste from concrete fraction) in Taiwan.
This model quantifies concrete waste output as the major
component of C&D waste from national C&D activities.
The data required for calculation were given by
statistical bureau of Taiwan. Hsiao et al., (2002),
established the model to estimate relevant values. Model
by Hsiao et al., (2002) is presented as:
Wc = dcc · [∑Aij x Fci] · Pcc (9)
Wd = dcd · [∑Aij · Fci] (10)
WC/D = generation of waste concrete from construction/
demolition (tons); dcc/d = specific gravity of C&D waste
concrete (1.8 tons/m3 for construction, 2.2 tons/m3 for
demolition); Aij = total floor area on use permits built

N. Karanović et al. Recycling and Sustainable Development 11 (2018) 9-19
12
(m2); Fci = volume of waste per area (m3/m2); Pcc =
percentage of waste concrete in construction waste
(21.17 %).
Martinez Lage et al., (2010) model can be regarded as
the most accurate and comprehensive. The model uses
reasonable assumptions, taking account C&D waste from
all activities, density of waste, detailed waste assessment
data from all counties of the region, and supported by
strong data for building permits from a number of
governmental sources.
4. Methodology
Aveiro is located in the northwest of Portugal within
the central region of the country which encompasses
around 1/3 of the continental coastline (around 275 km).
Aveiro is the main municipality of the Baixo Vouga sub-
region (NUTS III) which is integrated within the
Portuguese Central Region (NUTS II).
Aveiro city is the sub-regional centre as is also the most
populated of all municipalities (72,919 inhabitants – INE,
2010). Other sub-regional major cities include Águeda,
Ílhavo and Ovar. The sub-region covers an area of 1807
km² and has a total population of 394,393 inhabitants for
an overall density of 218 inhabitants/km².
Minimum data needed includes the number of
constructed buildings in the whole area over sufficient
number of year to be able to establish correlation between
year and number of building constructed.
The procedure involves the calculation for: number of
buildings (construction, renovation, and demolition),
distribution of activities in Aveiro, quantity per area
of activities and total waste generated from 1994 to 2014.
Data considering new construction, renovation and
demolition activities for Aveiro are obtained from
Portuguese Statistical Bureau (INE).
Model for quantification of C&D waste in Aveiro is
presented in this paper. Model presented, is focused on
C&D waste quantities from construction, demolition, and
renovation process which is focused on single-family
housing sector.
According to the data and analysis of single-family
house from Aveiro which is used as a sample, it is known
that 1,155,140 kg of construction materials were used for
construction. This single-family house is used as a
reference in order to acquire values for C&D waste in
Aveiro.
Considering construction waste, data from
new construction activity are used in order to
estimate quantities. In Table 1, percentages of
generated C&D waste per activity are presented.
It is estimated that 20 % of construction materials used
for new constructions represent waste according to
Table 1. Model for calculating the amount of generated
construction waste is:
QCW(20%) = NRO · RVO(20%) (11)
QCW - Quantity of generated construction waste,
NRO – Number of residential objects,
RVO – Referent value for object (amount of construction
materials).
Table 2
Construction activities in Aveiro concerning single-family housing sector in a period 1994-2014 (INE, 1994-2014)
Activity/Year New construction Renovation Demolition
1994 39 39 23
1995 118 36 11
1996 183 35 10
1997 173 24 10
1998 260 36 22
1999 278 18 21
2000 226 20 29
2001 306 19 25
2002 347 55 25
2003 340 43 5
2004 375 31 2
2005 281 43 4
2006 233 35 12
2007 229 48 26
2008 172 47 10
2009 138 27 8
2010 116 25 5
2011 104 25 4
2012 89 24 4
2013 68 20 2
2014 39 14 3

N. Karanović et al. Recycling and Sustainable Development 11 (2018) 9-19
13
Figure 1. Amount of generated C&D waste (tonnes) in Aveiro considering single-family housing sector from 1994 until 2014 (excavation
materials are not included)
It is estimated that waste derived from the process of
renovation of residential objects represent equal amount
as the amount of construction materials needed for
reconstruction of residential objects (input=output) in
this case. Analyzing current situation in Aveiro and data
from Table 1, considering percentage of waste activity
derived from renovation process, it is assumed that 20 %
of waste is generated compared with the amount of used
construction materials in the process of renovation.
Model for calculation of the amount of waste derived
from the process of renovation:
QRW(20%) = NRO · RVO(20%) (12)
QRW – Quantity of generated waste derived from the
process of renovation
Considering demolition waste in this case, it is assumed
that the process of demolition is performed
conventionally (with no extraction of recyclable
materials), and all the waste from demolition process
remains in situ.
Model for calculation of the amount of demolition
waste:
QDW = NRO · RVO (13)
QDW – Quantity of generated demolition waste
According to the Figure 1, it is visible that construction
waste has larger share in generation of C&D waste then
the waste generated from the processes of renovation and
demolition.
It is interrelated with the fact that in period processes of
renovation or demolition in single-family sector.
5. Results
5.1. MFA Approach
Material flow analysis (MFA) is a systematic
assessment of the flows and stocks of materials within a
system defined in space and time (Brunner et al., 2004).
MFA is applied in this study and it shows yearly
estimation of groups of construction materials and C&D
waste from a period 2015 until 2020 in Aveiro.
In Portugal, data considering generation and treatment
of construction and demolition (C&D) waste are
recorded every year, and those results are presented in the
“Integrated Map for Waste Registration (MIRR)” of the
“Integrated Registration System developed by
Portuguese Environment Agency (SIRAPA)”.
Considering this platform, data regarding quantities of
C&D waste generation and treatment, are obtained from
two sources: Portuguese statistical bureau (INE) and
Portuguese Environment Agency (APA). In this case,
Portuguese statistical bureau presented data between
2008 and 2013.
In the following table, results of C&D waste
management in Portugal are presented. Also, in Table 2,
data from two different sources in Portugal are collected
(European Commission, 2016).
According to the data given by the Portuguese
statistical bureau (INE) and Portuguese environmental
agency (APA) concerning generated and treated C&D
waste in Portugal from 2008-2013, MFA scenario for
Aveiro is developed comparing the values from Table 2,
representing the actual state of managing of C&D waste
in this city.
This MFA scenario considers projection of generated
and treated C&D waste of single-family residential sector
N. Karanović et al. Recycling and Sustainable Development 11 (2018) 9-19
14
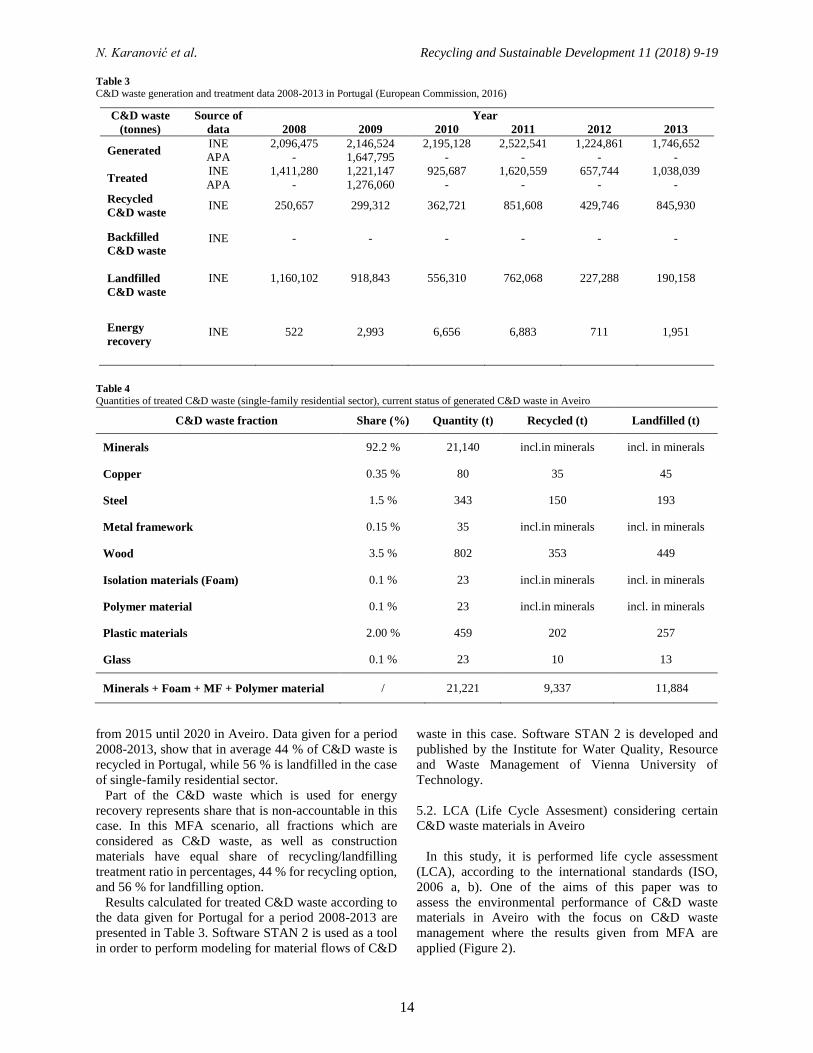
Table 3
C&D waste generation and treatment data 2008-2013 in Portugal (European Commission, 2016)
C&D waste
(tonnes)
Source of
data
Year
2008 2009 2010 2011 2012 2013
Generated INE 2,096,475 2,146,524 2,195,128 2,522,541 1,224,861 1,746,652
APA - 1,647,795 - - - -
Treated INE 1,411,280 1,221,147 925,687 1,620,559 657,744 1,038,039
APA - 1,276,060 - - - -
Recycled
C&D waste INE 250,657 299,312 362,721 851,608 429,746 845,930
Backfilled
C&D waste INE - - - - - -
Landfilled
C&D waste
INE 1,160,102 918,843 556,310 762,068 227,288 190,158
Energy
recovery INE 522 2,993 6,656 6,883 711 1,951
Table 4
Quantities of treated C&D waste (single-family residential sector), current status of generated C&D waste in Aveiro
C&D waste fraction Share (%) Quantity (t) Recycled (t) Landfilled (t)
Minerals 92.2 % 21,140 incl.in minerals incl. in minerals
Copper 0.35 % 80 35 45
Steel 1.5 % 343 150 193
Metal framework 0.15 % 35 incl.in minerals incl. in minerals
Wood 3.5 % 802 353 449
Isolation materials (Foam) 0.1 % 23 incl.in minerals incl. in minerals
Polymer material 0.1 % 23 incl.in minerals incl. in minerals
Plastic materials 2.00 % 459 202 257
Glass 0.1 % 23 10 13
Minerals + Foam + MF + Polymer material / 21,221 9,337 11,884
from 2015 until 2020 in Aveiro. Data given for a period
2008-2013, show that in average 44 % of C&D waste is
recycled in Portugal, while 56 % is landfilled in the case
of single-family residential sector.
Part of the C&D waste which is used for energy
recovery represents share that is non-accountable in this
case. In this MFA scenario, all fractions which are
considered as C&D waste, as well as construction
materials have equal share of recycling/landfilling
treatment ratio in percentages, 44 % for recycling option,
and 56 % for landfilling option.
Results calculated for treated C&D waste according to
the data given for Portugal for a period 2008-2013 are
presented in Table 3. Software STAN 2 is used as a tool
in order to perform modeling for material flows of C&D
waste in this case. Software STAN 2 is developed and
published by the Institute for Water Quality, Resource
and Waste Management of Vienna University of
Technology.
5.2. LCA (Life Cycle Assesment) considering certain
C&D waste materials in Aveiro
In this study, it is performed life cycle assessment
(LCA), according to the international standards (ISO,
2006 a, b). One of the aims of this paper was to
assess the environmental performance of C&D waste
materials in Aveiro with the focus on C&D waste
management where the results given from MFA are
applied (Figure 2).

N. Karanović et al. Recycling and Sustainable Development 11 (2018) 9-19
15
Fig
ure 2
. M
FA
of
C&
D w
aste
man
agem
ent
syst
em i
n A
vei
ro (
ton
nes
/yea
r) f
rom
201
5 t
o 2
020

N. Karanović et al. Recycling and Sustainable Development 11 (2018) 9-19
16
Emissions of treatment and transport regarding
different C&D waste materials are considered by
applying LCA impact assessment IPPC 2013 and CML
2001. CO2 emissions to the atmosphere and human
toxicity are observed. Initial values regarding C&D waste
materials were taken from the database Ecoinvent 3.2.
Software openLCA is used in order to perform
calculation considering environmental impact of certain
C&D waste materials.
In this case, life cycle analysis is performed only for
C&D waste in Aveiro, not including construction
materials. In Table 5, there are presented calculated
values concerning environmental impact of calculated
values from MFA model in Figure 2 on a yearly level.
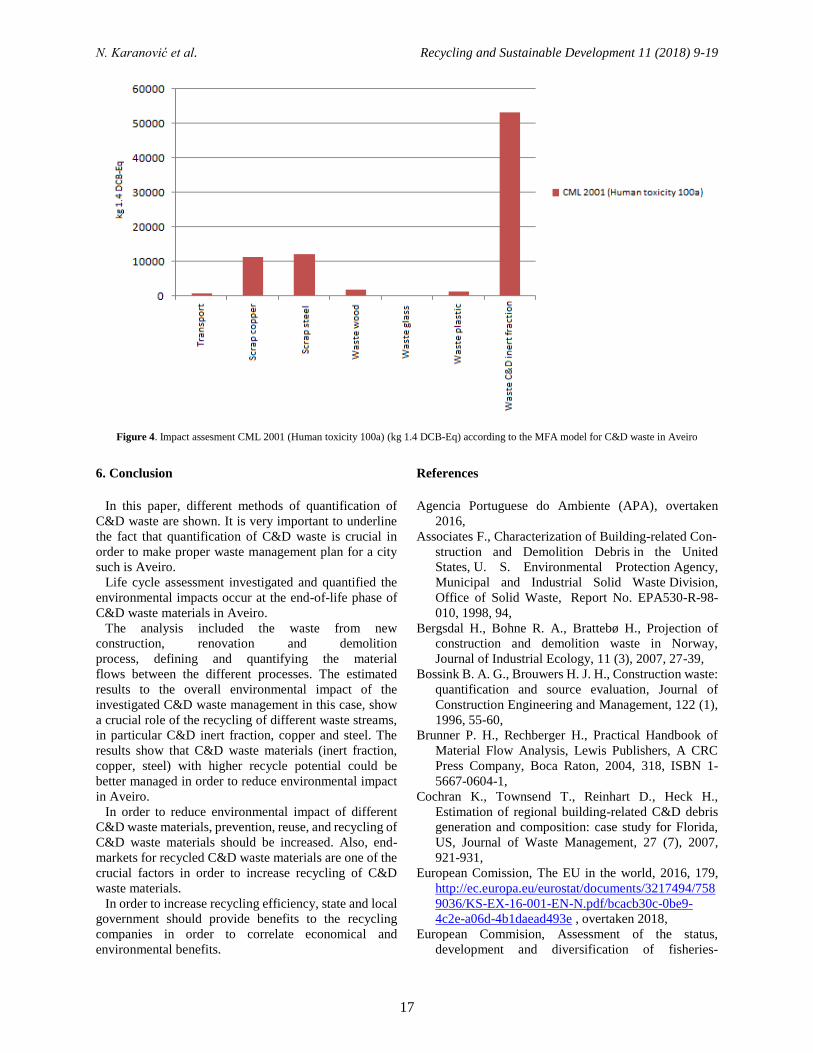
Table 5
Initial values of certain processes (values extracted from Ecoinvent 3.2) per 1 tonne of C&D waste treatment in Aveiro
Process Initial values
IPCC 2013 (GWP 100a)
(kg CO2_eq)
CML 2001 (Human toxicity 100a)
(kg 1.4 DCB-Eq)
Transport (Lorry 3.5-7.5 m3) 0.525 0.127
Scrap copper (market) 0.018 0.318
Scrap steel (market) 0.015 0.08
Waste wood (market) 0.013 0.0049
Waste glass (market) 0.022 0.012
Waste plastic (market) 0.013 0.0064
Waste C&D inert fraction (market) 0.011 0.0057
Table 6
Calculated values of certain processes of C&D waste treatment in Aveiro
Process Calculated values
IPCC 2013 (GWP 100a)
(kg CO2_eq)
CML 2001 (Human toxicity 100a)
(kg 1.4 DCB-Eq)
Transport (Lorry 3.5-7.5 m3) 3,210 776
Scrap copper (market) 6,300 11,130
Scrap steel (market) 2,250 12,000
Waste wood (market) 4,589 1,730
Waste glass (market) 220 120
Waste plastic (market) 2,626 1,293
Waste C&D inert fraction (market) 102,707 53,221
Figure 3. Impact assesment IPPC 2013 (GWP 100a) (kg CO2 eq) according to the MFA model for C&D waste in Aveiro
N. Karanović et al. Recycling and Sustainable Development 11 (2018) 9-19
17
Figure 4. Impact assesment CML 2001 (Human toxicity 100a) (kg 1.4 DCB-Eq) according to the MFA model for C&D waste in Aveiro
6. Conclusion
In this paper, different methods of quantification of
C&D waste are shown. It is very important to underline
the fact that quantification of C&D waste is crucial in
order to make proper waste management plan for a city
such is Aveiro.
Life cycle assessment investigated and quantified the
environmental impacts occur at the end-of-life phase of
C&D waste materials in Aveiro.
The analysis included the waste from new
construction, renovation and demolition
process, defining and quantifying the material
flows between the different processes. The estimated
results to the overall environmental impact of the
investigated C&D waste management in this case, show
a crucial role of the recycling of different waste streams,
in particular C&D inert fraction, copper and steel. The
results show that C&D waste materials (inert fraction,
copper, steel) with higher recycle potential could be
better managed in order to reduce environmental impact
in Aveiro.
In order to reduce environmental impact of different
C&D waste materials, prevention, reuse, and recycling of
C&D waste materials should be increased. Also, end-
markets for recycled C&D waste materials are one of the
crucial factors in order to increase recycling of C&D
waste materials.
In order to increase recycling efficiency, state and local
government should provide benefits to the recycling
companies in order to correlate economical and
environmental benefits.
References
Agencia Portuguese do Ambiente (APA), overtaken
2016,
Associates F., Characterization of Building-related Con-
struction and Demolition Debris in the United
States, U. S. Environmental Protection Agency,
Municipal and Industrial Solid Waste Division,
Office of Solid Waste, Report No. EPA530-R-98-
010, 1998, 94,
Bergsdal H., Bohne R. A., Brattebø H., Projection of
construction and demolition waste in Norway,
Journal of Industrial Ecology, 11 (3), 2007, 27-39,
Bossink B. A. G., Brouwers H. J. H., Construction waste:
quantification and source evaluation, Journal of
Construction Engineering and Management, 122 (1),
1996, 55-60,
Brunner P. H., Rechberger H., Practical Handbook of
Material Flow Analysis, Lewis Publishers, A CRC
Press Company, Boca Raton, 2004, 318, ISBN 1-
5667-0604-1,
Cochran K., Townsend T., Reinhart D., Heck H.,
Estimation of regional building-related C&D debris
generation and composition: case study for Florida,
US, Journal of Waste Management, 27 (7), 2007,
921-931,
European Comission, The EU in the world, 2016, 179,
http://ec.europa.eu/eurostat/documents/3217494/758
9036/KS-EX-16-001-EN-N.pdf/bcacb30c-0be9-
4c2e-a06d-4b1daead493e , overtaken 2018,
European Commision, Assessment of the status,
development and diversification of fisheries-

N. Karanović et al. Recycling and Sustainable Development 11 (2018) 9-19
18
dependent communities – Case study of Aveiro,
2010, 34,
https://ec.europa.eu/fisheries/sites/fisheries/files/doc
s/body/aveiro_en.pdf , overtaken 2018
Eurostat regional year book 2011, General and regional
statistics Collection: Statistical books, European
Commission, Luxembourg, Publications Office of the
European Union, 2011, 235,
http://ec.europa.eu/eurostat/documents/3217494/572
8777/KS-HA-11-001-EN.PDF, overtaken 2016,
Fatta D., Papadopoulus A., Kourmoussis F., Mentzis A.,
Sgourus E., Moustakas K., Loizidou M., Estimation
methods for the generation of construction and
demolition waste in Greece, Proceedings of the
International Conference, Sustainable Waste
Management and Recycling: Construction
Demolition Waste, London, September 2004, 28-33,
Editors: Limbachiya M. C., and Roberts J. J.,
Publisher: Thomas Telford, London,
Gheewala S. H., Kofoworola O. F., Estimation of
construction waste generation and management in
Thailand, Journal of Waste Management, 29 (2),
2009, 731-738,
Habert G., Billard C., Rossi P., Chen C., Roussel N.,
Cement production technology improvement
compared to factor 4 objectives, Journal of Cement
and Concrete Research, 40 (5), 2009, 820-826,
Hsiao T. Y., Huang Y. T., Yu Y. H., Wernick I. K.,
Modeling materials flow of waste concrete from
construction and demolition wastes in Taiwan,
Resources Policy, 28 (1-2), 2002, 39-47,
Instituto Nacional de Estatistica (INE), 1994-2014,
Statistical Yearbooks 1994-2015, 1-300,
https://ine.pt/xportal/xmain?xpgid=ine_main&xpid=
INE, overtaken 2016,
ISO, 2006a, Environmental Management - Life Cycle
Assessment-Principles and Framework, second ed.;
ISO 14040; 2006-07-01; ISO: Geneva, 2006,
ISO, 2006b, Environmental Management - Life Cycle
Assessment-Requirements and Guidelines, first ed.:
ISO 14044; 2006-07-01; ISO: Geneva, 2006,
Jaillon L., Poon C. S., Chiang Y. H., Quantifying the
waste reduction potential of using prefabrication in
building construction in Hong Kong, Journal of
Waste Management, 29 (1), 2009, 309-320,
Llatas C., A model for quantifying construction waste in
projects according to the European waste list, Journal
of Waste Management, 31 (6), 2011, 1261-1276,
Martinez Lage I., Martinez Abella F., Vazquez Herrero
C., Perez Ordonez J. L., Estimation of the annual
production and composition of C&D debris in
Galicia, Spain, Journal of Waste Management, 30 (4),
2010, 636-645,
Ortiz O., Pasqualino J. C., Castells F., Environmental
performance of construction waste: Comparing three
scenariosfrom a case study in Catalonia, Spain, Waste
Management, 30 (4), 646-654,
Pinto T. P., Agopayan V., Construction wastes as raw
material for low-cost construction products,
Sustainable construction: Proceedings of the First
International Conference of CIB TG 16, Tampa,
Florida, USA, November 1994, 335-342, Editors:
Kibert C. J., Publisher: University of Florida,
Gainesville, Fla.: Center for Construction and
Environment, ISBN 0964388618,
Statistics Norway, Waste from building activities, 2004.
Preliminary figures, Statistical Yearbook 2013, 63-
64; 331-335, http://www.ssb.no , overtaken 2018,
Vanderley M. J., Reciclagem de resíduos na construção
civil: contribuição à metodologia de pesquisa e
desenvolvimento, (Tese), Universidade de São Paulo,
Escola Politécnica, São Paulo, 2000, 113,
Yost P. A., Halstead J. M., A methodology for
quantifying the volume of construction waste, Waste
Management & Research, 14 (5), 1996, 453-461,
Yuan H., Shen L., Trend of the research on construction
and demolition waste management, Journal of Waste
Management, 31 (4), 2011, 670-679.
N. Karanović et al. Recycling and Sustainable Development 11 (2018) 9-19
19
Analiza upravljanja građevinskim otpadom i otpadom od rušenja u
gradu Aveiru, Portugalija
Nikola Karanović a, #, Ana Paula Gomes a, Nemanja Stanisavljević b
a Univerzitet u Aveiru, CESAM, Aveiro, Portugalija b Univerzitet u Novom Sadu, Fakultet tehničkih nauka, Novi Sad, Srbija
INFORMACIJE O RADU I Z V O D
Primljen 06 jun 2018
Prihvaćen 13 avgust 2018
Originalni rad
Ključne reči:
Otpad
Izgradnja
Rušenje
Kvantifikacija građevinskog otpada je veoma važna u kontekstu upravljanja
građevinskim otpadom. Procena količina građevinskog otpada može se postići
uspostavljanjem modela kvantifikacije građevinskog otpada koji se primenjuje u
urbanim područjima. U ovom radu predstavljen je model kvantifikacije
građevinskog otpada koji se primenjen u Aveiru. Analiza se odnosi na urbani sektor
sa porodičnim tipom stanovanja. U radu su korišćeni empirijski podaci dobijeni od
Portugalskog zavoda za statistiku (INE), u kojima su predstavljene sve građevinske
aktivnosti i podaci koji se odnose na građevinski otpad. Procena koja se odnosi na
količinu građevinskog otpada, doprinosi podacima o građevinskom otpadu, kao i
podacima koji se odnose na procenu generisanja građevinskog otpada za period
2015 - 2020 u Aveiru. LCA softver se primenjuje kako bi se odredio uticaj
određenih materijala iz građevinskog otpada na životnu sredinu.


Recycling and Sustainable Development 11 (2018) 21-26
Corresponding autor: [email protected]
doi: 10.5937/ror1801021A
Recycling and Sustainable Development
Precipitation of boron from waste water of Kirka borax plant
Neset Acarkan #, Ozan Kökkiliç, Hüseyin Baştürkçü, Ayhan Ali Sirkeci
Istanbul Technical University, Faculty of Mine, Istanbul, Turkey
A R T I C L E I N F O A B S T R A C T
Received 05 July 2018
Accepted 12 September 2018
Research Article
Keywords: Boron
Tailings
Precipitation
Boric acid
Extended and revised version of
a conference article - presented in
X IMPS
1. Introduction
Boron has an important role in manufacturing different
types of products such as glass, ceramics, high quality
steel, catalysts, cosmetics, and flame retardants (Yılmaz
et al., 2008a). Boron is found in the crust of earth as salts
(borates) or boro-silicate (Parks et al., 2005; Yılmaz et
al., 2008a); acid can easily be dissolved in water
(solubility of 55 g/L at 298 K) according to following
reaction (Yılmaz et al., 2008a):
𝐵(𝑂𝐻)3 + 𝐻2𝑂 ⇄ [𝐵(𝑂𝐻)4]− + 𝐻+ (1)
In some cases, boron is desired to be removed from
water. These cases can be classified as: a) environmental
issues, b) technological issues, which maintain a
recyclable water for the beneficiation plant
and diminish some kind of precipitates in tailing
ponds so it is provided new volumes for the tailings.
Today, there is not any specific boron removal
technology, which leads to the utilization of the methods
in conjunction with the other target parameters. These
involve coagulation-electrocoagulation, adsorption (on
oxides and activated carbon), chemical precipitation, ion
exchange, solvent extraction, electro dialysis, membrane
filtration, thermal treatment, and use of resins. When the
boron concentration in the solution is relatively high,
chemical precipitation is preferred, while milk of lime,
oxides of manganese, copper, cobalt and magnesium are
the precipitants used (Frütwirth et al., 1891; Boryta,
1995; Yamada and Eto, 1995; Kalafatoğlu, 1997;
Hasenmuller and Criss, 2013). Large boron reserves in
Turkey require tailings ponds with large volumes.
However, the management of large volume tailings
ponds imposes some difficulties. Kirka Boron Inc.
encounters a number of problems and will probably
Kirka Boron Inc., which is the largest boron processing plant in Turkey, produces
tincal from the run of mine ore and sodium penta borax in the same complex.
However, the deficiency of the tailings ponds causes significant problems, since
approximately 75 % of the current pond volume is filled with waste water, which
consists 3 g/L boron. The boron content of this water should be decreased for its
usage in the plant again, meanwhile about concentration of 3 g/L boron creates an
environmental risk. In this study, the boron in the effluents of the Kirka Boron Inc.
was precipitated using Ca(OH)2 and Al2SO4. The effects of several parameters such
as Ca(OH)2 dosage, initial pH, agitation duration, and settling duration were
investigated. It was found that, the precipitation was strongly related to the Ca2+
concentration. Therefore, when the initial pH was proceeded towards acidic values,
boron precipitation was increased. In conclusion, 97 % of the boron could be
precipitated from the solution by two stages and a precipitate assaying 38 % B2O3
was obtained.
www.rsd.tfbor.bg.ac.rs
RSD Online ISSN 2560-3132 Print ISSN 1820-7480

N. Acarkan et al. Recycling and Sustainable Development 11 (2018) 21-26
22
encounters a number of problems and will probably face
in the future, related to its capacity.
Kirka Borax Plant is located 70 km away from
Eskisehir near the town of Kirka. It is the largest boron
plant in Turkey with 1,000,000 tons of run-of-mine ore
processing capacity producing borax (Na2B4O7·5H2O).
Tailings are pumped to 14,000,000 m3 capacity tailing
ponds that are mostly filled up. The shortage of waste
ponds creates a serious problem in terms of environment.
Currently, tailing ponds hold about 12,000,000 m3 of
material of which 11,500,000 m3 is waste water
containing about 3 g/L of boron.
There are 5 tailings ponds in Kirka, 4 of which are used
for the tailings of the borax concentrator and the
remaining one is used for the tailings of the sodium penta
borax plant. Concentrator tailings contain 5-10 % solids
by weight. The tailings are fed to the ponds in a cascading
fashion, therefore, solids are primarily settle out in the
first pond. The last tailings pond primarily contains boron
rich solutions from the tailings of the concentrator and
the penta borax plant. One of the most important
problems faced in boron minerals processing plants is
tailing ponds. Tailings of those plants have to be kept in
well-constructed leakage free ponds. Although trace
amounts of boron are needed for living organisms and the
habitat, higher concentrations become environmentally
hazardous (Adams, 1964; Wong, 1984; Börekçi, 1986;
EPA, 1986). Therefore, concentrator tailings containing
high amounts of boron must be strictly kept under control
to prevent environmental pollution and urgent
precautions must be taken. This investigation aims
to remove boron from the liquid phase of the vast
Tailings Ponds of Kirka for both economic and
environmental reasons. Because of the boron
concentration of 1 mg/L more in the water used for
agricultural activities, it can cause problems (Ayers and
Westcot, 1976; Uygan and Çetin, 2004). But water
containing 3 mg/L boron can be used for dilution of
durable plants (Uygan and Çetin, 2004). The drinking
water in Turkey up to 1 mg/L B comprises is allowed
(Official Gazette, 2013).
2. Materials and method
2.1. Material
Boron containing effluents used in the experimental
studies were collected from the tailings pond of
Kirka Borax plant. A homogenous solution was
prepared by mixing 30 L lots. The chemical composition
of the blended test solution is given in Table 1. According
to the analysis, 3.93 g/L B, 6.38 g/L Na, and 675
mg/L SO4 was determined, while the pH of the
solution was 9.44. Boron analyzes were carried out
using volumetric titration method and other
analyzes were carried out using atomic absorption
spectrometry.
Table 1 The chemical composition of the test solution
Component Concentration Component Concentration
B 3.93 g/L Ca 6.28 mg/L
Na 6.38 g/L Fe 0.42 mg/L
K 102.8 mg/L SO4 675 mg/L
Al 0.52 mg/L Cl 536 mg/L
Mg 19.1 mg/L As 0.52 mg/L
2.2. Method
This study investigates the removal of boron from the
waste solutions in order to obtain a solution, which
contains below environmentally acceptable average level
of 2 mg/L B (Uygan and Çetin, 2004). The boron removal
tests were performed by utilizing the chemical
precipitation method in two steps (preliminary and basic
tests). With reference to the results obtained from the
preliminary tests, basic tests were conducted in two
stages. The parameters given below were examined in the
first stage:
- The amount of Ca(OH)2 – initial pH,
- Agitation duration,
- Settling duration.
Following the first stage basic precipitation, the
solution was subjected to second stage precipitation, in
which the effect of Ca(OH)2 usage only and Ca(OH)2
usage with Al2(SO)4 as precipitants were observed.
The precipitation tests were performed in a 400 mL
beaker using 100 mL of solution. The solution was
agitated with a magnetic stirrer. During the precipitation
tests, Ca(OH)2 and Al2(SO)4 were used, while HNO3 was
utilized to decrease the pH. The reason for the use of
HNO3 is that the damage and toxic effects of chlorine and
sulfate anions on the water and the environment are more
than nitrate ions.
After the agitation test, the solution was let to stand for
the particles to settle out and then some amount of aliquot
was taken. The boron analyses were performed with
titration method. Besides, all of the reagents used in the
experiments were analytical grade. The parameters and
ranges of the precipitation tests are shown in Table 2.
Table 2
The parameters tested in precipitation experiments
Parameters Ranges
Ca(OH)2 dosage (g/L) 10, 20, 40, 60, 80
Initial pH 3, 6, 8, 9.44
Agitation duration (min) 5, 15, 30, 45, 60
Settling duration (min) 5, 10, 20 30, 60, 120, 240,480
3. Results and discussion
3.1. The Preliminary Precipitation Tests
The preliminary tests revealed that the maximum Ca2+
solubility in the waste solution at the original pH (9.44)

N. Acarkan et al. Recycling and Sustainable Development 11 (2018) 21-26
23
was 300 mg/L. Above this pH, reaction between boron
and calcium cannot develop. However, if the initial pH is
decreased, then the Ca2+ concentration in the solution
increases, which promotes the reaction between calcium
and boron. At the first stage, preliminary tests were
carried out in order to observe the effect of solution
temperature on precipitation. As a result, it was found
that an increase in solution temperature did not provide
an enhancement in precipitation reaction. Therefore,
following tests were decided to be performed at the
temperature of 20 °C. Preliminary tests indicated that
reaction kinetics of calcium-boron compound formation
was found to be slow. Even after the agitation stopped,
the formation of calcium-boron compound continued,
which led to an enhancement in the efficiency of boron
precipitation. Test results revealed that the discharge of
one stage precipitation was inadequate in terms of
environmental issues. Therefore, a second stage
precipitation process was decided to be necessary.
3.2. The Basic Precipitation Tests
3.2.1. One Stage Precipitation
The Effects of Ca(OH)2 Dosage and Initial pH
In the first part of the experiments, the effect of
Ca(OH)2 was examined at different dosages, where
different initial pH values were tested under the
following conditions:
- Agitation duration: 30 min,
- Solution temperature: 22 2 °C,
- Settling duration: 60 min.
The results of the tests carried out at this conditions
are given in Table 3. According to the results given
in Table 3, the precipitation of boron increased
almost linearly, when the initial pH value decreased,
particularly at low Ca(OH)2 additions. The increase in
boron precipitation at decreasing initial pH values could
be related to the increasing solubility of Ca2+ ions. Boron
precipitation efficiencies showed similar values at
Ca(OH)2 dosages exceeding 20 g/L. About efficiency of
87 % boron precipitation could be reached at this group
tests, but boron concentration at the solution discharged
to the tailings pond was inadequate in terms of
environmental issues. Therefore, a second stage
precipitation process was needed. It was found that the
solubility of Ca2+ ions strongly depended on the solution
pH, which can be confirmed by Figure 1. These
indications show that initial pH of the solution has a
significant effect on calcium-boron interaction.
Increasing the initial pH from 6 to 9 prevents the
dissolution of Ca(OH)2 in the solution and therefore
calcium-boron interaction cannot develop because of
insufficient Ca2+ ions concentration.
Table 3
The effects of Ca(OH)2 dosage and initial pH on boron precipitation
Ca(OH)2
Dosage
(g/L)
Initial
pH
Final Boron
Concentration
(g/L)
Precipitation
Efficiency
(%)
10
9.4 2.64 32.8
8.0 2.50 36.5
6.0 2.35 40.1
2.6 2.20 44.0
20
9.4 1.17 70.3
8.0 0.71 81.8
6.0 0.59 84.9
2.9 0.52 86.7
40
9.4 1.07 72.8
8.0 0.69 82.5
6.0 0.56 85.8
2.8 0.50 87.3
60
9.4 1.04 73.5
8.0 0.70 82.1
6.0 0.55 86.2
2.8 0.50 87.4
80
9.4 1.01 74.3
8.0 0.74 81.2
6.0 0.54 86.4
2.8 0.49 87.5
Figure 1. The variation in Ca2+ concentration with respect to pH and
agitation duration
The Effect of Agitation Duration
In these tests, the effect of agitation duration on the
precipitation was investigated by adding varying dosages
of Ca(OH)2 under following conditions:
- Initial pH: 6,
- Solution temperature: 22 2 °C,
- Settling duration: 60 min.
The results in Figure 2 show that even 5 minutes
agitation duration would be enough for more than 80 %
precipitation. When the agitation duration was increased
from 5 to 15 minutes, 5 % marginal increase in the
precipitation efficiency was observed.
15 minutes agitation duration was found to be sufficient
as an optimum the precipitation time. The reaction
between boron ions and Ca ions takes place in two stages.
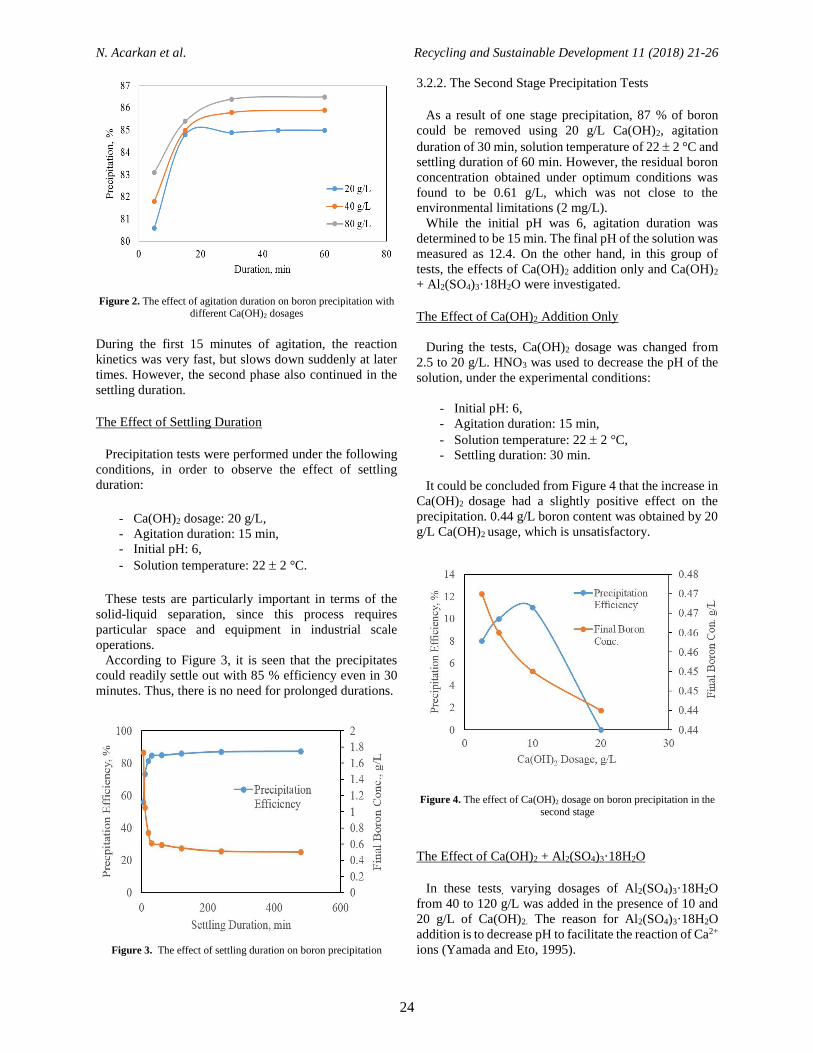
N. Acarkan et al. Recycling and Sustainable Development 11 (2018) 21-26
24
Figure 2. The effect of agitation duration on boron precipitation with different Ca(OH)2 dosages
During the first 15 minutes of agitation, the reaction
kinetics was very fast, but slows down suddenly at later
times. However, the second phase also continued in the
settling duration.
The Effect of Settling Duration
Precipitation tests were performed under the following
conditions, in order to observe the effect of settling
duration:
- Ca(OH)2 dosage: 20 g/L,
- Agitation duration: 15 min,
- Initial pH: 6,
- Solution temperature: 22 2 °C.
These tests are particularly important in terms of the
solid-liquid separation, since this process requires
particular space and equipment in industrial scale
operations.
According to Figure 3, it is seen that the precipitates
could readily settle out with 85 % efficiency even in 30
minutes. Thus, there is no need for prolonged durations.
Figure 3. The effect of settling duration on boron precipitation
3.2.2. The Second Stage Precipitation Tests
As a result of one stage precipitation, 87 % of boron
could be removed using 20 g/L Ca(OH)2, agitation
duration of 30 min, solution temperature of 22 2 °C and
settling duration of 60 min. However, the residual boron
concentration obtained under optimum conditions was
found to be 0.61 g/L, which was not close to the
environmental limitations (2 mg/L).
While the initial pH was 6, agitation duration was
determined to be 15 min. The final pH of the solution was
measured as 12.4. On the other hand, in this group of
tests, the effects of Ca(OH)2 addition only and Ca(OH)2
+ Al2(SO4)3·18H2O were investigated.
The Effect of Ca(OH)2 Addition Only
During the tests, Ca(OH)2 dosage was changed from
2.5 to 20 g/L. HNO3 was used to decrease the pH of the
solution, under the experimental conditions:
- Initial pH: 6,
- Agitation duration: 15 min,
- Solution temperature: 22 2 °C,
- Settling duration: 30 min.
It could be concluded from Figure 4 that the increase in
Ca(OH)2 dosage had a slightly positive effect on the
precipitation. 0.44 g/L boron content was obtained by 20
g/L Ca(OH)2 usage, which is unsatisfactory.
Figure 4. The effect of Ca(OH)2 dosage on boron precipitation in the
second stage
The Effect of Ca(OH)2 + Al2(SO4)3·18H2O
In these tests, varying dosages of Al2(SO4)3·18H2O
from 40 to 120 g/L was added in the presence of 10 and
20 g/L of Ca(OH)2. The reason for Al2(SO4)3·18H2O
addition is to decrease pH to facilitate the reaction of Ca2+
ions (Yamada and Eto, 1995).
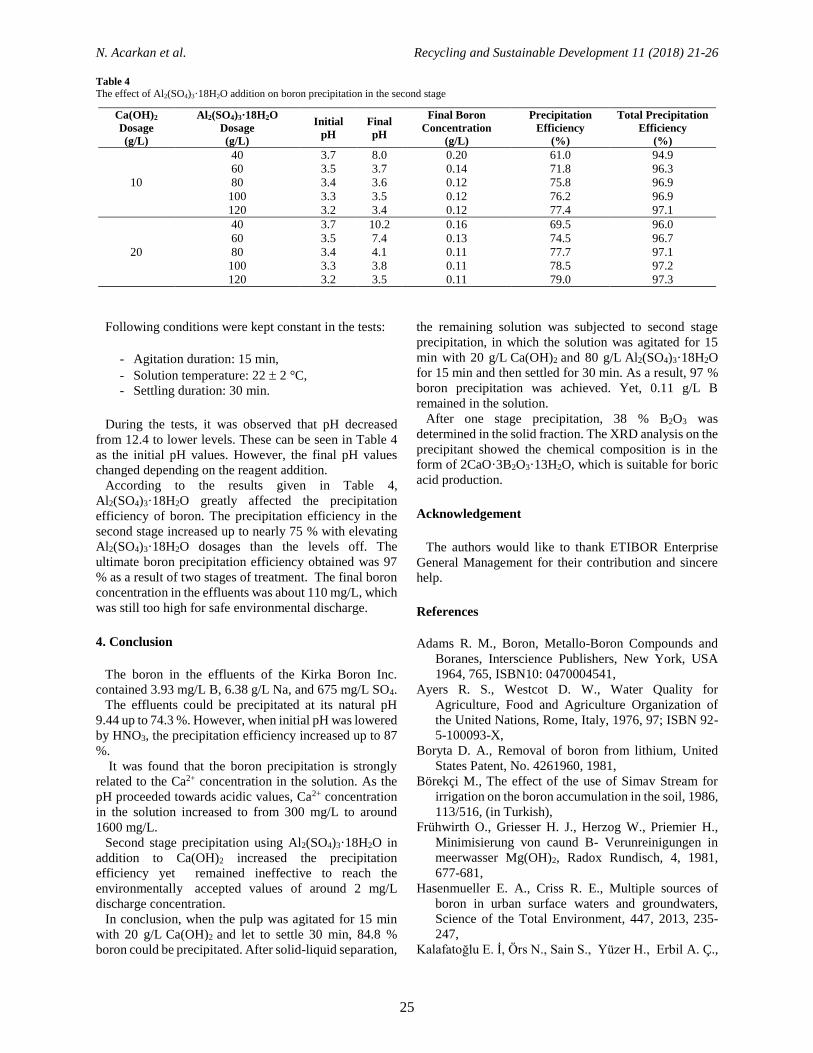
N. Acarkan et al. Recycling and Sustainable Development 11 (2018) 21-26
25
Table 4
The effect of Al2(SO4)3·18H2O addition on boron precipitation in the second stage
Ca(OH)2
Dosage
(g/L)
Al2(SO4)3·18H2O
Dosage
(g/L)
Initial
pH
Final
pH
Final Boron
Concentration
(g/L)
Precipitation
Efficiency
(%)
Total Precipitation
Efficiency
(%)
10
40 3.7 8.0 0.20 61.0 94.9
60 3.5 3.7 0.14 71.8 96.3
80 3.4 3.6 0.12 75.8 96.9
100 3.3 3.5 0.12 76.2 96.9
120 3.2 3.4 0.12 77.4 97.1
20
40 3.7 10.2 0.16 69.5 96.0
60 3.5 7.4 0.13 74.5 96.7
80 3.4 4.1 0.11 77.7 97.1
100 3.3 3.8 0.11 78.5 97.2
120 3.2 3.5 0.11 79.0 97.3
Following conditions were kept constant in the tests:
- Agitation duration: 15 min,
- Solution temperature: 22 2 °C,
- Settling duration: 30 min.
During the tests, it was observed that pH decreased
from 12.4 to lower levels. These can be seen in Table 4
as the initial pH values. However, the final pH values
changed depending on the reagent addition.
According to the results given in Table 4,
Al2(SO4)3·18H2O greatly affected the precipitation
efficiency of boron. The precipitation efficiency in the
second stage increased up to nearly 75 % with elevating
Al2(SO4)3·18H2O dosages than the levels off. The
ultimate boron precipitation efficiency obtained was 97
% as a result of two stages of treatment. The final boron
concentration in the effluents was about 110 mg/L, which
was still too high for safe environmental discharge.
4. Conclusion
The boron in the effluents of the Kirka Boron Inc.
contained 3.93 mg/L B, 6.38 g/L Na, and 675 mg/L SO4.
The effluents could be precipitated at its natural pH
9.44 up to 74.3 %. However, when initial pH was lowered
by HNO3, the precipitation efficiency increased up to 87
%.
It was found that the boron precipitation is strongly
related to the Ca2+ concentration in the solution. As the
pH proceeded towards acidic values, Ca2+ concentration
in the solution increased to from 300 mg/L to around
1600 mg/L.
Second stage precipitation using Al2(SO4)3·18H2O in
addition to Ca(OH)2 increased the precipitation
efficiency yet remained ineffective to reach the
environmentally accepted values of around 2 mg/L
discharge concentration.
In conclusion, when the pulp was agitated for 15 min
with 20 g/L Ca(OH)2 and let to settle 30 min, 84.8 %
boron could be precipitated. After solid-liquid separation,
the remaining solution was subjected to second stage
precipitation, in which the solution was agitated for 15
min with 20 g/L Ca(OH)2 and 80 g/L Al2(SO4)3·18H2O
for 15 min and then settled for 30 min. As a result, 97 %
boron precipitation was achieved. Yet, 0.11 g/L B
remained in the solution.
After one stage precipitation, 38 % B2O3 was
determined in the solid fraction. The XRD analysis on the
precipitant showed the chemical composition is in the
form of 2CaO·3B2O3·13H2O, which is suitable for boric
acid production.
Acknowledgement
The authors would like to thank ETIBOR Enterprise
General Management for their contribution and sincere
help.
References
Adams R. M., Boron, Metallo-Boron Compounds and
Boranes, Interscience Publishers, New York, USA
1964, 765, ISBN10: 0470004541,
Ayers R. S., Westcot D. W., Water Quality for
Agriculture, Food and Agriculture Organization of
the United Nations, Rome, Italy, 1976, 97; ISBN 92-
5-100093-X,
Boryta D. A., Removal of boron from lithium, United
States Patent, No. 4261960, 1981,
Börekçi M., The effect of the use of Simav Stream for
irrigation on the boron accumulation in the soil, 1986,
113/516, (in Turkish),
Frühwirth O., Griesser H. J., Herzog W., Priemier H.,
Minimisierung von caund B- Verunreinigungen in
meerwasser Mg(OH)2, Radox Rundisch, 4, 1981,
677-681,
Hasenmueller E. A., Criss R. E., Multiple sources of
boron in urban surface waters and groundwaters,
Science of the Total Environment, 447, 2013, 235-
247,
Kalafatoğlu E. İ, Örs N., Sain S., Yüzer H., Erbil A. Ç.,

N. Acarkan et al. Recycling and Sustainable Development 11 (2018) 21-26
26
Treatment of waste waters containing boron
compounds, 1997, TUBITAK Marmara Research
Center, 294, Unpublihed research report, (In
Turkish),
Official Gazette, number: 28580, date: 07.03.2013,
regulation on amendments to the regulation on
mineral waters,
Parks J. L., Edwards M., Boron in the environment,
Critical Reviews in Environmental Science and
Technology, 35 (2), 2005, 81-114,
United States Environmental Protection Agency, Quality
criteria for water, EPA, 440/5- 86/001, 1986,
Washington D. C. 20460, 62-63, http://nepis.epa.gov,
Uygan D., Çetin Ö., Agricultural and Environmental
Effects of Boron: Sedisuyu water deposit, II
International Boron Symposium, Eskişehir, Türkiye,
23-25 October 2004, 527-540, (In Turkish),
Wong J. M., Boron control in power plant reclaimed
water for potable reuse, Environmental Progress &
Sustainable Energy, 3 (1), 1984, 5-11,
Yamada R., Eto Y., Treatment of water containing boron
with calcium ion and aluminium ion, JP 07323292
A2, 1995 (C.A.: 124:184696),
Yılmaz A. E., Bonçukçuoğlu R., Kocaker¥m M. M.,
Kocadağistan E., An empirical model for kinetics of
boron removal from boron containing wastewaters by
the electrocoagulation method in a batch reactor,
Desalination, 230 (1-3), 2008a, 288-297,
Yılmaz A. E., Bonçukcuoğlu R., Kocaker¥m M. M.,
Yılmaz M. T., Paluluoğlu C., Boron removal from
geothermal waters by electrocoagulation, Journal of
Hazardous Materials, 153 (1-2), 2008b, 146-151.
Izdvajanje bora iz otpadnih voda postrojenja Kirka boraks
Neset Acarkan #, Ozan Kökkiliç, Hüseyin Baştürkçü, Ayhan Ali Sirkeci
Tehnički Univerzitet u Istanbulu, Rudarski fakultet, Istanbul, Turska
INFORMACIJE O RADU I Z V O D
Primljen 05 jul 2018
Prihvaćen 12 septembar 2018
Originalan rad
Ključne reči: Bor
Jalovišta
Precipitacija
Borna kiselina
Proširena i recenzirana verzija rada -
rad prezentovan na simpozijumu
X IMPS
Kirka Boron Inc. je najveće postrojenje za preradu i dobijanje bora u Turskoj,
proizvodi “tincal” (borax) iz rudnika i natrijum penta boraksa u istom kompleksu.
Međutim, jalovište predstavlja značajan problem, jer aproksimativno 75 %
zapremine postojećih bazena je ispunjeno otpadnom vodom koja sadrži 3 g/L bora.
Udeo bora u ovoj vodi mora da se smanji kako bi se ona ponovno koristila u
postrojenju. Pri tome koncentracija od 3 g/L bora predstavlja i rizik za životno
okruženje. U ovom radu, bor iz vode koja se izliva iz Kirka Boron Inc. postrojenja
je istaložen pomoću Ca(OH)2 i Al2SO4. Praćen je uticaj nekoliko parametara kao
što su količina Ca(OH)2, polazna pH, vreme mešanja i vreme taloženja. Može se
reći da koncentracija Ca2+ jona ima veliki uticaj na proces precipitacije i da je
stepen precipitacije veći ukoliko polazna pH teži kiselim vrednostima. Istraživanja
su pokazala da 97 % bora se može istaložiti iz rastvora kroz dva stepena, i pri tome
je utvrđeno da se pri taloženju dobije 38 % B2O3.

Recycling and Sustainable Development 11 (2018) 27-42
Corresponding autor: [email protected]
doi: 10.5937/ror1801027A
Recycling and Sustainable Development
Analysis of efficacy of the process of remediation of landfill site soil
contaminated with leachate using material flow analysis
Katarina Antić #, Nikolina Tošić, Maja Turk Sekulić,
Jelena Radonić, Nemanja Stanisavljević
University of Novi Sad, Faculty of Technical Sciences Novi Sad, Serbia
A R T I C L E I N F O A B S T R A C T
Received 01 August 2018
Accepted 01 October 2018
Research Article
Keywords: SFA
Remediation technologies
Landfill site soil contamination
Solid waste municipal landfills
Leachate
Cadmium
1. Introduction
Contamination of a landfill site is a condition
influenced by a complex of factors, before all the absence
of or inadequate implementation and use of a waste and
leachate management system. Non-sanitary municipal
solid waste landfills are an optimum example of absence
of implementation and use of both systems mentioned.
Requirements pertaining to impermeability and thickness
of natural geological barrier in the event of non-sanitary
landfills were not met, whereby the absence of a system
for collection and removal of leachate from the landfill
There are two possible cases concerning non-sanitary municipal solid waste
landfills due to failure to meet requirements with respect to impermeability and
thickness of geological barrier as well as absence of implementation and use of a
waste and leachate management system, and also depending on type and the
mineral composition of the geological barrier. In the first case, impermeable clay,
kaolinite, is prevailing in the composition of the geological barrier the final
outcome of which is the spillage of leachate into the volume of the deposited waste,
as well as its outbreak on the surface of the landfill site. In the second case,
permeable clay, smectite, is prevailing in the composition of geological barrier with
dominant leachate infiltration into the ground flow. In accordance with the first
case, using STAN software the substance flow analysis (SFA) was carried out, of
cadmium primarily, within three scenarios. Efficacy of remediation of the landfill
site soil contaminated with leachate from the aspect of heavy metal reduction,
focused primarily on cadmium, using in-situ and ex-situ systems, was presented
within Scenario 1 and Scenario 2. Possibility and efficacy of direct treatment of
leachate in a corresponding plant for its processing, in case of implementing and
using the leachate management system, was presented within Scenario 3. Efficacy
of cadmium flow reduction accomplished within Scenario 1, Scenario 2 and
Scenario 3 amounts to 99.04 %, 55 % and 99.2 %, respectively. Prevention of
landfill site contamination with leachate using the system of its management is an
optimum option and a desirable practice, while in the case of the already existing
contamination of the landfill site and its immediate environment, using in-situ
system of landfill site soil remediation, based on achieved results, high efficacy
was achieved contrary to use of the ex-situ system.
www.rsd.tfbor.bg.ac.rs
RSD Online ISSN 2560-3132 Print ISSN 1820-7480

K. Antić et al. Recycling and Sustainable Development 11 (2018) 27-42
28
body are additional aggravating and risky circumstances
(Ministry of Environment, Mining and Spatial Planning,
2010; Karanac et al., 2015).
In such circumstances, the role of protective liner
between the landfill body and the unsaturated area is
performed by impermeable layer consisting of a
combination of a geological barrier and a bottom liner of
the landfill and a base which, considering its geological
composition, consists of clay. Depending on mineral
composition of clay, of which the base is made, there are
two possible situations. If impermeable clay - kaolinite is
present on the landfill site, infiltration of leachate of the
landfill into the groundwater flow is the slightest
possible, whereby the increase in the volume of filtrates
in water storage within the landfill site is prevailing.
After exceeding the capacity of water storage, leachate
goes through constitutive layers of landfill site cells, if
any, or they are discharged into the volume of the
deposited waste. Therefore, leachate comes up to the
surface of the landfill site causing it to collapse. Due to
complex qualitative and quantitative composition of
leachate, landfill site and its immediate environment
become contaminated. In the second case, if clay, of
which the base is made, falls into a group of permeable
smectite according to its mineral composition, the
occurrence of leachate infiltration into the groundwater
flow will be prevailing. Tendency towards outcome of
the first case is beyond any doubt, however its realization
will take a longer period of time. Groundwater is a
primary contaminated medium in the said case. Leachate
is an entity influenced by a complex of factors, both
within the very landfill body (landfill age, morphological
composition of waste, temperature and content of
moisture, migration flow of liquid, technology of waste
treatment before disposal, thickness of the landfill body,
waste decomposition stages) and outside of it
(meteorological parameters, with a focus on annual
precipitation, the seasons). The process of forming
landfill filtrate comprises decomposition of solid
substances in water being filtrated through the landfill
body and the separation of dissolved or suspended matter
incurred through biological and chemical processes
inevitably taking place within the landfill body (Antić,
2016). Basic physical features characterizing landfill
leachate are dark-brown colour of filtrate and intensive
odour, while high level of pollutant concentration and the
values of biological consumption of oxygen over the
course of five days in the amount of 5,000 mg/l, represent
their exemplary chemical parameters.
Pollutants represented in the composition of leachate of
municipal landfills can be divided into four groups:
soluble organic components, inorganic
macrocomponents, heavy metals and xenobiotic organic
components (Kjeldsen et al., 2002; Renou et al., 2008;
Abbas et al., 2009; Bušatlić et al., 2017). Except for the
mentioned four groups of components, other compounds
and elements such as borate, sulphide, selenate, barium,
lithium, mercury and cobalt (Kjeldsen et al., 2002) can
also be identified within chemical composition of
leachate. Due to complex qualitative composition of
leachate, as a potential contaminant, Assessment of
condition of the environment of a contaminated site as
well as the creation of a Plan of recultivation, sanitation
and remediation are deemed as necessary activities.
Selection of adequate remediation technologies for
treatment of landfill site soil contaminated by leachate is
among last stages in the creation of the Plan, whereby
aspiration towards separation of targeted pollutants,
efficiency and price of remediation technologies are
considered as primary factors.
Mediums of the environment contaminated with toxic
heavy metal cadmium are a basic cause of harmful effects
on the environment and on people’s health as well due to
its allocation in food chain. Harmful effects on people’s
health are varying and depend on intensity of exposure to
cadmium concentrations. Cadmium poisoning symptoms
are diarrhea, pain in stomach, nausea, while the
consequences are reflected in the immune system
disorders, sterility, possible DNA damage (Crichton,
2012). Cadmium is characterized by high
bioconcentration factor (BCF) and therefore it is
predominantly deposited in liver, kidneys and bones,
causing bones to become more fragile with the possibility
of osteoporosis. Several epidemiological studies have
confirmed that the intake of cadmium is related to lung
and prostate cancer, and recently it has been classified
according to IARC as Group 1 carcinogen (Nodberg et
al., 2007). Acute poisoning with cadmium can have a
fatal outcome. A case of mass poisoning of population
after consuming rice grown in the fields irrigated with
river water contaminated with cadmium from industrial
waste water of the nearby factory was recorded in
Toyama prefecture of Japan in early 1912. Poisoning
with toxic heavy metal cadmium was manifested in a
disease called “Itai-itai”. Basic pathophysiological
mechanism explaining toxicity of cadmium is enzyme
inactivation via sulfhydryl (SH) groups. This way
synthesis of hem (a haemoglobin component) is reduced
and enzymes of significance for bone metabolism are
inhibited. All this leads to demineralization of bones and
to cadmium excretion through urine and also to “bone
softening”, the so-called osteomalacia. In addition to this
mechanism, cadmium also replaces calcium in bones;
however since it does not have the same properties as
calcium, bones become soft and fragile. The mentioned
poisoning is accompanied with heavy pain which is why
the disease was named “Itai-itai”, which means “It hurts-
It hurts disease” (Nodberg et al., 2007).
Three scenarios were created in the paper the goal of
which is to establish efficacy of heavy metal reduction,
of cadmium before all. Efficacy of remediation of the
landfill site soil contaminated with leachate, from the
aspect of heavy metal reduction, with a focus on
cadmium, using in-situ and ex-situ systems, is presented

K. Antić et al. Recycling and Sustainable Development 11 (2018) 27-42
29
within Scenario 1 and Scenario 2. Due to high efficacy of
heavy metal reduction and financial feasibility, two
remediation technologies have been selected within the
in-situ system - chemical oxidation and
phytoremediation, whereas within the ex-situ system, soil
washing and vitrification have been applied.
Possibility and efficacy of direct treatment of the
landfill filtrate in the leachate treatment plant is presented
within Scenario 3. The formed system represents an
integration of conventional and alternative treatment
methods, namely physical and chemical methods of
coagulation/flocculation, biological treatment using
membrane bioreactor with side flow and alternative
tertiary treatment, using phytoremediation methods, with
a goal of enhancing efficiency of heavy metal flow
reduction. After achieving these results it will be
concluded whether the direct treatment of landfill filtrate
within the leachate treatment plant represents an
optimum prevention of landfill site soil contamination,
namely whether it is necessary to implement and apply
the leachate management system. Also, in case of the
already contaminated landfill site soil, comparison of the
efficacy of the reduction of cadmium flow will be carried
out within Scenarios 1 and 2, namely within in-situ and
ex-situ remediation system.
2. Methods
By analysing the flows of material using STAN
software, the substance flow analysis (SFA) was carried
out, of cadmium before all, within three scenarios
(Brunner and Rechberger, 2004; Cencic and Rechberger,
2008; Stanisavljevic and Brunner, 2014).
2.1. Development of Scenario 1
In-situ treatment of landfill site soil contaminated with
leachate is presented within Scenario 1. The selected
technologies, chemical oxidation and phytoremediation,
were selected due to high efficacy of the reduction of
heavy metal flows and economic feasibility.
The use of a method of chemical oxidation presupposes
construction works within the landfill body, with a
goal of installing injection, extraction and observation
well. Oxidation agent, most typically it is H2O2, is
inserted in the contaminated soil through an injection
well, while the remaining oxidation agent, with
accumulated congeners of toxic pollutants from
contaminated soil is extracted through an extraction well.
Extracted oxidant is treated in the plant for recovery of
oxidation agent with a goal to repeat the use within the
mentioned process. Also, within the mentioned plant
toxic congeners accumulated in the oxidation agent are
being deposited within the in-situ process of chemical
oxidation, after which the formed deposit is extracted
from the system. The process of chemical oxidation is
shown in Figure 1. By applying the mentioned process an
efficient treatment of deep layers of contaminated soil is
achieved and, if necessary, of contaminated groundwater
as well.
Figure 1. In-situ process of chemical oxidation implemented within contaminated landfill site
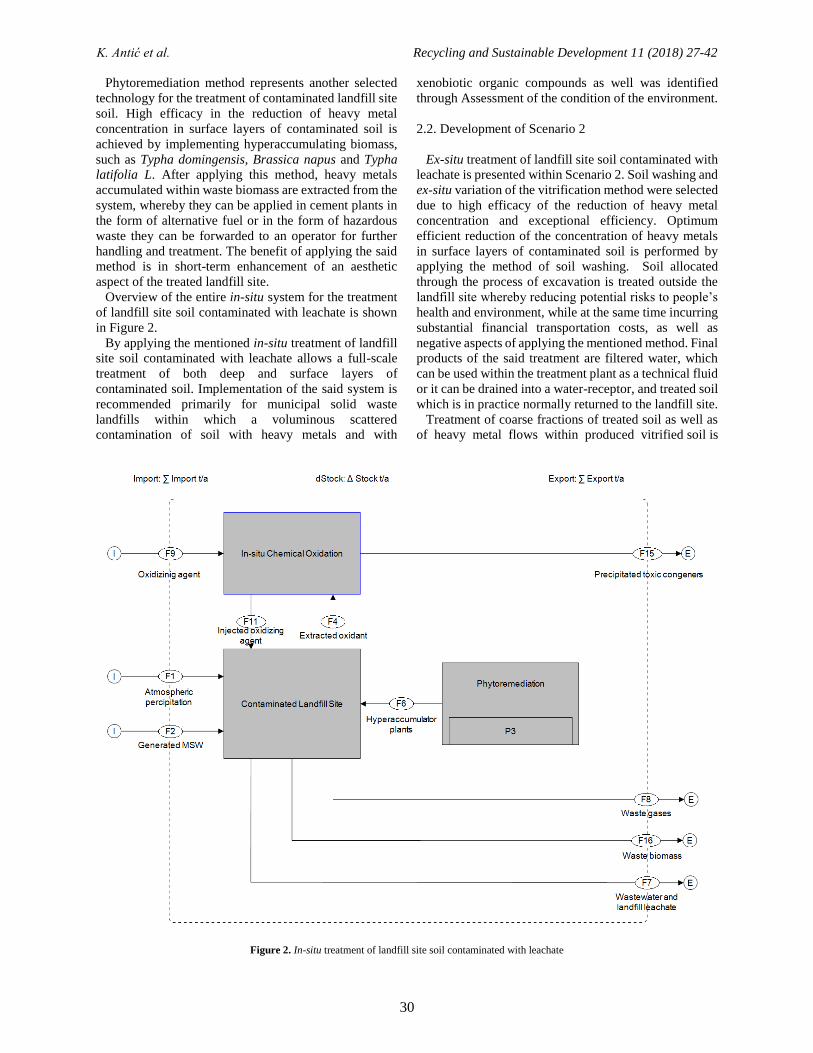
K. Antić et al. Recycling and Sustainable Development 11 (2018) 27-42
30
Phytoremediation method represents another selected
technology for the treatment of contaminated landfill site
soil. High efficacy in the reduction of heavy metal
concentration in surface layers of contaminated soil is
achieved by implementing hyperaccumulating biomass,
such as Typha domingensis, Brassica napus and Typha
latifolia L. After applying this method, heavy metals
accumulated within waste biomass are extracted from the
system, whereby they can be applied in cement plants in
the form of alternative fuel or in the form of hazardous
waste they can be forwarded to an operator for further
handling and treatment. The benefit of applying the said
method is in short-term enhancement of an aesthetic
aspect of the treated landfill site.
Overview of the entire in-situ system for the treatment
of landfill site soil contaminated with leachate is shown
in Figure 2.
By applying the mentioned in-situ treatment of landfill
site soil contaminated with leachate allows a full-scale
treatment of both deep and surface layers of
contaminated soil. Implementation of the said system is
recommended primarily for municipal solid waste
landfills within which a voluminous scattered
contamination of soil with heavy metals and with
xenobiotic organic compounds as well was identified
through Assessment of the condition of the environment.
2.2. Development of Scenario 2
Ex-situ treatment of landfill site soil contaminated with
leachate is presented within Scenario 2. Soil washing and
ex-situ variation of the vitrification method were selected
due to high efficacy of the reduction of heavy metal
concentration and exceptional efficiency. Optimum
efficient reduction of the concentration of heavy metals
in surface layers of contaminated soil is performed by
applying the method of soil washing. Soil allocated
through the process of excavation is treated outside the
landfill site whereby reducing potential risks to people’s
health and environment, while at the same time incurring
substantial financial transportation costs, as well as
negative aspects of applying the mentioned method. Final
products of the said treatment are filtered water, which
can be used within the treatment plant as a technical fluid
or it can be drained into a water-receptor, and treated soil
which is in practice normally returned to the landfill site.
Treatment of coarse fractions of treated soil as well as
of heavy metal flows within produced vitrified soil is
Figure 2. In-situ treatment of landfill site soil contaminated with leachate
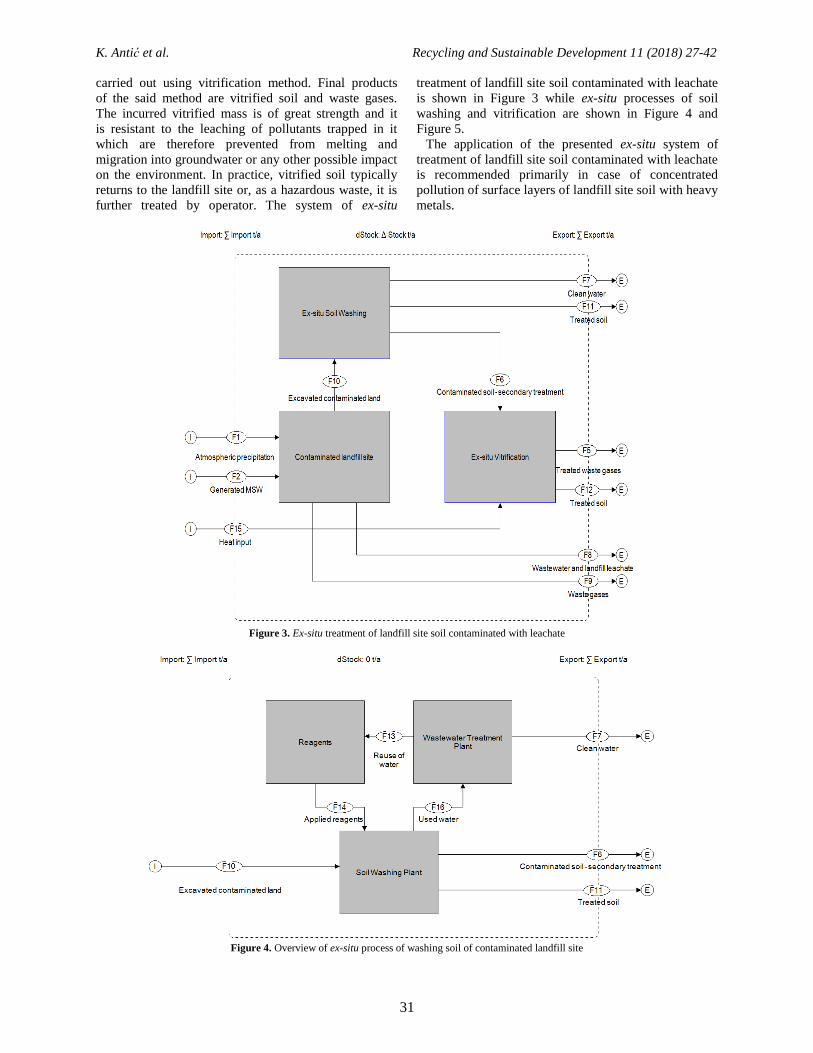
K. Antić et al. Recycling and Sustainable Development 11 (2018) 27-42
31
carried out using vitrification method. Final products
of the said method are vitrified soil and waste gases.
The incurred vitrified mass is of great strength and it
is resistant to the leaching of pollutants trapped in it
which are therefore prevented from melting and
migration into groundwater or any other possible impact
on the environment. In practice, vitrified soil typically
returns to the landfill site or, as a hazardous waste, it is
further treated by operator. The system of ex-situ
treatment of landfill site soil contaminated with leachate
is shown in Figure 3 while ex-situ processes of soil
washing and vitrification are shown in Figure 4 and
Figure 5.
The application of the presented ex-situ system of
treatment of landfill site soil contaminated with leachate
is recommended primarily in case of concentrated
pollution of surface layers of landfill site soil with heavy
metals.
Figure 3. Ex-situ treatment of landfill site soil contaminated with leachate
Figure 4. Overview of ex-situ process of washing soil of contaminated landfill site

K. Antić et al. Recycling and Sustainable Development 11 (2018) 27-42
32
Figure 5. Overview of ex-situ process of vitrification as a secondary treatment of coarse fractions retained after the process of soil washing
Figure 6. Model of a landfill leachate treatment plant
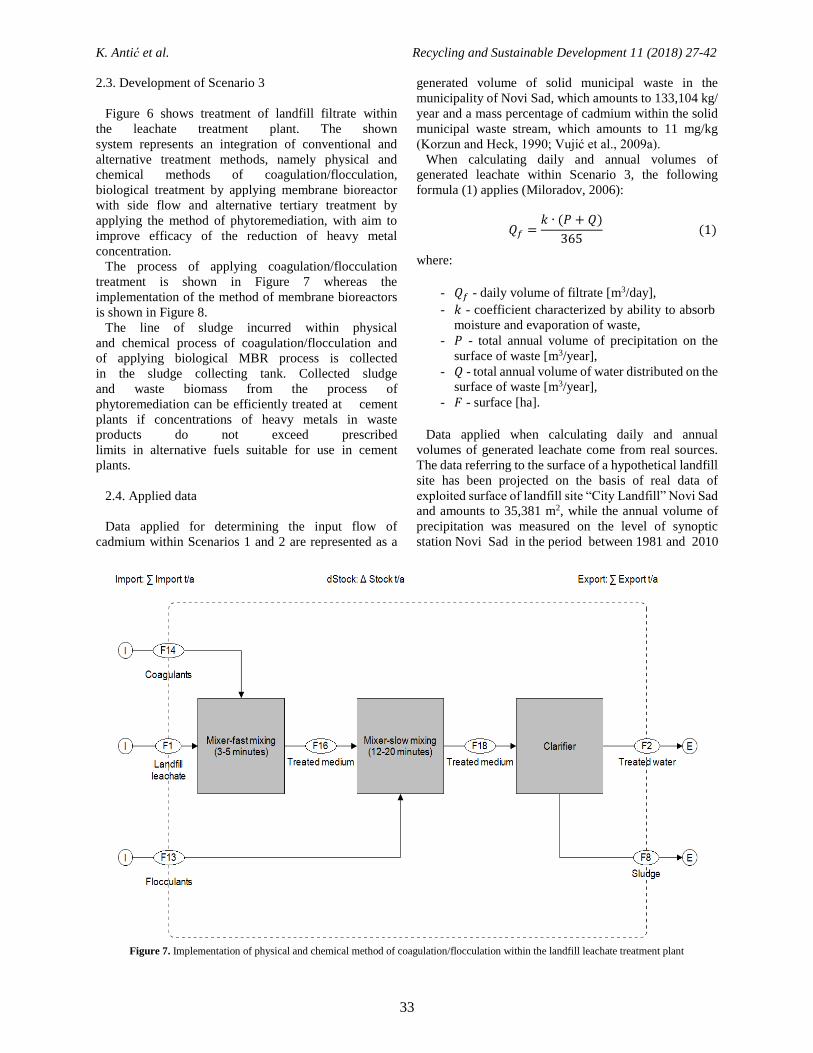
K. Antić et al. Recycling and Sustainable Development 11 (2018) 27-42
33
2.3. Development of Scenario 3
Figure 6 shows treatment of landfill filtrate within
the leachate treatment plant. The shown
system represents an integration of conventional and
alternative treatment methods, namely physical and
chemical methods of coagulation/flocculation,
biological treatment by applying membrane bioreactor
with side flow and alternative tertiary treatment by
applying the method of phytoremediation, with aim to
improve efficacy of the reduction of heavy metal
concentration.
The process of applying coagulation/flocculation
treatment is shown in Figure 7 whereas the
implementation of the method of membrane bioreactors
is shown in Figure 8.
The line of sludge incurred within physical
and chemical process of coagulation/flocculation and
of applying biological MBR process is collected
in the sludge collecting tank. Collected sludge
and waste biomass from the process of
phytoremediation can be efficiently treated at cement
plants if concentrations of heavy metals in waste
products do not exceed prescribed
limits in alternative fuels suitable for use in cement
plants.
2.4. Applied data
Data applied for determining the input flow of
cadmium within Scenarios 1 and 2 are represented as a
generated volume of solid municipal waste in the
municipality of Novi Sad, which amounts to 133,104 kg/
year and a mass percentage of cadmium within the solid
municipal waste stream, which amounts to 11 mg/kg
(Korzun and Heck, 1990; Vujić et al., 2009a).
When calculating daily and annual volumes of
generated leachate within Scenario 3, the following
formula (1) applies (Miloradov, 2006):
𝑄𝑓 =𝑘 ∙ (𝑃 + 𝑄)
365 (1)
where:
- 𝑄𝑓 - daily volume of filtrate [m3/day],
- 𝑘 - coefficient characterized by ability to absorb moisture and evaporation of waste,
- 𝑃 - total annual volume of precipitation on the
surface of waste [m3/year],
- 𝑄 - total annual volume of water distributed on the
surface of waste [m3/year],
- 𝐹 - surface [ha].
Data applied when calculating daily and annual
volumes of generated leachate come from real sources.
The data referring to the surface of a hypothetical landfill
site has been projected on the basis of real data of
exploited surface of landfill site “City Landfill” Novi Sad
and amounts to 35,381 m2, while the annual volume of
precipitation was measured on the level of synoptic
station Novi Sad in the period between 1981 and 2010
Figure 7. Implementation of physical and chemical method of coagulation/flocculation within the landfill leachate treatment plant

K. Antić et al. Recycling and Sustainable Development 11 (2018) 27-42
34
Figure 8. Implementation of biological method of membrane bioreactor with side flow
and it amounts to 647.3 mm/year (Vujić et al., 2009a;
Republic Hydrometeorological Service of Serbia, 2010).
When applying the methodology it is necessary to take
into consideration the fact that 70 % of precipitation
evaporates from the landfill through drying, and 25 %
evaporates through biometric processers occurring in the
layer of deposited waste at depth of 0.5 to 2 m.
Remaining precipitation, as a filtrate, migrates down to
the bottom of the landfill by 5-15 % for a sloped area and
by 1-10 % for the area which is not sloped. Consequently,
the coefficient 𝑘 for landfill sites on a flat terrain amounts
to 0.1, while for sloped landfill sites (mostly 2 %) it
amounts to 0.15 (Miloradov, 2006). Also, the total annual
volume of water distributed on the surface of waste
actually accounts for merely 30 % of total annual
precipitation left after evaporation off the landfill site
surface.
In calculations the formula (2) applies for conversion
of values from the level of mm/year to m3/year
(Berndtsson et al., 2014):
𝑚𝑚/𝑦𝑒𝑎𝑟 =10−3𝑚3
1 𝑚2𝑦𝑒𝑎𝑟 (2)
By applying the said formula (2) we have
concluded that the annual volume of precipitation
per 1 m2 amounts to 0.6473 m3. Introducing
exploited area of the landfill site “City Landfill”
Novi Sad which amounts to 35,381 m2, we
have calculated that the annual volume of
precipitation for the given surface amounts to
22,902.12 m3/year. Therefore, a factor 𝑃 was
determined within the formula (1). On the basis of the
obtained results, the factor 𝑄 was calculated and it
represents the remaining 30 % of total annual
precipitation distributed on the surface of waste and it
amounts to 6,870.64 m3/year. On the basis of the
presented data an assessment of generating
leachate was carried out within the hypothetical
landfill site, on a daily (3) and on an annual (4)
basis.
𝑄𝑓 =0.15 ∙ (22,902.1213 𝑚3/𝑦𝑒𝑎𝑟 + 6,870.63639 𝑚3/𝑦𝑒𝑎𝑟)
365= 12.24 𝑚3 /𝑦𝑒𝑎𝑟 (3)
𝑄𝑓 = 0.15 ∙ (22,902.1213 𝑚3/𝑦𝑒𝑎𝑟 + 6,870.63639 𝑚3/ 𝑦𝑒𝑎𝑟) = 4,465.914 𝑚3/𝑦𝑒𝑎𝑟 (4)
Concentration of cadmium within the generated
volume of leachate was established on the basis of field
testing and qualitative analysis of leachate from the
landfill site “City Landfill” in Novi Sad. Values of the
stated concentration amount to 0.02 mg/L, and 20 mg/m3
(Vujić et al., 2009b).
Within the in-situ system of Scenario 1, the value of
efficacy of the reduction of the flow of cadmium through
the method of chemical oxidation was adopted on the
basis of book values, by applying H2O2 as an oxidizing
agent, and it amounts to 95 %, while through the method
of phytoremediation using plant species Typha

K. Antić et al. Recycling and Sustainable Development 11 (2018) 27-42
35
domingensis, Brassica napus and Typha latifolia L.,
amounts to 81 % (Seol and Javandel, 2008; Lavagnolo et
al., 2016; Mojiri et al., 2016; Antić et al., 2017; Ferniza-
García et al., 2017).
Within the ex-situ system of Scenario 2, and based on
book values, the value of efficacy of the reduction of the
flow of cadmium through the method of soil washing
amounts to 55 %, while through the method of
vitrification, executed while performing field testing
amounts to 70 % (Thompson et al., 1992; Kos and Leštan,
2003; Pociecha et al., 2011; Sung et al., 2011).
Within Scenario 3, the value of efficacy of the
reduction of the cadmium flow by applying the method
of coagulation/flocculation is ranging between 74 %
(field research) to 98 % (laboratory research)
(Kurniawan, 2011). For the purpose of Scenario 3,
efficacy of the method in the amount of 74 %, established
on the basis of field research, was adopted. Efficacy of
the reduction of cadmium flow within MBR plant was
adopted on the basis of book value and amounts to 84 %
(Mahmoudkhani, 2014). Efficacy of the reduction of
cadmium flow by applying the phytoremediation method
was tested experimentally several times by experts. It was
established that efficacy amounting to 81 % was achieved
by using plant species Typha domingensis, Eichhornia
crassipes and Typha latifolia L. (Mojiri et al., 2016; Antić
et al., 2017; Ferniza-García et al., 2017). Within the
treatment at the cement plant, 99.98 % of the flow of
cadmium was concentrated in clinkers, and the remaining
0.02 % through waste gases are emitted in the
environment (Korzun and Heck, 1990; Mitchell et al.,
1992).
3. Results and discussion
3.1. Scenario 1
Due to possibly very harmful impact on the
environment and people’s health, within Scenario 1, the
focus is on efficacy of the reduction of the flow of toxic
heavy metal cadmium on the level of landfill site soil
contaminated with leachate.
The flow of cadmium in remediation of the landfill site
soil contaminated with leachate on an annual basis is
shown in Figure 9.
The input flow of cadmium was concentrated within
generated waste deposited on the landfill site in the
amount of 1,464,144 g/year, and 1,464.14 kg/year.
Cadmium concentrations were not recorded in remaining
input flows, i.e. precipitation and heat input.
Figure 9. The flow of cadmium within the process of in-situ remediation of landfill site soil contaminated with leachate (g/year)

K. Antić et al. Recycling and Sustainable Development 11 (2018) 27-42
36
Efficacy of the in-situ method of chemical oxidation
was adopted on the basis of book data and amounts to 95
% (Seol and Javandel, 2008). Accordingly, 95 % of the
initial cadmium flow, namely 1,390,937 g/year or
1,390.94 kg/year, was accumulated and extracted in the
form of toxic congeners of cadmium together with the
remaining oxidizing agent. The flow of cadmium within
the in-situ method of chemical oxidation is shown in
Figure 10.
After performed in-situ chemical oxidation treatment, 5
% of the initial flow of cadmium remains within the
landfill site soil contaminated with leachate, primarily in
surface layers. Secondary treatment of contaminated soil
is carried out by applying the method of
phytoremediation using plant species Typha
domingensis, Brassica napus and Typha latifolia L.
Efficacy of the reduction of the flow of cadmium by
applying the method of phytoremediation using the
mentioned plant species was adopted on the basis of
recorded data and amounts to 81 % (Lavagnolo et al.,
2016; Mojiri et al., 2016; Antić et al., 2017; Ferniza-
García et al., 2017).
Accordingly, after implementing the method of
phytoremediation within the waste mass, 4.05 % of the
remaining flow of cadmium is being accumulated,
namely 59,298 g/year or 59.3 kg/year. The remaining
0.95 % of the flow of cadmium, namely 13,909 g/year or
13.91 kg/year, through leachate generated within the
landfill site is allocated to groundwater aquifer.
Based on the flow of cadmium shown in Figure 4 and the
performed calculations, it has been established that the
efficacy of the applied in-situ methods of soil
remediation at the landfill site contaminated with
leachate amounts to 99.04 %.
3.2. Scenario 2
Due to possibly very harmful impact on the environment
and people’s health, the focus within Scenario 2 is on the
efficacy of the reduction of the flow of toxic heavy metal
cadmium on the level of the landfill site soil
contaminated with leachate waters. The flow of cadmium
within the remediation of landfill site soil contaminated
with leachate on an annual basis is shown in Figure 11.
The input flow of cadmium is concentrated in generated
waste deposited on the landfill site and it amounts to 11
mg/kg, whereby the annual flow of cadmium within
the municipal waste was obtained and it amounts to
1,464,144 g/year, i.e. 1,464.14 kg/year. Cadmium
concentrations were not recorded in remaining input
flows, namely precipitation and heat input.
Considering the mechanism of leachate production, in
Figure 10. The flow of cadmium within in-situ treatment of chemical oxidation of the landfill site soil contaminated with leachate (g/year)

K. Antić et al. Recycling and Sustainable Development 11 (2018) 27-42
37
the event of non-sanitary municipal solid waste landfills
without the system for its removal and collection, 85 %
of cadmium concentration contaminates soil on and in the
vicinity of the landfill site through leachate as a transfer
medium discharged onto the surface of the landfill site.
The mass flow rate within the said stream amounts to
1,244,522 g/year, i.e. 1,244.52 kg/year. Within the
landfill body, with potential for collecting and/or
infiltration in groundwater aquifer only 5-15 % of the
landfill filtrate remains, carrying with it 15 % of the
initially generated concentration of cadmium, namely
219,622 g/year or 219.62 kg/year (Miloradov, 2006).
Value of efficacy of the reduction of cadmium
concentration by applying ex-situ method of washing soil
was adopted on the basis of book data, namely the value
of efficacy of the reduction of heavy metals achieved
through field testing, which amounts to 55 % was applied
(Kos and Leštan, 2003; Pociecha et al., 2011; Sung et al.,
2011). Accordingly, after implementation and execution
of the said treatment, treated land and clean water are
obtained as final products. The treated land usually in
practice returns to the landfill site carrying with it 45 %
of the initial cadmium flow from the treated medium,
namely 560,035 g/year or 560.04 kg/year, while the
remaining 55 % of cadmium flow, namely 684,487
g/year or 684.49 kg/year, is stored within coarse fractions
of soil which are not subject to the applied treatment.
Coarse fraction of contaminated soil which is not
subject to ex-situ treatment of land washing, within which
the flow of cadmium amounts to 684,487 g/year, namely
684.49 kg/year, is sent for ex-situ vitrification treatment.
The value of efficacy of the reduction of cadmium
concentration by applying ex-situ vitrification method
was adopted on the basis of book data, namely the value
of efficacy of the reduction of heavy metals obtained
through field testing was applied, which amounts to 70 %
(Thompson et al., 1992).
After performing the treatment on vitrified soil the flow
of cadmium amounts to 479,141 g/year, namely 479.14
kg/year. Disadvantage of the said treatment is the
necessity to perform multi-stage filtering of waste gases.
In practice, conditions for the required level of clearing
of waste gases typically do not exist, and so the remaining
30 % of cadmium flow, namely 205,346 g/year or 205.35
kg/year are either directly or indirectly emitted in
environment.
On the basis of the flow of cadmium shown in Figure
11 and calculations performed, it has been established
that efficacy of the applied ex-situ methods of
remediation treatment of landfill site soil contaminated
with leachate amounts to 55 %. The advantage of the
presented system is permanent conservation and fixation
of 70 % of the flow of cadmium present in coarse fraction
of contaminated soil treated by ex-situ vitrification
Figure 11. Flow of cadmium within ex-situ remediation of landfill site soil contaminated with leachate (g/year)

K. Antić et al. Recycling and Sustainable Development 11 (2018) 27-42
38
method. For the purpose of improving the end quality of
soil which is after applying ex-situ washing process
returned to the landfill site, it is necessary to apply
additional treatment of the said fraction. Optimum
selection in achieving the said goal is thermal treatments,
such as pyrolysis or incineration, characterized by high
range of efficacy of the reduction of heavy metals, from
93.91 % to 99.9 %, within the treated medium (Debela et
al., 2012; US Environmental Protection Agency, 2012).
Long-term financially sustainable option for improving
the quality of soil which, after the process of ex-situ
washing returns to the landfill site, as well as
simultaneously long-term maintenance of the quality of
surface layers of soil of the landfill site, is the
implementation of the method of phytoremediation using
wooden plant species such as black alder (Alnus
glutinosa), silver birch (Betula pendula) and black pine
(Pinus nigra). The use of trees within the
phytoremediation method may result in extraction of
substantial quantities of metal, due to their high
production of biomass. Also, the advantage of
implementing the said method is the forming of a new
sustainable ecosystem and the green belt, as well as the
aesthetic enhancement of the treated site.
3.3. Scenario 3
Due to a possibly very harmful impact on the
environment and people’s health, within Scenario 3 the
focus of attention is on the efficacy of the reduction of
concentrations of toxic heavy metal cadmium on the level
of generated leachate, removed within sanitary municipal
solid waste landfills through implementation and
application of systems for collecting leachate.
The flow of cadmium within physical and chemical,
biological and alternative treatment of leachate from
solid waste municipal landfills on the level of a plant for
treatment of leachate is shown in Figure 12.
Cadmium concentration within generated volume of
leachate was determined on the basis of field testing
and qualitative analysis of leachate from landfill sites
of the “City Landfill” in Novi Sad. Values of the stated
concentration amount to 0.02 mg/L, namely 20 mg/m3,
on the basis of which the input mass flow of cadmium
was calculated in leachate which amounts to 89,318
mg/year, and 89.32 g/year.
Efficacy of reduction of heavy metals by applying the
method of coagulation/flocculation is ranging from 74
(based on field testing) to 98 % (based on laboratory
Figure 12. The flow of cadmium within the process of filtering leachate from municipal solid waste landfills in an adequate plant for physical
and chemical, biological and alternative treatment (mg/year)

K. Antić et al. Recycling and Sustainable Development 11 (2018) 27-42
39
testing) (Kurniawan, 2011). In order to meet
requirements of Scenario 3, the efficacy of the method in
the amount of 74 %, established on the basis of field
research, was adopted. Accordingly, 74 % of cadmium
flow is deposited within waste sludge, whereby the flow
of cadmium in this amounts to 66,096 mg/year, i.e.
66.096 g/year.
In leachate treated by applying the method of
coagulation/flocculation, 26 % of the flow of cadmium
remains, so the mass flow of cadmium within the stated
stream amounts to 23,223 mg/year, i.e. 23.22 g/year.
Efficacy of cadmium reduction within MBR plant was
adopted on the basis of a book value and it amounts to 84
% (Mahmoudkhani et al., 2014). Accordingly, 84 % of
cadmium flow from previously treated leachate is
concentrated in waste sludge, whereby the flow of
cadmium in it amounts to 19,507 mg/year, i.e. 19.5
g/year. 16 % of cadmium flow remains in the secondary
treated leachate, so the mass flow of cadmium in the said
stream amounts to 3,716 mg/year, i.e. 3.72 g/year.
Efficacy of the reduction of cadmium by applying the
method of phytoremediation was tested on several
occasions experimentally by experts and it was
concluded that efficacy in the amount of 81 % was
achieved by using plant species Typha domingensis,
Eichhornia crassipes and Typha latifolia L. (Mojiri et al.,
2016; Antić et al., 2017; Ferniza-García et al., 2017). On
the basis of the said above, 81 % of cadmium from
secondary treated leachate is accumulated in biomass
applied within the process of phytoremediation, whereby
the mass flow of cadmium after the process of
phytoremediation in waste biomass amounts to 3,010
mg/year, namely 3.01 g/year. 19 % of cadmium flow
remains in tertiary leachate against the influent of tertiary
treatment, so the flow of cadmium in leachate after
applying the phytoremediation method amounts to 706
mg/year, i.e. 0.71 g/year.
It is possible to use sludge deposited in the tank for
sludge storing, as well as waste biomass from tertiary
treatment, and/or the process of phytoremediation, as
alternative fuel in cement plants. For the purpose of
presenting the flow of cadmium in the stated alternative
fuels, Scenario 3 does not include the values of cadmium
concentration within RDF, and/or primarily exploited
fuel in cement plants. On the basis of book values, it is
known that 99.98 % of the flow of cadmium is installed
in the final product of cement plants, clinkers, while
merely 0.02 % of cadmium flow is emitted within waste
gases. Expressed in the form of a mass flow, 88,595
mg/year, i.e. 88.6 g/year of cadmium is installed in a
clinker, while 18 mg/year, i.e. 0.02 g/year of cadmium is
emitted within waste gases from cement plants.
On the basis of the flow of cadmium shown in Figure
12 and calculations performed, it has been concluded that
the efficacy of the designed plant for leachate treatment
within Scenario 3, including implemented primary -
physical and chemical, secondary - biological and tertiary
- alternative treatment, amounts to 99.2 % on an annual
basis.
4. Conclusion
This paper demonstrates three possible Scenarios for
soil remediation of contaminated landfill site, as well as
direct treatment of the polluting medium, leachate. In-
situ treatment of soil of the landfill site contaminated with
leachate, shown within Scenario 1, enables a
comprehensive treatment of both deep and surface layers
of contaminated soil, so the implementation of the
mentioned system is recommended primarily at solid
waste municipal landfills within which a spacious
scattered contamination with heavy metals and with
xenobiotic organic compounds was determined through
implementation of the Assessment of the condition of the
environment. The use of the ex-situ system of treating
landfill site soil contaminated with leachate, presented
within Scenario 2, is recommended primarily in case of
concentrated pollution of surface layers of landfill site
soil with heavy metals. Treatment of landfill filtrate
within the leachate treatment plant is presented within
Scenario 3. The shown system represents integration of
conventional and alternative treatment methods, namely
physical and chemical methods of
coagulation/flocculation, biological treatment by
applying membrane bioreactor with side flow, and
alternative tertiary treatment by using the method of
phytoremediation, for the purpose of enhancing efficacy
of reduction of heavy metal concentration.
On the basis of the presented cadmium flows and
performed calculations, it has been concluded that
efficacy of the applied in-situ system of treating
remediation of landfill site soil contaminated with
leachate amounts to 99.04 %, while ex-situ system of
treatment amounts to 55 %, with the possibility for
improving the performances by applying additional
thermal and alternative treatments. Efficacy of the
reduction of cadmium flow of the projected leachate
filtering plant within Scenario 3, with implemented
primary - physical and chemical, secondary - biological,
and tertiary - alternative treatment, amounts to 99.2 % on
an annual basis. The use of a method of collecting and
filtering leachate is very suitable and optimal with aim to
prevent the overflowing of contamination of the landfill
site soil with leachate, as well as maintenance of
optimum qualitative composition of generated landfill
filtrate.
The models of applying remediationtechnologies as
well as the very creation of the Plan for sanitation and
remediation of contaminated sites vary depending on a
particular case, considering the fact that certain specific
factors characterize each landfill site in particular the
effects of which either directly or indirectly affect the
entire process of remediation of contaminated landfill
site. The realization of the research has proven that the

K. Antić et al. Recycling and Sustainable Development 11 (2018) 27-42
40
treatment of the landfill filtrate within the landfill
leachate treatment plant is an essential step in the
implementation of landfill leachate management system
within the solid waste municipal landfills. Also, the
above procedure represents an adequate measure of
prevention from contamination of landfill site soil.
Acknowledgments
This environmental study has been financially
supported by Ministry of Education, Science and
Technological Development, Republic of Serbia (Project
III 46009 and TR 34014).
References
Abbas A. A., Jingsong G., Ping L. Z., Ya P. Y., Al-
Rekabi W. S., Review on landfill leachate treatments,
American Journal of Applied Sciences, 6 (4), 2009,
672-684,
Antić K., Assesment of leachate generation on specific
sanitary landfills in Republic of Serbia, (Bachelor),
University of Novi Sad, Faculty of Technical
Sciences in Novi Sad, Novi Sad, Serbia, 2016, 70,
UDK: 502.51,
Antić K., Pap S., Radonić J., Phytoremediation of landfill
leachate using Eichhornia crassipes, Zbornik radova
FTN, 7, 2017, 1335-1338,
Berndtsson R., Uvo B. C., Khatami S., Hydrology for
Environmental Engineers, 4th Edition, Lund
University Libraries, Faculty of Engineering, LTH,
KFS AB, Stockholm, Sweeden, 2014, 182,
Brunner P. H., Rechberger H., Practical Handbook of
Material Flow Analysis, CRC Lewis Publishers, Boca
Raton, Florida, USA, 2004, 333; ISBN 1-5667-0604-
1,
Bušatlić I., Botonjić Š., Halilović A., Bušatlić N., Karić
A., Positive examples of wastewater treatment
effectiveness in "Natron-Hayat" Maglaj factory,
Recycling and Sustainable Development, 10, 2017,
23-30,
Cencic O., Rechberger H., Material flow analysis with
Software STAN, Journal of Environmental
Engineering and Management, 18 (1), 2008, 3-7,
Crichton R. R., Biological Inorganic Chemistry (Second
Edition), ELSEVIER, 2012, 472; ISBN 978-0-444-
53782-9,
Debela F., Thring R., Arocena J., Immobilization of
heavy metals by co-pyrolysis of contaminated soil
with woody biomass, Water Air Soil Pollution, 223,
2012, 1161-1170,
Ferniza-García F., Amaya-Chávez A., Roa-Morales G.,
Barrera-Díaz E. C., Removal of Pb, Cu, Cd, and Zn
Present in Aqueous Solution Using Coupled
Electrocoagulation-Phytoremediation Treatment,
International Journal of Electrochemistry, 2017, 1-11,
Karanac M., Jovanović M., Mihajlović M., Dajić A.,
Stevanović D., Jovanović J., Landfill design in
Serbia, Recycling and Sustainable Development, 8,
2015, 27-37,
Kjeldsen P., Barlaz M. A., Rooker A. P., Baun A., Ledin
A., Christensen T. H., Present and long-term
composition of MSW landfill leachate: A Review,
Critical Review in Environmental Science and
Technology, 32 (4), 2002, 297-336,
Korzun A. E., Heck H. H., Sources and Fates of Lead and
Cadmium in Municipal Solid Waste, Journal of the
Air & Waste Management Association, 40 (9), 1990,
1220-1226,
Kos B., Leštan D., Induced Phytoextraction/Soil
Washing of Lead Using Biodegradable Chelate and
Permeable Barriers, Environmental Science and
Technology, 37 (3), 2003, 624-629,
Kurniawan T. A., Treatment of landfill leachate, LAP
LAMBERT Academic Publishing, 2011, 280; ISBN
978-3846550168,
Lavagnolo C. M., Malagoli M., Garbo F., Pivato A.,
Cossu R., Lab-scale phytotreatment of old
landfill leachate using different energy crops, Waste
Management, 55, 2016, 265-275,
Mahmoudkhani R., Torabian A., Hassani H. A.,
Magmoudkhani R., Copper, Cadmium and Ferrous
Removal by Membrane Bioreactor, APCBEE
Procedia 10, 2014, 79-83,
Miloradov M., Integrated waste management, sanitary
landfills and water protection, 2006,
https://www.academia.edu/8991848/INTEGRALNO
_UPRAVLJANJE_OTPADOM_SANITARNE_DE
PONIJE_I_ZA%C5%A0TITA_VODA, overtaken
03.07.2018.,
Ministry of Environment, Mining and Spatial Planning,
Regulation on waste landfilling, ("Official Gazette of
RS ", No. 92/2010), 2010, 1-32,
http://www.pks.rs/SADRZAJ/Files/Uredba%20od
laganje%20otpada%20na%20deponije.pdf, overtaken 03.07.2018.,
Mitchell J. D., Wild R. S., Jones C. K., Arrested
municipal solid waste incinerator fly ash as a source
of heavy metals to the UK environment,
Environmental Pollution, 76 (1), 1992, 79-84,
Mojiri A., Ziyang L., Tajuddin R. M., Farraji H., Alifar
N., Co-treatment of landfill leachate and municipal
wastewater using the ZELIAC/zeolite constructed
wetland system, Journal of Environmental
Management, 166, 2016, 124-130,
Nordberg F. G., Nogawa K., Nordberg M., Friberg T. L.,
Handbook on the Toxicology of Metals (Third
Edition), Academic Press, Cambridge,
Massachusetts, USA, 2007, 1024; ISBN 978-0-12-
369413-3,
Pociecha M., Kastelec D., Leštan D., Electrochemical
EDTA recycling after soil washing of Pb, Zn and Cd
contaminated soil, Journal of Hazardous Materials,
192 (2), 2011, 714-721,
K. Antić et al. Recycling and Sustainable Development 11 (2018) 27-42
41
Renou S., Givaudan G. J., Poulain S., Dirassouyan F.,
Moulin P., Landfill leachate treatment: Review and
opportunity, Journal of Hazardous Materials, 150 (3),
2008, 468-493,
Republic Hydrometeorological Service of Serbia,
Normal for synoptic cells, Novi Sad-Rimski Šančevi,
2010,
http://www.hidmet.gov.rs/ciril/meteorologija/stanica
_sr.php?moss_id=13168, overtaken 03.07.2018.,
Seol Y., Javandel I., Citric acid-modified Fenton’s
reaction for the oxidation of chlorinated ethylenes in
soil solution systems, Chemosphere, 72 (4), 2008,
537-542,
Stanisavljević N., Brunner H. P., Combination of MFA
and SFA-A powerful approach for decision support in
waste management, Waste Management & Research,
32 (8), 2014, 733-744,
Sung M., Lee C. Y., Lee S. Z., Combined mild soil
washing and compost-assisted phytoremediation in
treatment of silt loams contaminated with copper,
nickel, and chromium, Journal of Hazardous
Materials, 190 (1-3), 2011, 744-754,
Thompson L. E., Bates S. O., Hansen J. E., Technology
statusreport: in situ vitrification applied to buried
wastes, Pacific Northwest Laboratory, Richland,
Washington, 1992, 84,
United States Environmental Protection Agency, About
remediation technologies, US EPA Office of
Superfund Remediation and Technology Innovation
(CLU-IN), 2012,
https://cluin.org/techfocus/default.focus/sec/Bioreme
diation/cat/Overview/, overtaken 03.07.2018.,
Vujić G., Ubavin D., Batinić B.,Vojinović Miloradov M.,
Štrbac D., Gvozdenac B., Stanisavljević N.,
Milovanović D., Adamović D., Bačlić S., Dvornić
A., Determination of waste composition and quantity
estimation in order to define a strategy for the
management of secondary raw materials as part of the
sustainable development of the Republic of Serbia,
Report, Department of environmental engineering,
Faculty of Technical Sciences, Novi Sad, Serbia,
2009a, 72,
Vujić G., Vojinović Miloradov M., Radnović D., Turk
Sekulić M., Radonić J., Ubavin D., Đogo M., Dvornić
A., Bačlić S., Maoduš N., Stošić M., Preliminary
qualitative and quantitative analysis of the leachate
and landfill gases in order to establishing a
continuous monitoring, Project, Department of
environmental engineering, Faculty of Technical
Sciences, Novi Sad, Serbia, 2009b, 86.

K. Antić et al. Recycling and Sustainable Development 11 (2018) 27-42
42
Analiza efikasnosti procesa remedijacije zemljišta deponijskog lokaliteta
kontaminiranog procednim vodama primenom analize tokova materijala
Katarina Antić #, Nikolina Tošić, Maja Turk Sekulić,
Jelena Radonić, Nemanja Stanisavljević
Univerzitet u Novom Sadu, Fakultet tehničkih nauka Novi Sad, Srbija
INFORMACIJE O RADU I Z V O D
Primljen 01 avgust 2018
Prihvaćen 01 oktobar 2018
Originalan rad
Ključne reči:
SFA
Remedijacione tehnologije
Kontaminacija zemljišta deponijskog
lokaliteta
Komunalne deponije čvrstog otpada
Procedne vode
Kadmijum
Kod nesanitarnih komunalnih deponija čvrstog otpada, usled nezadovoljavanja
zahteva u pogledu vodonepropusnosti i debljine geološke barijere i odsustva
implementacije i primene sistema za upravljanje otpadom i procednim vodama,
kao i u zavisnosti od vrste i minerološkog sastava geološke barijere, moguća su dva
slučaja. Pri prvom slučaju, u okviru sastava geološke barijere dominira nepropusna
glina, kaolinit, te krajnji ishod predstavlja izlivanje procednih voda u zapreminu
deponovanog otpada, kao i izbijanje istih na površinu deponijskog lokaliteta. Pri
drugom slučaju, propusne gline, smektiti, preovlađuju u okviru sastava geološke
barijere, te je dominantna infiltracija procednih voda u podzemni tok. U skladu sa
prvim slučajem, primenom softvera STAN realizovana je analiza tokova supstanci
(SFA), primarno kadmijuma, u okviru tri scenarija. Efikasnost remedijacije
zemljišta deponijskog lokaliteta kontaminiranog procednim vodama, sa aspekta
redukcije teških metala, sa akcentom na kadmijum, primenom in-situ i ex-situ
sistema, predstavljena je u okviru Scenarija 1 i Scenarija 2. Mogućnost i efikasnost
direktnog tretmana procednih voda u postrojenju za tretman istih, u slučaju
implementacije i primene sistema za upravljanje procednim vodama, predstavljena
je u okviru Scenarija 3. Efikasnost redukcije toka kadmijuma ostvarena u okviru
Scenarija 1 iznosi 99.04 %, u okviru Scenarija 2 iznosi 55 %, dok u okviru
Scenarija 3 iznosi 99.2 %, respektivno. Prevencija kontaminacije deponijskog
lokaliteta procednim vodama primenom sistema za upravljanje istim predstavlja
optimalnu opciju i poželjnu praksu, dok u slučaju već postojeće kontaminacije
deponijskog lokaliteta i neposredne okoline, primenom in-situ sistema remedijacije
zemljišta deponijskog lokaliteta, na osnovu dobijenih rezultata, ostvaruje se visoka
efikasnost, nasuprot primeni ex-situ sistema.

Recycling and Sustainable Development 11 (2018) 43-52
Corresponding autor: [email protected]
doi: 10.5937/ror1801043M
Recycling and Sustainable Development
Recycling spent fluid cracking catalysts for rare earth
metal recovery - a review
S. Maryam Sadeghi, João M.O.M. Jesus, Helena M.V.M. Soares #
University of Porto, Faculty of Engineering, Portugal
A R T I C L E I N F O A B S T R A C T
Received 30 September 2018
Accepted 13 November 2018
Review Article
Keywords: Fluid cracking catalysts
Acid leaching
(Saponified) solvent extraction
Selective precipitation
Lanthanum
Cerium
1. Introduction
Fluid cracking catalysts (FCCs) are components used
for hydrocarbon processing in the petroleum industry.
FCCs aid in the cracking of large molecules from
feedstocks, such as heavy or vacuum gas oil. Although
their constitution can vary, they are mainly made of
crystalline microporous aluminosilicates also known as
zeolites, which are synthetized in such a way as to
increase its potential as a catalyst.
The zeolite is responsible for cracking due to its acid
sites that can convert molecules to the shorter and desired
gasoline range. However, other components are required
to pre-crack larger molecules as well as to act as binding
agent (Vogt and Weckhuysen, 2015).
Zeolite Y is one of the main types of zeolites used in
the industry and is stabilized with rare earths metals
(REEs), such as lanthanum (La) and cerium (Ce). These
metals not only enhance the catalyst activity but also
prevent loss of acid sites due to metal poisoning, mostly
vanadium (V) and nickel (Ni).
After reaction at high temperatures, the FCCs are
separated from the products and regenerated by burning
off the carbon, also known as coke, that has been
deposited; therefore, FCCs are continuously regenerated.
However, this process cannot be repeated endlessly; due
to the harsh temperature and pressure conditions in the
reactor, a complete catalyst deactivation eventually
occurs. Thus, fresh catalyst needs to be added to sustain
the conversion reactions (Ferella et al., 2016).
Fluid cracking catalysts (FCC) are widely used in the petroleum industry and
generate significant amounts of waste with rare earth (RE), such as Lanthanum
(La) and Cerium (Ce). Therefore, proper recycling of these materials is of
paramount importance. This review paper highlights the most recent developments
in this field regarding the different leaching and separation processes, such as
solvent extraction and precipitation. Leaching of these wastes was found to be more
effective using hydrochloric acid (HCl) and higher temperatures. On the other
hand, the effectiveness of both solvent extraction and precipitation, as separation
methods, are dependent on the end result required and strategy used. Regardless,
saponified solvent extraction provides extraction with higher efficiency but also
less selective. In terms of precipitation, if a mischmetal of La and Ce is the goal,
either the double sulphate or the oxalic acid addition method are equally effective
on a HCl pregnant solution. Based on these conclusions, a process flowsheet is
herein proposed, adaptable to variations in economic feasibility. In addition,
several research gaps are identified throughout this review in order to further
advance and explore recycling possibilities for FCC recycling.
www.rsd.tfbor.bg.ac.rs
RSD Online ISSN 2560-3132 Print ISSN 1820-7480

S. Maryam Sadeghi et al. Recycling and Sustainable Development 11 (2018) 43-52
44
The spent FCCs can be rejuvenated mostly by
removing impurities, such as V and iron (Fe), which
concentrate in the outer surface and reduce the active
surface available for reaction. However, despite several
developed methods, rejuvenation is not always an option
and has limited commercial application, namely due to
associated costs (Marafi and Stanislaus, 2008). Once
rejuvenation is no longer a possibility, spent FCCs can be
reused in other applications without the need of any
further processing.
One such reuse option is its application in cement
production. It is estimated that FCCs can replace up to
15–20 % of cement content or 10 % of sand without
adverse effect (Al-Jabri et al., 2013) although some
disadvantages of this reuse are also reported (Soriano et
al., 2016).
As a last resort, spent FCCs are still being sent for
disposal in landfills. However, the price of such option
has been increasing steadily. As a hazardous waste, spent
FCCs require several pre-treatments to ensure its safe
disposal and to reduce heavy metal leaching (Marafi and
Stanislaus, 2008).
Before opting for landfill disposal, metal recovery of
spent FCCs should be considered due to the sheer volume
of REEs used in the catalyst; in 2008, 1,980 tons of
cerium(IV) oxide (CeO2) and 17,800 tons of lanthanum
oxide (La2O3) were used for FCC production and it is
expected that these values have increased since then
(Akah, 2017).
Recycling these spent FCCs with the intention of
recovering REEs (La and Ce) have been the subject of
recent research efforts. As a result, this review aims to
assess the existing literature with a focus on
hydrometallurgical processes, to isolate the most
efficient yet simple and cost efficient process flowsheet
for an environmentally friendly recovery of REEs from
spent FCC.
2. FCC recycling process
The process of FCC recycling can be roughly divided
in two major steps. The initial step is the leaching
process, in which strong acid solutions are used to
transfer the metals into a liquid phase. A second step (or
series of steps) involves the separation of the REEs from
contaminants and, eventually, between them, if desirable,
in order to enable their complete recovery. Aspects such
as leaching efficiency and the influence of temperature,
type of acid, etc. will be explored in an initial section
below. Subsequently, two other sections will focus on the
most widely used separation methods, namely solvent
extraction and selective precipitation.
2.1. FCC leaching
The first stage of REEs recovery from spent FCC or
other derivatives is the acid leaching. There is a variety
of numerous inorganic acids studied, which may exhibit
different leaching efficiencies.
To better assess the performance of different acids as
well as other varying conditions, this study compares the
performance of several different works dedicated to this
matter. Although not a complete meta-analysis, some
screening parameters were used to ensure the quality and
relevance of potential comparisons. The studies included
in Table 1 all have the following characteristics:
- Studies of leaching of spent FCC or FC slag,
- Studies that have individual leaching efficiency
values for La and Ce,
- Studies with original data and present in the
Scopus database.
Furthermore, to enable a more comprehensive
comparison of the data, the molar quantity of the leachant
per gram of waste is also reported. Table 1 summarizes
the results compiled from studies on FCC acid leaching,
reported by increasing order of molar acid used per g of
waste.
By analysing Table 1, it can be seen that the lowest
values of Ce leaching efficiencies (25 and 53.5 %,
respectively) were obtained when nitric acid (HNO3) and
sulphuric acid (H2SO4) were used as leachants. However,
the same pattern cannot be found for La leaching
efficiency. Furthermore, Zhao et al., (2017) also details
that preliminary tests indicate that H2SO4 and HNO3 up
to 4 M in similar conditions as described in Table 1 are
only able to recover around 70 % of existing rare earth
elements while HCl is able to obtain 84.3 %. One
possible explanation for this difference presented by
Zhao et al., (2017) was that chloride (Cl-) ions have a
higher coordination effect than nitrate (NO3-) or sulphate
(SO42-). Another aspect is that HNO3 and H2SO4 are also
reported to lead to Ce precipitation, which would require
a secondary leaching in order to increase the recovery of
this rare metal (Zhao et al., 2017).
Regardless of the mechanism in question, the data in
Table 1 suggests that HCl is the most effective mineral
acid that can be used for REEs extraction from FCC. This
is further confirmed in Innocenzi et al., (2015) where a
second leaching with H2SO4 did not significantly
increase the leaching of REEs.
Little to no conclusions can be made regarding the time
and temperature required for leaching. Based on the
results of Zhao et al., (2017), 0.5 hours is clearly
insufficient for leaching and higher temperatures (60 ºC)
are preferable.
The experimental setup and conditions can be difficult
to compare. For instance, Wang et al., (2017b) used a
preliminary caustic selective leaching of aluminium
before the acid leaching, which seemingly increases the
efficiency of the latter.
Other aspects can also be seen in Table 1, like the
influence of varying the solid-to-liquid (S/L) ratio.

S. Maryam Sadeghi et al. Recycling and Sustainable Development 11 (2018) 43-52
45
T
ab
le 1
A
cid
lea
chin
g o
f F
CC
or
FC
rel
ated
was
tes
for
La
and
Ce
reco
ver
y
Sou
rce
T
yp
e
S/L
rati
o
(g/m
L)
Lea
ch
an
t m
mo
l H
+/
g w
ast
e
Tim
e
(h)
T
(ºC
)
Init
ial
Con
cen
trati
on
(%)
La
(%
)
Init
ial
Con
cen
trati
on
(%)
Ce
(%)
(Ngu
yen
et
al.,
20
18
) F
CC
0
.33
HN
O3 2
M
6
1
80
1.8
2
88
.00
0.0
6
25
.00
(Zh
ao e
t al
., 2
017
) F
CC
0
.20
HC
l 2
M
10
2
60
1.9
2
84
.00
0.2
9
83
.00
(Zh
ao e
t al
., 2
017
) F
CC
0
.09
HC
l 1
M
11
9
25
1.6
9
76
.60
1.5
7
95
.50
(Zh
ao e
t al
., 2
017
) F
CC
0
.10
HC
l 2
M
20
2
45
1.9
2
83
.50
0.2
9
86
.40
(Zh
ao e
t al
., 2
017
) F
CC
0
.10
HC
l 2
M
20
2
30
1.9
2
76
.00
0.2
9
81
.00
(Zh
ao e
t al
., 2
017
) F
CC
0
.10
HC
l 2
M
20
0.5
4
5
1.9
2
68
.10
0.2
9
72
.80
(Zh
ao e
t al
., 2
017
) F
CC
0
.10
HC
l 2
M
20
2
60
1.9
2
92
.00
0.2
9
96
.00
(Zh
ao e
t al
., 2
017
) F
CC
0
.09
HC
l 2
M
22
9
25
1.6
9
75
.80
1.5
7
94
.50
(Zh
ao e
t al
., 2
017
) F
CC
0
.05
HC
l 1
M
22
9
25
1.6
9
71
.38
1.5
7
90
.30
(In
no
cen
zi e
t al
., 2
01
5)
FC
C
0.1
5
H2S
O4 2
M
26
.70
3
25
3.0
2
61
.20
0.2
3
53
.50
(In
no
cen
zi e
t al
., 2
01
5)
FC
C
0.1
5
H2S
O4 2
M
26
.70
3
80
3.0
2
89
.00
0.2
3
81
.70
(Wan
g e
t al
., 2
017
a)
FC
sla
g
0.2
5
HC
l 9
M
36
2
20
1.2
0
91
.00
2.4
0
92
.20
(Wan
g e
t al
., 2
017
a)
FC
C
0.2
5
HC
l 9
M
36
2
20
0.3
8
86
.18
1.6
0
82
.30
(Wan
g e
t al
., 2
017
a)
Rey
Zeo
lite
0
.25
HC
l 9
M
36
2
20
1.1
0
97
.94
4.0
0
99
.90
(Wan
g e
t al
., 2
017
b)
FC
sla
g
- H
Cl
3 M
-
3
2
0
3.8
0
98
.60
0.2
5
98
.80
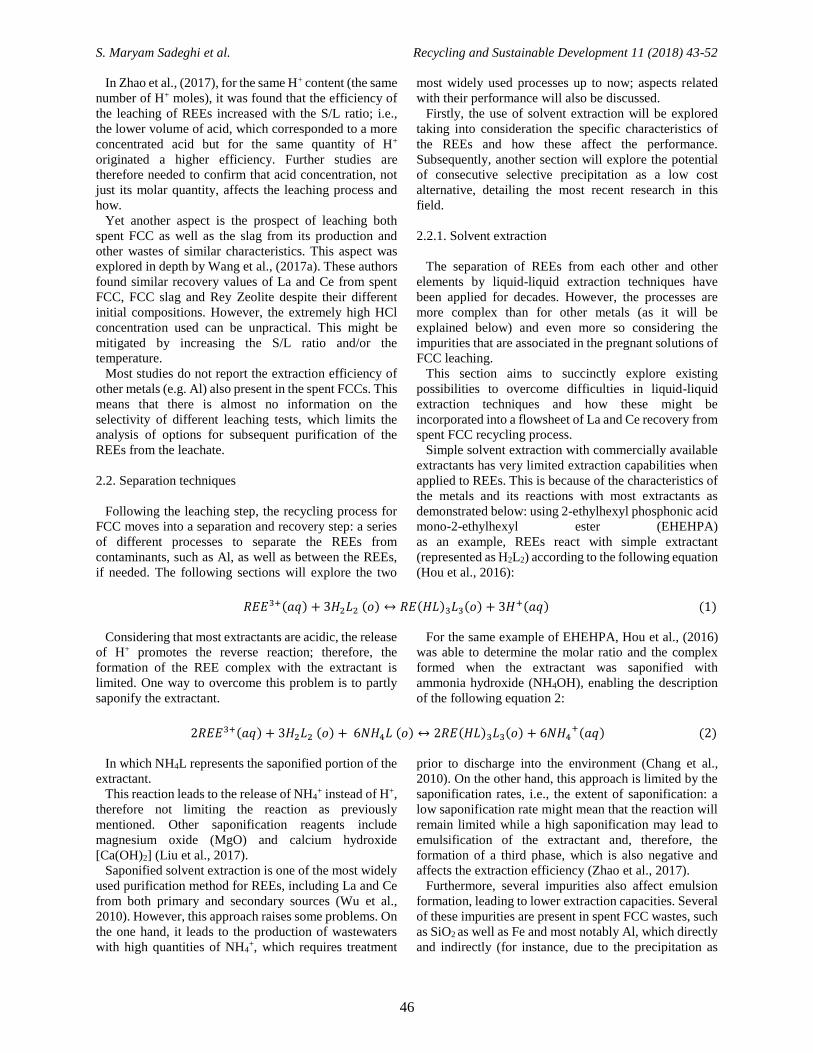
S. Maryam Sadeghi et al. Recycling and Sustainable Development 11 (2018) 43-52
46
In Zhao et al., (2017), for the same H+ content (the same
number of H+ moles), it was found that the efficiency of
the leaching of REEs increased with the S/L ratio; i.e.,
the lower volume of acid, which corresponded to a more
concentrated acid but for the same quantity of H+
originated a higher efficiency. Further studies are
therefore needed to confirm that acid concentration, not
just its molar quantity, affects the leaching process and
how.
Yet another aspect is the prospect of leaching both
spent FCC as well as the slag from its production and
other wastes of similar characteristics. This aspect was
explored in depth by Wang et al., (2017a). These authors
found similar recovery values of La and Ce from spent
FCC, FCC slag and Rey Zeolite despite their different
initial compositions. However, the extremely high HCl
concentration used can be unpractical. This might be
mitigated by increasing the S/L ratio and/or the
temperature.
Most studies do not report the extraction efficiency of
other metals (e.g. Al) also present in the spent FCCs. This
means that there is almost no information on the
selectivity of different leaching tests, which limits the
analysis of options for subsequent purification of the
REEs from the leachate.
2.2. Separation techniques
Following the leaching step, the recycling process for
FCC moves into a separation and recovery step: a series
of different processes to separate the REEs from
contaminants, such as Al, as well as between the REEs,
if needed. The following sections will explore the two
most widely used processes up to now; aspects related
with their performance will also be discussed.
Firstly, the use of solvent extraction will be explored
taking into consideration the specific characteristics of
the REEs and how these affect the performance.
Subsequently, another section will explore the potential
of consecutive selective precipitation as a low cost
alternative, detailing the most recent research in this
field.
2.2.1. Solvent extraction
The separation of REEs from each other and other
elements by liquid-liquid extraction techniques have
been applied for decades. However, the processes are
more complex than for other metals (as it will be
explained below) and even more so considering the
impurities that are associated in the pregnant solutions of
FCC leaching.
This section aims to succinctly explore existing
possibilities to overcome difficulties in liquid-liquid
extraction techniques and how these might be
incorporated into a flowsheet of La and Ce recovery from
spent FCC recycling process.
Simple solvent extraction with commercially available
extractants has very limited extraction capabilities when
applied to REEs. This is because of the characteristics of
the metals and its reactions with most extractants as
demonstrated below: using 2-ethylhexyl phosphonic acid
mono-2-ethylhexyl ester (EHEHPA)
as an example, REEs react with simple extractant
(represented as H2L2) according to the following equation
(Hou et al., 2016):
𝑅𝐸𝐸3+(𝑎𝑞) + 3𝐻2𝐿2 (𝑜) ↔ 𝑅𝐸(𝐻𝐿)3𝐿3(𝑜) + 3𝐻+(𝑎𝑞) (1)
Considering that most extractants are acidic, the release
of H+ promotes the reverse reaction; therefore, the
formation of the REE complex with the extractant is
limited. One way to overcome this problem is to partly
saponify the extractant.
For the same example of EHEHPA, Hou et al., (2016)
was able to determine the molar ratio and the complex
formed when the extractant was saponified with
ammonia hydroxide (NH4OH), enabling the description
of the following equation 2:
2𝑅𝐸𝐸3+(𝑎𝑞) + 3𝐻2𝐿2 (𝑜) + 6𝑁𝐻4𝐿 (𝑜) ↔ 2𝑅𝐸(𝐻𝐿)3𝐿3(𝑜) + 6𝑁𝐻4
+(𝑎𝑞) (2)
In which NH4L represents the saponified portion of the
extractant.
This reaction leads to the release of NH4+ instead of H+,
therefore not limiting the reaction as previously
mentioned. Other saponification reagents include
magnesium oxide (MgO) and calcium hydroxide
[Ca(OH)2] (Liu et al., 2017).
Saponified solvent extraction is one of the most widely
used purification method for REEs, including La and Ce
from both primary and secondary sources (Wu et al.,
2010). However, this approach raises some problems. On
the one hand, it leads to the production of wastewaters
with high quantities of NH4+, which requires treatment
prior to discharge into the environment (Chang et al.,
2010). On the other hand, this approach is limited by the
saponification rates, i.e., the extent of saponification: a
low saponification rate might mean that the reaction will
remain limited while a high saponification may lead to
emulsification of the extractant and, therefore, the
formation of a third phase, which is also negative and
affects the extraction efficiency (Zhao et al., 2017).
Furthermore, several impurities also affect emulsion
formation, leading to lower extraction capacities. Several
of these impurities are present in spent FCC wastes, such
as SiO2 as well as Fe and most notably Al, which directly
and indirectly (for instance, due to the precipitation as

S. Maryam Sadeghi et al. Recycling and Sustainable Development 11 (2018) 43-52
47
(Fe(OH)3SiO2·NH2O) increase and stabilize
emulsification (Wu et al., 2010). Due to the limitations of
the saponified solvent extraction method, several other
avenues have also been explored in liquid-liquid
extraction of REEs. One such possibility is the complex
induced extraction. This method aims to replace
saponification as a solution to the abovementioned issue
of H+ production by adding a complexing agent.
One such complexing agent is lactic acid,
which forms several complexes with the REEs and
enables the following extraction reaction - equation 3
(Yin et al., 2013):
𝑅𝐸(𝐿𝑎𝑐)𝑥
(3−𝑥)+(𝑜) + 3 𝐻2𝐿2 (𝑜) ↔ 𝑅𝐸𝐴33𝐻𝐴 (𝑜) + (3 − 𝑥)𝐻+(𝑎𝑞) + 𝑥𝐿𝐴𝐶 (𝑎𝑞) (3)
In which ‘x’ represents the number of the moles of the
ligand in the REE complex and ‘Lac’ represents the
lactate ion. The higher the ‘x’ the lower the H+ produced.
Several other compounds have been tested, such as
citric acid, acetic acid, ethylenediamine tetraacetic acid
(EDTA), etc. to name a few (Kashi et al., 2018).
It is reported that the addition of these complexing
agents enhance the selectivity among different REEs as
well as improves the overall extraction efficiency. For
instance, Zhang et al., (2016) found that the presence of
0.6 mol/L of lactic acid combined with the extractant 2-
ethylhexylphosphonic acid mono-2-ethylhexyl ester
P507 increased the distribution ratio up to 8 times for Ce
(at pH 2) and up to 25 times for La (at pH 3.5).
Another strategy that might even allow the use of
unsaponified extractant is the synergetic extraction. As
the name suggests, it involves the synergetic combination
of two or more different extractants in such a way that the
extraction efficiency is improved, being higher than the
sum of the individual extractants (Song et al., 2009).
For instance, a combination of the extractant
8-hydroxyquinoline (HQ) with bis(2,4,4-
trimethylpentyl)dithiophosphinic acid (Cyanex 301) has
a La distribution ratio up to 3.3 times higher than the ones
observed for HQ and Cyanex 301 when tested
independently (Tian et al., 2013).
Zhang et al., (2014) combined both principles using a
complex induced synergetic solvent extraction – a
mixture of 2-ethylhexylphosphonic mono-2-ethylhexyl
ester (HEHEHP) and di-2-ethylhexyl phosphoric acid
(D2EHPA), as extractants, and lactic and citric acids, as
complexing agents.
In this study, it was found that lactic acid was able to
increase the extraction capacity of Ce and La by two-fold
for both extractants separately.
However, this value decreased when the two
extractants tested were mixed. However, mixing the two
extractants with the lactic acid increases the separation
factor.
Only a few recent studies have analysed the potential
and limitations of liquid-liquid extractions when applied
to FCC recycling and metal recovery (Table 2).
Table 2
Solvent extraction applied to FCC pregnant solutions containing La and Ce (pHe – equilibrium pH; SE – stripping efficiency)
Source (Innocenzi et al., 2015) (Zhao et al., 2017) (Nguyen et al., 2018) (Ye et al., 2017)
Extractant D2EHPA* 20 %
(v/v)
D2EHPA* 16 %
(v/v)
D2EHPA* + TBP**
(4:1 ratio)
EHEHPA***
(20 % saponified
w/ammonia)
Solvent n-hexane kerosene n-octane kerosene
pHe 2.25 2.5 < 1 3.17
Time (min) - 10 10 -
A/O ratio - 1 - 2
La extraction (%) 95 85
72 100
Ce extraction (%) 98 89 100
Al extraction (%) - 50 0 100
Stripping agent HNO3 4 M HCl 2 M - HCl 1 M
SE (%) - La 82 62.88
- 96
SE (%) - Ce 79 -
* D2HPA - di-2-ethylhexyl phosphoric acid
** TBP - tributyl phosphate
*** EHEPA - 2-ethylhexyl phosphoric acid-2-ethylhexyl ester

S. Maryam Sadeghi et al. Recycling and Sustainable Development 11 (2018) 43-52
48
To the best of the authors’ knowledge, these 4 studies
are the only ones that incorporate liquid-liquid extraction
into a spent FCC recycling flowsheet. This obviously
represents a data gap in this field that needs to be
addressed. Based on Table 2, D2EHPA is the most tested
extractant with n-hexane being the solvent that seems to
enable a better extraction performance when compared to
kerosene and n-octane. However, with n-octane and
added TBP, a high extraction is possible even at low pH;
this extraction was extremely selective to the REEs with
no Al being co-extracted. Saponification, as
demonstrated in Ye et al., (2017), leaded to very high
extraction, but not selective to REEs; under these
conditions, all Al was also co-extracted. Stripping
performance varies with the different studies, likely a
reflection of the different quantities being extracted in the
first stage of the process. The challenge is to explore the
incorporation of these techniques into a flowsheet of
spent FCC recovery taking into consideration the specific
characteristics of the leachates that are formed during the
process, particularly its impurities.
2.2.2. Consecutive selective precipitations
Another strategy to recover the REEs present in the
FCCs leachates is to selectively precipitate them.
However, as is the case for solvent extraction, research
on this issue remains scarce.
There are two main issues to be addressed: (i) to
separate the REEs, La and Ce, from the rest of the
impurities and (ii) separate La and Ce from each other.
The choice of one over the other depends on the end use
and the necessary purity; a precipitated containing both
La and Ce can still be used as a mischmetal for several
applications, whilst specific needs require pure La or
pure Ce. To accomplish the second option, Ce3+ can be
selectively precipitated from La and Al by oxidation
whilst Al and La remain in the solution. For a simplified
simulation of the potential selectivity of this approach,
Medusa software (Puigdomenech, 2004) was applied to
draw Pourbaix diagrams for Ce, La and Al using data
from Zhao et al., (2017). The concentrations considered
in this simplified model were: 0.013, 0.002 and 0.48
mol/L for La, Ce and Al, respectively.
Results are represented in figure 1, which shows that
Ce can be easily separated and purified from La and Al
by raising the redox potential (Eh) to approximately 1.6
V in the pH range between 1.0 and 2.5; under these
conditions, Pourbaix diagrams predict that Ce3+ is
oxidized to Ce 4+, which precipitates as cerium (IV) oxide
(CeO2) while La and Al remain soluble as M3+.
However, this strategy, should only be applied if an
appreciable amount of Ce is present in the leachate and
the ultimate goal is to recover Ce and La with high
purity.
For the separation of La and Ce from the rest of the
impurities in the pregnant solution, two main options are
described in the literature: (i) the precipitation of double
sulphate salts – NaRE(SO4)2·H2O and oxalate
precipitation in the form of RE2(C2O4)3. In this case, the
main precipitates are either NaLa(SO4)2 or La2(C2O4)3 for
the double salt precipitation or the oxalate precipitation
strategies, respectively.
Figure 1. Pourbaix diagrams for Ce (A), La (B) and Al (C) in the pH
range 0.0 and 3.0. Initial conditions Al 0.48 M, La 0.002 M, Ce 0.0013 M
A
B
C

S. Maryam Sadeghi et al. Recycling and Sustainable Development 11 (2018) 43-52
49
Although scarcely, literature describes application of
these two precipitation methods for recovering REEs
from FCCs leachates. For example, Innocenzi et al.,
(2015) initially precipitated La and Ce as double sulphate
salts by increasing the pH up to 2 after extraction with
sulphuric acid. This lead to a precipitation yield of 100
%, with a RE purity between 75 and 80 %.
These authors have also tested oxalic acid precipitation,
achieving a precipitate with 37-47 % La and 3.06-3.11 %
Ce (w/w) content.
However, this precipitation was only performed after
solvent extraction; even though an absolute comparison
between the different precipitation approaches is
extremely difficult, results suggest that oxalic acid
precipitation is capable of yielding a precipitate with
higher purity in REEs.
Wang et al., (2017b) performed oxalic acid
precipitation prior to any other separation method and
was able to achieve a final product with 98.7 % RE purity
after calcination. This again seems to confirm that oxalic
acid precipitation is capable of producing a final product
with very high purity.
Finally, Wang et al., (2017a) tested a sequence of
precipitation steps for recovering REEs from a
hydrochloric acid leachate. Initially, REEs were
precipitated, as NaRE(SO4)2·H2O, using Na2SO4 at 300
% of its stoichiometric proportion with 99 % efficiency;
under these conditions, only 2 % of Al co-precipitated
together with REEs.
Subsequently, this precipitate was converted into
RE(OH)3 by reacting with NaOH and then to RECl3 by
dissolution in HCl; a final product with a total recovery
of 90.2 % of the REEs ready for immediate and direct
reuse in zeolite production was achieved. Even though
high total REEs recovery with high purity was achieved,
the recycling procedure is not simple containing several
steps, which consume a huge amount of reagents. In
conclusion, further studies seem to be required in order
to better assess the potential of consecutive and selective
precipitations, particularly considering its potential to
substantially simplify the process and reduce operational
costs without compromising the final purity of the
recycled REEs.
2.3. Process analysis
Potential flowsheet(s) for complete recovery of REEs
from spent FCC is shown in figure 2. Initially, an acid
leaching step should be implemented in order to extract
the REEs from the solid matrix into the aqueous phase as
it was mentioned in section for FCC leaching. Literature
describes the use of several mineral acids for this purpose
but the nature of the anion may affect the yield of the
REEs leaching and, consequently, the entire recovery
process.
Preferably with HCl, as demonstrated in this article,
leaching begins the process creating a solid waste made
of zeolite from the FCC (which can, in theory, be reused
to produce new FCC if reprocessed) and a leachate
containing the REEs, such as La and Ce, plus Al, Si and
other minor amounts of other metals, as for example Fe.
This leachate requires further processing with the goal
to obtain either pure Ce or La or reusable mischmetals.
As it was discussed throughout this work, solvent
extraction can be used either with a single extractant or
with a synergetic combination of extractants.
Furthermore, solvent extraction can be also applied
through saponified extractants or complex induced to
enhance its extraction capacities. However, saponified
extractants leads to the production of high-strength
wastewater, particularly ammonia, which requires added
and more expensive treatment.
Figure 2. Schematic flowsheet for complete recovery of REE from spent FCC. Legend: Green – final, highly pure products for reuse; Red – final low purity products ready for reuse; Blue – potentially reusable wastes

S. Maryam Sadeghi et al. Recycling and Sustainable Development 11 (2018) 43-52
50
Regardless of the solvent extraction type, a highly pure
solution of La and Ce can be obtained from the stripping
step of the solvent extraction, facilitating precipitation.
Alternatively, instead of using solvent extraction,
precipitation can be performed directly either by adding
Na2SO4 to obtain double sulphate salts of Ce and La or
by adding oxalic acid or an oxalate salt to precipitate both
La and Ce, as well.
Both these strategies required further purification steps.
In the case of the double sulphate strategies, one
possibility lays on converting the precipitate first to
RE(OH)3 (using NaOH) and then finally to an end
product mischmetal of RECl3, which is reusable to
produce new FCC or other materials (Wang et al.,
2017a). In the case of oxalate addition, a calcination step
would yield a mischmetal of RE oxides, also directly
reusable for FCC production (Geus and D'Appolonia,
2017).
Finally, a selective precipitation to separate Ce from La
is also possible, but likely at a higher cost. Through
oxidation of Ce3+ to Ce4+ and consequent precipitation as
an oxide, a pure Ce precipitate could be obtained and
reused as raw material. The La remaining in the solution
could then be precipitated by the other methods referred
in this study, preferably through oxalic acid addition plus
calcination to obtain a pure La precipitate also ready to
be reused as a raw material in the industry.
Considering the current prices of the REEs present in
FCC, it seems to be of more practical use to precipitate
them at low cost, as oxide mischmetal, to substitute
existing mischmetal in the market. However, the
proposed flowsheet can adapt to changing prices and
market demands, and if prices will increase, the
obtainment of pure Ce and/or La may became more
advantageous.
3. Conclusion
This review aimed at presenting novel developments in
the methodologies of recycling fluid cracking catalysts
(FCC) as well as to formulate a tentative process
flowsheet.
Regarding leaching and, based on the comparison of
different leaching strategies, it can be concluded that
hydrochloric acid is the most efficient acid tested across
multiple studies. Using this acid, it is possible to extract
high quantities of both La and Ce from FCC wastes as
well as from FC slag and rey zeolites, two wastes from
the FCC production itself.
Furthermore, temperature plays an important role on
the extraction efficiency of the REEs during leaching.
Some other aspects can be highlighted, although
requiring further research, such as the fact that the
concentration of acid, and not only its quantity, has a
significant impact on the leaching efficiency.
The explored separation techniques for metal selection
are characterized by a shortage of recent articles. Still,
through a combination of studies in similar fields and the
existing studies dedicated to these techniques for FCC
recycling, some conclusions can be drawn. Regarding
solvent extraction, results suggest that saponified
extraction can lead to higher extraction efficiencies but
also to a higher wastewater production and lack of
selectivity; in this aspect, a compromise between
selectivity and extraction capacity will always depend on
the subsequent treatments and recycling objectives.
Selective precipitation can also be applied in multiple
forms, either through addition of oxalic acid or double
sulphate precipitation with similar selectivity, final purity
and precipitation yield (although more studies are needed
to confirm these aspects further). Similar to solvent
extraction, however, the methodology to be adopted
depends heavily on the final objectives. Having these
multiple possibilities in mind, a process flowsheet was
developed and discussed in this study.
The proposed process is adaptable to variations in the
price of the commodities to be extracted, in this case the
REE La and Ce, with options to increase purity and
selectivity, if economically viable, or to precipitate these
two metals together into a mischmetal that can be used
directly in the industry.
Acknowledgments
This work was performed in the framework of the
financing with reference LAQV (UID/ QUI/50006/2013
- POCI/01/0145/FEDER/007265) with financial support
from FCT/MEC through national funds and co-financed
by FEDER, under the Partnership Agreement PT2020. S. Maryam Sadeghi would like to thank the support
from her grant with reference SFRH/BD/95540/2013
from FCT.
References
Akah A., Application of rare earths in fluid catalytic
cracking: A review, Journal of Rare Earths, 35 (10),
2017, 941-956,
Al-Jabri K., Baawain M., Taha R., Al-Kamyani Z. S., Al-
Shamsi K., Ishtieh A., Potential use of FCC spent
catalyst as partial replacement of cement or sand in
cement mortars, Construction and Building
Materials, 39, 2013, 77-81,
Chang H., Li M., Liu Z., Hu Y., Zhang F., Study on
separation of rare earth elements in complex system,
Journal of Rare Earths, 28, 2010,116-119,
Ferella F., Innocenzi V., Maggiore F., Oil refining spent
catalysts: A review of possible recycling
technologies, Resources, Conservation and
Recycling, 108, 2016, 10-20,
Geus and D'Appolonia, Development of a Sustainable
Exploitation Scheme for Europe's Rare Earth Ore
Deposits, Machacek E., Kalvig P., 2017, 163,
http://promine.gtk.fi/documents_news/promine_final

S. Maryam Sadeghi et al. Recycling and Sustainable Development 11 (2018) 43-52
51
_conference/8_50_PASPALIARIS_EURARE_proje
ct_promine.pdf , 19.09.2018.,
Hou H., Xu J., Wang Y., Chen J., Solvent extraction of
lanthanum and cerium ions from hydrochloric acidic
aqueous solutions using partly saponified 2-
ethylhexyl phosphonic acid mono-2-ethylhexyl ester,
Chinese Journal of Chemical Engineering, 24 (1),
2016, 79-85,
Puigdomenech I., Hydra/Medusa Chemical Equilibrium
Database and Plotting Software (2004), KTH Royal
Institute of Technology, freely downloadable
software at http://www.kemi.kth.se/medusa
overtaken 06.08.2018.,
Innocenzi V., Ferella F., De Michelis I., Vegliò F.,
Treatment of fluid catalytic cracking spent catalysts
to recover lanthanum and cerium: Comparison
between selective precipitation and solvent
extraction, Journal of Industrial and Engineering
Chemistry, 24, 2015, 92-97,
Kashi E., Habibpour R., Gorzin H., Maleki A., Solvent
extraction and separation of light rare earth elements
(La, Pr and Nd) in the presence of lactic acid as a
complexing agent by Cyanex 272 in kerosene and the
effect of citric acid, acetic acid and Titriplex III as
auxiliary agents, Journal of Rare Earths, 36 (3), 2018,
317-323,
Liu Y., Sohn S. H., Lee M. S., Methods for the
substitution of common saponification systems for
the solvent extraction of REEs, Geosystem
Engineering, 20 (2), 2017, 111-118,
Marafi M., and Stanislaus A., Spent catalyst waste
management: A review: Part I—Developments in
hydroprocessing catalyst waste reduction and use,
Resources, Conservation and Recycling, 52 (6), 2008,
859-873,
Nguyen L.P., Pham Y. T. H., Ngo P. T., Tran T. V., Tran
L. V.,. Le N. T. H, Nguyen L. H., Dang T. T., Nguyen
D. A., Wenzel M., Hartmann D., Gloe K., Weigand J.
J., Kretschmer K., Production of high purity rare earth
mixture from iron-rich spent fluid catalytic cracking
(FCC) catalyst using acid leaching and two-step
solvent extraction process, Korean Journal of
Chemical Engineering, 35 (5), 2018, 1195-1202,
Song N., Tong S., Liu W., Jia Q., Zhou W., Lia W.,
Extraction and separation of rare earths from chloride
medium with mixtures of 2-ethylhexylphosphonic
acid mono-(2-ethylhexyl) ester and sec-
nonylphenoxy acetic acid, Journal of Chemical
Technology & Biotechnology, 84 (12), 2009, 1798-
1802,
Soriano L., Payá J., Monzó J., Borrachero M. V.,
Tashima M. M., High strength mortars using ordinary
Portland cement–fly ash–fluid catalytic cracking
catalyst residue ternary system (OPC/FA/FCC),
Construction and Building Materials, 1067, 2016,
228-235,
Tian M., Jia Q., Liao W., Studies on synergistic solvent
extraction of rare earth elements from nitrate medium
by mixtures of 8-hydroxyquinoline with Cyanex 301
or Cyanex 302, Journal of Rare Earths, 31 (6), 2013,
604-608,
Vogt E. T. C., Weckhuysen B. M., Fluid catalytic
cracking: recent developments on the grand old lady
of zeolite catalysis, Chemical Society Reviews, 44
(20), 2015, 7342-7370,
Wang J., Huang X., Cui D., Wang L., Feng Z., Hu B.,
Long Z., Zhao N., Recovery of rare earths and
aluminum from FCC waste slag by acid leaching and
selective precipitation, Journal of Rare Earths, 35
(11), 2017a, 1141-1148,
Wang J., Xu Y., Wang L., Zhao L., Wang Q., Cui D.,
Long Z., Huang X., Recovery of rare earths and
aluminum from FCC catalysts manufacturing slag by
stepwise leaching and selective precipitation, Journal
of Environmental Chemical Engineering, 5 (4),
2017b, 3711-3718,
Wu W., Li D., Zhao Z., Chen J., Zhang F., Yin S., Qian
M., Bian X., Formation mechanism of micro
emulsion on aluminum and lanthanum extraction in
P507-HCl system, Journal of Rare Earths, 28, 2010,
174-178,
Ye S., Jing Y., Wang Y., Fei W., Recovery of rare earths
from spent FCC catalysts by solvent extraction using
saponified 2-ethylhexyl phosphoric acid-2-
ethylhexyl ester (EHEHPA), Journal of Rare Earths,
35 (7), 2017, 716-722,
Yin S., Wu W., Bian X., Luo Y., and Zhang F., Solvent
Extraction of Lanthanum Ion from Chloride Medium
by Di-(2-ethylhexyl) Phosphoric Acid with a
Complexing Method, International Journal of
Nonferrous Metallurgy, 2 (2), 2013, 75-79,
Zhang F., Wu W., Bian X., Zeng W., Synergistic
extraction and separation of lanthanum (III) and
cerium (III) using a mixture of 2-
ethylhexylphosphonic mono-2-ethylhexyl ester and
di-2-ethylhexyl phosphoric acid in the presence of
two complexing agents containing lactic
acid and citric acid, Hydrometallurgy, 149, 2014,
238-243,
Zhang F., Wu W., Dai J., Bian X., Extraction and
separation of Pr(III)/Ce(III) from chloride medium by
2-ethylhexylphosphonic acid mono-(2-ethylhexyl)
ester in the presence of two complexing agents,
Separation Science and Technology, 51 (5), 2016,
778-783,
Zhao Z., Z. Qiu, J. Yang, S. Lu, L. Cao, W. Zhang, Y.
Xu, Recovery of rare earth elements from spent fluid
catalytic cracking catalysts using leaching and
solvent extraction techniques, Hydrometallurgy, 167,
2017, 183-188.

S. Maryam Sadeghi et al. Recycling and Sustainable Development 11 (2018) 43-52
52
Dobijanje retkih zemljinih metala recikliranjem
istrošenih katalizatora - pregled
S. Maryam Sadeghi, João M.O.M. Jesus, Helena M.V.M Soares #
Univerzitet u Portu, Fakultet inženjerstva, Portugal
INFORMACIJE O RADU I Z V O D
Primljen 30 septembar 2018
Prihvaćen 13 novembar 2018
Pregledni rad
Ključne reči: Katalitičko krekovanje u fluidnom
sloju
Kiselo luženje
(Saponifikovana) solventna ekstrakcija
Selektivno taloženje
Lantan
Cerijum
Katalitičko krekovanje u fluidizovanom sloju (eng. FCC) koje ima široku primenu
u naftnoj industriji proizvodi značajnu količinu otpada koji sadrži retke zemljine
elemente, kao što su lantan (La) i cerijum (Ce). Dakle, odgovarajuće recikliranje
ovih materijala je od velike važnosti. U ovom pregledu se ističu najnoviji pomaci
u ovoj oblasti hemijskih postupaka luženja i separacije, kao što su solventna
ekstrakcija i taloženje. Luženje ovih otpada efikasnije je u prisustvu
hlorovodonične kiseline (HCl) i na visokim temperaturama. S druge strane,
efikasnost solventne ekstrakcije i taloženja kao metoda za separaciju zavisi od
traženog krajnjeg rezultata i strategije koja se koristi. Uprkos tome,
saponifikovanom solventnom ekstrakcijom se postiže veća efikasnost, ali i manja
selektivnost. Što se tiče taloženja, ako je cilj da se dobije mišmetal koji sadrži La i
Ce, podjednako je efikasan i metod sa dodavanjem sulfata i oksalne kiseline u
rastvor HCl. Na osnovu ovih zaključaka, u radu je predložen dijagram postupka
koji je podložan promenama u vezi sa ekonomskom ostvarivošću. Pored toga, u
pregledu je uočeno i nekoliko propusta na osnovu kojih mogu da se unaprede i
ispitaju mogućnosti recikliranja katalizatora.

Recycling and Sustainable Development 11 (2018) 53-62
Corresponding autor: [email protected]
doi: 10.5937/ror1801053K
Recycling and Sustainable Development
Optimization of biodiesel production from corn oil
by methanolysis catalyzed by corn cob ash
Milan D. Kostić a, Marija B. Tasić a, Ivica G. Đalović b, Milan O. Biberdžić c,
Petar M. Mitrović b, Olivera S. Stamenković a, Vlada B. Veljković a, #
a University of Nis, Faculty of Technology, Leskovac, Serbia b Institute of Field and Vegetable Crops, Novi Sad, Serbia
c University of Pristina, Faculty of Agriculture, Lesak, Serbia
A R T I C L E I N F O A B S T R A C T
Received 30 September 2018
Accepted 21 November 2018
Research Article
Keywords: Biodiesel
Corn cob ash
Corn germs
Optimization
Response surface methodology
Transesterification
1. Introduction
Biodiesel, a mixture of fatty acid alkyl esters (FAAE)
that satisfy the prescribed standards, such as EN14240, is
commonly produced by esterification of free fatty acids
(FFAs) and/or transesterification (alcoholysis) of
triacylglycerols (TAG) from various renewable
bioresources with methanol or ethanol, in the presence of
a catalyst. Because of its growing use (Živković et al.,
2017) and almost unchangeable price (Veljković et al.,
2018), biodiesel production is expected to expand from
29.7 · 106 m3 in 2014 to 39 · 106 m3 in 2024, which is a
27 % increase (OECD/FAO, 2015). The main feedstocks
for biodiesel production are oil crops like rapeseed,
soybean, and palm oils, which mainly contribute to the
high biodiesel production price. Therefore, other oil
crops that could grow on marginal lands and produce
non-edible oils should be looked for. Besides that, low-
The use of low-cost or priceless feedstocks such as byproducts in biodiesel
production results in a reduced overall process costs. The present paper reports the
use of corn germs and corn cobs as byproducts from corn-based starch production
in the biodiesel production by the methanolysis of the oil extracted from corn
germs, catalyzed by the ash produced by combustion of corn cobs. The major aim
was to optimize the methanol-to-oil molar ratio, catalyst loading, and reaction time
in a batch stirred reactor with respect to the content of methyl ester fatty acids
(FAME). The statistical modeling and optimization were carried out using a
second-order polynomial (quadratic) model developed by the response surface
methodology combined with a 33 factorial design with 3 central points. The FAME
content was determined by a high-pressure liquid chromatography method. The
analysis of variance showed that only the catalyst amount, the reaction time, the
catalyst amount interaction with reaction time and all three quadratic terms were
the significant model terms with the confidence level of 95 %. The optimum
reaction conditions (the catalyst amounts of 19.8 %, the methanol-to-oil molar ratio
of 9.4 mol/mol and the reaction time of 31 min) provided the FAME content of
98.1 %, which was in an excellent agreement with the predicted FAME content
(98.4 %). Thus, both corn germs and corn cobs may be suitable feedstocks for
biodiesel production.
www.rsd.tfbor.bg.ac.rs
RSD Online ISSN 2560-3132 Print ISSN 1820-7480
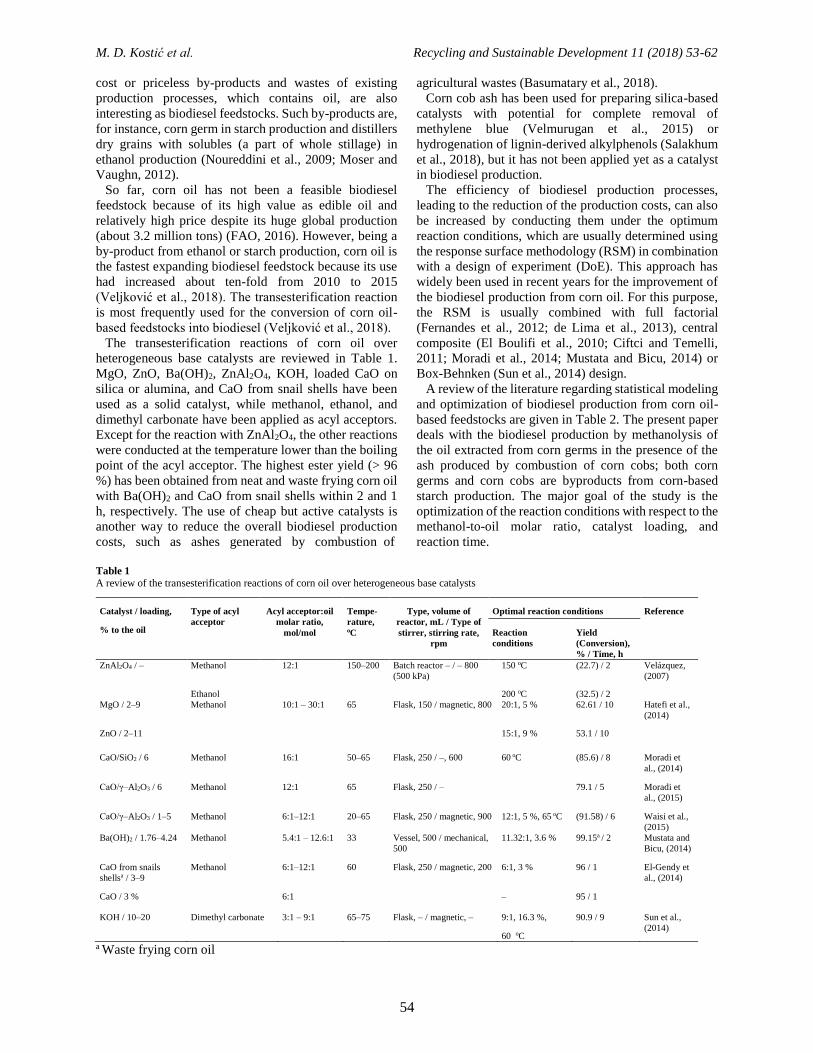
M. D. Kostić et al. Recycling and Sustainable Development 11 (2018) 53-62
54
cost or priceless by-products and wastes of existing
production processes, which contains oil, are also
interesting as biodiesel feedstocks. Such by-products are,
for instance, corn germ in starch production and distillers
dry grains with solubles (a part of whole stillage) in
ethanol production (Noureddini et al., 2009; Moser and
Vaughn, 2012).
So far, corn oil has not been a feasible biodiesel
feedstock because of its high value as edible oil and
relatively high price despite its huge global production
(about 3.2 million tons) (FAO, 2016). However, being a
by-product from ethanol or starch production, corn oil is
the fastest expanding biodiesel feedstock because its use
had increased about ten-fold from 2010 to 2015
(Veljković et al., 2018). The transesterification reaction
is most frequently used for the conversion of corn oil-
based feedstocks into biodiesel (Veljković et al., 2018).
The transesterification reactions of corn oil over
heterogeneous base catalysts are reviewed in Table 1.
MgO, ZnO, Ba(OH)2, ZnAl2O4, KOH, loaded CaO on
silica or alumina, and CaO from snail shells have been
used as a solid catalyst, while methanol, ethanol, and
dimethyl carbonate have been applied as acyl acceptors.
Except for the reaction with ZnAl2O4, the other reactions
were conducted at the temperature lower than the boiling
point of the acyl acceptor. The highest ester yield (> 96
%) has been obtained from neat and waste frying corn oil
with Ba(OH)2 and CaO from snail shells within 2 and 1
h, respectively. The use of cheap but active catalysts is
another way to reduce the overall biodiesel production
costs, such as ashes generated by combustion of
agricultural wastes (Basumatary et al., 2018).
Corn cob ash has been used for preparing silica-based
catalysts with potential for complete removal of
methylene blue (Velmurugan et al., 2015) or
hydrogenation of lignin-derived alkylphenols (Salakhum
et al., 2018), but it has not been applied yet as a catalyst
in biodiesel production.
The efficiency of biodiesel production processes,
leading to the reduction of the production costs, can also
be increased by conducting them under the optimum
reaction conditions, which are usually determined using
the response surface methodology (RSM) in combination
with a design of experiment (DoE). This approach has
widely been used in recent years for the improvement of
the biodiesel production from corn oil. For this purpose,
the RSM is usually combined with full factorial
(Fernandes et al., 2012; de Lima et al., 2013), central
composite (El Boulifi et al., 2010; Ciftci and Temelli,
2011; Moradi et al., 2014; Mustata and Bicu, 2014) or
Box-Behnken (Sun et al., 2014) design.
A review of the literature regarding statistical modeling
and optimization of biodiesel production from corn oil-
based feedstocks are given in Table 2. The present paper
deals with the biodiesel production by methanolysis of
the oil extracted from corn germs in the presence of the
ash produced by combustion of corn cobs; both corn
germs and corn cobs are byproducts from corn-based
starch production. The major goal of the study is the
optimization of the reaction conditions with respect to the
methanol-to-oil molar ratio, catalyst loading, and
reaction time.
Table 1
A review of the transesterification reactions of corn oil over heterogeneous base catalysts
Catalyst / loading,
% to the oil
Type of acyl
acceptor
Acyl acceptor:oil
molar ratio,
mol/mol
Tempe-
rature, oC
Type, volume of
reactor, mL / Type of
stirrer, stirring rate,
rpm
Optimal reaction conditions Reference
Reaction
conditions
Yield
(Conversion),
% / Time, h
ZnAl2O4 / – Methanol 12:1 150–200 Batch reactor – / – 800
(500 kPa)
150 oC (22.7) / 2 Velázquez,
(2007)
Ethanol 200 oC (32.5) / 2
MgO / 2–9 Methanol 10:1 – 30:1 65 Flask, 150 / magnetic, 800 20:1, 5 % 62.61 / 10 Hatefi et al.,
(2014)
ZnO / 2–11 15:1, 9 % 53.1 / 10
CaO/SiO2 / 6 Methanol 16:1 50–65 Flask, 250 / –, 600 60 oC (85.6) / 8 Moradi et
al., (2014)
CaO/γ–Al2O3 / 6 Methanol 12:1 65 Flask, 250 / – 79.1 / 5 Moradi et
al., (2015)
CaO/γ–Al2O3 / 1–5 Methanol 6:1–12:1 20–65 Flask, 250 / magnetic, 900 12:1, 5 %, 65 oC (91.58) / 6 Waisi et al.,
(2015)
Ba(OH)2 / 1.76–4.24 Methanol 5.4:1 – 12.6:1 33 Vessel, 500 / mechanical,
500
11.32:1, 3.6 % 99.15a / 2 Mustata and
Bicu, (2014)
CaO from snails
shellsa / 3–9
Methanol 6:1–12:1 60 Flask, 250 / magnetic, 200 6:1, 3 % 96 / 1 El-Gendy et
al., (2014)
CaO / 3 % 6:1 – 95 / 1
KOH / 10–20 Dimethyl carbonate 3:1 – 9:1 65–75 Flask, – / magnetic, – 9:1, 16.3 %,
60 oC
90.9 / 9 Sun et al.,
(2014)
a Waste frying corn oil

M. D. Kostić et al. Recycling and Sustainable Development 11 (2018) 53-62
55
Ta
ble
2
Th
e re
vie
w o
f th
e li
tera
ture
reg
ard
ing t
o s
tati
stic
al m
od
elin
g a
nd o
pti
miz
atio
n o
f bio
die
sel
pro
du
ctio
n f
rom
corn
oil
–b
ased
fee
dst
ock
s
Fee
dst
ock
a W
FC
O
CO
C
O
CO
C
O
CO
C
O
CO
Acy
l ac
cep
torb
M
eOH
M
eOH
M
eOH
D
MC
M
eOH
M
eOH
E
tOH
E
tOH
Cat
alyst
c
CaO
C
aO/s
ilic
a B
a(O
H) 2
K
OH
L
ipas
e
KO
H
NaO
H
NaO
H,
KO
H
Des
ign
of
exp
erim
ents
d
D–
OD
B
BD
C
CD
B
BD
C
CD
F
FD
C
CD
F
FD
fF
D
CC
D
Nu
mb
er o
f fa
cto
rs
4
3
3
3
4
2
2
2
6
2
Nu
mb
er o
f le
vel
s 3
3
5
3
5
2
5
3
2
5
Res
po
nse
e E
Y
EP
E
Y
EY
E
Y
EP
E
Y
EY
E
P
EY
E
Y
Rea
ctio
n t
emp
erat
ure
(А
)
Mo
lar
rati
o (
B)
Cat
alyst
am
ou
nt
(C)
Rea
ctio
n t
ime
(D)
Sti
rrin
g s
pee
d (
E)
Pre
ssu
re (
F)
CO
2 f
low
rat
e (G
)
Infl
uen
tial
fac
tors
f B
, C
, D
, B
2, C
2
C,
E,
C2
C,
E,
C2
B,
C,
B2,
C2
ng
g
A,
B,
A2
A,
C,
A·C
A
, C
, A
·C
B,
C,
C2
To
scr
een
fact
ors
ng
Ref
eren
ce
El-
Gen
dy e
t al
.,
(201
4)
Mo
rad
i et
al.
,
(201
4)
Mu
stat
a
and
Bic
u,
(201
4)
Su
n e
t al
.,
(201
4)
Cif
tci
and
Tem
elli
, (2
01
1)
El
Bou
lifi
et
al.,
(201
0)
Fer
nan
des
et
al.,
(20
12
)
de
Lim
a et
al.
,
(201
3)
a C
O –
co
rn o
il a
nd
WF
CO
– w
ast
e fr
yin
g c
orn
oil
. b M
eOH
– m
ethan
ol,
EtO
H –
eth
ano
l and
DM
C –
dim
eth
yl
carb
onat
e.
c IL
– i
onic
liq
uid
. d F
FD
– f
ull
fac
tori
al
des
ign,
fFD
– f
ract
ional
fac
tori
al d
esig
n,
D–
OD
– D
–o
pti
mal
des
ign,
BB
D –
Bo
x–
Beh
nken d
esig
n a
nd
CC
D –
centr
al c
om
po
site
des
ign.
e E
P –
est
ers
puri
ty a
nd
ЕY
– e
ster
s yie
ld.
f A
t th
e 9
5%
co
nfi
dence
lev
el.
g n
g –
no
t giv
en.

M. D. Kostić et al. Recycling and Sustainable Development 11 (2018) 53-62
56
2. Experimental
2.1. Materials
Corn germs, with a moisture content of 3.3 %, were
purchased from the ALMEX-IPOK, Zrenjanin, Serbia.
Corn germs were ground in a Braun electric grinder for 2
min and sieved through a 0.8 mm screen. The oil was
extracted from the ground germs using n-hexane. Waste
corn cobs were combusted in an oven and the obtained
ash was used as a catalyst. Methanol (99.5 %, Zorka-
Pharma, Serbia and HPLC grade, Promochem LGC,
Germany), n-hexane (HPLC grade, Promochem LGC,
Germany) and 2-propanol (HPLC grade Carlo Erba,
Italy) were used.
2.2. Extraction of oil by maceration
The oil was also extracted from the ground corn germs
by maceration. Ground corn germs (200 g) and n-hexane
(600 ml) were poured into an Erlenmeyer (1000 ml),
equipped with a reverse condenser, which was then kept
for 15 min in a water bath at 20 °C. After completion of
the extraction, the liquid extract was separated from the
residual solid material by filtration using a Büchner
funnel. The cake obtained after filtration was washed
with 200 ml of n-hexane. Thereafter, the combined
filtrate was evaporated at 50 °C to a constant mass using
the rotary vacuum evaporator.
2.3. Methanolysis of corn oil
The base-catalyzed methanolysis of the corn oil
obtained by maceration was carried out in a three-necked
round-bottom flask (250 ml), equipped with a reflux
condenser and a magnetic stirrer, which was placed in a
thermostated water bath. The reaction was carried out at
the methanol-to-oil molar ratio of 9:1, 12:1 or 15:1, the
catalyst concentration of 10, 15 or 20 % (based on oil
mass), and 60 °C under atmospheric pressure.
The oil (20 g) and the appropriate amounts of catalyst
and methanol were added to the reaction flask and stirred
with a magnetic stirrer (900 rpm). The catalyst particles
were uniformly distributed in the liquid. At different time
intervals during the reaction, samples (0.5 ml) of the
reaction mixture were taken to determine the conversion
of TAG. The samples were centrifuged (Sigma,
Germany) at 3500 min-1 (average 700 ×g) for 10 min to
separate the ester-oily and alcoholic phases. The upper
ester-oil layer was separated and dissolved in a mixture
of 2-propanol and n-hexane (5:4 v/v) in a ratio of 1:200,
and then filtered through a Millipore (0.45 μm) filter for
quantitative analysis using an HPLC method
(Stamenković et al., 2007). The TAG conversion degree
(xA) was calculated on the basis of the actual and initial
TAG contents in the oily-ester phase of the reaction
mixture using the following equation:
xA = 1 – TAG / TAG0 (1)
where TAG and TAG0 are the actual and initial
concentration of TAG (%).
2.4. Modeling the experimental results of the
methanolysis reaction
The methanolysis of corn oil was investigated at
various amounts of catalyst (factor A), methanol-to-oil
molar ratios (factor B) and reaction times (factor C)
according to a 33 factorial design with 3 central points.
The dependent variable (response) was the FAME
content in the oily-ester phase of the reaction mixture.
The lower, central and upper coded values of the
process factors are designated as (-1), (0) and (1),
respectively. The values of the coded and non-coded
process factors are shown in Table 3. In order to
minimize the error, the experiments were performed in a
random order.
The obtained experimental data of the FAME content
were modeled by the non-linear regression method using
the second-order polynomial equation (Eq. 2), which
correlated the dependent variable with the process
factors:
𝑦 = 𝑏0 + 𝑏1𝐴 + 𝑏2𝐵 + 𝑏3𝐶 + 𝑏12𝐴𝐵 + 𝑏13𝐴𝐶 + 𝑏23𝐵𝐶 + 𝑏11𝐴2 + 𝑏22𝐵2 + 𝑏33𝐶2 (2)
where y is FAME content, A, B and C are factors, b0
is the regression coefficient, bi, bii, and bij (i, j = 1, 2, 3)
are linear, quadratic, and two-way interaction
regression coefficients, respectively. The
complete design matrix of the 33 factorial design with
3 central points is shown in Table 4, consisted of
30 experimental runs. According to the Kolmogorov-
Smirnov normality test, the FAME content data
were normally distributed at the 0.05 level of
significance.
The obtained experimental data were analyzed by the
R-Project software (open source, http://cran.us.r-
project.org). Statistical significance of the
process factors and their interactions, as well
as the applicability of the model, was assessed
by the analysis of variance (ANOVA). The influence
of the process factors on FAME content was
analyzed using the RSM, while the optimal
conditions providing the maximum FAME
content were determined by solving the regression
equation.

M. D. Kostić et al. Recycling and Sustainable Development 11 (2018) 53-62
57
Table 3
Process factors
Symbol Factor Unit Level
(-1) (0) (+1)
A Catalyst (ash) amount %a 10 15 20
B Methanol-to-oil molar ratio mol/mol 9:1 12:1 15:1
C Reaction time min 20 30 40
a Based on the oil mass
Table 4 Experimental matrix of the 33 factorial design with 3 central points
Run Coded factors Uncoded factors FAME, Y (%)
Factor A Factor B Factor C Factor A Factor B Factor C Actual Predicted Relative
deviationa (%)
1 -1 -1 -1 10 9 20 11.1 8.3 25.2
2 0 -1 -1 15 9 20 42.3 54.3 -28.4
3 1 -1 -1 20 9 20 91.2 81.2 11.0
4 -1 0 -1 10 12 20 17.7 13.6 23.2
5 0 0 -1 15 12 20 59.4 56.03 5.7
6 1 0 -1 20 12 20 73.9 79.2 -7.2
7 -1 1 -1 10 15 20 12.0 5.5 54.2
8 0 1 -1 15 15 20 33.9 44.2 -30.4
9 1 1 -1 20 15 20 64.7 63.8 1.4
10 -1 -1 0 10 9 30 37.6 44.5 -18.4
11 0 -1 0 15 9 30 82.4 81.6 1.0
12 1 -1 0 20 9 30 98.0 99.6 -1.6
13 -1 0 0 10 12 30 44.5 52.5 -18.0
14 0 0 0 15 12 30 96.1 86.0 10.5
15 1 0 0 20 12 30 96.5 100.3 -3.9
16 -1 1 0 10 15 30 43.3 47.0 -8.5
17 0 1 0 15 15 30 77.9 76.9 1.3
18 1 1 0 20 15 30 90.1 87.6 2.8
19 -1 -1 1 10 9 40 69.1 62.5 9.6
20 0 -1 1 15 9 40 92.0 90.7 1.4
21 1 -1 1 20 9 40 98.8 99.8 -1.0
22 -1 0 1 10 12 40 71.0 73.1 -3.0
23 0 0 1 15 12 40 96.6 97.8 -1.2
24 1 0 1 20 12 40 96.5 103.2 -6.9
25 -1 1 1 10 15 40 71.0 70.4 0.8
26 0 1 1 15 15 40 88.9 91.4 -2.8
27 1 1 1 20 15 40 98.2 93.2 5.1
28 0 0 0 15 12 30 80.1 86.0 -7.4
29 0 0 0 15 12 30 94.5 86.0 9.0
30 0 0 0 15 12 30 93.0 86.0 7.5
MRPDb (%)= ±10.3
a Relative deviation (%) = (Actual – Predicted) 100/Actual. b Re /MRPD lativedeviation n , where n = 30
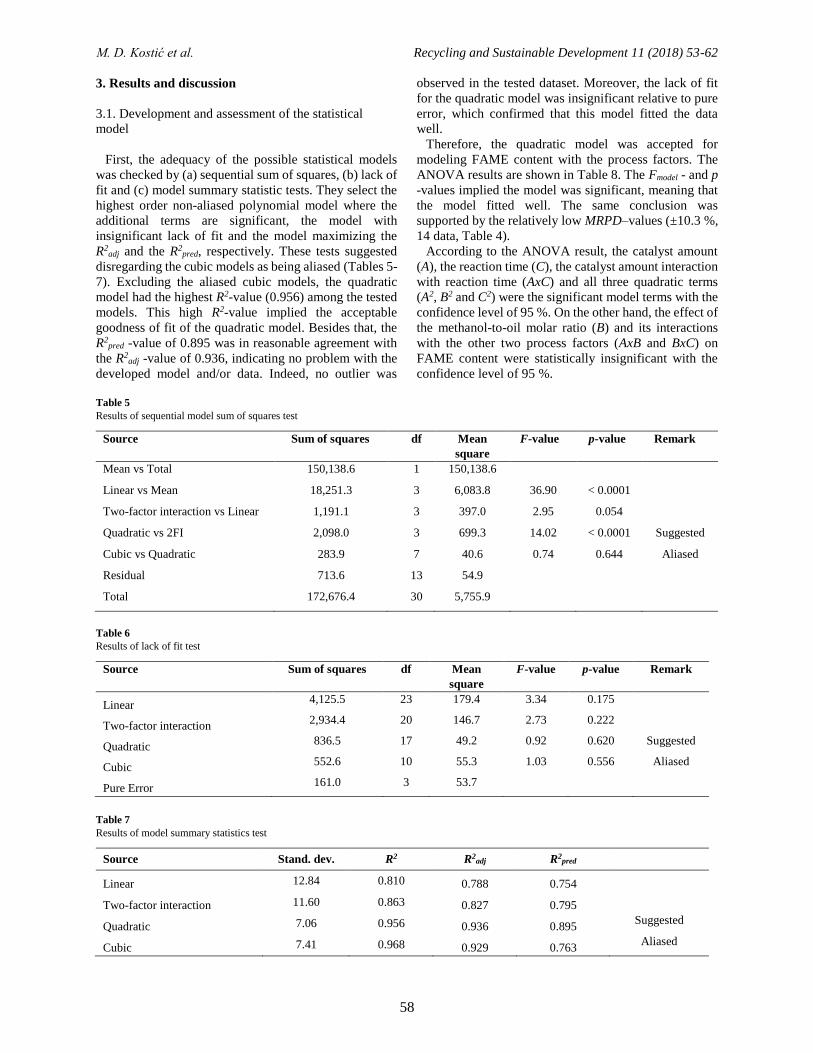
M. D. Kostić et al. Recycling and Sustainable Development 11 (2018) 53-62
58
3. Results and discussion
3.1. Development and assessment of the statistical
model
First, the adequacy of the possible statistical models
was checked by (a) sequential sum of squares, (b) lack of
fit and (c) model summary statistic tests. They select the
highest order non-aliased polynomial model where the
additional terms are significant, the model with
insignificant lack of fit and the model maximizing the
R2adj and the R2
pred, respectively. These tests suggested
disregarding the cubic models as being aliased (Tables 5-
7). Excluding the aliased cubic models, the quadratic
model had the highest R2-value (0.956) among the tested
models. This high R2-value implied the acceptable
goodness of fit of the quadratic model. Besides that, the
R2pred -value of 0.895 was in reasonable agreement with
the R2adj -value of 0.936, indicating no problem with the
developed model and/or data. Indeed, no outlier was
observed in the tested dataset. Moreover, the lack of fit
for the quadratic model was insignificant relative to pure
error, which confirmed that this model fitted the data
well.
Therefore, the quadratic model was accepted for
modeling FAME content with the process factors. The
ANOVA results are shown in Table 8. The Fmodel - and p
-values implied the model was significant, meaning that
the model fitted well. The same conclusion was
supported by the relatively low MRPD–values (±10.3 %,
14 data, Table 4).
According to the ANOVA result, the catalyst amount
(A), the reaction time (C), the catalyst amount interaction
with reaction time (AxC) and all three quadratic terms
(A2, B2 and C2) were the significant model terms with the
confidence level of 95 %. On the other hand, the effect of
the methanol-to-oil molar ratio (B) and its interactions
with the other two process factors (AxB and BxC) on
FAME content were statistically insignificant with the
confidence level of 95 %.
Table 5
Results of sequential model sum of squares test
Source Sum of squares df Mean
square
F-value p-value Remark
Mean vs Total 150,138.6 1 150,138.6
Linear vs Mean 18,251.3 3 6,083.8 36.90 < 0.0001
Two-factor interaction vs Linear 1,191.1 3 397.0 2.95 0.054
Quadratic vs 2FI 2,098.0 3 699.3 14.02 < 0.0001 Suggested
Cubic vs Quadratic 283.9 7 40.6 0.74 0.644 Aliased
Residual 713.6 13 54.9
Total 172,676.4 30 5,755.9
Table 6
Results of lack of fit test
Source Sum of squares df Mean
square
F-value p-value Remark
Linear 4,125.5 23 179.4 3.34 0.175
Two-factor interaction 2,934.4 20 146.7 2.73 0.222
Quadratic 836.5 17 49.2 0.92 0.620 Suggested
Cubic 552.6 10 55.3 1.03 0.556 Aliased
Pure Error 161.0 3 53.7
Table 7
Results of model summary statistics test
Source Stand. dev. R2 R2adj R2
pred
Linear 12.84 0.810 0.788 0.754
Two-factor interaction 11.60 0.863 0.827 0.795
Quadratic 7.06 0.956 0.936 0.895 Suggested
Cubic 7.41 0.968 0.929 0.763 Aliased

M. D. Kostić et al. Recycling and Sustainable Development 11 (2018) 53-62
59
Table 8
ANOVA results for the quadratic model
Source Sum of squares df Mean square F-value p-value
Model 21,540.3 9 2,393.4 47.99 < 0.0001
A 10,300.9 1 10,300.9 206.53 < 0.0001
B 100.3 1 100.3 2.01 0.172
C 7,850.0 1 7,850.0 157.39 < 0.0001
AxB 157.7 1 157.7 3.16 0.091
AxC 947.0 1 947.0 18.99 0.0003
BxC 86.4 1 86.4 1.73 0.203
A2 633.3 1 633.3 12.70 0.002
B2 310.3 1 310.3 6.22 0.022
C2 567.1 1 567.1 11.37 0.003
Residual 997.5 20 49.9
Lack of Fit 836.5 17 49.2 0.92 0.620
Pure Error 161.0 3 53.7
Corrected Total 22,537.8 29
The quadratic model is as follows:
- Coded factors
𝑦 = 86.00 + 23.92𝐴 − 2.36𝐵 + 20.88𝐶 − 3.62𝐴𝐵 − 8.88𝐴𝐶 + 2.68𝐵𝐶 − 9.61𝐴2 − 6.73𝐵2 − 9.09𝐶2 (3)
- Uncoded (actual) factors
𝑦 = −406.20 + 24.55𝐴 + 18.09𝐵 + 9.14𝐶 − 0.24𝐴𝐵 − 0.18𝐴𝐶 + 0.09𝐵𝐶 − 0.38𝐴2 − 0.75𝐵2 − 0.09𝐶2 (4)
After eliminating the insignificant terms, Eqs (3) and (4) become the reduced quadratic models as follows:
- Coded factors
𝑦 = 86.00 + 23.92𝐴 − 2.36𝐵 + 20.88𝐶 − 8.88𝐴𝐶 − 9.61𝐴2 − 6.73𝐵2 − 9.09𝐶2 (5)
- Uncoded (actual) factors
𝑦 = −394.89 + 22.65𝐴 + 17.15𝐵 + 10.21𝐶 − 0.18𝐴𝐶 − 0.38𝐴2 − 0.75𝐵2 − 0.09𝐶2 (6)
The R2-value (0.945) demonstrated a good fitting
capability of the reduced quadratic model, which was
supported by an acceptable MRPD-value (±10.6 %, 30
data). In addition, the R2adj - and R2
pred -values (0.927 and
0.896, respectively) were high and close enough to each
other, implying that the reduced quadratic model
represented the experimental data well. This reduced
quadratic model was further used for response surface
analysis and optimization.
3.2. Response surface analysis and optimization
Figure 1 shows the response surface 3D plots for
FAME content as a function of catalyst loading and
reaction time at methanol-to-oil molar ratio 12:1 mol/mol
resulted from the reduced quadratic model. It was
obvious that the FAME content increased with the
increase of both catalyst loading and reaction time. The
influence of the catalyst amount on FAME content was
more significant at a shorter reaction time, while it
decreased at a longer reaction time. Such a behavior
could be attributed to approaching the reaction to the
equilibrium when the FAME formation rate slowed
down. The reaction time was more influential at lower
catalyst amounts and became less significant at higher
catalyst amounts, which was ascribed to the faster
reaction rate at a higher catalyst amount because of the
higher concentration of catalytically active sites,
enabling the completion of the transesterification
reaction rate for a shorter reaction time. The significant
influence of catalyst amount and reaction time on FAME
content was previously reported for the corn oil
transesterification over a CaO-based catalyst obtained
from snails’ shells (El-Gendy et al., 2014) and the corn
oil transesterification with dimethyl carbonate over solid
KOH (Sun et al., 2014). According to Mustata and Bicu
(2014), the catalyst amount had a significant influence,
while the effect of the reaction time on the corn oil
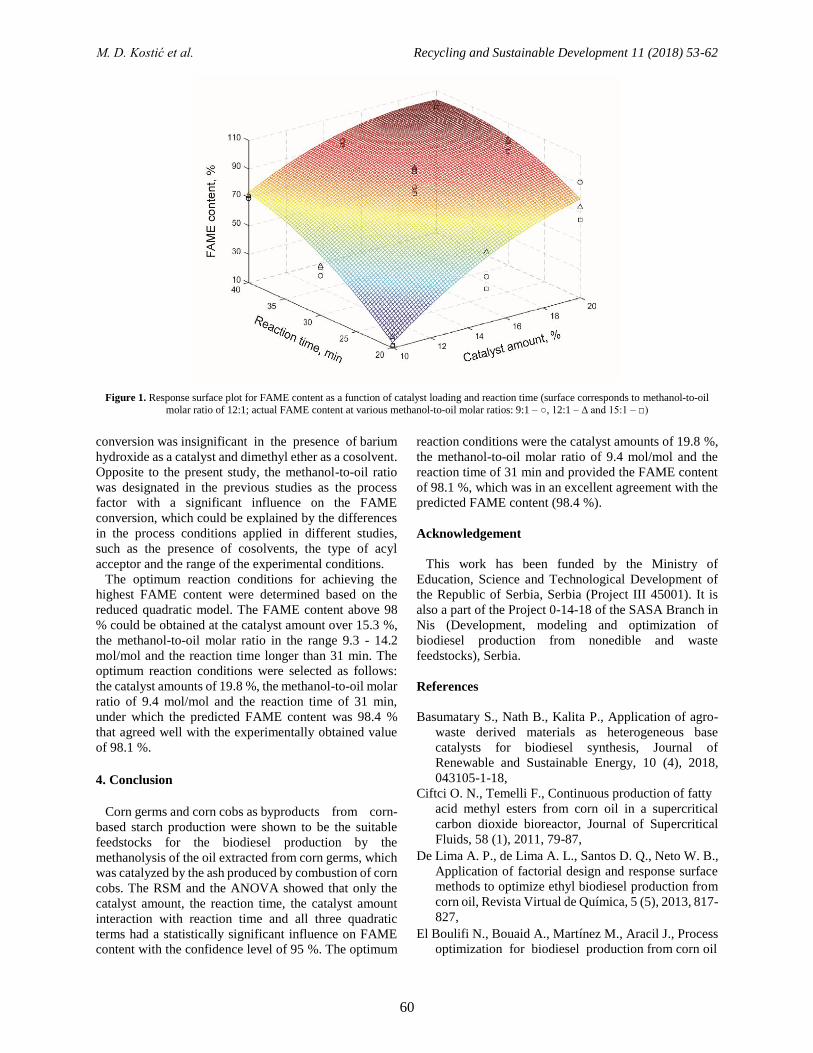
M. D. Kostić et al. Recycling and Sustainable Development 11 (2018) 53-62
60
Figure 1. Response surface plot for FAME content as a function of catalyst loading and reaction time (surface corresponds to methanol-to-oil
molar ratio of 12:1; actual FAME content at various methanol-to-oil molar ratios: 9:1 – ○, 12:1 – ∆ and 15:1 – □)
conversion was insignificant in the presence of barium
hydroxide as a catalyst and dimethyl ether as a cosolvent.
Opposite to the present study, the methanol-to-oil ratio
was designated in the previous studies as the process
factor with a significant influence on the FAME
conversion, which could be explained by the differences
in the process conditions applied in different studies,
such as the presence of cosolvents, the type of acyl
acceptor and the range of the experimental conditions.
The optimum reaction conditions for achieving the
highest FAME content were determined based on the
reduced quadratic model. The FAME content above 98
% could be obtained at the catalyst amount over 15.3 %,
the methanol-to-oil molar ratio in the range 9.3 - 14.2
mol/mol and the reaction time longer than 31 min. The
optimum reaction conditions were selected as follows:
the catalyst amounts of 19.8 %, the methanol-to-oil molar
ratio of 9.4 mol/mol and the reaction time of 31 min,
under which the predicted FAME content was 98.4 %
that agreed well with the experimentally obtained value
of 98.1 %.
4. Conclusion
Corn germs and corn cobs as byproducts from corn-
based starch production were shown to be the suitable
feedstocks for the biodiesel production by the
methanolysis of the oil extracted from corn germs, which
was catalyzed by the ash produced by combustion of corn
cobs. The RSM and the ANOVA showed that only the
catalyst amount, the reaction time, the catalyst amount
interaction with reaction time and all three quadratic
terms had a statistically significant influence on FAME
content with the confidence level of 95 %. The optimum
reaction conditions were the catalyst amounts of 19.8 %,
the methanol-to-oil molar ratio of 9.4 mol/mol and the
reaction time of 31 min and provided the FAME content
of 98.1 %, which was in an excellent agreement with the
predicted FAME content (98.4 %).
Acknowledgement
This work has been funded by the Ministry of
Education, Science and Technological Development of
the Republic of Serbia, Serbia (Project III 45001). It is
also a part of the Project 0-14-18 of the SASA Branch in
Nis (Development, modeling and optimization of
biodiesel production from nonedible and waste
feedstocks), Serbia.
References
Basumatary S., Nath B., Kalita P., Application of agro-
waste derived materials as heterogeneous base
catalysts for biodiesel synthesis, Journal of
Renewable and Sustainable Energy, 10 (4), 2018,
043105-1-18,
Ciftci O. N., Temelli F., Continuous production of fatty
acid methyl esters from corn oil in a supercritical
carbon dioxide bioreactor, Journal of Supercritical
Fluids, 58 (1), 2011, 79-87,
De Lima A. P., de Lima A. L., Santos D. Q., Neto W. B.,
Application of factorial design and response surface
methods to optimize ethyl biodiesel production from
corn oil, Revista Virtual de Química, 5 (5), 2013, 817-
827,
El Boulifi N., Bouaid A., Martínez M., Aracil J., Process
optimization for biodiesel production from corn oil

M. D. Kostić et al. Recycling and Sustainable Development 11 (2018) 53-62
61
and its oxidative stability, International Journal of
Chemical Engineering, Article ID 518070, 2010, 1-9,
El-Gendy N. S., Deriase S. F., Hamdy A., The
optimization of biodiesel production from waste
frying corn oil using snails shells as a catalyst, Energy
Sources A, 36 (6), 2014, 623-637,
FAO Statistics Division, http://www.biofuelstp.eu/,
(assessed on December 12, 2016),
Fernandes F. A. N., Mazzone L. C. A., Matos L. J. B. L.,
Cartaxo S. J. M., Rodrigues S., Ultrasound-assisted
transesterification of corn oil with ethanol,
Latin American Applied Research, 42, 2012, 193-
196,
Hatefi H., Mohsennia M., Niknafs H., Transesterification
of corn oil using MgO and ZnO as catalysts,
International Conference on Chemistry, Biomedical
and Environment Engineering (ICCBEE'14),
Antalya, Turkey, 2014, 37-41,
Moradi G., Mohadesi M., Hojabri Z., Biodiesel
production by CaO/SiO2 catalyst synthesized by the
sol-gel process, Reaction Kinetics, Mechanisms, and
Catalysis, 113 (1), 2014, 169-186,
Moradi G., Mohadesi M., Rezaei R., Moradi R.,
Biodiesel production using CaO/γ–Al2O3 catalyst
synthesized by sol-gel method, Canadian Journal of
Chemical Engineering, 93 (9), 2015, 1531-1538,
Moser B. R., Vaughn S. F., Biodiesel from corn distillers
dried grains with solubles: preparation, evaluation,
and properties, BioEnergy Research, 5 (2), 2012, 439-
449,
Mustata F., Bicu I., The optimization of the production of
methyl esters from corn oil using barium hydroxide
as a heterogeneous catalyst, Journal of the American
Oil Chemists' Society, 91 (5), 2014, 839-847,
Noureddini H., Bandlamudi S. R. P., Guthrie E. A., A
novel method for the production of biodiesel from the
whole stillage-extracted corn oil, Journal of the
American Oil Chemists' Society, 86 (1),
2009, 83-91,
OECD/FAO (2015), OECD-FAO Agricultural Outlook
2015, OECD Publishing, Paris,
https://doi.org/10.1787/agr_outlook-2015-en, 2015,
126-142,
Salakhum S., Yutthalekha T., Chareonpanich M.,
Limtrakul J., Wattanakit C., Synthesis of hierarchical
faujasite nanosheets from corn cob ash-derived
nanosilica as efficient catalysts for hydrogenation of
lignin-derived alkylphenols, Microporous and
Mesoporous Materials, 258, 2018, 141-150,
Stamenković O. S., Lazić M. L., Todorović Z. B.,
Veljković V. B., Skala D. U., The effect of agitation
intensity on alkali-catalyzed methanolysis of
sunflower oil, Bioresource Technology, 98 (14),
2007, 2688-2699,
Sun S., Zhang L., Meng X., Ma C., Xin Z., Biodiesel
production by transesterification of corn oil with
dimethyl carbonate under heterogeneous base
catalysis conditions using potassium hydroxide,
Chemistry and Technology of Fuels and Oils, 50 (2),
2014, 99-107,
Velázquez J. M., Conversion of corn oil to alkyl esters,
(Master thesis), Iowa State University, Ames, Iowa
2007, 57,
Veljković V. B., Biberdžić M. O., Banković-Ilić I. B.,
Djalović I. G., Tasić M. B., Nježić Z. B., Stamenković
O. S., Biodiesel production from corn oil: a review,
Renewable and Sustainable Energy Reviews, 91,
2018, 531-548,
Velmurugan P., Shim J., Lee K.-J., Cho M., Lim S.-S.,
Seo S.-K., Cho K.-M., Bang K.-S., Oh B.-T.,
Extraction, characterization, and catalytic potential of
amorphous silica from corn cobs by sol-gel method,
Journal of Industrial and Engineering Chemistry, 29,
2015, 298-303,
Waisi H., Milojković M., Nikolić B., Marinković M.,
Panić I., Ormai M., Influence of process parameters
on transesterification reaction of corn oil over base
promoted γ–alumina, Zaštita materijala, 57 (3),
2016, 473-480,
Živković S. B., Veljković M. V., Banković-Ilić I.
B., Krstić I. M., Konstantinović S. S., Ilić S.
B., Avramović J. M., Stamenković O. S.,
Veljković V. B., Technological, technical, economic,
environmental, social, human health
risk, toxicological and policy considerations of
biodiesel production and use, Renewable
and Sustainable Energy Reviews, 79, 2017, 222-
247.

M. D. Kostić et al. Recycling and Sustainable Development 11 (2018) 53-62
62
Optimizacija proizvodnje biodizela kukuruznog ulja metanolizom
katalizovanom pepelom kurdeljke
Milan D. Kostić a, Marija B. Tasić a, Ivica G. Đalović b, Milan O. Biberdžić c,
Petar M. Mitrović b, Olivera S. Stamenković a, Vlada B. Veljković a, #
a Univerzitet u Nišu, Tehnološki fakultet Leskovac, Srbija b Institut za ratarstvo i povrtarstvo, Novi Sad, Srbija
c Univerzitet u Prištini, Poljoprivredni fakultet, Lešak, Srbija
INFORMACIJE O RADU I Z V O D
Primljen 30 septembar 2018
Prihvaćen 21 novembar 2018
Originalni rad
Ključne reči: Biodizel
Pepeo kurdeljke
Kukuruzne klice
Optimizacija
Metodologija površine odziva
Transesterifikacija
Upotreba jeftinih ili bezvrednih sirovina, kao što su sporedni proizvodi, u
proizvodnji biodizela ima za rezultat smanjene ukupne troškove procesa. U
ovom radu su prikazani rezultati upotrebe kukuruznih klica i okrunjenog
kukuruznog klipa (kurdeljke, krudeljke) kao sporednih proizvoda iz proizvodnje
kukuruznog skroba u proizvodnji biodizela metanolizom ulja izdvojenog iz
kukuruznih klica, katalizovane pepelom dobijenim sagorevanjem kurdeljke.
Glavni cilj je bila optimizacija molskog odnosa metanol-ulje, količine
katalizatora i reakcionog vremena u šaržnom reaktoru sa mešanjem u odnosu na
sadržaj metilestra masnih kiselina (MEMK). Statističko modelovanje i
optimizacija izvršeni su korišćenjem kvadratnog modela, razvijenog
metodologijom odzivne površine, u kombinaciji sa 33 faktorijelnim planom sa 3
centralne tačke. Sadržaj MEMK-a je određen metodom tečne hromatografije pod
visokim pritiskom. Analiza varijanse je pokazala da su samo uticaji količine
katalizatora, reakcionog vremena, interakcije količine katalizatora sa reakcionim
vremenom i sva tri kvadratna člana statistički značajni sa nivoom pouzdanosti
od 95 %. Pod optimalnim reakcionim uslovima (količina katalizatora 19,8 %,
molski odnos metanol/ulje 9,4 mol/mol i reakciono vreme 31 min) dobijen je
sadržaj MEMK-a od 98,1 %, koji se slaže sa predviđenim sadržajem MEMK-a
(98,4 %). Prema tome, i kukuruzne klice i kurdeljka mogu biti pogodne sirovine
za proizvodnju biodizela.

Recycling and Sustainable Development 11 (2018) 63-71
Corresponding autor: [email protected]
doi: 10.5937/ror1801063A
Recycling and Sustainable Development
Micronization of zeolite in vibration mill
Ljubiša Andrić a, #, Milan Trumić b, Maja Trumić b, Vladimir Nikolić b
a Institute for Technology of Nuclear and other Mineral Raw Materials, Serbia b University of Belgrade, Technical Faculty in Bor, Serbia
A R T I C L E I N F O A B S T R A C T
Received 21 September 2018
Accepted 07 December 2018
Research Article
Keywords: Dry micronizing grinding
Non-metallic mineral raw materials
Vibratory disc mill
Agglomeration
Reactivity
Zeolite
Dry micronizing grinding of mineral raw materials is a very complex process and
depends on a whole range of parameters such as: shape, particle size, size
distribution of the starting and micronized material, hardness, moisture, density,
surface properties, structural characteristics of mills, etc. In order to obtain a clear
picture of dry micronizing milling process, a good knowledge of the theoretical
principles of high-energy mills operation is necessary.
Classical mills are not suitable for micronization to a fine and particularly very
fine particles size (upper particle size limit below 5 μm), which is necessary for
modern industrial application domains. The intensive fundamental and
developmental research of the dry micronizing milling process for the new
materials development has also enabled the development of new construction
solutions for ultra-fine high-energy mills - mechanics. These mills have found
application into the state-of-the-art production technologies of new very
profitable materials. For the production of powders - particles of micron
dimensions, the mechano-actuators are used and all micronizers - disintegrators,
colloidal (perl mills), vibratory, planetary, ultra-centrifugal mill, Jet-current mills
and others operate on the principle of impact, shock and friction.
This paper presents the experimentally achieved results of dry micronizing
grinding of zeolites in a vibrating mill with rings, as well as the improvement of
its reactivity. All experimental micronization investigations were carried out on
a previously prepared coarse particle size class (- 3.35 + 0) mm with different
starting mass (50 g and 200 g), and carried out in different grinding time intervals
(45, 120, 900 seconds), in order to examine the impact of these parameters on the
micronization process. Grinding success was evaluated by the particle size
measurements and content of class (- 5 + 0) μm, and particle specific surface. It
was shown that for a sample of four times larger initial mass it is need longer
grinding time to achieve the maximum content of the class (- 5 + 0) μm, but for
a sample of the bulk class (- 3.35 + 0) mm with a lower starting mass the effects
of amorphization due to prolonged micronizing grinding are very pronounced,
and the zeolite minerals in crystalline form are practically in the trace and the
largest part is amorphous. Generally, it can be concluded that a vibrating mill
with a rings proved to be a good device for efficient ultra-fine micronizing
grinding.
www.rsd.tfbor.bg.ac.rs
RSD Online ISSN 2560-3132 Print ISSN 1820-7480
Lj. Andrić et al. Recycling and Sustainable Development 11 (2018) 63-71
64
1. Introduction
In the history of humanity non-metallic mineral raw
materials were the first natural materials that a man began
to use, and most of them until the beginning of the 20th
century did not attract attention. Between the two World
Wars, and especially during and after the Second World
War, there is a significant change in relation to these raw
materials, they become increasingly important and
necessary to the modern industry. One of such non-
metallic mineral raw materials are certainly zeolites that
represent precious inorganic material that has a wide
range of applications (Andrić, 2014).
Natural zeolites are the most porous crystalline
hydrated alumosilicates (tectosilicate) whose structures
contain infinite three-dimensional frames. The basis of
the three-dimensional network consists of tetrahedral
groups SiO4 and AlO4 (Johan et al., 2015; Stocker et al.,
2017). The adjacent tetrahedrons are bound, at their
corners, through a common oxygen atom, making the
zeolites structure rich in cavities and channels. The
channel opening consists of 6, 8, 10 or 12 oxygen atoms
together with the same number of silicon and / or
aluminum atoms. Tetrahedral groups are connected in
space through common oxygen atoms by constructing
secondary polyhedron units whose connection creates a
crystalline (alumosilicate) grid (Baerlocher et al., 2007).
The alumosilicate grid is formed by connecting Si(IV)-
O and Al(III)-O of the building units, and it is negatively
charged. Electroneutrality is provided by the alkali and /
or alkaline earth metal cations located inside the channel
and the cavity of the grid. These hydrated cations are
mainly Na+, K+, Mg2+ and Ca2+ and rarely Ba2+ and Sr2+.
Due to poor electrostatic interactions with the
alumosilicate gratings, these cations are mobile, and in
contact with the solution, they can be easily exchanged
with ions from the solution, which gives the zeolites the
ion exchanger properties (Jovanović, 2016). Zeolites are
actually forms of "molecular sieves" associated with
micropores and cavities. Structural empty spaces in the
molecular-scale range (3-10 A°) can provide space for
receiving cations (Na+, K+, Mg+, Ba+, Ca+), and various
metal cations, transition metal ions (Co, Fe, Mn, Zn), as
well as molecules and ions from the group H2O, NH3,
CO32−, NO3
−. In the channels and cavities there are also
water molecules that can be reversibly desorbed, which
gives to zeolites the properties of the drying agents (Alver
et al., 2010; Terzić et al., 2017).
Due to their unique structure, zeolites have wide
application (Charkhi et al., 2010). Zeolites are inactive in
nature, and their adsorption capability and cation
exchange capacity are activated by mechanical treatment.
Activated zeolites are used as organic products in
construction, agriculture and livestock, veterinary
medicine, antioxidants and as adsorbents for heavy and
radioactive metals, in food, textile and other industries.
Zeolites are also used for the separation of gases due to
its adsorption potential (Ackley et al., 2003; Wang et al.,
2015; Chen et al., 2017), for the collection of unpleasant
odors and removing moisture traces from organic
solutions, from the rooms and therefore also been used as
aquarium filters, purification of water and wastewater
containing heavy metals and ammonia (Cooney et al.,
1999; Margeta et al., 2013; Kahler, 2014; Ghasemi et al.,
2016), gas sorption as catalysts (Tomić, 2016).
2. Micronization milling of non-metallic mineral raw
materials
The process of micronizing grinding is intended to
grind the mineral raw material to particles of micron
dimensions and thus prepare for direct application or for
further technological processing. The micronizing
grinding process is mainly used for grinding mineral raw
materials that have been already crushed and grinded.
This process is carried out under the influence of external
forces, as is the case with standard grinding (Andrić and
Trumić, 2013), and the intensity of the micronizing
grinding process depends on the characteristics of the
micronized mineral raw material, the purposes and the
market requirements regarding the quality of the product.
During micronizing grinding there is a decrease in the
regularity of particle shape, which reflects in the increase
in the content of fine particles at the expense of the large
ones. One of the basic factors affecting the shape and
interaction of the individual particles content are the type
of process and the type of micronizing grinding device
which is used (Prziwara et al., 2018). Today, special
attention is paid to the effect of micronizing grinding
mills, in other words, to the micronized product costs,
especially if the mineral resource is low. However,
recently, all micronized mineral raw materials, especially
non-metallic mineral raw materials, have market value.
In the micronizing grinding of non-metallic mineral raw
materials, special attention is paid to the following basic
parameters of product quality: the content of individual
size classes, the specific surface, the average particle
diameter, the chemical and mineralogical characteristics.
In addition to the bulk, as a basic parameter of the quality
of micronizing grinding products, it is necessary to
mention other very important parameters: volume mass,
surface activity, particle shape, optical properties, etc.
The mentioned parameters of the quality of micronizing
grinding products depend on the physical, mechanical,
chemical and mineralogical properties of the starting
materials, such as: structure, texture, resistance,
plasticity, durability, hardness, abrasiveness,
sagnosticity, elasticity, stickiness (Andrić et al., 2010;
Andrić and Trumić, 2013).
3. Material and methods
The micronizing grinding of zeolite was carried out in
a laboratory vibrating disc mill „SIEBTECHNIK TS-
250“, with rings at 1,000 rpm over a time interval of (45,

Lj. Andrić et al. Recycling and Sustainable Development 11 (2018) 63-71
65
120 and 900) seconds. For all laboratory experiments of
the zeolite micronization, a grossness class (- 3.35 + 0)
mm was used with different starting mass (50 and 200) g
and as a characteristic grossness class, the share of the
class (- 5 + 0) µm was also monitored. On each
micronizing grinding product, the particle size
distribution and the specific surface area were monitored
all in order to obtain the finest micronized product of
improved reactivity.
After analyzing the particle size distribution of
micronizing grinding products, X-ray diffraction analysis
was carried out to determine and monitor the phase
composition of the samples. The samples were analyzed
on the “PHILIPS”, X-ray diffractometer, the PW-1710
model with a curved graphite monohromator and a
scintillation counter. The diffracted CuKα X-ray
diffraction intensities (λ=1.54178Å) were measured at
room temperature at intervals of 0.02 °2θ and at a time of
1 a in the range of 4 to 65 °2θ. The X-ray tube was loaded
with a voltage of 40 kV and a current of 30 mA, while
the slots for direct and diffracted beam direction were 1 °
and 0.1 mm.
3.1. Physico-chemical and mineralogical characteristics
of the initial zeolite sample
The measured density of the zeolite sample was
determined by glass pycnometers, and the average value
after three measurements was: ρ=2,186 kg/m3, which
fits the theoretical values for zeolite ρ=2,000 – 3,000
kg/m3 (Majstorović-Necković, 2015; Mihajlović-Kostić,
2016).
In Table 1, the results of the particle size distribution
and the theoretical specific surface area of the initial
zeolite sample of the bulk class (- 3.35 + 0) mm are
shown.
Table 1
Particle size distribution of the bulk zeolite sample (- 3.35 + 0) mm
Dry screening Wet screening
Particle size (mm) W (%) D (%) W (%) D (%)
- 3.35 + 2.36 17.96 100 14.71 100
- 2.36 + 1.70 14.93 82.04 10.04 85.29
- 1.70 + 1.18 13.21 67.11 9.75 75.25 - 1.18 + 0.85 9.03 53.90 5.18 65.50
- 0.85 + 0.600 7.97 44.87 6.47 60.32
- 0.600 + 0.425 5.93 36.90 4.37 53.85 - 0.425 + 0.300 5.31 30.97 3.82 49.48
- 0.300 + 0.212 3.70 25.66 3.19 45.66
- 0.212 + 0.150 4.18 21.96 3.29 42.47 - 0.150 + 0.106 3.68 17.78 3.36 39.18
- 0.106 + 0.075 3.44 14.10 3.07 35.82
- 0.075 + 0.040 4.56 10.66 5.87 32.75 - 0.040 + 0.030 0.05 6.10 0.29 26.88
- 0.030 + 0.020 0.05 6.05 0.23 26.59
- 0.020 + 0.010 0.15 6.00 0.08 26.36 - 0.010 + 0.005 0.06 5.85 0.17 26.28
- 0.005 + 0 5.79 5.79 26.11 26.11
∑ 100.00 - 100.00 -
Calculated theoretical
specific surface area,
S (m2/g) 70.79 294.07
The particle size distribution of the initial sample of the
bulk class (- 3.35 + 0) mm sieving with dry and wet
method are significantly different. It can be noticed that
when dry procedure is followed, the finest particles
formed aggregates (larger particles), which does not
occur with wet sieving process. Such a phenomenon
leads to a decrease in the content of the finest class
(- 5 + 0) μm from 26.11 % to 5.79 %, and therefore, up
to four times lower value of the specific surface is
obtained.
The determination of the chemical composition of the
initial sample of zeolite, was carried out using a standard
analytical method. The results of the chemical analysis
are given in Table 2.
Table 2
Chemical composition of the initial zeolite sample
Component Content, % SiO2 64.05 Al2O3 15.29 Fe2O3 2.52 CaO 4.82 MgO 1.33 K2O 0.77 Na2O 1.27 LoI * 9.86
* LoI - The loss on ignition (LoI) was determined as a
weight difference between 20° and 1000° C.
The diffractogram of the initial zeolite sample
a polycrystalline powder is shown in Figure 1 and
it can be seen that the most prevalent minerals
in the analyzed sample are zeolite minerals,
while quartz, feldspars and micas are significantly
less represented. Of feldspar, plagioclases are
more dominant than K-feldspar. From the
carbonate minerals the presence of calcite appears in the
trace.
Figure 1. XRD analysis of the initial sample of zeolite
4. Results and discussion
4.1. Micronization grinding of zeolites
The results of the micronizing grinding of zeolite
particle size class (- 3.35 + 0) mm are shown in Table 3
and Table 4.

Lj. Andrić et al. Recycling and Sustainable Development 11 (2018) 63-71
66
Table 3
Particle size distribution and specific surface of micronized zeolite, bulk class (-3.35 + 0) mm, starting mass 50 g
SAMPLE:
(- 3.35 + 0) mm 45 seconds 120 seconds 900 seconds
Particle size, (µm) W (%) D (%) W (%) D (%) W (%) D (%)
- 212 + 150 0.29 100.00 0.80 100.00 3.12 100.00
- 150 + 106 0.29 99.71 0.68 99.20 5.20 96.88
- 106 + 75 0.87 99.42 1.82 98.52 7.69 91.68
- 75 + 30 0.66 98.55 1.55 96.70 2.29 83.99
- 30 + 20 0.45 97.89 0.82 95.15 1.02 81.70
- 20 + 10 0.02 97.44 0.02 94.33 0.12 80.68
- 10 + 5 0.02 97.42 0.23 94.31 0.38 80.56
- 5 + 0 97.40 97.40 94.08 94.08 80.18 80.18 ∑ 100.00 - 100.00 - 100.00 -
Calculated-theoretical specific
surface area, S (m2/g) 1.07 1.04 0.89
Table 4
Particle size distribution and specific surface of micronized zeolite, bulk class (-3.35 + 0) mm, starting mass 200 g
SAMPLE:
(- 3.35 + 0) mm 45 seconds 120 seconds 900 seconds
Particle size (µm) W (%) D (%) W (%) D (%) W (%) D (%)
- 212 + 150 0.25 100.00 0.54 100.00 7.25 100.00
- 150 + 106 0.97 99.75 0.25 99.46 7.76 92.75
- 106 + 75 2.74 98.78 1.28 99.21 8.85 84.99
- 75 + 30 1.40 96.04 2.16 97.93 1.89 76.14
- 30 + 20 1.83 94.64 1.24 95.77 1.06 74.25
- 20 + 10 0.20 92.81 0.53 94.53 0.69 73.19
- 10 + 5 0.12 92.61 0.61 94.00 1.01 72.50
- 5 + 0 92.49 92.49 93.39 93.39 71.49 71.49 ∑ 100.00 - 100.00 - 100.00 -
Calculated-theoretical specific
surface area, S (m2/g) 1.02 1.03 0.80
Based on Table 3, it can be concluded that grinding
takes place up to 45 seconds of micronizing grinding.
Subsequently, the content of the class (- 5 + 0) µm begins
to slowly decrease. Only after 45 seconds of micronizing
grinding, the content of the class (- 5 + 0) µm was 97.40
%, but after 900 seconds of grinding the content
decreased to almost 80 %, indicating that 17 % of the
particles had a larger mean diameter.
Based on the results in Table 4, for a sample of the bulk
class (- 3.35 + 0) mm, and the starting mass of 200 g, it
can be observed that grinding takes place up to 120
seconds of micronizing grinding. Then, the content of the
class (- 5 + 0) µm begins to decrease. After 120 seconds
of micronizing grinding, the content of the class (- 5 + 0)
was 93.39 %, and after 900 seconds of grinding the
content decreased to almost 72 %, indicating that about
21 % of the raw material was reduced.When the particle
size distribution of the starting mass 50 g and 200 g
(Figure 2) is comparing, it can be noted that for a sample
of 50 g a shorter grinding time is required to achieve the
maximum value of the class (- 5 + 0) μm. At the starting
mass sample of 50 g grinding takes place up to 45
seconds, and the content of the class (- 5 + 0) μm is 97.40
%. For a sample of four times larger initial mass 200 g it
is need about 2.5 times higher grinding time to achieve
the maximum content 93.39 % of the class (- 5 + 0) μm.
Figure 2. Cumulative mass of the bulk class (- 5 + 0) µm
depending on the grinding time
In the ultra-fine micronizing grinding process, the
energy consumption is very high. Due to this fact, the
ring mill has proven to be an economical device for
efficient ultra-fine micronizing grinding. Depending on
the starting mass, (50 or 200) g, more than 90 % of the
raw material is smaller than 5 μm after only 45 seconds
of micronizing grinding, which is better than the results
50
60
70
80
90
100
0 100 200 300 400 500 600 700 800 900
D (
%)
Milling time (s)
50 g 200 g

Lj. Andrić et al. Recycling and Sustainable Development 11 (2018) 63-71
67
obtained by other researchers. Based on the literature, it
was found that various authors in their work came up
with the following results: Herceg et al., (2004) carried
out tribomechanical micronization of zeolites using
equipment designed for tribomechanical micronization
and activation (TMA), and only after 60 seconds of
grinding, was achieved the 90 % cumulative mass of the
class (- 44.12 + 0) µm and of the class (-31.15 + 0) µm
at a speed of 16,000 rpm and 22,000 rpm, respectively;
Tunç and Demirkıran, (2014) investigated the effects of
mechanical activation of the natural zeolite in a planetary
mill with balls, and found that after 2 hours of grinding
cumulative mass of the class (- 33.16 + 0) µm was 90 %;
Burris and Juenger, (2016) performed micronization of
zeolites in a gravity mill with balls, and found that after
8 hours of grinding cumulative mass of the class
(- 24.3 + 0) µm was 90 %; Terzić et al., (2017)
investigated the mechanochemical activation of zeolites
in the ultra-centrifugal mill, and found that after 30
minutes of grinding 38.8 % of the raw material, (- 5 + 0)
μm, was obtained.
By comparing the obtained results with these from
literature it follows that the vibrating mill with rings
proved to be a very good solution when ultra-fine
micronizing grinding (- 5 +0) μm, is needed.
In Figure 3, a microscopic analysis of the samples
before and after grinding were shoved. In Figure 3 c-d, it
can be noticed that after micronizing grinding of 120 and
a) b)
c) d)
Figure 3. Microscopic image of zeolite samples before and after
micronizing grinding: a) the initial sample obtained with the x10 magnification; b) the micronizing grinding zeolite sample after 45
seconds obtained at x100 magnification; c) the micronizing grinding
zeolite sample after 120 seconds obtained at x100 magnification; d) the micronizing grinding zeolite sample after 900 seconds, obtained at x100
magnification
900 seconds the finest particles were formed aggregates.
When comparing the microscopic view of the initial
sample of the class (- 3.35 + 0) mm with microscopic
images obtained after micronizing grinding of (45, 120
and 900) seconds, it can be noticed that the particles in
initial sample has a cubic shape, and after micronization,
the majority of the particles changed shape in a spherical,
elliptical or irregular shape. The formed agglomerates
have a plate shape, which can be seen at Figure 3 c-d.
4.2. XRD analysis
The redgene assay was tested on the initial sample
(Figure 1), and on a samples with the starting mass of (50
and 200) g after micronizing grinding (Figure 4 and
Figure 5).
a)
b)
c)
Figure 4. XRD analysis of the micronized sample: a) 45 seconds; b) 120 seconds; c) 900 seconds

Lj. Andrić et al. Recycling and Sustainable Development 11 (2018) 63-71
68
Figure 4 shows XRD analysis of the micronized sample
with a starting mass of 50 g after micronizing grinding
process (45, 120 and 900) seconds. It can be noticed that
after 45 seconds of grinding the zeolite mineral content
has not decreased in relation to the initial sample, and the
effects of the amorphization due to grinding are not
visible. For micronized sample which was obtained after
120 seconds of grinding, the zeolite mineral content
begins to decrease, and the effects of grinding
amorphization are poorly expressed. With an increase in
grinding time 900 seconds, on the obtained sample, the
effects of amorphization due to grinding are very
pronounced, and the zeolite minerals in crystalline form
are practically in the trace and the largest part is
amorphous.
a)
b)
c)
Figure 5. XRD analysis of the sample micronized: a) 45 seconds; b) 120 seconds; c) 900 seconds
Figure 5 shows XRD analysis of the micronized sample
with a starting mass of 200 g after micronizing grinding
process (45, 120 and 900) seconds.
Figure 5 shows that a micronized samples with 4 times
large mass, which were obtained after 45 seconds and
after 120 seconds of grinding, have the same zeolite
minerals content as well as a sample with smaller mass.
The effects of amorphization due to grinding are not
visible too. This shows that the sample mass has no effect
on the mineralogical composition of the zeolite if
grinding takes place in a short time interval. With an
increase in grinding time 900 seconds, on the obtained
sample, the effects of amorphization due to grinding are
not visible unlike a sample of 4 times less mass.
4.3. Reactivity of zeolite during micronizing grinding
By correlation of the operating parameter of the
vibratory disc mill and the zeolite micronizing grinding
product parameter, the functional dependence of the
specific surface area on the micronizing grinding time
was formed. This functional dependence shows that as
the micronizing grinding time increases, the specific
surfaces in all experiments increase to the limit value
upon which over time passes into the stationary level,
which corresponds to the balance in the ultra-fine
micronizing milling.
The results of the functional dependence of the specific
surface from the time of micronizing grinding are shown
in Figure 6. This analysis also confirms the visual
conclusion that after a very short micronization grinding
time, particle agglomeration occurs, i.e. the specific
surface area decreases.
Figure 6. Change of the zeolite specific surface during
micronizing grinding
Based on the above, it can be said that the specific
surface area parameter is a very important indicator of the
micronizing grinding efficiency.
5. Conclusion
Based on experimental research and experimentally
achieved results, it can be concluded that the study of
0,7
0,75
0,8
0,85
0,9
0,95
1
1,05
1,1
0 100 200 300 400 500 600 700 800 900
Sp
ecif
ic s
urf
ace
area
(m2/g
)
Milling time (s)
Zeolite sample
50 g 200 g

Lj. Andrić et al. Recycling and Sustainable Development 11 (2018) 63-71
69
micronizing grinding zeolite in the domain of modern
technologies is not a simple task, it is complex and very
important.
Zeolites after micronizing grinding have wide
application, and are especially used as adsorbents, due to
the significant power of sorption of metal ions,
radionuclides, micotossine. Thanks to their physico-
mechanical and physico-chemical properties, as well as
their composition and structure, zeolites are also used as
ion exchangers, and have been shown to be very powerful
detoxicans and antioxidants because of significant
capacity to deactivate free radicals.
Based on experimentally achieved results and their
analysis, the following conclusions can be made:
It is important to select a sieving procedure to
avoid particle agglomeration. The sieving of
micronized products of zeolite should be carried
out wet.
For a sample of four times larger initial mass 200
g it is need about 2.5 times longer grinding time
to achieve the maximum content of the class
(- 5 + 0) μm.
For a sample of the bulk class (- 3.35 + 0) mm
with a starting mass of 50 g the effects of
amorphization due to micronizing grinding (after
900 seconds) are very pronounced, and the zeolite
minerals in crystalline form are practically in the
trace and the largest part is amorphous.
In this work, complex experimental investigations of
the micronizing grinding of zeolite have enabled:
To determine the kinetic parameters of the
vibratory mill with rings in the micronizing
grinding process, which influence the appearance
of structural defects and the reactivity of zeolites,
which can be efficiently used to rationalize
process of grinding and the obtaining of high
quality zeolites.
To determine the optimum values of all the most
important technological and technical parameters
(particle size distribution, mean particle diameter
and particle shape, specific surface areas, etc.).
To establish the correlation of the change in the
specific surface and the reaction capacity,
determine the changes in the specific surface
energy that have a major influence on the
flow of the micronizing grinding of the zeolite.
Generally, it can be concluded that a vibrating mill with
a rings proved to be a good device for efficient ultra-fine
micronizing grinding.
Acknowledgments
This investigation was supported by Serbian Ministry of Education, Science and Technological Development
and it was conducted under following project: TR 33007.
References
Ackley W. M., Rege U. S., Saxena H., Application of
natural zeolites in the purification and separation of
gases, Microporous and Mesoporous Materials, 61
(1-3), 2003, 25-42,
Alver E. B., Sakizci M., Yo ̈ru ̈kog ̆ullari E.,
Investigation of clinoptilolite rich natural zeolites
from Turkey: a combined XRF, TG/DTG, DTA and
DSC study, Journal of Thermal Analysis and
Calorimetry, 100 (1), 2010, 19-26,
Andrić Lj., Exploitation of Non-Metallic Mineral Raw
Materials, Serbian Mining and Geology in the second
half of the 20th century, Academy of Engineering
Sciences of Serbia, Matica Srpska, Mining
Institute, 2014, 413-461,
Andrić Lj., Ćalić N., Milošević V., Aćimović-Pavlović
Z., Development and application of micronizing
grinding of non-metallic mineral resources in
environmental protection, Chapter in monograph,
Mineral raw material complex of Serbia today:
challenges and crossroads, Academy of Engineering
Sciences Serbia (AINS), University of Belgrade,
Faculty of Mining and Geology, Serbian Chamber of
Commerce, Belgrade, 203-210, 2010,
Andrić Lj., Trumić M., Comminution by milling,
University of Belgrade, Technical Faculty in Bor,
Bor, 2013, 202, ISBN 978-86- 6305-013-6, (Serbian
edition),
Baerlocher C., McCusker B. L., Olson H. D., Atlas of
Zeolite Framework Types, 6th Edition, Elsevier,
Amsterdam, 2007, 398,
Burris E. L, Juenger C.G. M., Milling as a pretreatment
method for increasing the reactivity of natural zeolites
for use as supplementary cementitious materials,
Cement and Concrete Composites, 65, 2016, 163-
170,
Charkhi A., Kazemian H., Kazemeini M., Optimized
experimental design for natural clinoptilolite zeolite
ball milling to produce nano powders, Powder
Technology, 203 (2), 2010, 389-396,
Chen S. J., Tao Z. C., Fu Y., Zhu M., Li W. L., Li X. D.,
CO2 separation from offshore natural gas in quiescent
and flowing states using 13X zeolite, Applied Energy,
205, 2017, 1435-1446,
Cooney L. E., Booker A. N., Shallcross C. D., Stevens
W. G., Ammonia removal from wastewaters using
natural Australian zeolite. II. Pilot-scale study using
continuous packed column process, Separation
Science And Technology, 34 (14), 1999, 2741-2760,
Ghasemi Z., Sourinejad I., Kazemian H., Rohani S.,
Application of zeolites in aquaculture industry: a
review, Reviews in Aquaculture, 10, 2018, 75-95,
Herceg Z., Lelas V., Brnčić M., Tripalo B., Ježek D.,
Tribomechanical micronization and activation of
whey protein concentrate and zeolite, Sādhanā,

Lj. Andrić et al. Recycling and Sustainable Development 11 (2018) 63-71
70
29 (1), 2004, 13-26,
Johan E., Yamada T., Munthali W. M., Kabwadza-
Corner P., Aono H., Matsue N., Natural zeolites as
potential materials for decontamination of radioactive
cesium, Procedia Environmental Sciences, 28, 2015,
52-56,
Jovanović B. M., Removal of heavy metals ions from
aqueous solutions using zeolites: mechanism, kinetics
and application in fluidizied bed, (Dissertation),
University of Belgrade, Faculty of Technology and
Metallurgy, 2016, 211,
Kahler B., A Synopsis of the Polyvalent Qualities of
Zeolite-Clinoptilolite and the Proposed Uses Within
the Namibian Medical, Pharmaceutical, Industrial
and Economical Sectors: A Proposal for an
Integrated Research, International Science and
Technology Journal of Namibia (ISTJN), 3 (1), 2014,
42-63,
Majstorović-Necković B. J., The possibilities of using the
domestic zeolite for the synthesis of refractory
materialwith high thermal stability, (Dissertation),
University of Belgrade, Faculty of Technology and
Metallurgy, Belgrade, 2015, 176,
Margeta K., Zabukovec L. N., Šiljeg M., Farkaš A.,
Natural zeolites in water treatment - how effective is
their use, Chapter 5, 2013, 81-112,
Mihajlović-Kostić T. M., Sorption of lead, cadmium and
zinc ions from aqueous solutions onto natural and
modified zeolite, (Dissertation), University of
Belgrade, Faculty of Technology and Metallurgy,
Belgrade, 2016, 210,
Prziwara P., Breitung-Faes S., Kwade A., Impact of
grinding aids on dry grinding performance, bulk
properties and surface energy, Advanced Powder
Technology, 29 (2), 2018, 416-425,
Stocker K., Ellersdorfer M., Lehner M., Raith G. J.,
Characterization and Utilization of Natural Zeolites
in Technical Applications, BHM, 162 (4), 2017, 142-
147,
Terzić A., Pezo L., Ljubiša Andrić, Chemometric
assessment of mechano-chemically activated zeolites
for application in the construction composites,
Composites Part B, 109, 2017, 30-44,
Tomić Ž., Possible application of synthetic zeolite CR-
100 (Crystal-Right™) in ammonia adsorption from
ground water of Banat aquifer, (Dissertation),
University of Novi Sad, Faculty of Technology Novi
Sad, 2016, 138,
Tunç T., Demirkıran A. Ş., The effects of mechanical
activation on the sintering and microstructural
properties of cordierite produced from
natural zeolite, Powder Technology, 260, 2014, 7-14,
Wang X., Zhang L., Xi B., Sun W., Xia X., Zhu C., He
X., Li M., Yang T., Wang P., Zhang Z., Biogas
production improvement and C/N control by natural
clinoptilolite addition into anaerobic co-digestion of
Phragmites australis, feces and kitchen
waste, Bioresource Technology, 180, 2015, 192-199.

Lj. Andrić et al. Recycling and Sustainable Development 11 (2018) 63-71
71
Mikronizirajuće mlevenje zeolita u vibracionom mlinu
Ljubiša Andrić a, #, Milan Trumić b, Maja Trumić b, Vladimir Nikolić b
a Institut za tehnologiju nuklearnih i drugih mineralnih sirovina, Srbija b Univerzitet u Beogradu, Tehnički fakultet u Boru, Srbija
INFORMACIJE O RADU I Z V O D
Primljen 21 septembar 2018
Prihvaćen 07 decembar 2018
Originalni rad
Ključne reči: Suvo mikronizirajuće mlevenje
Nemetalične mineralne sirovine
Vibracioni mlin sa prstenovima
Aglomeracija
Reaktivnost
Zeolit
Suvo mikronizirajće mlevenje mineralnih sirovina je vrlo složen proces i zavisi od
čitavog niza parametara kao što su: oblik, krupnoća čestica, granulometrijski sastav
polaznog i mikroniziranog materijala, tvrdoća, vlažnost, gustina, svojstva površina,
konstruktivne karakteristike mlinova itd. Da bi se dobila što jasnija slika procesa
suvog mikronzirajućeg mlevenja, neophodno je dobro poznavanje teorijskih
principa rada visokoenergetskih mlinova.
Klasični mlinovi nisu pogodni za mikronizaciju finih i posebno veoma finih čestica
(gornja granična krupnoća čestice manja od 5 μm), koja je neophodna za savremene
domene industrijske primene. Intenzivna fundamentalna i razvojna istraživanja
procesa suvog mikronizirajućeg mlevenja za razvoj novih materijala omogućila su
i razvoj novih konstrukcionih rešenja za ultra fine visokoenergetske mlinove -
mehano-aktivatore. Ovi mlinovi su našli primenu u najsavremenijim tehnologijama
koje se bave proizvodnjom novih profitabilnih materijala. Za dobijanje mikronskih
čestica - prahova, koriste se mehano-aktivatori i ostali mikronizeri-dezintegratori,
koloidni (perl-atritori), vibracioni, planetarni, ultra-centrifugalni, Jet-strujni
mlinovi i dr., koji rade na principu udarnog dejstva, udara i trenja.
U radu su prikazani eksperimentalno postignuti rezultati suvog mikronizirajućeg
mlevenja zeolita u vibracionom mlinu sa prstenovima, kao i poboljšanja njegove
reaktivnosti. Svi eksperimenti mikronizacije su se izvodili na prethodno
pripremljenoj široj klasi krupnoće (- 3,35 + 0) mm sa različitim polaznim masama
(50 g i 200 g), i u različitim vremenskim intervalima (45, 120, 900 sekundi), kako
bi se ispitao uticaj ovih parametara na proces mikronizacije. Proizvodi mlevenja su
praćeni preko granulometrijskog sastava, sadržaja klase (- 5 + 0) µm i preko
specifične površine. Pokazalo se da je za uzorak zeolita koji ima četiri puta veću
masu u poređenju sa inicijalnim uzorkom, potrebno duže mlevenje za postizanje
maksimalnog sadržaja klase (- 5 + 0) µm, ali i da kod uzorka zeolita klase
(- 3,35 + 0) mm sa manjom početnom masom su efekti amorfizacije usled
mikronizirajućeg mlevenja vrlo jako izraženi, a minerali zeolita u kristalnom
obliku praktično su u tragu, odnosno najveći deo je amorfizovan. Generalno, može
se zaključiti da se vibracioni mlin sa prstenovima pokazao kao dobar uređaj za
efikasno ultra fino mikronizirajuće mlevenje.


Contents
Editor-in-Chief
Nóra Halyag, Gábor Mucsi
S. Maryam Sadeghi, João M.O.M. Jesus, Helena M.V.M. Soares
Milan D. Kosti , Marija B. Tasi , Ivica G. Ðalovi , Milan O. Biberdži , Petar M. Mitrovi ,Olivera S. Stamenkovi , Vlada B. Veljkovi
Ljubiša Andri , Milan Trumi , Maja Trumi , Vladimir Nikoli
Introduction to the Anniversary Issue of the Recycling & Sustainable Development Journal i
Recycling spent fluid cracking catalysts for rare earth metal recovery - a review 43
Optimization of biodiesel production from corn oil by methanolysis catalyzed by corn cob ash 53
Micronization of zeolite in vibration mill 63
Functionalized geopolymers - a review 1
Assessment of construction and demolition waste management in the city of Aveiro, Portugal 9
Precipitationofboron fromwastewaterofKirkaboraxplant 21
Analysis of efficacy of the process of remediation of landfill site soil contaminated with leachateusing material flow analysis 27
Nikola Karanovi
Neset Acarkan, Ozan Kökkiliç, Hüseyin Ba türkçü, Ayhan Ali Sirkeci
Katarina Anti
ć, Ana Paula Gomes, Nemanja Stanisavljević
ć, Nikolina Tošić, Maja Turk Sekulić, Jelena Radonić, Nemanja Stanisavljević
ş
ć ć ć ć ćć ć
ć ć ć ć
10th