Embed Size (px)
Citation preview

RED BLOOD CELL SEGMENTATION AND CLASSIFICATION METHOD
USING MATLAB
ABDULLAH SALEH ALI ALGAMILI
A thesis submitted in partial
fulfillment of the requirement for the award of the
Degree of Master of Electrical Engineering
Faculty of Electrical and Electronic Engineering
Universiti Tun Hussein Onn Malaysia
DECEMBER 2016
iii
DEDICATION
To my beloved father ‘Saleh Ali’, beloved mothers, darling wife, sons, beloved sisters and
brothers and to all my inspiring friends, who have encouraged and guided me throughout
my journey of education.

iv
ACKNOWLEDGEMENT
Alhamdulillah, I am grateful to ALLAH SWT on his blessing and mercy for making this
project successful.
First of all, I would like to express my heartiest appreciation to my supervisor,
Prof. Muhammad Mahadi Abdul Jamil for his effort, guidance and support throughout this
project. Without his advices, suggestions and guidance, the project would have not been
successful in achieving the objectives.
My deepest appreciation also dedicated to my family, who are always there when
it matters most.
Last but not least, I would like to appreciate all my lecturers who have taught me
during three years period, many thanks for the lessons that have been delivered. Not
forgetting Nayf Alduais, Wadhah Waheeb, Abdurahman Amer, and Bashar Ali as my
friends and colleague in this project that giving me ideas, sharing sources of information
and encouragement during the development of the project until it has been successfully
completed.
v
ABSTRACT
Red blood cells (RBCs) are the most important kind of blood cell. Its diagnosis is very
important process for early detection of related disease such as malaria and anemia before
suitable follow up treatment can be proceed. Some of the human disease can be showed
by counting the number of red blood cells. Red blood cell count gives the vital information
that help diagnosis many of the patient’s sickness. Conventional method under blood
smears RBC diagnosis is applying light microscope conducted by pathologist. This
method is time-consuming and laborious. In this project an automated RBC counting is
proposed to speed up the time consumption and to reduce the potential of the wrongly
identified RBC. Initially the RBC goes for image pre-processing which involved global
thresholding. Then it continues with RBCs counting by using two different algorithms
which are the watershed segmentation based on distance transform, and the second one is
the artificial neural network (ANN) classification with fitting application depend on
regression method. Before applying ANN classification there are step needed to get
feature extraction data that are the data extraction using moment invariant. There are still
weaknesses and constraints due to the image itself such as color similarity, weak edge
boundary, overlapping condition, and image quality. Thus, more study must be done to
handle those matters to produce strong analysis approach for medical diagnosis purpose.
This project build a better solution and help to improve the current methods so that it can
be more capable, robust, and effective whenever any sample of blood cell is analyzed. At
the end of this project it conducted comparison between 20 images of blood samples taken
from the medical electronic laboratory in Universiti Tun Hussein Onn Malaysia (UTHM).
The proposed method has been tested on blood cell images and the effectiveness and
reliability of each of the counting method has been demonstrated.

vi
ABSTARK
Sel darah merah merupakan sel darah yang sangat penting. Ia merupakan diagnosis yang
amat penting dalam melakukan proses awalan untuk mengesan penyakit seperti demam
malaria dan anemia sebelum rawatan selanjutnya di berikan kepada pesakit. Sesetengah
manusia penyakit boleh di kesan melalui kiraan bilangan sel darah merah. Kiraan sel darah
merah memberi informasi penting dalam membantu diagnosis terhadap ramai pesakit.
Kaedah konvensyen terhadap diagnosis sapuan darah RBC ialah dengan menggunakan
microskop yang dikendalikan oleh patologi. Kaedah ini memerlukan proses dalam tempoh
masa yang lama serta kajian dan penyelidikan. Dalam projek ini kiraan RBC automatik
mencadangkan untuk melajukan tempoh masa dan mengurangkan potensi berlakunya
kesilapan untuk mengenal pasti RBC. Pertama sekali RBC akan melalui pra-proses
gambar dimana ia melibatkan global pengambangan. Seterusnya ia di teruskan dengan
kiraan RBC dengan menggukan dua algoritma yang berbeza dimana titik perubahan
pengsengmanan adalah perdasarkan jarak pertukaran, dan kedua adalah (rangkaian saraf
buatan ) “artificial neural network” (ANN) dengan memasukkan applikasi bergandung
dengan kaedah regrasi.Sebelum menggunakan ANN klasifikasi terhadap langkah-langkah
adalah diperlukan untuk mendapatkan data seterusnya dengan menggunakan pergerakan
pegun. Masih terdapat kelamahan dan kekangan terhadap gambar berkenaan seperti
ketepatan warna, butiran kurang tepat, pertindihan kondisi dan kualiti gambar.Oleh itu
banyak kajian perlu di jalankan untuk mengendalikan masalah untuk menghasilkan
analisis yang kuat untuk mencapai diagnosis untuk kegunan perubatan. Projek ini di
laksanakan dengan penyelesaian yang baik dan membantu untuk menambah baikkan
kaedah semasa supaya ia dapat memperbanyakkan berkebolehan, berkeupayaan tinggi
dan berkesan. Akhir sekali projek ini akan di laksanakan dengan membuat perbandingan
sekurang-kurangnya 20 keping contoh gambar darah yang di ambil daripada makmal
perubatan Electronic di Universiti Tun Hussein Onn Malaysia (UTHM). Kaedah yang di
cadangkan telah pun di uji terhadap gambar darah dan keberkesanan dan
kebolehpercayaan terhadap kaedah kiraan telah pun di buktikan dengan demonstrasi.
vii
TABLE OF CONTENTS
CHAPTER TITLE PAGE
TITLE PAGE i
DECLARATION ii
DEDICATION iii
ACKNOWLEDGEMENT iv
ABSTRACT v
ABSTRAK vi
TABLE OF CONTENTS vii
LIST OF TABLES xi
LIST OF FIGURES xii
LIST OF SYMPOLES AND ABBREVIATIONS xv
1 INTRODUCTION 1
1.1 Project Background 1
1.2 Problem Statement 3
1.3 Aim and Objectives 4
1.4 Scope of works 4
1.5 Outline of thesis 4
2 LITERATURE REVIEW
2.1 Introduction 6
viii
2.2 Complete blood count (CBC) 8
2.3 Image Acquisition and Enhancement 8
2.4 Image Conversion 9
2.5 Cell Detection 10
2.6 Feature Extraction 10
2.7 Morphological Operation 11
2.8 Image Segmentation 12
2.8.1 Watershed transform 14
2.9 Image Classification 18
2.9.1 Artificial Neural Network (ANN) classifier 19
2.10 Summary 20
2.11 Related Works 20
3 METHODOLOGY
3.1 Introduction 21
3.2 Image acquisition 22
3.3 Pre-processing 23
3.3.1 Global Thresholding 23
3.3.2 Global Color Thresholding 23
3.3.3 Binary Image 24
3.3.4 Morphological Operation 24
3.3.5 Remove Border Object 25
3.3.6 Erosion 26
3.3.7 Dilation 26
ix
3.4 RBC Segmentation using Watershed Algorithms 28
3.5 RBC Classification method 31
3.5.1 RBC Features Extraction 31
3.5.1.1 Textural 32
3.5.1.2 Geometrical 32
3.5.1.3 Statistical 32
3.5.1.4 Morphological 32
3.5.2 Classification using Artificial Neural
Network ‘ANN’
33
3.5.3 Fit Data with a Neural Network 34
3.6 Graphical user interfaces 36
3.6.1 Creating a MATLAB Applications with
Applications Designer
36
3.6.2 Creating a MATLAB GUI with GUIDE 37
3.7 Summary 38
4 RRESULTS AND ANALYSIS
4.1 Introduction 39
4.2 RBCs & WBCs Separation 39
4.3 RBC Image Pre-processing 41
4.4 RBC Watershed Segmentation Result 45
4.5 RBC Classification Result
4.5.1 RBC Features Extraction
50
4.5.2 Classification using Artificial Neural
Network (ANN) in Matlab
51
x
4.5.2.1 Using the Neural Network Fitting
Tool
52
4.6 Graphical User Interface ‘GUIs’ 62
5 CONCLUSION 63
FUTURE WORK 65
REFERENCES 66

xi
LIST OF TABLES
Table No TITLE PAGE
1.1 Normal blood count differentiated by gender 8
4.1 The comparison summary of RBCs account methods
54
xii
LIST OF FIGURES
FIGURE
NO.
TITLE PAGE
1.1 (a) Haemocytometer, and (b) blood cells type image in
blood sample
3
2.1 Image Acquisition Equipment
9
2.2 Flooding process in watershed transform 15
2.3 Example results from previously proposed methods
which confront with overlapping cells (dash-line circle)
(a) Masking and Watershed algorithm
(b) Morphological Watershed Transformation algorithm
17
3.1 RBC counting and classification flow diagram 21
3.2 Original image of blood for 40X objective 22
3.3 conversion from (a) RGB to, (b)binary image 24
3.4 (a) Before remove border object
(b) after remove border object
25
3.5 (a) Binary image, (b) Eroded binary image
26
3.6 (a) Before fill hole, (b) After fill hole
27
3.7 Structure of Feed-Forward network for problem
classification
34
3.8 The regression plots 35
xiii
3.9 Graphic user interface of RBCs segmentation and
classification methods
37
4.1 (a) The saturation component with HSV colour space
(b) Segmented WBC nucleus
40
4.2 (a) Superimpose Separated WBCs on original image, (b)
thresholding the Separated WBCs result
41
4.3 Image pre-processing flow diagram 42
4.4 Dataset images RBC-1: RBC-20 43
4.5 (a) Original Image, (b) Thresholding, (c) After
Thresholding, (d) Remove small object, (e) Reverse, (f)
Fill hole, (g) Remove border and (h) Reverse
44
4.6 Image after prepressing step 45
4.7 calculate the transform distance 46
4.8 watershed transform 47
4.9 The watershed ridge lines 47
4.10 superimposed mask on the original image 48
4.11 Final watershed segmentation result 49
4.12 The result of watershed segmentation in MatLab 49
4.13 The result of one image feature extraction 51
4.14 Training results 53
4.15 Bar chart of image 1-5 classifier accuracy result 55
4.16 Bar chart of image 6-10 classifier accuracy result 56
4.17 Bar chart of image 11-15 classifier accuracy result 56
4.18 Bar chart of image 16-20 classifier accuracy result 57
4.19 [a] Before, [b] after classification and [c] after
segmentation result of (1) RBC_1: (5) RBC_5
58
xiv
4.20 [a] Before, [b] after classification and [c] after
segmentation result of (6) RBC_6: (10) RBC_10
59
4.21 [a] Before, [b] after classification and [c] after
segmentation result of (11) RBC_11: (15) RBC_15
60
4.22 [a] Before, [b] after classification and [c] after
segmentation result of (16) RBC_16: (20) RBC_20
61
4.23 The result of RBCs segmentation and classification
using GUI (a) actual image loaded, (b) segmented
image, (c)actual image tested,(d)classified image, and
(e) classified image tested
62

xv
LIST OF SYMPOLES AND ABBREVIATIONS
RBC Red Blood Cells
WBC White Blood Cells
CBC Complete blood count"
CAD Computer-aided diagnosis
MCV mean corpuscular volume
MCH mean corpuscular hemoglobin
MSE mean square error
PCNN pulse coupled neural network
HT Hough Transform
CHT Circular Hough Transform
SEM scanning electron microscope
ANN Artificial Neural Network
CCL connected-component labelling
GUI Graphical user interfaces
GUIDE GUI development environment
1
CHAPTER 1
INTRODUCTION
1.1 Project Background
In recent years, there has been an increasing interest in development of various algorithms
for automated analysis of medical images in conjunction with advanced artificial
intelligent, image processing and computer graphics techniques [1]. Blood cells are
classified as erythrocytes (Red Blood Cells), leukocytes (White Blood Cells) and platelets
(not considered real cells). The resultant count is the total number of erythrocytes and
leukocytes expressed in a volume of blood [2]. Image segmentation and classification in
natural and medical images is one of the most important topics in medical diagnosis [3].
As consequences, several automatic medical diagnosis systems have been developed to
help doctors to diagnose disease particularly in red blood (RBC) and white blood (WBC)
cells of human that provides valuable information to pathologists [1]. RBCs make up
about 40% by blood volume. WBCs are fewer but larger in size than RBCs. Platelets are
cell-like particles which are smaller than RBCs and WBCs [4]. Red blood cells are the
most important kind of blood cell. Human beings use red blood cells as the main carriers
that send oxygen to the all the human body’s tissues via the blood flow tin the human
being’s circulatory system. Some of the human disease can be showed by counting the
number of red blood cells, some of the human disease can be found by the measurement
of the size of the cell or by the analysis of red blood cell’s shape. The counting of the
number of red blood cells is also an important item in normal blood examination [5].
Automatic counting systems have been available in the medical laboratories for the last
30 years. A low red blood cell count is the indicative for various diseases including
2
anemia, blood loss, leukemia and malnutrition in People who have a less number of
red blood cells.
Pathologists can get valuable information regarding various blood oriented
disorders through red blood cells counting in a blood sample. In the conventional
method of red blood examination in a blood sample done by manpower; hence it has
deficiencies such as less accuracy, poor reliability, and strong subjectivity. The
diagnosis is defined as the process of finding out what kind of disease a certain patient
has and those diagnosed must always be accurate. Sometimes a wrong diagnosis
may lead to situation that wrong dosage of drugs given to the patient, some cases it
may lead to loss of patient life [6]. The conventional method is not suitable for
telemedicine system, In order to overcome these kind of situations. Nowadays, research
in image processing have developed a wide variety of segmentation algorithms. Image
segmentation technology separate image regions by using techniques that include edge
detection and tracking, image gray-value threshold of the image, region growth and
separation, fitting statistic models, pixel clustering, classification using neural networks,
and so on [5]. some research have done some useful works especially in classifying
blood cells from other cells, for example, classifying red blood cells from other cells
such as white blood cells and platelets. Most of the researches have concentrated on the
classification of white blood cells since most of the diseases are easy to determine by
analyzing the change in white blood cells. However, red blood cells also provides some
information about the abnormal condition in our body [6].
In this project, there are four steps involved in counting the red blood cells, image
acquisition, segmentation, morphological operations, and classification. The acquisition
step used the existing blood sample images. Next, the image segmentation and feature
extraction is done by using a morphological technique in order to distinguish the red blood
cells from background and other cells. Then the image classified into every single RBCs.
The purpose of all is to count the number of red blood cells.
3
1.2 Problem Statement
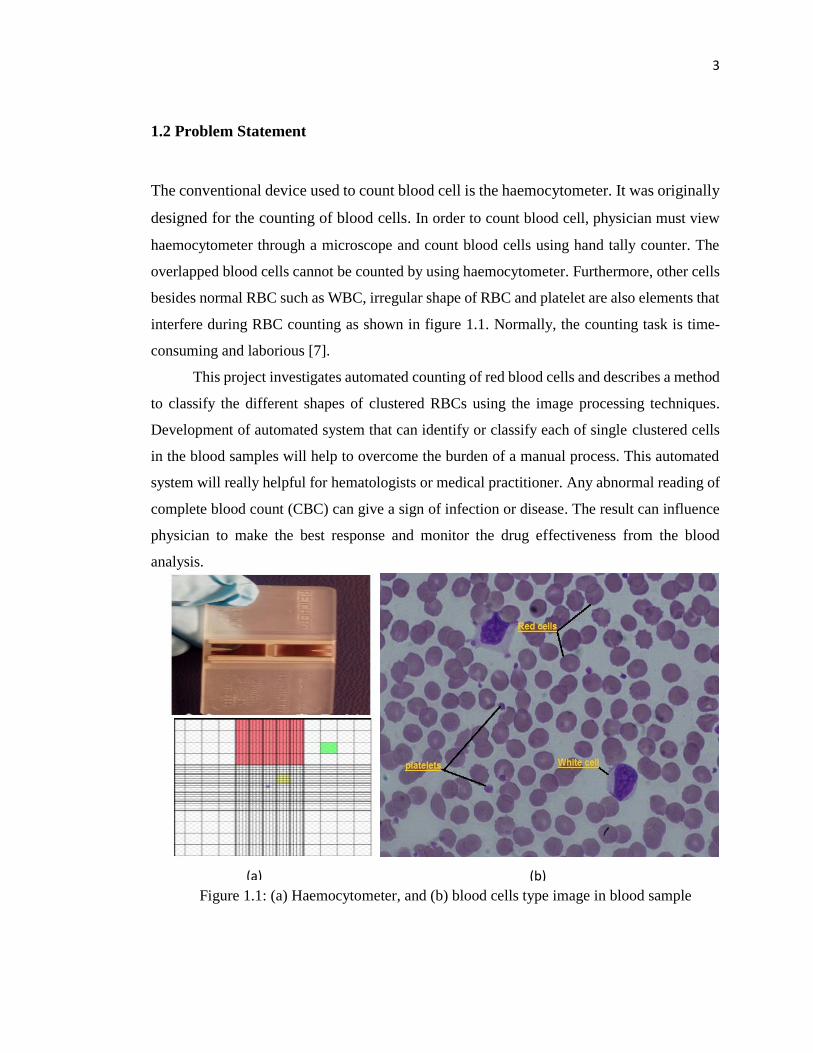
The conventional device used to count blood cell is the haemocytometer. It was originally
designed for the counting of blood cells. In order to count blood cell, physician must view
haemocytometer through a microscope and count blood cells using hand tally counter. The
overlapped blood cells cannot be counted by using haemocytometer. Furthermore, other cells
besides normal RBC such as WBC, irregular shape of RBC and platelet are also elements that
interfere during RBC counting as shown in figure 1.1. Normally, the counting task is time-
consuming and laborious [7].
This project investigates automated counting of red blood cells and describes a method
to classify the different shapes of clustered RBCs using the image processing techniques.
Development of automated system that can identify or classify each of single clustered cells
in the blood samples will help to overcome the burden of a manual process. This automated
system will really helpful for hematologists or medical practitioner. Any abnormal reading of
complete blood count (CBC) can give a sign of infection or disease. The result can influence
physician to make the best response and monitor the drug effectiveness from the blood
analysis.
Figure 1.1: (a) Haemocytometer, and (b) blood cells type image in blood sample
(a) (b)
4
1.3 Aim and Objectives
The aim of this project is to automate the counting process of Red Blood Cells using
Segmentation and Classification methods, ease the working of the pathologist, to help the
doctor make a better diagnosis. The following are the formulated objectives:
i. To develop automated RBCs counting system using segmentation and classification
method.
ii. To test the segmentation and classification performance for system accuracy and
reliability towards the RBCs count process.
1.4 Scope of works
This project is concerned with the scopes as following:
i. To develop RBC pre-processing image, measuring and feature extraction of red blood
cells.
ii. To test the RBC image segmentation and classification system performance.
iii. To produce the summary of analyses for the comparison of the segmentation and
classification performance for system accuracy and suitability judgment towards the
RBCs count project.
1.5 Outline of thesis
This project is divided into five chapters. The scope of each chapter is explained as below:
First chapter gives the background of the thesis, problem statement, aim and objective,
scopes of works and outline of the thesis.
5
Chapter II is about the literature review, in which previous studies and theories related to
this project are discussed and reviewed. It is also describe about RBC image segmentation
and classification using several methods such as neural network and nearest mean.
Literature review provides a background of this project and also gives and direction in this
project.
Chapter III deals with a project methodology. It describes the detailed methods that have
been used to conduct this project. This chapter proposes the method that involved in this
project including image pre-processing using morphological, WBCs separation, threshold
method, and feature extraction. The segmentation method that is proposed is watershed
algorithm depends on Distance transform. The classification method that is proposed is
ANN classification depend on regression fitting application in Matlab.
Chapter IV is for the results and discussion. This chapter will highlight the result of each
method that is proposed in this project also the each of the performance evaluation
conducted to find the most suitable method that provides by Matlab that suits with this
RBC counting project.
Chapter V concludes this project. It also describes the next step that need to be done in
the future works.
6
CHAPTER 2
LITERATURE REVIEW
2.1 Introduction
RBC analysis through image processing method has been subject of interest of many
researchers recently because of conventional method using haemocytometer is quite
tedious and time consuming. Most of the previous work using MATLAB image
processing toolbox as their main tool for analyses the RBC image because of its
convenient for evaluating newly developed algorithm [7].
Complete blood count "CBC " process can be automated by computerized techniques
which are more reliable and economic. Therefore, there is always a need to develop
systems to provide assistance to hematologists and to alleviate the suffering or repetitive
work of physicians. Computer-aided diagnosis (CAD) will establish methods for precise,
accurate, robust and reproducible measurements of blood smear particles status while
reducing human error and diminish the cost of instruments and material used. Afterwards,
software provides the capabilities of upgrading and measurement variability without
major changes and extra burdens. Distance transform watershed algorithm can avoid over
segmentation issue and it has being used to handle overlapping cell. The main idea in this
project is the using of masking and morphological operation function to eliminate
unwanted objects [8]. The computerized steps into automated blood examination refers to
a work done by Bentley and Lewis [9] in 1975. In this early work, authors used of colour
information analysis to obtain integrated data on erythrocytes size in a numbers of normal
and abnormal red blood cells. This project went after to address the correlation between
7
MCV (mean corpuscular volume) refers to the size of erythrocyte and MCH (mean
corpuscular hemoglobin) refers to the concentration of hemoglobin in red blood cells. One
decade after, the first fully automated processing of blood smear slides was introduced by
Rowan [01] in 1986.
Many combination of method has been tested in the RBC image processing. The main
challenge of such process is identification of normal RBC in the blood sample since the
variety in shape of such cell may exist. It will become worse if the cell is clump and
overlap in a group. Such a problem is a main challenge for a researcher to identify or to
classify single RBC in this region.
Some of the previous works just ignore the overlapped RBC [00][01] and some of it
proposed a method to classify/separate the overlapped cell [01][01][15] by using
sophisticated image processing methodology. In this project, the focus is on an automated
method for RBC counting including overlapping condition. In following section,
explanation of various methods available to overcome such an issue is given in detail.
8
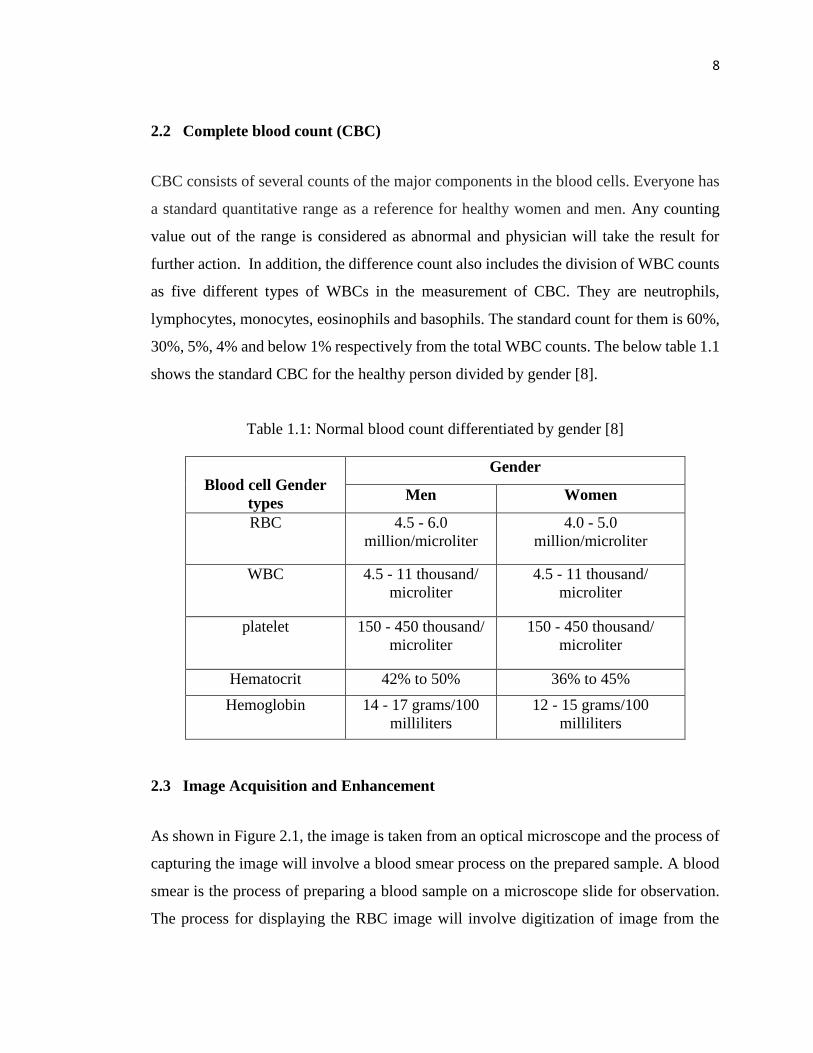
2.2 Complete blood count (CBC)
CBC consists of several counts of the major components in the blood cells. Everyone has
a standard quantitative range as a reference for healthy women and men. Any counting
value out of the range is considered as abnormal and physician will take the result for
further action. In addition, the difference count also includes the division of WBC counts
as five different types of WBCs in the measurement of CBC. They are neutrophils,
lymphocytes, monocytes, eosinophils and basophils. The standard count for them is 60%,
30%, 5%, 4% and below 1% respectively from the total WBC counts. The below table 1.1
shows the standard CBC for the healthy person divided by gender [8].
Table 1.1: Normal blood count differentiated by gender [8]
Blood cell Gender
types
Gender
Men Women
RBC 4.5 - 6.0
million/microliter
4.0 - 5.0
million/microliter
WBC 4.5 - 11 thousand/
microliter
4.5 - 11 thousand/
microliter
platelet 150 - 450 thousand/
microliter
150 - 450 thousand/
microliter
Hematocrit 42% to 50% 36% to 45%
Hemoglobin 14 - 17 grams/100
milliliters
12 - 15 grams/100
milliliters
2.3 Image Acquisition and Enhancement
As shown in Figure 2.1, the image is taken from an optical microscope and the process of
capturing the image will involve a blood smear process on the prepared sample. A blood
smear is the process of preparing a blood sample on a microscope slide for observation.
The process for displaying the RBC image will involve digitization of image from the

9
optical image with 40 times (40X) objective which equal to approximately 400
magnification [3].
Figure 2.1: Image Acquisition Equipment [3]
The images are then being filtered to reduce or minimize noise. Several filtration
techniques are used such as average filter and median filter [11][16][17]. Average filter is
a linear spatial domain filter and function to decrease all noises in sample. It uses a defined
filter mask to average grey level pixel in the neighborhood.
While median filter is a nonlinear spatial filter that changes the gray value at the center
pixel with median value of the gray value of the pixel group. Edge detection reduces
amount of data, filters useless information and preserves important structural details.
Histogram equalization is used to adjust intensity value of image [18][14][19]. Contrast
and brightness adjustment is a step that has been used in image processing. Both
adjustments used histogram of interested image to display the range of intensity value of
image [7].
2.4 Image Conversion
Previous method has been done on image conversion from original image to gray image
[20][21][16][22]. The classification of images by gray-level pixels can reduce and
Light microscope
Camera
Compute
r
10
simplify some image processing operations such as edge detection, edge smoothing,
feature extraction, image processing and image registration [21].
RGB image conversion into binary image also has been done on previous work [23][30].
Conversion to binary image is helpful to identify foreground and background of the image.
Since the binary image is in the black-and-white mode, the image can be easily recognized.
This process will continue through the threshold method, the threshold will be used as a
reference to identify the object and its background.
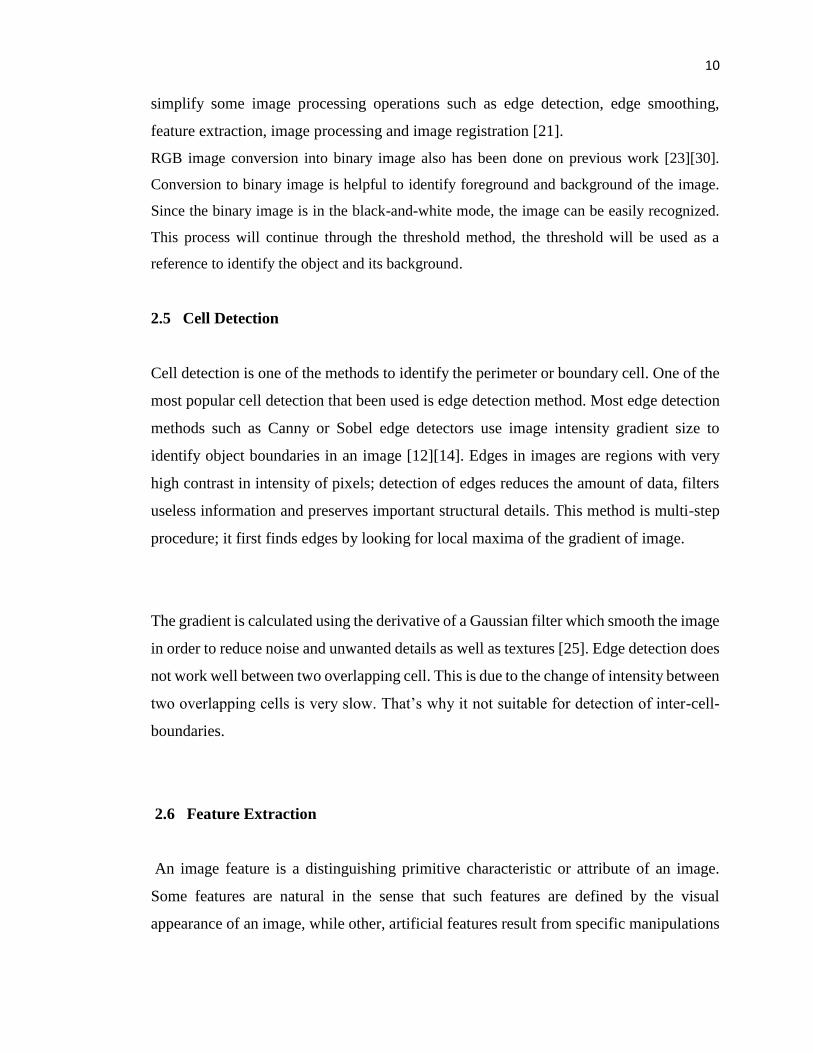
2.5 Cell Detection
Cell detection is one of the methods to identify the perimeter or boundary cell. One of the
most popular cell detection that been used is edge detection method. Most edge detection
methods such as Canny or Sobel edge detectors use image intensity gradient size to
identify object boundaries in an image [12][14]. Edges in images are regions with very
high contrast in intensity of pixels; detection of edges reduces the amount of data, filters
useless information and preserves important structural details. This method is multi-step
procedure; it first finds edges by looking for local maxima of the gradient of image.
The gradient is calculated using the derivative of a Gaussian filter which smooth the image
in order to reduce noise and unwanted details as well as textures [25]. Edge detection does
not work well between two overlapping cell. This is due to the change of intensity between
two overlapping cells is very slow. That’s why it not suitable for detection of inter-cell-
boundaries.
2.6 Feature Extraction
An image feature is a distinguishing primitive characteristic or attribute of an image.
Some features are natural in the sense that such features are defined by the visual
appearance of an image, while other, artificial features result from specific manipulations
11
of an image. Natural features include the luminance of a region of pixels and gray scale
textural regions. Image amplitude histograms and spatial frequency spectra are examples
of artificial features. Image features are of major importance in the isolation of regions of
common property within an image and subsequent identification or labeling of such
regions [25].
2.7 Morphological Operation
Morphology is a broad set of image processing operations that process images based on
shapes [22]. Morphological operations apply a structuring element to an input image,
creating an output image of the same size. In a morphological operation, the value of each
pixel in the output image is based on a comparison of the corresponding pixel in the input
image with its neighbors. The number of pixels added or removed from the objects in an
image depends on the size and shape of the structuring element used to process the image
[14][24]. This adding and removing object is also called ‘dilation’ and ‘erosion’.
Morphological operation is used to separate overlapped image. But there is only certain
condition where morphological operation can be used. It is normally works to separate
minor overlapped image. This method is not suitable to separate overlapped image.
All morphological processing operations are based on two simple ideas, hit and fit. Fit
stands for the condition when all pixels in the structuring element cover on pixels in the
image whereas hit signifies the condition when any of the pixels in the structuring element
covers on a pixel in the image.
Next, morphological opening is the combination process of erosion and continued by
dilation while morphological closing is using the concept of dilation and continued by
erosion. In other words, the functions of morphological opening are to removes, break and
diminished the connection or objects which not contain the structure elements. In contrary,
morphological closing functions to join, fill and build connection and objects in the image
[8].
However both of opening and closing operation have similar task which is smoothen the
object contours but in different ways. For reconstruction, it using two images which is
marker and mask as initial point of transformation and transformation inducer. The
structuring element will act as connectivity element.. Reconstruction also can be applied

12
for filling holes and clearing border objects with the combination of marker and mask
function [8].
2.8 Image Segmentation
Segmentation is one of the most crucial tasks in image processing and computer vision
[29]. As mentioned earlier blood cell contains RBC, WBC, platelet and sickle RBC. To
identify each of this item, there are several method of image processing has been done.
Initial success on segmentation of medical imaging and blood segmentation was obtained
with graph theory [26 [27] [28] which was used to navigate around edge pixels in an
available image. However this approach has involved images of single objects manually
located in an image. Further, it does not address the problems of multiple objects in the
image. Therefore, object location, removal of extraneous edges (internal to the cell), or
the selection of suitable starting and ending points for the graph search are the initial steps
which are should considered. These arguments rely too heavily on quantitative analysis of
manual aforementioned preprocessing steps where it is always an inconsistency with this
argument. There is no consensus among researchers regarding what method can be applied
for different conditions, and there is no general agreement about these initial steps.
Due to complexity of the problem at hand some of the papers are limited to image-based
comparisons based on red cells segmented either manually [30] [31], or semi-
automatically[32] [33] [34] [35] they proposed a framework with three steps to identify
rolling leukocytes in microscopic images. This work profits gradient inverse coefficients
of variation (GICOV) to discriminate leukocytes in-vivo environment. Authors first build
a set of arbitrary number of ellipses by varying radii and orientation. Local maximum in
gradient inverse coefficients of varying value denote presence of white blood cell in a
close-by ellipse area where ellipses corresponding to locally maximum GICOV will be
relaxed to flexible contours by active B-spline curves. Some of them used a method to
estimate circularity ratio of cells [36]. Watershed algorithm is a method used to segment
RBC in overlapping area [11][12][22]. However, it cannot handle when the overlapping
area contain important information and it is hard to ensure the accuracy of segmentation
due to the large error. The improvement has been done by combining mathematical
morphology using corrosion and expansion algorithm with the principle of watershed
13
algorithm [13].The line operator with 20 line segments in various directions over a global
Otsu threshold image has been applied. One of the previous work employed a K-means
classification to detect of leukocyte and then counting RBC was addressed using
watershed [40].
The distance transform is a useful tool employed in conjunction with the watershed
transform. It computes the distance from every pixel to the nearest non-zero valued pixel.
On previous work, distance transform is used combined with watershed for splitting
clumped cells. The main function of distance transform is it detects the cell central point.
Thus if the image is inconsistent in shape or overlapped, by using this method it can detect
cell image based on the central point’s [20].
The other recent common methods used for overlapping and clumped cells are concavity
analysis and template matching [11]. On the other hand, concavity analysis is used to
measure split lines for an overlapped cells. Nevertheless, it is only applicable for a pair of
cells but useless against multiple overlapping cells. Plus, a very accurate segmentation is
needed to apply this method. Other technique template matching which uses a template of
RBC or clumping area to be matched to the object in the image able to separate small cell
in shape and size. However, it is computationally expensive.
In a research, template matching method was combined with pulse coupled neural network
(PCNN) since PCNN cannot cope with overlapped cells. However the accuracy decreases
whenever the RBCs are overlapped totally because the area of one cell is considered as a
template and the algorithm works only in 100x microscope scale [21].
Hough transform method also been used in previous work. The Hough Transform (HT)
has been recognized as a very powerful tool for the detection of parametric curves in
images [15][16][37]. It implements a voting process that maps image edge points into
manifolds in an appropriately defined parameter space. The Circular Hough Transform
(CHT) is one of the modified versions of the HT. The CHT concentrates to find circular
patterns within an image. The Circle Hough Transform is designed to find a circle
characterized by a center point.
Contour tracing approach has been used to segment scanning electron microscope (SEM)
images. The method views contour detection and negotiating perceived problem areas one
at a time but it still has lack when facing overlapping cells. It applies Bayesian tracking
14
framework [38]. Consequently, the RBC segmentation of SEM image utilized shape
reconstruction and multi-scale surface based on shape from shading technique combined
with linear approximation [17]. Other than that, classification of RBC has been done
through depth map and surface feature for different surface shapes [39].
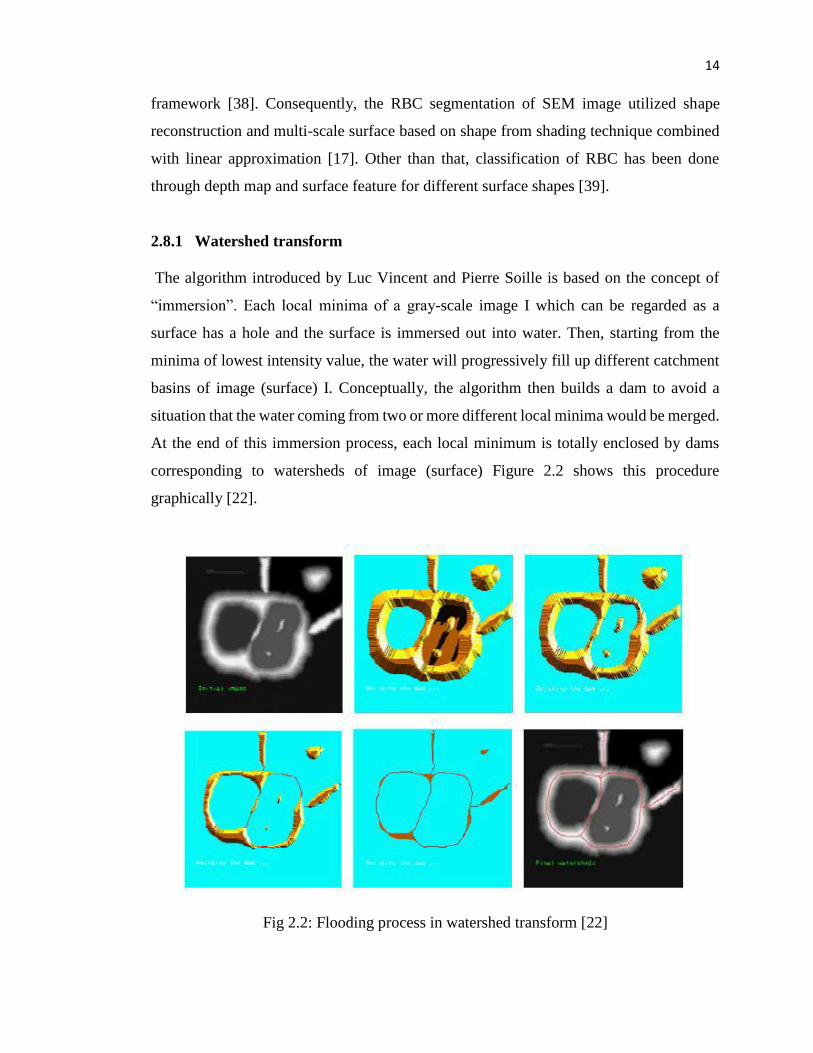
2.8.1 Watershed transform
The algorithm introduced by Luc Vincent and Pierre Soille is based on the concept of
“immersion”. Each local minima of a gray-scale image I which can be regarded as a
surface has a hole and the surface is immersed out into water. Then, starting from the
minima of lowest intensity value, the water will progressively fill up different catchment
basins of image (surface) I. Conceptually, the algorithm then builds a dam to avoid a
situation that the water coming from two or more different local minima would be merged.
At the end of this immersion process, each local minimum is totally enclosed by dams
corresponding to watersheds of image (surface) Figure 2.2 shows this procedure
graphically [22].
Fig 2.2: Flooding process in watershed transform [22]
15
The watershed transform has been widely used in many fields of image processing,
including medical image segmentation, due to the number of advantages that it possesses:
it is a simple intuitive method, it is fast and can be parallelized and an almost linear
speedup was reported for a number of processors up to 64) and it produces a complete
division of the image in separated regions even if the contrast is poor, thus avoiding the
need for any kind of contour joining. It is appropriate to use this method to segment the
high-resolution remote sensing image [22].
Watershed segmentation is one of the most potential algorithms that have been used for
cell segmentation because of its adaptability to segment complex images [11]. The
performance of watershed segmentation depends on how the correct markers are chosen,
otherwise it suffers from over segmentation. The main advantage of the marker controlled
watershed method over other previously developed remedies in segmentation methods is
that it allows segmentation of particular objects and is thus applicable for counting
applications [15].
Hemant et.al [15] used marker controlled watershed segmentation for counting of WBCs,
RBCs and platelets. The blood images were pre-processed to filter noise, and then
converted in to binary for colour distinction between the cells and to create a marker,
finally watershed transform was applied. Although the blood cells were segmented, the
overlapped RBCs were considered as one cell in their work. The accuracy of the
segmentation is hence decreased. Karunakar [18] proposed an algorithm to automatically
count RBCs using windows based applications in mobile phones. The basic segmentation
algorithm is based on Otsu’s threshold, morphological operations like opening, closing
and filtering and also marker controlled watershed segmentation. They obtained a
minimum accuracy of 80%; however the overlapping cells were not considered. Sharif
et.al [24] proposed an algorithm to segment RBCs, by removing WBCs and platelets using
masking and morphological operations, and then applying marker controlled watershed
segmentation. The algorithm is capable of handling only touched cells but not overlapping
cells.
Watershed segmentation has also been used by Gonzalez and Ballarin [44] for
segmentation of biomedical images. They proposed the use of K-means clustering to
cluster objects of interest for automatic detection of markers and the applied watershed
16
transform on them. Their algorithm was simple and robust. Sun and Luo [45] proposed an
algorithm to segment overlapping binary particle images using distance transform and
then applied watershed segmentation. The overlap parameter was defined and a criterion
was built to merge the spurious local minima and hence over segmentation was avoided.
Other than watershed segmentation, other methods like clustering, contour tracing, Hough
Transform and Distance Mapping have also been proposed for RBCs count. Nasution and
Suryaningtyas [46] have tried to compare RBCs count using Connected Component
Labelling and Backprojection of Artificial Neural Network and obtained an accuracy of
87.74% and 86.97% respectively. The image was first pre-processed, and then the
watershed segmentation was applied next. Region of interest was determined for clumping
and unclumping cells. Edge detection was applied for clumping cells, and then the outer
boundaries were removed. The separated clumping and unclumping cells were
superimposed for the counting process [46]. Maitra, Gupta and Mukherjee [47] presented
to segment and count RBCs in microscopic blood images using Hough Transform. Hough
transform was used as a feature extraction tool to extract RBCs based on their shapes and
sizes by detecting circles in the image after the pre-processing step [47]. However, the
result of Hough transform depended on the image quality and object shapes.
Habibzadeh et al. [2] proposed to count RBCs and WBCs in a noisy blood image. Their
work used Bivariate wavelet to noise reduction, Kuwahara filter for edge preservation,
merged Otsu and Niblack method for binarization, size estimations for

17
WBCs and RBCs separation. Cells in their work were finally counted using Immersion
watershed algorithms. The methods still confront with the overlapping cells caused the
estimation size of cells fail and then effects the accuracy results of counting cells. Li et al.
[31] presented an algorithm to segment touching cell nuclei of zebra fish using gradient
vector flow tracking and separated the image into smaller regions with nucleus and applied
adaptive thresholding. The paper provided a good algorithm to depress over segmentation
and under segmentation. Vromen and McCane [48] presented a model to segment
Scanning Electron Microscope Image of RBCs using contour tracing approach. Their
results were satisfactory but still needed some improvement in removing falsely detected
contours for minimally occluded cells. Figure 2.3 shows the limitations of the previously
proposed algorithms confront with overlapping cells.
Khan and Maruf [49] presented a framework for cell segmentation by detection of
centroids in microscopic images facilitated by computing template based pattern matching
on the distance transform called distance mapping. The accuracy obtained was relatively
higher than compared to other methods of segmentation. However this method over
counted the cells since it had false positives. Nguyen, Duong and Vu [50] also employed
Figure 2.3: Example results from previously proposed methods which confront with
overlapping cells (dash-line circle) (a) Masking and Watershed algorithm proposed in
[24], (b) Morphological Watershed Transformation algorithm proposed in [15].
18
distance transform for splitting clumped cells by detecting central points and estimating
the cell size for cell count. In order to increase the accuracy of detecting central points,
boundary-covering degree was applied to each point. Their algorithm had limitations on
segmenting large number of overlapped cells.
2.9 Image Classification
A neural network is a computational structure inspired by the study of biological neural
processing. There are many different types of neural networks, from relatively simple to
very complex, just as there are many theories on how biological neural processing works.
In image classification, Multilayer perceptron artificial neural network (ANN) is most
common method used to identify and count RBC [18][14]. It performed by adjusting the
value of the weight between the elements and the mean square error is calculated from
there. The weight value is used to separate abnormal RBC and Normal RBC, thus the
quantity of normal RBC is counted. In some other research, back projection of ANN
compared with connected-component labelling (CCL) has been proved. Haematology
analyser Sysmex KX-21 was used as benchmark for the comparison. The average
accuracy of the CCL is 87.74% and the back projection ANN produced 86.97% of
accuracy [41]. One of the previous study use method of Artificial Neural Network (ANN)
classifier to classified RBCs as normal/abnormal it is Levenberg Marquardt algorithm
with mean square error (MSE) cost function [3].
The images is recorded and converted into grayscale images for easy processing and given
to the artificial neural network. The result found is the complete healthy RBC as well as
incomplete non circular RBC i.e. sickled cells [25].
19
2.9.1 Artificial Neural Network (ANN) classifier
In order to be able to discriminate between RBCs clustering types in the image by using
the selected features, a robust classifier should be used. The classification module is
performed by using artificial neural network (ANN) classifier. The ANNs are a
mathematical approximation of a biological brain, and have been identified as a useful
framework for precise modelling of nonlinear response. It comprises a number of neurons
connected together to form a network. The weights that linked between the neurons, i.e.
Wij and Wjk are where the functionality of the network resides. Before the network can be
useful, it needs to be trained. Basically the training session will alter the weights so that
the error between the inputs and targets can be minimized. One of the fastest training
approaches is Levenberg Marquardt algorithm with mean square error (MSE) cost
function. Here we feed the data from the RBC features, i.e. [compactness and seven HU
moments invariant], to the input neurons, and RBCs clustered types to the targets neuron
during the training process. The networks setting is consider optimal for the highest
recognition rate in both training and validation set [3].
20
2.10 Summary
RBC classification using image processing has been done in many previous works. As we
know RBC analysis using image processing is not a new thing in medical diagnosis.
Researchers focus on the improvement of the accuracy and promising result in their
research by using many different methods. A framework for automatically classify the
RBC into many type of cluster is proposed.
There are still weaknesses and constraints due to the image itself such as color
similarity, weak edge boundary, overlapping condition, image quality, contrast,
brightness, illumination and noise. Thus, more study must be done to handle those matters
to produce strong analysis approach for medical diagnosis purpose. This project is hoped
to can build a better solution and help to improve the current methods so that it can be
more capable, robust, and effective whenever any sample of blood cell is analyzed.
2.11 Related Works
A Number of works have been conducted in the area of general segmentation and
classification methods, Edge and border detection, region growing, filtering, mathematical
morphology, and watershed clustering. Chen,Yang, and Petriu pointed out that the
Watershed segmentation is an effective method for gray level image segmentation. Watershed
algorithm is a method used to segment RBC in overlapping area [11][12][22]. However, it
cannot handle when the overlapping area contain important information and it is hard to ensure
the accuracy of segmentation due to the large error. The improvement has been done by
combining mathematical morphology using corrosion and expansion algorithm with the
principle of watershed algorithm [13] Thresholding is the simplest method of image
segmentation. It can be used to create binary images from a grayscale image [23]. Marques
stated that the Segmentation is one of the most crucial tasks in image processing and computer
vision [29]. The major application of neural networks was devoted to the classification of
RBCs is done by morphologic parameters [1] [41].

21
CHAPTER 3
METHODOLOGY
3.1 Introduction
Figure 3.1: project framework
Image acquisition using light microscope
Image Enhancement, noise filter, and convert into gray
scale
Colour space reduction
Subtract WBC and small particles
Normal/abnormal RBC classification and counting
Morphological operations
Adjust contrast and smoothen image
Masking operation
WBC nucleus and small particles segmentation
Figure 3.1: RBC counting flow diagram
Global Thresholding
Remove small object
Fill hole
Reverse
Reverse
Remove border object
RBC Features
Extraction
ANN Training
RBC Counting
Random image
testing
RBCs Classification
Particle area size
System training
Numeric function
RBC Counting
Numeric function
Pre-processing
ANN
Classification
Watershed
segmentation
RBC Counting
WBCs Subtractions
Image
22
There are several steps taken in for RBC counting system. The problem domain in this
case is to count RBC from a blood cell image automatically. Whereby, the goal is to
segment and classify RBC between many types of shape. The foundation methods that are
taken in digital image processing will be similar one to another. Image pre-processing is
not a one-step process: most solutions follow a sequential processing scheme whose main
steps are described in this project. The complete RBCs counting flow diagram is shown
in Figure 3.1.
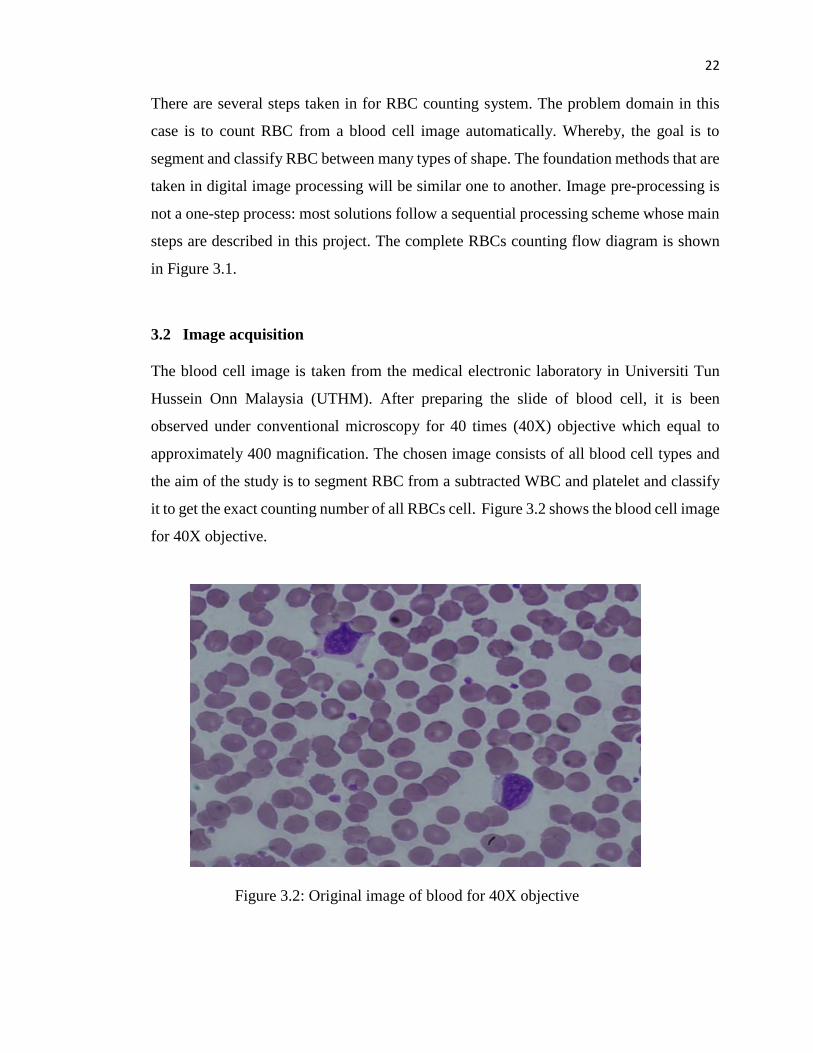
3.2 Image acquisition
The blood cell image is taken from the medical electronic laboratory in Universiti Tun
Hussein Onn Malaysia (UTHM). After preparing the slide of blood cell, it is been
observed under conventional microscopy for 40 times (40X) objective which equal to
approximately 400 magnification. The chosen image consists of all blood cell types and
the aim of the study is to segment RBC from a subtracted WBC and platelet and classify
it to get the exact counting number of all RBCs cell. Figure 3.2 shows the blood cell image
for 40X objective.
Figure 3.2: Original image of blood for 40X objective
23
3.3 Pre-processing
The goal of the pre-processing stage is to improve the quality of the acquired image. In
image processing step the image is being enhance in term of quality level to be prepared
for the next process. It is because the produced image may have some artifacts and
illumination issue and this will be handled in the next process. As described earlier,
blood cell contains RBC, WBC and platelet.
During pre-processing, unwanted image need to be removed. This process will
remain RBC as the remaining object to be analyzed for next process. Possible algorithms
to be employed during this stage including border image removal, removing small
objects and filling holes of the RBC images.
3.3.1 Global Thresholding
The cells are separated from the background using global thresholding. The optimum
threshold is calculated using the well-known Otsu’s method. Otsu’s method is a histogram
based image thresholding method that separates the image pixels into two classes with
minimal intra-class variance. In this project, global colour thresholding process is applied
to convert the image from RGB to binary image.
3.3.2 Global Color Thresholding
Colour thresholding converts a colour image into a binary image. To threshold a colour
image, specify a threshold interval for each of the three colour components. A pixel in
the output image is set to 1 if and only if its colour components fall within the specified
ranges. Otherwise, the pixel value is set to 0.
For a pixel in the colour image to be set to 1 in the binary image, its red value
should lie between 130 and 200, its green value should lie between 100 and 150, and its
blue value should lie between 55 and 115.
24
3.3.3 Binary Image
Binary images are encoded as a 2D array, typically using 1 bit per pixel, where a 0 usually
means “black” and a 1 means “white” (although there is no universal agreement on that).
The main advantage of this representation usually suitable for images containing simple
graphics, text, or line art is its small size.
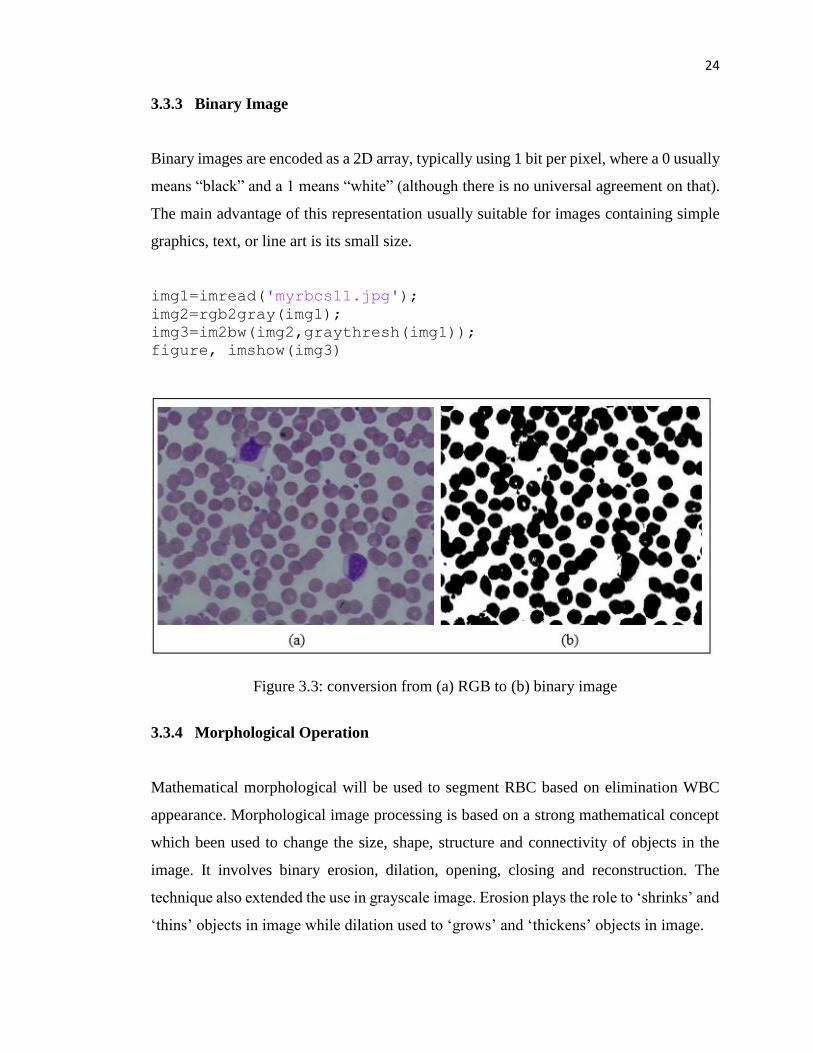
img1=imread('myrbcs11.jpg');
img2=rgb2gray(img1);
img3=im2bw(img2,graythresh(img1));
figure, imshow(img3)
Figure 3.3: conversion from (a) RGB to (b) binary image
3.3.4 Morphological Operation
Mathematical morphological will be used to segment RBC based on elimination WBC
appearance. Morphological image processing is based on a strong mathematical concept
which been used to change the size, shape, structure and connectivity of objects in the
image. It involves binary erosion, dilation, opening, closing and reconstruction. The
technique also extended the use in grayscale image. Erosion plays the role to ‘shrinks’ and
‘thins’ objects in image while dilation used to ‘grows’ and ‘thickens’ objects in image.
66
REFERENCES
[1] Tomari, R., Zakaria, W. N. W., Jamil, M. M. A., Nor, F. M., & Fuad, N. F. N.
(2014). Computer aided system for red blood cell classification in blood smear
image. Procedia Computer Science, 42, 206-213.
[2] Habibzadeh, M. (2015). Automatic Segmentation and Classification of Red and
White Blood cells in Thin Blood Smear Slides (Doctoral dissertation, Concordia
University).
[3] Yang, L. (2009). Robust segmentation and object classification in natural and
medical images. Rutgers University.
[4] Kareem, S., Morling, R. C., & Kale, I. (2011, May). A novel method to count the
red blood cells in thin blood films. In Circuits and Systems (ISCAS), 2011 IEEE
International Symposium on (pp. 1021-1024). IEEE.
[5] Cai, R., Wu, Q., Zhang, R., Fan, L., & Ruan, C. (2012, October). Red blood cell
segmentation using Active Appearance Model. In Signal Processing (ICSP), 2012
IEEE 11th International Conference on (Vol. 3, pp. 1641-1644). IEEE.
[6] Venkatalakshmi, B., & Thilagavathi, K. (2013, April). Automatic red blood cell
counting using Hough transform. In Information & Communication Technologies
(ICT), 2013 IEEE Conference on (pp. 267-271). IEEE.
[7] Lias, J. (2015). Analysis of red blood cell (RBC) classification using Ni vision
builder Ai (Doctoral dissertation, Universiti Tun Hussein Onn Malaysia).
[8] Sharif, J. M., Miswan, M. F., Ngadi, M. A., Salam, M. S. H., & Jamil, M. M. B.
A. (2012, February). Red blood cell segmentation using masking and watershed
algorithm: A preliminary study. In Biomedical Engineering (ICoBE), 2012
International Conference on (pp. 258-262). IEEE.
[9] Bentley, S. A., & Lewis, S. M. (1975). The use of an image analysing computer
for the quantitation of red cell morphological characteristics. British journal of
haematology, 29(1), 81-88.

67
[10] Rowan, R., & England, J. M. (1986). Automated examination of the
peripheral blood smear. Automation and quality assurance in hematology, 129-
177.
[11] Lepcha, P., Srisukkham, W., Zhang, L., & Hossain, A. (2014, December).
Red Blood based disease screening using marker controlled watershed
segmentation and post-processing. In Software, Knowledge, Information
Management and Applications (SKIMA), 2014 8th International Conference
on (pp. 1-7). IEEE.
[12] Karunakar, Y., & Kuwadekar, A. (2011, September). An unparagoned
application for red blood cell counting using marker controlled watershed
algorithm for Android mobile. In Next Generation Mobile Applications, Services
and Technologies (NGMAST), 2011 5th International Conference on (pp. 100-
104). IEEE.
[13] Huang, J. (2010, October). An improved algorithm of overlapping cell
division. In Intelligent Computing and Integrated Systems (ICISS), 2010
International Conference on (pp. 687-691). IEEE.
[14] Poomcokrak, J., & Neatpisarnvanit, C. (2008). Red blood cells extraction
and counting. In The 3rd International Symposium on Biomedical Engineering
(pp. 199-203).
[15] Tulsani, H., Saxena, S., & Yadav, N. (2013). Segmentation using
morphological watershed transformation for counting blood cells. IJCAIT, 2(3),
28-36.
[16] Mahmood, N. H., Lim, P. C., Mazalan, S. M., & Razak, M. A. A. (2013).
Blood cells extraction using color based segmentation technique. International
journal of life sciences biotechnology and pharma research, 2(2), 233-240.
[17] Wang, R., MacCane, B., & Fang, B. (2010, December). RBC image
segmentation based on shape reconstruction and multi-scale surface fitting. In
Information Science and Engineering (ISISE), 2010 International Symposium on
(pp. 586-589). IEEE.
68
[18] Karunakar, Y., & Kuwadekar, A. (2011, September). An unparagoned
application for red blood cell counting using marker controlled watershed
algorithm for Android mobile. In Next Generation Mobile Applications, Services
and Technologies (NGMAST), 2011 5th International Conference on (pp. 100-
104). IEEE.
[19] Di Rubeto, C., Dempster, A., Khan, S., & Jarra, B. (2000). Segmentation
of blood images using morphological operators. In Pattern Recognition, 2000.
Proceedings. 15th International Conference on (Vol. 3, pp. 397-400). IEEE.
[20] Nguyen, N. T., Duong, A. D., & Vu, H. Q. (2010, October). A new method
for splitting clumped cells in red blood images. In Knowledge and Systems
Engineering (KSE), 2010 Second International Conference on (pp. 3-8). IEEE.
[21] Adagale, S. S., & Pawar, S. S. (2013, December). Image segmentation
using PCNN and template matching for blood cell counting. In Computational
Intelligence and Computing Research (ICCIC), 2013 IEEE International
Conference on (pp. 1-5). IEEE.
[22] Kaur, A. (2014). Aayushi.: Image segmentation using watershed
transform. Int. J. Soft Comput. Eng.(IJSCE), 4(1), 5-8.
[23] B. Bobier and M. Wirth.(2008) Evaluation of binarization algorithms.
Technical report,Department of Computing and Information Science, University
of Guelph,Guelph, ON, 2008.
[24] Chen, Q., Yang, X., & Petriu, E. M. (2004, October). Watershed
segmentation for binary images with different distance transforms. In Proceedings
of the 3rd IEEE International Workshop on Haptic, Audio and Visual
Environments and Their Applications (pp. 111-116).
[25] Jambhekar, N. D. (2011). Red blood cells classification using image
processing. Science Research Reporter, 1(3), 151-154.
[26] Martelli, A. (1976). An application of heuristic search methods to edge and
contour detection. Communications of the ACM, 19(2), 73-83.

69
[27] Osowski, S., Siroić, R., Markiewicz, T., & Siwek, K. (2009). Application
of support vector machine and genetic algorithm for improved blood cell
recognition. Instrumentation and Measurement, IEEE Transactions on, 58(7),
2159-2168.
[28] Fleagle, S. R., Johnson, M. R., Wilbricht, C. J., Skorton, D. J., Wilson, R.
F., White, C. W., ... & Collins, S. M. (1989). Automated analysis of coronary
arterial morphology in cineangiograms: geometric and physiologic validation in
humans. Medical Imaging, IEEE Transactions on, 8(4), 387-400.
[29] Marques, O. (2011). Practical image and video processing using
MATLAB. John Wiley & Sons.
[30] Li, G., Liu, T., Nie, J., Guo, L., Chen, J., Zhu, J., ... & Wong, S. T. C.
(2008). Segmentation of touching cell nuclei using gradient flow tracking. Journal
of Microscopy, 231(1), 47-58.
[31] Albertini, M. C., Teodori, L., Piatti, E., Piacentini, M. P., Accorsi, A., &
Rocchi, M. B. (2003). Automated analysis of morphometric parameters for
accurate definition of erythrocyte cell shape. Cytometry part A, 52(1), 12-18.
[32] Robinson, R. D., Benjamin, L. J., Cosgriff, J. M., Cox, C., Lapets, O. P.,
Rowley, P. T., ... & Wheeless, L. L. (1994). Textural differences between AA and
SS blood specimens as detected by image analysis. Cytometry, 17(2), 167-172.
[33] Costin, H., Rotariu, C., Zbancioc, M., Costin, M., & Hanganu, E. (2001).
Fuzzy rule-aided decision support for blood cell recognition. Fuzzy Systems &
Artificial Intelligence, 7(1-3), 61-70.
[34] Gering, E., & Atkinson, C. T. (2004). A rapid method for counting
nucleated erythrocytes on stained blood smears by digital image analysis. Journal
of Parasitology, 90(4), 879-881.
[35] Dong, G., Ray, N., & Acton, S. T. (2005). Intravital leukocyte detection
using the gradient inverse coefficient of variation. Medical Imaging, IEEE
Transactions on, 24(7), 910-924.
[36] Rathore, S., Iftikhar, A., Ali, A., Hussain, M., & Jalil, A. (2012). Capture
Largest Included Circles: An Approach for Counting Red Blood Cells. In
70
Emerging Trends and Applications in Information Communication Technologies
(pp. 373-384). Springer Berlin Heidelberg.
[37] Xiong, W., Ong, S. H., Kang, C., Lim, J. H., Liu, J., Racoceanu, D., &
Foong, K. (2009, October). Cell clumping quantification and automatic area
classification in peripheral blood smear images. In Biomedical Engineering and
Informatics, 2009. BMEI'09. 2nd International Conference on (pp. 1-5). IEEE.
[38] Vromen, J., & McCane, B. (2009, November). Red blood cell
segmentation from SEM images. In 2009 24th International Conference Image and
Vision Computing New Zealand. IEEE (pp. 44-49).
[39] Wang, R., & McCane, B. (2008, December). Red Blood Cell Classification
through Depth Map and Surface Feature. In Computer Science and Computational
Technology, 2008. ISCSCT'08. International Symposium on (Vol. 2, pp. 339-
342). IEEE.
[40] Wei, X., Cao, Y., Fu, G., & Wang, Y. (2015). A counting method for
complex overlapping erythrocytes-based microscopic imaging. Journal of
Innovative Optical Health Sciences, 8(06), 1550033.
[41] Nasution, A. M. T., & Suryaningtyas, E. K. (2008, December).
Comparison of red blood cells counting using two algorithms: Connected
component labeling and backprojection of artificial neural network. In
PhotonicsGlobal@ Singapore, 2008. IPGC 2008. IEEE (pp. 1-4). IEEE.
[42] Nasution, A. M. T., & Suryaningtyas, E. K. (2008, December).
Comparison of red blood cells counting using two algorithms: Connected
component labeling and backprojection of artificial neural network. In
PhotonicsGlobal@ Singapore, 2008. IPGC 2008. IEEE (pp. 1-4). IEEE.
[43] Jha, K. K., Das, B. K., & Dutta, H. S. (2014, March). Detection of
abnormal blood cells on the basis of nucleus shape and counting of WBC. In Green
Computing Communication and Electrical Engineering (ICGCCEE), 2014
International Conference on (pp. 1-5). IEEE.
[44] Gonzalez, M. A., & Ballarin, V. L. (2009). Automatic marker
determination algorithm for watershed segmentation using clustering. Latin
American applied research, 39(3), 225-229.

71
[45] Sun, H. Q., & Luo, Y. J. (2009). Adaptive watershed segmentation of
binary particle image. Journal of microscopy, 233(2), 326-330.
[46] Nasution, A. M. T., & Suryaningtyas, E. K. (2008, December).
Comparison of red blood cells counting using two algorithms: Connected
component labeling and backprojection of artificial neural network. In
PhotonicsGlobal@ Singapore, 2008. IPGC 2008. IEEE (pp. 1-4). IEEE.
[47] Maitra, M., Gupta, R. K., & Mukherjee, M. (2012). Detection and counting
of red blood cells in blood cell images using Hough transform. International
journal of computer applications, 53(16).
[48] Vromen, J., & McCane, B. (2009, November). Red blood cell
segmentation from SEM images. In 2009 24th International Conference Image and
Vision Computing New Zealand. IEEE (pp. 44-49).
[49] Khan, H. A., & Maruf, G. M. (2013, May). Counting clustered cells using
distance mapping. In Informatics, Electronics & Vision (ICIEV), 2013
International Conference on (pp. 1-6). IEEE.
[50] Nguyen, N. T., Duong, A. D., & Vu, H. Q. (2010, October). A new method
for splitting clumped cells in red blood images. In Knowledge and Systems
Engineering (KSE), 2010 Second International Conference on (pp. 3-8). IEEE.
[51] Rahmani, M. K. I., Pal, N., & Arora, K. (2014). Clustering of Image Data
Using K-Means and Fuzzy K-Means. International Journal of Advanced Computer
Science and Applications, 5(7), 160-163.
[52] Bradley, P. S., & Fayyad, U. M. (1998, July). Refining Initial Points for K-
Means Clustering. In ICML (Vol. 98, pp. 91-99).
[53] Nandy, S., Sarkar, P. P., & Das, A. (2012). An Improved Gauss-Newtons
Method based Back-propagation algorithm for fast convergence. arXiv preprint
arXiv:1206.4329.


![Extraction of Blood Vessels from Retinal Image using ......automatic extraction of blood vessels may help to detect ... literature. In [2], the cross section of a blood vessel is detected](https://img.pdfslide.net/doc/110x75/5f9c882ebfa94c36611bb254/extraction-of-blood-vessels-from-retinal-image-using-automatic-extraction.jpg)