Embed Size (px)
Citation preview
RED, BOOST, and You: Improving the Discharge
Transition of Care
Jeffrey L. Greenwald, MD, SFHM Massachusetts General Hospital - Clinician Educator Service
Co-Investigator Project RED & Project BOOST The John D. Stoeckle Center Seminar
March 26, 2010
Objectives
• Be familiar with the seminal literature in discharge transitions of care
• Introduce participants to Projects RED and BOOST
• Be able to identify first steps for yourself and for your institution to begin to improve discharge transitions

It’s not a happy story!
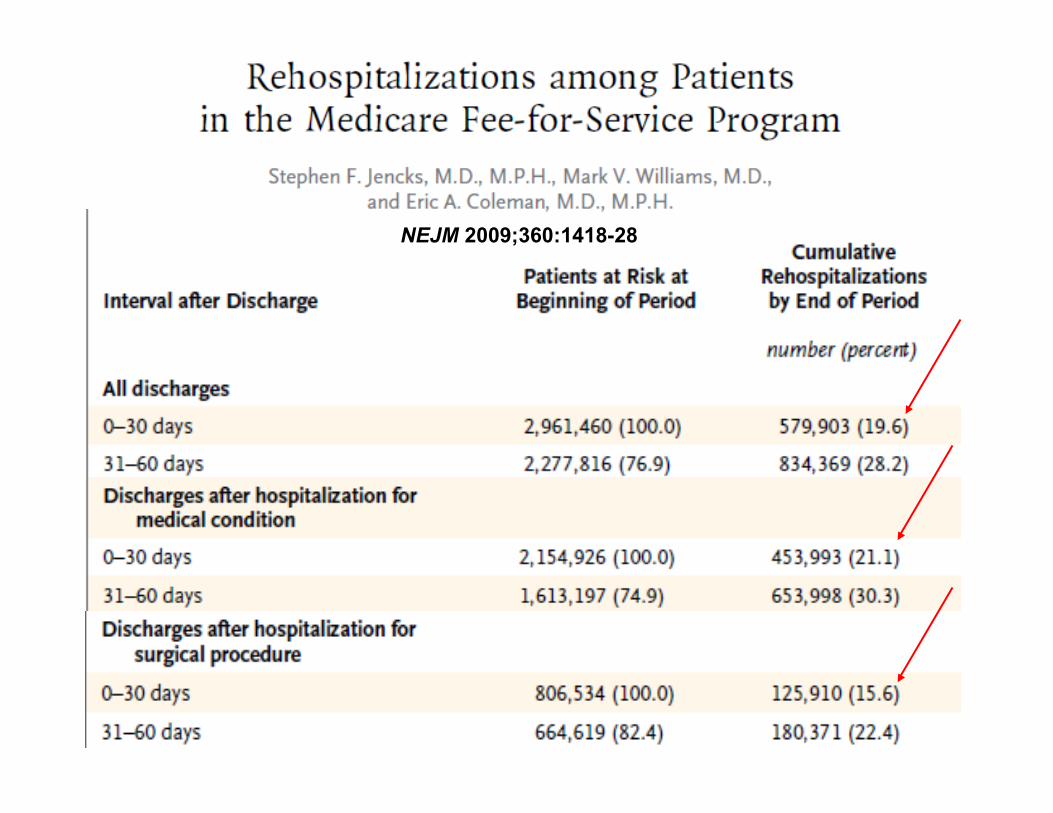
NEJM 2009;360:1418-28
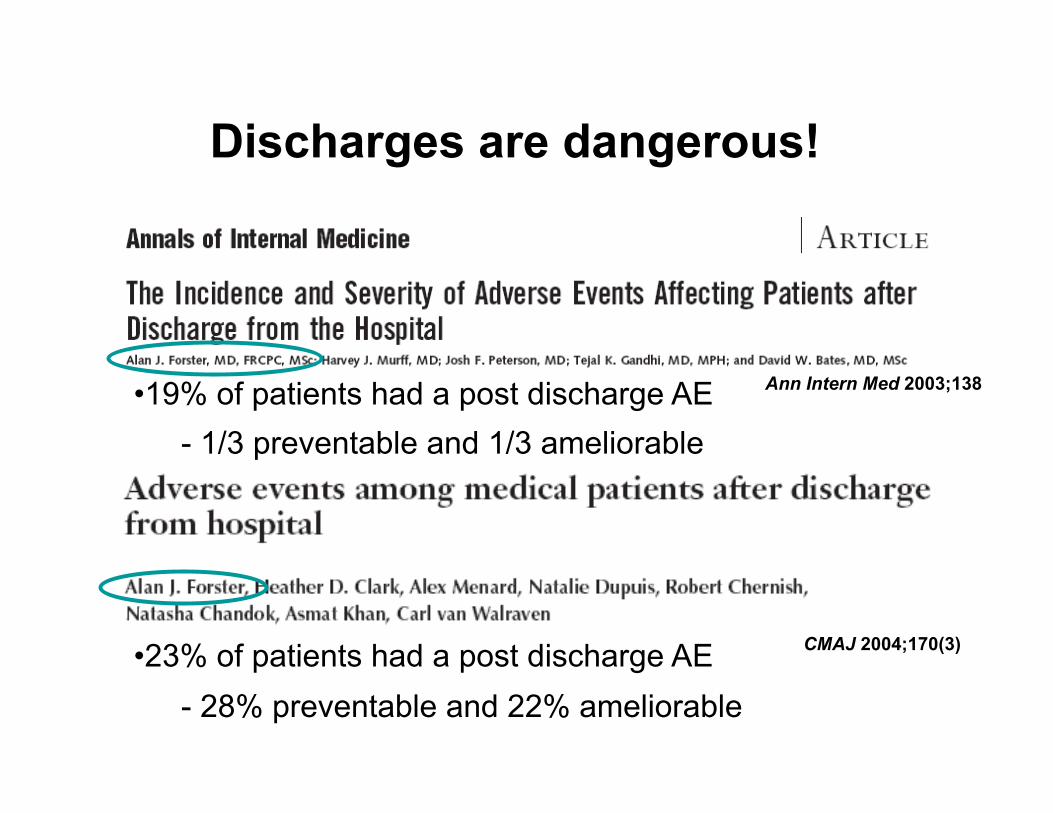
Discharges are dangerous!
• 19% of patients had a post discharge AE - 1/3 preventable and 1/3 ameliorable
Ann Intern Med 2003;138
• 23% of patients had a post discharge AE - 28% preventable and 22% ameliorable
CMAJ 2004;170(3)
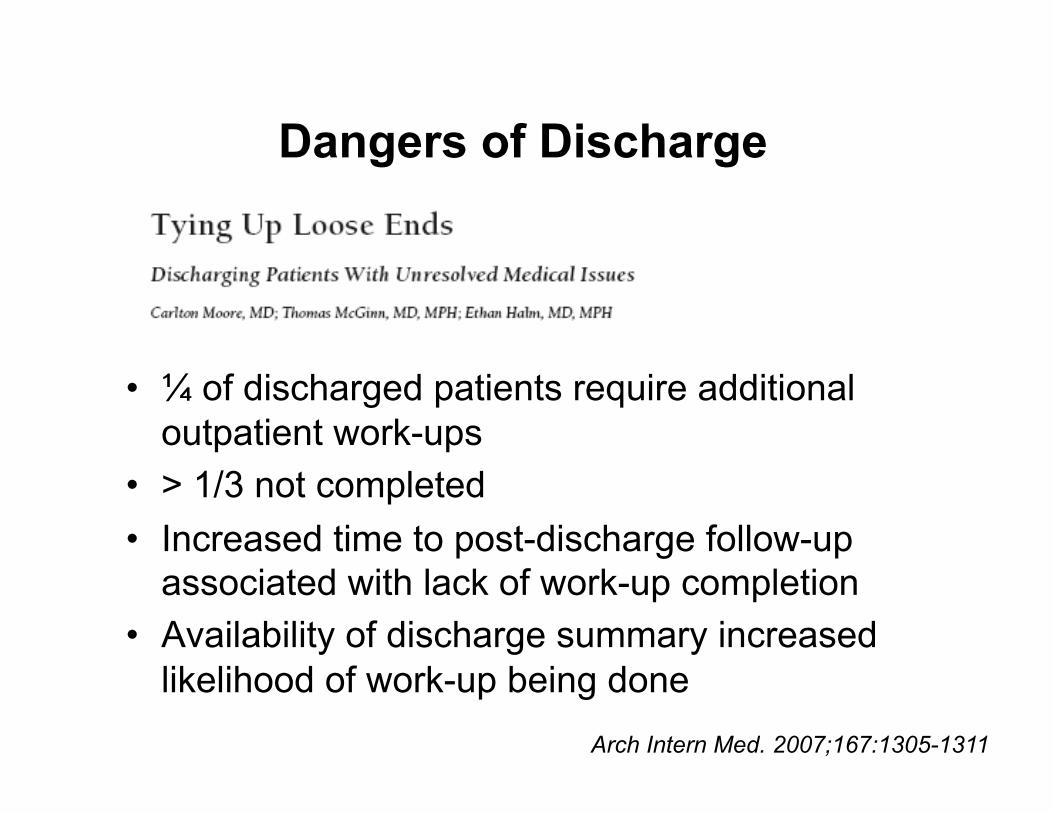
Dangers of Discharge
• ¼ of discharged patients require additional outpatient work-ups
• > 1/3 not completed • Increased time to post-discharge follow-up
associated with lack of work-up completion • Availability of discharge summary increased
likelihood of work-up being done Arch Intern Med. 2007;167:1305-1311
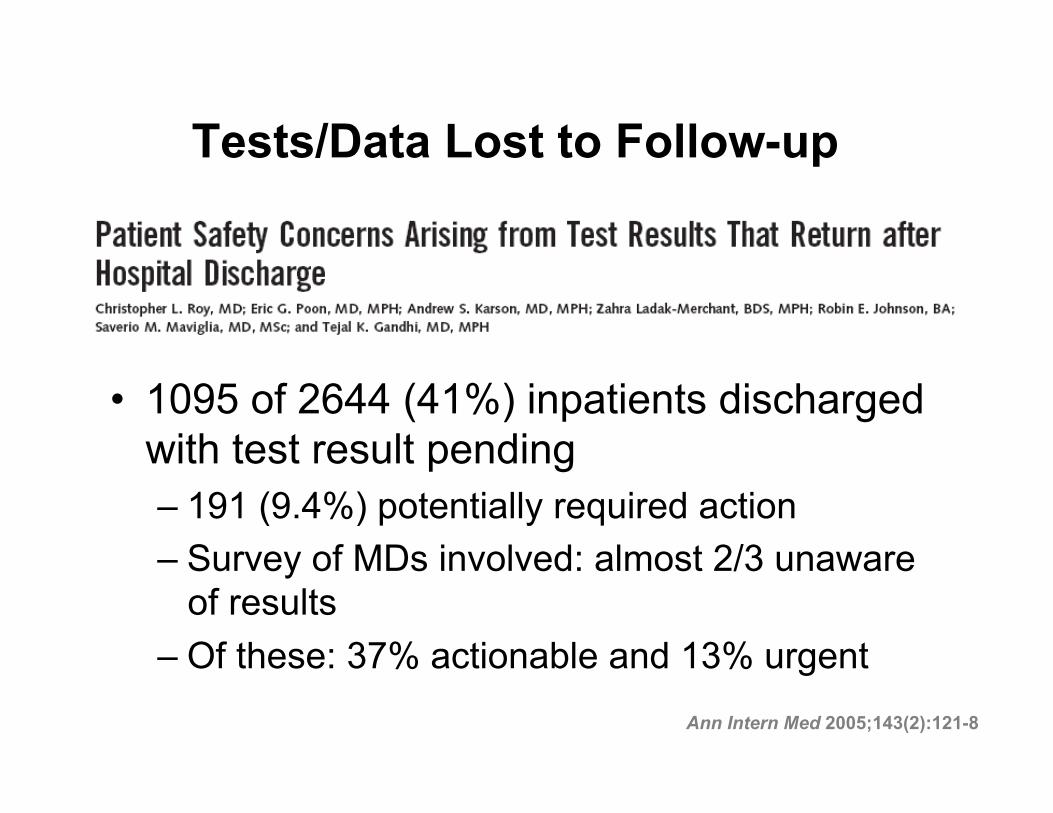
Tests/Data Lost to Follow-up
• 1095 of 2644 (41%) inpatients discharged with test result pending – 191 (9.4%) potentially required action – Survey of MDs involved: almost 2/3 unaware
of results – Of these: 37% actionable and 13% urgent
Ann Intern Med 2005;143(2):121-8
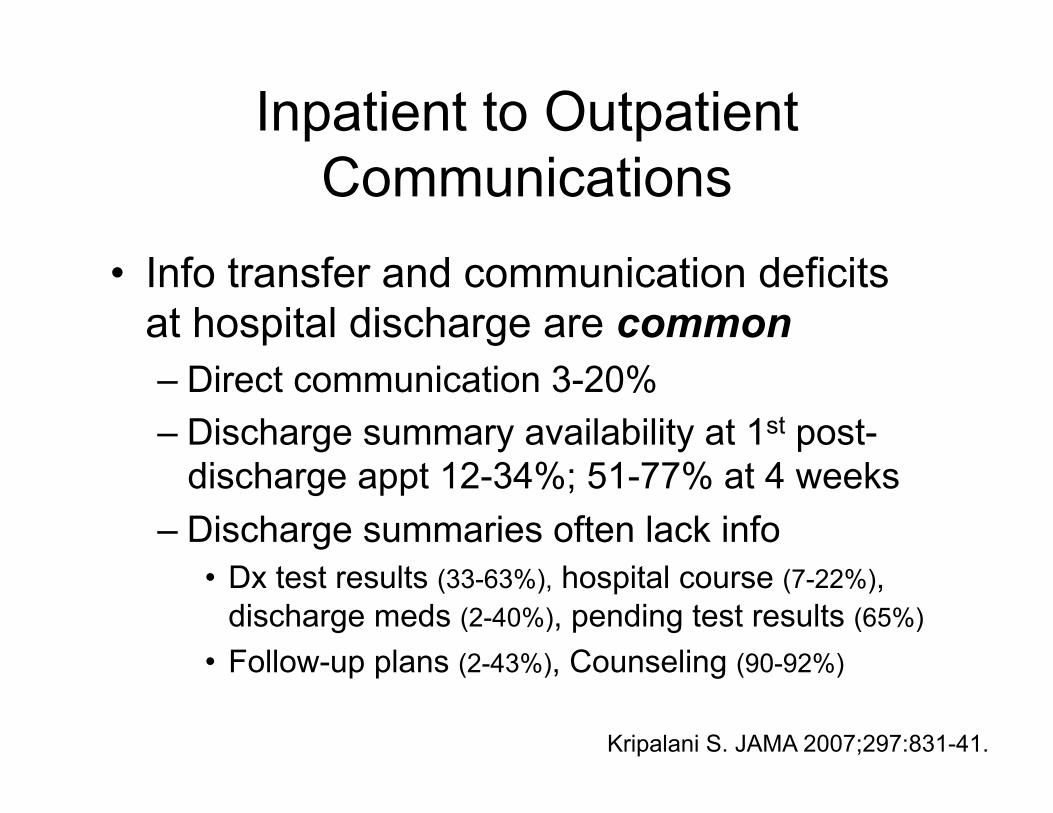
Inpatient to Outpatient Communications
• Info transfer and communication deficits at hospital discharge are common – Direct communication 3-20% – Discharge summary availability at 1st post-
discharge appt 12-34%; 51-77% at 4 weeks – Discharge summaries often lack info
• Dx test results (33-63%), hospital course (7-22%), discharge meds (2-40%), pending test results (65%)
• Follow-up plans (2-43%), Counseling (90-92%)
Kripalani S. JAMA 2007;297:831-41.
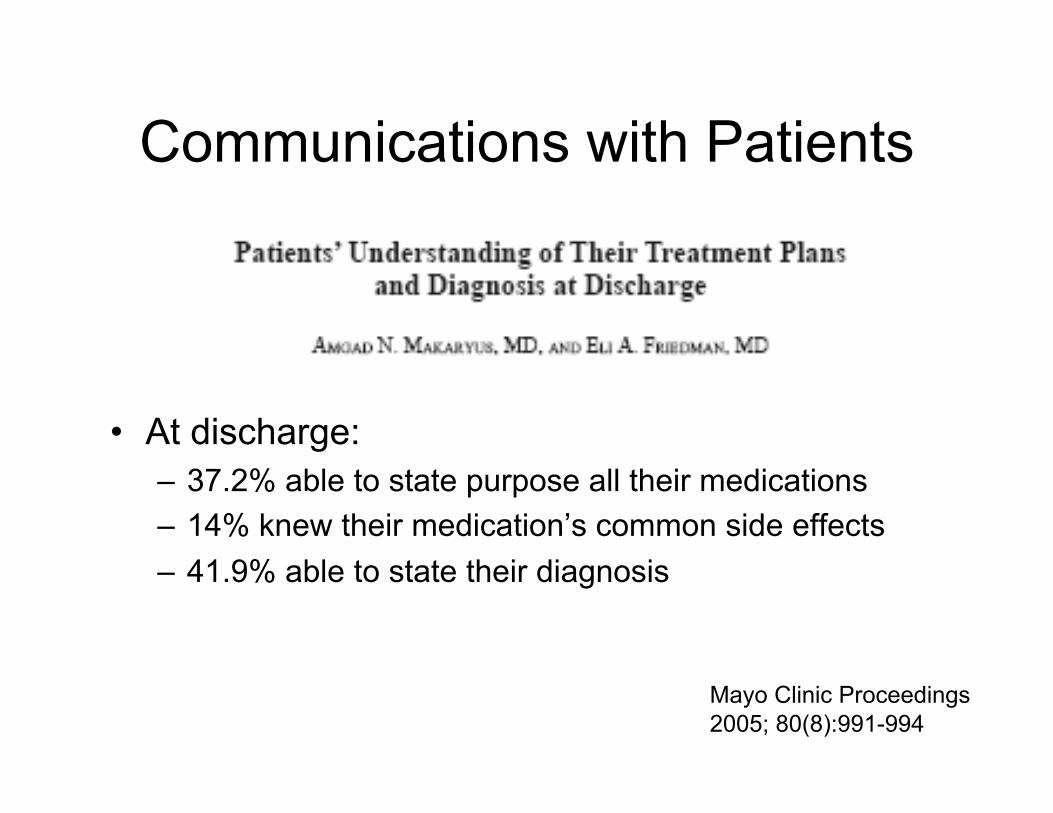
Communications with Patients
• At discharge: – 37.2% able to state purpose all their medications – 14% knew their medication’s common side effects – 41.9% able to state their diagnosis
Mayo Clinic Proceedings 2005; 80(8):991-994
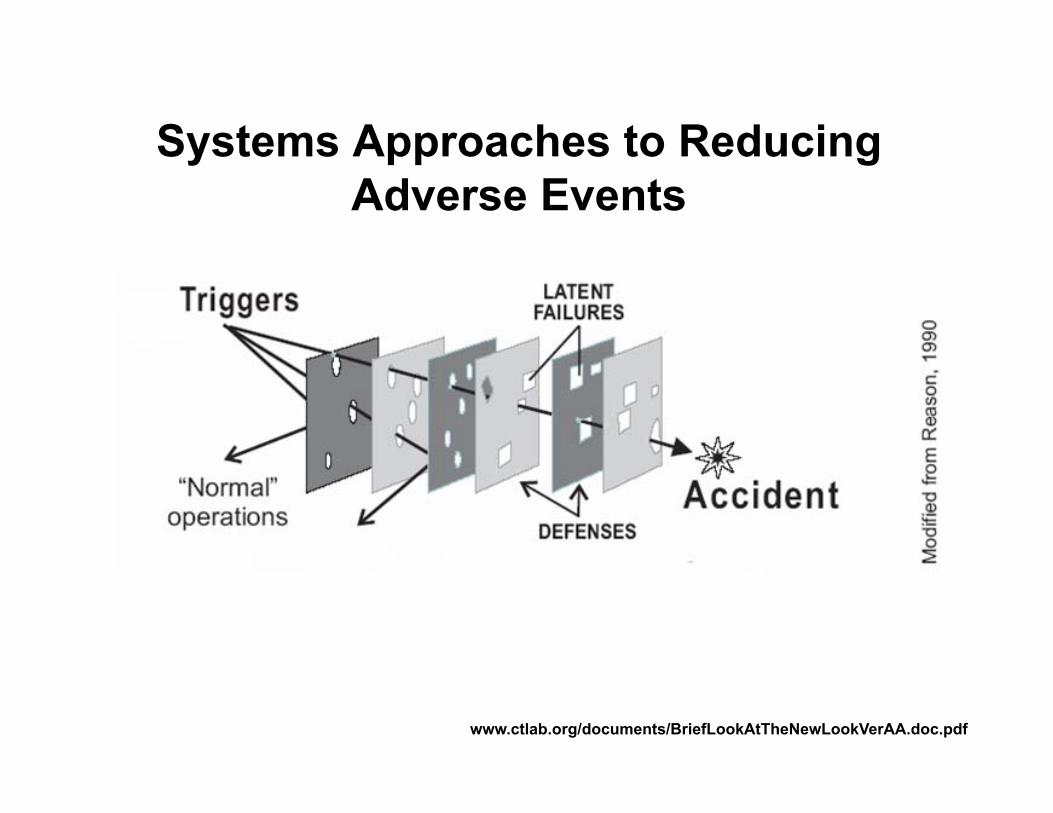
Systems Approaches to Reducing Adverse Events
www.ctlab.org/documents/BriefLookAtTheNewLookVerAA.doc.pdf
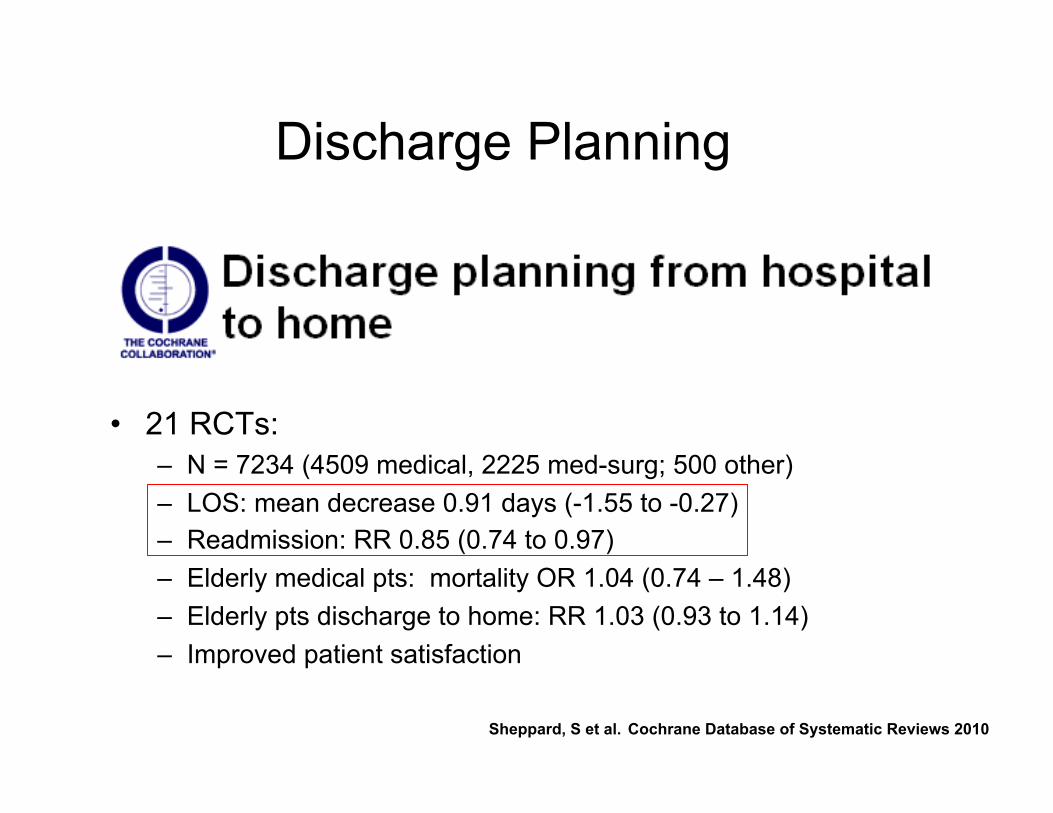
Discharge Planning
• 21 RCTs: – N = 7234 (4509 medical, 2225 med-surg; 500 other) – LOS: mean decrease 0.91 days (-1.55 to -0.27) – Readmission: RR 0.85 (0.74 to 0.97) – Elderly medical pts: mortality OR 1.04 (0.74 – 1.48) – Elderly pts discharge to home: RR 1.03 (0.93 to 1.14) – Improved patient satisfaction
Sheppard, S et al. Cochrane Database of Systematic Reviews 2010
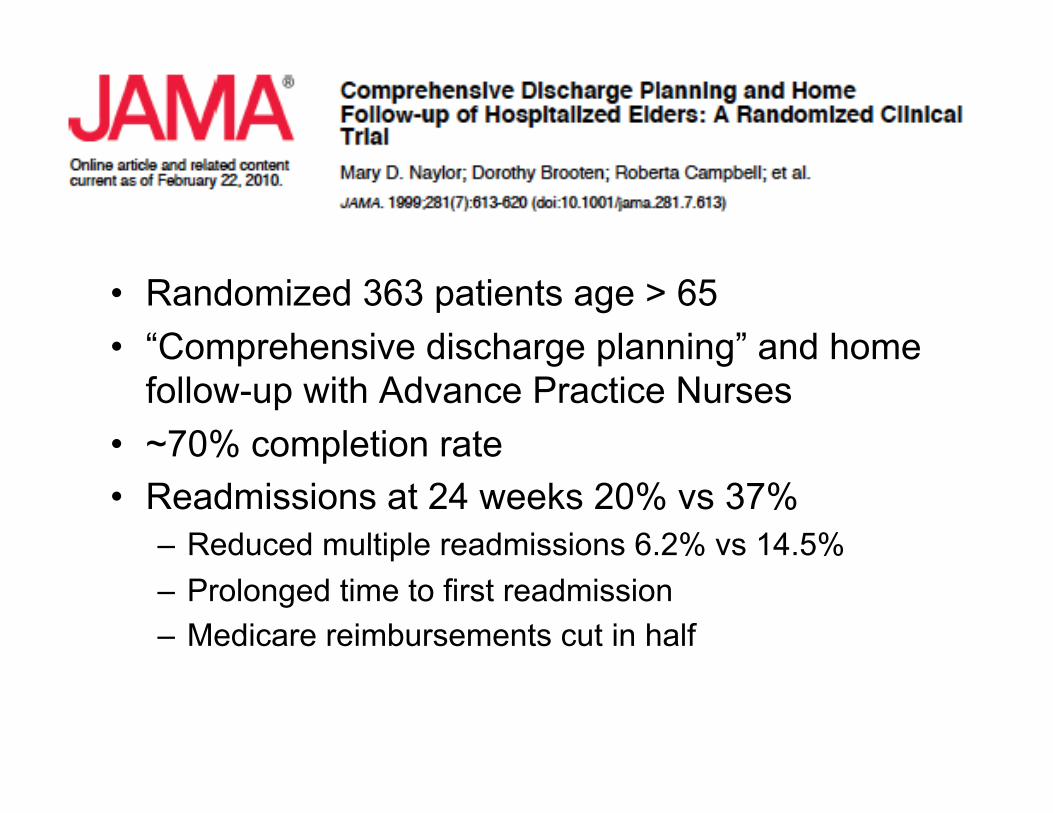
• Randomized 363 patients age > 65 • “Comprehensive discharge planning” and home
follow-up with Advance Practice Nurses • ~70% completion rate • Readmissions at 24 weeks 20% vs 37%
– Reduced multiple readmissions 6.2% vs 14.5% – Prolonged time to first readmission – Medicare reimbursements cut in half
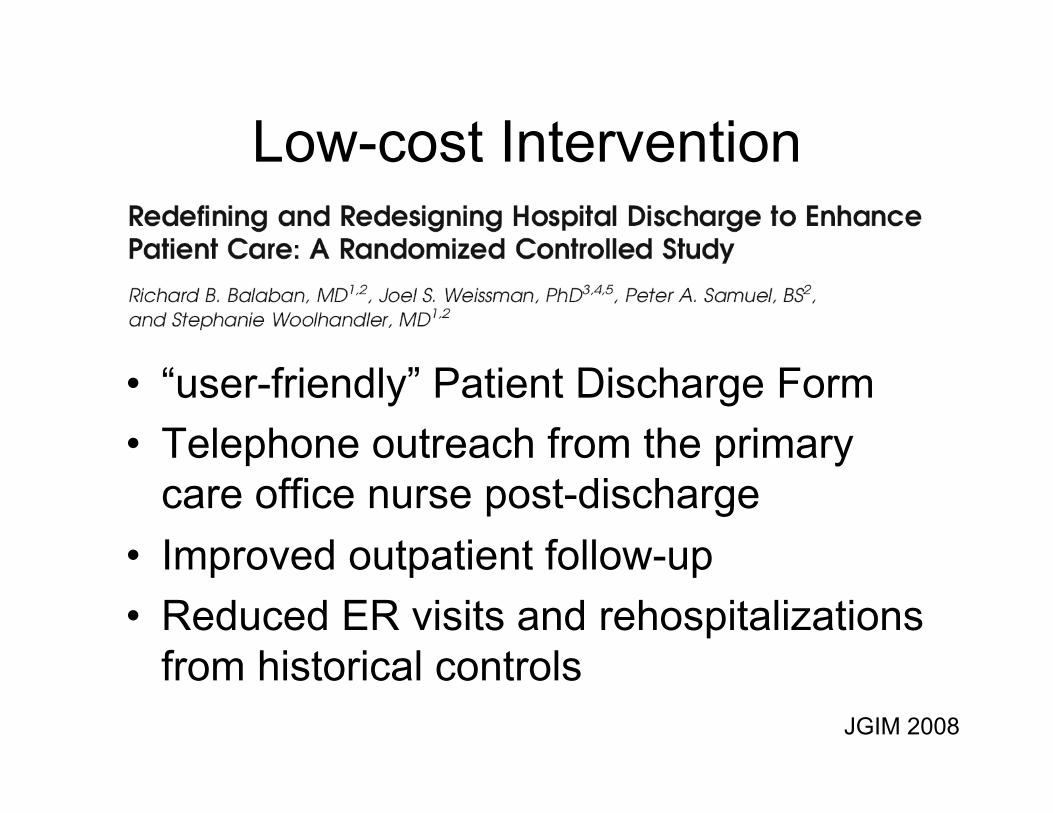
Low-cost Intervention
• “user-friendly” Patient Discharge Form • Telephone outreach from the primary
care office nurse post-discharge • Improved outpatient follow-up • Reduced ER visits and rehospitalizations
from historical controls JGIM 2008
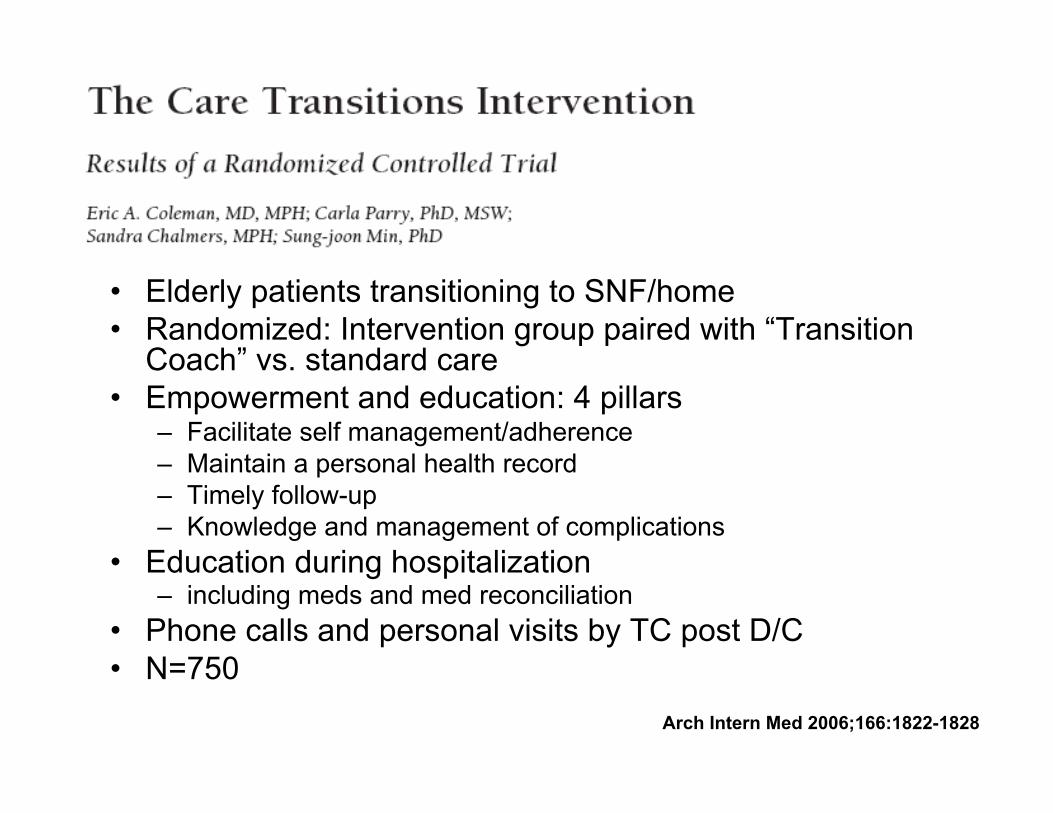
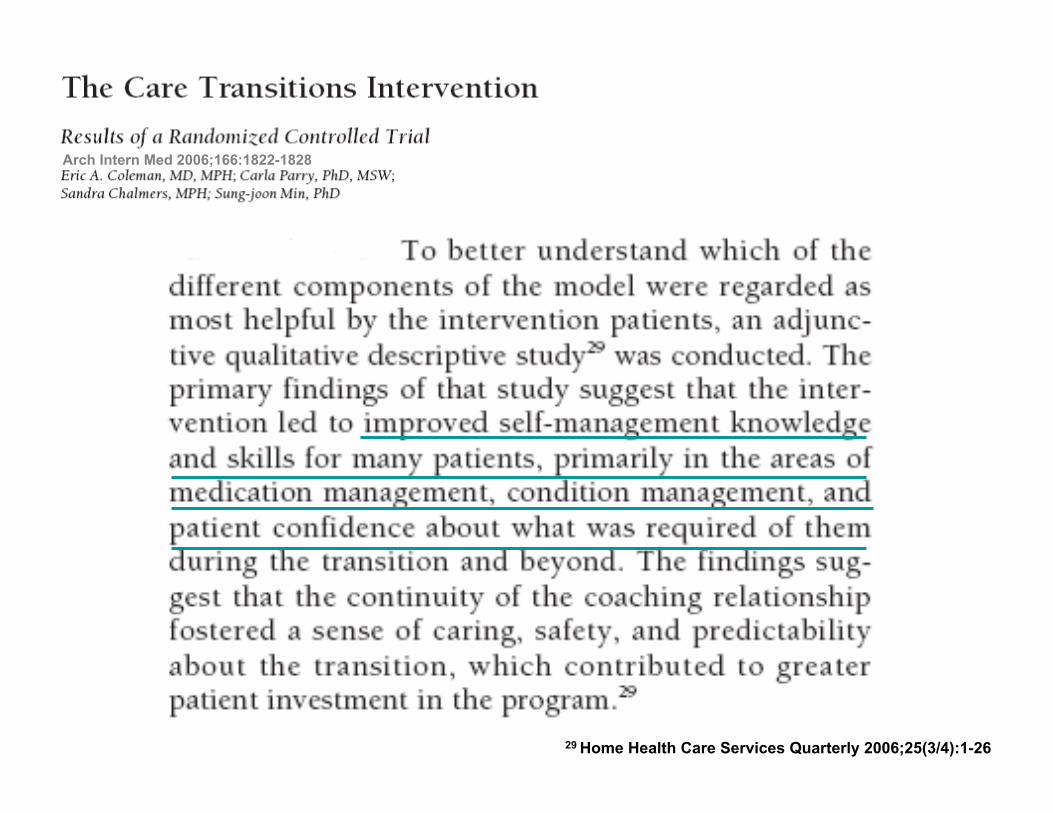
• Elderly patients transitioning to SNF/home • Randomized: Intervention group paired with “Transition
Coach” vs. standard care • Empowerment and education: 4 pillars
– Facilitate self management/adherence – Maintain a personal health record – Timely follow-up – Knowledge and management of complications
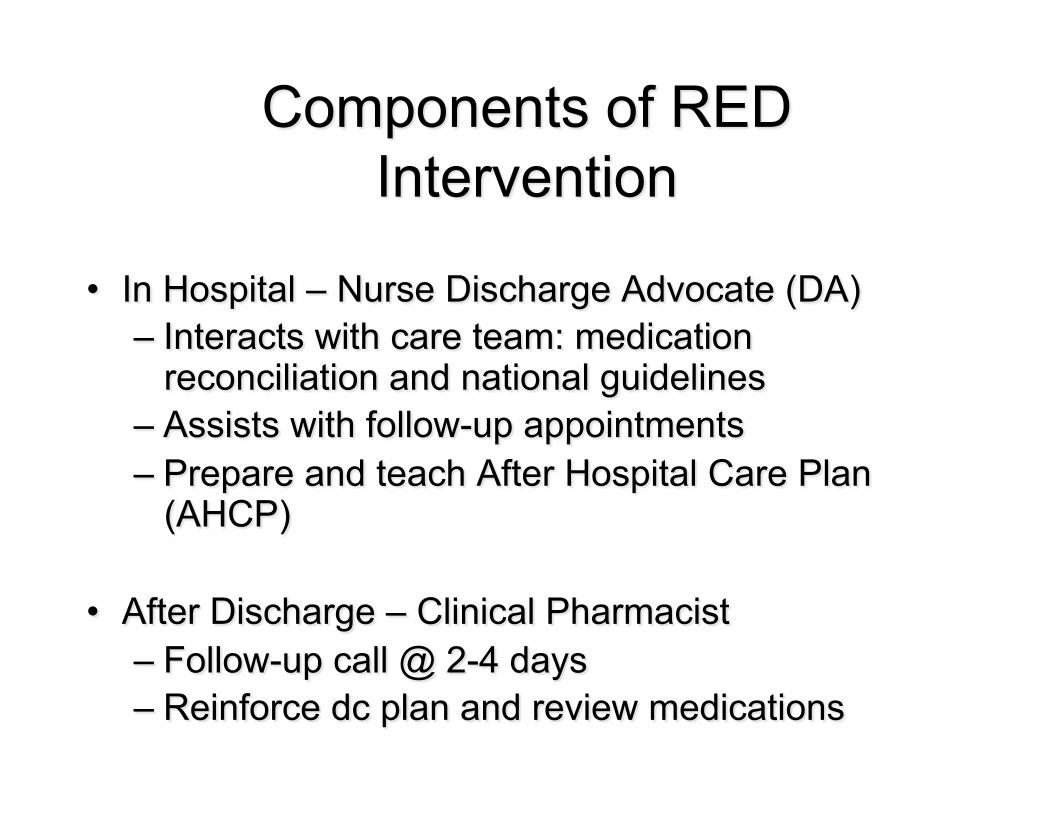
• Education during hospitalization – including meds and med reconciliation
• Phone calls and personal visits by TC post D/C • N=750
Arch Intern Med 2006;166:1822-1828
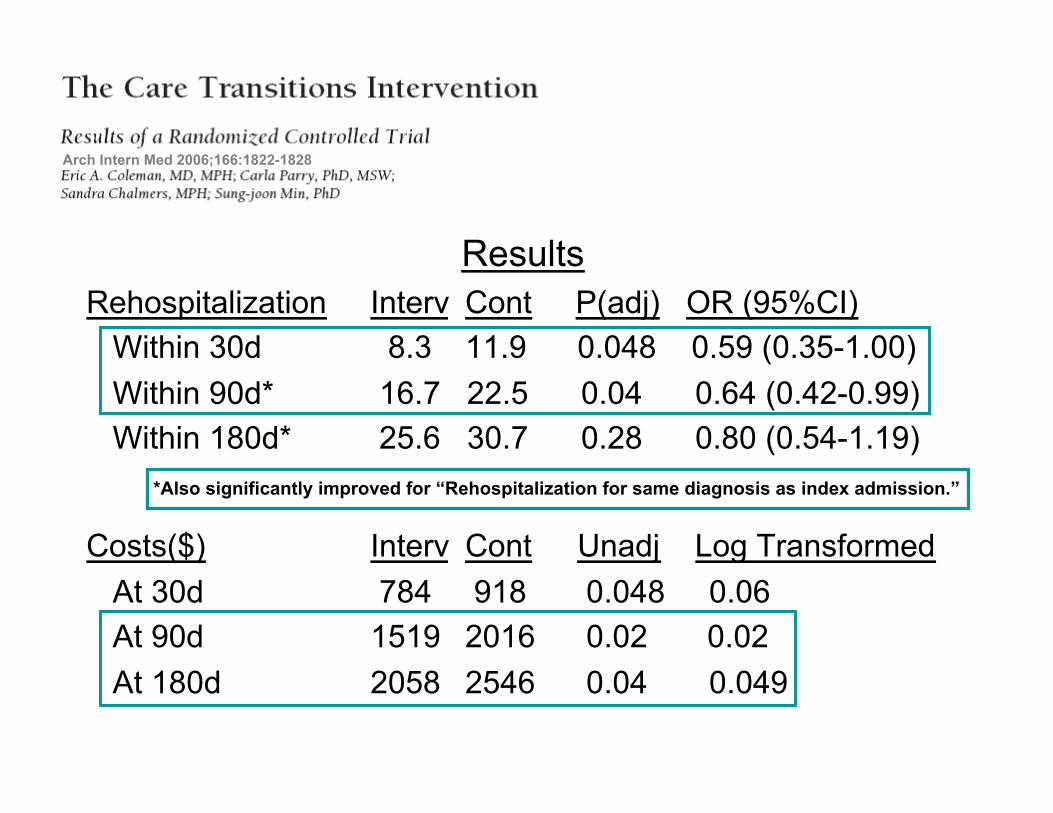
Results Rehospitalization Interv Cont P(adj) OR (95%CI) Within 30d 8.3 11.9 0.048 0.59 (0.35-1.00) Within 90d* 16.7 22.5 0.04 0.64 (0.42-0.99) Within 180d* 25.6 30.7 0.28 0.80 (0.54-1.19)
*Also significantly improved for “Rehospitalization for same diagnosis as index admission.”
Costs($) Interv Cont Unadj Log Transformed At 30d 784 918 0.048 0.06 At 90d 1519 2016 0.02 0.02 At 180d 2058 2546 0.04 0.049
Arch Intern Med 2006;166:1822-1828
Arch Intern Med 2006;166:1822-1828
29 Home Health Care Services Quarterly 2006;25(3/4):1-26
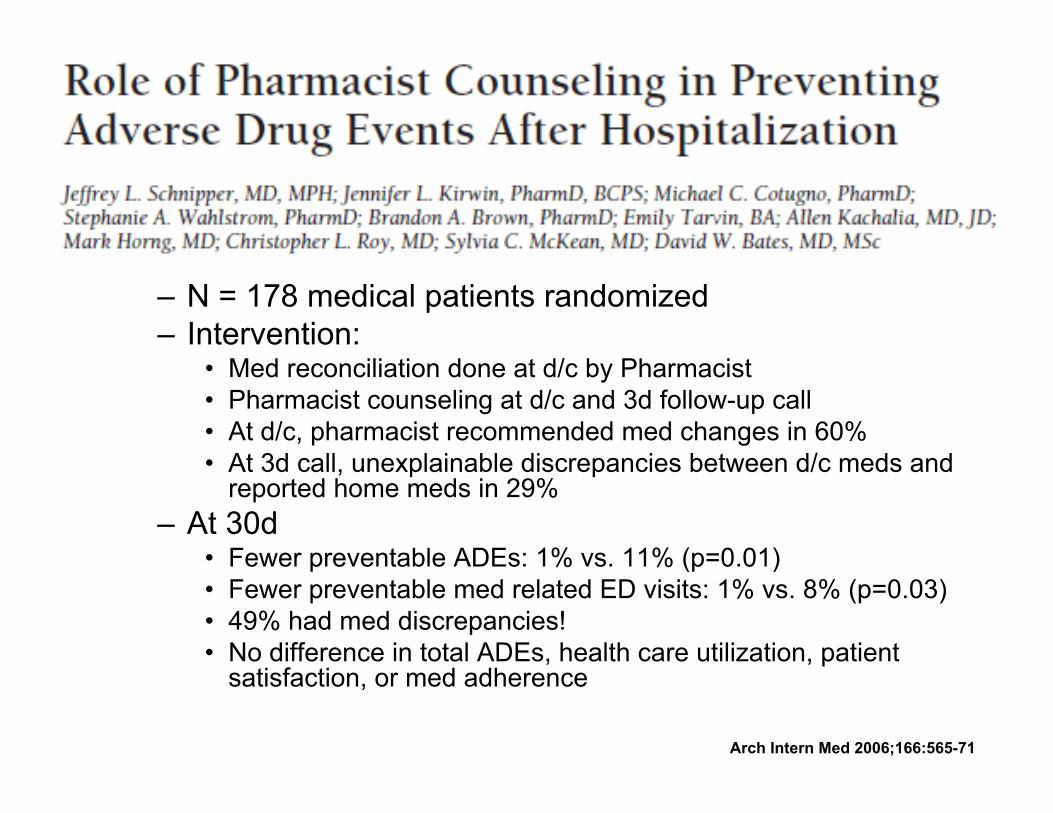
– N = 178 medical patients randomized – Intervention:
• Med reconciliation done at d/c by Pharmacist • Pharmacist counseling at d/c and 3d follow-up call • At d/c, pharmacist recommended med changes in 60% • At 3d call, unexplainable discrepancies between d/c meds and
reported home meds in 29% – At 30d
• Fewer preventable ADEs: 1% vs. 11% (p=0.01) • Fewer preventable med related ED visits: 1% vs. 8% (p=0.03) • 49% had med discrepancies! • No difference in total ADEs, health care utilization, patient
satisfaction, or med adherence
Arch Intern Med 2006;166:565-71
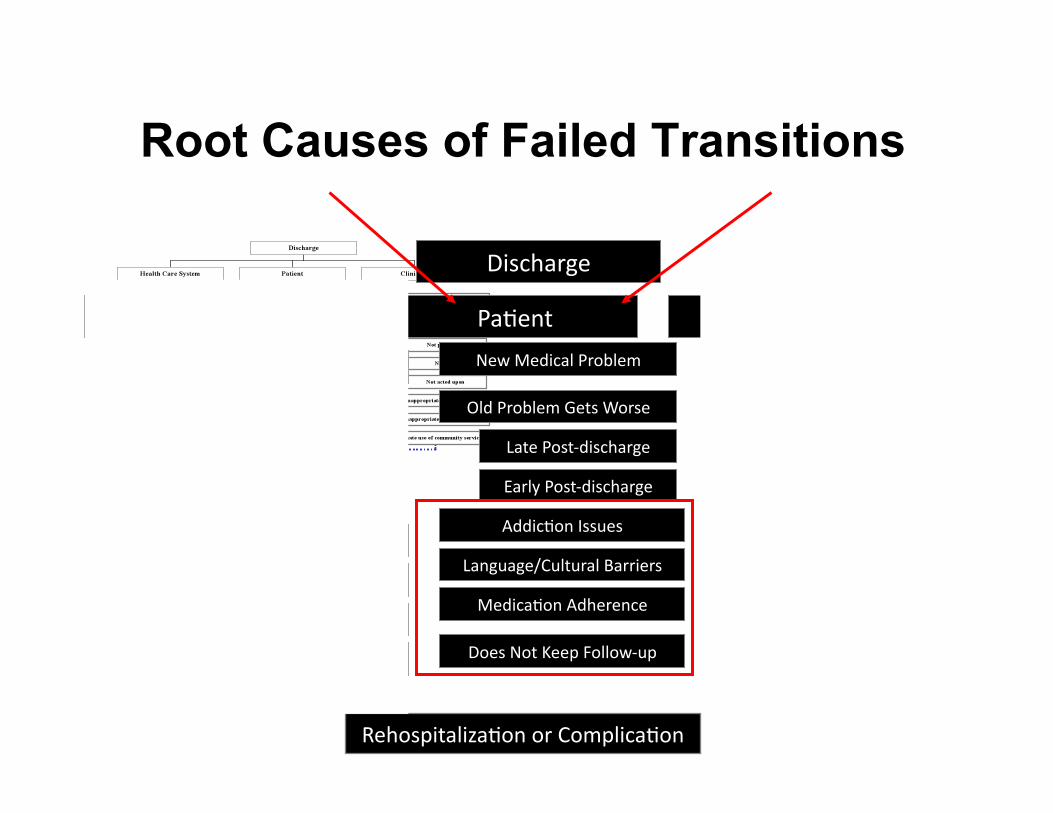
Rehospitaliza,onorComplica,on
Discharge
HospitalCareSystem Pa,ent Clinician
LapseofCommunica,on NewMedicalProblem Lab/TestError
OldProblemGetsWorse
LatePost‐discharge
EarlyPost‐discharge
D/CSummaryPCP
Inpa,entTeamPCP
HomeServicesPCP
InadequatePtEduca,on
Medica,onErrors
LackofTimelyFollow‐up
LapseinHomeServices
Addic,onIssues
Language/CulturalBarriers
Medica,onAdherence
DoesNotKeepFollow‐up
NotOrdered
NotPerformed
NotSeen
NotActedUpon
InappropriateDischarge
InappropriateMedica,ons
InadequateHomeServices
Root Causes of Failed Transitions
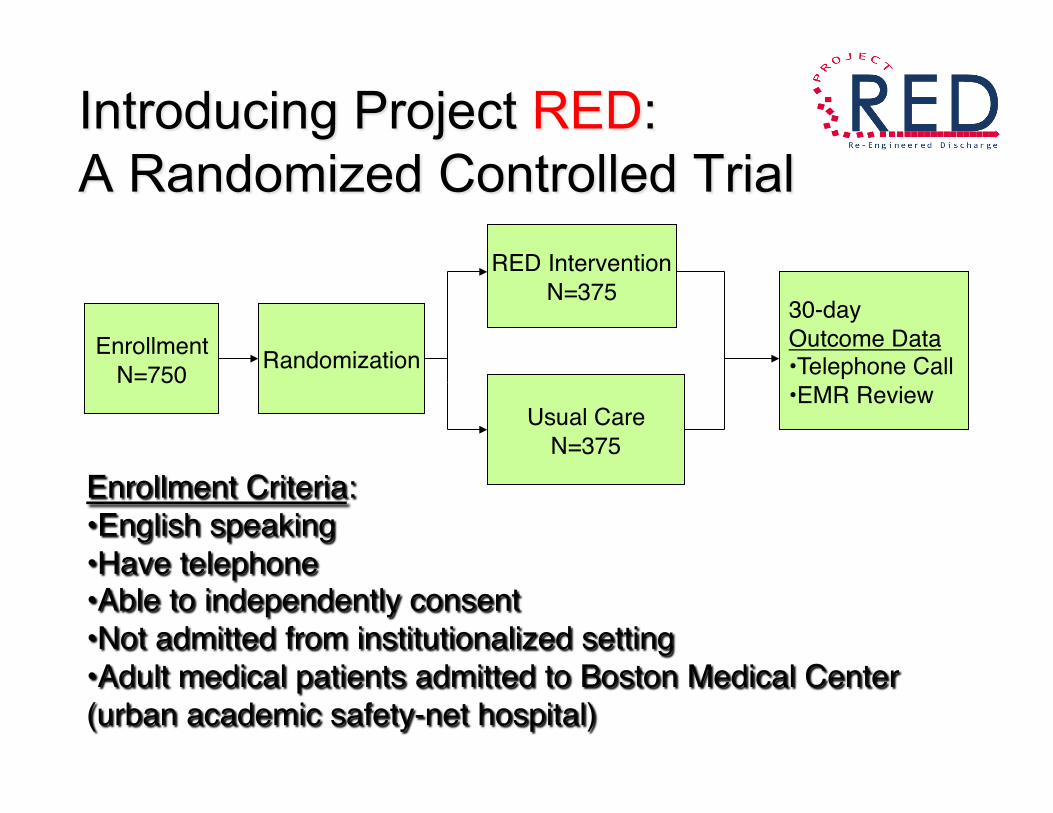
Enrollment N=750 Randomization
RED Intervention N=375
Usual Care N=375
30-day Outcome Data • Telephone Call • EMR Review
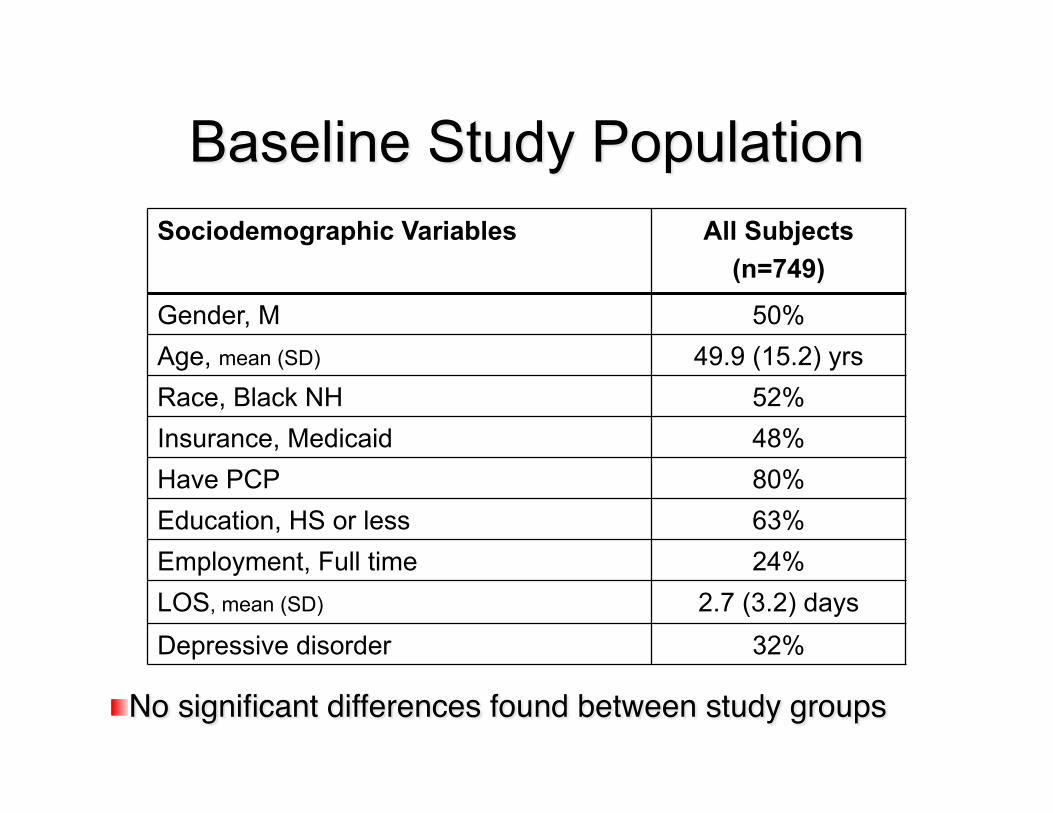
Sociodemographic Variables All Subjects (n=749)
Gender, M 50% Age, mean (SD) 49.9 (15.2) yrs Race, Black NH 52% Insurance, Medicaid 48% Have PCP 80% Education, HS or less 63% Employment, Full time 24% LOS, mean (SD) 2.7 (3.2) days Depressive disorder 32%
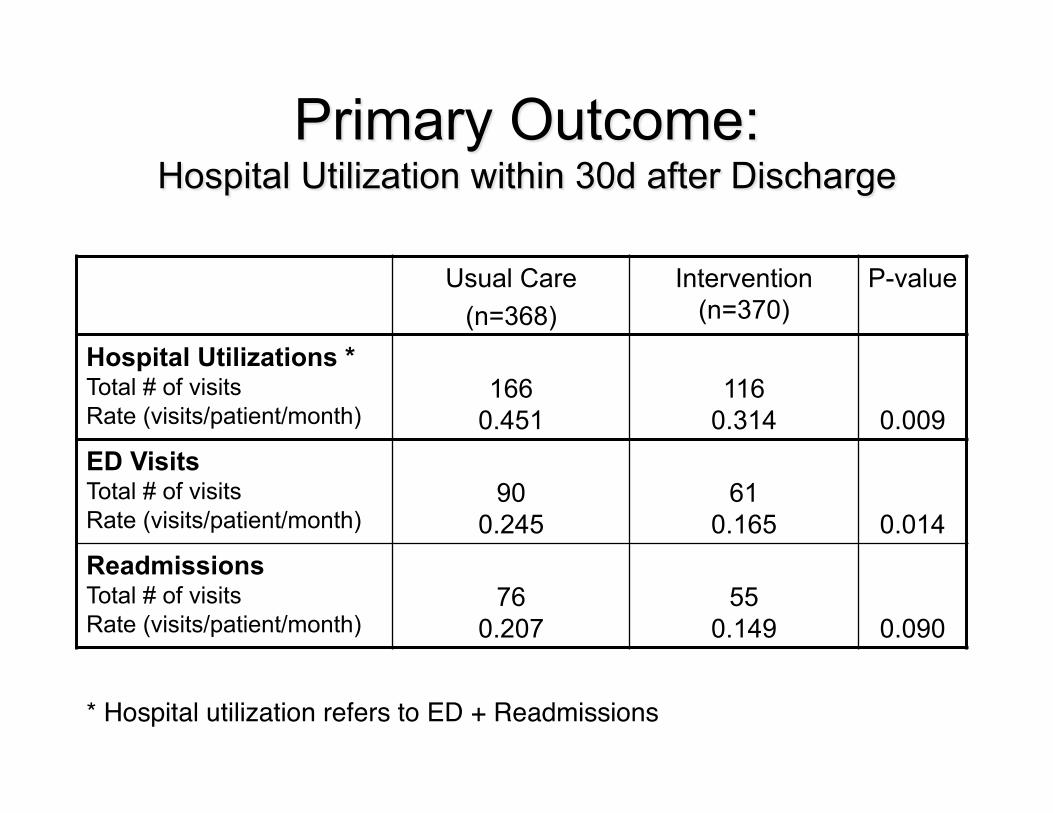
Usual Care (n=368)
Intervention (n=370)
P-value
Hospital Utilizations * Total # of visits Rate (visits/patient/month)
166 0.451
116 0.314 0.009
ED Visits Total # of visits Rate (visits/patient/month)
90 0.245
61 0.165 0.014
Readmissions Total # of visits Rate (visits/patient/month)
76 0.207
55 0.149 0.090
* Hospital utilization refers to ED + Readmissions
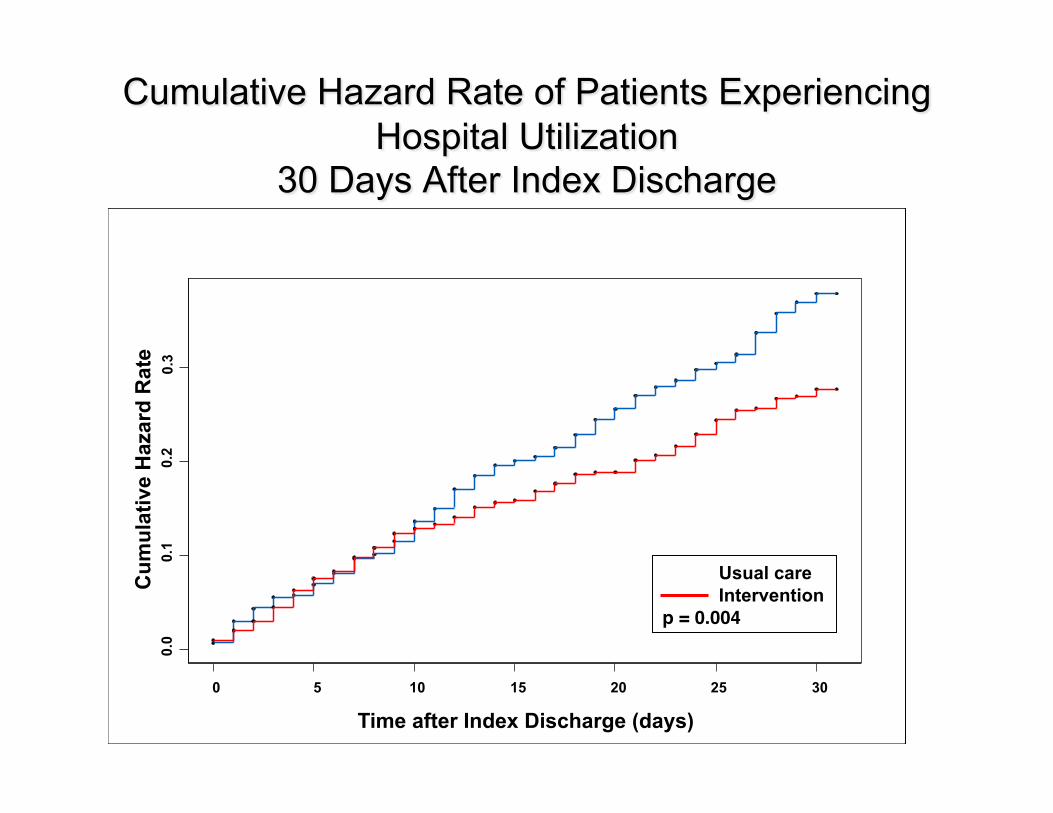
Usual care Intervention p = 0.004
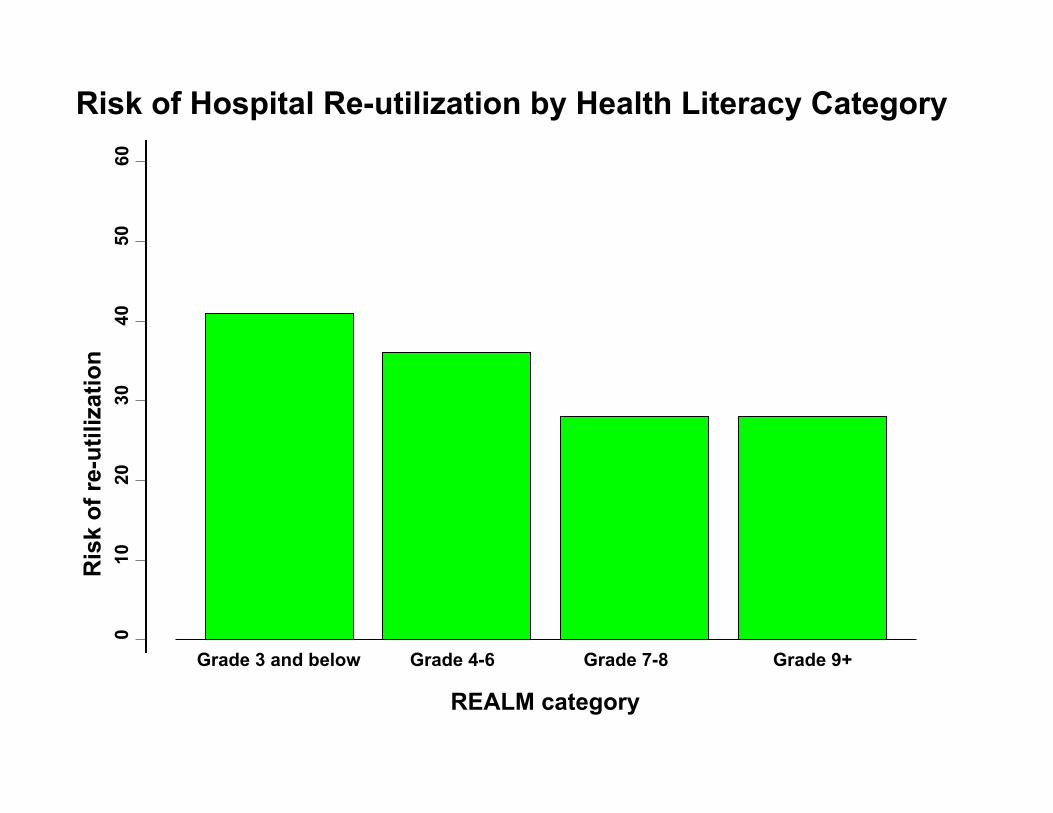
P for trend=0.009
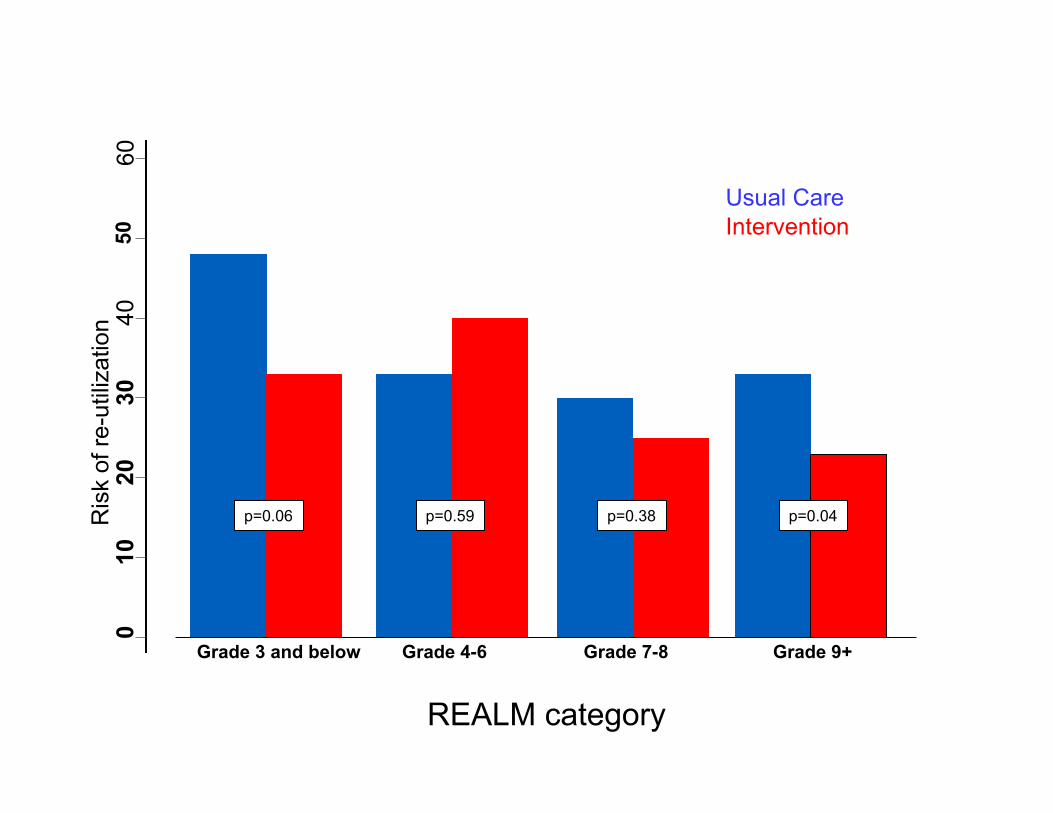
Grade 3 and below Grade 4-6 Grade 7-8 Grade 9+ Grade 3 and below Grade 4-6 Grade 7-8 Grade 9+
Grade 3 and below Grade 4-6 Grade 7-8 Grade 9+
Usual Care Intervention
p=0.06 p=0.59 p=0.38 p=0.04
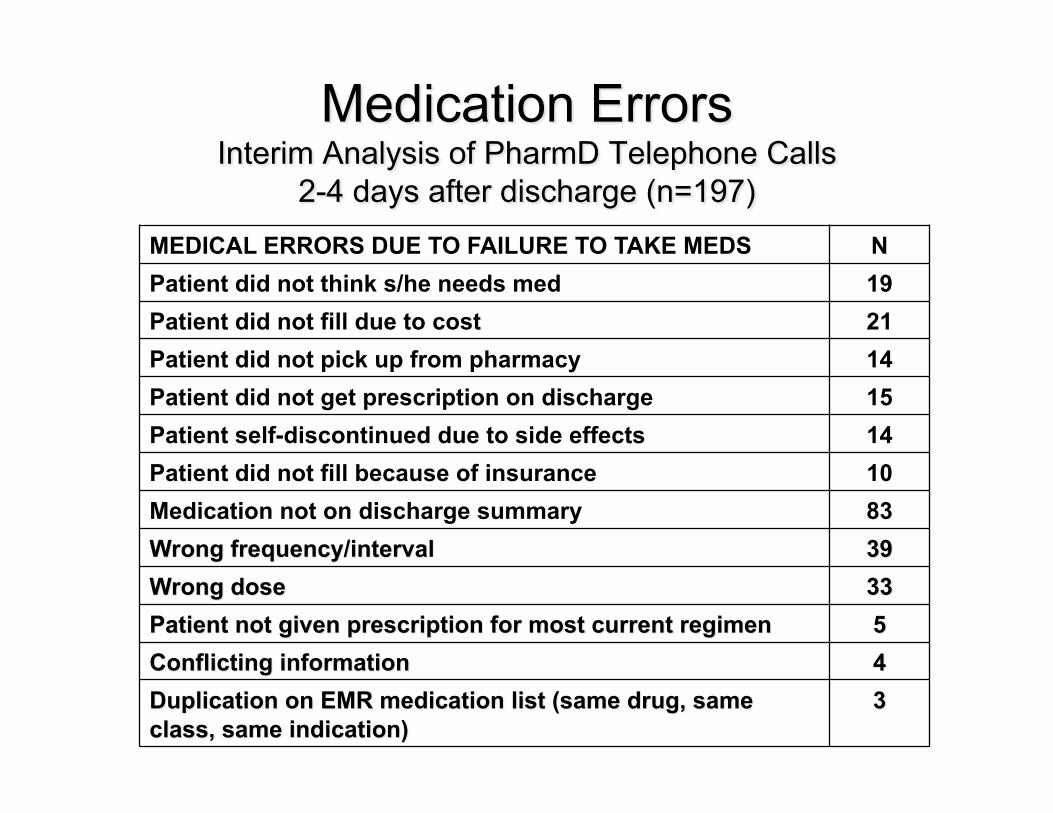
MEDICAL ERRORS DUE TO FAILURE TO TAKE MEDS N Patient did not think s/he needs med 19 Patient did not fill due to cost 21 Patient did not pick up from pharmacy 14 Patient did not get prescription on discharge 15 Patient self-discontinued due to side effects 14 Patient did not fill because of insurance 10 Medication not on discharge summary 83
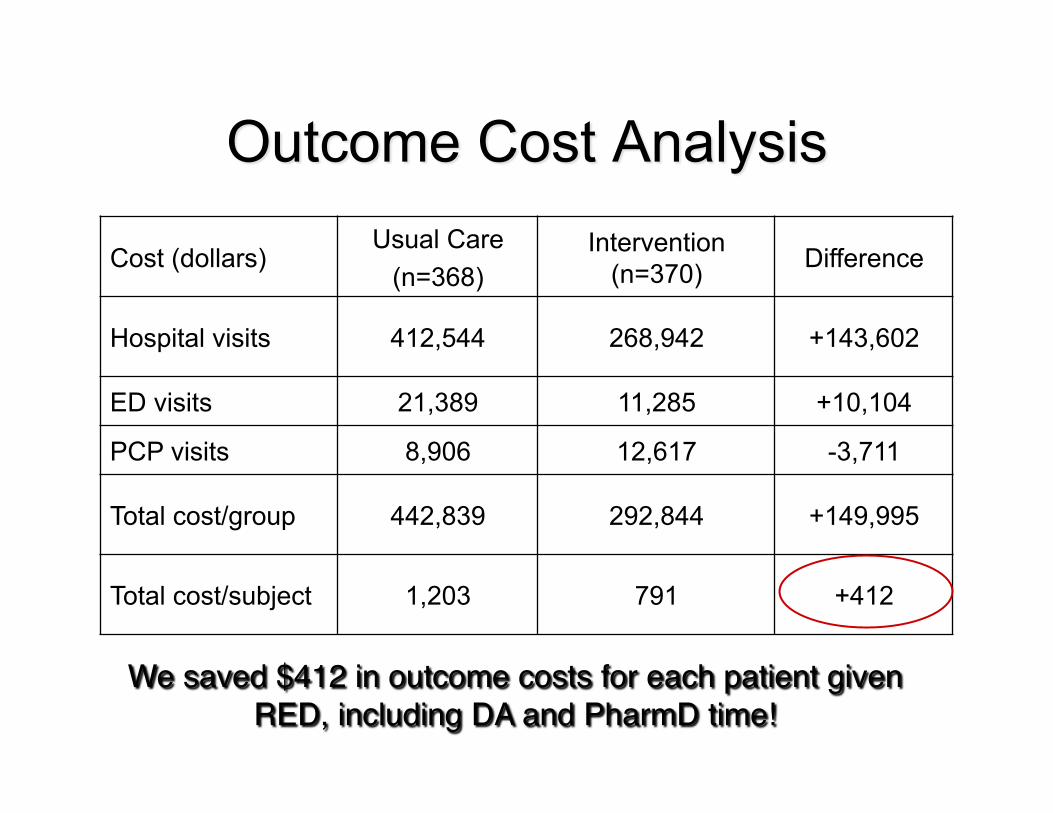
Cost (dollars) Usual Care
(n=368) Intervention
(n=370) Difference
Hospital visits 412,544 268,942 +143,602
ED visits 21,389 11,285 +10,104
PCP visits 8,906 12,617 -3,711
Total cost/group 442,839 292,844 +149,995
Total cost/subject 1,203 791 +412

Introducing Project BOOST
• Funded by the John A Hartford Foundation • Grant to the Society of Hospital Medicine • Principle Investigator = Mark Williams, MD • Implementation project
Project BOOST
• Developed a project team and national advisory board
• Developed a toolkit and implementation guide with web resources
• Rolled out via mentored implementation initially to 6 pilot sites across USA
• Now completing phase 2: full roll out to 24 more sites
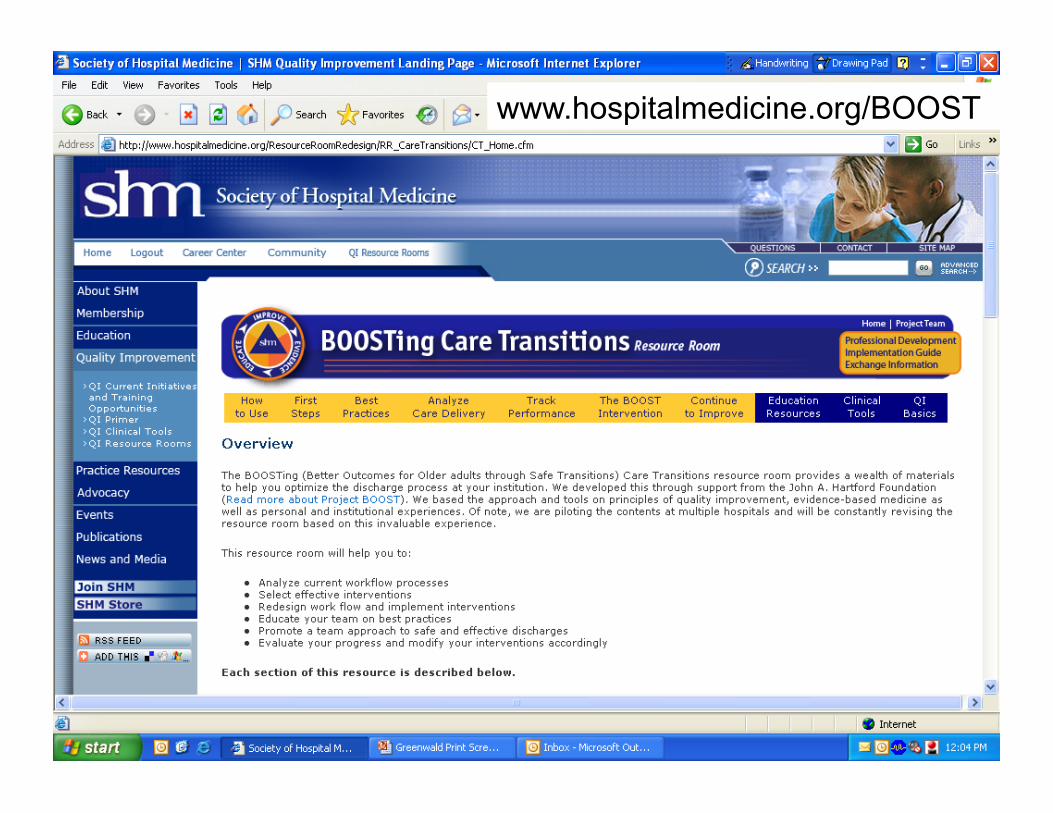
www.hospitalmedicine.org/BOOST

Introducing…
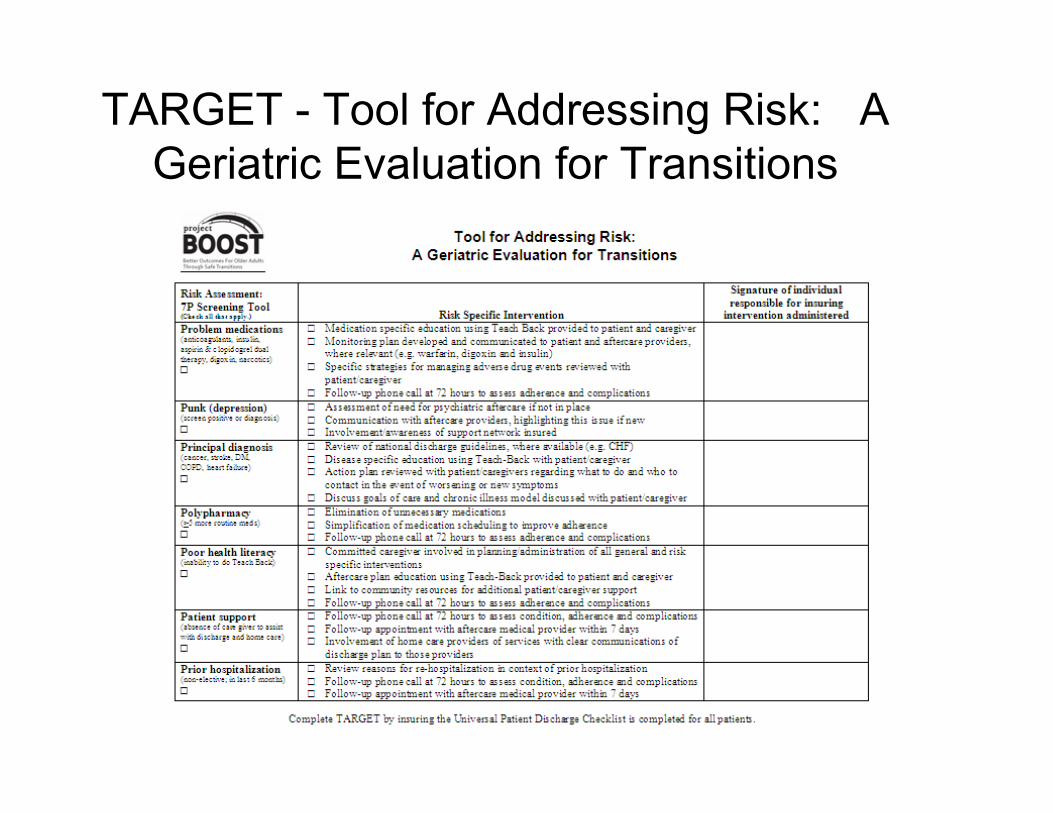
TARGET - Tool for Addressing Risk: A Geriatric Evaluation for Transitions

Principal BOOST Intervention Tools
• TARGET: Tool for Adjusting Risk: A Geriatric Evaluation for Transitions – 7P Risk Scale – The Universal Patient Discharge Checklist – The General Assessment of Preparedness
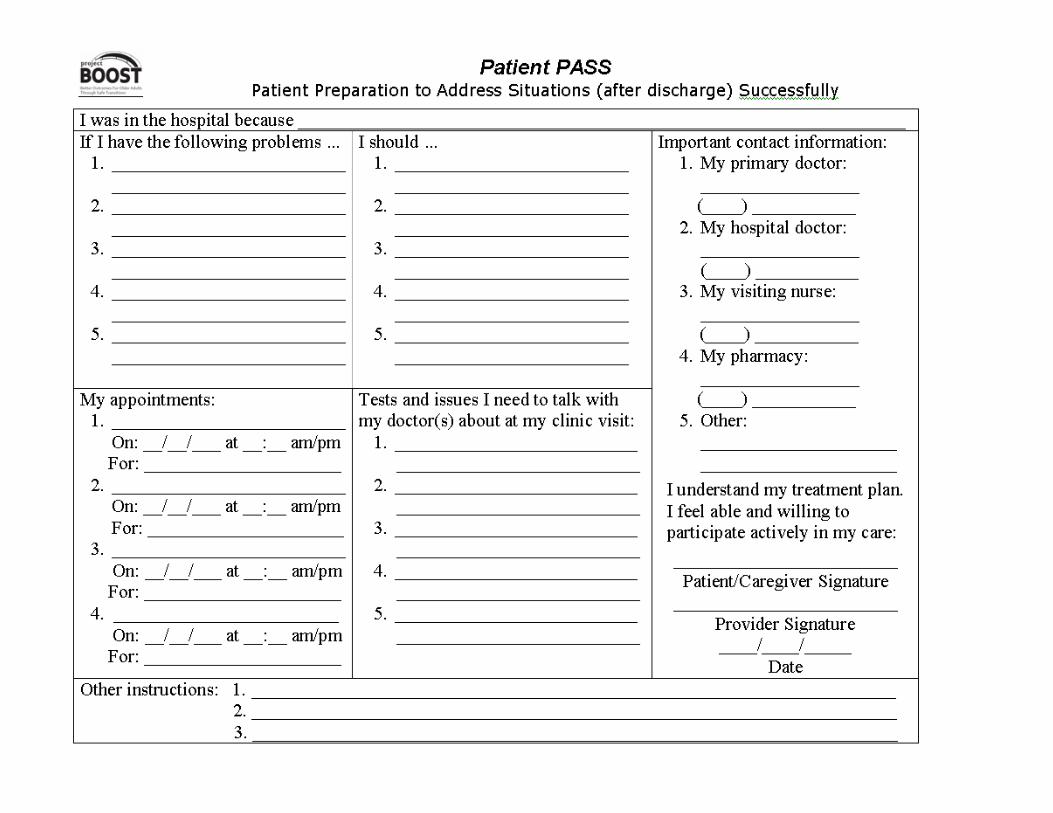
• The Patient PASS • Teach Back training
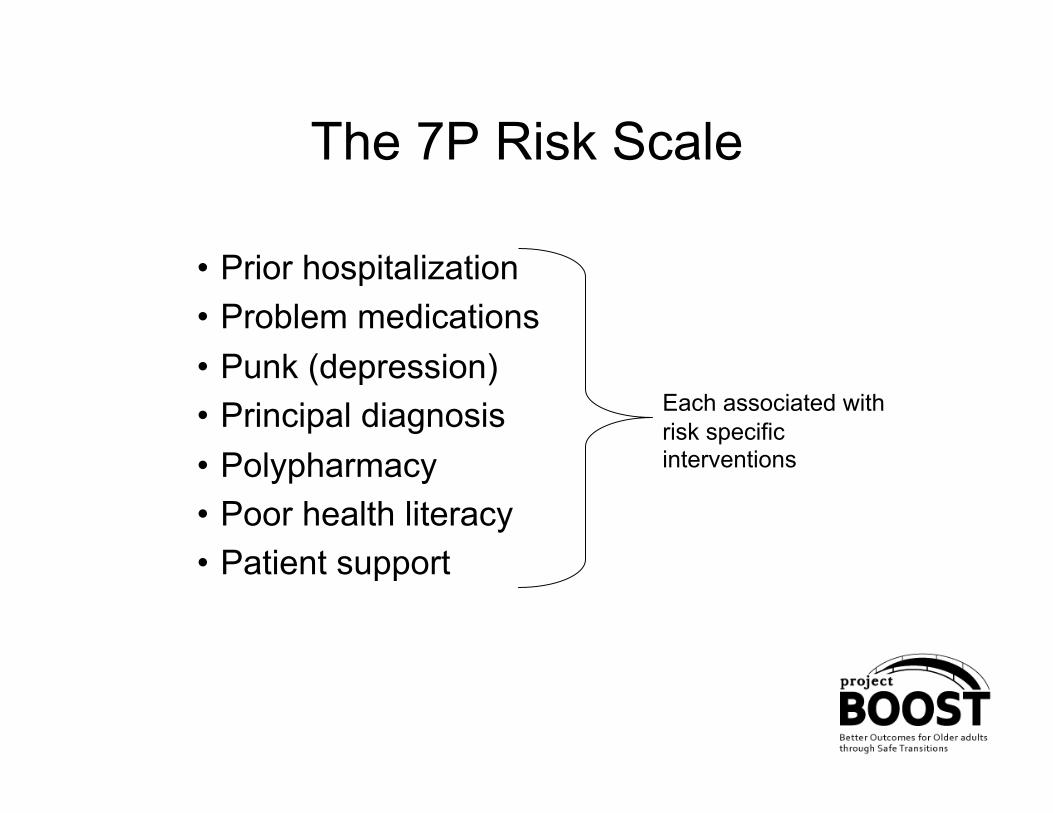
The 7P Risk Scale
• Prior hospitalization • Problem medications • Punk (depression) • Principal diagnosis • Polypharmacy • Poor health literacy • Patient support
Each associated with risk specific interventions
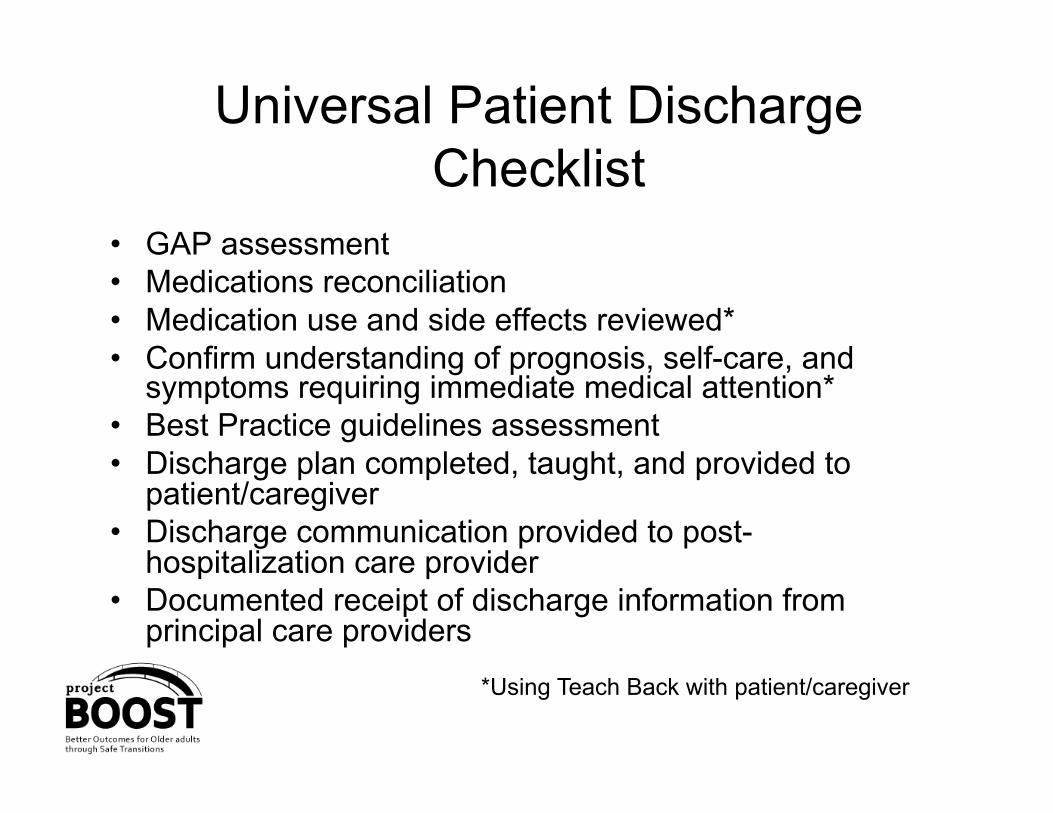
Universal Patient Discharge Checklist
• GAP assessment • Medications reconciliation • Medication use and side effects reviewed* • Confirm understanding of prognosis, self-care, and
symptoms requiring immediate medical attention* • Best Practice guidelines assessment • Discharge plan completed, taught, and provided to
patient/caregiver • Discharge communication provided to post-
hospitalization care provider • Documented receipt of discharge information from
principal care providers
*Using Teach Back with patient/caregiver
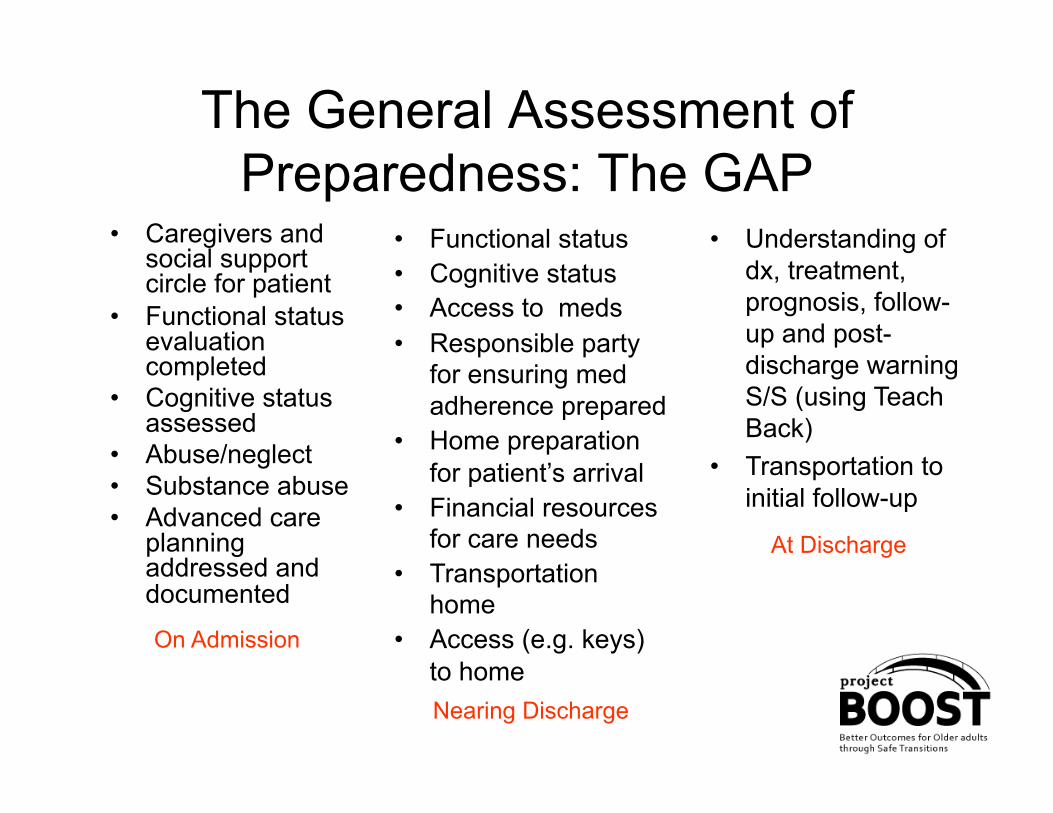
The General Assessment of Preparedness: The GAP
• Caregivers and social support circle for patient
• Functional status evaluation completed
• Cognitive status assessed
• Abuse/neglect • Substance abuse • Advanced care
planning addressed and documented
• Functional status • Cognitive status • Access to meds • Responsible party
for ensuring med adherence prepared
• Home preparation for patient’s arrival
• Financial resources for care needs
• Transportation home
• Access (e.g. keys) to home
• Understanding of dx, treatment, prognosis, follow-up and post-discharge warning S/S (using Teach Back)
• Transportation to initial follow-up
On Admission
Nearing Discharge
At Discharge


Understanding Misunderstanding
vs.
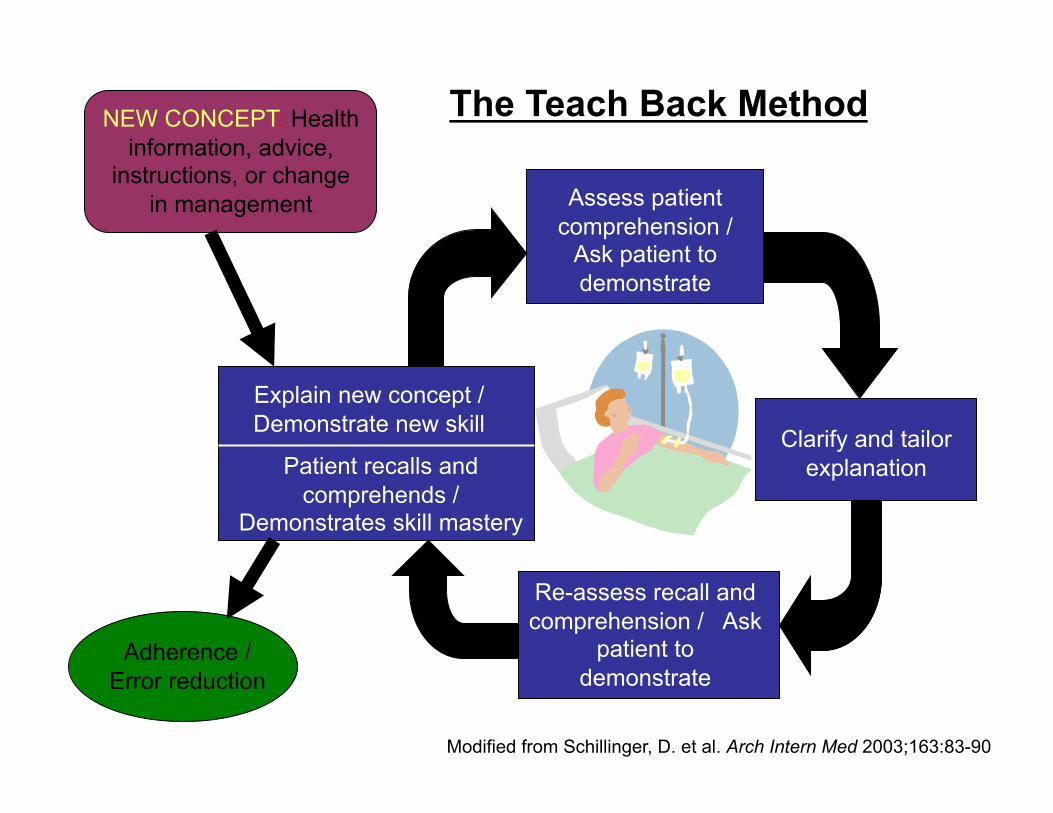
NEW CONCEPT: Health information, advice,
instructions, or change in management
Adherence / Error reduction
Explain new concept / Demonstrate new skill
Patient recalls and comprehends /
Demonstrates skill mastery
Assess patient comprehension /
Ask patient to demonstrate
Clarify and tailor explanation
Re-assess recall and comprehension / Ask
patient to demonstrate
The Teach Back Method
Modified from Schillinger, D. et al. Arch Intern Med 2003;163:83-90
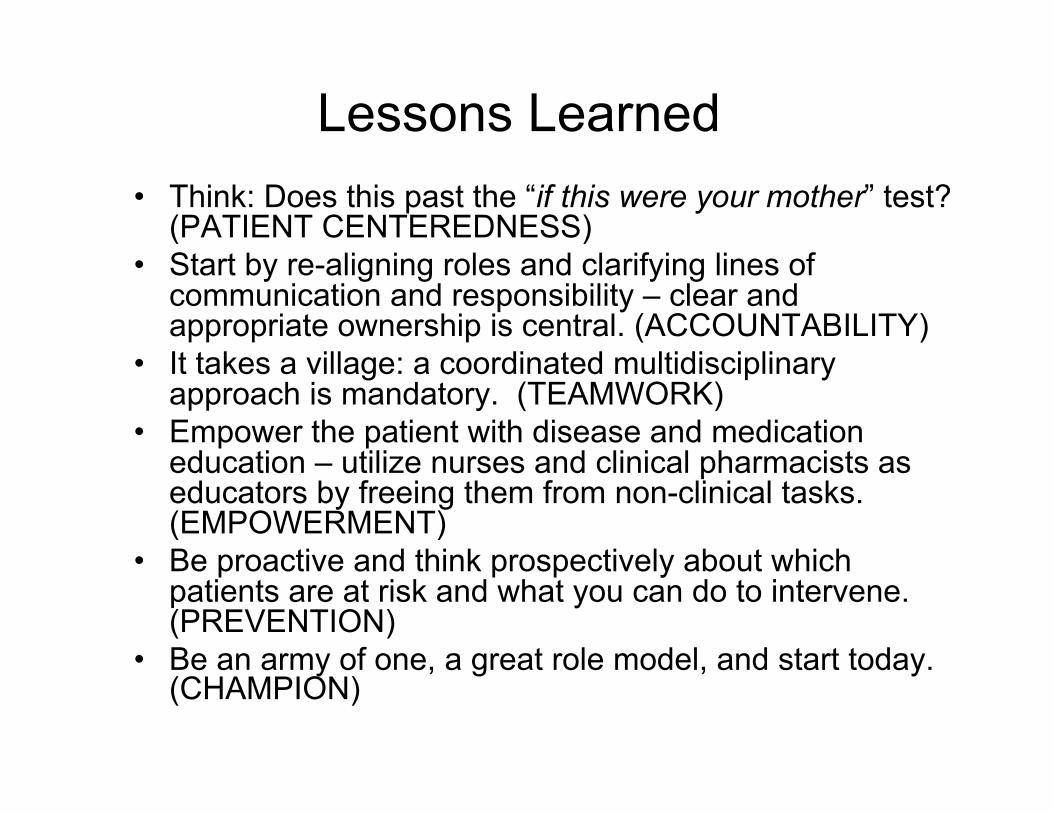
Lessons Learned • Think: Does this past the “if this were your mother” test?
(PATIENT CENTEREDNESS) • Start by re-aligning roles and clarifying lines of
communication and responsibility – clear and appropriate ownership is central. (ACCOUNTABILITY)
• It takes a village: a coordinated multidisciplinary approach is mandatory. (TEAMWORK)
• Empower the patient with disease and medication education – utilize nurses and clinical pharmacists as educators by freeing them from non-clinical tasks. (EMPOWERMENT)
• Be proactive and think prospectively about which patients are at risk and what you can do to intervene. (PREVENTION)
• Be an army of one, a great role model, and start today. (CHAMPION)
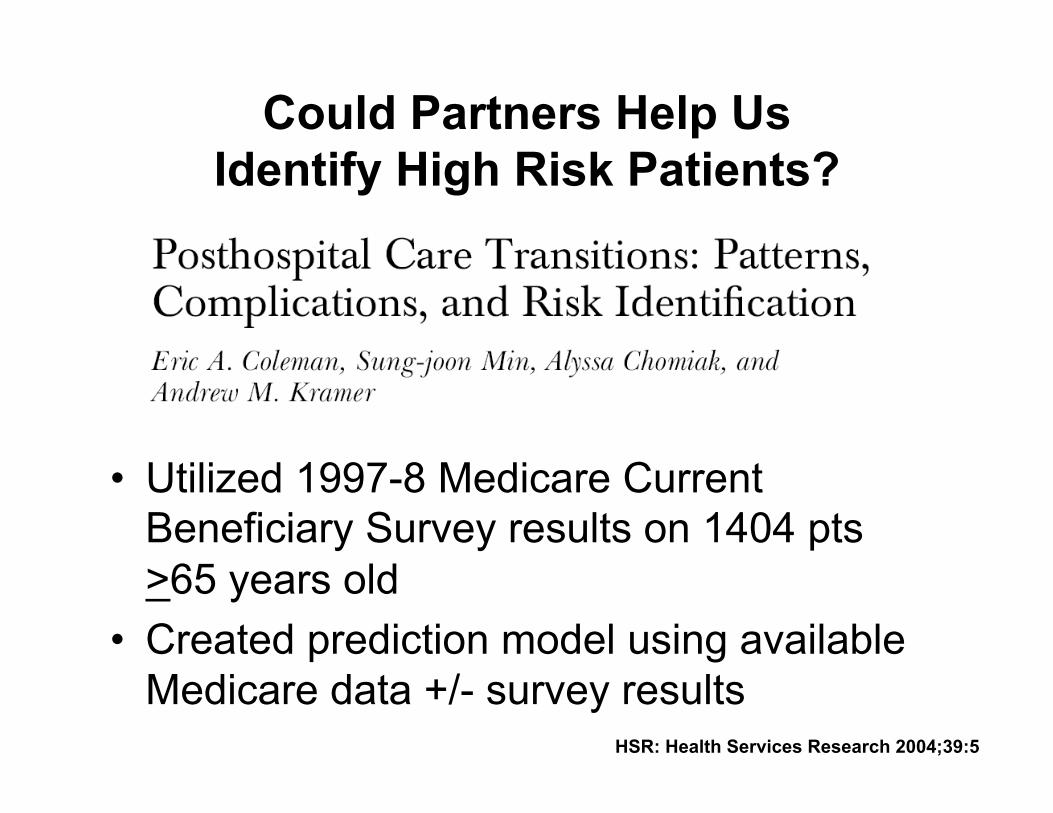
Could Partners Help Us Identify High Risk Patients?
• Utilized 1997-8 Medicare Current Beneficiary Survey results on 1404 pts >65 years old
• Created prediction model using available Medicare data +/- survey results
HSR: Health Services Research 2004;39:5
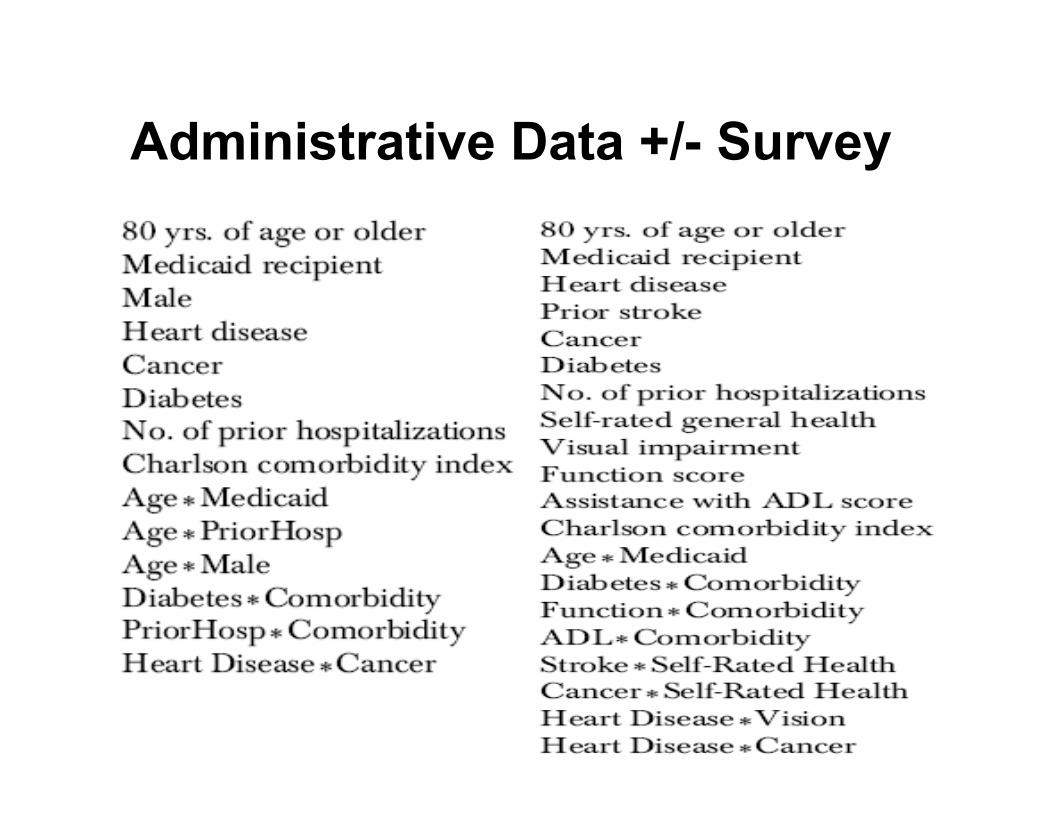
Administrative Data +/- Survey

HSR: Health Services Research 2004;39:5