Embed Size (px)
Citation preview
Red Lake River Farm to Stream Tile Drainage
Study- Red Lake Watershed District –
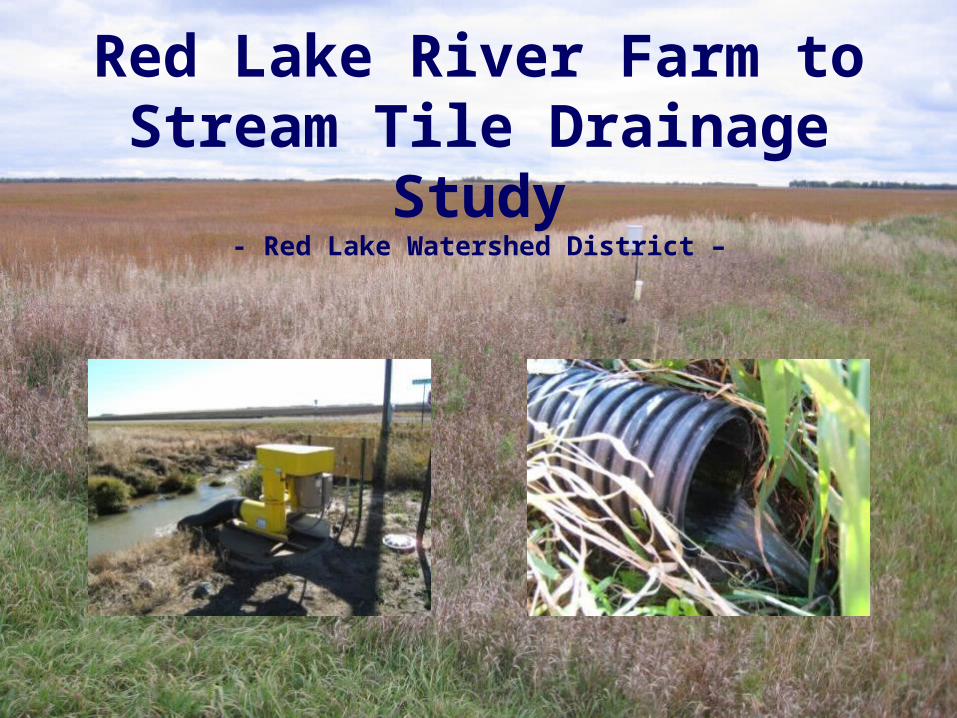
Project Background
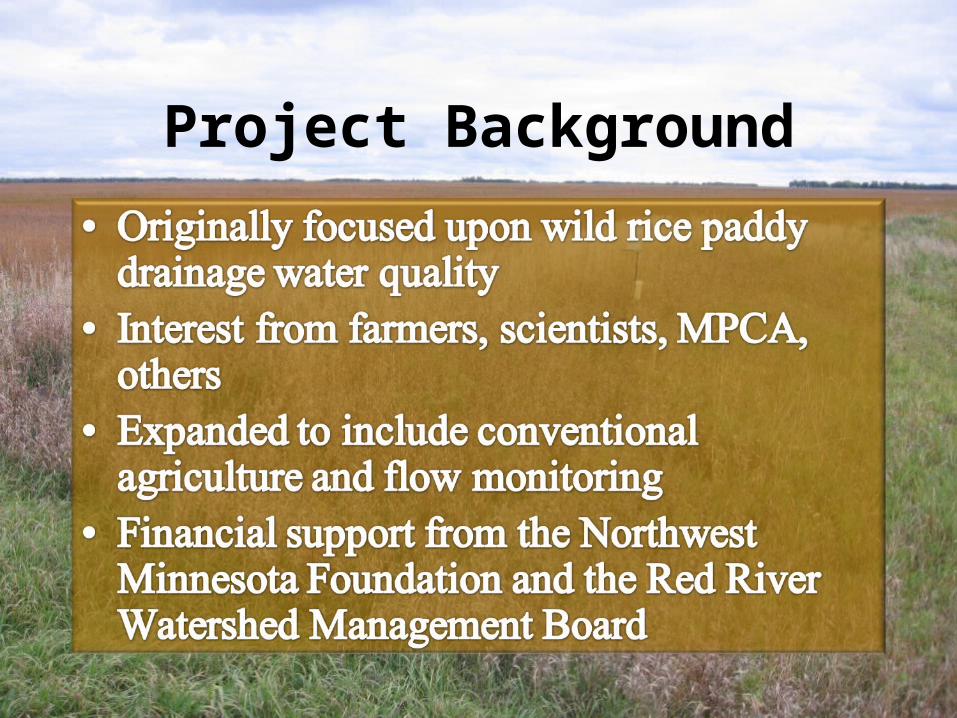
Theories
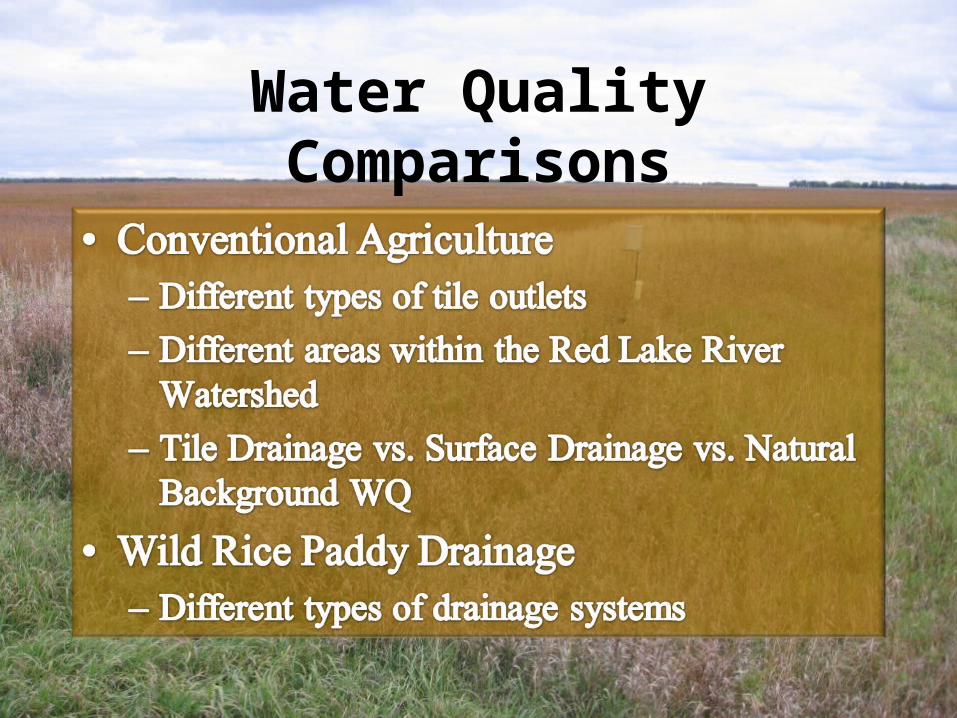
Water Quality Comparisons
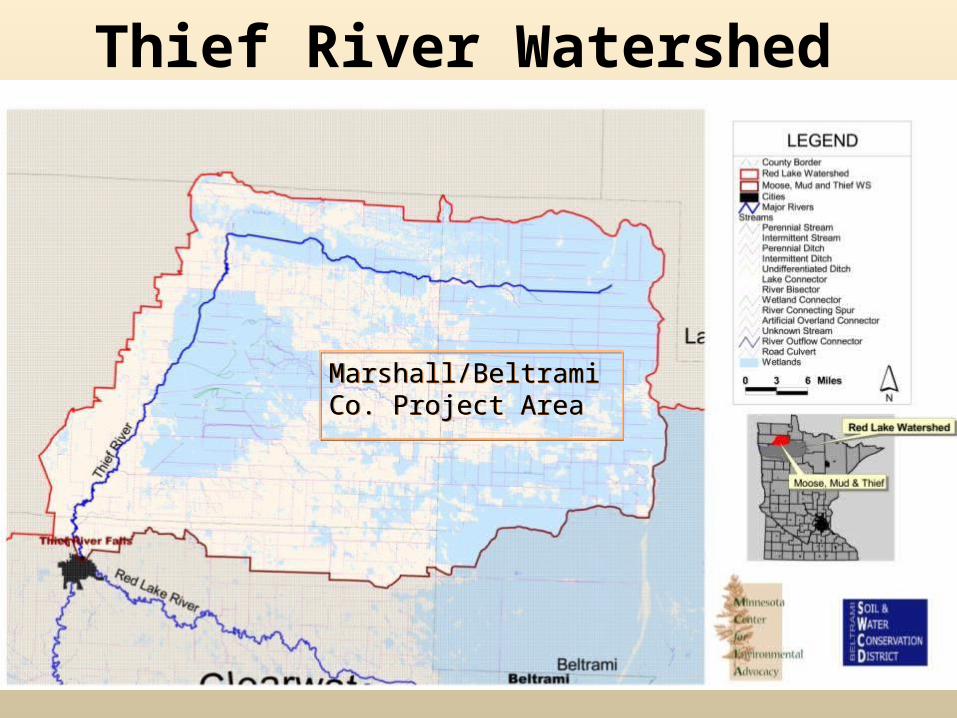
Thief River Watershed
Marshall/Beltrami Co. Project AreaMarshall/Beltrami Co. Project Area
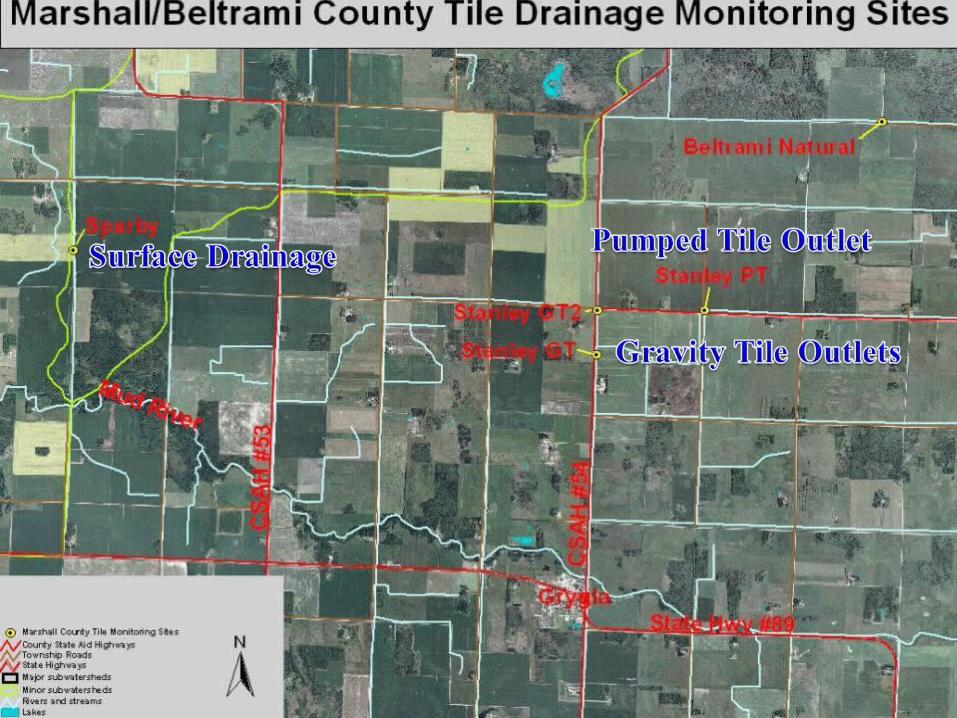
Marshall County Sites
Red Lake Co. Project AreaRed Lake Co. Project Area Wild Rice
Paddy Monitoring
Wild Rice Paddy Monitoring
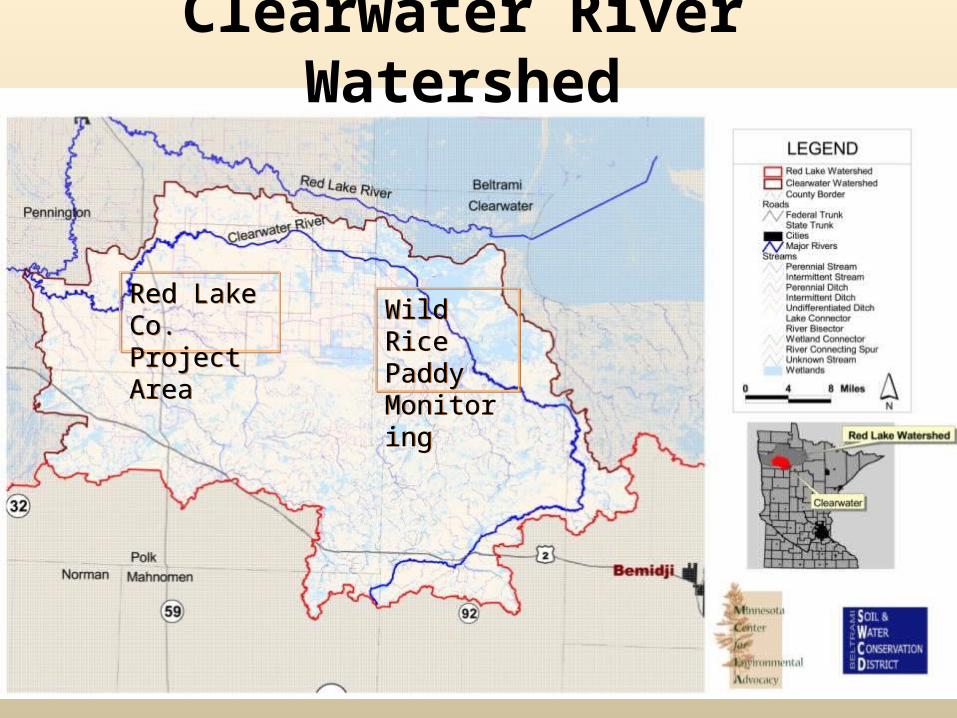
Clearwater River Watershed
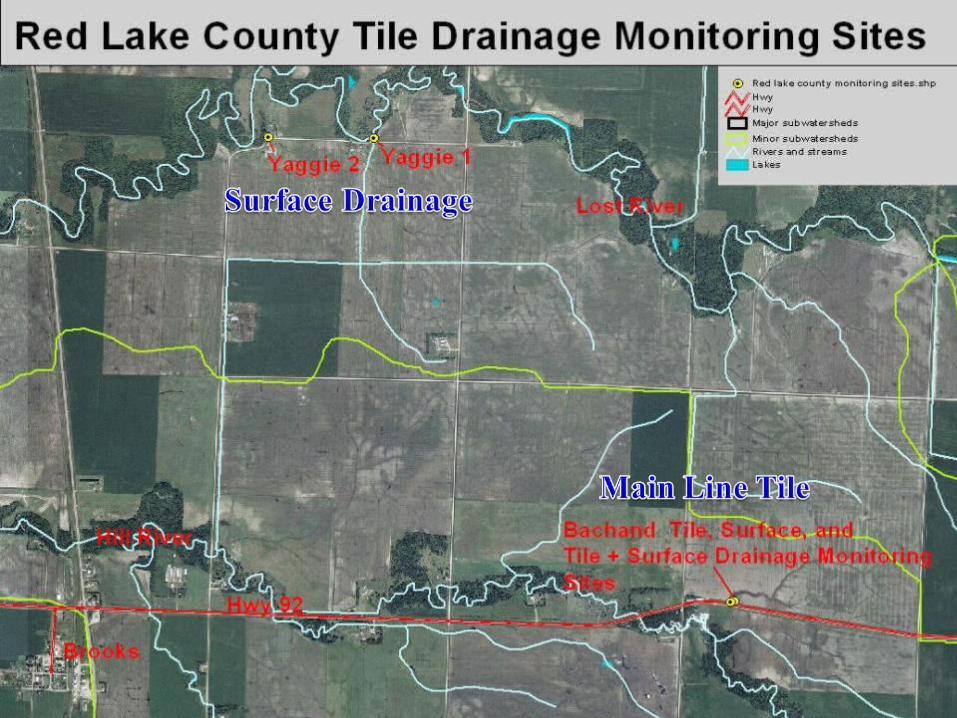
Red Lake County Sites
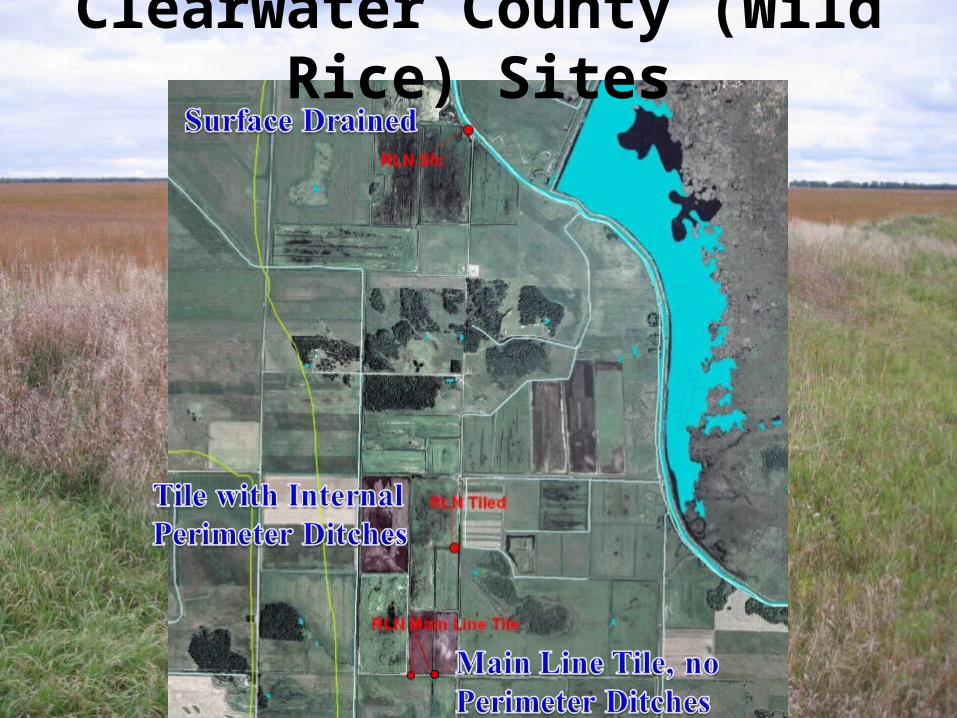
Clearwater County (Wild Rice) Sites
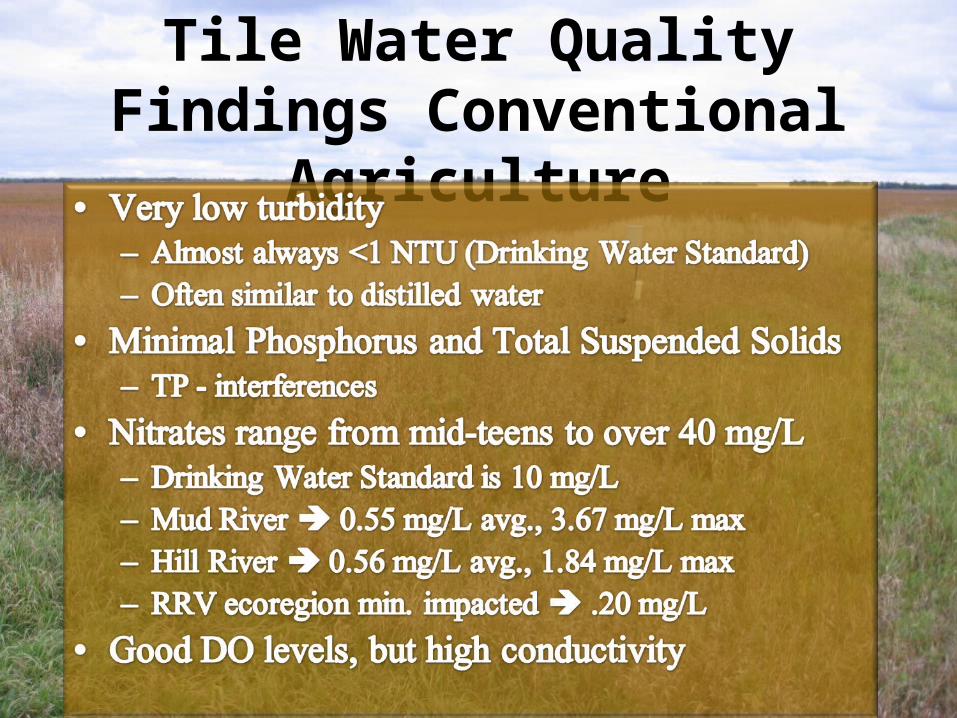
Tile Water Quality Findings Conventional Agriculture
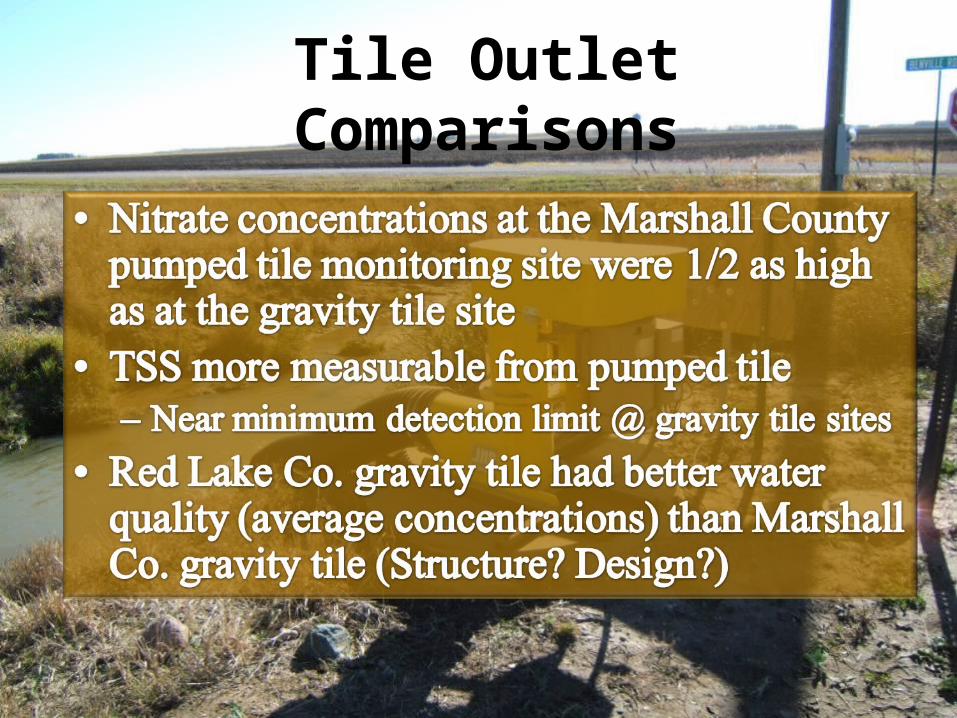
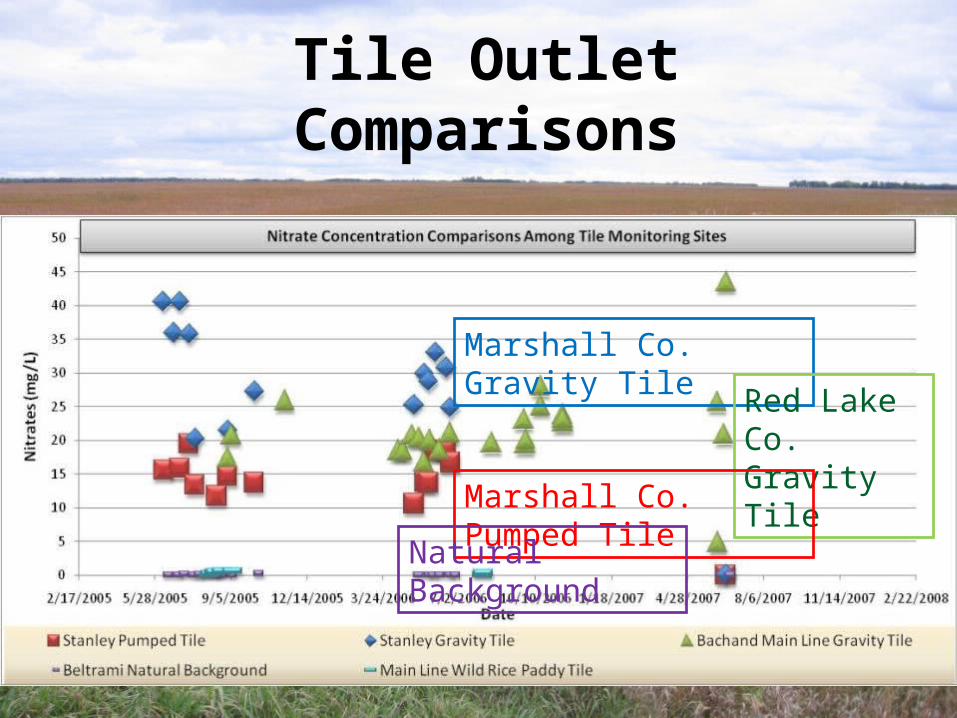
Tile Outlet Comparisons
Tile Outlet Comparisons
Marshall Co. Gravity Tile
Red Lake Co. Gravity Tile
Marshall Co. Pumped Tile
Natural Background
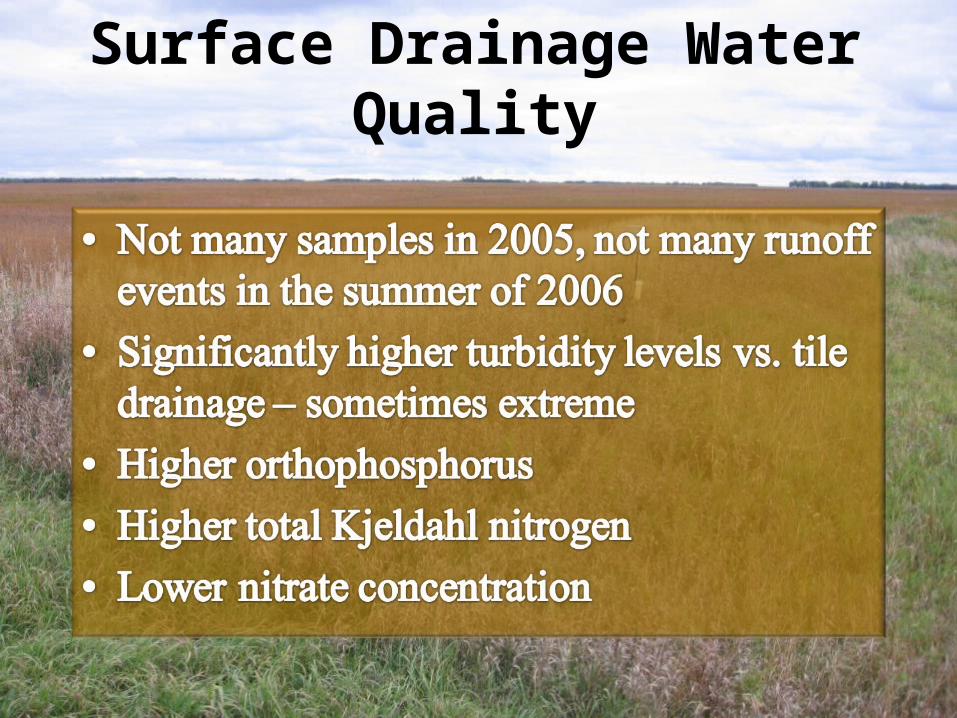
Surface Drainage Water Quality
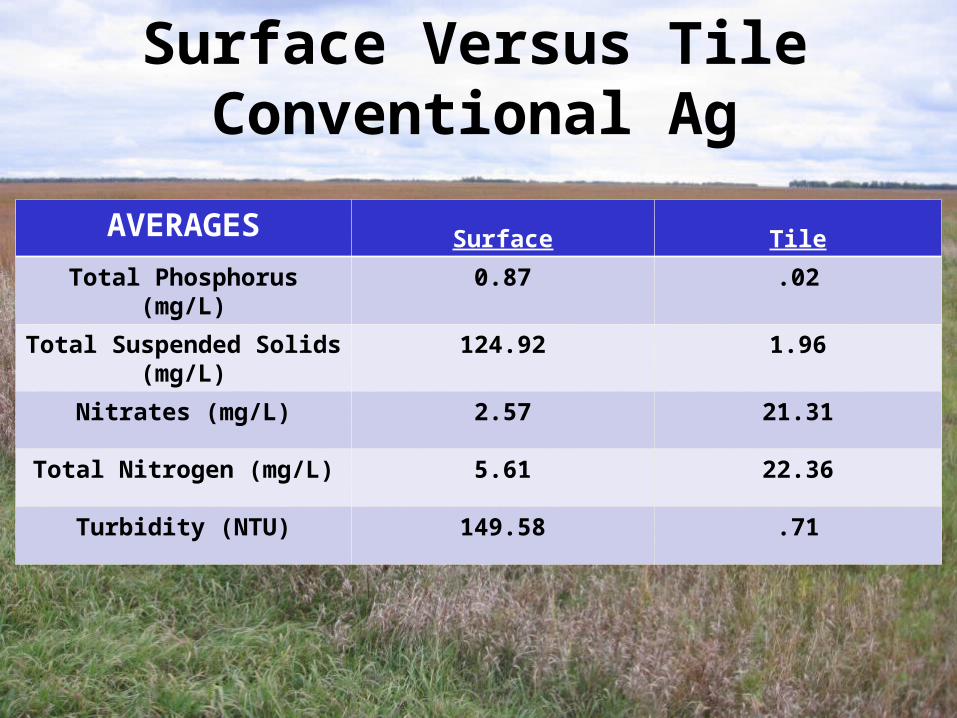
Surface Versus TileConventional Ag
AVERAGES Surface Tile
Total Phosphorus (mg/L) 0.87 .02
Total Suspended Solids (mg/L) 124.92 1.96
Nitrates (mg/L) 2.57 21.31
Total Nitrogen (mg/L) 5.61 22.36
Turbidity (NTU) 149.58 .71
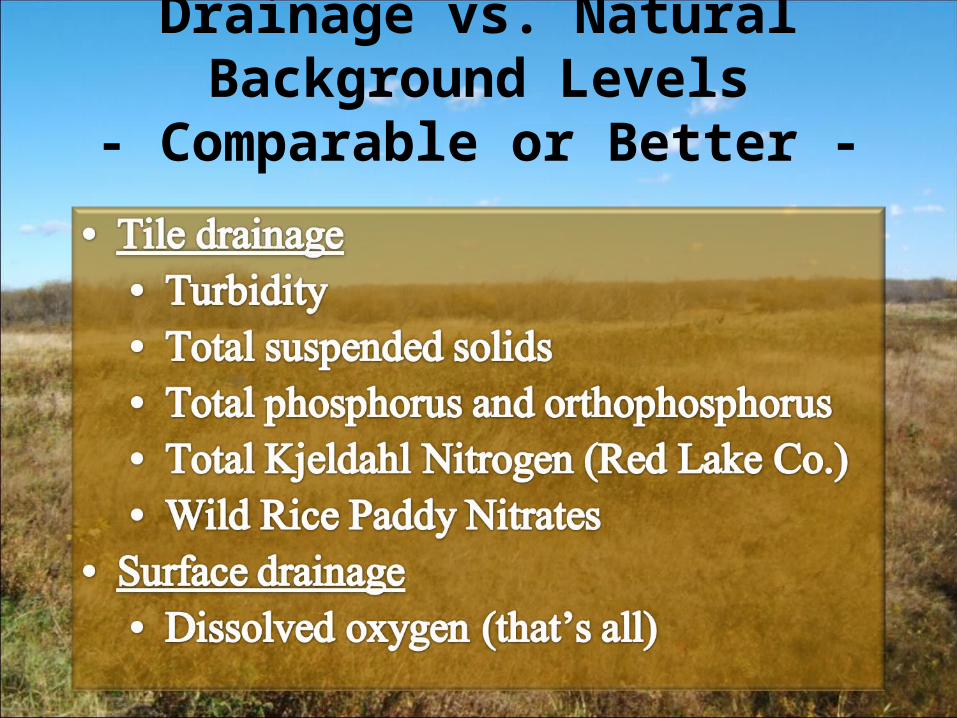
Drainage vs. Natural Background Levels- Comparable or Better -
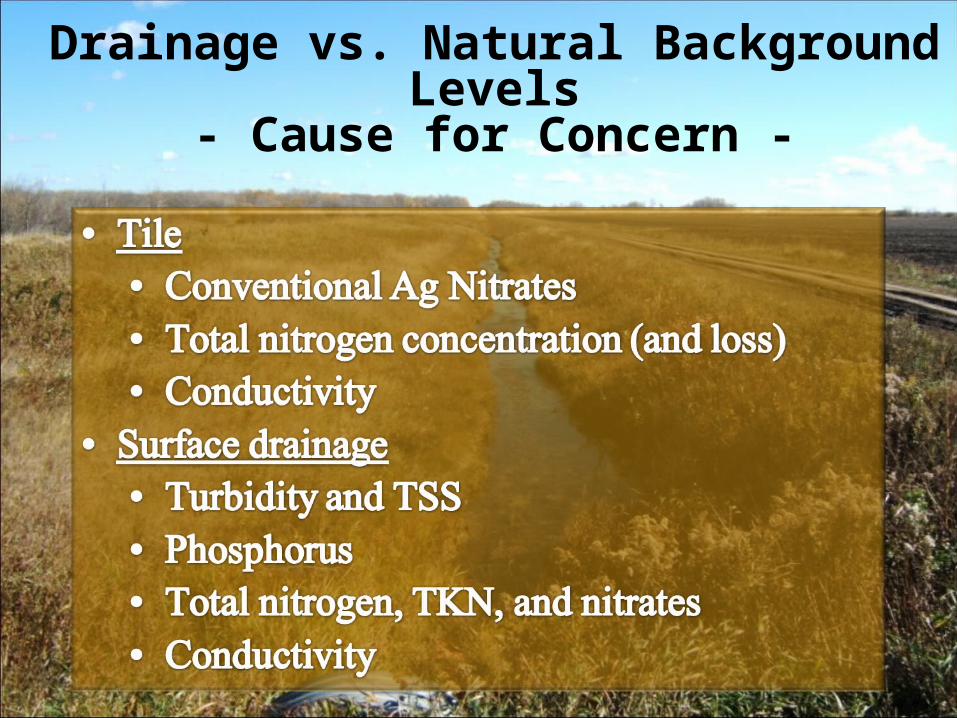
Drainage vs. Natural Background Levels- Cause for Concern -
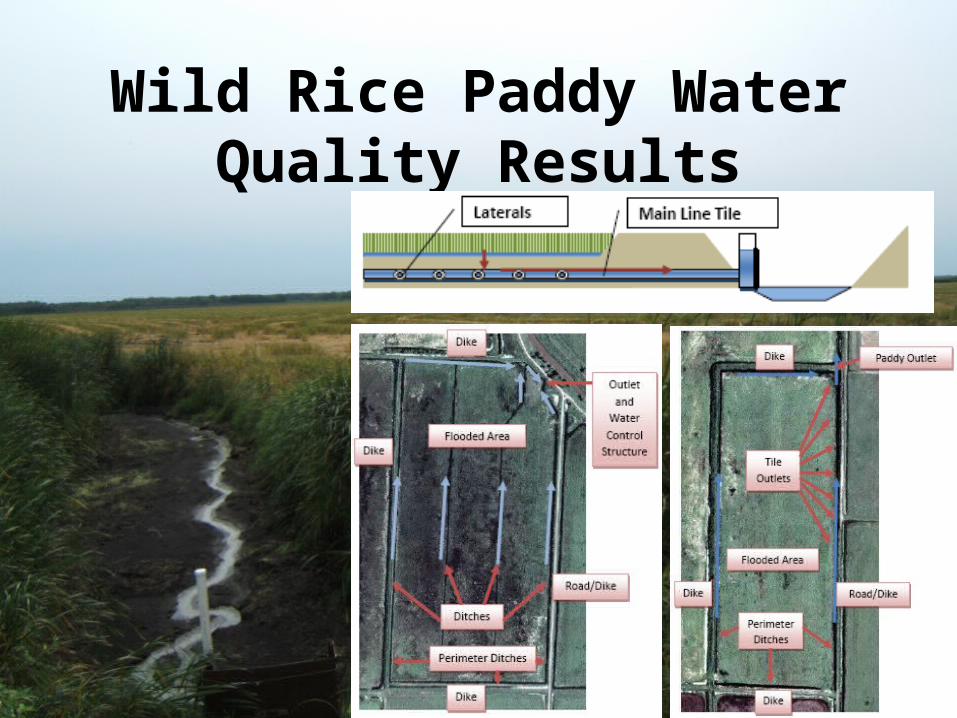
Wild Rice Paddy Water Quality Results
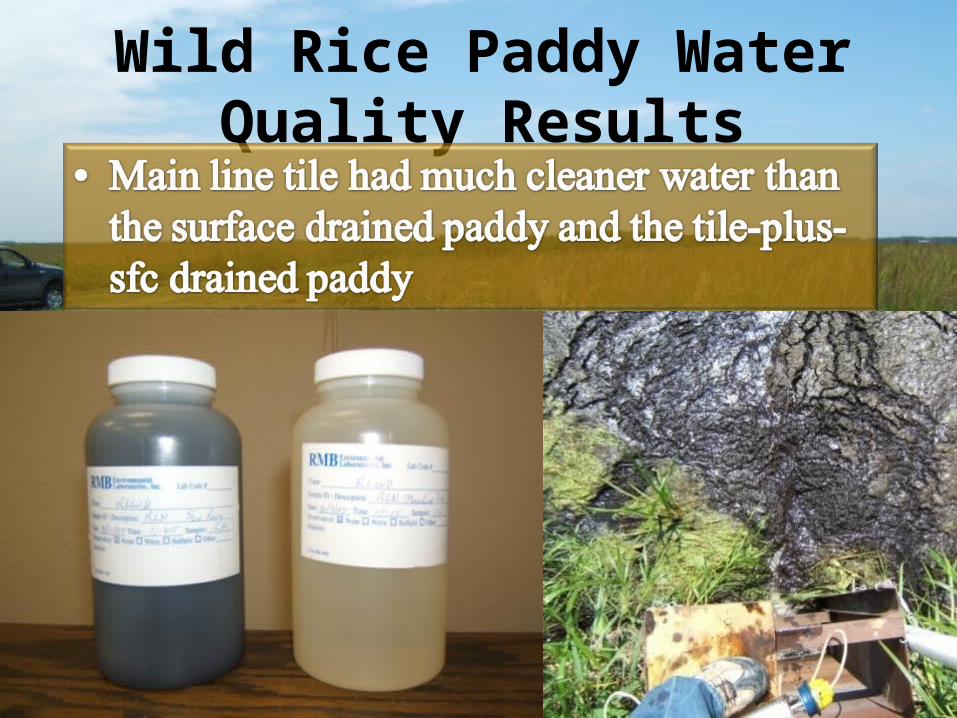
Wild Rice Paddy Water Quality Results
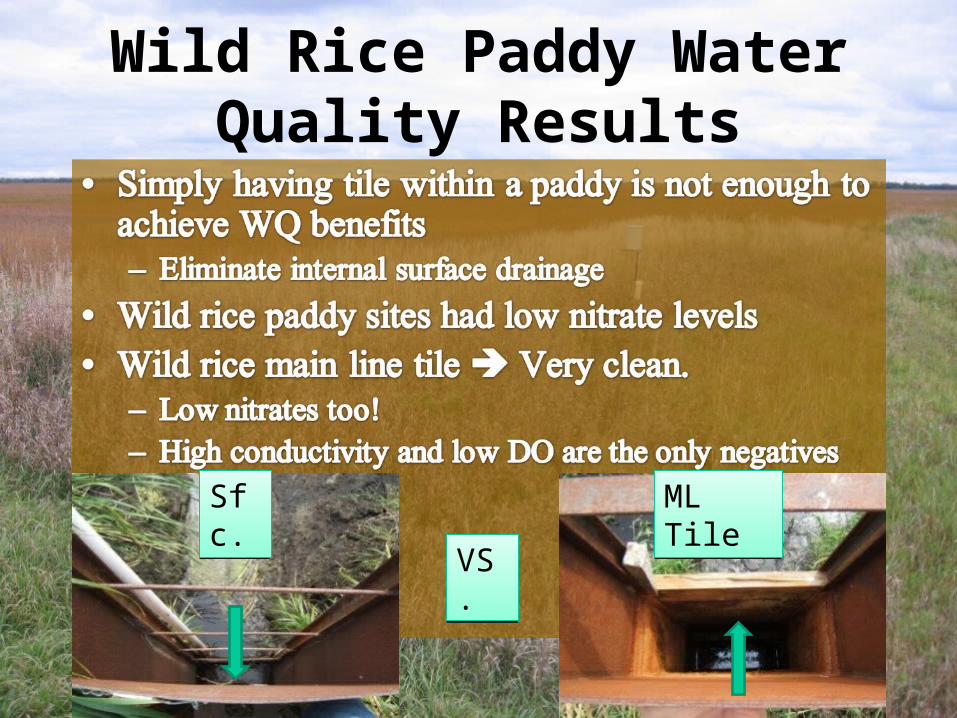
Wild Rice Paddy Water Quality Results
VS.VS.
Sfc.Sfc. ML TileML Tile
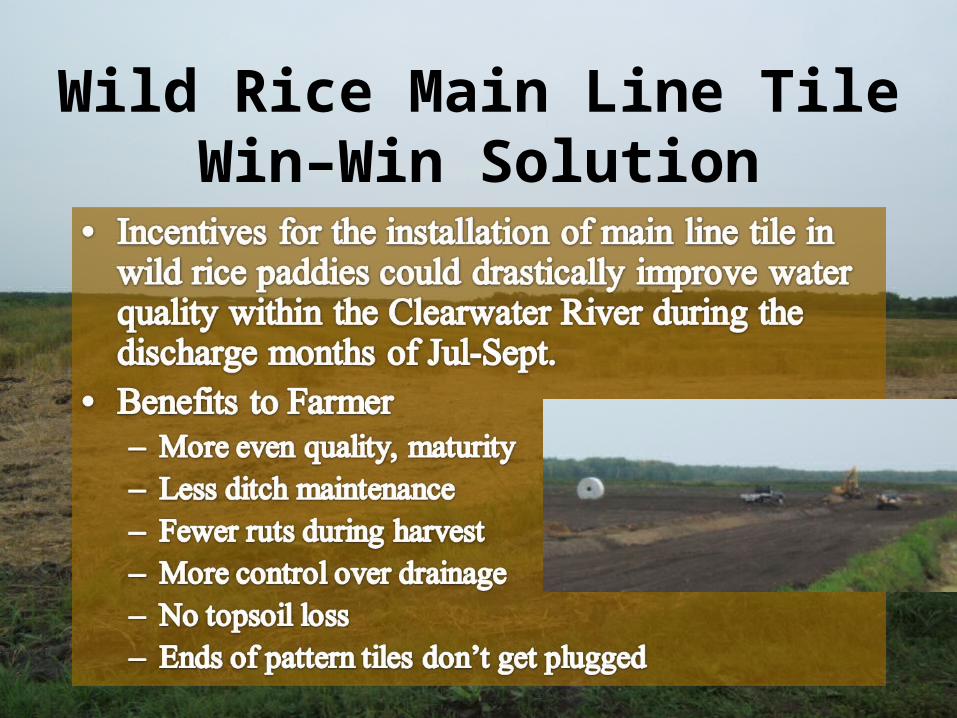
Wild Rice Main Line TileWin–Win Solution
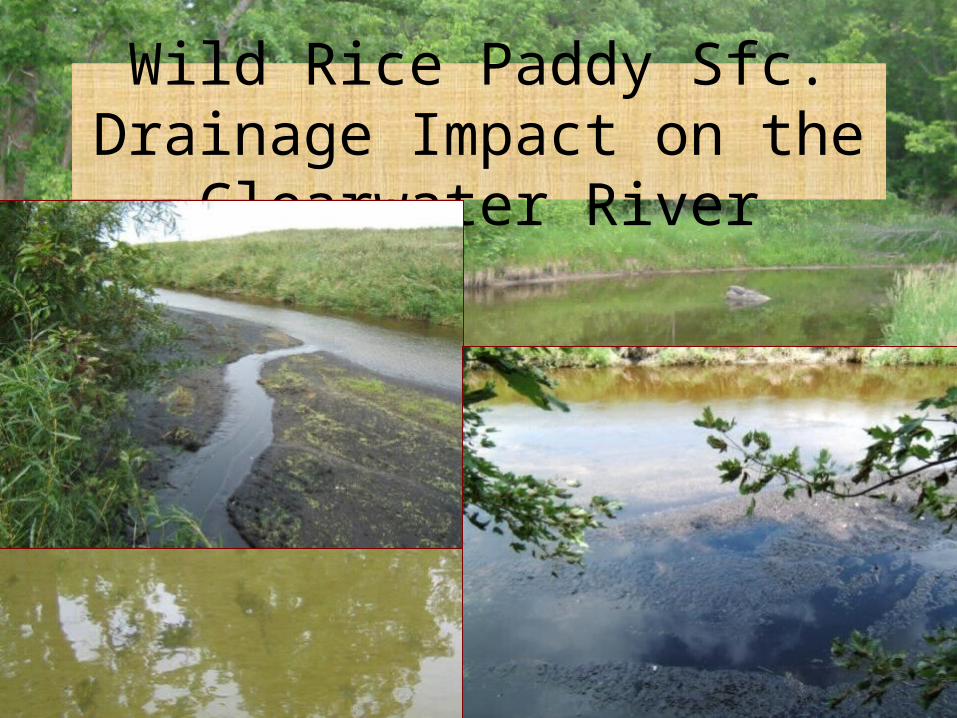
Wild Rice Paddy Sfc. Drainage Impact on the Clearwater River
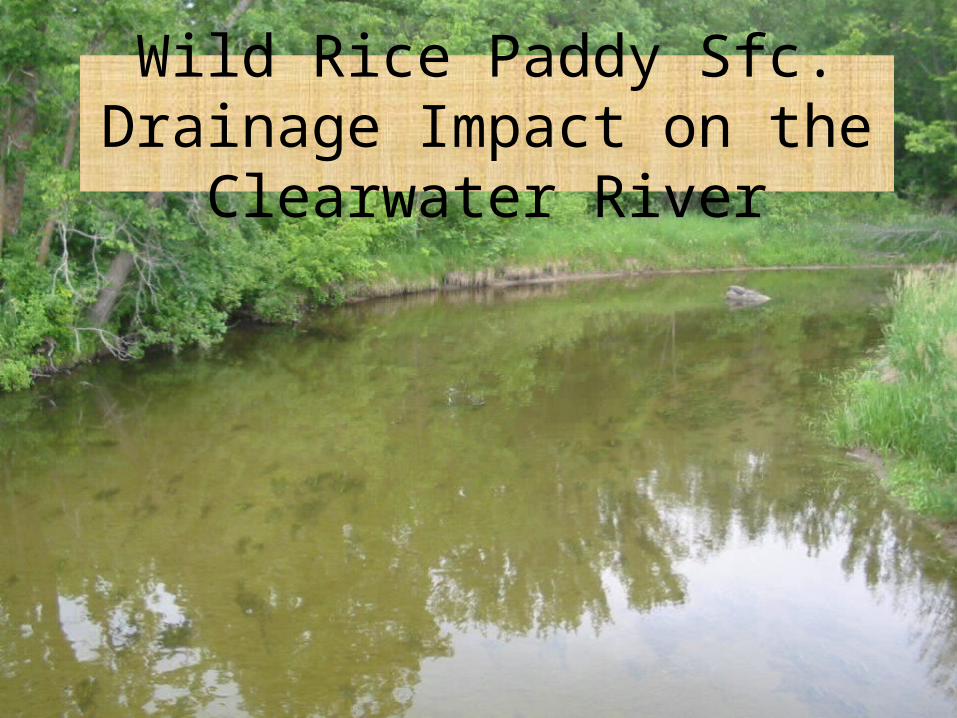
Wild Rice Paddy Sfc. Drainage Impact on the Clearwater River
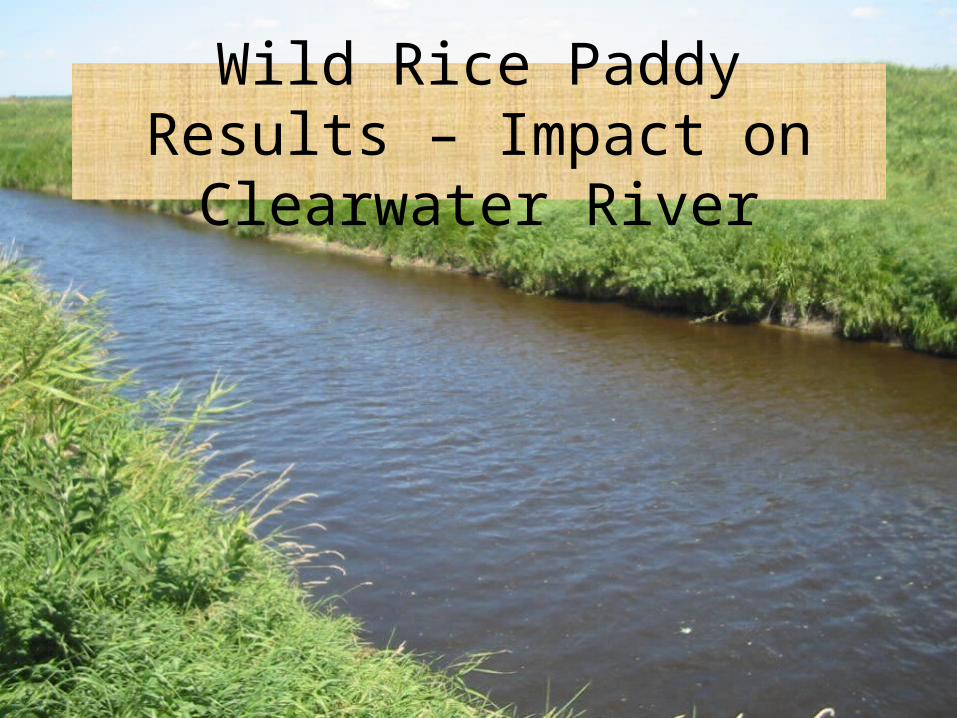
Wild Rice Paddy Results – Impact on Clearwater River
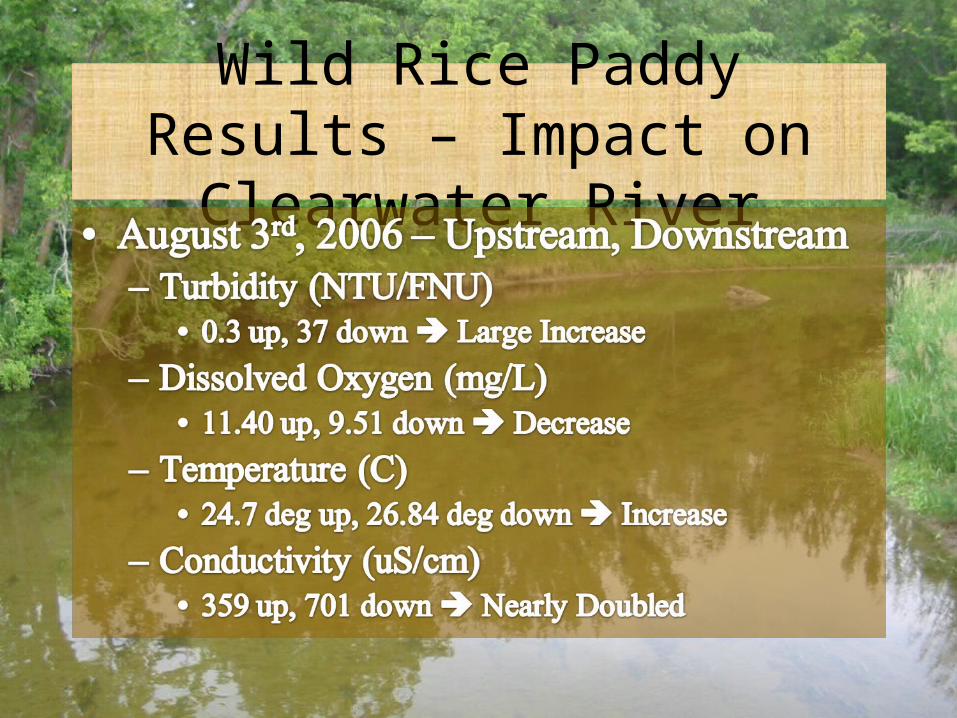
Wild Rice Paddy Results – Impact on Clearwater River
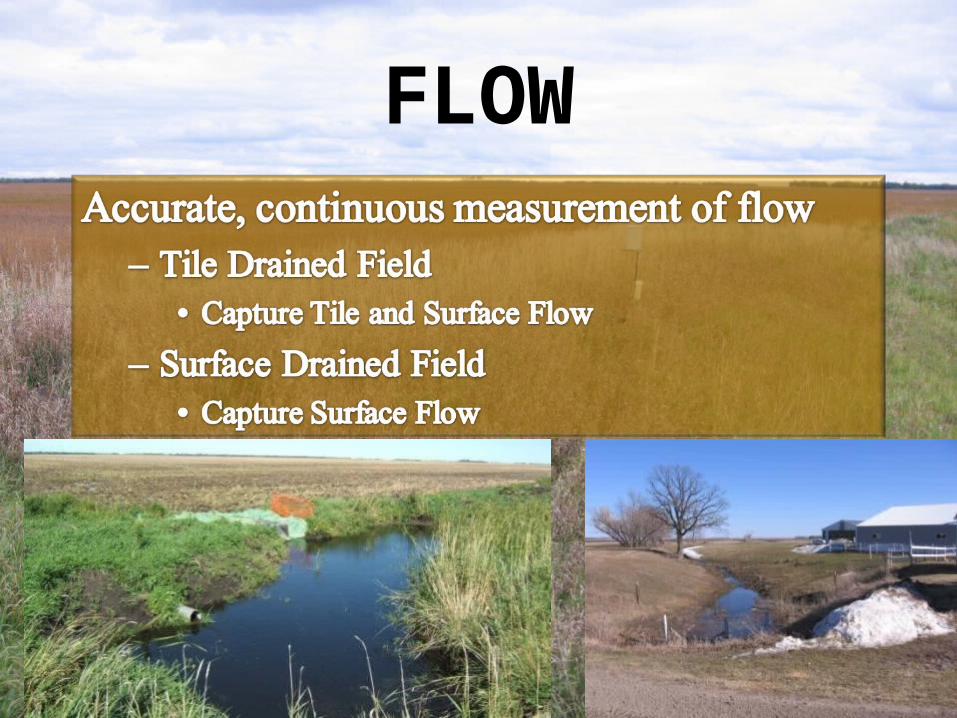
FLOW
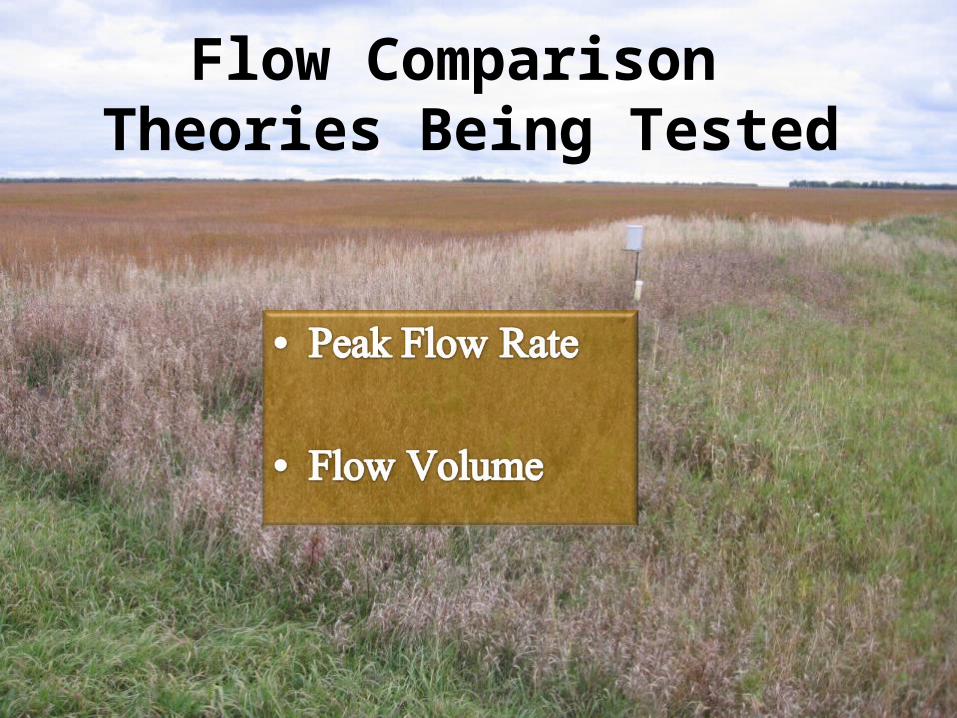
Flow Comparison Theories Being Tested
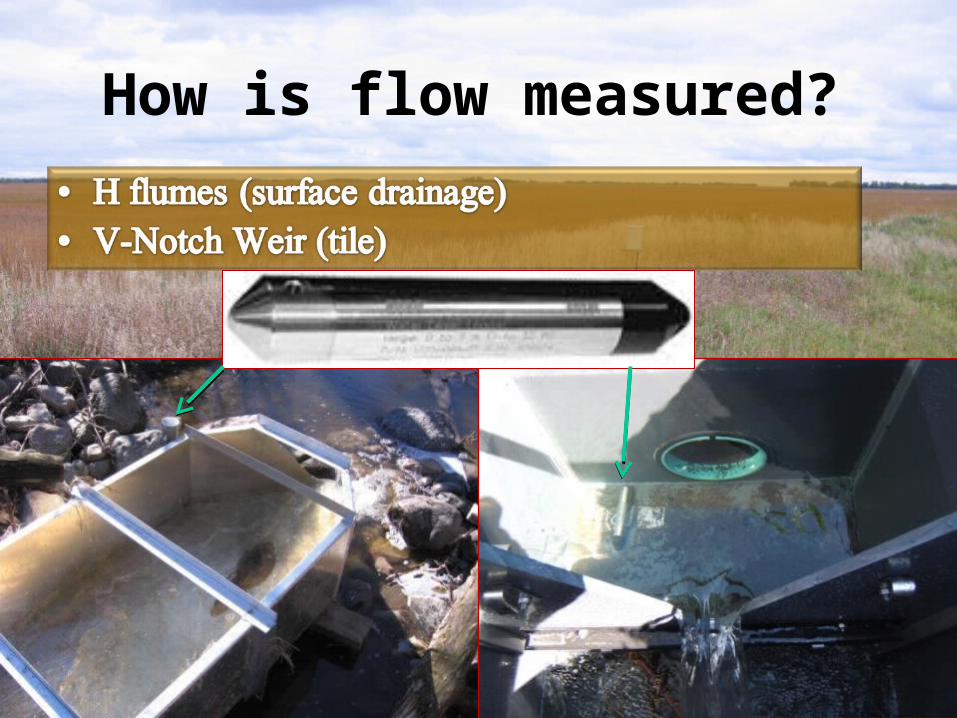
How is flow measured?
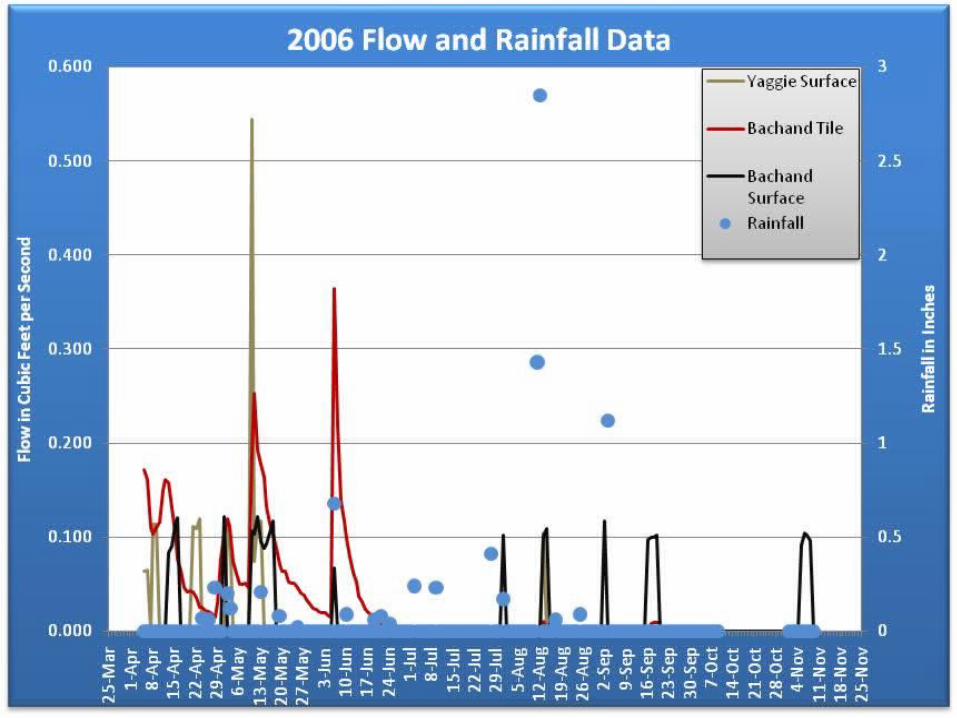
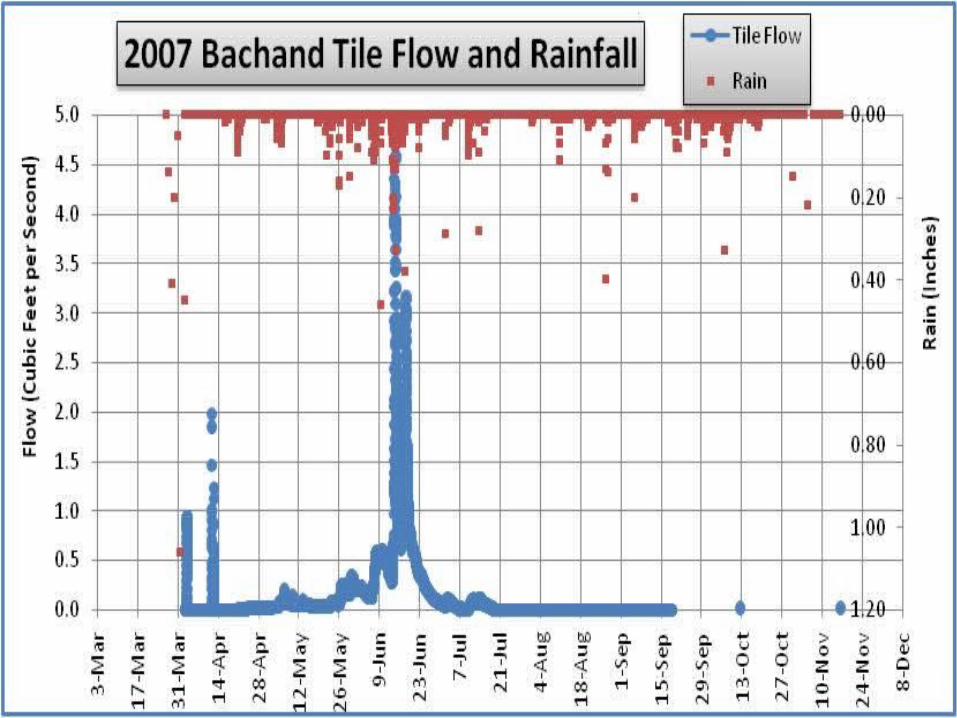
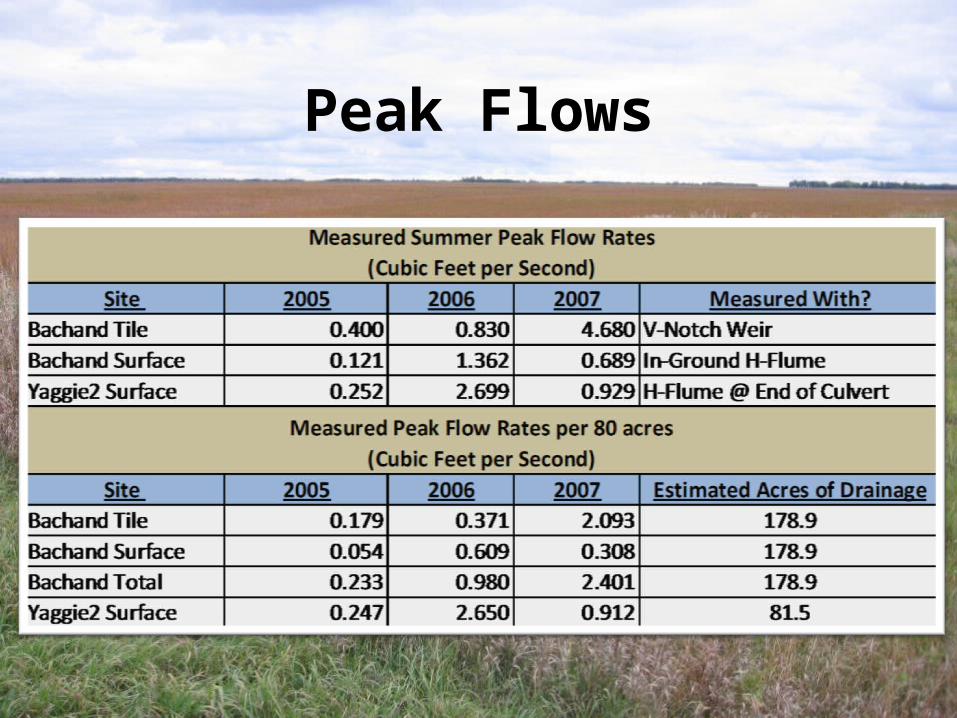
Peak Flows
More InformationMore Questions
Future Plans