Embed Size (px)
Citation preview
MANGO RED Chandigarh Report
May 2016
RedMango Analytics Find your Sweet Spot
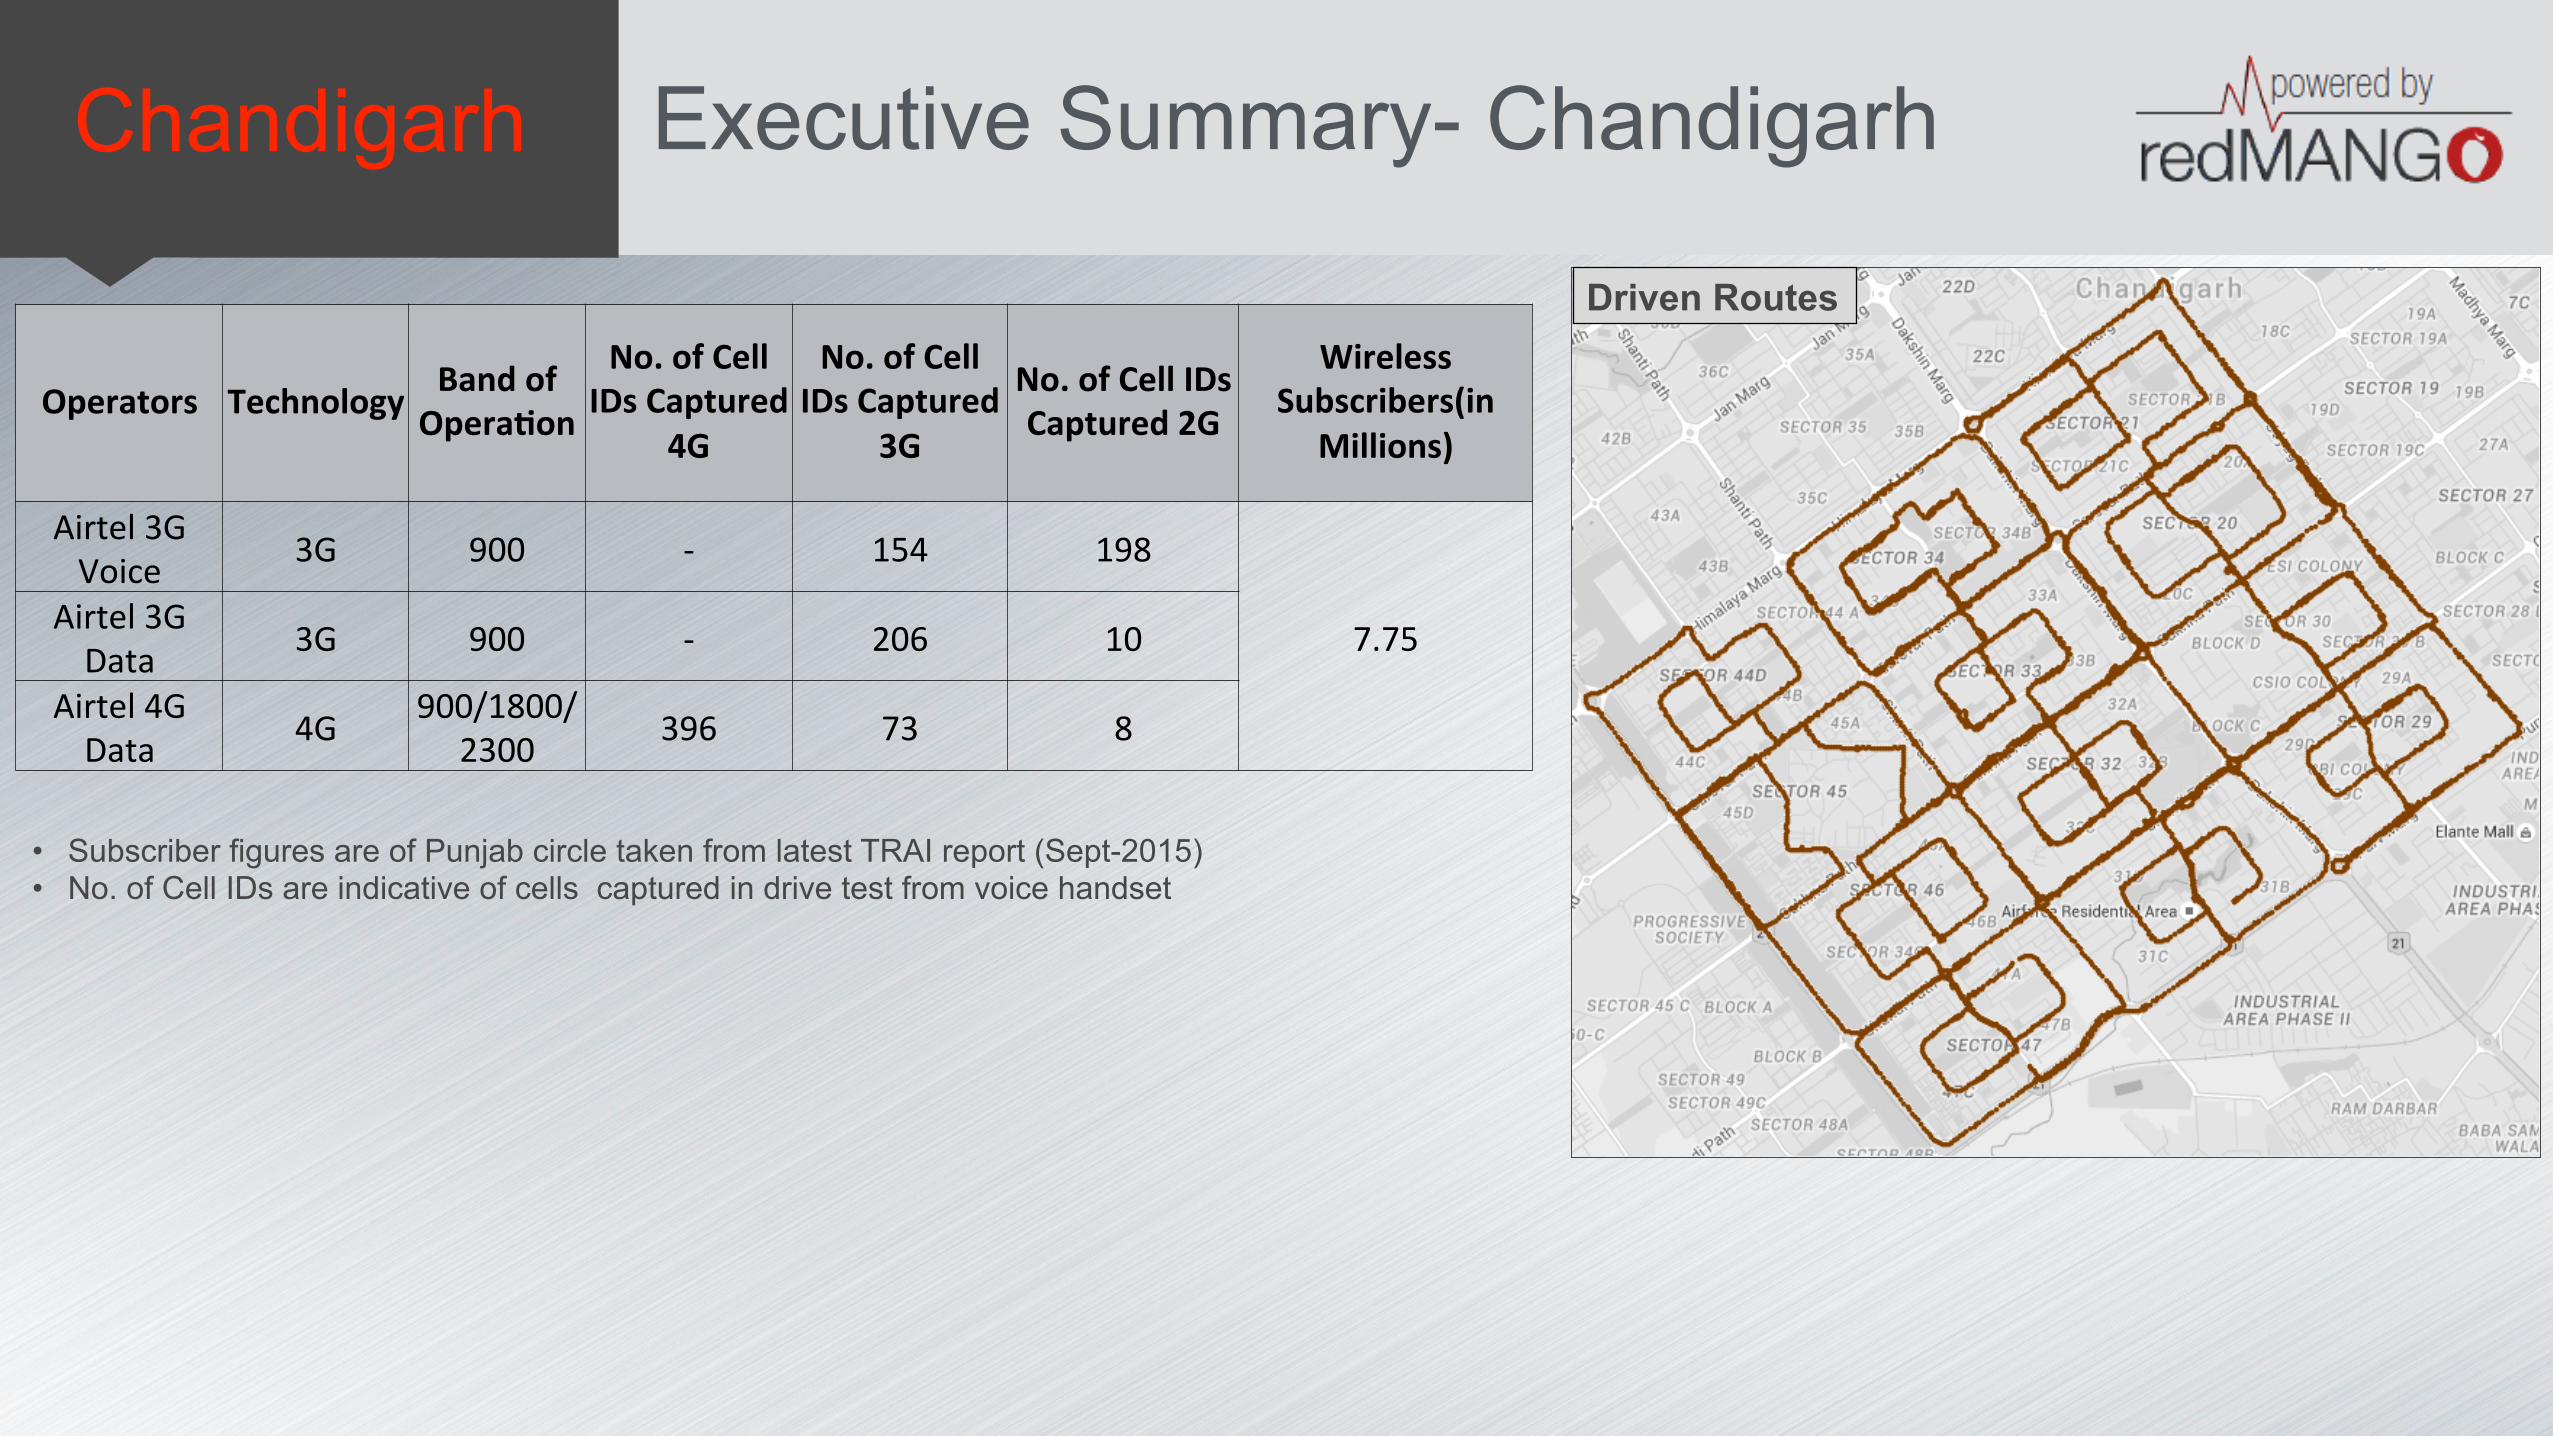
Chandigarh Executive Summary- Chandigarh
Operators Technology Band of Opera4on
No. of Cell IDs Captured
4G
No. of Cell IDs Captured
3G
No. of Cell IDs Captured 2G
Wireless Subscribers(in
Millions)
Airtel 3G Voice 3G 900 -‐ 154 198
7.75 Airtel 3G Data 3G 900 -‐ 206 10
Airtel 4G Data 4G 900/1800/
2300 396 73 8
• Subscriber figures are of Punjab circle taken from latest TRAI report (Sept-2015) • No. of Cell IDs are indicative of cells captured in drive test from voice handset
Driven Routes
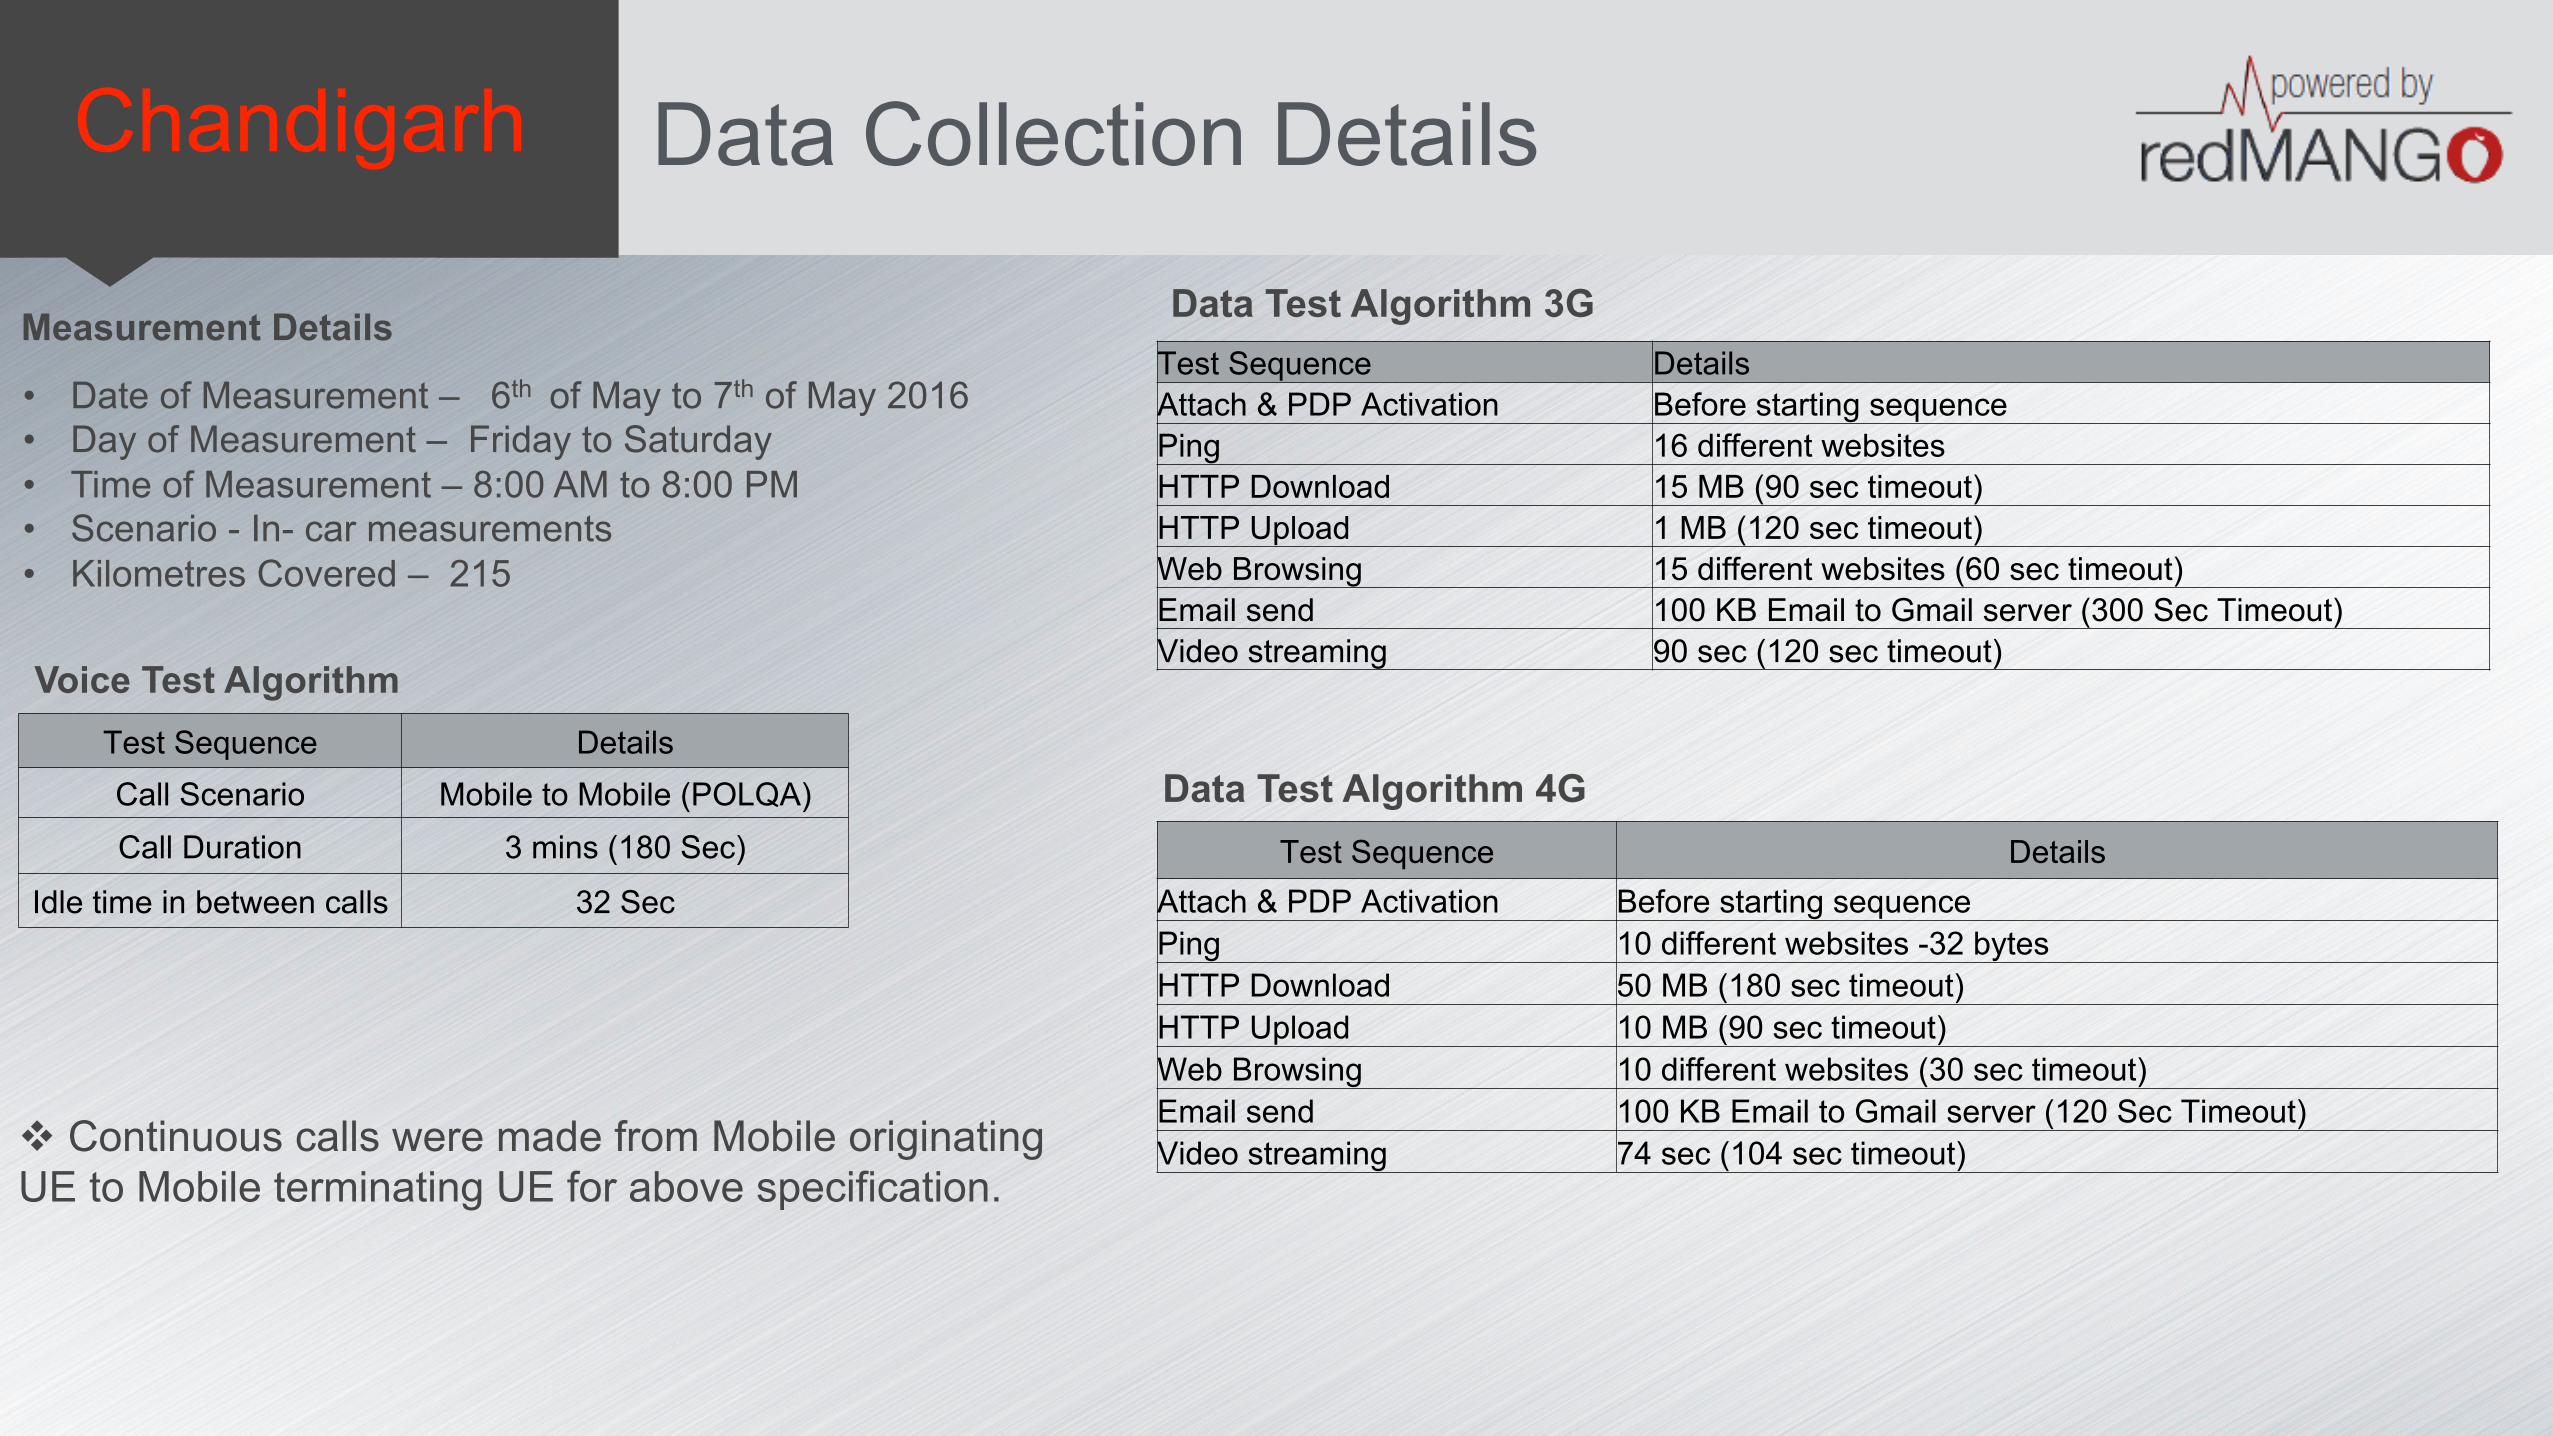
Chandigarh Data Collection Details
Measurement Details
• Date of Measurement – 6th of May to 7th of May 2016 • Day of Measurement – Friday to Saturday • Time of Measurement – 8:00 AM to 8:00 PM • Scenario - In- car measurements • Kilometres Covered – 215
Voice Test Algorithm Test Sequence Details Call Scenario Mobile to Mobile (POLQA) Call Duration 3 mins (180 Sec)
Idle time in between calls 32 Sec
v Continuous calls were made from Mobile originating UE to Mobile terminating UE for above specification.
Data Test Algorithm 3G Test Sequence Details Attach & PDP Activation Before starting sequence Ping 16 different websites HTTP Download 15 MB (90 sec timeout) HTTP Upload 1 MB (120 sec timeout) Web Browsing 15 different websites (60 sec timeout) Email send 100 KB Email to Gmail server (300 Sec Timeout) Video streaming 90 sec (120 sec timeout)
Data Test Algorithm 4G Test Sequence Details
Attach & PDP Activation Before starting sequence Ping 10 different websites -32 bytes HTTP Download 50 MB (180 sec timeout) HTTP Upload 10 MB (90 sec timeout) Web Browsing 10 different websites (30 sec timeout) Email send 100 KB Email to Gmail server (120 Sec Timeout) Video streaming 74 sec (104 sec timeout)
Chandigarh
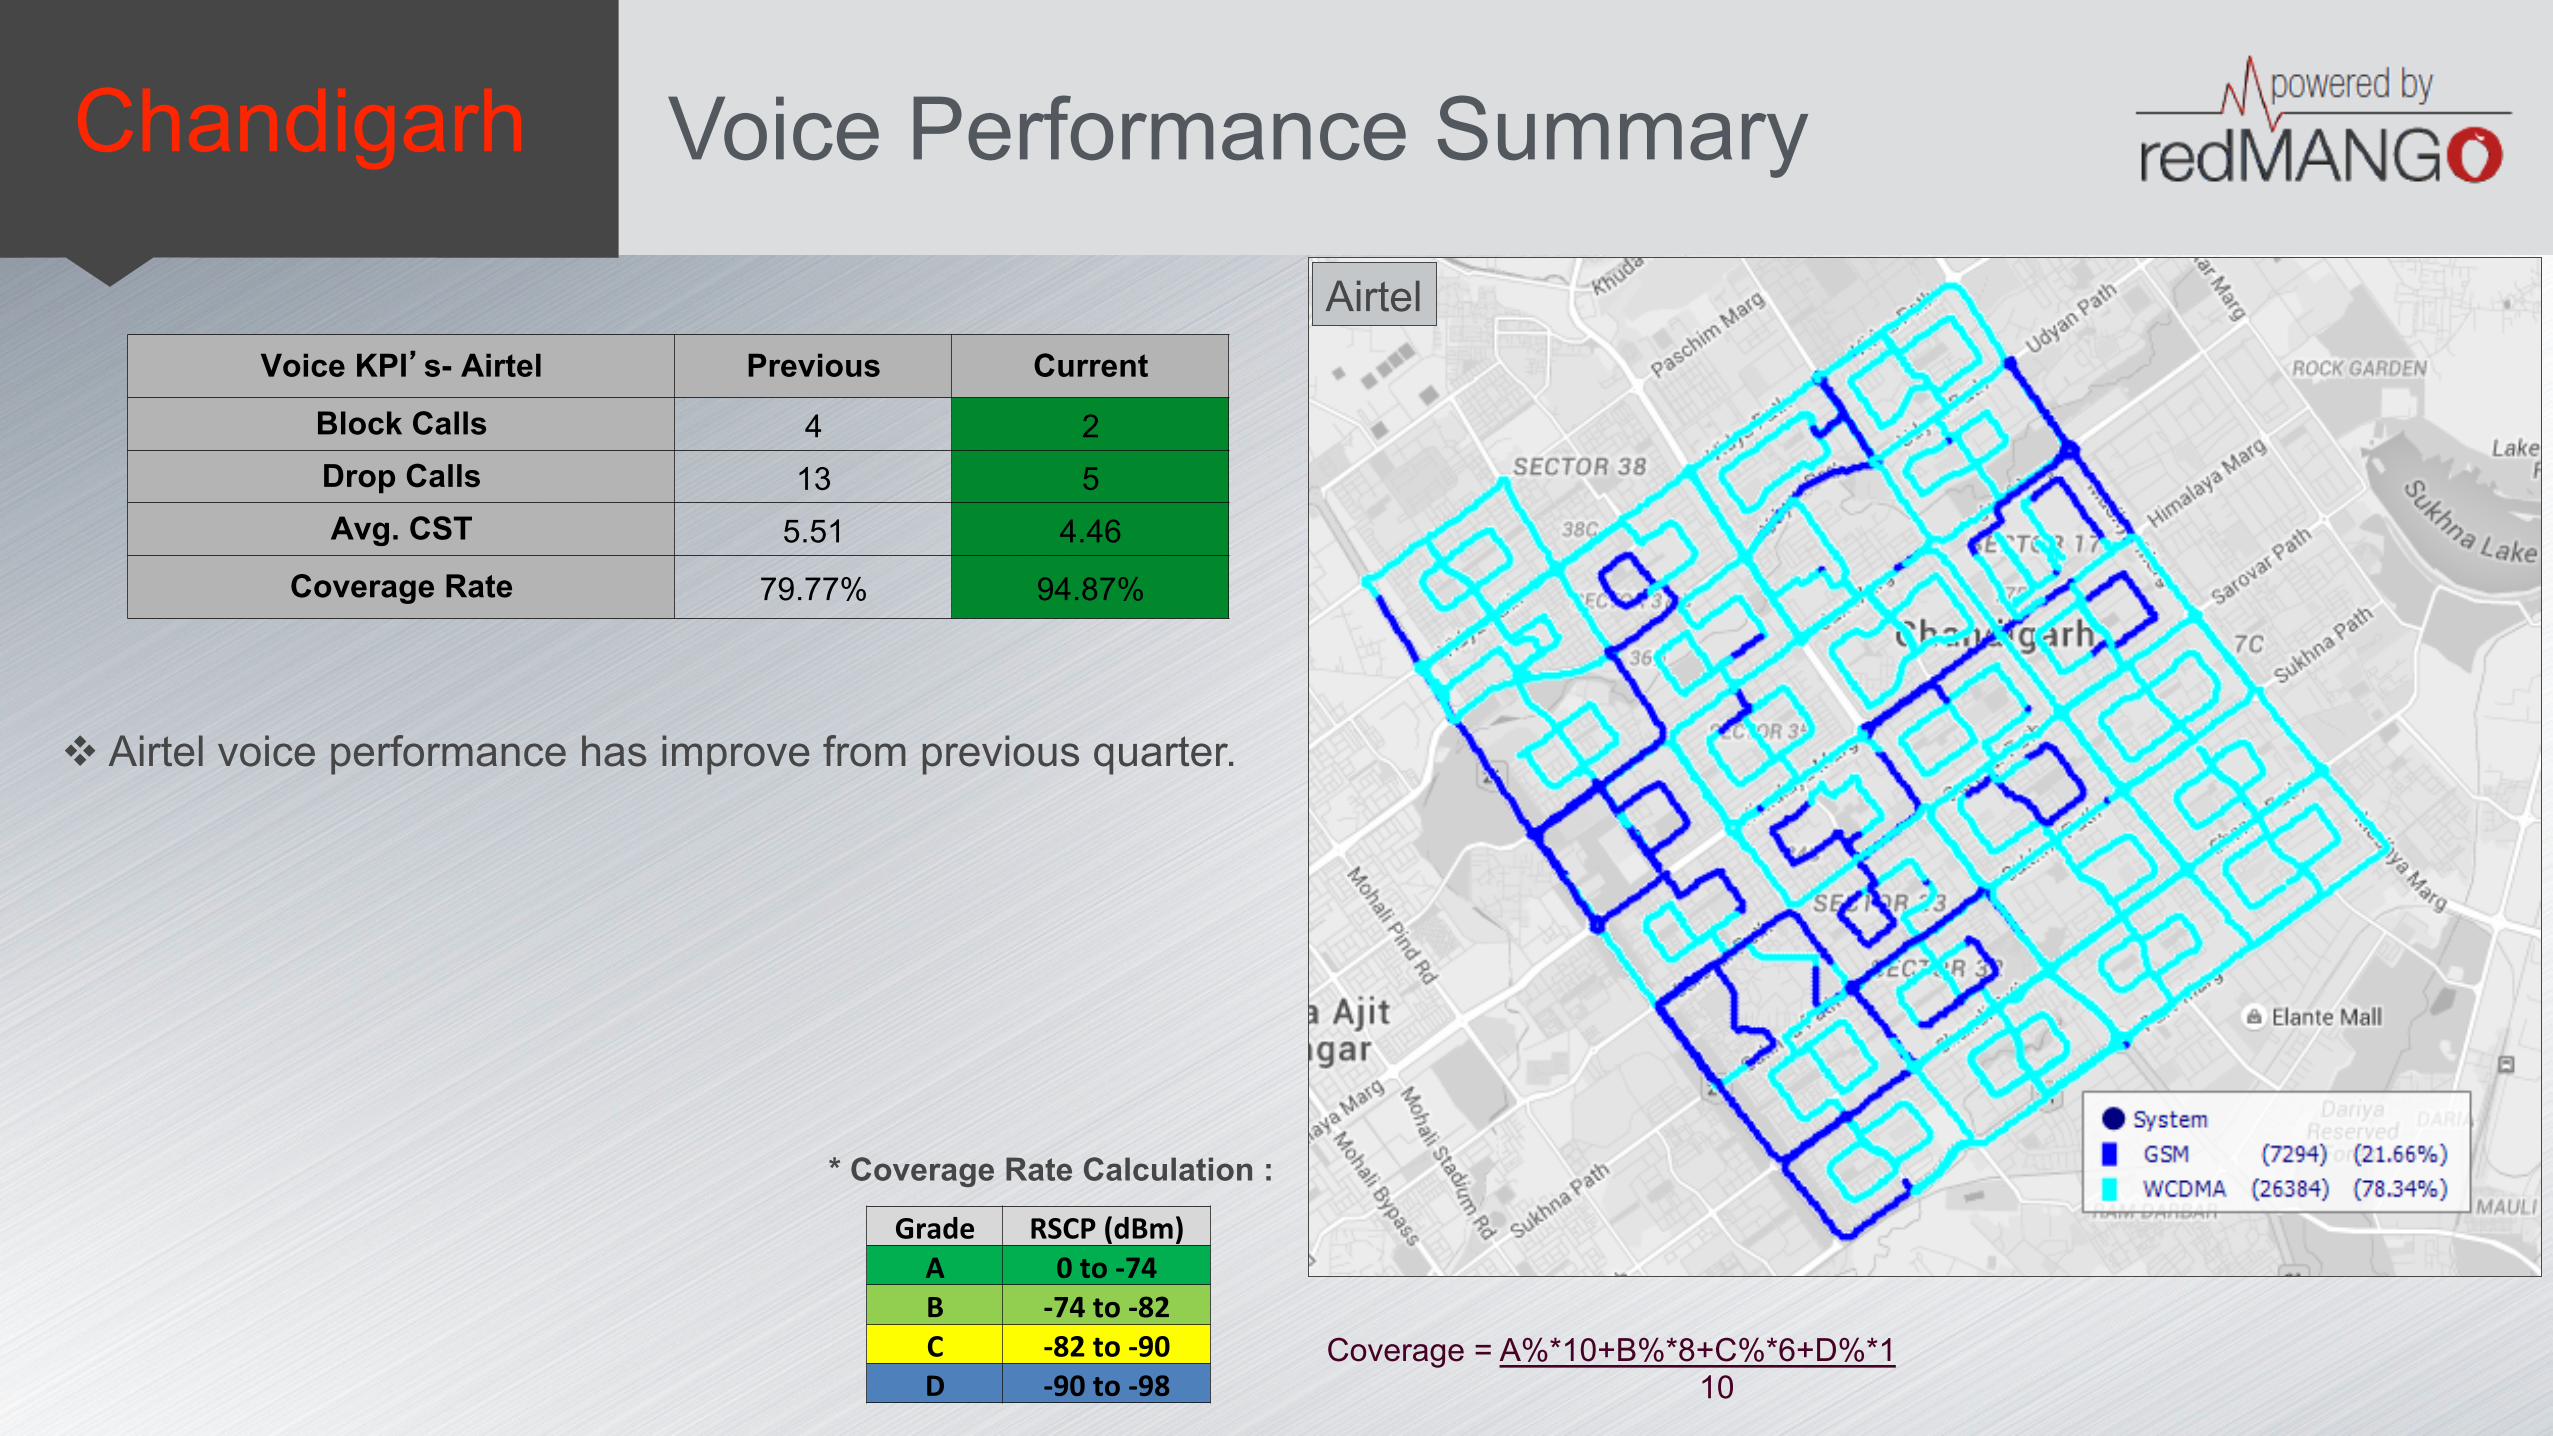
* Coverage Rate Calculation :
Grade RSCP (dBm) A 0 to -‐74 B -‐74 to -‐82 C -‐82 to -‐90 D -‐90 to -‐98
Coverage = A%*10+B%*8+C%*6+D%*1 10
Voice Performance Summary
Voice KPI’s- Airtel Previous Current
Block Calls 4 2 Drop Calls 13 5 Avg. CST 5.51 4.46
Coverage Rate 79.77% 94.87%
Airtel
v Airtel voice performance has improve from previous quarter.
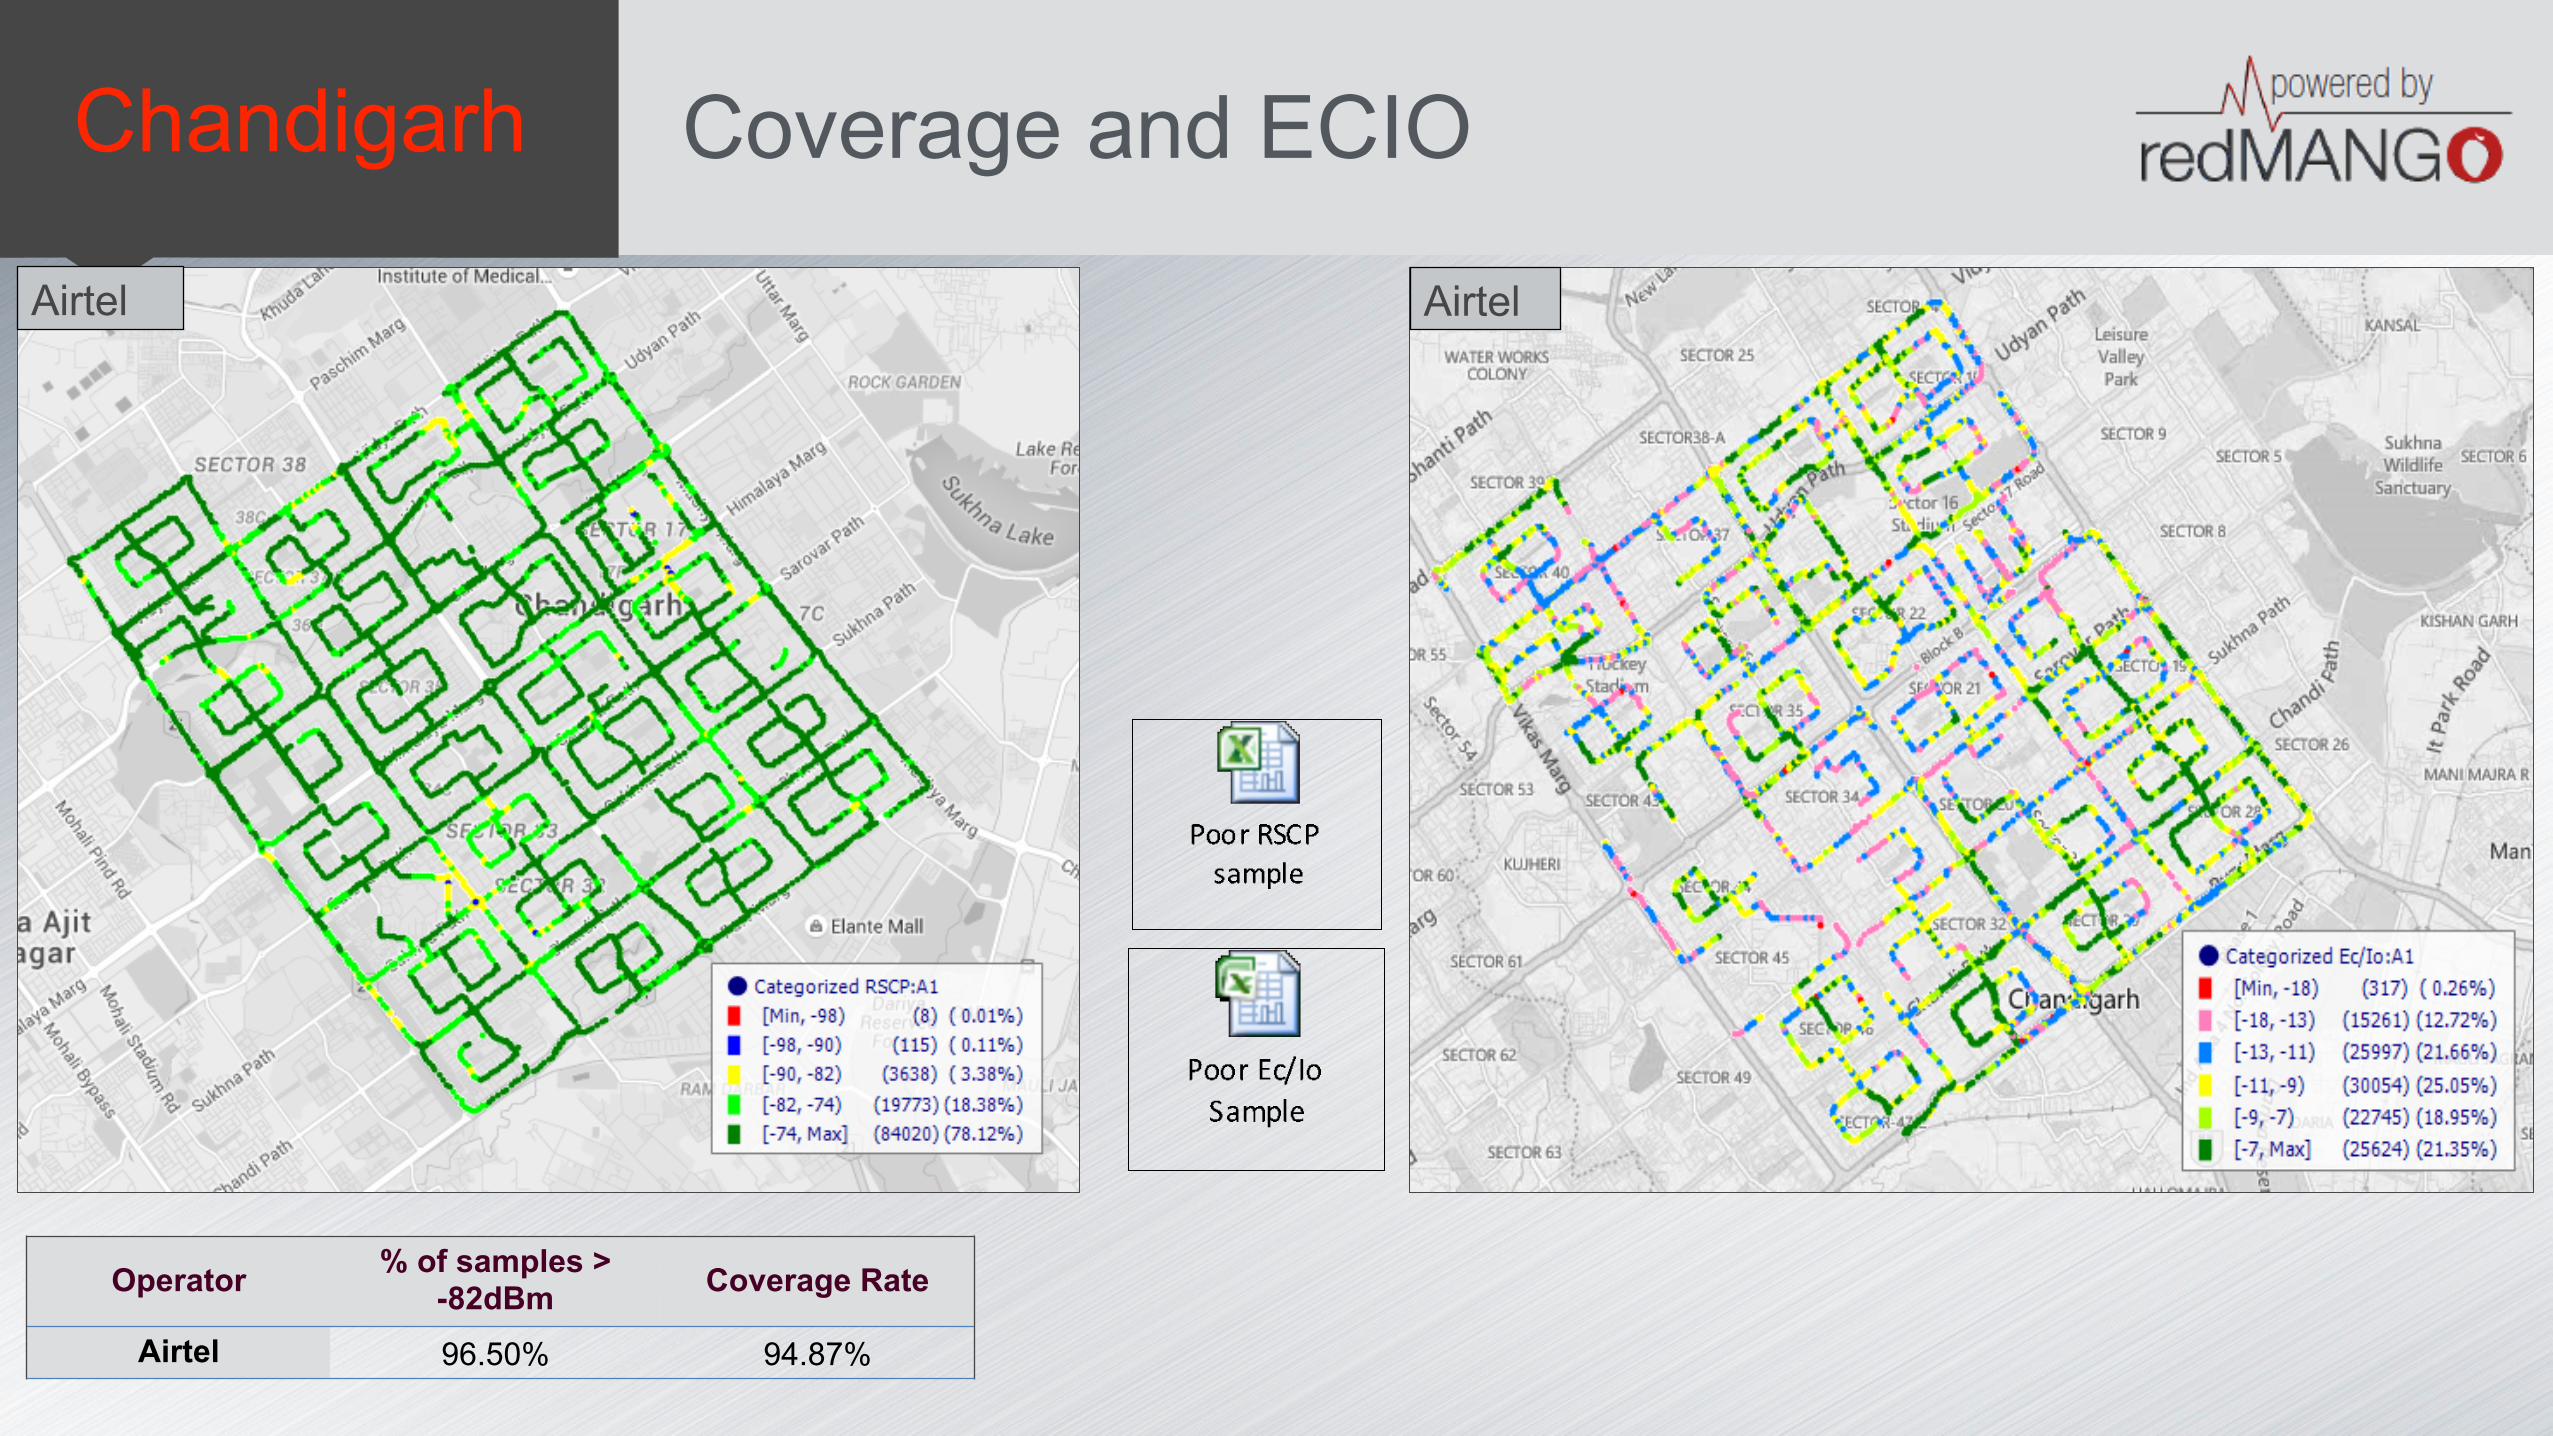
Chandigarh Coverage and ECIO
Operator % of samples > -82dBm Coverage Rate
Airtel 96.50% 94.87%
Airtel Airtel
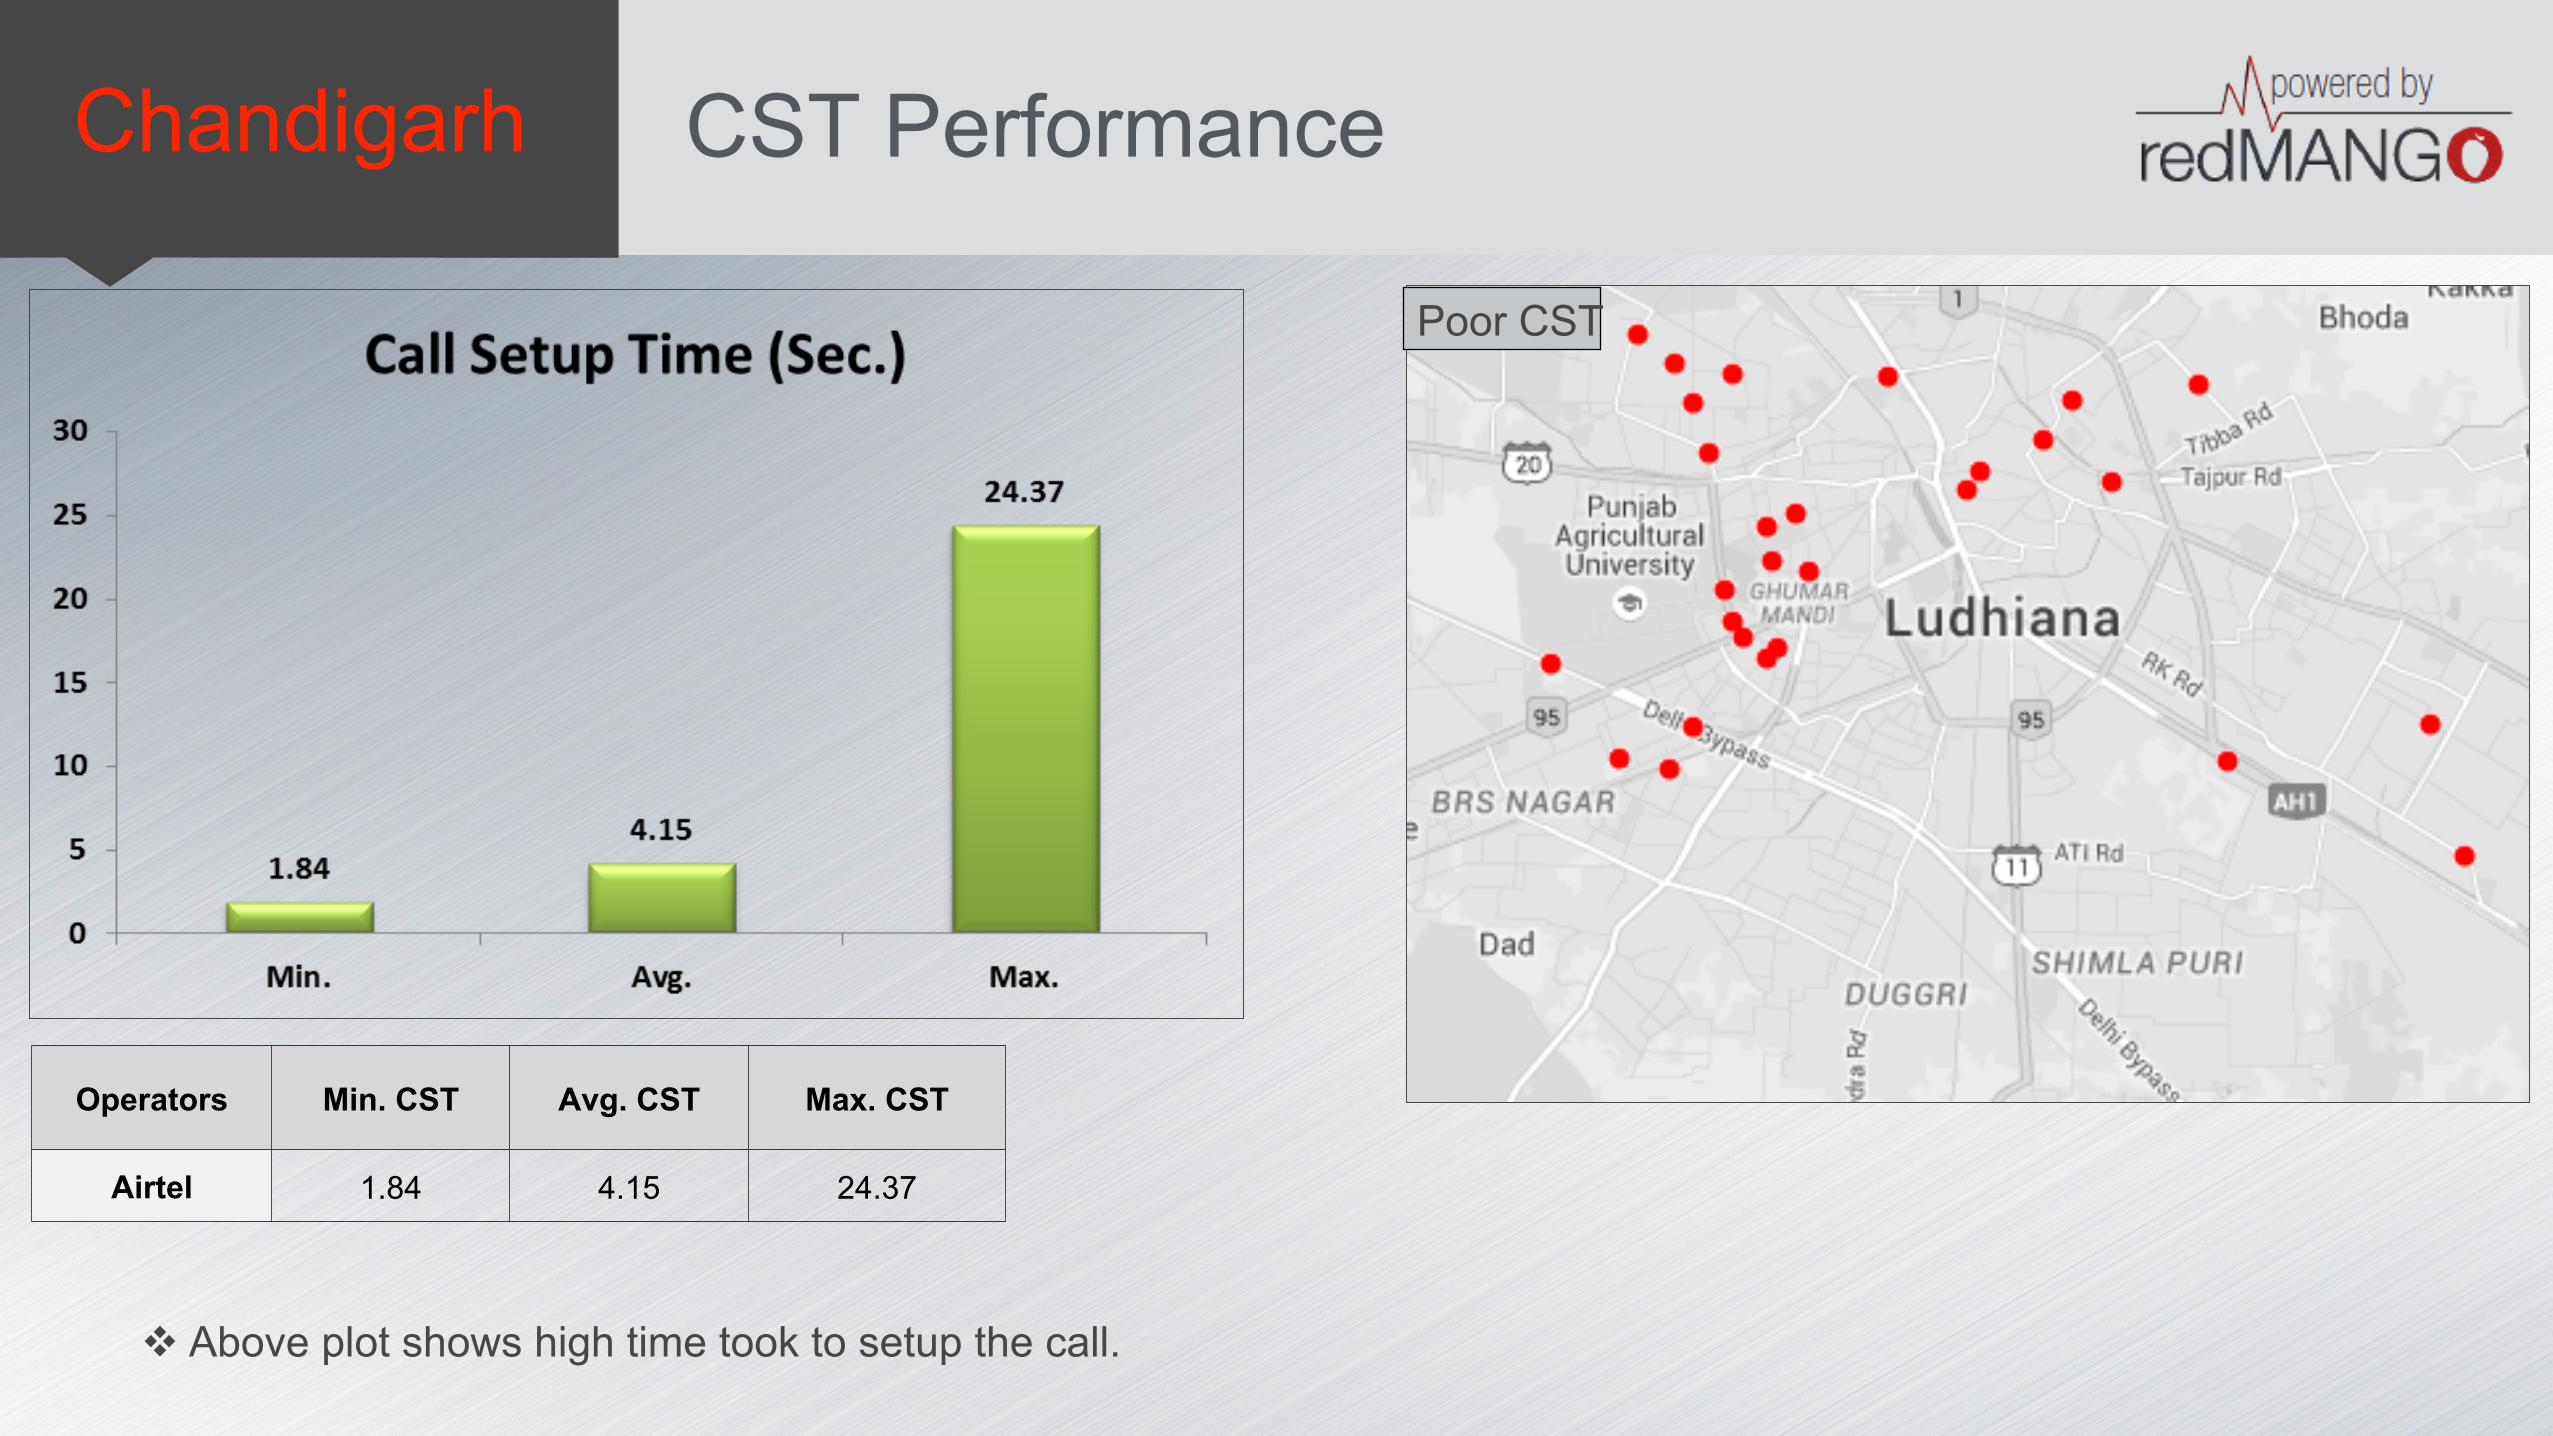
Chandigarh CST Performance
Operators Min. CST Avg. CST Max. CST
Airtel 1.84 4.15 24.37
Poor CST
v Above plot shows high time took to setup the call.
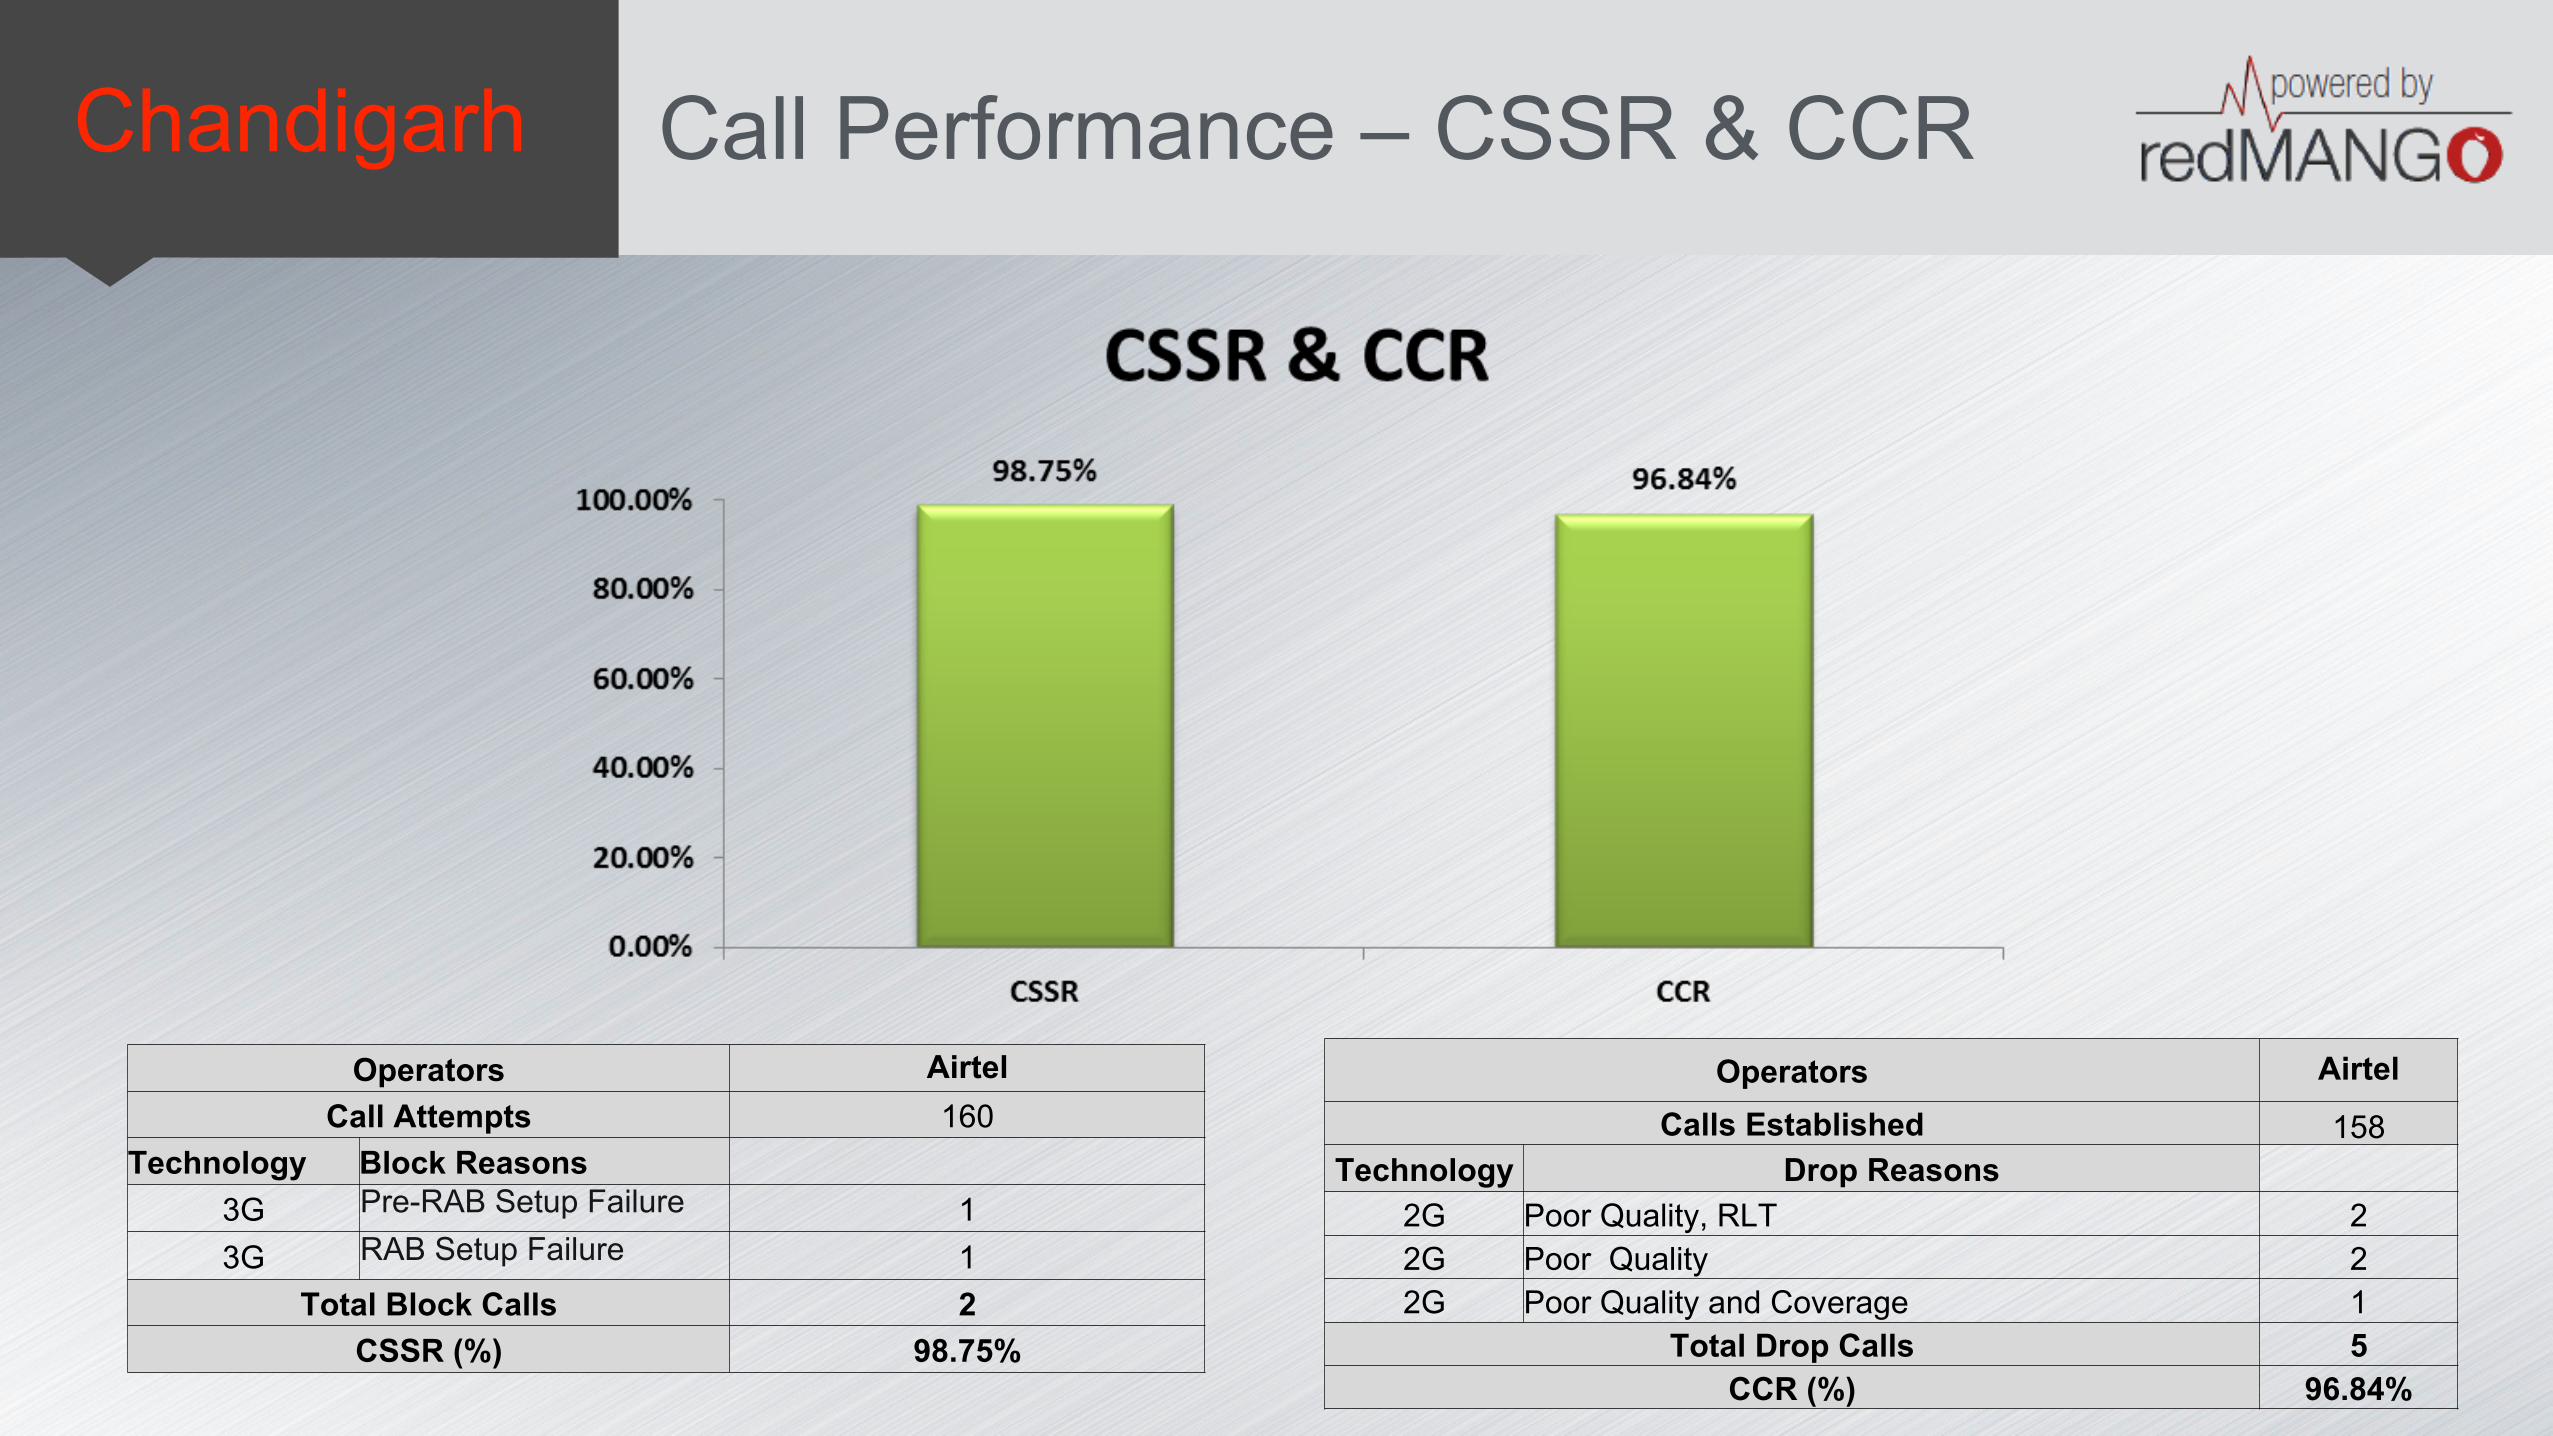
Chandigarh Call Performance – CSSR & CCR
Operators Airtel Call Attempts 160
Technology Block Reasons 3G Pre-RAB Setup Failure 1 3G RAB Setup Failure 1
Total Block Calls 2 CSSR (%) 98.75%
Operators Airtel
Calls Established 158 Technology Drop Reasons
2G Poor Quality, RLT 2 2G Poor Quality 2 2G Poor Quality and Coverage 1
Total Drop Calls 5 CCR (%) 96.84%
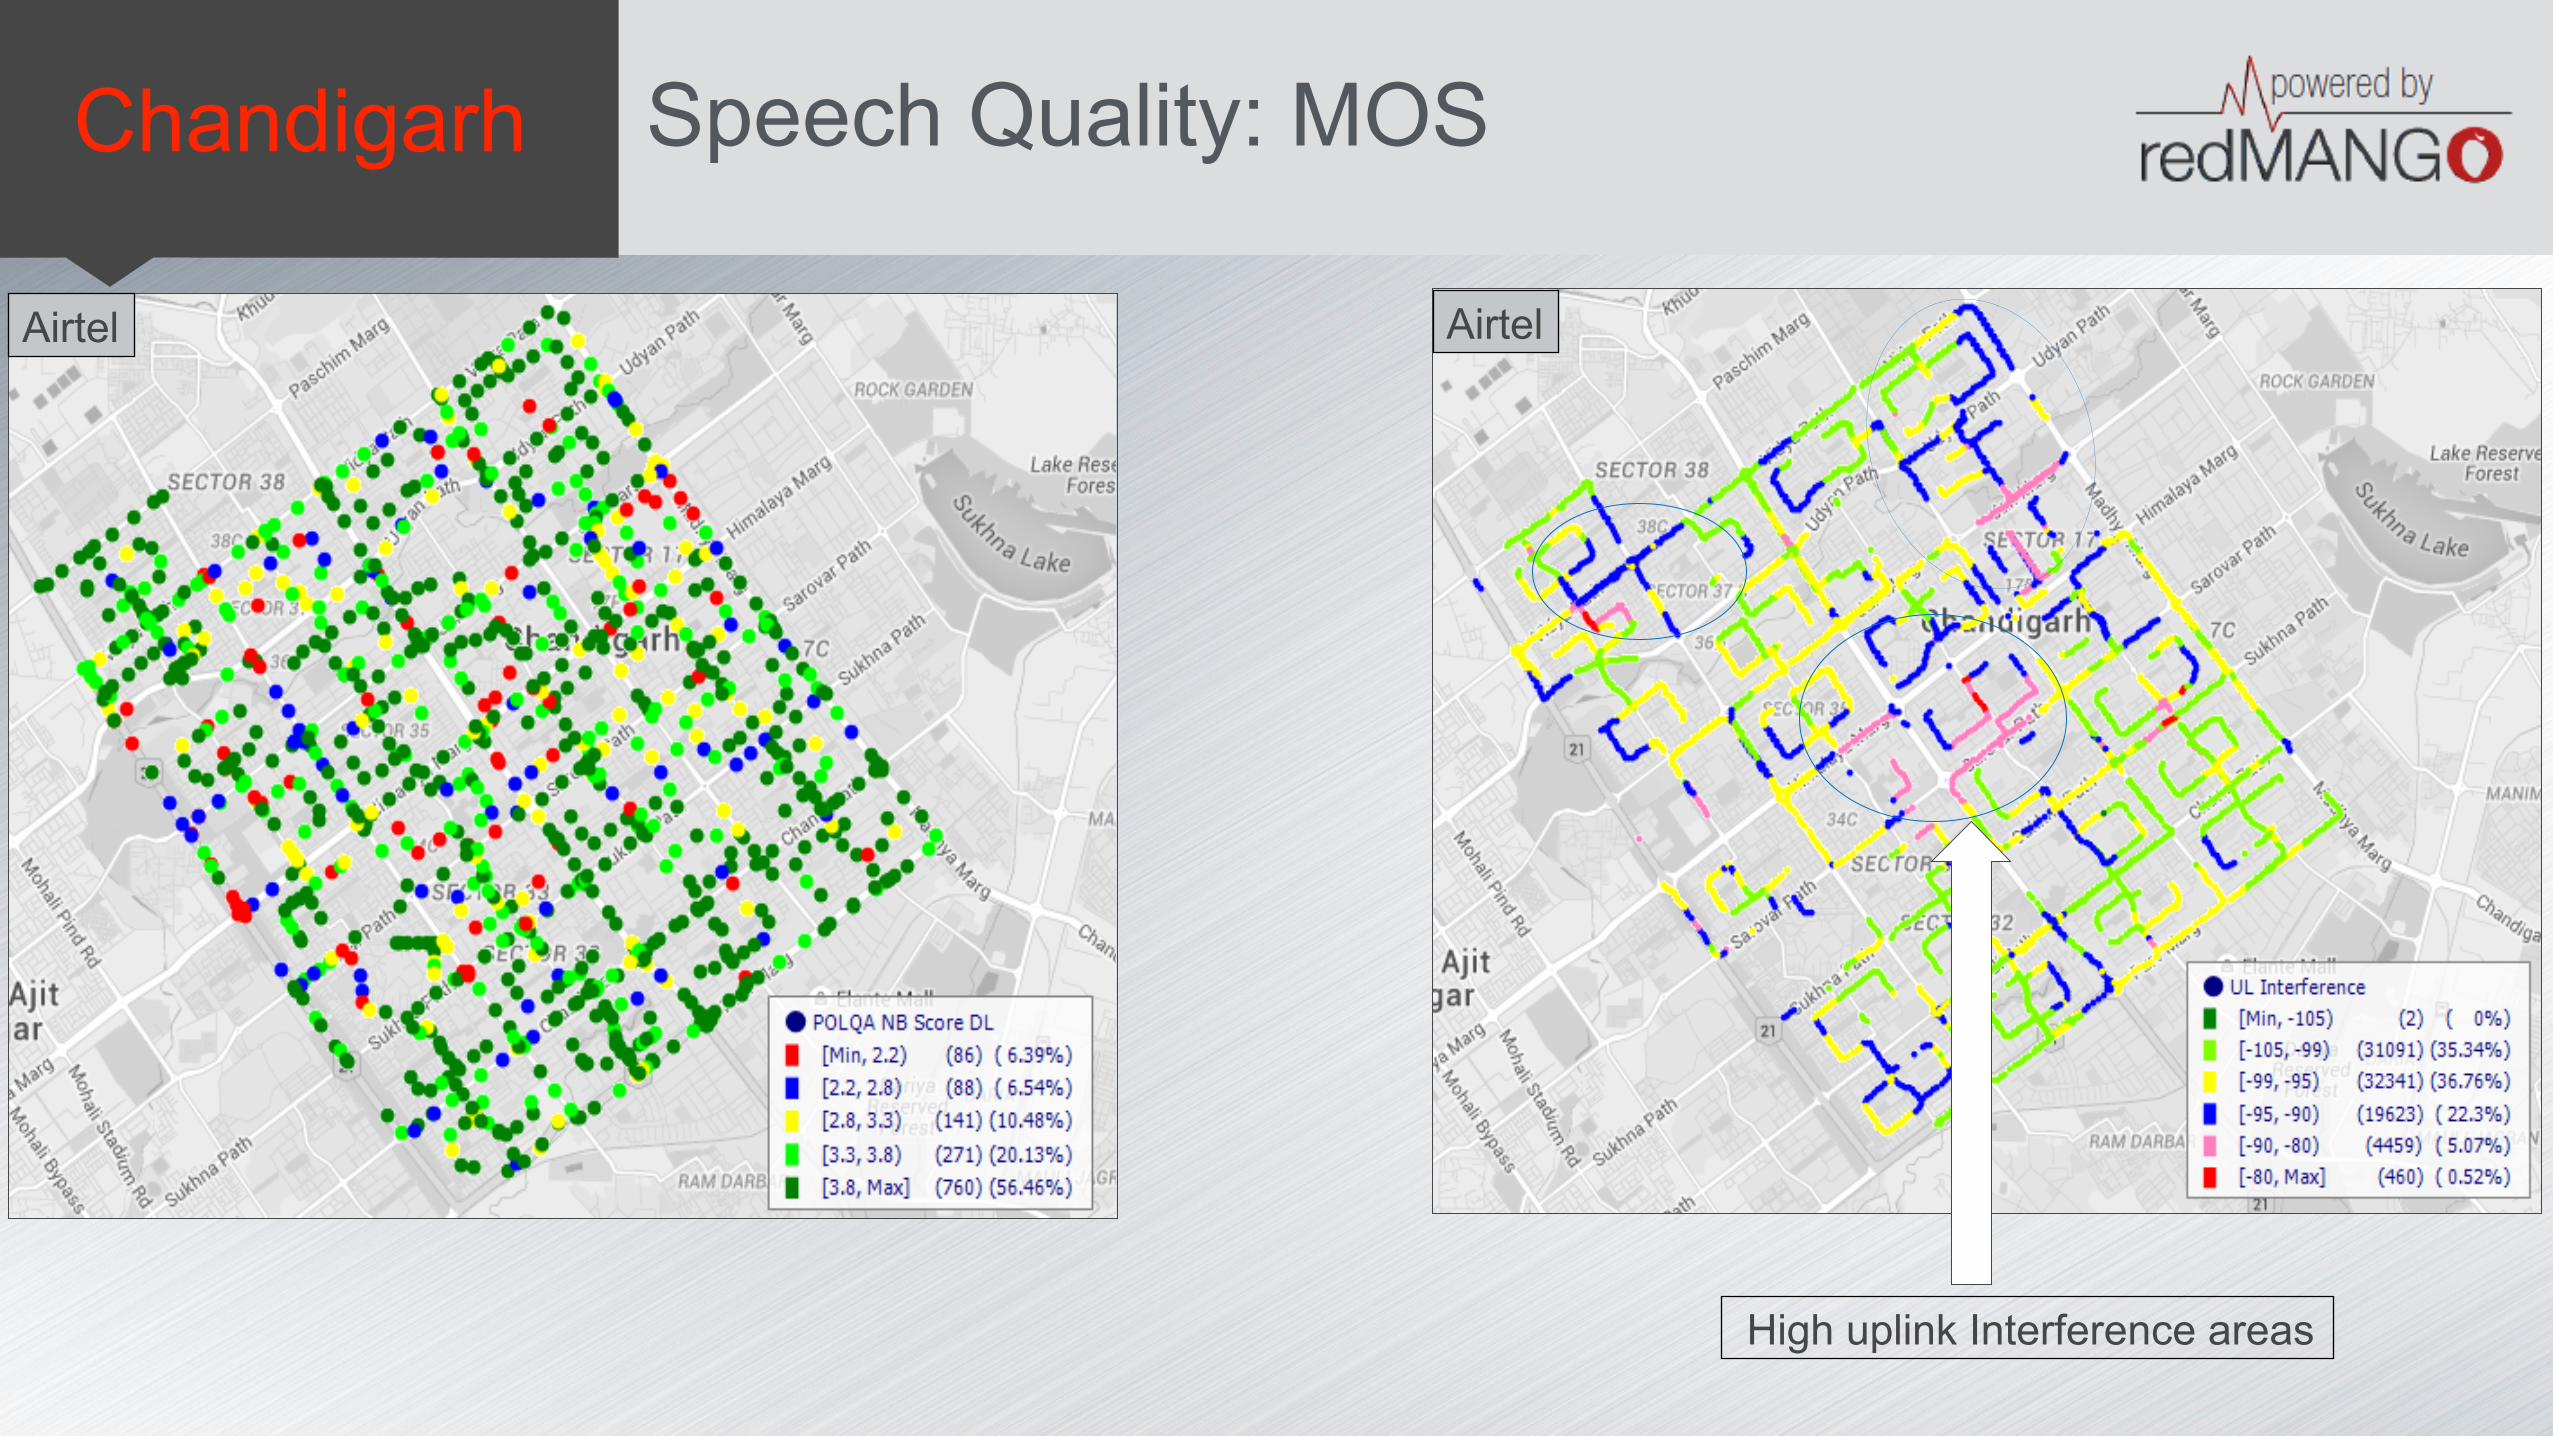
Chandigarh Speech Quality: MOS
Airtel Airtel
High uplink Interference areas
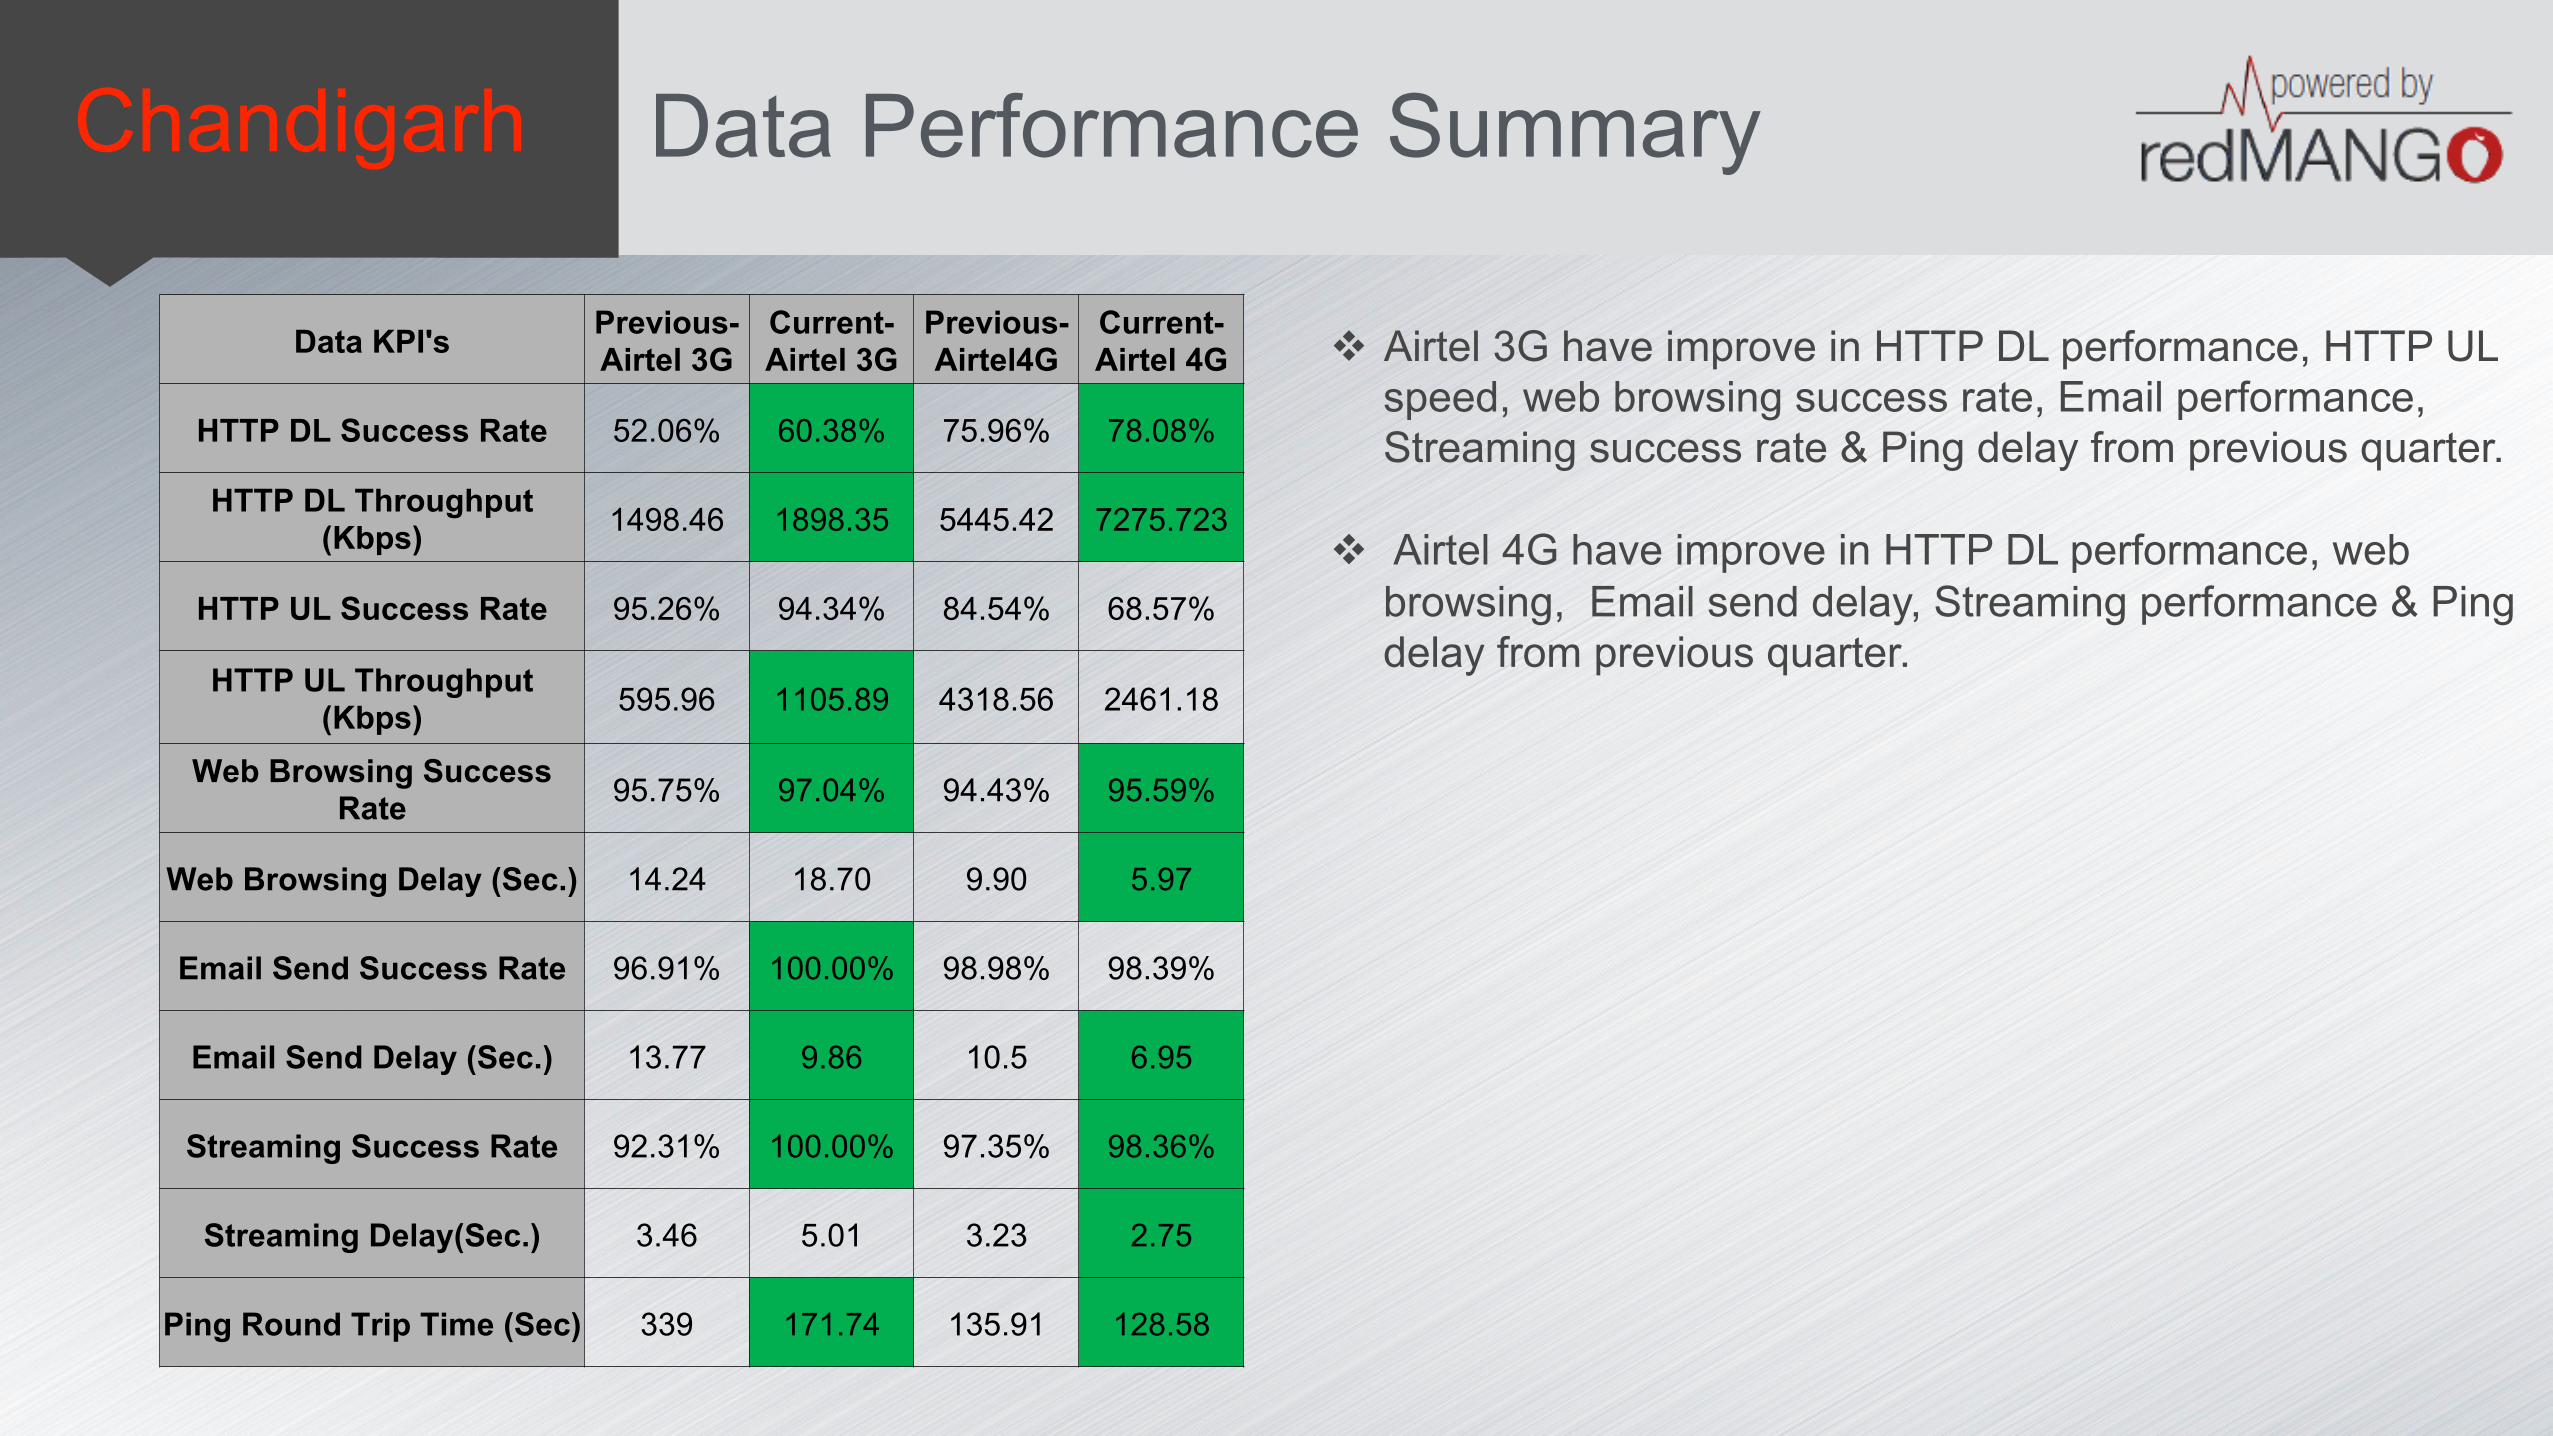
Chandigarh Data Performance Summary
Data KPI's Previous-Airtel 3G
Current-Airtel 3G
Previous-Airtel4G
Current-Airtel 4G
HTTP DL Success Rate 52.06% 60.38% 75.96% 78.08%
HTTP DL Throughput (Kbps) 1498.46 1898.35 5445.42 7275.723
HTTP UL Success Rate 95.26% 94.34% 84.54% 68.57%
HTTP UL Throughput (Kbps) 595.96 1105.89 4318.56 2461.18
Web Browsing Success Rate 95.75% 97.04% 94.43% 95.59%
Web Browsing Delay (Sec.) 14.24 18.70 9.90 5.97
Email Send Success Rate 96.91% 100.00% 98.98% 98.39%
Email Send Delay (Sec.) 13.77 9.86 10.5 6.95
Streaming Success Rate 92.31% 100.00% 97.35% 98.36%
Streaming Delay(Sec.) 3.46 5.01 3.23 2.75
Ping Round Trip Time (Sec) 339 171.74 135.91 128.58
v Airtel 3G have improve in HTTP DL performance, HTTP UL speed, web browsing success rate, Email performance, Streaming success rate & Ping delay from previous quarter.
v Airtel 4G have improve in HTTP DL performance, web browsing, Email send delay, Streaming performance & Ping delay from previous quarter.
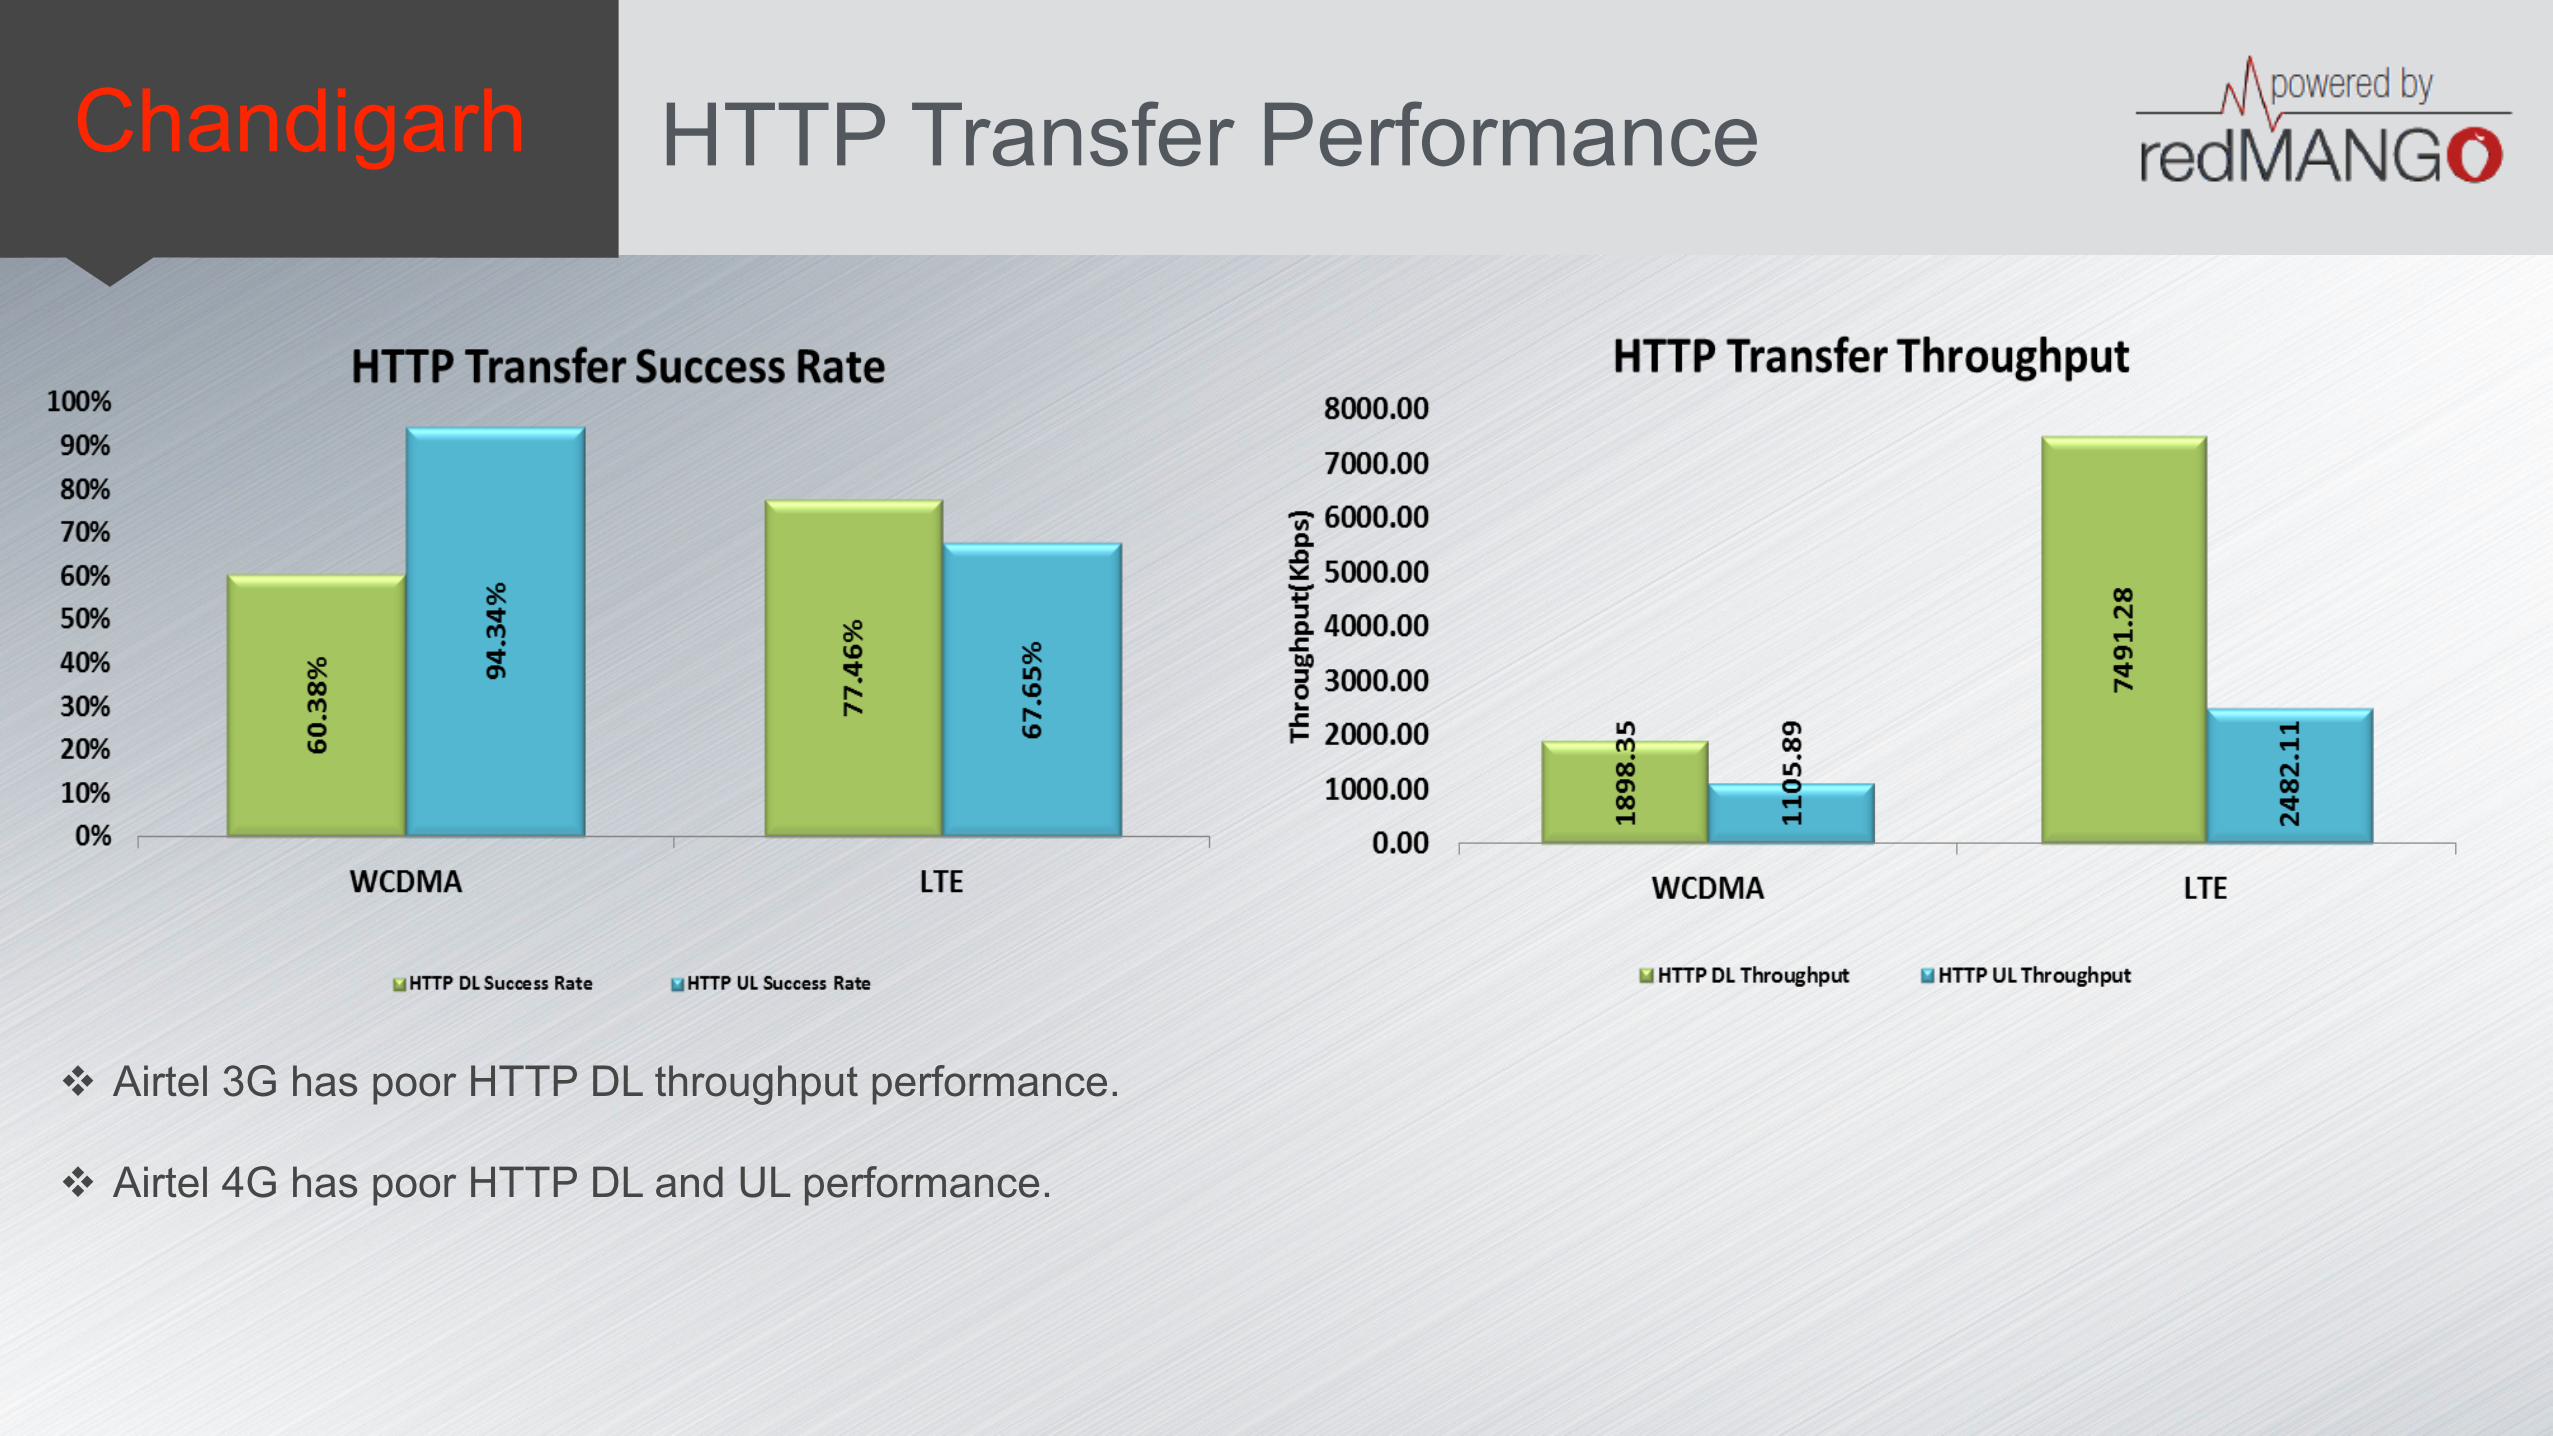
Chandigarh HTTP Transfer Performance
v Airtel 3G has poor HTTP DL throughput performance.
v Airtel 4G has poor HTTP DL and UL performance.
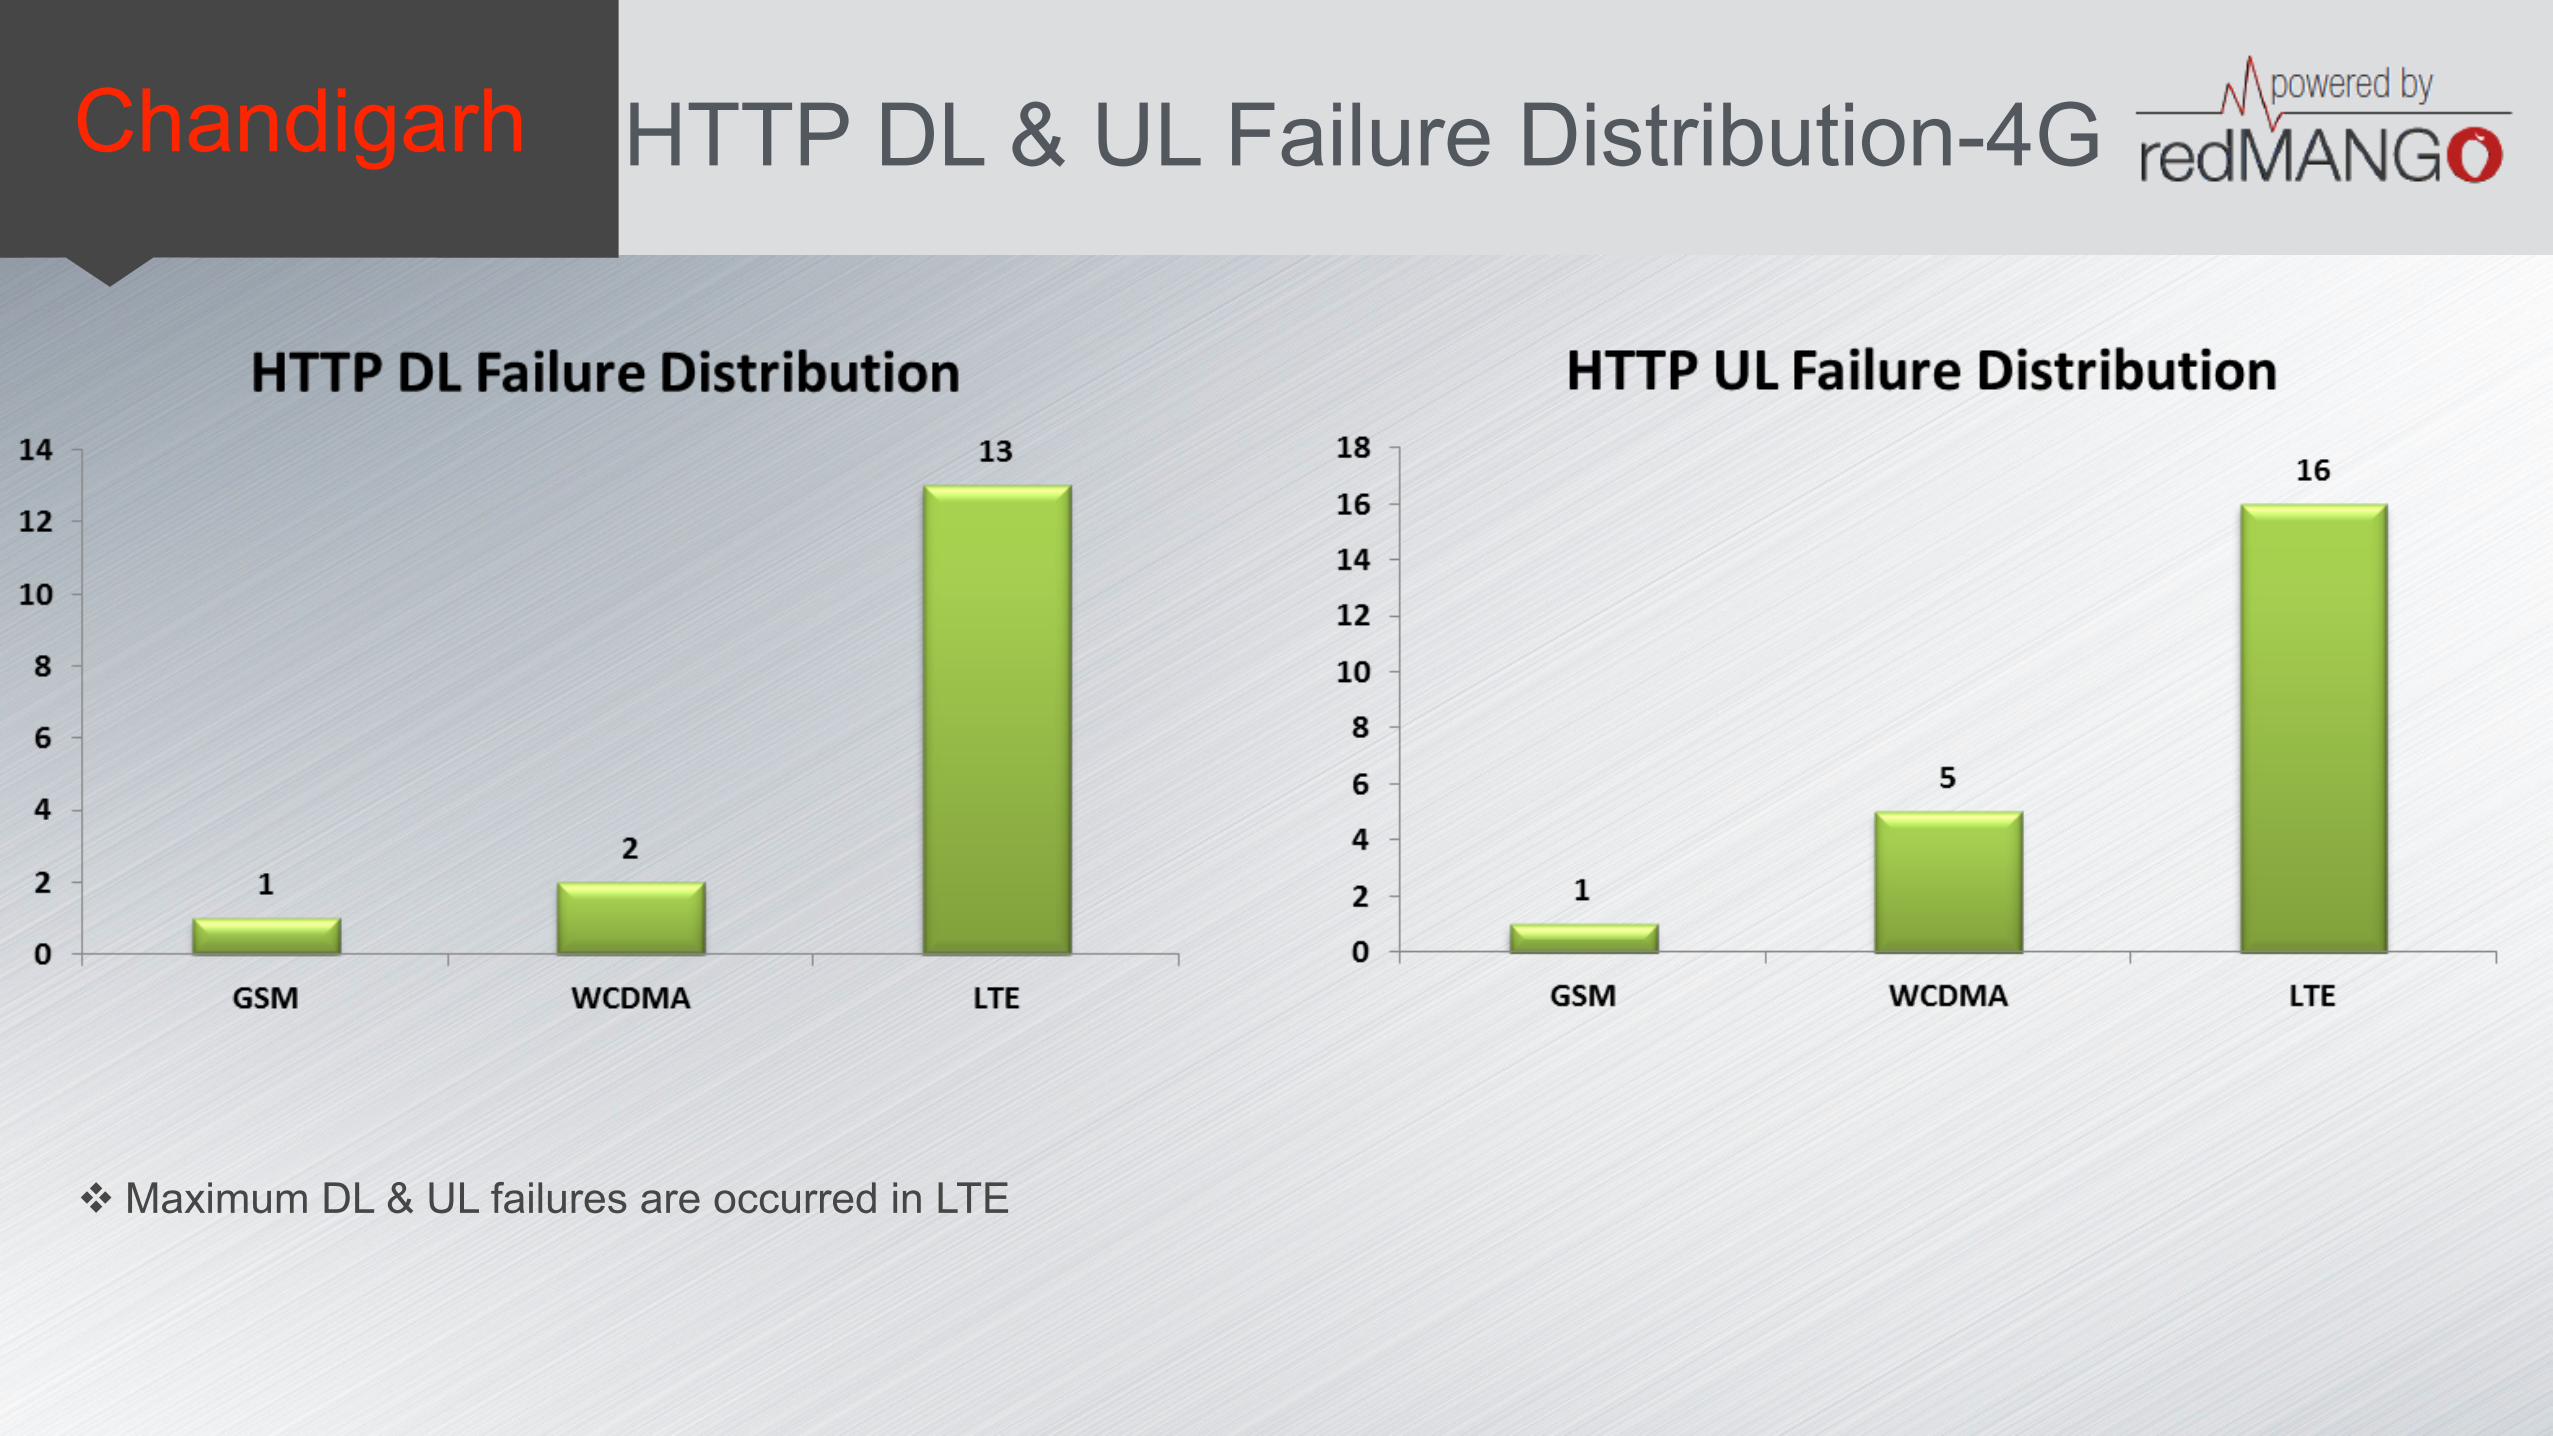
Chandigarh HTTP DL & UL Failure Distribution-4G
v Maximum DL & UL failures are occurred in LTE
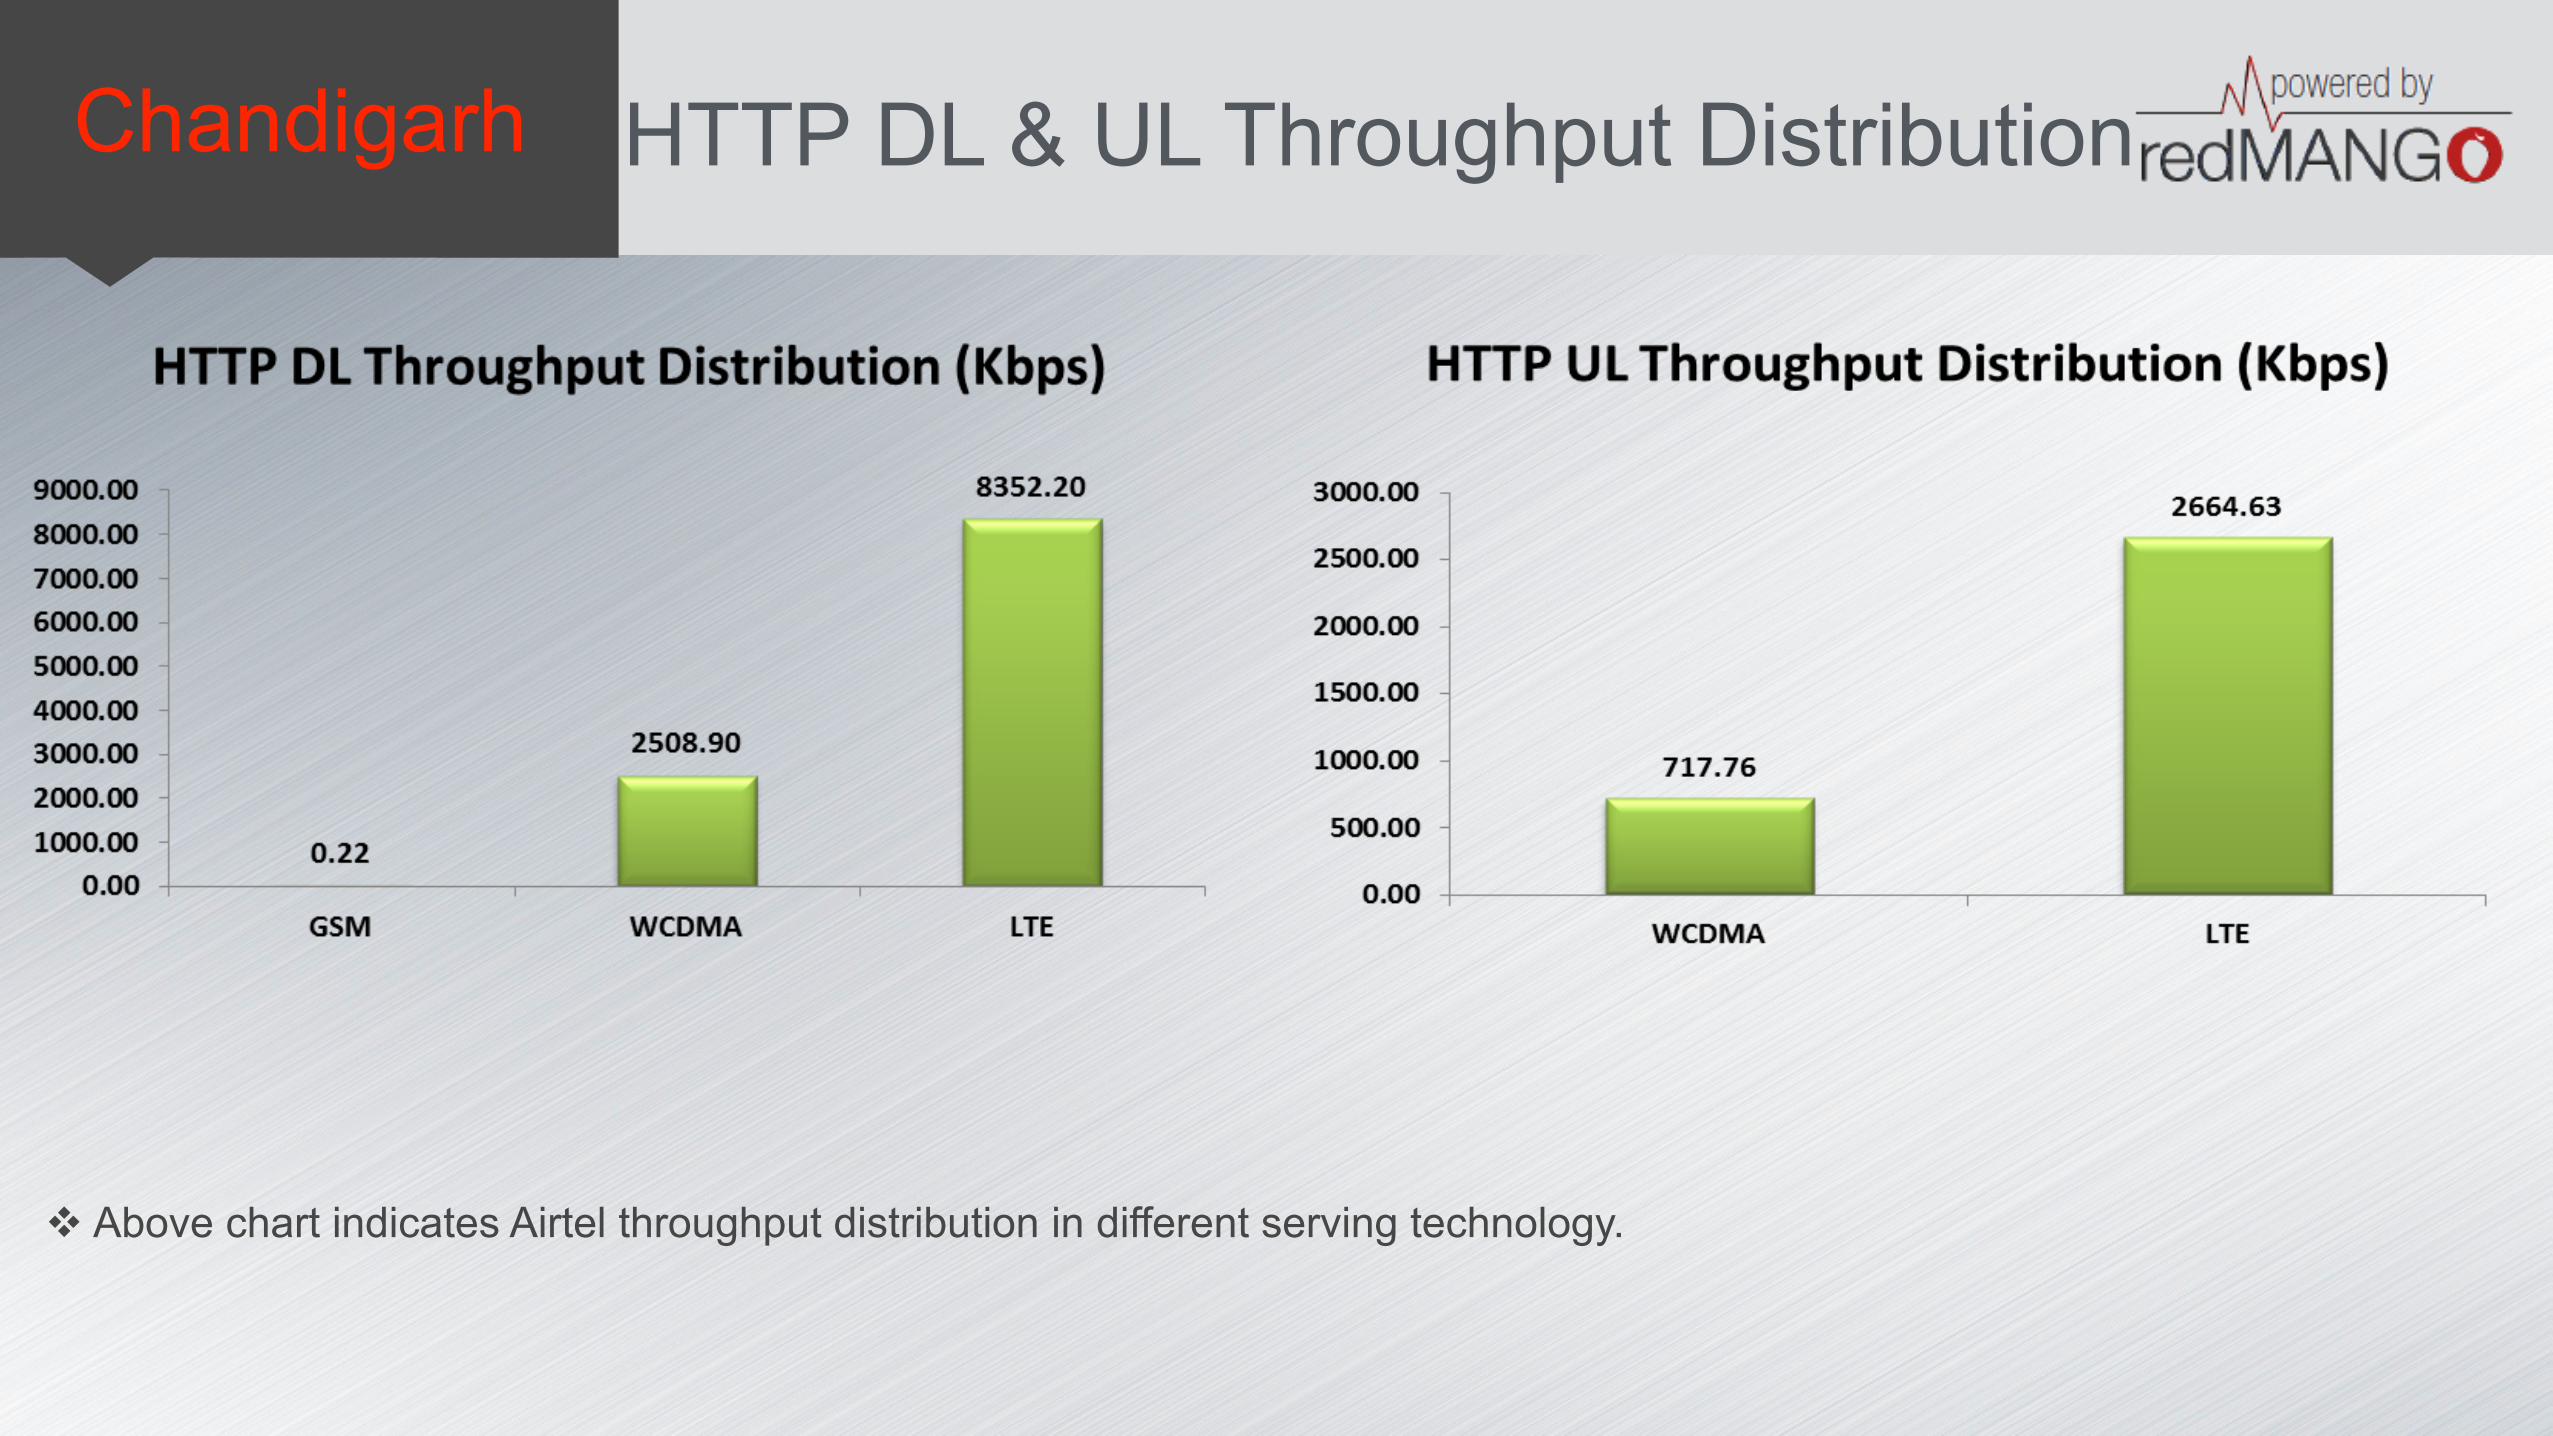
Chandigarh HTTP DL & UL Throughput Distribution
v Above chart indicates Airtel throughput distribution in different serving technology.