Embed Size (px)
Citation preview
REDD+ in landscapes: drivers of deforestation, institutions and jurisdictionsL Verchot Angelsen M Brockhaus N De Sy M Herold N
REDD+ Implementation and SFM Tokyo, 6-7 February 2014
L. Verchot, . Angelsen, M. Brockhaus, N. De Sy, M. Herold, N. Hosonuma, M. Kanninen, K. Korhonen-Kurki, A. Larson, A. Ravikumar, A. Wijaya
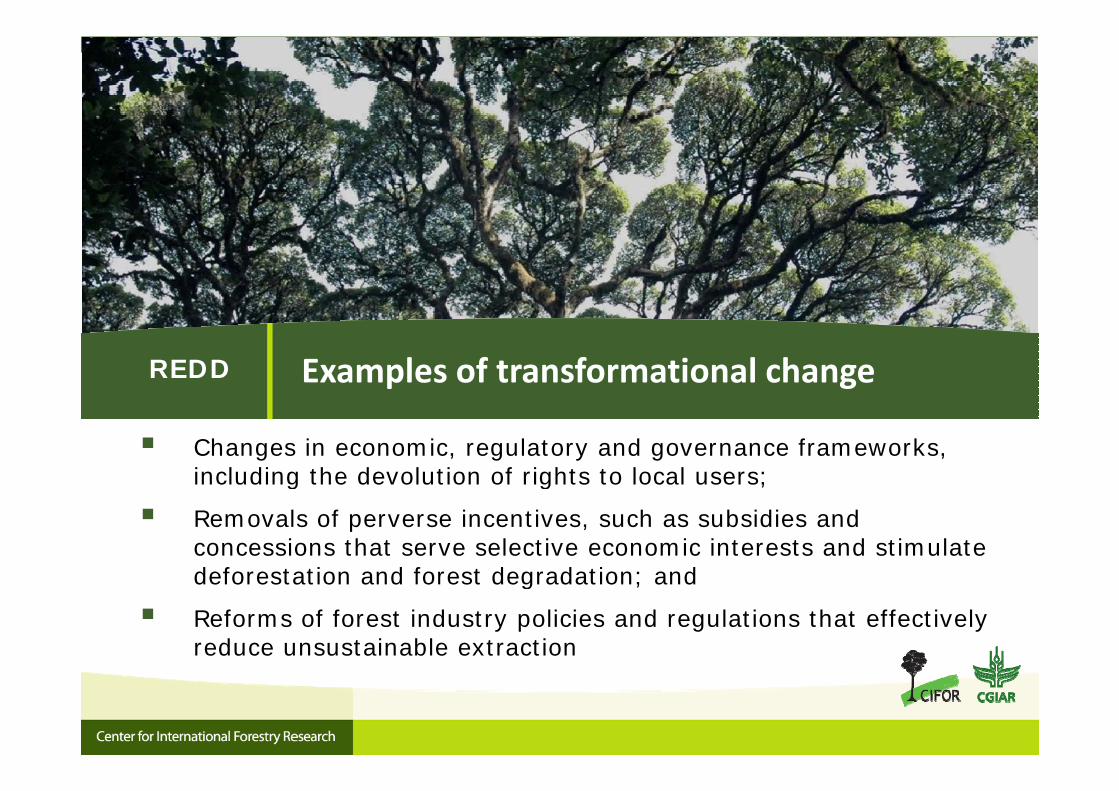
Examples of transformational change REDD
Changes in economic, regulatory and governance frameworks, including the devolution of rights to local users; g g ;
Removals of perverse incentives, such as subsidies and concessions that serve selective economic interests and stimulate deforestation and forest degradation; and deforestation and forest degradation; and
Reforms of forest industry policies and regulations that effectively reduce unsustainable extraction
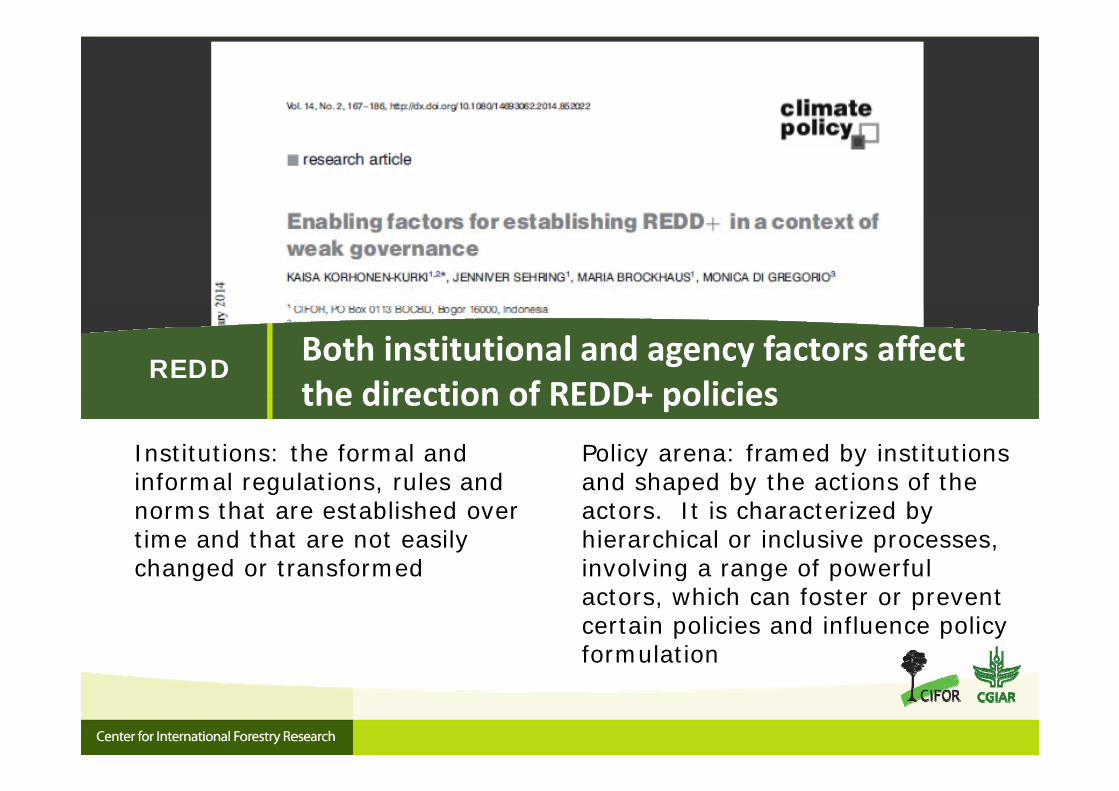
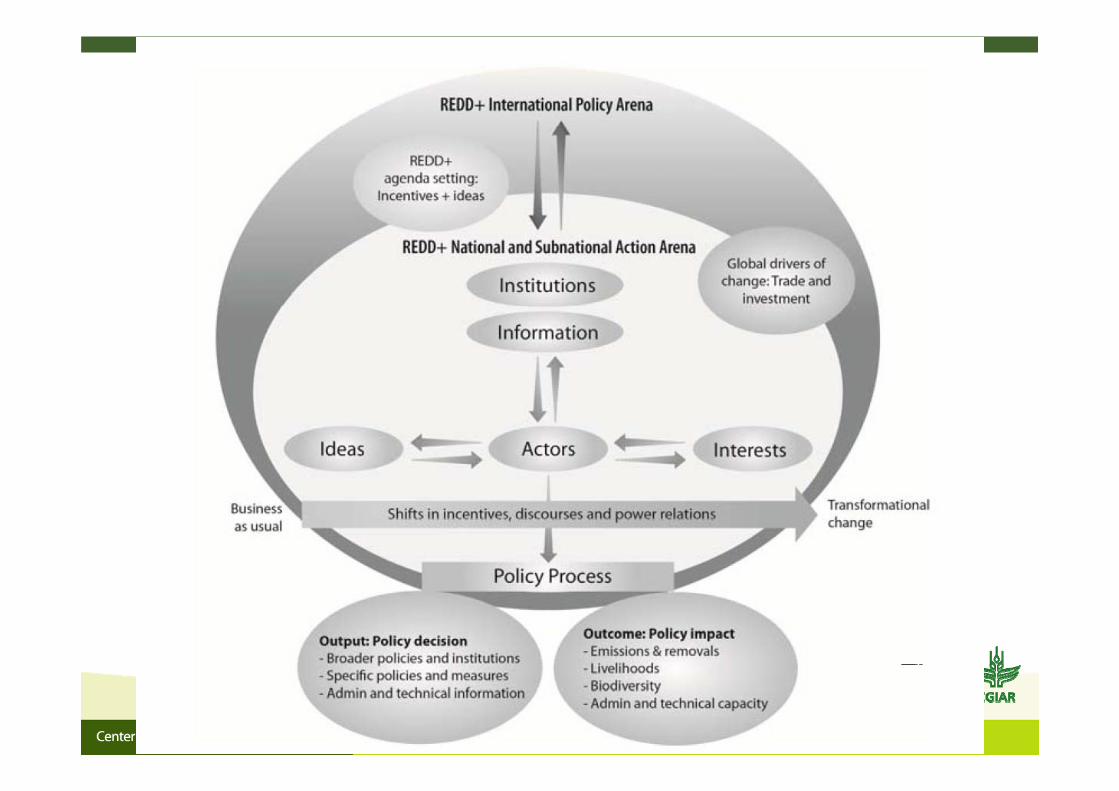
Both institutional and agency factors affect the direction of REDD+ policies
REDD
Institutions: the formal and informal regulations rules and
the direction of REDD+ policiesPolicy arena: framed by institutions and shaped by the actions of the informal regulations, rules and
norms that are established over time and that are not easily changed or transformed
and shaped by the actions of the actors. It is characterized by hierarchical or inclusive processes, involving a range of powerful changed or transformed involving a range of powerful actors, which can foster or prevent certain policies and influence policy formulation
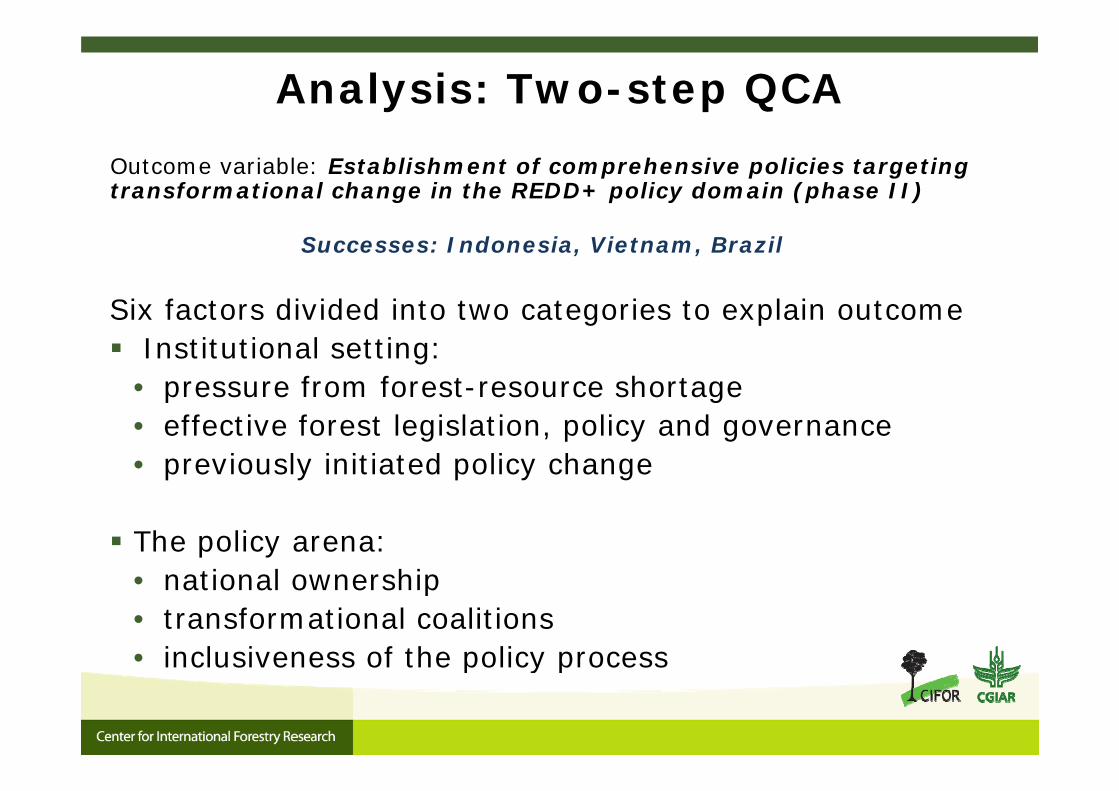
Analysis: Two-step QCAOutcome variable: Establishment of comprehensive policies targeting transformational change in the REDD+ policy domain (phase II)
Successes: Indonesia, Vietnam, Brazil
Six factors divided into two categories to explain outcome Six factors divided into two categories to explain outcome Institutional setting:
• pressure from forest-resource shortagepressure from forest resource shortage• effective forest legislation, policy and governance• previously initiated policy change
The policy arena: national ownership• national ownership
• transformational coalitions• inclusiveness of the policy processinclusiveness of the policy process
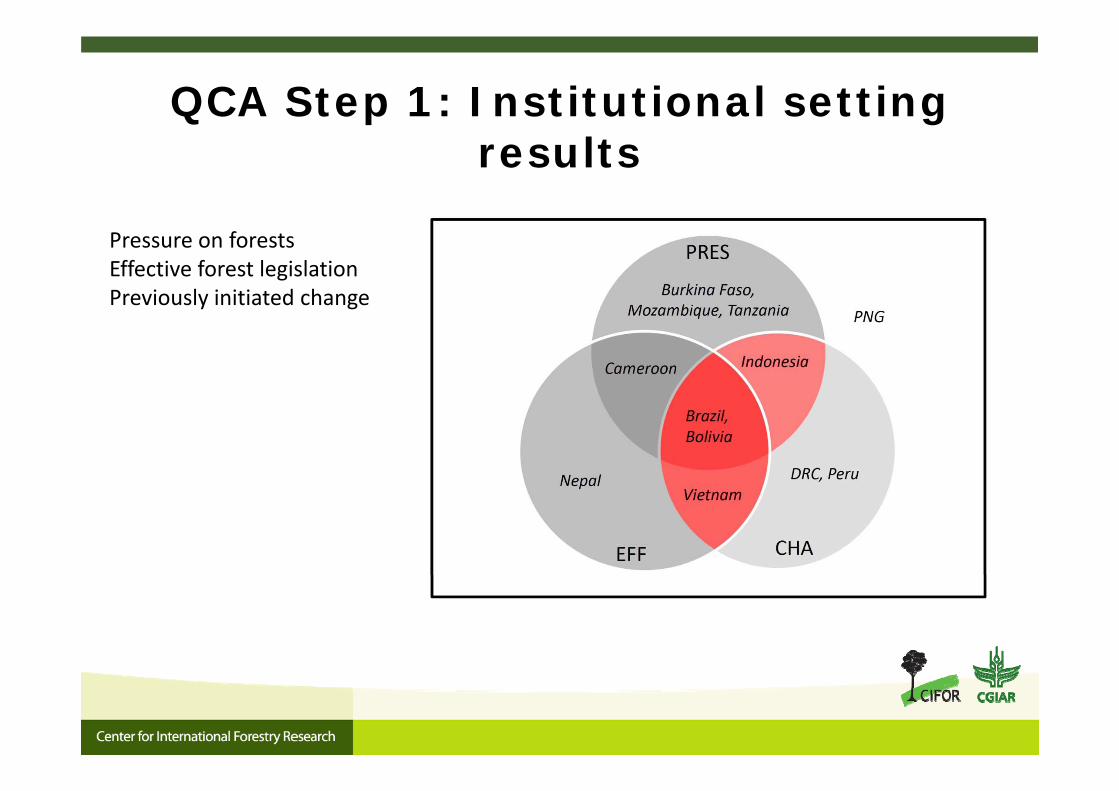
QCA Step 1: Institutional setting results
Pressure on forestsEffective forest legislationPreviously initiated changey g
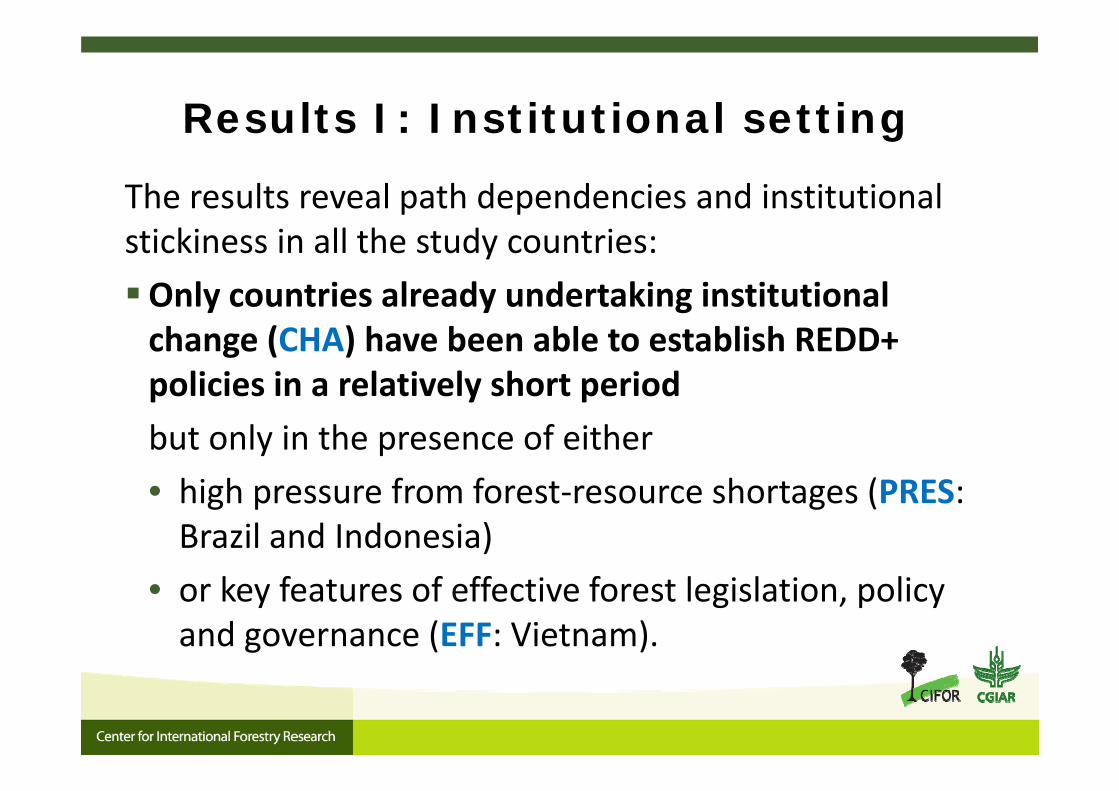
Results I: Institutional settingResults I: Institutional setting
The results reveal path dependencies and institutional stickiness in all the study countries:Only countries already undertaking institutionalOnly countries already undertaking institutional change (CHA) have been able to establish REDD+ policies in a relatively short periodpolicies in a relatively short periodbut only in the presence of either hi h f f t h t (PRES• high pressure from forest‐resource shortages (PRES: Brazil and Indonesia)
• or key features of effective forest legislation, policy and governance (EFF: Vietnam).
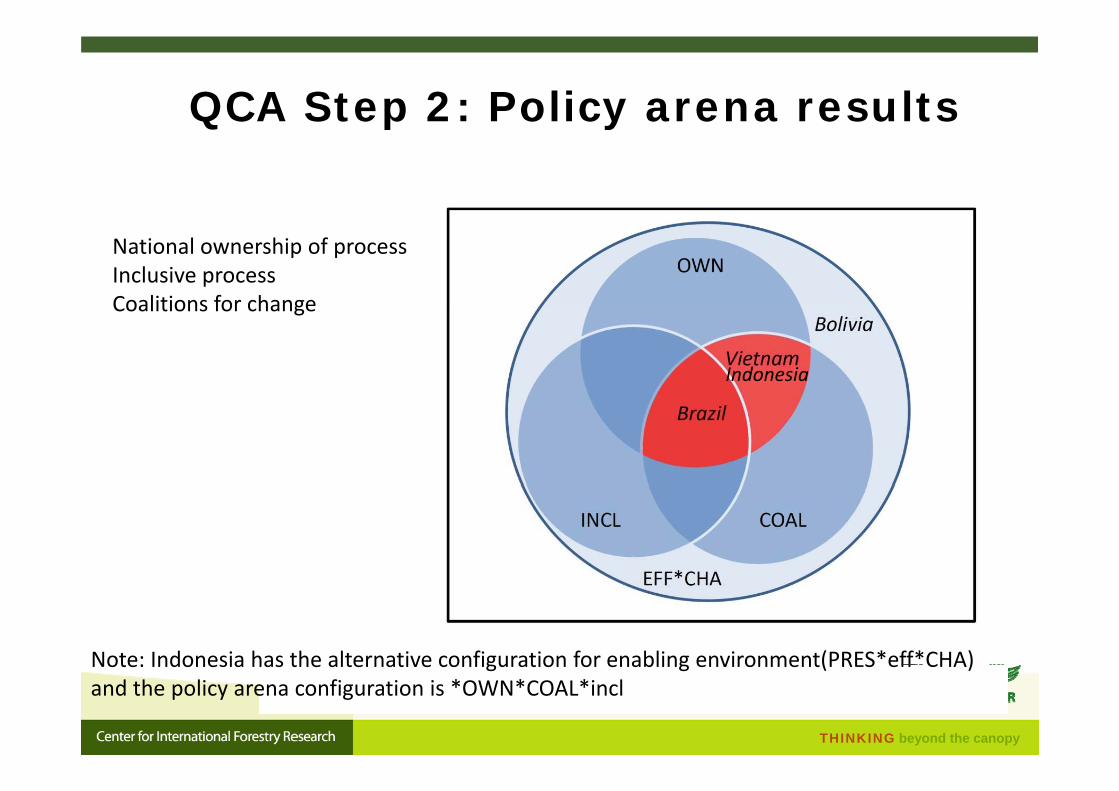
QCA Step 2: Policy arena resultsQ p y
National ownership of processInclusive processCoalitions for change
Indonesia
Coalitions for change
Note: Indonesia has the alternative configuration for enabling environment(PRES*eff*CHA)
THINKING beyond the canopy
Note: Indonesia has the alternative configuration for enabling environment(PRES eff CHA) and the policy arena configuration is *OWN*COAL*incl
Results II: Policy arena
Where an enabling institutional setting is in place (EFF*CHA or PRES*eff*CHA), two conditions of the policy arena proved to be crucial for all three successful countries (Brazil, Vietnam and Indonesia):
National ownership (OWN) Transformational coalitions (COAL)
Countries that have these two conditions of the policy arena, but not the enabling institutional setting (e g Peru and but not the enabling institutional setting (e.g. Peru and Mozambique), were not successful in establishing REDD+ yet.
The country with enabling policy conditions, but neither national ownership nor coalitions for transformation (Bolivia) was unsuccessfulwas unsuccessful
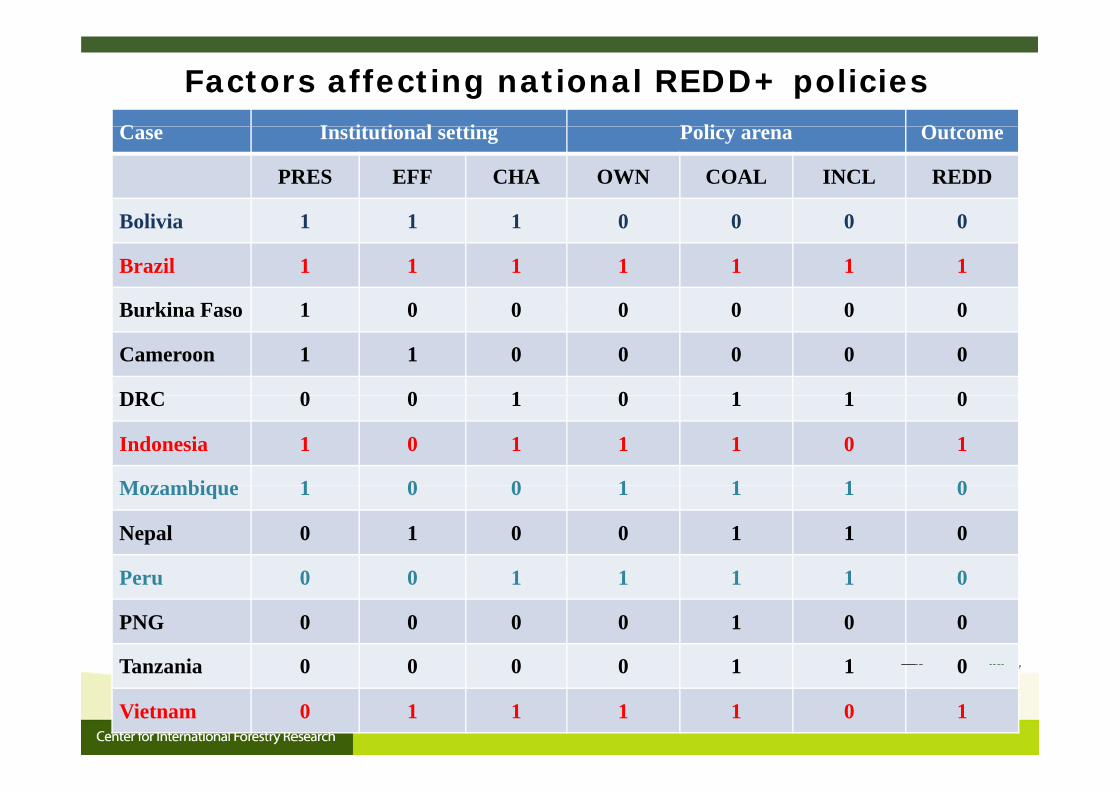
Factors affecting national REDD+ policiesC I tit ti l tti P li O tCase Institutional setting Policy arena Outcome
PRES EFF CHA OWN COAL INCL REDD
B li i 1 1 1 0 0 0 0Bolivia 1 1 1 0 0 0 0
Brazil 1 1 1 1 1 1 1
B ki F 1 0 0 0 0 0 0Burkina Faso 1 0 0 0 0 0 0
Cameroon 1 1 0 0 0 0 0
DRC 0 0 1 0 1 1 0DRC 0 0 1 0 1 1 0
Indonesia 1 0 1 1 1 0 1
Mozambique 1 0 0 1 1 1 0Mozambique 1 0 0 1 1 1 0
Nepal 0 1 0 0 1 1 0
Peru 0 0 1 1 1 1 0Peru 0 0 1 1 1 1 0
PNG 0 0 0 0 1 0 0
Tanzania 0 0 0 0 1 1 0Tanzania 0 0 0 0 1 1 0
Vietnam 0 1 1 1 1 0 1
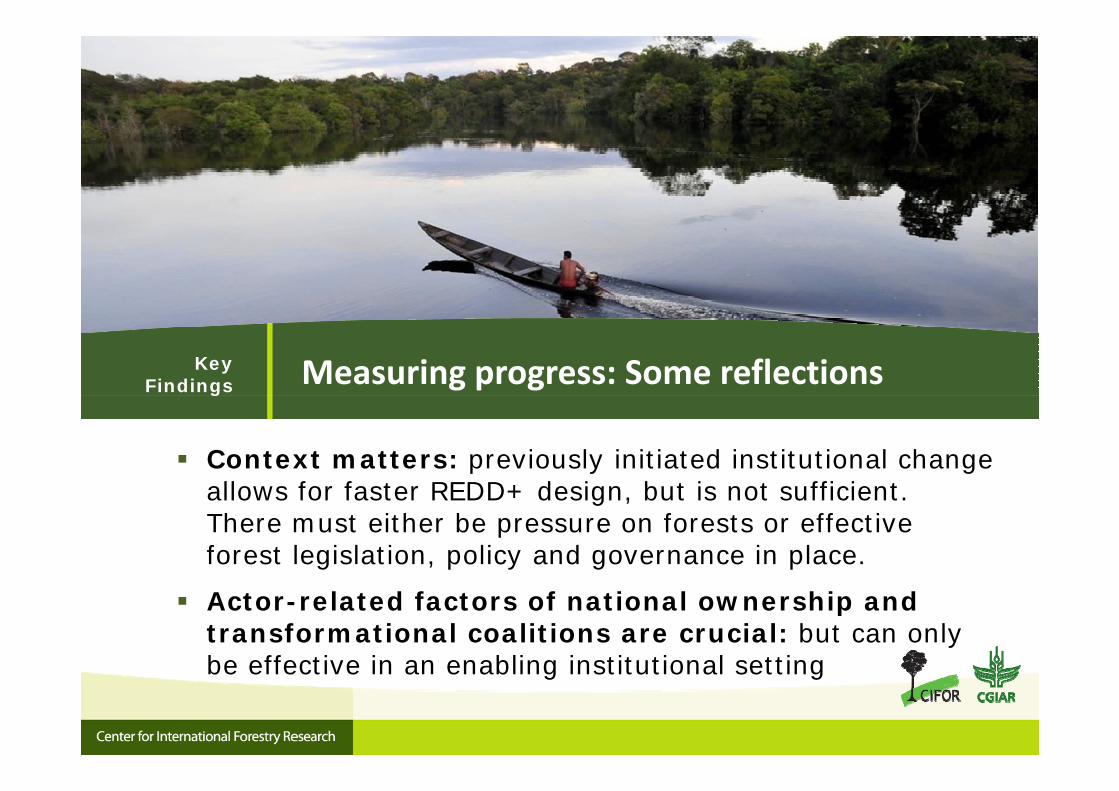
Measuring progress: Some reflectionsKey Findings
Context matters: previously initiated institutional change ll f f t REDD+ d i b t i t ffi i t
g
allows for faster REDD+ design, but is not sufficient. There must either be pressure on forests or effective forest legislation, policy and governance in place.
Actor-related factors of national ownership and transformational coalitions are crucial: but can only be effective in an enabling institutional settingbe effective in an enabling institutional setting
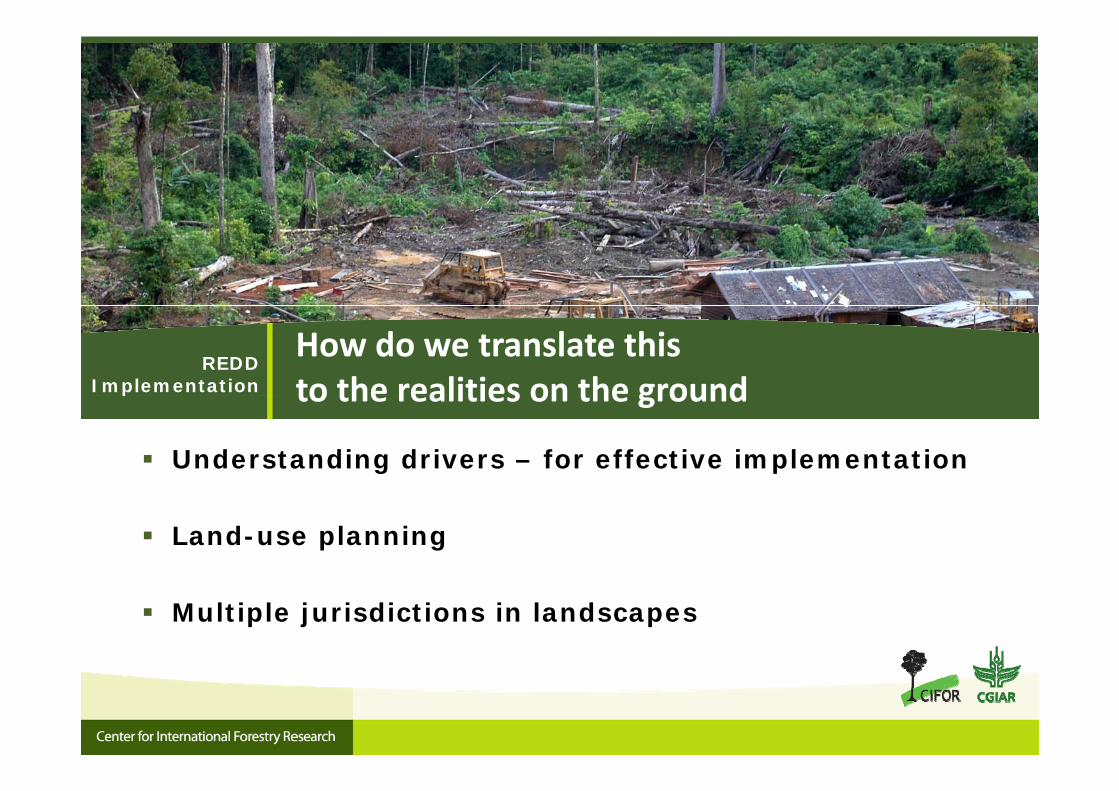
How do we translate this to the realities on the ground
REDDImplementation
Understanding drivers – for effective implementation
to the realities on the groundp
Land-use planning
Multiple jurisdictions in landscapes
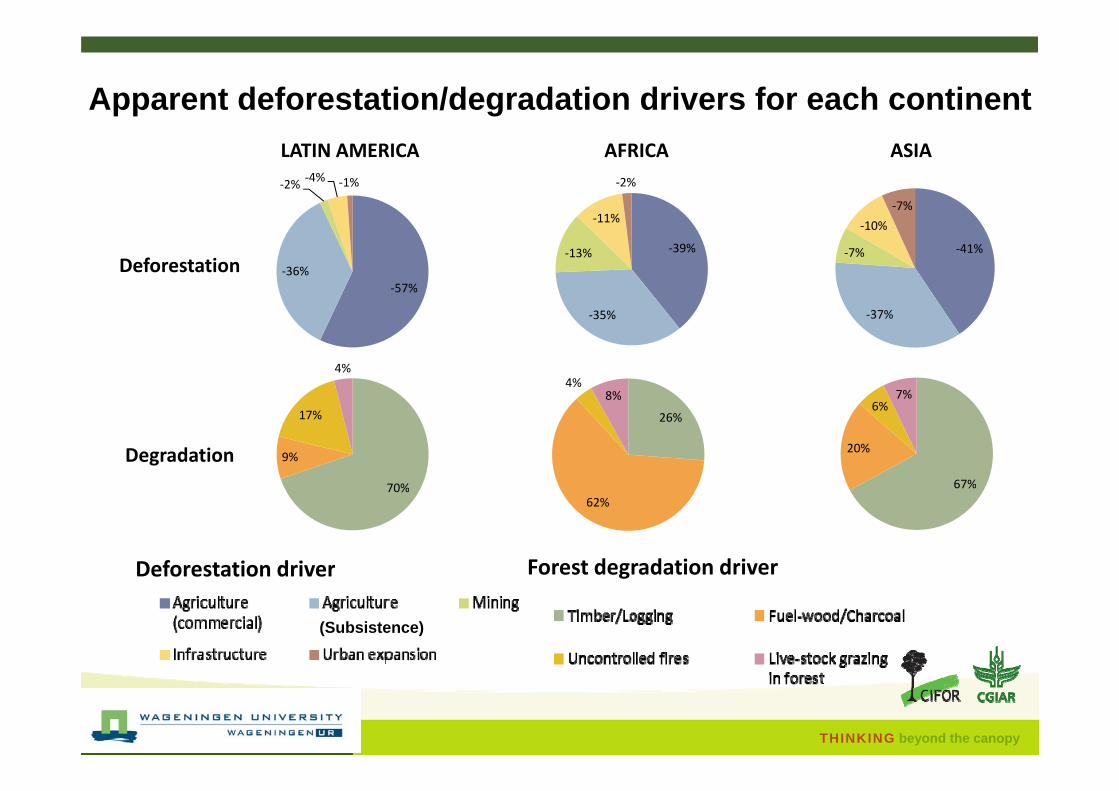
Apparent deforestation/degradation drivers for each continent
11%
‐2%‐2% ‐4% ‐1%
‐7%
LATIN AMERICA AFRICA ASIA
‐39%‐13%
‐11%
‐57%‐36%
‐41%‐7%
‐10%
Deforestation
‐35% ‐37%
4%8%
4%
7%
26%
8%
70%
9%
17%
67%
20%
6%7%
Degradation
Forest degradation driver
62%70% 67%
Deforestation driver gDeforestation driver
(Subsistence)
THINKING beyond the canopy
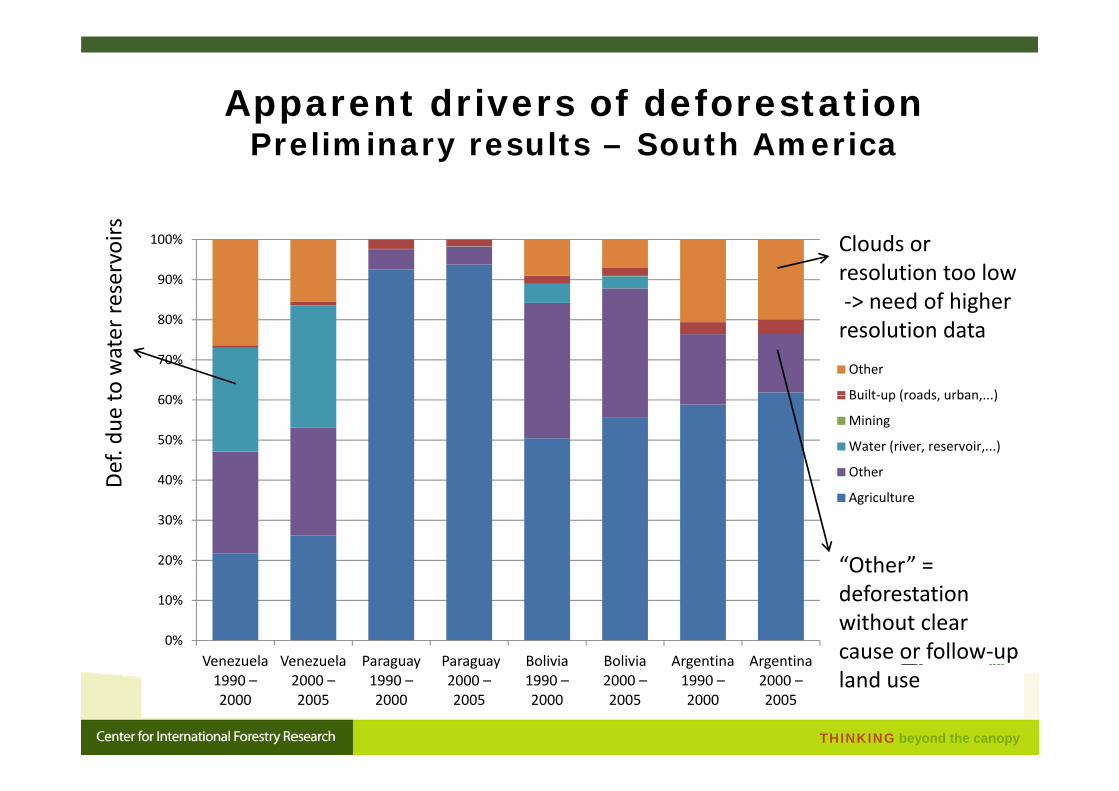
Apparent drivers of deforestationPreliminary results – South America
90%
100% Clouds or resolution too low‐> need of higheres
ervoirs
60%
70%
80%
Other
Built‐up (roads urban )
> need of higher resolution data
to water r
40%
50%
60% Built‐up (roads, urban,...)
Mining
Water (river, reservoir,...)
OtherDef. du
e t
20%
30%Agriculture
“Other” =
D
0%
10%
Venezuela Venezuela Paraguay Paraguay Bolivia Bolivia Argentina Argentina
deforestation without clear cause or follow‐up
THINKING beyond the canopy
Venezuela 1990 –2000
Venezuela 2000 –2005
Paraguay 1990 –2000
Paraguay 2000 –2005
Bolivia 1990 –2000
Bolivia 2000 –2005
Argentina 1990 –2000
Argentina 2000 –2005
land use
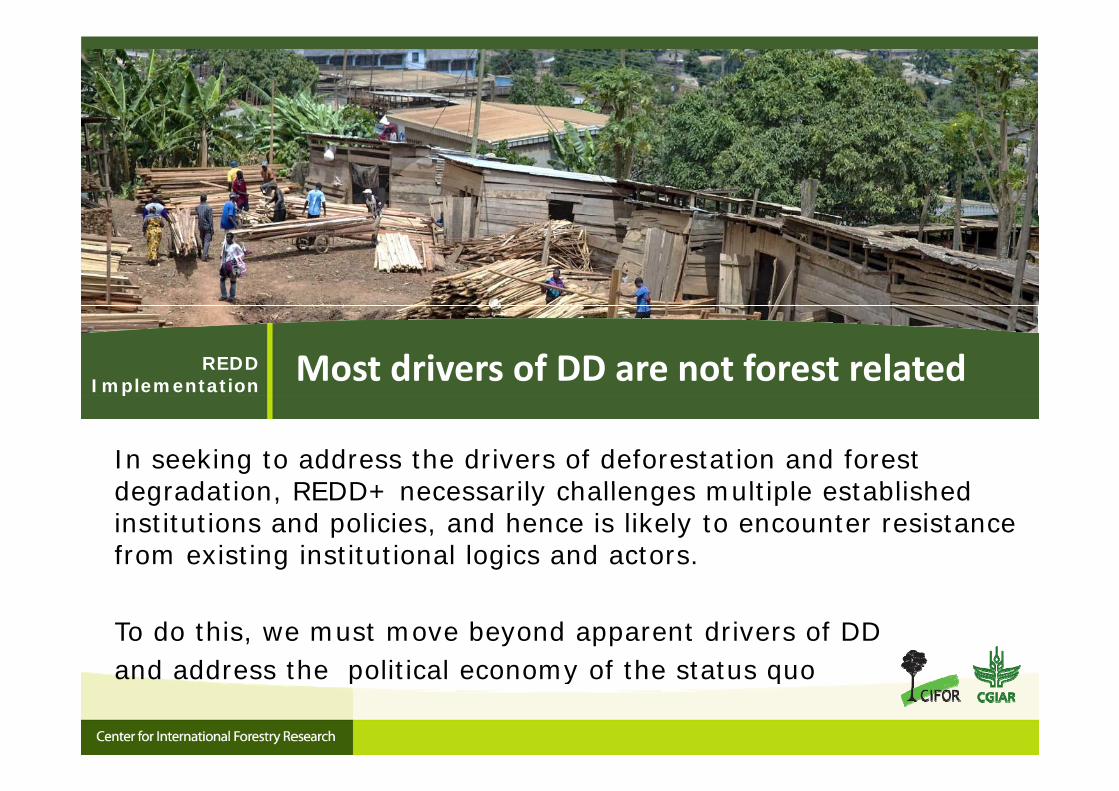
Most drivers of DD are not forest relatedREDDImplementation
In seeking to address the drivers of deforestation and forest d d ti REDD+ il h ll lti l t bli h d
p
degradation, REDD+ necessarily challenges multiple established institutions and policies, and hence is likely to encounter resistance from existing institutional logics and actors.
To do this, we must move beyond apparent drivers of DD and address the political economy of the status quoand address the political economy of the status quo
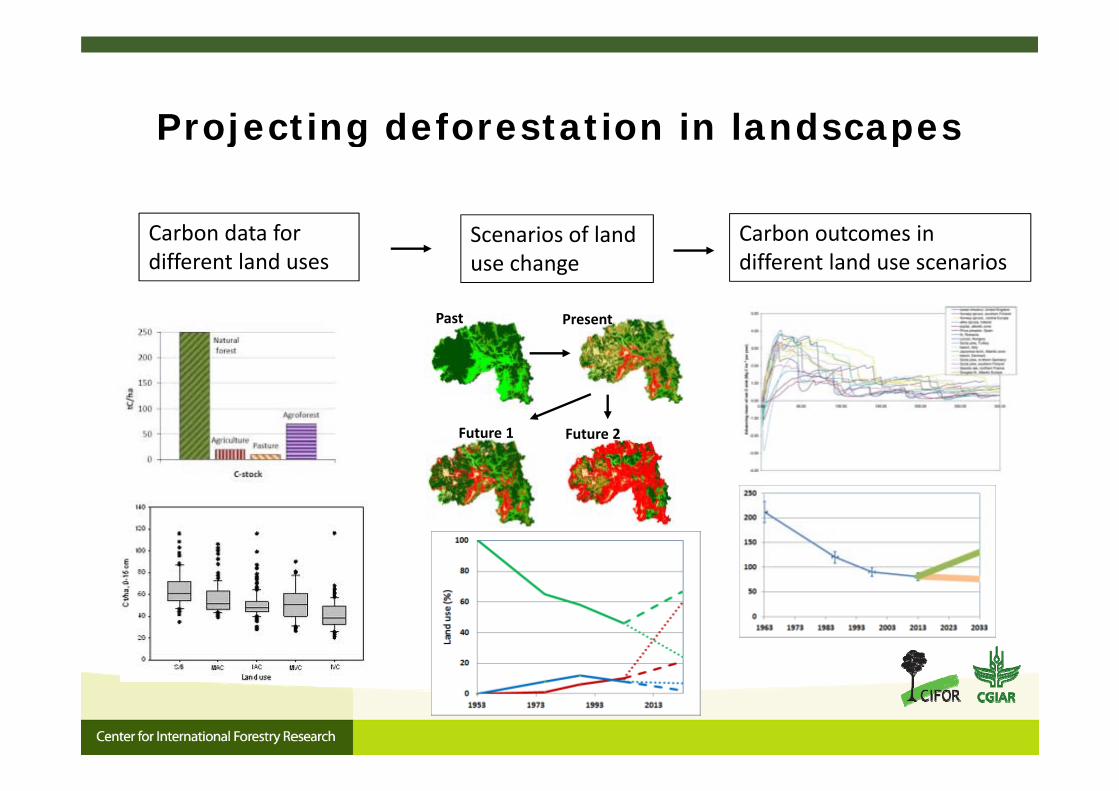
Projecting deforestation in landscapesProjecting deforestation in landscapes
Carbon data for different land uses
Scenarios of land use change
Carbon outcomes in different land use scenarios
Past Present
Future 1 Future 2
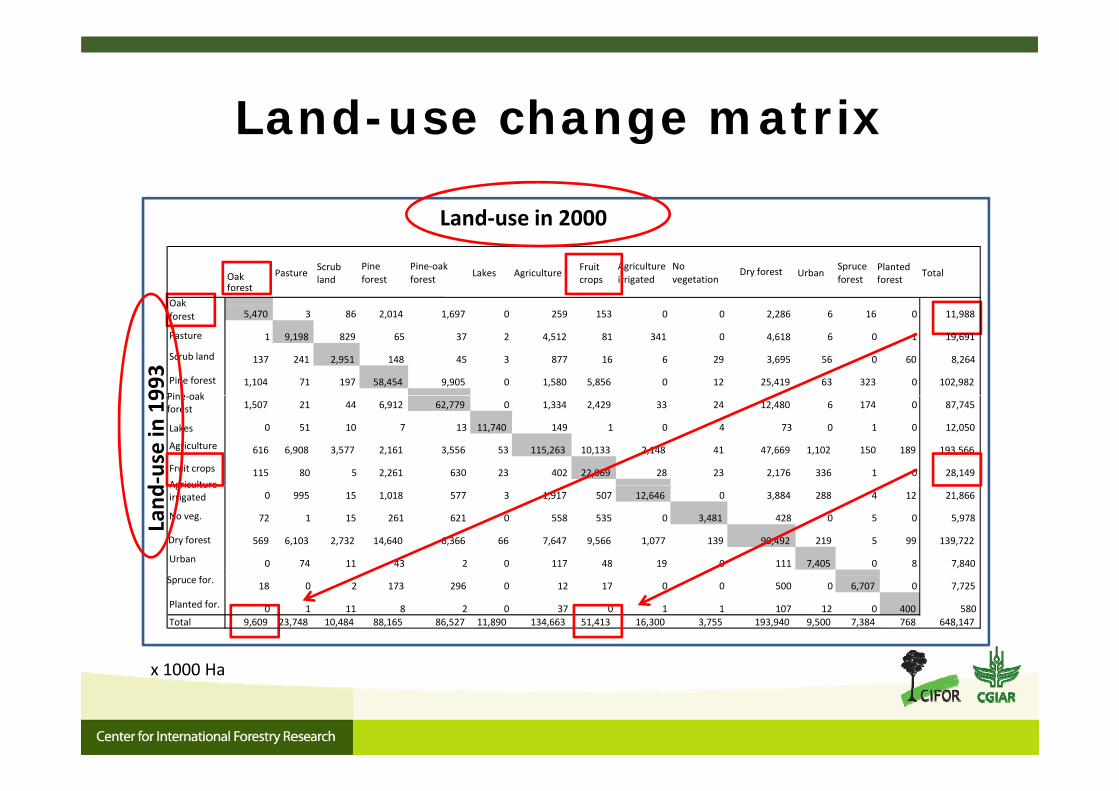
Land-use change matrixLand use change matrix
Land use in 2000Land‐use in 2000
Oak forest
Pasture Scrub land
Pine forest
Pine‐oak forest Lakes Agriculture Fruit
cropsAgriculture irrigated
Novegetation
Dry forest UrbanSpruceforest
Plantedforest Total
Oak
993
Oak forest 5,470 3 86 2,014 1,697 0 259 153 0 0 2,286 6 16 0 11,988
Pasture 1 9,198 829 65 37 2 4,512 81 341 0 4,618 6 0 1 19,691
Scrub land 137 241 2,951 148 45 3 877 16 6 29 3,695 56 0 60 8,264
Pine forest 1,104 71 197 58,454 9,905 0 1,580 5,856 0 12 25,419 63 323 0 102,982Pine oak
‐use in
19 Pine‐oak
forest 1,507 21 44 6,912 62,779 0 1,334 2,429 33 24 12,480 6 174 0 87,745
Lakes 0 51 10 7 13 11,740 149 1 0 4 73 0 1 0 12,050
Agriculture 616 6,908 3,577 2,161 3,556 53 115,263 10,133 2,148 41 47,669 1,102 150 189 193,566
Fruit crops 115 80 5 2,261 630 23 402 22,069 28 23 2,176 336 1 0 28,149Agriculture
Land
Agricultureirrigated 0 995 15 1,018 577 3 1,917 507 12,646 0 3,884 288 4 12 21,866
No veg. 72 1 15 261 621 0 558 535 0 3,481 428 0 5 0 5,978
Dry forest 569 6,103 2,732 14,640 6,366 66 7,647 9,566 1,077 139 90,492 219 5 99 139,722
Urban 0 74 11 43 2 0 117 48 19 0 111 7,405 0 8 7,840Spruce for. 18 0 2 173 296 0 12 17 0 0 500 0 6,707 0 7,725
Planted for. 0 1 11 8 2 0 37 0 1 1 107 12 0 400 580Total 9,609 23,748 10,484 88,165 86,527 11,890 134,663 51,413 16,300 3,755 193,940 9,500 7,384 768 648,147
1000 Hx 1000 Ha
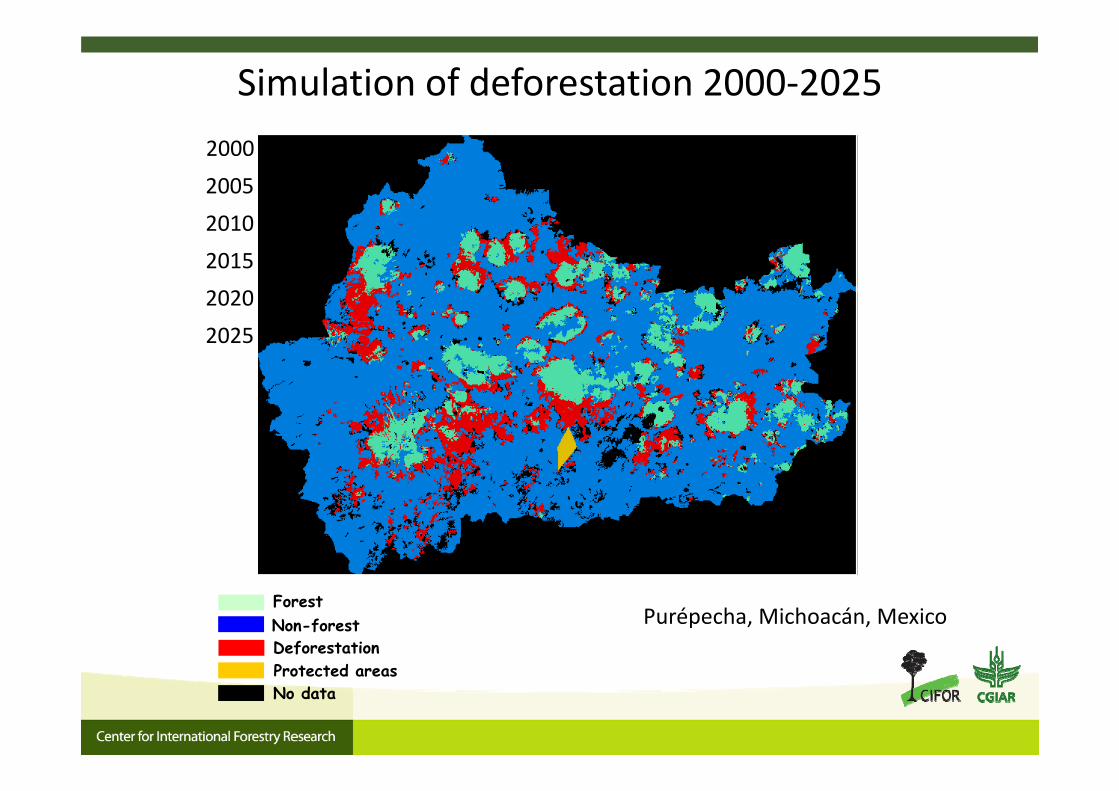
Simulation of deforestation 2000‐20252000
2005
20102010
20152020
2025
Non-forestForest
DeforestationP d
Purépecha, Michoacán, Mexico
Protected areas No data
approx. 600 000 ha.
Source: Adapted from Google Maps Inc., 2013
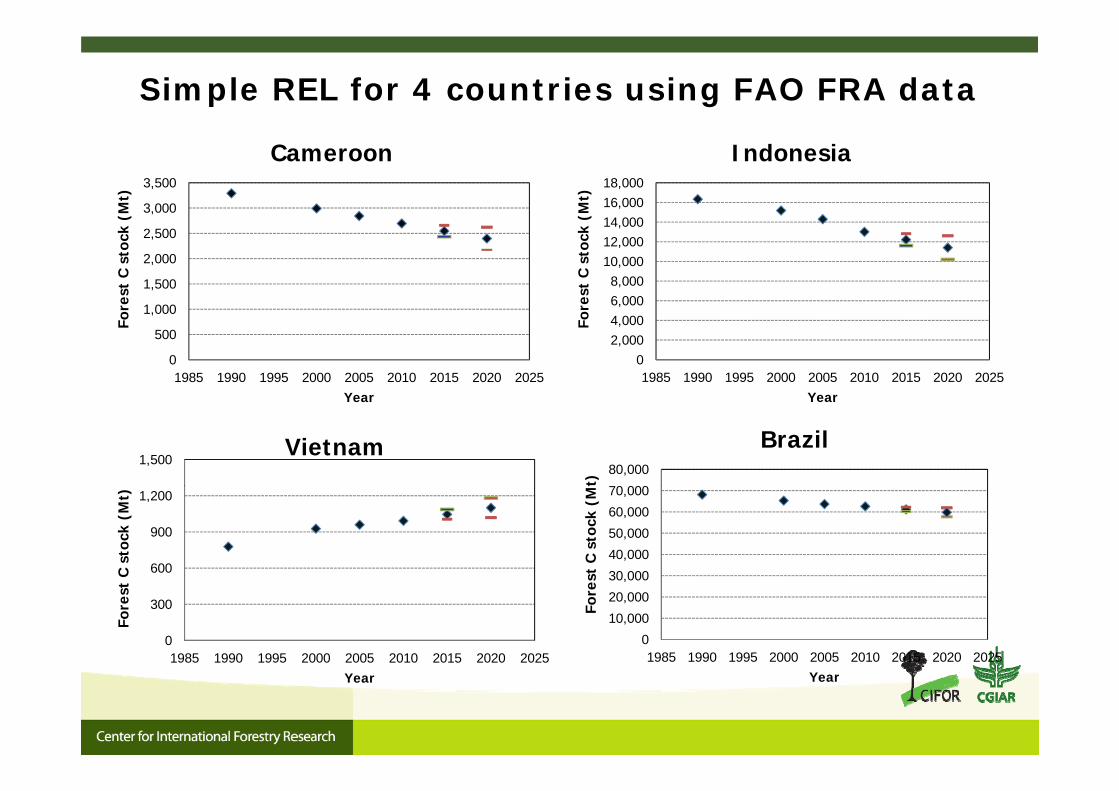
Simple REL for 4 countries using FAO FRA data
3,000
3,500
(Mt)
Cameroon
16,00018,000
(Mt)
Indonesia
1 000
1,500
2,000
2,500
rest
C s
tock
(
6,0008,000
10,00012,00014,000
rest
C s
tock
(
0
500
1,000
1985 1990 1995 2000 2005 2010 2015 2020 2025
For
Year
02,0004,000,
1985 1990 1995 2000 2005 2010 2015 2020 2025
For
YearYear Year
1,500Vietnam
0 000
80,000
t)
Brazil
600
900
1,200
C s
tock
(M
t)
30 000
40,000
50,000
60,000
70,000
st C
sto
ck (
Mt
0
300
1985 1990 1995 2000 2005 2010 2015 2020 2025
Fore
st C
0
10,000
20,000
30,000
1985 1990 1995 2000 2005 2010 2015 2020 2025
Fore
s
Year Year
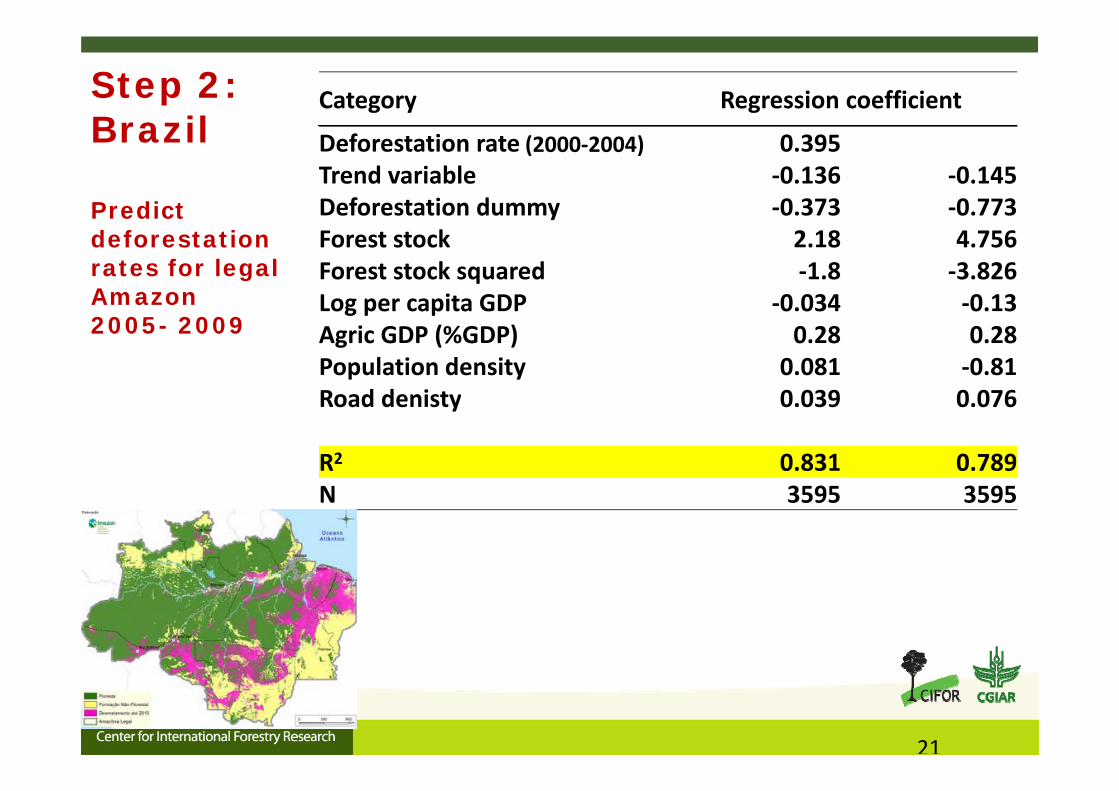
Step 2: Brazil
Category Regression coefficientBrazil
Predict
Deforestation rate (2000‐2004) 0.395Trend variable ‐0.136 ‐0.145Deforestation dummy ‐0.373 ‐0.773Predict
deforestation rates for legal Amazon
yForest stock 2.18 4.756Forest stock squared ‐1.8 ‐3.826Log per capita GDP ‐0 034 ‐0 13
2005- 2009Log per capita GDP ‐0.034 ‐0.13Agric GDP (%GDP) 0.28 0.28Population density 0.081 ‐0.81Road denisty 0 039 0 076Road denisty 0.039 0.076
R2 0.831 0.789N 3595 3595
21
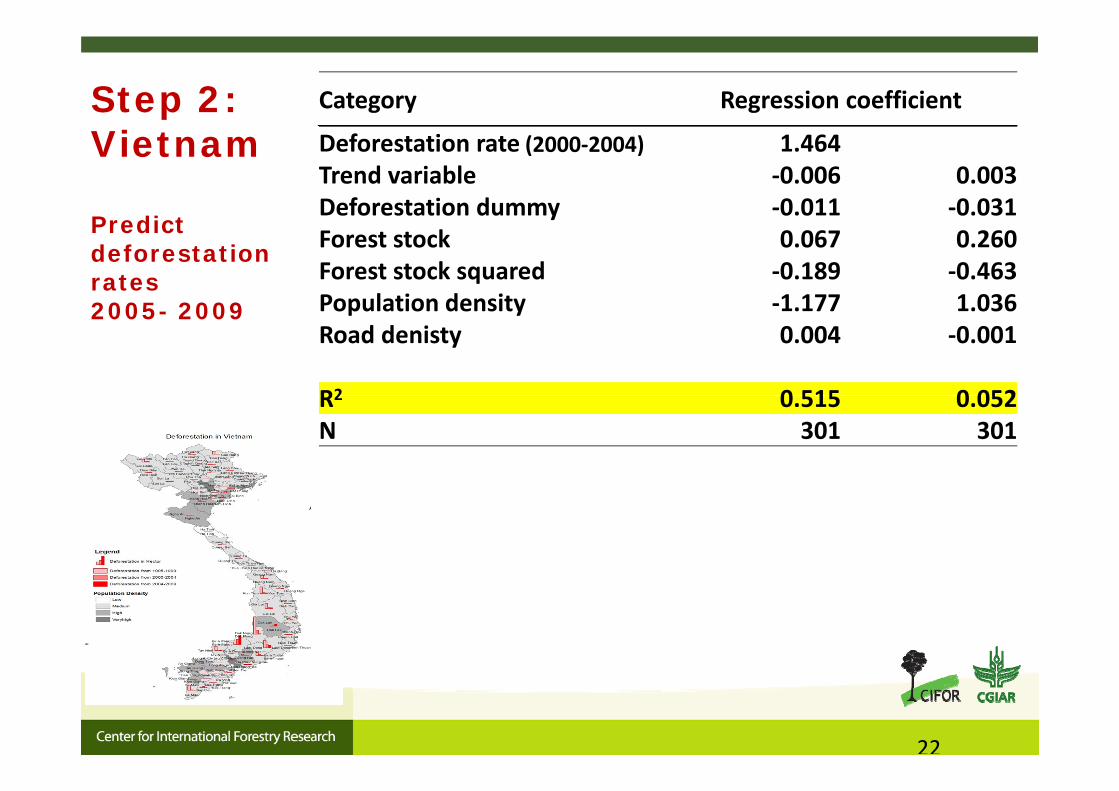
Step 2: Category Regression coefficient
Vietnam
P di
Deforestation rate (2000‐2004) 1.464Trend variable ‐0.006 0.003Deforestation dummy ‐0.011 ‐0.031
Predict deforestation rates 2005 2009
yForest stock 0.067 0.260Forest stock squared ‐0.189 ‐0.463Population density ‐1 177 1 0362005- 2009 Population density ‐1.177 1.036Road denisty 0.004 ‐0.001
R2 0 515 0 052R2 0.515 0.052N 301 301
22
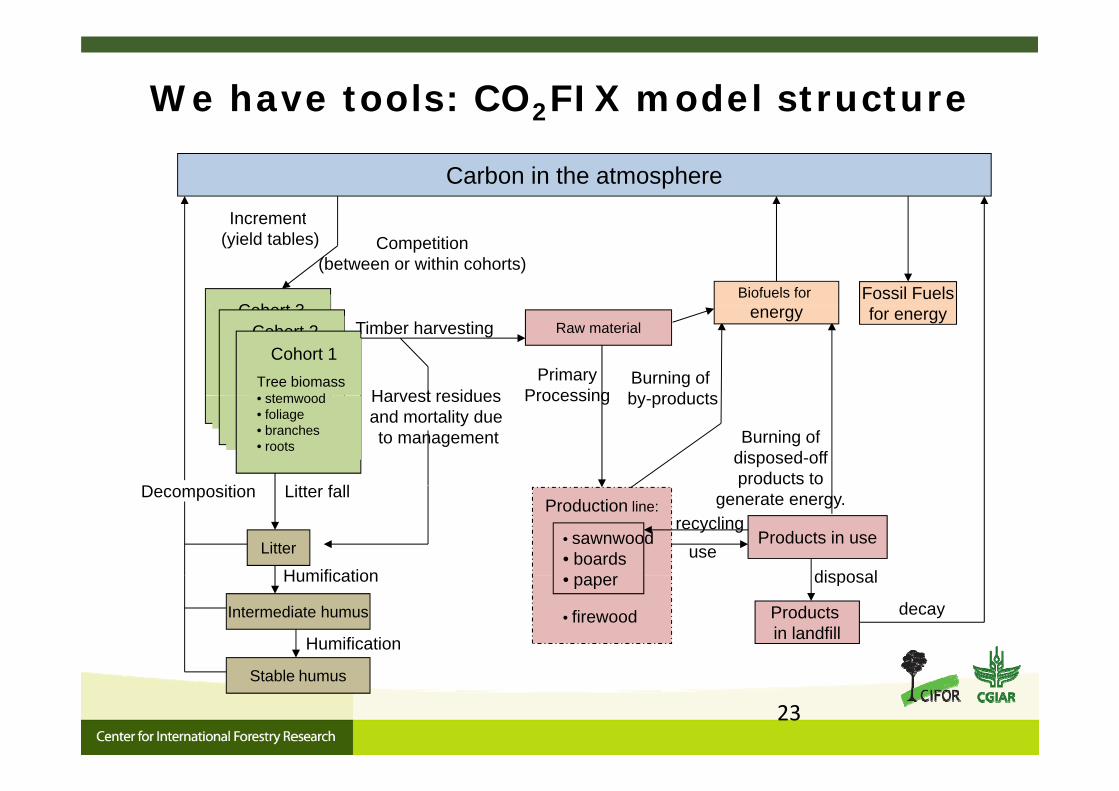
We have tools: CO2FIX model structure
Carbon in the atmosphere
Increment
C h t 3
Competition(between or within cohorts)
Increment(yield tables)
Biofuels for Fossil FuelsCohort 3
Tree biomass
• stemwood
• foliage
Raw material
Burning of by products
PrimaryProcessingHarvest residues
Timber harvestingCohort 2Tree biomass
• stemwood
Cohort 1Tree biomass
t d
energy for energy
D iti
• branches
• roots
by-productsProcessingHarvest residues and mortality due to management
Litt f ll
• foliage
• branches
• roots
• stemwood• foliage• branches• roots Burning of
disposed-offproducts to
Decomposition
• sawnwood• boardsLitter Products in use
Humification disposaluse
recycling
Litter fallProduction line:
pgenerate energy.
• paper
Products in landfill
Humification
decay
disposal
• firewoodIntermediate humus
Humification
23
Stable humus
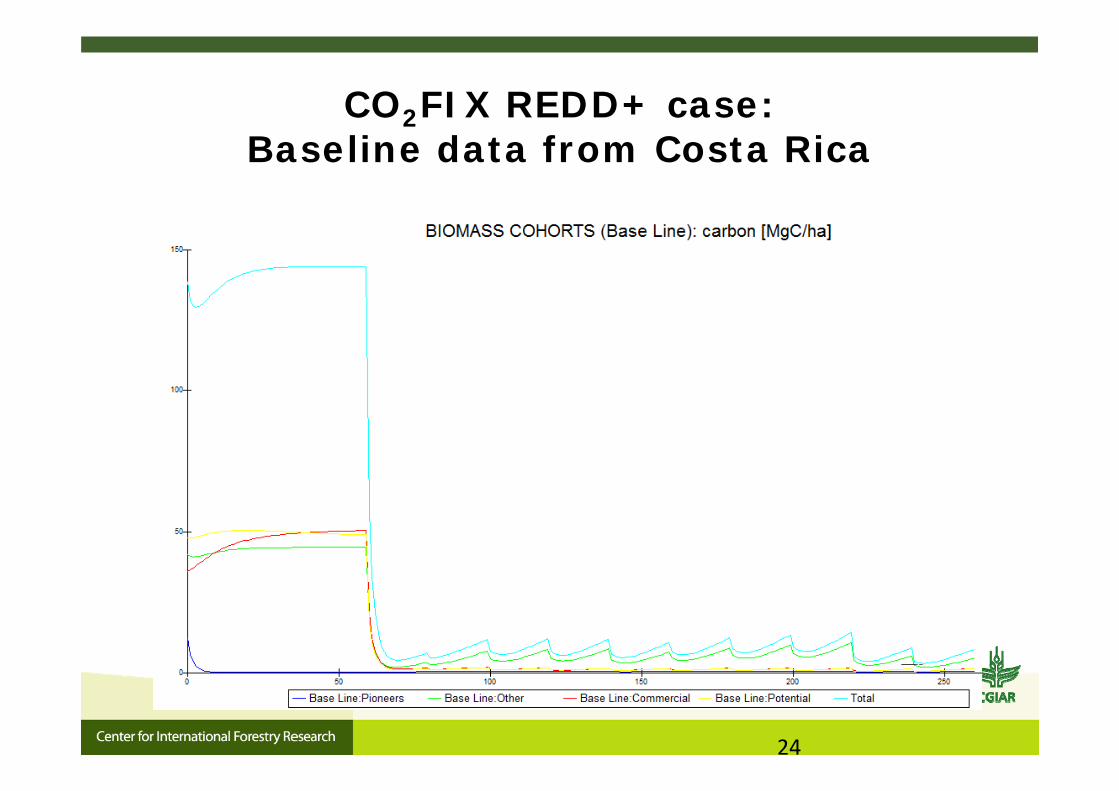
CO2FIX REDD+ case: 2Baseline data from Costa Rica
24
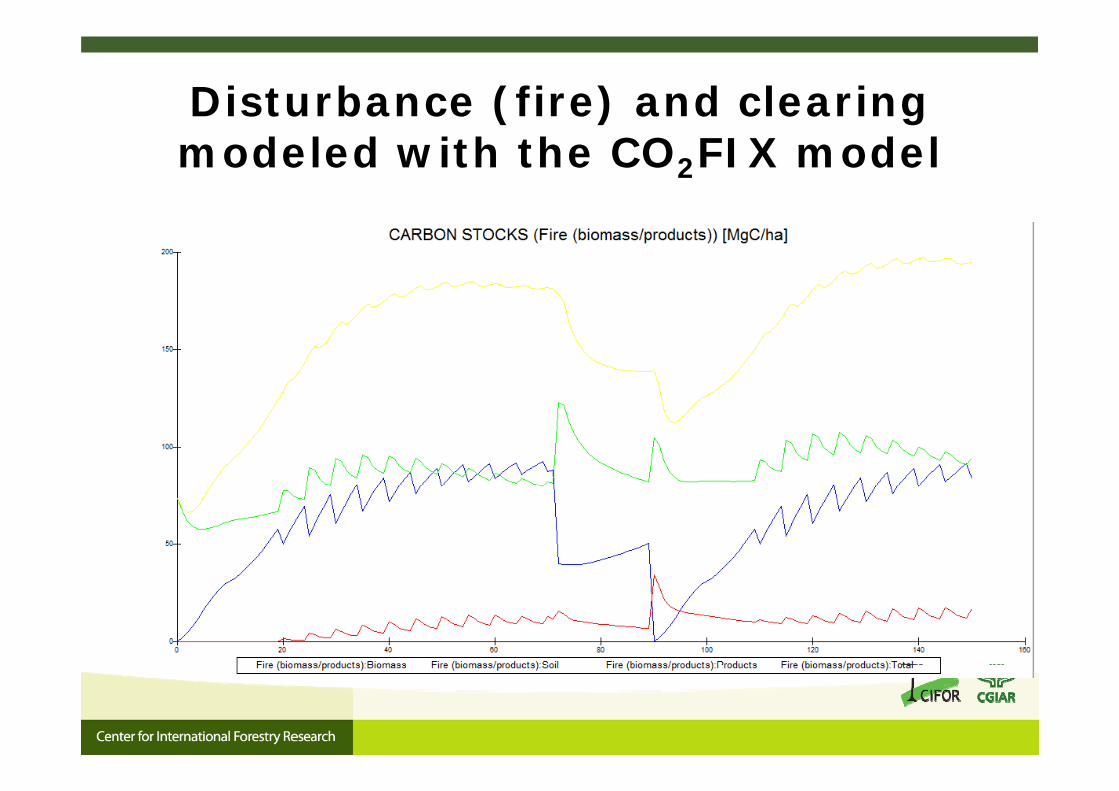
Disturbance (fire) and clearing modeled with the CO2FIX model
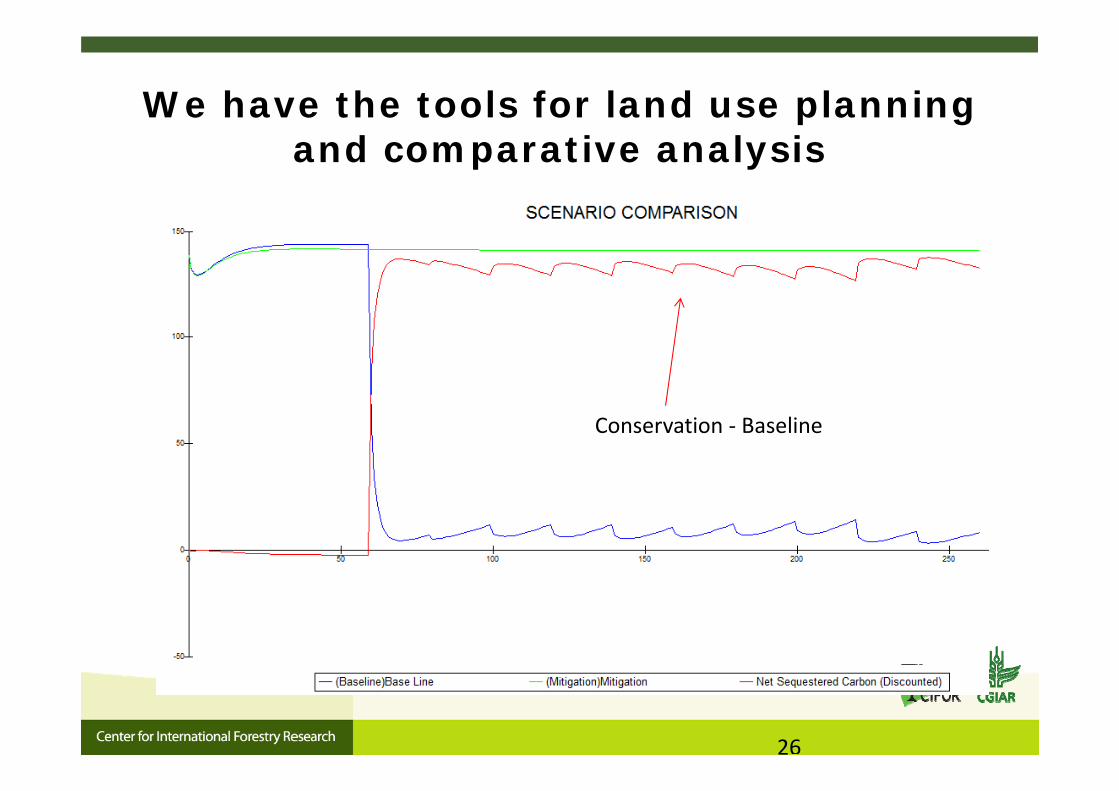
We have the tools for land use planning and comparative analysis
Conservation ‐ Baseline
26
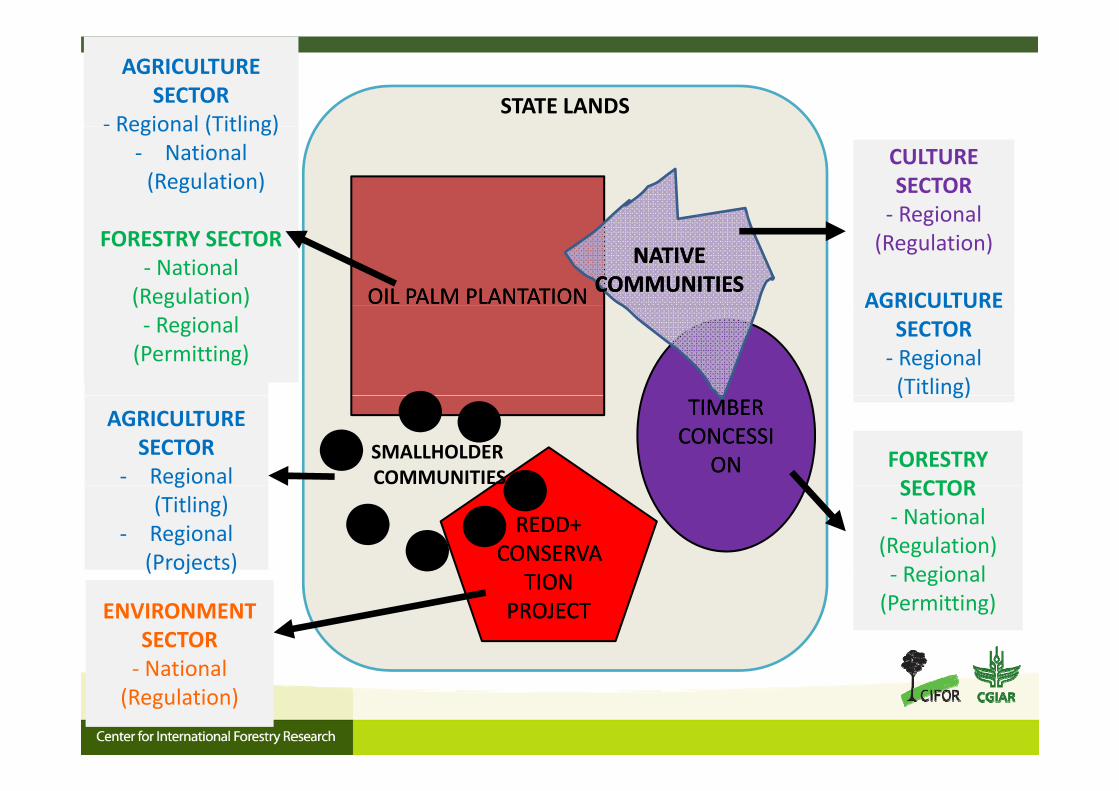
STATE LANDS
AGRICULTURE SECTOR
‐ Regional (Titling)Regional (Titling)‐ National (Regulation)
CULTURE SECTOR ‐ Regional
OIL PALM PLANTATIONOIL PALM PLANTATION
NATIVENATIVECOMMUNITIESCOMMUNITIES
FORESTRY SECTOR‐ National (Regulation)
‐ Regional(Regulation)
AGRICULTURE( g )‐ Regional (Permitting)
AGRICULTURE SECTOR‐ Regional (Titling)
TIMBER TIMBER CONCESSICONCESSI
ONONSMALLHOLDER COMMUNITIES
FORESTRY SECTOR
( g)AGRICULTURE
SECTOR‐ Regional
REDD+ REDD+ CONSERVACONSERVA
TIONTION
SECTOR‐ National (Regulation)‐ Regional
g(Titling)
‐ Regional (Projects)
TION TION PROJECTPROJECTENVIRONMENT
SECTORNational
‐ Regional (Permitting)
‐ National (Regulation)
Further reading:Masera, O.R., et al. 2003. Modeling carbon sequestration in afforestation, agroforestry and
fforest management projects. Ecological Modelling 164, 177‐199.Brown, S., et al. 2007. Baselines for land‐use change in the tropics: application to avoided
deforestation projects. MITI 12, 1001‐1026.Hosonuma, N., et al. 2012. An assessment of deforestation and forest degradation drivers
in developing countries. Environ. Res. Lett. 7 p.12Herold M et al 2012 A step‐wise framework for setting REDD+ forest referenceHerold, M., et al. 2012. A step wise framework for setting REDD+ forest reference
emission levels and forest reference levels. CIFOR Info Brief No. 52. CIFOR.Romijn, E., et al. 2013. Different forest definitions and their impact on developing REDD+
reference emission levels: a case study for Indonesia Environ Sci &Policy 33:246 250reference emission levels: a case study for Indonesia. Environ.Sci. &Policy 33:246‐250.Angelsen, A., et al. 2013. Testing methodologies for REDD+: Deforestation drivers, costs
and reference levels. Technical Report, UK Department of Energy and Climate Change, L d UK 138London, UK. pp. 138.
Korhonen‐Kurki, K, et al. 2014. Enabling factors for establishing REDD+ in a context of weak governance. Climate Policy. In press, available online.