Embed Size (px)
Citation preview

Proc. Natl. Acad. Sci. USAVol. 77, No. 11, pp. 6371-6375, November 1980Biochemistry
Redox conformation changes in refined tuna cytochrome c(x-ray diffraction/electron transfer mechanism/protein conformation changes/buried water molecule/heme motion in protein)
TSUNEHIRO TAKANO AND RICHARD E. DICKERSONNorman W. Church Laboratory of Chemical Biology, California Institute of Technology, Pasadena, California 91125
Communicated by Enanuel Margoliash, July 21, 1980
ABSTRACT Tuna ferrocytochrome c and ferricytochromec have been refined independently at high resolution (1.5 A and1.8 A) to crystallographic residual errors of 17.3% and 20.8%,respectively. Small but significant conformational differencesare seen surrounding a buried water molecule that is hydrogenbonded to Asn-52, Tyr-67, and Thr-78. In the oxidized state, thiswater molecule is 1.0 A closer to the heme and the heme hasmoved 0.15 A out of its heme crevice; both changes lead to amore polar microenvironment for the heme. Chemical modifi-cation studies, patterns of evolutionary conservatism, structuraldifferences in bacterial cytochromes, and x-ray studies all agreethat the "active site" for cytochrome c is bounded by lysines 8,13, 27, 72, 79, 86, and 87 (thus containing the evolutionary con-servative 72-87 loop) and has the buried water molecule justbelow its surface and the opening of the heme crevice slightlyto one side.
Respiratory cytochrome c from mitochondria is perhaps thebest-known and most intensively studied of all electron-trans-port proteins-from the spectroscopic studies of MacMunn in1887 (1) through the virtual rediscovery of the protein by Keilinin 1925 (2) and work by Theorell and the Stockholm school (3)to the many investigations in other laboratories (4-6). Its nearomnipresence in oxygen-respiring life forms, ease of isolationand purification, and relative stability under in vitro conditionshave made it an ideal candidate for examination of electron-transfer processes between macromolecules. The same prop-erties have also made it especially suitable for study by x-raydiffraction methods. Our investigations were begun at Caltechin 1963 in collaboration with E. Margoliash; they have resultedin a 4-A resolution map of horse ferricytochrome c in 1967 (7),a 2.8-A resolution map that revealed the polypeptide chain path(8), a 2.45-A analysis of tuna ferrocytochrome c (9), andstructure analyses of both ferricytochrome c and ferrocyto-chrome c from tuna at 2.0 A that included optimized model-building and fitting of idealized bond parameters to the re-sultant electron density map (10-12). In parallel with this work,the Osaka protein structure group has produced a 2.3-A analysisof bonito ferrocytochrome c (13-15) and a 2.8-A analysis of theferric form (16). None of the above work, however, has resultedin a molecular structure that is truly refined in the crystallo-graphic sense, and it has been impossible to determine whatchanges, if any, occurred in the molecule as it shifted from oneheme oxidation state to the other.
This paper describes the results of high-resolution crystal-lographic refinement of tuna ferricytochrome c and ferrocy-tochrome c that has led to standard crystallographic residualerrors (R factors) of 17.3% for ferrocytochrome c at 1.5-A res-olution and 20.8% for ferricytochrome c at 1.8-A resolution.
The publication costs of this article were defrayed in part by page
charge payment. This article must therefore be hereby marked "ad-vertisement" in accordance with 18 U. S. C. §1734 solely to indicatethis fact.
6371
METHODSTuna cytochrome c was extracted, purified, and crystallizedas described (9, 10). X-ray data were collected at room tem-perature on a Syntex P1 automatic diffractometer to 1.5-Aresolution for ferrocytochrome c (space group P21212; cell di-mensions of a = 37.33 A, b = 87.10 A, c = 34.44 A) and to 1.8-Aresolution for ferricytochrome c (space group P43; cell di-mensions of a = b = 74.42 A, c = 36.30 A). Merging of new datawith the earlier 2-A sets and rejection of intensities below 2cgave 13,840 statistically significant intensities for ferrocyto-chrome c refinement and 16,831 for ferricytochrome c.The refinement process is described in more detail elsewhere
(unpublished data). It essentially consisted of Diamond modelbuilding and real-space refinement (17-19), followed byJack-Levitt energy refinement (20). At present, ferrocyto-chrome c has an R factor of 17.3% and 52 solvent molecules,and ferricytochrome c has an R factor of 20.8% and 49 solventmolecules. Luzzati's method of estimating root-mean-squareerrors in atomic positions (21) gives 0.15 A for the reducedmolecule and 0.20 A for the oxidized. For a rigid ring or othergroup of n atoms, this can be reduced by a factor of -v,making reasonable estimates for errors within a pyrrole ringof n-0.07 A and ;0.09 A, respectively. Twelve solvent moleculeswere found at the same relative positions in all three molecules;three of these are discussed in detail in this paper.
RESULTSThree cytochrome c molecules were refined in this analysis: theferrocytochrome molecule (designated reduced or simply R)and the two crystallographically independent ferricytochromemolecules in the oxidized crystal. The latter two will be dif-ferentiated by designating the molecule involved in the 43 screwaxis through the origin of the cell as the outer molecule and thataround the screw axis through the center of the cell as the innermolecule. Refined coordinates for all three molecules have beendeposited with the Brookhaven Protein Data Bank (Long Island,NY), replacing the 1976 coordinates.
This refinement at high resolution has led to differencesbetweeen ferrocytochrome c and ferricytochrome c that arebelievable because they are departures from the startingcoordinates and are greater than the refined differences be-tween the two independent ferricytochrome molecules.Comparision of the root-mean-square differences in corre-sponding atom positions in all three pairs of molecules showsthat the differences between oxidation states are approximately0.10 A greater than those between outer and inner moleculesfor all classes of atoms-main chain, side chains, and heme. (Fora graphical description of a detailed atom-by-atom comparisonof distances between corresponding atoms in the three mole-cules and a discussion of its significance, see ref. 22.)The conformational changes with redox state that we believe
to be most significant are best shown by comparison of their

6372 Biochemistry: Takano and Dickerson
FIG. 1. Superimposed stereo-pair drawings of reduced or ferrocytochrome c molecule (solid bonds) and inner ferricytochrome c molecule(open bonds). Aside from minor differences around residues 27 and 28 that arise from intermolecular packing contacts in the oxidized crystal,the two redox states differ principally at the lower portion of the molecule, in the vicinity of Asn-52 (see Fig. 2).
stereo drawings (Figs. 1 and 2) with Fig. 3 as a control. On re-duction, the heme group moves 0.15 A into the crevice, roughlyalong a vector connecting pyrrole rings 3 and 1.* A more precisedescription would be to say that it pivots around the methyl sidechain of ring 2. Regions in which the redox conformationaldifferences are significantly greater than the differences be-tween ferricytochrome molecules include Cys-17 to Thr-19 (theheme attachment), Lys-27 to Leu-35 (the lower right lining ofthe heme crevice), Lys-39 to Ala-44, and Ser-47 to Asn-60 (thefloor of the crevice), and groups Tyr-67, Met-80, Phe-82, andAla-83 (all of which are directly involved with the heme).The most striking changes are those that occur in the network
of hydrogen bonds around the water molecule buried to the leftof the heme crevice. These changes are shown accurately inFigs. 1 and 2 and schematically in Fig. 4. As the heme sinks intothe crevice, the hydrogen bond between its buried propionateand Trp-59 drags that group 0.4 A toward the interior of themolecule. Tyr-48, also bonded to that propionate, is pusheddownward. The buried water molecule sinks 1.0 A toward the
bottom of the molecule. Its hydrogen-bonded Asn-52 side chaintwists, and the backbone of the "50s" helix moves down and tothe left (Fig. 1). The hydrogen bond between Asn-52 and themain chain amide of residue 41 decreases from 3.5 A to 3.0 Aand that between the water molecule and Tyr-67 pulls thatgroup 0.7 A down and into the interior. A third hydrogen bondfrom the water molecule extends to the hydroxyl group ofThr-78, which seems to act as a motionless pivot during re-duction.The geometry of the heme group and the interaction be-
tween the group and ligands in the three molecules are sum-marized in Table 1. The iron-nitrogen distances to His-18 andthe iron-sulfur distances are consistent with those observed inmodel compounds (23-25). In neither the model compoundsnor in tuna cytochrome is a change in oxidation state of the ironaccompanied by significant changes in Fe-N and Fe-S bondlengths.
DISCUSSION
* Pyrrole ring numbering: 1 = buried propionate, 2 = Cys-14 attach-ment, 3 = Cys-17 attachment, 4 = outer propionate. This agrees withcurrent numbering practice of the Brookhaven Protein Data Bankand publications on other heme proteins. In some earlier papers, ourrings 1-4 are numbered IV, I, II, and III, respectively.
79
The differences between the conformations of reduced andoxidized cytochrome c proved in the end to be smaller than hadbeen expected, or had been believed at intermediate stages ofthe structure analysis, and to lie in a region of the moleculewhose importance to mechanism had not previously been
2 9
TRP59 TH 78
FIG. 2. Left side view of the reduced (solid bonds) and inner (open bonds) molecules.
Proc. Natl. Acad. Sci. USA 77 (1980)

Proc. Natl. Acad. Sci. USA 77 (1980) 6373
TYR6 YR LYS79 R67"NY LYS79
, 2 2 i 7 8 ~78 SN8
FIG. 3. The "control" for Figs. 1 and 2: a superposition from the same orientation of the two ferricytochrome c molecules, outer (solid bonds)and inner (open bonds). There are no important differences except at the amino and carboxy termini (which also have large temperature factors);in particular, there are none of the changes around the water molecule.
considered-the bottom left side of the heme crevice. The shiftin Asn-52 with redox change was actually observed in reoxi-dized-minus-reduced difference maps in August 1972, but itssignificance was discounted at the time (11). In retrospect, theseearly observations give us confidence in the accuracy of thepresent refinement.The buried water molecule that is hydrogen bonded to
Asn-52, Thr-78, and Tyr-67 lies just under the molecular surfaceas defined by the 70s loop of polypeptide chain, which had beennoticed to be evolutionarily conservative at the very beginningof sequence and structure analysis (8, 26). In the light of recentchemical modification and protection studies of the interactionof cytochrome c with its oxidase, reductase, and peroxidase, thisregion of the molecular surface assumes more importance as
possibly being the contact surface with the larger macromole-cules between which it transfers electrons. Millet and Margo-hash have independently prepared series of cytochrome c de-rivatives in which a single lysine side chain is modified, and thenthey looked for altered reactivity of each derivative with mi-tochondrial cytochrome oxidase (27-29) and reductase (30, 31),
ei,' COH- 5-aHK-HNH H"
° ~~~----Sb-o HN
FIG. 4. Schematic drawing of side-chain motion in the vicinityof the heme. Heavy lines indicate the reduced molecule, and light linesindicate the oxidized molecule. Hydrogen bonds are dashed; bonddistances between nonhydrogen atoms are in Angstrom units. Dis-tances for the oxidized state are averages of the outer and innermolecules. The three water molecules shown schematically here are
shown accurately in Fig. 5.
yeast cytochrome c peroxidase (32), and liver microsomal cy-tochrome b5 (33). The latter is relevant because it has beenshown to resemble a core domain of yeast cytochrome b2-lactatedehydrogenase, for which cytochrome c is an in vvo electronacceptor (34). In a somewhat different but complementaryapproach, Bosshard and Pettigrew have studied the shieldingof lysines against chemical modification that is produced bybinding cytochrome c to its oxidase (35, 36), reductase (35, 37),or peroxidase (38). All of these studies define the same bindingsite on the cytochrome c molecule: the upper front of the hemecrevice, roughly centered around Phe-82 and bounded by ly-sines 8, 13, 27, 72, 79, 86, and 87 and to a lesser extent 5, 7, 25,73, and 88. In contrast, lysines 22, 39, 53, 55, 60, 99, and 100at the bottom and rear of the molecule are not involved in in-teractions with any of the electron donor or acceptor macro-molecules.The "active site" of cytochrome c, as defined by these lysine
Table 1. Heme geometryReduced Outer Inner
Distance, AFe to heme plane* 0.06 0.01 0.04Fe to NNNN planet 0.07 0.03 0.01Fe to pyrrole N (avg.) 2.06 2.08 2.03Fe to Ne of His-18 1.97 1.96 2.04Fe to S of Met-80 2.32 2.28 2.26Ne of His-18 to NNNN plane 1.90 1.97 2.03Sb of Met-80 to NNNN plane 2.39 2.23 2.20
Angle, °, between heme-plane normal andPyrrole 1-plane normal 5.1 6.3 3.2Pyrrole 2-plane normal 11.1 10.8 5.6Pyrrole 3-plane normal 14.2 10.1 8.9Pyrrole 4-plane normal 7.8 5.5 4.6NNNN-plane normal 3.8 2.3 3.7Fe-N bond to His-18 2.7 5.2 4.9Fe-S bond to Met-80 5.7 9.9 10.4
Angle, °, between NNNN-plane normal andFe-N bond to His-18 2.8 6.5 8.2Fe-S bond to Met-80 2.4 9.6 12.3
Angle, °, between imidazole ring plane normal and1N-3N vector 47 51 52
* Defined by porphyrin core plus first attached carbon atoms on pe-rimeter.
t Defined by four pyrrole nitrogen atoms.
Biochemistry: Takano and Dickerson
6374 Biochemistry: Takano and Dickerson
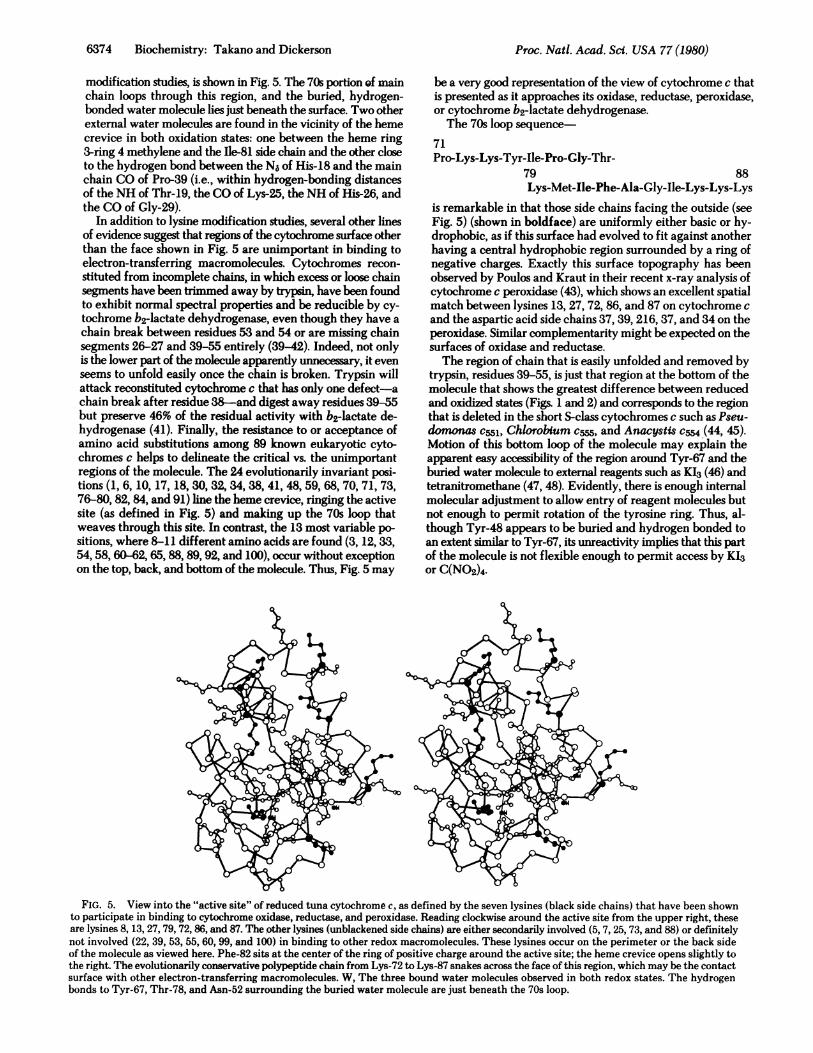
modification studies, is shown in Fig. 5. The 70s portion of mainchain loops through this region, and the buried, hydrogen-bonded water molecule lies just beneath the surface. Two otherexternal water molecules are found in the vicinity of the hemecrevice in both oxidation states: one between the heme ring3-ring 4 methylene and the Ile-81 side chain and the other closeto the hydrogen bond between the N6 of His-18 and the mainchain CO of Pro-39 (i.e., within hydrogen-bonding distancesof the NH of Thr-19, the CO of Lys-25, the NH of His-26, andthe CO of Gly-29).
In addition to lysine modification studies, several other linesof evidence suggest that regions of the cytochrome surface otherthan the face shown in Fig. 5 are unimportant in binding toelectron-transferring macromolecules. Cytochromes recon-stituted from incomplete chains, in which excess or loose chainsegments have been trimmed away by trypsin, have been foundto exhibit normal spectral properties and be reducible by cy-tochrome b2-lactate dehydrogenase, even though they have achain break between residues 53 and 54 or are missing chainsegments 26-27 and 39-55 entirely (39-42). Indeed, not onlyis the lower part of the molecule apparently unnecessary, it evenseems to unfold easily once the chain is broken. Trypsin willattack reconstituted cytochrome c that has only one defect-achain break after residue 38-and digest away residues 39-55but preserve 46% of the residual activity with b2-lactate de-hydrogenase (41). Finally, the resistance to or acceptance ofamino acid substitutions among 89 known eukaryotic cyto-chromes c helps to delineate the critical vs. the unimportantregions of the molecule. The 24 evolutionarily invariant posi-tions (1, 6, 10, 17, 18, 30, 32, 34, 38, 41, 48, 59, 68, 70, 71, 73,76-80, 82, 84, and 91) line the heme crevice, ringing the activesite (as defined in Fig. 5) and making up the 70s loop thatweaves through this site. In contrast, the 13 most variable po-sitions, where 8-11 different amino acids are found (3, 12, 33,54, 58, 60-62, 65, 88, 89, 92, and 100), occur without exceptionon the top, back, and bottom of the molecule. Thus, Fig. 5 may
be a very good representation of the view of cytochrome c thatis presented as it approaches its oxidase, reductase, peroxidase,or cytochrome b2-lactate dehydrogenase.The 70s loop sequence
71Pro-Lys-Lys-Tyr-Ile-Pro-Gly-Thr-
79 88Lys-Met-Ile-Phe-Ala-Gly-Ile-Lys-Lys-Lys
is remarkable in that those side chains facing the outside (seeFig. 5) (shown in boldface) are uniformly either basic or hy-drophobic, as if this surface had evolved to fit against anotherhaving a central hydrophobic region surrounded by a ring ofnegative charges. Exactly this surface topography has beenobserved by Poulos and Kraut in their recent x-ray analysis ofcytochrome c peroxidase (43), which shows an excellent spatialmatch between lysines 13, 27, 72, 86, and 87 on cytochrome cand the aspartic acid side chains 37, 39, 216, 37, and 34 on theperoxidase. Similar complementarity might be expected on thesurfaces of oxidase and reductase.The region of chain that is easily unfolded and removed by
trypsin, residues 39-55, is just that region at the bottom of themolecule that shows the greatest difference between reducedand oxidized states (Figs. 1 and 2) and corresponds to the regionthat is deleted in the short S-class cytochromes c such as Pseu-domonas c551, Chlorobium c%55, and Anacystis c&54 (44, 45).Motion of this bottom loop of the molecule may explain theapparent easy accessibility of the region around Tyr-67 and theburied water molecule to external reagents such as KI3 (46) andtetranitromethane (47, 48). Evidently, there is enough internalmolecular adjustment to allow entry of reagent molecules butnot enough to permit rotation of the tyrosine ring. Thus, al-though Tyr-48 appears to be buried and hydrogen bonded toan extent similar to Tyr-67, its unreactivity implies that this partof the molecule is not flexible enough to permit access by KI3or Q(N02)4.
FIG. 5. View into the "active site" of reduced tuna cytochrome c, as defined by the seven lysines (black side chains) that have been shownto participate in binding to cytochrome oxidase, reductase, and peroxidase. Reading clockwise around the active site from the upper right, theseare lysines 8, 13, 27, 79, 72, 86, and 87. The other lysines (unblackened side chains) are either secondarily involved (5, 7, 25, 73, and 88) or definitelynot involved (22, 39, 53, 55, 60, 99, and 100) in binding to other redox macromolecules. These lysines occur on the perimeter or the back sideof the molecule as viewed here. Phe-82 sits at the center of the ring of positive charge around the active site; the heme crevice opens slightly tothe right. The evolutionarily conservative polypeptide chain from Lys-72 to Lys-87 snakes across the face of this region, which may be the contactsurface with other electron-transferring macromolecules. W, The three bound water molecules observed in both redox states. The hydrogenbonds to Tyr-67, Thr-78, and Asn-52 surrounding the buried water molecule are just beneath the 70s loop.
Proc. Natl. Acad. Sci. USA 77 (1980)

Proc. Natl. Acad. Sci. USA 77 (1980) 6375
What contribution might the buried but moving watermolecule and its network of hydrogen bonds make to the cy-tochrome c mechanism? Its role might be a purely passive andstructural one, helping to stabilize the left side of the hemecrevice and shifting its position in response to the formal chargeon the heme (ferroheme is neutral whereas ferriheme has a +1charge). Both the 1.0-A shift of the buried water moleculetoward the heme and the 0.15-A movement of the heme out ofits crevice would be natural responses to the increased polarityof the heme after oxidation. However, cause and effect aredifficult to untangle; if, in some manner, the binding of ferro-cytochrome c to oxidase were to induce the shift of the watermolecule, then the more polar microenvironment of the hemeproduced would assist the loss of an electron. The ferricyto-chrome molecule, making a better fit against the oxidase surfacethan ferrocytochrome, would then be expected to be a com-petitive inhibitor of further ferrocytochrome reaction, whichis known to be true (49). Unfortunately for such an aestheticallypleasing hypothesis, little or no difference can be seen (Figs.1 and 2) for that region of the cytochrome c surface that is mostlikely to come in contact with other electron-transferring en-zymes. At present, the water molecule can only be assigned astructural role, helping by its hydrogen bonds to hold togetherthe left half of the molecule.
We thank George A. Carlson and Ben Conner for their help in var-ious phases of crystal preparation, data collection, and data processing.This is Contribution No. 6231 from the Norman W. Church Laboratoryof Chemical Biology, California Institute of Technology. This workwas performed with the support of National Institutes of Health GrantGM-12121 and National Science Foundation Grant PCM 79-13959.
1. MacMunn, C. A. (1887) J. Physiol. 8,51-56.2. Keilin, D. (1966) The History of Cell Respiration and Cyto-
chrome, (Cambridge Univ. Press, Cambridge, England).3. Akeson, A. & Ehrenberg, A., eds. (1972) Structure and Function
of Oxidation-Reduction Enzymes (Pergamon, Oxford).4. Margoliash, E. & Schejter, A. (1966) Adv. Protein Chem. 21,
113-286.5. Lemberg, R. & Barrett, J. (1973) Cytochromes (Academic, New
York).6. Dickerson, R. E. & Timkovich, R. (1975) in The Enzymes, ed.
Boyer, P. D. (Academic, New York), 3rd Ed., Vol. 11, pp.397-547.
7. Dickerson, R. E., Kopka, M. L., Weinzierl, J., Varnum, J.,Eisenberg, D. & Margoliash, E. (1967) J. Biol. Chem. 242,3015-3017.
8. Dickerson, R. E., Takano, T., Eisenberg, D., Kallai, 0. B., Samson,L., Cooper, A. & Margoliash, E. (1971) J. Biol. Chem. 246,1511-1535.
9. Takano, T., Kallai, 0. B., Swanson, R. & Dickerson, R. E. (1973)J. Biol. Chem. 248,5234-5255.
10. Swanson, R., Trus, B. L., Mandel, N., Mandel, G., Kallai, 0. B.& Dickerson, R. E. (1977) J. Biol. Chem. 252,759-775.
11. Takano, T., Trus, B. L., Mandel, N., Mandel, G., Kallai, 0. B.,Swanson, R. & Dickerson, R. E. (1977) J. Biol. Chem. 252,776-785.
12. Mandel, N., Mandel, G., Trus, B. L., Rosenberg, J., Carlson, G.& Dickerson, R. E. (1977) J. Biol. Chem. 252,4619-4636.
13. Ashida, T., Ueki, T., Tsukihara, T., Sugihara, A., Takano, T. &Kakudo, M. (1971) J. Biochem. 70,913-924.
14. Ashida, T., Tanaka, N., Yamane, T., Tsukihara, T. & Kakudo,M. (1973) J. Biochem 73, 463-465.
15. Tanaka, N., Yamane, T., Tsukihara, T., Ashida, T. & Kakudo,M. (1975) J. Biochem. 77, 147-162.
16. Matsuura, Y., Hata, Y., Yamaguchi, T., Tanaka, N. & Kakudo,M. (1979) J. Biochem. 85,729-737.
17. Diamond, R. (1966) Acta Crystallogr. 21,235-266.18. Diamond, R. (1971) Acta Crystallogr. Sect. A 27,436-452.19. Diamond, R. (1974) J. Mol. Biol. 82,371-391.20. Jack, A. & Levitt, M. (1978) Acta Crystallogr. Sect. A 34,
931-935.21. Luzatti, V. (1952) Acta Crystallogr. 5,802-810.22. Takano, T. & Dickerson, R. E. (1980) in Interaction Betueen Iron
and Proteins in Oxygen and Electron Transport, ed. Ho, C.(Elsevier/North Holland, New York), in press.
23. Bowman, K., Gaughan, A. P. & Dori, Z. (1972) J. Am. Chem. Soc.94,727-721.
24. Collins, D. M., Countryman, R. & Hoard, J. L. (1972) J. Am.Chem. Soc. 94,2066-2072.
25. Mashiko, T., Marchon, J.-C., Musser, D. T., Reed, C. A., Kastner,M. E. & Scheidt, W. R. (1979) J. Am. Chem. Soc. 101, 3653-3655.
26. Margoliash, E. (1963) Proc. Natl. Acad. Sci. USA 50,672-679.27. Staudenmayer, N., Ng, S., Smith, M. B. & Millett, F. (1977)
Biochemisty 16,600-604.28. Smith, H. T., Staudenmayer, N. & Millett, F. (1977) Biochemistry
16,4971-4974.29. Ferguson-Miller, S., Brautigan, D. L. & Margoliash, E. (1978) J.
Biol. Chem. 253,149-159.30. Ahmed, A. J., Smith, H. T., Smith, M. B. & Millett, F. (1978)
Biochemistry 17,2479-2483.31. Speck, S. H., Ferguson-Miller, S., Osheroff, N. & Margoliash, E.
(1979) Proc. Natl. Acad. Sci. USA 76, 155-159.32. Kang, C. H., Brautigan, D. L., Osheroff, N. & Margoliash, E.
(1978) J. Biol. Chem. 253,6502-6510.33. Ng, S., Smith, M. B., Smith, H. T. & Millett, F. (1977) Biochem-
istry 16,4975-4978.34. Guiard, B., Groudinsky, 0. & Lederer, F. (1974) Proc. Natl. Acad.
Sci. USA 71,2539-2543.35. Rieder, R. & Bosshard, H. R. (1978) FEBS Lett. 92,223-226.36. Rieder, R. & Bosshard, H. R. (1978) J. Biol. Chem. 253, 6045-
6053.37. Bosshard, H. R., Zuirrer, M., Schiigger, H. & von Jagow, G. (1979)
Biochem. Biophys. Res. Commun. 89,250-258.38. Pettigrew, G. (1978) FEBS Lett. 86, 14-16.39. Hantgan, R. R. & Taniuchi, H. (1977) J. Biol. Chem. 252,
1367-1374.40. Hantgan, R. R. & Taniuchi, H. (1978) J. Biol. Chem. 253,
5373-5380.41. Parr, G. R., Hantgan, R. R. & Taniuchi, H. (1978) J. Biol. Chem.
253,5381-5388.42. Juillerat, M., Parr, G. R. & Taniuchi, H. (1980) J. Biol. Chem. 255,
845-853.43. Poulos, T. L. & Kraut, J. (1980) J. Biol. Chem., in press.44. Dickerson, R. E. (1980) Sci. Am. 242 (3), 136-153.45. Dickerson, R. E. (1980) Nature (London) 283,210-212.46. McGowan, E. B. & Stellwagen, E. (1970) Biochemistry 9,
3047-3052.47. Sokolovsky, M., Aviram, I. & Schejter, A. (1970) Biochemistry
9,5113-5118.48. Schejter, A., Aviram, I. & Sokolovsky, M. (1970) Biochemistry
9,5118-5122.49. Yonetani, T. & Ray, G. S. (1965) J. Biol. Chem. 240, 3392-
3398.
Biochemistry: Takano and Dickerson