Embed Size (px)
DESCRIPTION
Redrawing the Map on Redistricting 2010 - A Philadelphia Study
Citation preview

Azavea White Paper 1
Using geospatial analysis to measure electoral district compactness and limit gerrymandering
An Azavea White Paper
Redrawing the Map on Redistricting 2010
Redrawing the Map on Redistricting
The Philadelphia Study
REDISTRICTINGTHE Philadelphia REGION
Azavea White Paper 2
Azavea • 340 North 12th Street
Philadelphia, Pennsylvania • 19107
(215) 925—2600
www.azavea.com
Copyright © 2009 Azavea
All rights reserved.
Printed in the United States of America.
The information contained in this document is the exclusive property of
Azavea. This work is protected under United States copyright law and other
international copyright treaties and conventions. No part of this work may
be reproduced or transmitted in any form or by any means, electronic or
mechanical, including photocopying and recording, or by any information
storage or retrieval system, except as expressly permitted in writing by
Azavea. All requests should be sent to Attention: Contracts Manager, Aza-
vea, 340 N 12th St, Suite 402, Philadelphia, PA 19107, USA.
The information contained in this document is subject to change without
notice.
U.S. GOVERNMENT RESTRICTED/LIMITED RIGHTS
Any software, documentation, and/or data delivered hereunder is subject
to the terms of the License Agreement. In no event shall the U.S. Govern-
ment acquire greater than RESTRICTED/LIMITED RIGHTS. At a minimum,
use, duplication, or disclosure by the U.S. Government is subject to restric-
tions as set forth in FAR §52.227-14 Alternates I, II, and III (JUN 1987); FAR
§52.227-19 (JUN 1987) and/or FAR §12.211/12.212 (Commercial Technical
Data/Computer Software); and DFARS §252.227-7015 (NOV 1995) (Tech-
nical Data) and/or DFARS §227.7202 (Computer Software), as applicable.
Contractor/Manufacturer is Azavea, 340 N 12th St, Suite 402B, Philadel-
phia, PA 19107, USA.
Azavea, the Azavea logo, DecisionTree, ModelTree, REX, Cicero, HunchLab,
Sajara, Kaleidocade, Esphero, www.azavea.com, and @Azavea.com are
trademarks, registered trademarks, or service marks of Azavea in the Unit-
ed States, and certain other jurisdictions. Other companies and products
mentioned herein are trademarks or registered trademarks of their respec-
tive trademark owners.
Azavea White Paper 3
The most famous examples of gerrymandering are typically
the product of dramatic partisan battles over seats in the U.S.
Congress, but citizens often feel the effects of the practice
most acutely at the local level. There is an appealing drama in
tales of the entire Texas Democratic delegation to the House
fleeing the state to stymie a mid-decade redistricting power
grab by members of the GOP. In reality, however, most ger-
rymandering efforts are the product of deal-making by party
power brokers, designed to protect the influence of incum-
bents and other insiders. The redistricting dramas that play out
in city councils and state legislatures across the country are
often more about the interests of individuals than of parties.
In our white paper Redrawing the Map on Redistricting 2010:
A National Study we used the lens of compactness to examine
the phenomenon of gerrymandering at the nationwide scale.
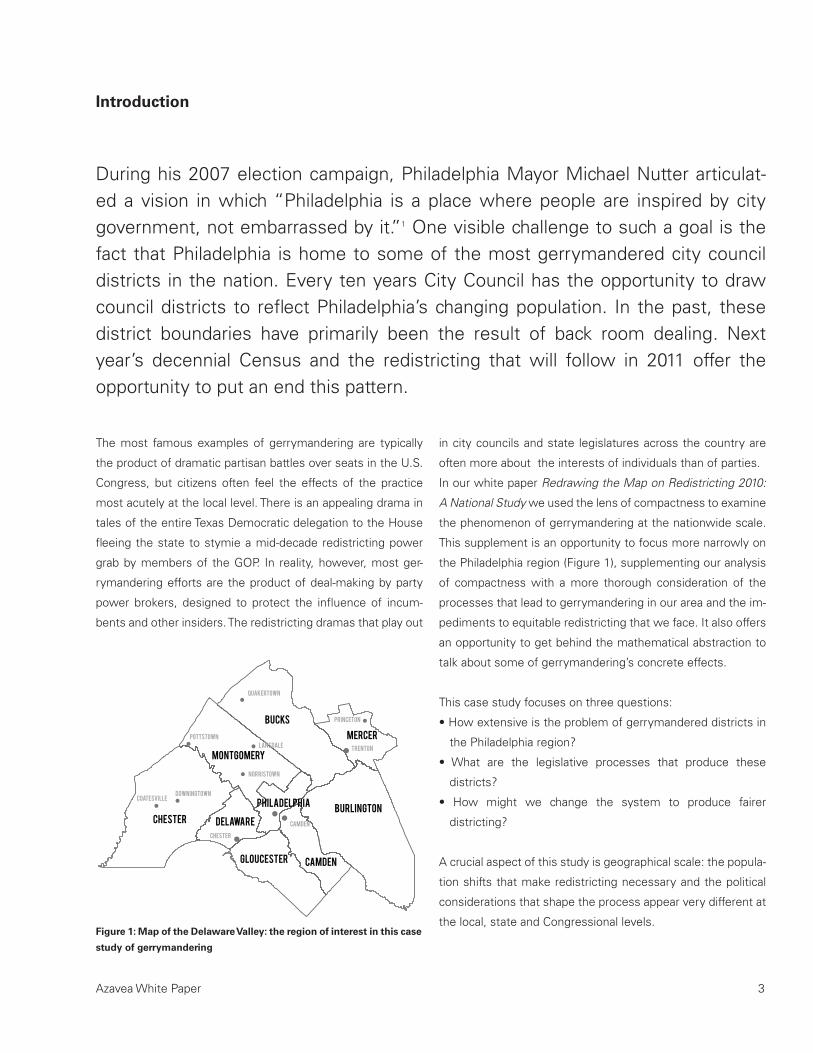
This supplement is an opportunity to focus more narrowly on
the Philadelphia region (Figure 1), supplementing our analysis
of compactness with a more thorough consideration of the
processes that lead to gerrymandering in our area and the im-
pediments to equitable redistricting that we face. It also offers
an opportunity to get behind the mathematical abstraction to
talk about some of gerrymandering’s concrete effects.
This case study focuses on three questions:
• How extensive is the problem of gerrymandered districts in
the Philadelphia region?
• What are the legislative processes that produce these
districts?
• How might we change the system to produce fairer
districting?
A crucial aspect of this study is geographical scale: the popula-
tion shifts that make redistricting necessary and the political
considerations that shape the process appear very different at
the local, state and Congressional levels.
Introduction
During his 2007 election campaign, Philadelphia Mayor Michael Nutter articulat-ed a vision in which “Philadelphia is a place where people are inspired by city government, not embarrassed by it.”1 One visible challenge to such a goal is the fact that Philadelphia is home to some of the most gerrymandered city council districts in the nation. Every ten years City Council has the opportunity to draw council districts to reflect Philadelphia’s changing population. In the past, these district boundaries have primarily been the result of back room dealing. Next year’s decennial Census and the redistricting that will follow in 2011 offer the opportunity to put an end this pattern.
Camden
CoatesvilleDowningtown
Pottstown
Trenton
Princeton
Chester
Norristown
Quakertown
Lansdale
Philadelphia
Chester
Bucks
Montgomery
DelawareBurlington
CamdenGloucester
Mercer
Figure 1: Map of the Delaware Valley: the region of interest in this case
study of gerrymandering
Azavea White Paper 4
Gerrymandering in the Philadelphia Region
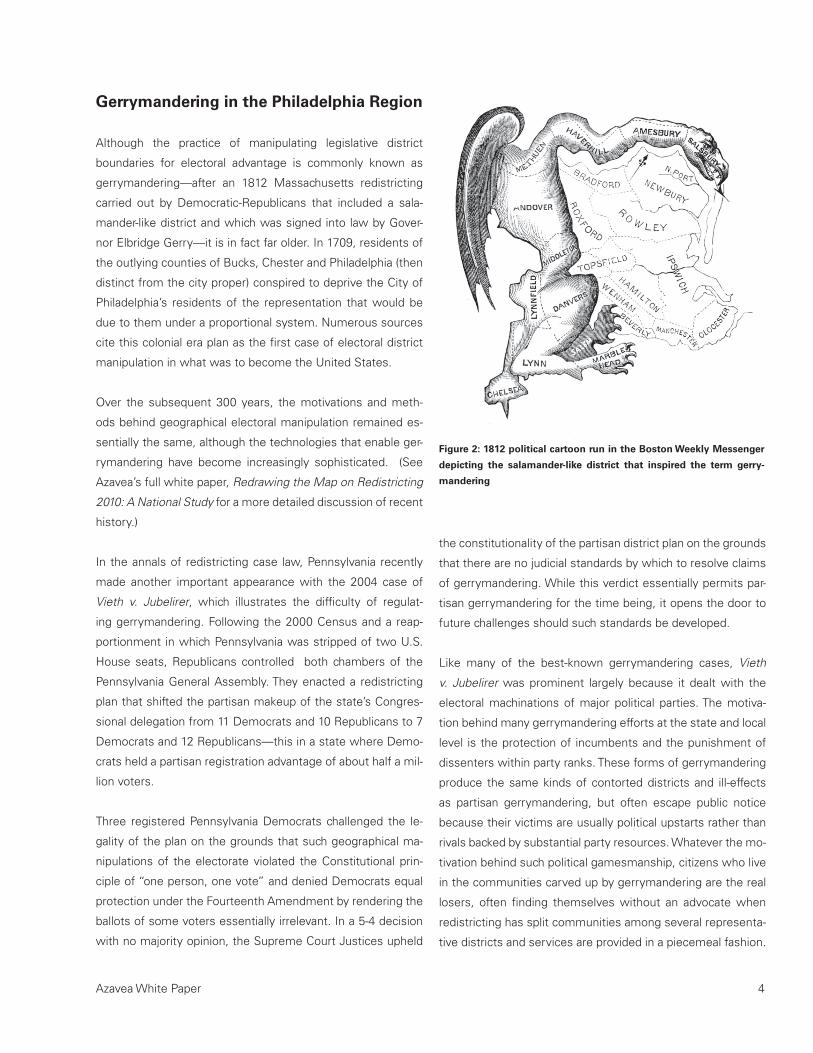
Although the practice of manipulating legislative district
boundaries for electoral advantage is commonly known as
gerrymandering—after an 1812 Massachusetts redistricting
carried out by Democratic-Republicans that included a sala-
mander-like district and which was signed into law by Gover-
nor Elbridge Gerry—it is in fact far older. In 1709, residents of
the outlying counties of Bucks, Chester and Philadelphia (then
distinct from the city proper) conspired to deprive the City of
Philadelphia’s residents of the representation that would be
due to them under a proportional system. Numerous sources
cite this colonial era plan as the first case of electoral district
manipulation in what was to become the United States.
Over the subsequent 300 years, the motivations and meth-
ods behind geographical electoral manipulation remained es-
sentially the same, although the technologies that enable ger-
rymandering have become increasingly sophisticated. (See
Azavea’s full white paper, Redrawing the Map on Redistricting
2010: A National Study for a more detailed discussion of recent
history.)
In the annals of redistricting case law, Pennsylvania recently
made another important appearance with the 2004 case of
Vieth v. Jubelirer, which illustrates the difficulty of regulat-
ing gerrymandering. Following the 2000 Census and a reap-
portionment in which Pennsylvania was stripped of two U.S.
House seats, Republicans controlled both chambers of the
Pennsylvania General Assembly. They enacted a redistricting
plan that shifted the partisan makeup of the state’s Congres-
sional delegation from 11 Democrats and 10 Republicans to 7
Democrats and 12 Republicans—this in a state where Demo-
crats held a partisan registration advantage of about half a mil-
lion voters.
Three registered Pennsylvania Democrats challenged the le-
gality of the plan on the grounds that such geographical ma-
nipulations of the electorate violated the Constitutional prin-
ciple of “one person, one vote” and denied Democrats equal
protection under the Fourteenth Amendment by rendering the
ballots of some voters essentially irrelevant. In a 5-4 decision
with no majority opinion, the Supreme Court Justices upheld
the constitutionality of the partisan district plan on the grounds
that there are no judicial standards by which to resolve claims
of gerrymandering. While this verdict essentially permits par-
tisan gerrymandering for the time being, it opens the door to
future challenges should such standards be developed.
Like many of the best-known gerrymandering cases, Vieth
v. Jubelirer was prominent largely because it dealt with the
electoral machinations of major political parties. The motiva-
tion behind many gerrymandering efforts at the state and local
level is the protection of incumbents and the punishment of
dissenters within party ranks. These forms of gerrymandering
produce the same kinds of contorted districts and ill-effects
as partisan gerrymandering, but often escape public notice
because their victims are usually political upstarts rather than
rivals backed by substantial party resources. Whatever the mo-
tivation behind such political gamesmanship, citizens who live
in the communities carved up by gerrymandering are the real
losers, often finding themselves without an advocate when
redistricting has split communities among several representa-
tive districts and services are provided in a piecemeal fashion.
Figure 2: 1812 political cartoon run in the Boston Weekly Messenger
depicting the salamander-like district that inspired the term gerry-
mandering
Azavea White Paper 5
Compactness
Background
Academic articles, state laws and Supreme Court rulings have
all cited compactness, along with contiguity, as a traditional
districting principle, and low compactness is considered a sign
of a potential gerrymander. Indeed, the Pennsylvania Constitu-
tion (Article II, Section 16) provides fairly typical districting cri-
teria, both in what it specifies and, more importantly, in what
it does not: districts “shall be composed of compact and con-
tiguous territory as nearly equal in population as practicable.”
The New Jersey Constitution is similarly vague, stipulating
that “The Assembly districts shall be composed of contiguous
territory, as nearly compact and equal in the number of their
inhabitants as possible” (Article IV, Section II, paragraph 4).2
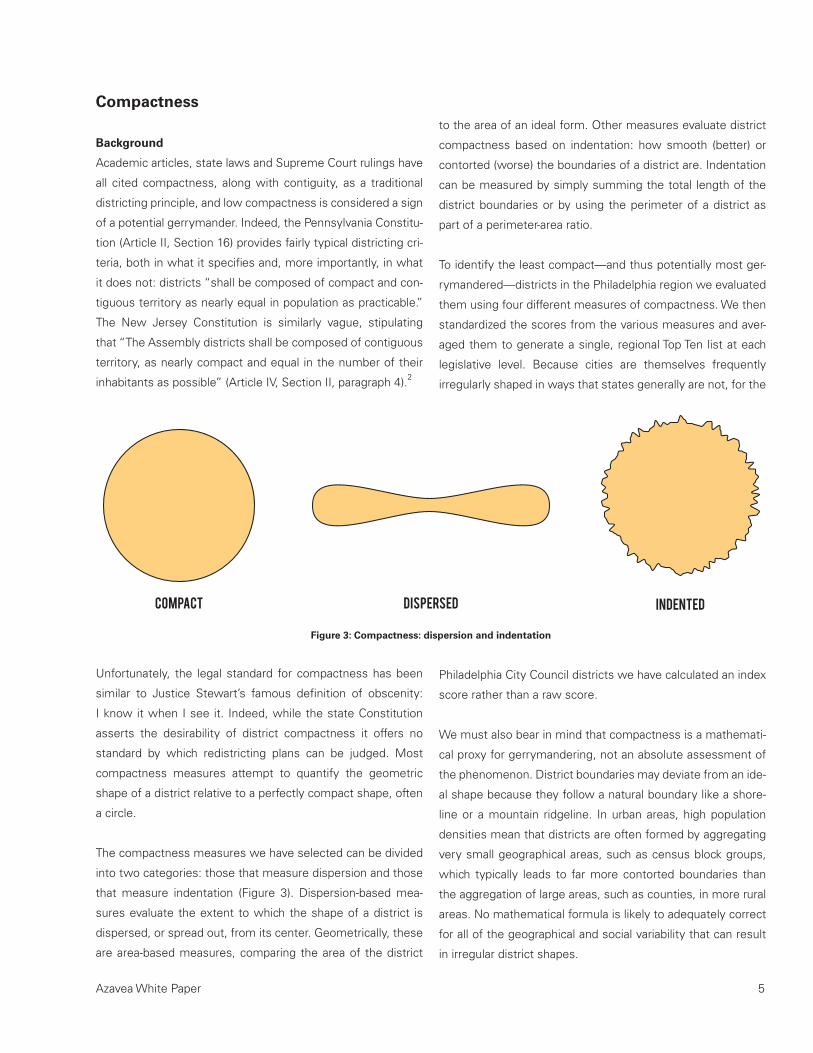
to the area of an ideal form. Other measures evaluate district
compactness based on indentation: how smooth (better) or
contorted (worse) the boundaries of a district are. Indentation
can be measured by simply summing the total length of the
district boundaries or by using the perimeter of a district as
part of a perimeter-area ratio.
To identify the least compact—and thus potentially most ger-
rymandered—districts in the Philadelphia region we evaluated
them using four different measures of compactness. We then
standardized the scores from the various measures and aver-
aged them to generate a single, regional Top Ten list at each
legislative level. Because cities are themselves frequently
irregularly shaped in ways that states generally are not, for the
Unfortunately, the legal standard for compactness has been
similar to Justice Stewart’s famous definition of obscenity:
I know it when I see it. Indeed, while the state Constitution
asserts the desirability of district compactness it offers no
standard by which redistricting plans can be judged. Most
compactness measures attempt to quantify the geometric
shape of a district relative to a perfectly compact shape, often
a circle.
The compactness measures we have selected can be divided
into two categories: those that measure dispersion and those
that measure indentation (Figure 3). Dispersion-based mea-
sures evaluate the extent to which the shape of a district is
dispersed, or spread out, from its center. Geometrically, these
are area-based measures, comparing the area of the district
Philadelphia City Council districts we have calculated an index
score rather than a raw score.
We must also bear in mind that compactness is a mathemati-
cal proxy for gerrymandering, not an absolute assessment of
the phenomenon. District boundaries may deviate from an ide-
al shape because they follow a natural boundary like a shore-
line or a mountain ridgeline. In urban areas, high population
densities mean that districts are often formed by aggregating
very small geographical areas, such as census block groups,
which typically leads to far more contorted boundaries than
the aggregation of large areas, such as counties, in more rural
areas. No mathematical formula is likely to adequately correct
for all of the geographical and social variability that can result
in irregular district shapes.
Figure 3: Compactness: dispersion and indentation
compact dispersed
Compactness: DISPERSION
compact indented
Compactness: Indentation
Azavea White Paper 6
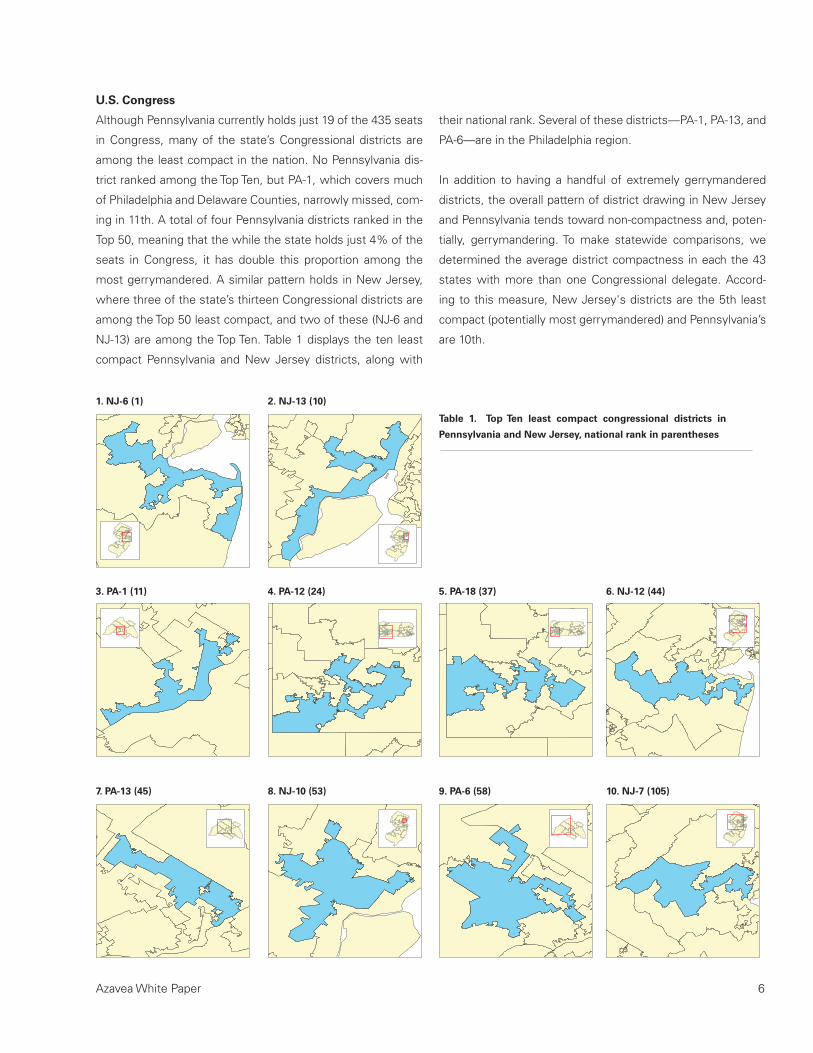
Table 1. Top Ten least compact congressional districts in
Pennsylvania and New Jersey, national rank in parentheses
U.S. Congress
Although Pennsylvania currently holds just 19 of the 435 seats
in Congress, many of the state’s Congressional districts are
among the least compact in the nation. No Pennsylvania dis-
trict ranked among the Top Ten, but PA-1, which covers much
of Philadelphia and Delaware Counties, narrowly missed, com-
ing in 11th. A total of four Pennsylvania districts ranked in the
Top 50, meaning that the while the state holds just 4% of the
seats in Congress, it has double this proportion among the
most gerrymandered. A similar pattern holds in New Jersey,
where three of the state’s thirteen Congressional districts are
among the Top 50 least compact, and two of these (NJ-6 and
NJ-13) are among the Top Ten. Table 1 displays the ten least
compact Pennsylvania and New Jersey districts, along with
9. PA-6 (58) 10. NJ-7 (105)7. PA-13 (45) 8. NJ-10 (53)
5. PA-18 (37) 6. NJ-12 (44)3. PA-1 (11) 4. PA-12 (24)
1. NJ-6 (1) 2. NJ-13 (10)
their national rank. Several of these districts—PA-1, PA-13, and
PA-6—are in the Philadelphia region.
In addition to having a handful of extremely gerrymandered
districts, the overall pattern of district drawing in New Jersey
and Pennsylvania tends toward non-compactness and, poten-
tially, gerrymandering. To make statewide comparisons, we
determined the average district compactness in each the 43
states with more than one Congressional delegate. Accord-
ing to this measure, New Jersey's districts are the 5th least
compact (potentially most gerrymandered) and Pennsylvania’s
are 10th.
Azavea White Paper 7
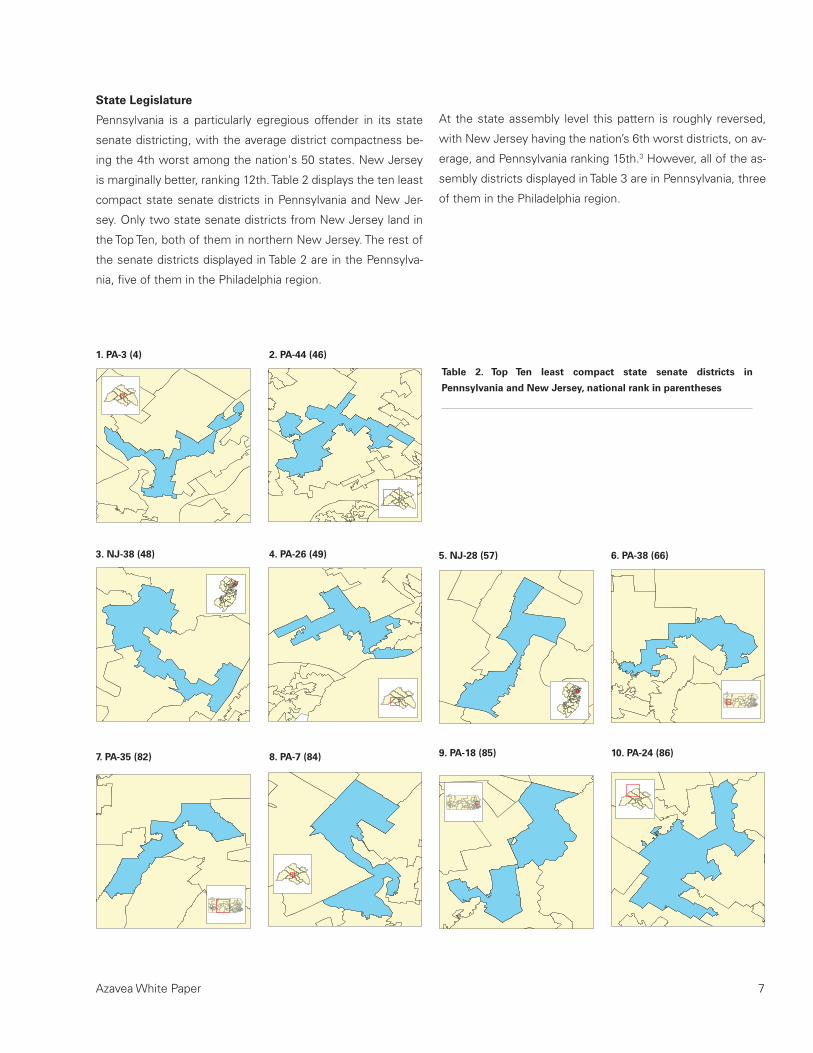
State Legislature
Pennsylvania is a particularly egregious offender in its state
senate districting, with the average district compactness be-
ing the 4th worst among the nation's 50 states. New Jersey
is marginally better, ranking 12th. Table 2 displays the ten least
compact state senate districts in Pennsylvania and New Jer-
sey. Only two state senate districts from New Jersey land in
the Top Ten, both of them in northern New Jersey. The rest of
the senate districts displayed in Table 2 are in the Pennsylva-
nia, five of them in the Philadelphia region.
Table 2. Top Ten least compact state senate districts in
Pennsylvania and New Jersey, national rank in parentheses
9. PA-18 (85) 10. PA-24 (86)7. PA-35 (82) 8. PA-7 (84)
5. NJ-28 (57) 6. PA-38 (66)3. NJ-38 (48) 4. PA-26 (49)
1. PA-3 (4) 2. PA-44 (46)
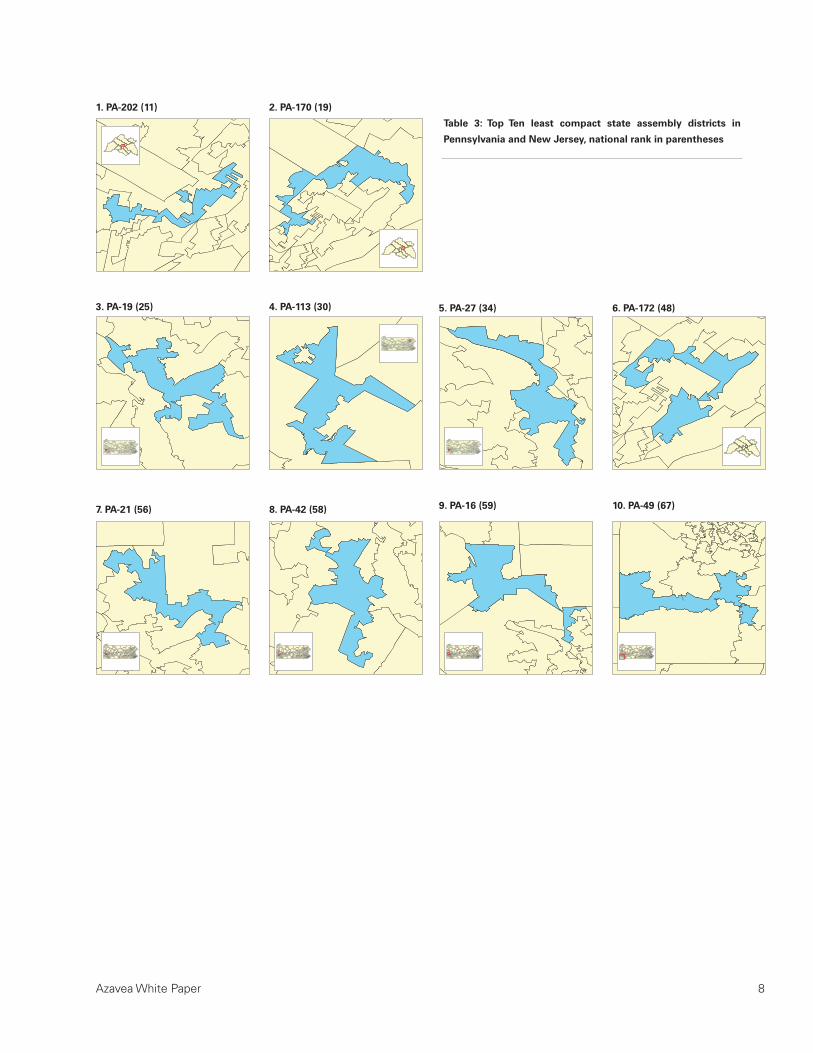
At the state assembly level this pattern is roughly reversed,
with New Jersey having the nation’s 6th worst districts, on av-
erage, and Pennsylvania ranking 15th.3 However, all of the as-
sembly districts displayed in Table 3 are in Pennsylvania, three
of them in the Philadelphia region.
Azavea White Paper 8
Table 3: Top Ten least compact state assembly districts in
Pennsylvania and New Jersey, national rank in parentheses
9. PA-16 (59) 10. PA-49 (67)7. PA-21 (56) 8. PA-42 (58)
5. PA-27 (34) 6. PA-172 (48)3. PA-19 (25) 4. PA-113 (30)
1. PA-202 (11) 2. PA-170 (19)

Azavea White Paper 9
Table 4: Top Four least compact Philadelphia City Council Districts, rank by measure
1. Philadelphia District 7 2. Philadelphia District 5
4. Philadelphia District 93. Philadelphia District 1
the least compact, often in the Top Ten.4 Philadelphia Council
Districts Nine and One also appear at the top of the list of least
compact districts, by several measures.
Philadelphia City Council
Partisan redistricting at the Congressional and state levels at-
tracts most of the attention, but the problem is equally acute
at the municipal level, though it takes on a different form. How
does Philadelphia fare in this regard? Among city council dis-
tricts in the nation's fifty most populous cities, Philadelphia
City Council Districts Seven and Five consistently rank among
Polsby-Popper: 3
Schwartzberg: 3
Reock: 50
Convex Hull: 41
Polsby-Popper: 7
Schwartzberg: 7
Reock: 39
Convex Hull: 11
Polsby-Popper: N/A
Schwartzberg: N/A
Reock: N/A
Convex Hull: 40
Polsby-Popper: N/A
Schwartzberg: N/A
Reock: 17
Convex Hull: 46
Azavea White Paper 10
Process
The Census and Redistricting
The goal of redistricting is to ensure that the principle of “one
person, one vote” is respected by drawing district boundar-
ies such that they contain populations of equal size. At the
Congressional level, redistricting goes hand-in-hand with reap-
portionment: the process of distributing the seats in the U.S.
House of Representatives among the 50 states to reflect the
distribution of the population across the nation; every state is
guaranteed one seat. In 1911 Congress fixed the number of
seats in the House at 435 to prevent the chamber from grow-
ing to an unwieldy size. At this time members of the House
each represented approximately 212,000 constituents—up
from 33,000 in the original House—but now this number has
grown to an average of 700,000.5 Congress made it a legal
requirement in 1967 that members of the House be elected
from geographically defined, single-member districts.
The Constitution mandates that a Census be conducted every
ten years, and redistricting at the federal, state and local levels
is conducted following the release of Census figures to ensure
that district boundaries reflect the most recent, comprehen-
sive and accurate population data. Redistricting data must be
submitted to the states within one year following the Census;
April 1, 2011, in this case. From that point forward, redistrict-
ing timelines diverge depending on the policies in place for the
particular legislative body.
U.S. Congress, Pennsylvania
In Pennsylvania, Congressional district plans must be passed
by the General Assembly and signed into law by the governor.
Following the delivery of Census data to the state, a redistrict-
ing plan must be put in place in time for candidates to file
paperwork for the first round of primary elections, which will
likely mean late January of 2012. If the General Assembly fails
to enact a districting plan, the Supreme Court of Pennsylvania
is empowered to intervene and adopt a plan, as it did in 1992.
Because the stakes are higher—votes in the U.S. House of
Representatives can impact legislative priorities on the nation-
al stage— Congressional districting typically attracts the most
media attention. For this reason, gerrymandering of federal
legislative districts typically fits the familiar mold of partisan
gerrymandering, in which representatives of the majority po-
litical parties jockey to ensure that district plans are drawn so
as to yield as many seats as possible for candidates from their
party. The case of Vieth v. Jubelirer, discussed in the Introduc-
tion above, illustrates the power of partisan gerrymandering
and the difficulty of challenging such plans in the courts.
Compounding this problem is the fact that Pennsylvania’s pop-
ulation growth has lagged behind the rest of the United States
for the past several decades, meaning that in recent rounds
of post-Census reapportionment the state has lost Congres-
sional seats. In addition to the purely partisan aspects of redis-
tricting, the process has become a game of musical chairs in
which not all incumbents’ seats are guaranteed, rendering the
process particularly contentious. This pattern is likely to hold
true in 2010, with Pennsylvania’s congressional delegation pre-
dicted to shrink to 18.
Redistricting reform at the Federal level has been sluggish.
In each of the last several sessions of Congress, Rep. John
Tanner has introduced the Fairness and Independence in
Redistricting Act, which would prohibit states from carrying
out more than one Congressional redistricting following the
decennial census and would require them to conduct redis-
tricting through independent commissions. Unfortunately
there seems to be little political will for reform on the part of
Congress, and the bill and its companion Senate bill have been
stuck in committee repeatedly.
• February – March 2010: Census questionnaires are mailed
or delivered to households.
• April 1, 2010: Census Day
• April – July 2010: Census takers visit households that did
not return a questionnaire by mail.
• December 31, 2010: By law, Census Bureau delivers popu-
lation counts to President for apportionment.
• April 1, 2011: By law, Census Bureau completes delivery of
redistricting data to states.
Source: U.S. Census Bureau6
Census Timeline

Azavea White Paper 11
Pennsylvania General Assembly
The Pennsylvania Constitution (Article II, Section 17) entrusts
the redrawing of state General Assembly districts to a Legisla-
tive Reapportionment Commission.7 Unlike the independent
redistricting commissions established in other states, Penn-
sylvania’s commission is composed of five members, “four
of whom shall be the majority and minority leaders of both
the Senate and the House of Representatives” or their depu-
ties. These four members select a fifth member to chair the
commission, provided that this person is a citizen of the Com-
monwealth and is not a paid local, State or Federal official.
The state Constitution sets forth a firm timeline for achieving
various benchmarks of the redistricting process, essentially
giving the commission seven to eight months to complete a
plan, submit it for public comment and make any necessary
changes.
Unlike in some states, the full Pennsylvania legislature is not
involved in drafting the redistricting plan, nor does it vote the
plan into law. Nevertheless, the redistricting plans generated
by the Legislative Reapportionment Commission have typically
favored incumbents; this should come as no surprise given the
partisan composition of the commission. In marked contrast
to the partisan gerrymandering characteristic of Congressional
redistricting plans, the manipulation that goes on with regard
to state legislative districts is best described as bipartisan in-
cumbent protection, a.k.a. a “sweetheart” gerrymander.
In these cases, incumbent legislators are protected by dis-
trict lines drawn to exclude promising challengers or to form
a more sympathetic electorate. In 1991 one potential candi-
date who had stated his intention to challenge an incumbent
Senator found that his house had been redrawn into a differ-
ent district. Another promising candidate, wise to these sorts
of tactics, went to extraordinary lengths to prevent legislative
leaders from drawing him out of the House district in which he
had made a good showing two years earlier. During the redis-
tricting process he moved to a series of undisclosed locations,
bought a decoy house, and eventually moved into the same
precinct as the incumbent.
Incumbents who have done a poor job of representing the vot-
ers may even be protected from their own constituents. In one
case, community members had organized to oppose a state
representative who had sold local farmland to be transformed
into a landfill, posing a threat to his re-election chances. In
the final version of the redistricting plan, the township where
the agitators were concentrated had been transplanted to a
neighboring district.
Redistricting of General Assembly seats also offers an oppor-
tunity to enforce party discipline. Those legislators on both
sides of the aisle who have bucked their party’s leadership
may find themselves out in the cold, either by being drawn
into hostile territory or through the elimination of their districts
altogether. Population shifts during the 1990s saw suburban
areas growing at the expense of urban centers in Philadelphia
and Pittsburgh. These demographic changes alone seem insuf-
ficient to explain the fact that in the final 2002 redistricting plan
the three Pittsburgh-area districts that were eliminated had
been represented by Democratic lawmakers who had clashed
frequently with their party’s leadership. Similarly, a Republican
representative from suburban Philadelphia found that the pre-
cinct in which his house was located had been combined with
a predominantly Democratic area, but the rest of his home-
town—his base of support—had been left behind.
Common Cause Pennsylvania and the League of Women Vot-
ers (LWV) collaborated on a 2008 effort to amend the state
• April 1, 20110: Deadline for the U.S. Census Bureau to pub-
lish the data required for redistricting.
• May 31, 2011: Sixty days after publication of the census
data, the state must name and certify four members of the
Legislative Reapportionment Commission.
• July 15, 2011: By forty-five days after certification, the Leg-
islative Reapportionment Commission must select a fifth
member who shall serve as chairperson of the commission.
• October 13, 2011: By ninety days after certification of the
commission (or after the publication of the census data,
whichever is later) it shall file a preliminary redistricting plan
with the Secretary of the Commonwealth.
PA State Redistricting Timeline
Azavea White Paper 12
Constitution by proposing a redistricting reform bill that would
remedy some of the worst abuses described above by pro-
hibiting the use of incumbent addresses as districting crite-
ria. Additionally, the legislation would establish clear criteria
for the legislature to use when drawing district boundaries,
and would require the legislature to conduct public hearings
on redistricting.8 Although it is now too late for the bill to pass
as a Constitutional amendment in time for the 2011 redistrict-
ing, Common Cause and LWV continue to advocate for a more
transparent process, and hope to succeed with the Constitu-
tional amendment in time for the 2021 round.
Philadelphia City Council
Within Philadelphia, the City Council redistricting process is
guided by the Home Rule Charter (Article II, Section 102),
which outlines a tight deadline and punitive measures if a plan
is not enacted expeditiously. Council has 60 days in which to
generate a plan, which the Mayor must sign or veto. The sev-
enteen-member Council can override the Mayor’s veto with a
twelve member majority or can devise and submit an alternate
plan. If the Council members are unable to secure approval of
a plan within six months, the City will withhold their paychecks
until a plan is agreed upon, at which time they will receive their
salaries with back pay.
The dynamics of redistricting at the local level typically reflect
the interests of individual politicians and local coalitions more
than partisanship. A particularly vicious redistricting battle in
2001 was largely the product of a power struggle between
Council President Anna Verna and Mayor John Street and his
allies on Council. The fight was precipitated by a district plan in
which rapidly developing areas of Center City would have been
transferred from the Fifth District of Darrell Clarke—a former
chief of staff to then newly elected Mayor (and former Coun-
cil President) John Street—to that of Council President Anna
Verna. At stake were wealthy constituents and access to pow-
erful developers with interests in the area. Allied with Clarke
against the other fifteen Council members was Rick Mariano
of the Seventh District.
The redistricting plan became the subject of a protracted
battle that involved numerous pieces of legislation as well as
the city’s unions and other local power brokers. As the fight
dragged on, Mayor Street wielded his redistricting veto power
to his advantage, forcing Council members to go without their
salaries in the face of his opponents’ inability to assemble a
veto-proof majority. In early February 2002, not having been
paid for months, Council approved the district proposal sup-
ported by Clarke and Mariano. Notably, under the plan that
they created, these Council Members represented two dis-
tricts—the Fifth and the Seventh—that have subsequently
been ranked as among the least compact and potentially most
gerrymandered city council districts in the nation (see Com-
pactness section, above).
In addition to the political dynamics of redistricting, Council
must weigh the impact of shifting city demographics as they
draw their plans. While Philadelphia’s total population has been
stagnant or contracted over the past few decades, the Latino
population has been steadily growing, concentrated largely in
North Philadelphia. The 1991 round of redistricting saw Council
devise a plan that would disperse Latino voters across four dis-
tricts, diluting their power as a voting bloc and denying them
the opportunity for geographical representation on Council.
Mayor Goode vetoed this plan and Council was unable to pass
a plan before a new mayor and Council were inaugurated in
1992. Ignoring protests of Latino leaders that the plan consti-
tuted vote suppression, the then-new City Council passed the
plan and the new Mayor at the time, Ed Rendell, declined to
veto it as his predecessor had done. One significant outcome
of the 2001 redistricting was the creation of a single district,
the Seventh, in which Latinos comprised more than 40% of
the population. After Rick Mariano, the district’s representative
on Council, was convicted on corruption charges and jailed in
2006, Maria Quiñones-Sánchez was elected to replace him,
attaining the geographical representation on Council that the
Latino community had long sought.
To date, there has been little momentum behind a local re-
districting reform movement in Philadelphia. During the 2001
redistricting standoff, then-Council member (and current May-
or) Michael Nutter introduced a proposal to amend the City
Charter to eliminate the mayor’s redistricting veto power and
to lift the salary suspension requirement, but it was not en-
acted. During the 2007 election campaign, the Committee of
Seventy—a non-partisan, non-profit organization cited as the

Azavea White Paper 13
region’s “premier government watchdog”—urged City Council
candidates to endorse “a non-partisan and independent citi-
zen’s commission to allow for an open and public process that
will result in a fair redistricting plan.” Mayor Nutter and nine
current council members (a majority) endorsed the plan at the
time, but to date they have taken no action on the proposal.9
Conclusion
When we began to research our first Gerrymandering white
paper in 2006 we were propelled largely by local concerns.
The Philadelphia-area legislative districts in which we lived
and worked seemed strangely contorted, but how bad were
they? Using the district shapes we had on hand as part of our
Cicero elected official database, we developed a nationwide
Gerrymandering Index that enabled us to compare Philadel-
phia legislative districts to those around the country. Now, in
anticipation of the 2010 Census and subsequent redistricting,
we have revised and expanded that white paper as Redrawing
the Map on Redistricting 2010: A National Study. Our research
into district compactness has underscored the point that an
open process is the key to successful redistricting.
For this case study we returned our attention to the Philadel-
phia region to examine the processes that shape our local dis-
tricts, and our analysis has led us to a few important conclu-
sions. First, the compactness calculations that we developed
in our national study demonstrate that non-compactness—a
potential flag for gerrymandering—is pervasive at every level
of government in the Philadelphia region. Second, the motiva-
tions and methods behind the manipulation of district bound-
aries vary based on spatial scale. The incentive to gerryman-
der a U.S. Congress district is often quite different than for a
Philadelphia City Council seat, and the process by which it is
achieved is distinct as well. There are committed reform orga-
nizations working at every legislative level, and they are able
to identify and advocate for the procedural changes that will be
most effectively prevent gerrymandering in a particular case.
However, there is one remedy that is common across spatial
scales: transparency. Reform advocates recognize that engag-
ing citizens and exposing the redistricting process to public
scrutiny is an essential way to ensure that legislative districts
are drawn with the interests of voters, rather than politicians,
in mind. Only when that happens will Philadelphians realize
Mayor Nutter’s hope of being inspired by government rather
than ashamed of it. Getting people informed and involved
is the key to bringing this change about. To this end, Azavea
has partnered with the Committee of Seventy to launch the
Redistricting the Philadelphia Region website. We believe that
armed with knowledge and the right tools, ordinary citizens
can help redraw the map on redistricting.
1 http://www.greatexpectations07.com/node/105
2 The New Jersey Constitution goes into a more detailed description of what constitutes population equality, and both states bar the di-vision of counties and various sorts of municipalities into multiple districts. Neither provides additional guidance on the meaning of “compact.”
3 Only 49 states have a lower legislative chamber because Nebraska governs through a unicameral legislature.
4 The analysis began with a group of more than 500 legislative dis-tricts drawn from 43 of the nation’s 50 most populous cities. For each measure of compactness, a normalized index score was cal-culated for those districts (approximately 100) whose compact-ness was far below the norm. The ranks that appear here are gen-erated after two rounds of analysis. When the rank N/A appears, it indicates that the district’s compactness was normal enough that no index score was calculated. For a complete explanation of our method, see Azavea’s Redrawing the Map on Reidstricting 2010: A National Study.
5 Baker, Peter. “Expand the House?” The New York Times. 17 September 2009. http://www.nytimes.com/2009/09/18/us/politics/18baker.html
6 U.S. Census Bureau, “2010 Census Timeline: Key Dates” http://2010.census.gov/2010census/about_2010_census/013279.html; U.S. Census Bureau, “Questions and Answers on Appor-tionment”
7 http://www.census.gov/population/www/censusdata/apportion-ment/faq.html
8 http://sites.state.pa.us/PA_Constitution.html
9 http://www.commoncause.org/site/pp.asp? c=dkLNK1MQIwG&b=4773689
10 The Council Members endorsing the plan were Blondell Reynolds Brown (D-AL), Bill Green (D-AL), Bill Greenlee (D-AL), Jack Kelly (R-AL), Frank Rizzo (R-AL), Frank DiCicco (D-1st), Anna Verna (D-2nd), Curtis Jones (D-4th), Maria Quiñones-Sánchez (D-7th); Com-mittee of Seventy, 2007 Ethics Agenda responses, http://www.seventy.org/Files/2007_CCEthics_Responses.pdf.