Embed Size (px)
Citation preview

U.S. Department of Health and Human ServicesCenters for Disease Control and Prevention
Morbidity and Mortality Weekly ReportWeekly / Vol. 65 / No. 16 April 29, 2016
Teen childbearing can have negative health, economic, and social consequences for mothers and their children (1) and costs the United States approximately $9.4 billion annually (2). During 1991–2014, the birth rate among teens aged 15–19 years in the United States declined 61%, from 61.8 to 24.2 births per 1,000, the lowest rate ever recorded (3). Nonetheless, in 2014, the teen birth rate remained approxi-mately twice as high for Hispanic and non-Hispanic black (black) teens compared with non-Hispanic white (white) teens (3), and geographic and socioeconomic disparities remain (3,4), irrespective of race/ethnicity. Social determinants asso-ciated with teen childbearing (e.g., low parental educational attainment and limited opportunities for education and employment) are more common in communities with higher proportions of racial and ethnic minorities (4), contributing to the challenge of further reducing disparities in teen births. To examine trends in births for teens aged 15–19 years by race/ethnicity and geography, CDC analyzed National Vital Statistics System (NVSS) data at the national (2006–2014), state (2006–2007 and 2013–2014), and county (2013–2014) levels. To describe socioeconomic indicators previously associ-ated with teen births, CDC analyzed data from the American Community Survey (ACS) (2010–2014). Nationally, from 2006 to 2014, the teen birth rate declined 41% overall with the largest decline occurring among Hispanics (51%), fol-lowed by blacks (44%), and whites (35%). The birth rate ratio for Hispanic teens and black teens compared with white teens declined from 2.9 to 2.2 and from 2.3 to 2.0, respec-tively. From 2006–2007 to 2013–2014, significant declines in teen birth rates and birth rate ratios were noted nationally and in many states. At the county level, teen birth rates for 2013–2014 ranged from 3.1 to 119.0 per 1,000 females aged 15–19 years; ACS data indicated unemployment was higher,
and education attainment and family income were lower in counties with higher teen birth rates. State and county data can be used to understand disparities in teen births and imple-ment community-level interventions that address the social and structural conditions associated with high teen birth rates.
NVSS natality files are compiled annually by CDC’s National Center for Health Statistics and include demographic information, such as maternal age, race, and Hispanic ethnicity, for births in all 50 states and the District of Columbia (DC) (3). CDC calculated teen birth rates (number of births per 1,000 females aged 15–19 years) at the national, state, and county level, and birth rate ratios (the birth rates for black
Reduced Disparities in Birth Rates Among Teens Aged 15–19 Years — United States, 2006–2007 and 2013–2014
Lisa Romero, DrPH1; Karen Pazol, PhD1; Lee Warner, PhD1; Shanna Cox, MSPH1; Charlan Kroelinger, PhD1; Ghenet Besera, MPH1; Anna Brittain, MHS1; Taleria R. Fuller, PhD1; Emilia Koumans, MD1; Wanda Barfield, MD1
INSIDE415 Opioid Prescriptions Among Women of Reproductive
Age Enrolled in Medicaid — New York, 2008–2013418 Food and Drug Administration Approval for Use of
Hiberix as a 3-Dose Primary Haemophilus influenzae Type b (Hib) Vaccination Series
420 Counterfeit Norco Poisoning Outbreak — San Francisco Bay Area, California, March 25–April 5, 2016
424 Notes from the Field: Primary Amebic Meningoencephalitis Associated with Exposure to Swimming Pool Water Supplied by an Overland Pipe — Inyo County, California, 2015
425 Notes from the Field: Health Care–Associated Hepatitis A Outbreak — Texas, 2015
427 Announcement428 QuickStats
Continuing Education examination available at http://www.cdc.gov/mmwr/cme/conted_info.html#weekly.
Morbidity and Mortality Weekly Report
410 MMWR / April 29, 2016 / Vol. 65 / No. 16 US Department of Health and Human Services/Centers for Disease Control and Prevention
The MMWR series of publications is published by the Center for Surveillance, Epidemiology, and Laboratory Services, Centers for Disease Control and Prevention (CDC), U.S. Department of Health and Human Services, Atlanta, GA 30329-4027.Suggested citation: [Author names; first three, then et al., if more than six.] [Report title]. MMWR Morb Mortal Wkly Rep 2016;65:[inclusive page numbers].
Centers for Disease Control and PreventionThomas R. Frieden, MD, MPH, Director
Harold W. Jaffe, MD, MA, Associate Director for Science Joanne Cono, MD, ScM, Director, Office of Science Quality
Chesley L. Richards, MD, MPH, Deputy Director for Public Health Scientific ServicesMichael F. Iademarco, MD, MPH, Director, Center for Surveillance, Epidemiology, and Laboratory Services
MMWR Editorial and Production Staff (Weekly)Sonja A. Rasmussen, MD, MS, Editor-in-Chief
Charlotte K. Kent, PhD, MPH, Executive Editor Jacqueline Gindler, MD, Editor
Teresa F. Rutledge, Managing Editor Douglas W. Weatherwax, Lead Technical Writer-Editor
Soumya Dunworth, PhD, Teresa M. Hood, MS, Technical Writer-Editors
Martha F. Boyd, Lead Visual Information SpecialistMaureen A. Leahy, Julia C. Martinroe,
Stephen R. Spriggs, Moua Yang, Tong Yang,Visual Information Specialists
Quang M. Doan, MBA, Phyllis H. King, Terraye M. Starr,Information Technology Specialists
MMWR Editorial BoardTimothy F. Jones, MD, ChairmanMatthew L. Boulton, MD, MPH
Virginia A. Caine, MD Katherine Lyon Daniel, PhD
Jonathan E. Fielding, MD, MPH, MBADavid W. Fleming, MD
William E. Halperin, MD, DrPH, MPHKing K. Holmes, MD, PhD
Robin Ikeda, MD, MPH Rima F. Khabbaz, MD
Phyllis Meadows, PhD, MSN, RNJewel Mullen, MD, MPH, MPA
Jeff Niederdeppe, PhDPatricia Quinlisk, MD, MPH
Patrick L. Remington, MD, MPH Carlos Roig, MS, MA
William L. Roper, MD, MPH William Schaffner, MD
teens and for Hispanic teens compared with white teens), as measures of disparities at the national and state level. This report includes national data for 2006–2014. For state-specific comparisons, 2 years of data were combined for 2006–2007 and 2013–2014 to provide reliable estimates for each race/ethnicity group (numerators ≥20). Changes over time were evaluated using a Z-test (for birth rates based on counts ≥100), or through a comparison of Poisson probability distributions (for birth rates based on counts <100, and for birth rate ratios). County-specific data were reported for 2013–2014 combined, and excluded counties with <20 teen births in total, resulting in a final data set accounting for 76% of all counties and 99% of all teen births in the United States.
The most recent 5-year estimate (2010–2014) from the U.S. Census Bureau’s ACS was used to describe key socioeconomic indicators. The ACS is a continual nationwide survey that col-lects detailed information on demographic, social, economic, and housing characteristics (5). Three markers of economic opportunity and perceived potential for future opportunities, previously used as indicators of social determinants for teen childbearing (6), were selected (i.e., percentage of the popula-tion aged ≥16 years unemployed, percentage of the population aged ≥25 years with an associate’s degree or higher, and median family income). The value for each indicator was compared between U.S. counties in highest and lowest quintiles of teen birth rates for 2013–2014. T-tests were used to evaluate dif-ferences (p<0.05).
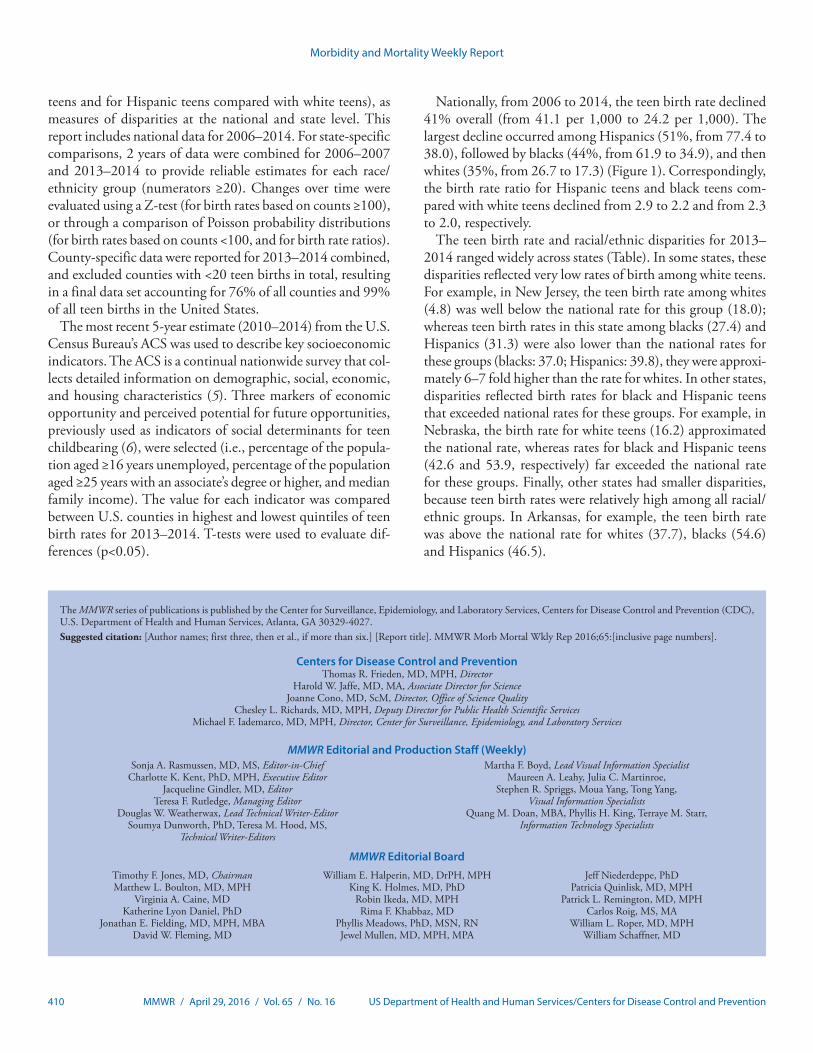
Nationally, from 2006 to 2014, the teen birth rate declined 41% overall (from 41.1 per 1,000 to 24.2 per 1,000). The largest decline occurred among Hispanics (51%, from 77.4 to 38.0), followed by blacks (44%, from 61.9 to 34.9), and then whites (35%, from 26.7 to 17.3) (Figure 1). Correspondingly, the birth rate ratio for Hispanic teens and black teens com-pared with white teens declined from 2.9 to 2.2 and from 2.3 to 2.0, respectively.
The teen birth rate and racial/ethnic disparities for 2013–2014 ranged widely across states (Table). In some states, these disparities reflected very low rates of birth among white teens. For example, in New Jersey, the teen birth rate among whites (4.8) was well below the national rate for this group (18.0); whereas teen birth rates in this state among blacks (27.4) and Hispanics (31.3) were also lower than the national rates for these groups (blacks: 37.0; Hispanics: 39.8), they were approxi-mately 6–7 fold higher than the rate for whites. In other states, disparities reflected birth rates for black and Hispanic teens that exceeded national rates for these groups. For example, in Nebraska, the birth rate for white teens (16.2) approximated the national rate, whereas rates for black and Hispanic teens (42.6 and 53.9, respectively) far exceeded the national rate for these groups. Finally, other states had smaller disparities, because teen birth rates were relatively high among all racial/ethnic groups. In Arkansas, for example, the teen birth rate was above the national rate for whites (37.7), blacks (54.6) and Hispanics (46.5).
Morbidity and Mortality Weekly Report
MMWR / April 29, 2016 / Vol. 65 / No. 16 411US Department of Health and Human Services/Centers for Disease Control and Prevention
From 2006–2007 to 2013–2014, the overall birth rate for teens declined significantly in every state, with the percentage decline ranging from 13% (North Dakota) to 48% (Arizona). In nearly every state, there was a significant decline for all three racial/ethnic groups assessed (Table). In many states disparities also declined significantly from 2006–2007 to 2013–2014; the birth rate ratio declined significantly for black teens compared with white teens in 28 states and for Hispanic teens compared with white teens in 37 states (p<0.05). However, states with the largest percentage decline in teen births did not necessarily have the largest declines in racial/ethnic disparities (Table).
U.S. county-level teen birth rates for 2013–2014 ranged from 3.1 to 119.0, with median rates of 14.6 and 57.1 for the counties in the lowest and highest quintiles for teen birth rates, respectively (Figure 2). Many counties with teen birth rates in the highest quintile were clustered in the south and southwest; some states with low overall birth rates also had counties in the highest quintile.
Data from ACS indicated that among counties in the high-est quintile for teen birth rates, the mean percentage of the population aged ≥16 years unemployed, mean percentage of the population aged ≥25 years with an associate’s degree or higher,
and mean family income were 10.5%, 19.9% and $46,005, respectively. By comparison, values for all three socioeconomic indicators were more favorable among counties in the lowest quintile for teen birth rates, at 7.6%, 40.4% and $73,967, respectively (p<0.001, for all comparisons).
Discussion
Significant declines in racial/ethnic disparities have accom-panied the historic decline in the overall teen birth rate in the United States since 2006. Nationally, and in many states, the largest decline occurred among Hispanic teens followed by black and then white teens. Nonetheless, racial/ethnic and geographic disparities remain, both within and across states, and even where large declines in teen birth rates have occurred. The variation in county-level data reinforces the need to use local data to focus teen pregnancy prevention efforts on com-munities with the greatest need.
To address persistent disparities in teen births, the U.S. Department of Health and Human Services (HHS) Office of Adolescent Health partnered with CDC during 2010–2015 to fund community-wide initiatives in nine communities with some of the highest teen birth rates in the United States (7,8).
0
10
20
30
40
50
60
70
80
90
2006 2007 2008 2009 2010 2011 2012 2013 2014
Birt
hs p
er 1
,000
fem
ales
age
d 15
–19
year
s
Year
HispanicBlack, non-HispanicWhite, non-Hispanic
FIGURE 1. Birth rates for females aged 15–19 years — National Vital Statistics System, United States, 2006–2014

Morbidity and Mortality Weekly Report
412 MMWR / April 29, 2016 / Vol. 65 / No. 16 US Department of Health and Human Services/Centers for Disease Control and Prevention
TABLE. Birth rates* among females aged 15–19 years, by state and by race/ethnicity,† and birth rate ratios for non-Hispanic blacks (blacks)§ and Hispanics¶ compared with non-Hispanic whites (whites) — National Vital Statistics System, United States, 2006–2007 and 2013–2014
State
Birth rate* 2013–2014 Birth rate ratio 2013–2014% change in birth rate 2006–2007
to 2013–2014**% change in birth rate ratio 2006–2007 to 2013–2014**
Overall White Black Hispanic Black:white§ Hispanic:white¶ Overall White Black Hispanic Black:white§ Hispanic:white¶
United States 25.4 18.0 37.0 39.8 2.1 2.2 -38.5 -33.3 -40.3 -47.8 -8.7 -21.4Alabama 33.2 29.4 39.3 49.7 1.3 1.7 -36.2 -27.9 -40.1 -66.4 -18.8 -52.8Alaska 29.1 20.5 30.0 27.5 1.5 1.3 -31.2 -25.2 -43.3 -53.5 -21.1†† -40.9Arizona 31.5 17.9 35.5 43.9 2.0 2.5 -47.8 -41.7 -37.3 -55.7 11.1†† -21.9Arkansas 41.5 37.7 54.6 46.5 1.4 1.2 -31.4 -25.6 -35.1 -55.9 -17.6 -42.9California 22.4 10.0 28.0 33.3 2.8 3.3 -43.6 -39.8 -36.8 -48.8 3.7†† -15.4Colorado 21.9 13.5 24.2 41.2 1.8 3.1 -47.5 -39.5 -55.2 -56.8 -25.0 -27.9Connecticut 12.2 5.1 20.4 34.3 4.0 6.7 -47.6 -49.5 -53.6 -49.5 -9.1†† 0.0††
Delaware 22.7 15.4 32.9 40.7 2.1 2.6 -43.1 -36.1 -45.9 -60.3 -16.0 -38.1District of
Columbia30.3 1.8 44.2 49.1 24.6 27.3 -38.5 -45.5†† -30.7 -55.7 27.5†† -18.8††
Florida 23.6 18.8 35.9 24.4 1.9 1.3 -45.1 -37.3 -42.6 -57.0 -9.5 -31.6Georgia 29.5 23.3 36.0 43.8 1.5 1.9 -45.0 -40.4 -43.5 -63.8 -6.3 -38.7Hawaii 24.1 18.6 19.2 42.7 1.0 2.3 -37.9 -41.0 -44.8 -49.5 -9.1†† -14.8††
Idaho 24.5 20.5 17.6 43.8 0.9 2.1 -37.2 -34.1 -35.5†† -52.7 0.0†† -30.0Illinois 23.7 13.7 46.1 35.4 3.4 2.6 -40.8 -34.1 -39.6 -51.6 -8.1 -25.7Indiana 29.1 26.0 44.1 41.3 1.7 1.6 -31.4 -27.0 -41.3 -50.5 -19.0 -30.4Iowa 21.0 17.1 46.6 46.3 2.7 2.7 -35.8 -38.0 -38.8 -49.3 -3.6†† -18.2Kansas 28.6 22.6 43.0 53.3 1.9 2.4 -31.4 -29.6 -41.3 -43.4 -17.4 -17.2Kentucky 37.4 37.0 41.5 44.7 1.1 1.2 -28.6 -24.6 -40.0 -61.5 -21.4 -50.0Louisiana 37.5 30.3 47.5 48.1 1.6 1.6 -31.1 -24.1 -36.9 -26.0 -15.8 0.0††
Maine 16.9 16.7 25.8 17.0 1.5 1.0 -33.7 -33.5 -30.8†† -43.1†† 0.0†† -16.7††
Maryland 18.6 10.5 27.3 39.6 2.6 3.8 -45.3 -47.8 -45.5 -49.2 4.0†† -2.6††
Massachusetts 11.3 6.0 17.1 38.4 2.9 6.4 -46.2 -54.9 -52.2 -38.2 7.4†† 36.2††
Michigan 22.3 16.4 45.3 32.5 2.8 2.0 -33.2 -31.4 -29.2 -53.6 3.7†† -31.0Minnesota 16.1 10.8 35.5 39.8 3.3 3.7 -41.7 -40.0 -47.2 -57.8 -10.8 -28.8Mississippi 40.3 33.2 48.6 41.9 1.5 1.3 -41.3 -35.9 -43.6 -61.4 -11.8 -38.1Missouri 28.6 25.2 44.5 41.5 1.8 1.6 -35.0 -31.3 -39.5 -52.0 -10.0 -33.3Montana 27.1 21.4 —§§ 34.5 NA 1.6 -25.5 -25.2 —§§ -28.3 NA -5.9††
Nebraska 23.6 16.2 42.6 53.9 2.6 3.3 -30.8 -27.4 -51.1 -46.6 -33.3 -26.7Nevada 29.4 20.0 41.5 39.5 2.1 2.0 -44.0 -37.3 -35.6 -54.2 5.0†† -25.9New Hampshire 11.8 11.4 14.0 22.5 1.2 2.0 -36.9 -36.3 -40.9†† -48.9 -7.7†† -20.0††
New Jersey 14.0 4.8 27.4 31.3 5.7 6.5 -43.8 -44.8 -43.4 -47.7 1.8†† -5.8††
New Mexico 40.5 22.8 27.3 48.2 1.2 2.1 -36.0 -33.5 -47.8 -40.3 -20.0†† -12.5New York 16.9 10.2 24.2 31.7 2.4 3.1 -35.0 -29.7 -38.3 -39.8 -11.1 -13.9North Carolina 27.2 19.7 35.4 48.5 1.8 2.5 -43.3 -40.3 -42.4 -61.5 -5.3†† -34.2North Dakota 24.0 18.2 36.8 52.0 2.0 2.9 -13.4 -5.7†† -5.6†† -33.2†† 0.0†† -27.5Ohio 26.1 21.5 46.9 41.5 2.2 1.9 -33.8 -32.0 -37.0 -45.3 -8.3 -20.8Oklahoma 40.7 35.8 46.9 58.0 1.3 1.6 -29.3 -25.6 -33.6 -39.5 -13.3 -20.0Oregon 20.8 16.5 29.5 39.1 1.8 2.4 -39.7 -36.8 -35.9 -54.1 0.0†† -27.3Pennsylvania 20.1 13.8 38.9 48.7 2.8 3.5 -34.1 -31.0 -41.1 -42.9 -15.2 -18.6Rhode Island 16.7 10.0 24.8 40.9 2.5 4.1 -41.2 -38.7 -53.7 -44.6 -24.2 -8.9††
South Carolina 30.0 24.9 37.3 45.5 1.5 1.8 -42.2 -34.6 -44.2 -64.9 -16.7 -47.1South Dakota 27.6 17.2 28.6 47.3 1.7 2.8 -31.0 -33.8 -40.4†† -47.0 -5.6†† -17.6††
Tennessee 33.8 29.6 45.2 50.8 1.5 1.7 -35.9 -31.0 -37.1 -64.8 -11.8 -50.0Texas 39.4 23.4 39.3 54.7 1.7 2.3 -36.1 -31.4 -38.9 -40.5 -10.5 -14.8Utah 20.0 14.5 24.5 46.5 1.7 3.2 -41.7 -41.1 -55.9 -52.0 -26.1 -17.9Vermont 14.4 14.8 19.7 —§§ 1.3 NA -29.4 -29.2 —§§ —§§ NA NAVirginia 19.3 15.0 28.5 32.6 1.9 2.2 -43.6 -37.5 -45.9 -56.6 -13.6 -29.0Washington 19.8 14.9 22.3 41.4 1.5 2.8 -39.6 -38.2 -49.5 -50.4 -16.7 -20.0West Virginia 38.3 39.2 33.8 26.8 0.9 0.7 -14.9 -13.3 -35.1 -28.3†† -25.0 -12.5††
Wisconsin 18.8 11.8 53.8 41.3 4.6 3.5 -38.4 -38.5 -38.2 -50.3 2.2†† -18.6Wyoming 29.9 27.7 19.8 40.1 0.7 1.4 -37.7 -31.6 -72.3 -56.0 -61.1 -39.1
Abbreviation: NA = not applicable. * Number of births per 1,000 females aged 15–19 years. † Teens categorized as black or white were non-Hispanic. Teens categorized as Hispanic might be of any race. Other racial ethnic populations were too small for
meaningful analysis. § Birth rate for non-Hispanic black teens divided by the birth rate for non-Hispanic white teens. ¶ Birth rate for Hispanic teens divided by the birth rate for non-Hispanic white teens. ** Overall for the United States, and unless otherwise indicated for individual states, the decline from 2006–2007 to 2013–2014 was significant (p<0.05). †† The decrease from 2006–2007 to 2013–2014 was not statistically significantly (p>0.05). §§ Figure does not meet standards of reliability or precision; based on >20 births in the numerator.

Morbidity and Mortality Weekly Report
MMWR / April 29, 2016 / Vol. 65 / No. 16 413US Department of Health and Human Services/Centers for Disease Control and Prevention
This effort focused on black and Hispanic teens and integrated activities that addressed social determinants of health at the community level (8). Participating communities examined local data to develop their activities. Examples of activities included presenting community-specific teen birth data to civic leaders; encouraging health care providers to offer evening and weekend hours and low-cost services to increase access; having teen-focused, culturally appropriate materials available dur-ing health care visits; and implementing evidence-based teen pregnancy prevention programs to reach teens of both sexes both inside and outside of schools (e.g., through Job Corps, alternative schools, churches, and community colleges) (8). Preliminary data (9) indicate that each community increased the number of teens who received reproductive health services and evidence-based interventions, as well as the proportion of teens who received moderately or highly effective contraceptive methods. Many aspects of the community-wide initiatives have been incorporated in Teen Pregnancy Prevention Replication
grants awarded in 2015 by the Office of Adolescent Health to communities with the greatest need (10).
The findings in this report are subject to at least three limi-tations. First, teen birth rate estimates for some racial/ethnic groups (i.e., American Indian/Alaskan Natives and Asian Pacific Islanders in all states; blacks in Montana; Hispanics in Vermont; and all racial/ethnic groups by county) were not available at the state and county level because of small popula-tion sizes. Second, while this report examined each major race/ethnicity group overall, there are differences in teen birth rates among subgroups within these populations, such as Mexican, Puerto Rican, and Cuban persons of Hispanic ethnicity (3). Finally, information on economic data, unemployment, and educational attainment provides useful information about community context for preventing teen pregnancy, but does not provide a direct link with individual-level factors.
Despite substantial declines in teen births in the United States, disparities by race/ethnicity and geography persist,
FIGURE 2. Births per 1,000 females aged 15–19 years, by county of residence — National Vital Statistics System, United States, 2013–2014
≥48.2 (1st quintile)37.5–48.1 (2nd quintile)29.0–37.4 (3rd quintile)20.8–28.9 (4th quintile)≤20.7 (5th quintile)Data not available

Morbidity and Mortality Weekly Report
414 MMWR / April 29, 2016 / Vol. 65 / No. 16 US Department of Health and Human Services/Centers for Disease Control and Prevention
highlighting the continuing need for teen pregnancy preven-tion efforts. Understanding disparities in teen birth rates and the multiple causes at the local level can help target effective interventions for populations with the greatest need (4). Ongoing efforts to integrate social determinants of health into teen pregnancy prevention program play a critical role in addressing racial/ethnic and geographical disparities observed in teen births in the United States.
SummaryWhat is already known about this topic?
Despite record declines in the rate of births among teens, racial/ethnic and geographic disparities persist.
What is added by this report?
From 2006 to 2014, the birth rate for teens aged 15–19 years declined 41% overall (from 41.1 to 24.2 per 1,000 females). The greatest decline was for Hispanics (51%), followed by non-Hispanic blacks (blacks) (44%), and non-Hispanic whites (whites) (35%). From 2006–2007 to 2013–2014, the overall birth rate for teens declined significantly in every state, with declines ranging from 13% in North Dakota to 48% in Arizona; the birth rate ratio also declined for black teens compared with white teens in 28 states and for Hispanic teens compared with white teens in 37 states. County-level teen birth rates for 2013–2014 ranged from 3.1 to 119.0 per 1,000 females aged 15–19 years; unemployment was higher, and education attainment and family income were lower in counties with higher teen birth rates.
What are the implications for public health practices?
Community-level interventions that address the social condi-tions associated with high teen birth rates might further reduce racial/ethnic and geographic teen birth disparities in the United States. State and county-level data can be used to identify populations with the greatest need.
Acknowledgments
Amy Branum, PhD, Brady Hamilton, PhD, Lauren Rossen, PhD, Division of Vital Statistics, National Center for Health Statistics, CDC; Evelyn Kappeler, Amy Farb, PhD, Amy Margolis, MPH, Office of Adolescent Health, HHS; Leandris Liburd, PhD, Ana Penman-Aguilar, PhD, Office of Minority Health and Health Equity, CDC; Danielle Barradas, PhD, Mary D. Brantley, MPH, Amy Fasula, PhD, Stacy Fentress, MA, Sean Kennedy, MPH, Joan Kraft, PhD, Nikki Mayes, ABJ, Kelly Morris, MPH, Wilda Parker, MPH, Maria Rivera, MPH, Jackie Rosenthal, MPH, Ruben Smith, PhD, Linda West, MSPH, Division of Reproductive Health, CDC.
1Division of Reproductive Health, National Center for Chronic Disease Prevention and Health Promotion, CDC.
Corresponding author: Lisa Romero, [email protected], 770-488-8393.
References 1. Hoffman SD. Updated estimates of the consequences of teen childbearing
for mothers. In: Hoffman S, Maynard R, eds. Kids having kids: economic costs and social consequences of teen pregnancy. Washington, DC: The Urban Institute Press; 2008:74–118.
2. National Campaign to Prevent Teen and Unplanned Pregnancy. Counting it up: the public costs of teen childbearing. Washington, DC: National Campaign to Prevent Teen and Unplanned Pregnancy; 2013. http://thenationalcampaign.org/why-it-matters/public-cost
3. Hamilton BE, Martin JA, Osterman MJK, Curtin SC, Mathews TJ. Births: final data for 2014. Natl Vital Stat Rep 2015;64:1–64.
4. Penman-Aguilar A, Carter M, Snead MC, Kourtis AP. Socioeconomic disadvantage as a social determinant of teen childbearing in the US. Public Health Rep 2013;128(Suppl 1):5–22.
5. US Census Bureau. American Community Survey (ACS): technical documentation. Suitland, MD: US Census Bureau; 2015. https://www.census.gov/programs-surveys/acs/technical-documentation.html
6. Kraft JM, Kulkarni A, Hsia J, Jamieson DJ, Warner L. Sex education and adolescent sexual behavior: do community characteristics matter? Contraception 2012;86:276–80. http://dx.doi.org/10.1016/j.contraception.2012.01.004
7. Kappeler EM, Farb AF. Historical context for the creation of the Office of Adolescent Health and the Teen Pregnancy Prevention Program. J Adolesc Health 2014;54(Suppl):S3–9. http://dx.doi.org/10.1016/j.jadohealth.2013.11.020
8. CDC. Communitywide teen pregnancy prevention initiatives. Atlanta, GA: US Department of Health and Human Services, CDC; 2015. http://www.cdc.gov/TeenPregnancy/PreventTeenPreg.htm
9. CDC. Final performance measure data for the CDC/OAH communitywide teen pregnancy prevention initiatives (Unpublished report). Atlanta, GA: US Department of Health and Human Services, CDC; 2016.
10. US Department of Health and Human Services. HHS awards Teen Pregnancy Prevention Program grants. Washington, DC: US Department of Health and Human Services; 2015. http://www.hhs.gov/about/news/2015/07/06/hhs-awards-teen-pregnancy-prevention-program-grants


![Meet mullen[1]](https://img.pdfslide.net/doc/110x75/54519d3aaf795911068b5332/meet-mullen1.jpg)