Embed Size (px)
Citation preview
8/14/2019 Reduced insulin secretion: an independent predictor of body weight gain
http://slidepdf.com/reader/full/reduced-insulin-secretion-an-independent-predictor-of-body-weight-gain 1/6
8/14/2019 Reduced insulin secretion: an independent predictor of body weight gain
http://slidepdf.com/reader/full/reduced-insulin-secretion-an-independent-predictor-of-body-weight-gain 2/6
1572 SCHWARTZ ET AL. JCE & M . 1995Vol80. No 5
included normal findings from history and physical exa mination and
routine laboratory tests. Informed consent was given by each subject,
and studies were approved by the ethics committees of the NIDDK, the
Indian Health Service, and the Tribal Council of the Gila River India n
Community. Subjects were admitted to the metabolic research ward
annually for 8-16 days, during which time they were fed a weight
maintenance diet (50% of calories as carbohydrate, 30% as fat, and 20%
as protein). Body composition was assessed by underwater weighin g (7),
insulin sensitivity assessed by euglycemic, hyperinsulinemic clamp, and
insulin secretion was determined from the results of an iv glucose
tolerance test, a meal tolerance test (MIT), and a 75-g oral glucose
tolerance test (OGTT). Any subjects who met National Diabetes Data
Group criteria for impaired glucose tolerance (2-h plasma glucose value
of 140-199 mg/dL during the OGTT) were excluded u priori from the
present analysis. Of 135 subjects in whom all studies were performed,
38 were excluded because of impaired glucose tolerance, leaving 97
subjects for the present analysis. Data obtained from some subjects were
included in previous publications (4); however, the requirement for
normal oral glucose tolerance and determination of insulin secretion in
response to 3 different challenges yielded a population whose compo-
sition is unique to the current study. Changes in both weight and body
fat mass (determined from underwater weighing) from the first to the
last admission, with a minim um of 6 months between visits, were used
for all analyses.
Determina tion of insulin secretion and insulin sens itivity
Immunoreactive insulin (IRI) concentrations were determined in
plasma samples by RIA, using the Herbert modification (8) of the
method of Yalow and Berson (91, and glucose levels were determined by
the glucose oxidase method (Beckman Instruments, Fullerton, CA). Af-
ter 8-15 days on the metabolic ward, insulin sensitivity was determined
as the rate of glucose infusion during a euglycemic hyperinsulinemic
clamp (M) (lo), modifie d as previously described (11). Insulin was
infused iv, first at a low dose (40 mLJ/m’ body surface area.min) for 100
min, then at a high dose (400/m’ body surface area.min) for an addi-
tional 100 min while euglycemia was maintain ed by a variable rate iv
20% glucose infusion. Measurement of the rate of endogenous glucose
production using iv infusion of tracer amounts of [3-3H]glucose was
performed before and during the low dose insulin infusion (12). The rate
of glucose infusion during the last 40 min of both low and high dose
insulin infusions and the rate of endogenous glucose production during
the low dose insulin infusions were used to calculate insulin-mediatedglucose disposal rates (referred to as submax M and max M, respec-
tively), as previously described (11,121. Insulin secretion was measured
using three different procedures. Subjects underwent an iv glucose
tolerance test using a 25 g iv glucose infusion over 3.6 min to quantify
insulin secretion. Plasma sam ples were obtained at baseline and 3,4, and
5 min after iv glucose administration, and glucose-stimulated insulin
secretion was assessed as the acute insulin response to glucose (AIRg),
determined as half the incremental area under the curve of plasma IRI
from the third to the fifth minute after the glucose bolus. After an
overnight fast, subjects underwent a 75-g OGTI and, on a separate day,
consumption of a standardized breakfast containing 30% of the weight-
maintain ing caloric requirement, composed of 20% protein, 40% carbo-
hydrate, and 40% fat (13). Insulin levels were determined in plasma
samples obtained at baseline; at 30, 60, 120, and 180 min during the
OGTT; and 0,30,60,90,120,150,180 ,210, and 240 min after the meal.
The insulin secretory response was quantified as the incremental area
under the curve of IRI during the OGTT and M’IT, and was computed
using the trapezoidal approximation (14).
Stat ist ical methods
The percent total weight gain per yr was calculated as final weight
minus initial w eight divided by initial w eight and number of years of
follow-up multip lied by 100. The percent fat mass gain per yr was
calculated as final body fat mass minus initial body fat mass divided by
initial body fat mass and number of years of follow-up multip lied by 100.
For regression analysis, dependent variables of interest were percent
weight change per yr and percent fat mass change per yr. The
relationships between each of these outcomes and independe nt
variables of interest, including the three measures of insulin secretion,
were examined using univariate and multiple linear regression analysis
(15,161. Multip le regression models examined the relationship between
insulin secretion in response to a meal, an OGTT, and the AIRg and each
outcome while adjusting for age in years, sex, submax M or max M, and
initial body weight.
Results
Baseline characteristics
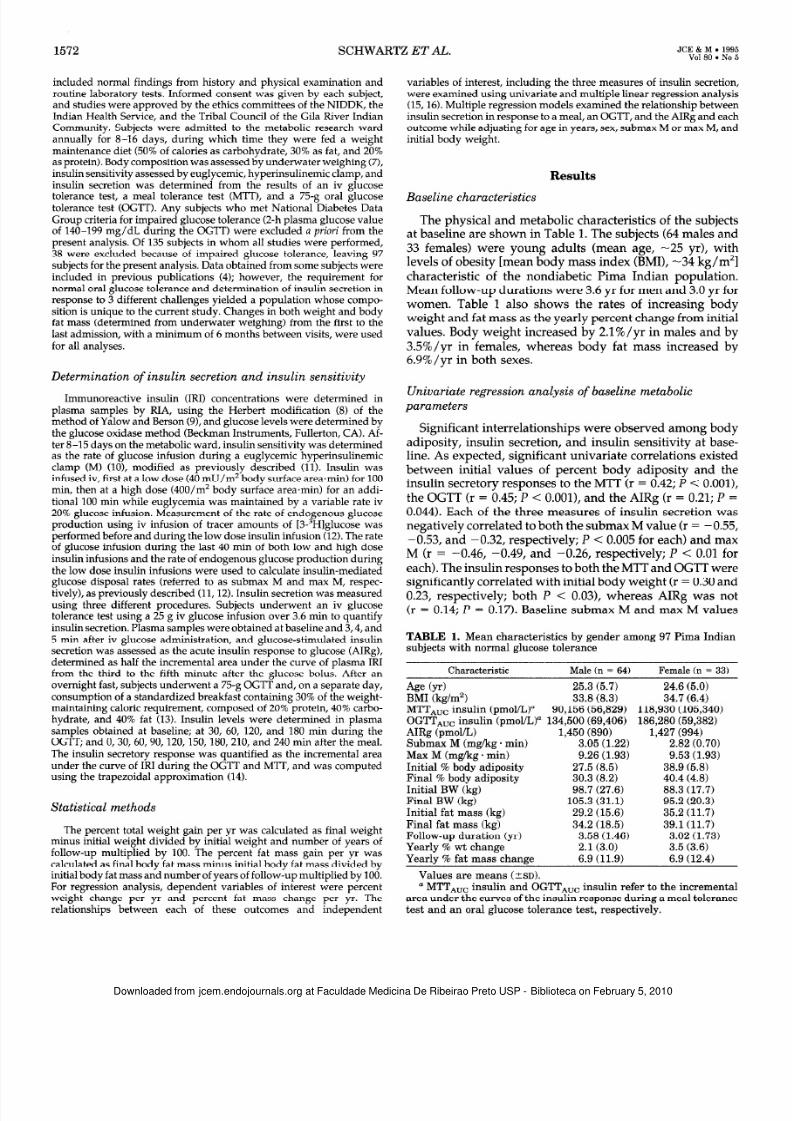
The physical and metabolic characteristics of the subjectsat baseline are shown in Table 1. The subjects (64 males and33 females) were young adults (mean age, -25 yr), withlevels of obesity [mean body mass index (BMI), -34 kg/m’]characteristic of the nondiabetic Pima Indian population.Mean follow-up durations were 3.6 yr for men and 3.0 yr forwomen. Table 1 also shows the rates of increasing bodyweight and fat mass as the yearly percent change from initialvalues. Body weight increased by 2.l%/yr in males and by3.5%/yr in females, whereas body fat mass increased by6.9%/yr in both sexes.
Univariate regression analysis of baseline metabolic
parameters
Significant interrelationships were observed among bodyadiposity, insul in secretion, and insulin sens itivi ty at base-line. As expected, significant univariate correlations existedbetween initial va lues of percent body adipos ity and theinsul in secretory responses to the MTT (r = 0.42; P < 0.0011,the OGTT (r = 0.45; P < O.OOl),and the AIRg (r = 0.21; P =0.044). Each of the three measures of insulin secretion wasnegatively correlated to both the submax M value (r = -0.55,-0.53, and -0.32, respectively; P < 0.005 for each) and maxM (r = -0.46, -0.49, and -0.26, respect ively; P < 0.01 for
each). The insulin responses to both the MTT and OGTT weresignif icantly correlated with in itial body weight (r = 0.30 and0.23, respectively; both P < 0.031, whereas AIRg was not(r = 0.14; P = 0.17). Baseline submax M and max M values
TABLE 1. Mean characteristics by gender amo ng 97 Pima Indian
subjects with normal glucose tolerance
Characteristic Male (n = 64) Female (n = 33)
Age (yr) 25.3 (5.7) 24.6 (5.0)
BMI (kg/m’) 33.8 (8.3) 34.7 (6.4)
MTTmo insulin (pmol/LP 90,156 (56,829) 118,930 (105,340)
OGTT,,, insulin (pmol/L)” 134,500 (69,406) 186,280 (59,382)
AIRg fpmol/L) 1,450 (890) 1,427 (994)
Submax M (mg/kg * min) 3.05 (1.22) 2.82 (0.70)
Max M (mg/kg * min) 9.26 (1.93) 9.53 (1.93)
Initial % body adiposity 27.5 (8.5) 38.9 (5.8)
Final % body adiposity 30.3 (8.2) 40.4 (4.8)
Initial BW (kg) 98.7 (27.6) 88.3 (17.7)
Final BW (kg) 105.3 (31.1) 95.2 (20.3)
Initial fat mass (kg) 29.2 (15.6) 35.2 (11.7)
Final fat mass (kg) 34.2 (18.5) 39.lQ1.7)
Follow-up duration (yr) 3.58 (1.46) 3.02 (1.73)
Yearly % wt change 2.1(3.0) 3.5 (3.6)
Yearly % fat mass change 6.9 (11.9) 6.9 (12.4)
Values are means (23D).
a MTTAUC insulin and OG’M’*uo insulin refer to the incremental
area under the curves of the insulin response during a meal tolerance
test and an oral glucose tolerance test, respectively.
at Faculdade Medicina De Ribeirao Preto USP - Biblioteca on February 5, 2010 jcem.endojournals.orgDownloaded from
8/14/2019 Reduced insulin secretion: an independent predictor of body weight gain
http://slidepdf.com/reader/full/reduced-insulin-secretion-an-independent-predictor-of-body-weight-gain 3/6
INSULIN SECRETION PREDICTS WEIGHT GAIN 1573
were significantly correlated with both initial weight (r =
-0.51; P < 0.001 and r = -0.41; P < 0.001, respectively ) andfat mass (r = -0.54; P < 0.001 and r = -0.37; P < 0.001,
respectively). Fasting plasma IRI levels were highly corre-
lated to initial fat mass (r = 0.70; P < O.OOl),submax M (r =-0.62; P < 0.0011, and max M (r = -0.46; P < 0.001) values.
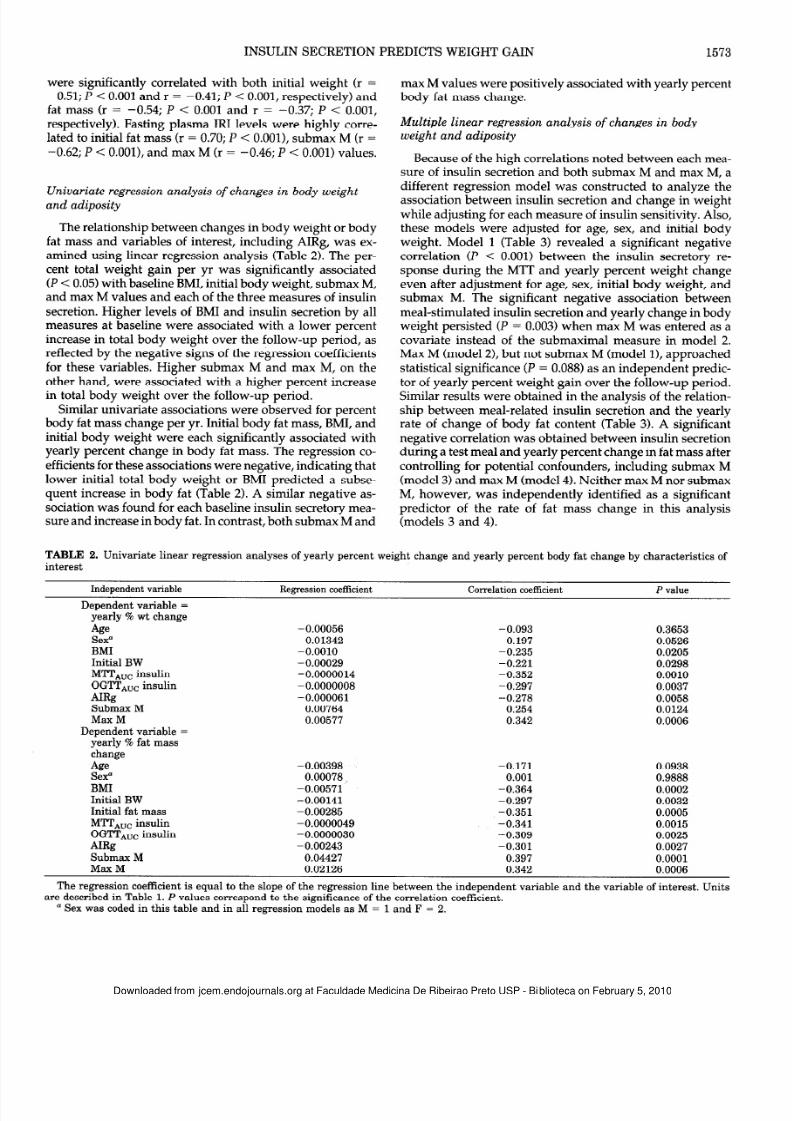
Univariate regression analysis of change s in body weight
and adiposity
The relationship between changes in body weight or bodyfat mass and variables of interest, including AIRg, was ex-amined using linear regression analys is (Table 2). The per-
cent total weight gain per yr was significantly associated
(P < 0.05) with baseline BMI, initial body weight, submax M,and max M values and each of the three measures of insulin
secretion. Higher levels of BMI and insulin secretion by allmeasures at baseline were associated w ith a lower percentincrease in total body weight over the follow-up period, as
reflected by the negative signs of the regression coefficientsfor these variables. Higher submax M and max M, on the
other hand, were associated with a higher percent increasein total body weight over the follow-up period.
Simila r univariate associations were observed for percentbody fat mass change per yr. Initial body fat mass, BMI, and
initial body weight were each significantly associated with
yearly percent change in body fat mass. The regression co-efficients for these associations were negative, indicating thatlower in itial total body weight or BMI predicted a subse-quent increase in body fat (Table 2). A similar negative as-sociation was found for each baseline insulin secretory mea-
sure and increase in body fat. In contrast, both submax M and
max M values were positively associated with yearly percent
body fat mass change.
Multiple linear regression analysis of changes in body
weight and adiposity
Because of the high correlations noted between each mea-sure of insulin secretion and both submax M and max M, a
different regression model was constructed to analyze theassociation between insulin secretion and change in weightwhile adjusting for each measure of insulin sensitivity. Also,
these models were adjusted for age, sex, and initial bodyweight. Model 1 (Table 3) revealed a significant negativecorrelation (P < 0.001) between the insulin secretory re-
sponse during the MTT and yearly percent weight change
even after adjustment for age, sex, init ial body weight, and
submax M. The significant negative association betweenmeal-stimulated insulin secretion and yearly change in bodyweight persisted (P = 0.003) when max M was entered as acovariate instead of the submaximal measure in model 2.
Max M (model 21, but not submax M (model l), approached
statistical significance (P = 0.088) as an independent predic-
tor of yearly percent weight gain over the follow-up period.Simila r results were obtained in the analys is of the relation-ship between meal-related insulin secretion and the yearlyrate of change of body fat content (Table 3). A significant
negative correlation was obtained between insulin secretion
during a test meal and yearly percent change in fat mass aftercontrolling for potential confounders, including submax M(model 3) and max M (model 4). Neither max M nor submax
M, however, was independently identified as a significantpredictor of the rate of fat mass change in this analysis
(models 3 and 4).
TABLE 2. Univariate linear regression analyses of yearly percent weight change a nd yearly percent body fat change by characteristics of
interest
Independent variable Regression coeffk ient Correlation coeffic ient P value
Dependent variable =
yearly % wt change
Age -0.00056 -0.093 0.3653
Sex” 0.01342 0.197 0.0526
BMI -0.0010 -0.235 0.0205
Initial BW -0.00029 -0.221 0.0298
M’IT,,, insulin -0.0000014 -0.352 0.0010
OGTT,,, insulin -0.0000008 -0.297 0.0037
-4W -0.000061 -0.278 0.0058
Submax M 0.00764 0.254 0.0124
MaxM 0.00577 0.342 0.0006
Dependent variable =
yearly % fat mass
change
Ag e -0.00398 -0.171 0.0938
Sex” 0.00078 0.001 0.9888
BM I -0.00571 -0.364 0.0002
Initial BW -0.00141 -0.297 0.0032
Initial fat mass -0.00285 -0.351 0.0005
!zzC insulinnsulin -0.00000490.0000030 -0.3410.309 0.0015.0025
MRg -0.00243 -0.301 0.0027
Submax M 0.04427 0.397 0.0001
MaxM 0.02126 0.342 0.0006
The regression coefficient is equal to the slope of the regression line between the independen t variable and the variable of interest. Units
are described in Table 1. P values correspond to the significance of the correlation coefficient.
a Sex was coded in this table and in all regression models as M = 1 and F = 2.
at Faculdade Medicina De Ribeirao Preto USP - Biblioteca on February 5, 2010 jcem.endojournals.orgDownloaded from
8/14/2019 Reduced insulin secretion: an independent predictor of body weight gain
http://slidepdf.com/reader/full/reduced-insulin-secretion-an-independent-predictor-of-body-weight-gain 4/6
SCHWARTZ ET AL. JCE & M . 1995Vol80 . No 5
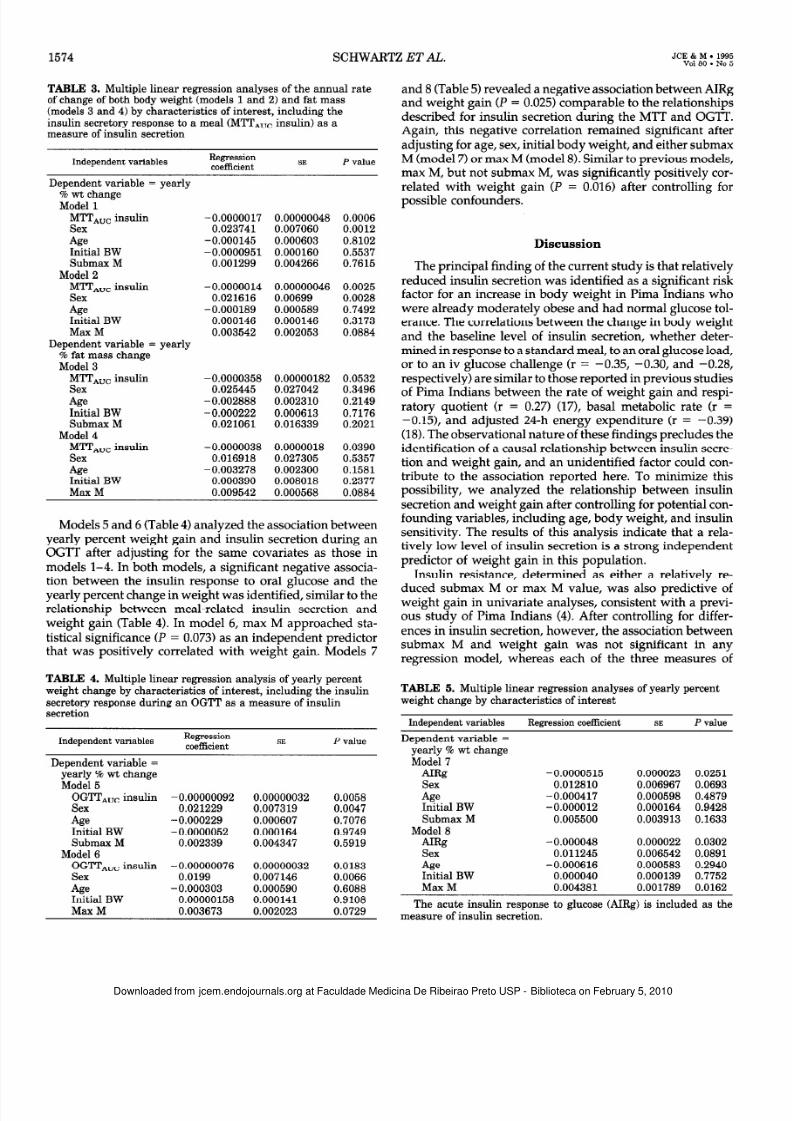
TABLE 3. Multipl e linear regression analyses of the annual rate
of change of both body weight (models 1 and 2) and fat mass
(models 3 and 4) by characteristics of interest, including the
insulin secretory response to a meal (MTT,,, insulin) as a
measure of insulin secretion
Independent variablesRegression
SE P value
Dependent variable = yearly
% wt change
Model 1
MITAUo insulin
Sex
Ag eInitial BW
Submax M
Model 2
MmAoc insulin
Sex
Ag eInitial BW
MaxM
Dependent variable = yearly
% fat mass change
Model 3
MTTAuc insulinSex
-4sInit ial BW
Submax M
Model 4
M’ITAUc insulin
Sex
Ag eInit ial BW
Max M
-0.0000017 0.00000048 0.0006
0.023741 0.007060 0.0012
-0.000145 0.000603 0.8102
-0.0000951 0.000160 0.5537
0.001299 0.004266 0.7615
-0.0000014 0.00000046 0.0025
0.021616 0.00699 0.0028
-0.000189 0.000589 0.7492
0.000146 0.000146 0.3173
0.003542 0.002053 0.0884
-0.0000358 0.00000182 0.05320.025445 0.027042 0.3496
-0.002888 0.002310 0.2149
-0.000222 0.000613 0.7176
0.021061 0.016339 0.2021
-0.0000038 0.0000018 0.0390
0.016918 0.027305 0.5357
-0.003278 0.002300 0.1581
-0.000390 0.008018 0.2377
0.009542 0.000568 0.0884
Models 5 and 6 (Table 4) analyzed the association betweenyearly percent weight gain and insulin secretion during anOGTT after adjusting for the same covariates as those in
models l-4. In both models, a significant negative associa-tion between the insulin response to oral glucose and theyearly percent change in weight was identified, simi lar to therelationship between meal-related insulin secretion andweight gain (Table 4). In model 6, max M approached sta-tistical sign ificance (P = 0.073) as an independent predictorthat was posit ively correlated with weight gain. Models 7
TABLE 4. Multip le linear regression analysis of yearly percent
weight change by characteristics of interest, including the insulin
secretory response during an OG’IT as a measure of insulin
secretion
Independent variablesRegression
coefficientSE P va lue
Dependent variable =
yearly % wt change
Model 5
OG!lTAuc insulin
Sex
Ag eInit ial BW
Submax M
Model 6
OG’l’TAUC insulin
Sex
Ag eInit ial BW
MaxM
-0.00000092 0.00000032 0.0058
0.021229 0.007319 0.0047
-0.000229 0.000607 0.7076
-0.0000052 0.000164 0.9749
0.002339 0.004347 0.5919
-0.00000076 0.00000032 0.0183
0.0199 0.007146 0.0066
-0.000303 0.000590 0.6088
0.00000158 0.000141 0.9108
0.003673 0.002023 0.0729
and 8 (Table 5) revealed a negative association between AIRgand weight gain (P = 0.025) comparable to the relationsh ipsdescribed for insulin secretion during the MTT and OGTT.Again, this negative correlation remained significant afteradjusting for age, sex, initial body weight, and either submaxM (model 7) or max M (model 8). Similar to previous models,max M, but not submax M, was significantly positively cor-
related with weight gain (P = 0.016) after controlling forpossible confounders.
Discussion
The principal finding of the current study is that relat ivelyreduced insulin secretion was identified as a significant ris kfactor for an increase in body weight in Pima Indians whowere already moderately obese and had normal glucose tol-erance. The correlations between the change in body weightand the baseline level of insulin secretion, whether deter-mined in response to a standard meal, to an oral glucose load,or to an iv glucose challenge (r = -0.35, -0.30, and -0.28,
respec tively) are simi lar to those reported in previous studiesof Pima Indians between the rate of weight gain and respi-ratory quotient (r = 0.27) (171, basal metabolic rate (r =-0.151, and adjusted 24-h energy expenditure (r = -0.39)(18). The observational nature of these findings precludes theidentification of a causal relationship between insulin secre-tion and weight gain, and an unidentified factor could con-tribute to the association reported here. To minimize thispossibility , we analyzed the relationship between insulinsecretion and weight gain after controlling for potential con-founding variables, including age, body weight, and insulinsensitivity. The results of this analysis indicate that a rela-tively low level of insulin secretion is a strong independentpredictor of weight gain in this population.
Insulin resistance, determined as either a relatively re-duced submax M or max M value, was also predictive ofweight gain in univariate analyses, consistent with a previ-ous study of Pima Indians (4). After controlling for differ-ences in insulin secretion, however, the association betweensubmax M and weight gain was not significant in anyregression model, whereas each of the three measures of
TABLE 5. Multip le linear regression analyses of yearly percent
weight change by characteristics of interest
Independent variables Regression coefficient SE P value
Dependent variable =
yearly % wt change
Model 7
AR -0.0000515 0.000023 0.0251
Sex 0.012810 0.006967 0.0693
Ag e -0.000417 0.000598 0.4879
Initial BW -0.000012 0.000164 0.9428
Submax M 0.005500 0.003913 0.1633
Model 8
A&z -0.000048 0.000022 0.0302
Sex 0.011245 0.006542 0.0891
Ag e -0.000616 0.000583 0.2940
Initial BW 0.000040 0.000139 0.7752
MaxM 0.004381 0.001789 0.0162
The acute insulin response to glucose (AIRg) is included as the
measure of insulin secretion.
at Faculdade Medicina De Ribeirao Preto USP - Biblioteca on February 5, 2010 jcem.endojournals.orgDownloaded from
8/14/2019 Reduced insulin secretion: an independent predictor of body weight gain
http://slidepdf.com/reader/full/reduced-insulin-secretion-an-independent-predictor-of-body-weight-gain 5/6
INSULIN SECRETION PREDICTS WEIGHT GAIN 1575
insulin secretion was a significant predictor of weight gaineven after adjusting for differences in submax M. In contrast,
max M was identified as a significant independent predictorof weight gain in some, but not all, regression models, in-dicating that this measure of insulin action may be predictiveof weight gain independent of its association with insulin
secretion. Taken together, these findings suggest that in PimaIndians, the level of insulin secretion may be a stronger
predictor of changes in body adiposity than is the level ofinsulin sensitivity, but that both parameters may have anindependent predictive effect. Further studies are necessary
to clarify the relative contributions of insulin secretion, in-
sulin sensitiv ity, and the interaction between them to the riskof weight gain identified in our study.
The concept that increased insulin secretion protectsagainst weight gain seems, upon initial consideration, to be
counterintuitive. Given insulin ’s potent lipogenic effects andthe major role suggested for hyperinsulinemia in the patho-
genesis of obesity in rodent models (191, increased insulinsecretion might be expected to promote, rather than prevent,
weight gain. A hypothesis that reconciles the lipogenic action
of insulin with a protective effect of increased insulin secre-tion on weight gain is based on evidence that insulin sig-
naling in the brain causes a catabolic response that counter-
balances its anabolic effects in peripheral tissues (6). Supportfor this hypothesis derives from the demonstration that cir-culating insulin gains access to the brain via a specialized
vascular transport mechanism (20-221, and that intracranialinsulin administration lowers food intake and body weight
across mammalian species [including baboons (231, sheep
(24), and rats (25); see Ref. 26 for review]. The neural basisfor this insulin effect includes the regulation of genes en-coding neuropeptides (26) and catecholamine cotransport
proteins (27) in brain areas that control feeding behavior. Theopposing nature of peripheral and central insulin action pro-
vides the foundation for the hypothesis that insulin resis-tance and hyperinsulinemia represent adaptive responses toincreased adiposity, which, by increasing central nervoussystem (CNS) insulin signaling and suppressing food intake,
confer resistance to weight gain. Our finding that the capac-
ity to secrete insulin is inverse ly related to the risk of weightgain in Pima Indians is consistent with this hypothesis.
The mechanism responsible for the protective effect ofincreased insulin secretion on weight gain in Pima Indianscannot be ascertained from the results of this study. Specif-
ically , it is not known whether weight gain associated withrelatively reduced insulin secretion is the result of increased
caloric intake, reduced energy expenditure, or both. How-
ever, as only --lo-12% of the variance in weight gain in thecurrent study was attributable to differences in insulin se-
cretion, the level of insulin secretion is not the only factor
playing a role in the development of obesity in Pima Indians.Moreover, obesity develops in this population despite
marked hyperinsulinemia compared to other ethnic groups.This observation suggests that a reduction in the ability of thebrain to respond to increased circulating insulin levels may
coexist with peripheral tissue insulin resistance in Pima In-dians. Findings of blunted CNS insulin responsiveness in the
genetically obese fa/fa Zucker rat may be relevant to thepresent report. In these animals, marked insulin resistance
and hyperinsulinemia accompany defects in both the trans-
port of insulin into the CNS (28, 29) and the ability of cen-trally administered insulin to regulate neuropeptide expres-sion (30) and inhibit food intake (25). These findings raise the
possibility that a syndrome of generalized insulin resistance(affecting both the periphery and the brain) may play an
etiological role in certain forms of genetic obesity, includingthat conferred by the thrifty genotype. Additional studies to
confirm these results in other populations and in individua lsbefore the onset of obes ity are required to further clarify therole of insulin secretion in long term body weight regulation.
In conclusion, we have identified a significant effect of
reduced insulin secretion to predispose to weight gain in a
prospective study of Pima Indians with normal glucose tol-erance. This effect of reduced insulin secretion was found tobe independent from the previously reported association ofinsulin resistance with a reduced rate of weight gain in this
population. Insulin resistance and hyperinsulinemia, there-
fore, are unlikely to play a primary role in the pathogenesisof obesity in this population. These results are consistent with
the hypothesis that the ability to increase insulin secretion in
parallel with increasing adiposity limits further weight gainand plays an important role in long term body weight reg-
ulation. Moreover, because relatively reduced insulin secre-tion is also an independent predic tor of the development of
NIDDM in Pima Indians (12), our results are consistent withthe hypothesis that relatively reduced insulin secretion con-
tributes to the progression of both obesity and glucose in-tolerance in subjects bearing the thrifty genotype, a progres-
sion that leads to overt B-ce ll failure and NIDDM.
Acknowledgments
Data were collected at the Clinical Research Center of the Clinical
Diabetes and Nutrition Section of the NIDDK and analyzed at the
Department of Medicine, University of Washington and ceterans Af-
fairs Medical Center (Seattle, WA). The authors eratefullv acknowledee
the critical review of this manuscript provided by Drs. Daniel Porte, Jy.,
and Stephen C. Woods.
1.
2.
3.
4.
5.
6.
7.
8.
9.
10.
References
Neel JV. 1962 Diabetes mellitus: a “thrifty” genotype rendered
detrimental by “progress?” Am J Hum Genet. 14:353-362.
Neel JV. 1982 The genetics of diabetes mellitus. Proceedings of the
Serono Sym posium. In: Kobberling J, Tattersall R, eds. The thrifty
genotype revisited. London: Academic Press; 283-293.
O’Dea K. 1992 Obesitv and diabetes in “the land of milk and honey.”
Diabetes/Metab Rev: 8:373-388.
Swinbu m BA, Nvomba BL, Saad MF. et al. 1991 Insulin resistance
associated with lower rates’of weight’ gain in Pima Indians. J Clin
Invest. 88:168-173.
Eckel RH. 1992 Insulin resistance: an adaptation for weight main-tenance. Lancet. 340:1452-1453.
Woods SC, Porte Jr D, Bobbio ni E, et al. 1985 Insulin: its relation-
ship to the central nervous system and to the control of food intake
and body we ight. Am J Clin Nutr. 42:1063-1071.
Goldman RF, Buskirk ER. 1961 A method for underwater weighing
and the determination of body density. In: Brozek J, Henschel A, eds.
Techniques for measuring body composition. Washington DC: 7%
106.
Herbert V, Lau K, Gottlieb CW, Bleicher SJ. 1965 Coated charcoal
immunoassay of insulin. J Clin Endocrinol Metab. 25:1375-1384.
Yalow RS, Berson SA. 1960 Immunoassay of endogenous plasma
insulin in man. J Clin Invest. 39:1157-1167.
DeFronzo RA, Tobin JD, Andres R. 1979 Glocose clamp technigue:
at Faculdade Medicina De Ribeirao Preto USP - Biblioteca on February 5, 2010 jcem.endojournals.orgDownloaded from
8/14/2019 Reduced insulin secretion: an independent predictor of body weight gain
http://slidepdf.com/reader/full/reduced-insulin-secretion-an-independent-predictor-of-body-weight-gain 6/6
1576 SC H W AR T Z ET AL,. JCE & M . 1995Vol80. No 5
11 .
12 .
13 .
14 .
15 .
16 .
17 .
18 .
19 .
20 .
a method for quantify ing insulin resistance. Am J Physiol. 237:E214-E223.Bogardus C, Lillio ja S, Mott D, Reaven GR, Kashiwagi A, Foley JE.
1984 Relationship between obes ity an maxim al insulin stimulatedglucose u ptake in viva and in vitro in Pima Ind ians. J Clin Inve st.78:1568-1578.Lil l ioja S, Mott DM, Foley JE, et al. 1993 Insulin resistance andinsulin se cretory dysfunctio n as precursors of non-insulin-depen-dent diabetes mell i tus. N Engl J Med. 329:1988-1992.
Bogardus C, Lillio ja S, Reaven G, Mott DM. 1984 Relationshipbetween insulin secretion , insulin action, and fasting pla sma glucoseconcen tration in nondiabetic and noninsulin-dependent diabeticsubjects. J Clin Invest. 741238-1246.Thomas GB. 1968 Calculus and geometry. Menlo Park Addison-Wesley; 179-180.
Kleinbaum DG, Kupper LL, Muller KE. 1988 Applied regressionanalysis and other mult ivariable methods. Boston: PWS-Kent;
102-296.SAS Institute I. 1987 SAS/STAT guide for personal computers,
version 6, chapt 20. Cary: SAS Inst i tute; 28.Zurlo F, Li l l ioja S, Puente AE, et al. 1990 Low rat io of fat to car-bohvdrate oxidation as predictor of weight gain: study of 24-h RQ .Am-J Physiol. 259:E650f-E657. - - =Ravussin E, Lillio ia MB, Knowler WC, et al. 1988 Reduced rate ofenergy expend&e as a risk factor for body-weigh t-gain. N EnglJ Med. 318467-472.
Bray GA. 1989 Autono mic and endocrine factors in the regulationof food intake. Int J Obes. 13:327-335.Baura G, Foster D, Porte DJ, et al. 1993 Saturable transport of insulinfrom plasma into the central nervous system of dogs in vivo: amech anism for regulated insulin delivery to the brain. J Clin Inve st.921824-1830.
21. Schwartz MW, Bergman RN, Kahn SE, et al. 1991 Evidence foruptake of plasma insulin into cerebrospinal fluid through an inter-mediate compartment in dogs. J Clin In vest. 88:1272-1281.
22. Pardridge WM. 1986 Receptor-m ediated peptide transport throughthe blood-brain barrier. Endocr R ev. 7:314-330.
23. Woods SC, Stein LJ, McKay LD, Porte Jr D. 1979 Chronic intrac-erebroventricular infusion of insulin re duces food intake and body
weight of baboons. Nature. 282:50%505.24. Foster LA, Ames NK, Emery RS. 1991 Food intake and serum
insulin respon ses to intraventricular infusions of insulin and IGF -I.Physiol Behav. 50:745-749.25. Ikeda H, West DB, Pustek JJ, et al. 1986 Intraventricular insulin
reduces food intake and body weight of lean but not obese Zuckerrats. Appetite. 7381-386.
26. Schwartz MW, Figlewicz DP, Baskin DG, Woods SC, Porte Jr D.
1992 Insulin in the brain: a hormonal regulator of energy balance.Endocr Rev. 13:387-414.
27. Figlewicz DP, Szot P, Israel PA, Payne C, Dorsa DM. 1993 Insulinreduces norepinephrine transporter mR NA in vivo in rat locuscoeruleus. Brain Res. 602:161-164.
28. Stein LJ, Dorsa DM, Baskin DG, Figlwicz DP, Porte Jr D, Woods
SC . 1987 Reduce d effe ct of experimen tal peripheral hyperinsuline-mia to elevate cerebrospinal fluid insulin concen trations of obeseZucker rats. Endocrinology. 121:1611-1615.
29. Schwartz MW, Figlewicz DP, Kahn SE, Baskin DG, Porte DJ,
Greenwood MRC. 199 0 Insulin binding to brain capillaries is re-
duced in genetically obese hyperinsulinem ic Zucke r rats. Peptide s.11467-472.
30. Schwartz MW, Marks J, Sipols AJ, et al. 1991 Central insulin ad-ministration reduces neuropeptide Y mR NA expression in the ar-cuate nucleus o f food-deprived lean (Fa/Fa ) but not obese (fa/fa)Zucker rats. Endocrinology. 12826452647.
Satel lite Symposium of the 15th Congress of the International Federationof Fertility SocietiesUFFS)
WEIGHT, NUTRITION AND HORMONAL EVENTS IN WOMEN
Basic and Clinical Aspects
Impact on Hormonal Therapies
Montpellier (France)
September 15-16,1995
Organizing committee: J. Bringer, A. Basdevant (France).
Cong ress Organization: Soci& le Coru m, Esplanade Charles de Gaulle BP 2200,34027 Montpellier Cede x
1 France. PHON E: (33) 67 61 67 61; FAX: (33) 67 61 66 84.
at Faculdade Medicina De Ribeirao Preto USP - Biblioteca on February 5, 2010 jcem.endojournals.orgDownloaded from