Embed Size (px)
Citation preview
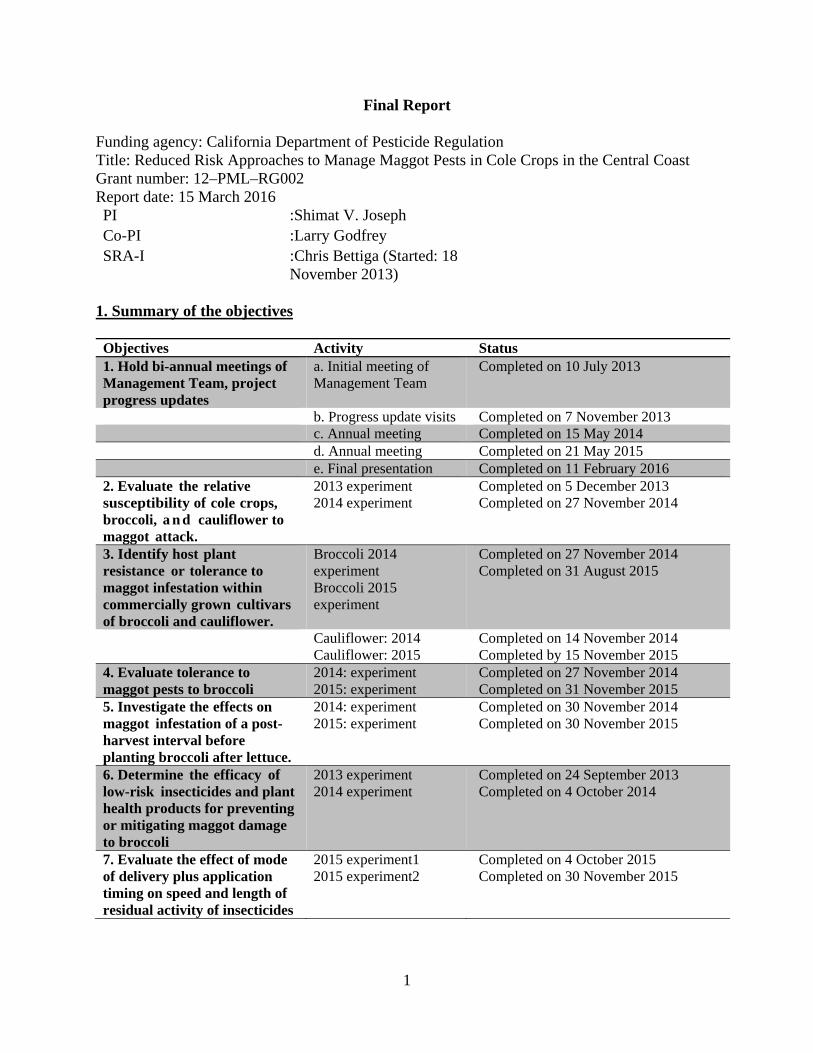
Objectives Activity Status 1. Hold bi-annual meetings of a. Initial meeting of Completed on 10 July 2013 Management Team, project Management Team progress updates b. Progress update visits Completed on 7 November 2013 c. Annual meeting Completed on 15 May 2014 d. Annual meeting Completed on 21 May 2015 e. Final presentation Completed on 11 February 2016
Final Report
Funding agency: California Department of Pesticide Regulation Title: Reduced Risk Approaches to Manage Maggot Pests in Cole Crops in the Central Coast Grant number: 12–PML–RG002 Report date: 15 March 2016 PI :Shimat V. Joseph Co-PI :Larry Godfrey SRA-I :Chris Bettiga (Started: 18
November 2013)
1. Summary of the objectives
2. Evaluate the relative 2013 experiment Completed on 5 December 2013 susceptibility of cole crops, 2014 experiment Completed on 27 November 2014 broccoli, a n d cauliflower to maggot attack. 3. Identify host plant resistance or tolerance to maggot infestation within commercially grown cultivars of broccoli and cauliflower.
4. Evaluate tolerance to maggot pests to broccoli 5. Investigate the effects on maggot infestation of a post-harvest interval before planting broccoli after lettuce.
Broccoli 2014 experiment Broccoli 2015 experiment
Cauliflower: 2014 Cauliflower: 2015 2014: experiment 2015: experiment 2014: experiment 2015: experiment
Completed on 27 November 2014 Completed on 31 August 2015
Completed on 14 November 2014 Completed by 15 November 2015 Completed on 27 November 2014 Completed on 31 November 2015 Completed on 30 November 2014 Completed on 30 November 2015
6. Determine the efficacy of 2013 experiment Completed on 24 September 2013 low-risk insecticides and plant 2014 experiment Completed on 4 October 2014 health products for preventing or mitigating maggot damage to broccoli 7. Evaluate the effect of mode 2015 experiment1 Completed on 4 October 2015 of delivery plus application 2015 experiment2 Completed on 30 November 2015 timing on speed and length of residual activity of insecticides
1

Annual report 2015 Submitted
Deliverables 1. Paper presented at 2014 annual meeting of Entomological Society of
America, Portland, OR. Title: Susceptibility to cabbage maggot infestation on brassicas when planted side-by-side with host and non-host
crops in California’s central coast. 2. Presented at 2014 annual entomology seminar, Salinas, CA. Titled: Host plant susceptibility and management of cabbage maggot in brassicas. 3. Presented at 2015 annual entomology seminar, Salinas, CA. Titled: Use of Insecticides for Cabbage Maggot
Control. 4. Paper presented at 2015 annual
meeting of Entomological Society of America, Minneapolis, MN. Title: Approaches Considered to Manage Cabbage Maggot in Brassica Vegetables
in Central Coast of California 5. Journal article: “Relative Susceptibility to Cabbage Maggot (Diptera: Anthomyiidae) Infestation among Brassicaceous crops When Planted Side-by-side in California’s Central Coast” in preparation and will be submitted to Journal of Entomological Science. 6. Journal article: “Effects of time interval between crops on Cabbage Maggot (Diptera: Anthomyiidae) on
broccoli in California’s Central Coast” in preparation and will be submitted to
Journal of Economic Entomology. 7. Journal article: “Effect of insecticide-coated broccoli seed on Cabbage Maggot (Diptera: Anthomyiidae) infestation in California’s Central Coast” in preparation and will be
submitted to Crop Protection.
8. Assess the effectiveness of Quarterly reports Completed: on 30 September 2013; 2 the project by preparing February 2014; 30 April 2014; 30 July
2015; 30 October 2014; 4 December progress reports and a summary report. 2014; 30 March 2015; 30 June 2015; 30
October 2015 Annual report 2014 Submitted
2
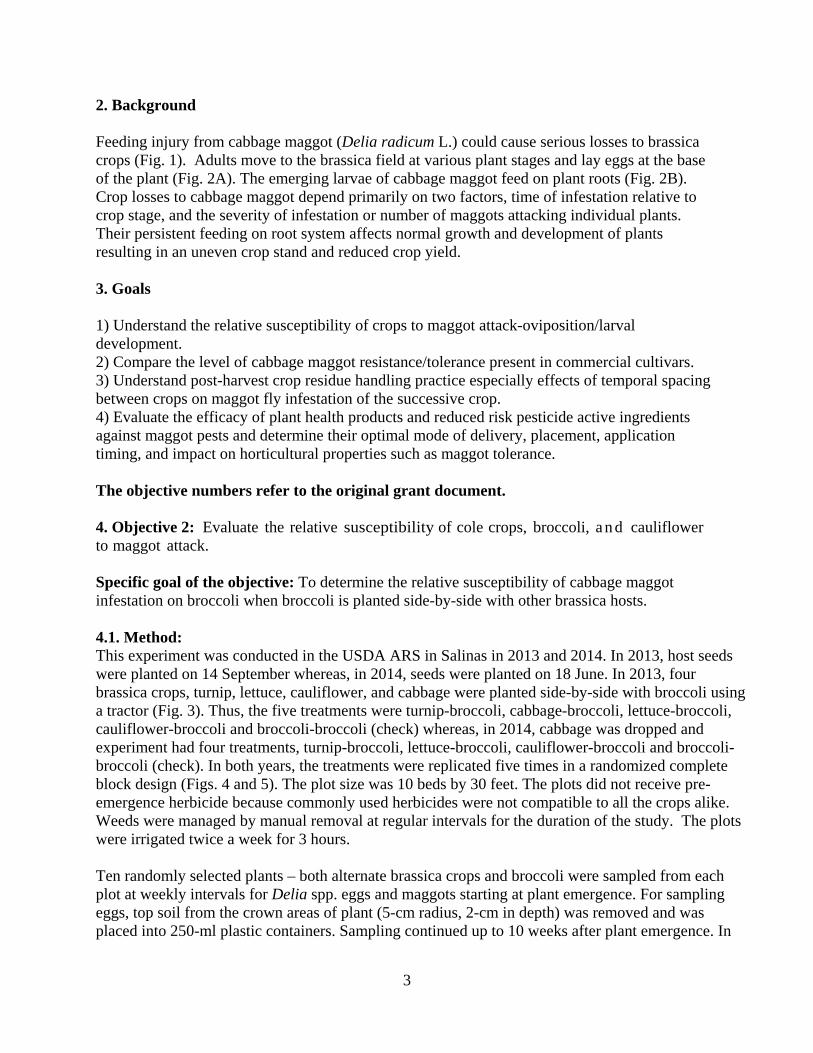
2. Background
Feeding injury from cabbage maggot (Delia radicum L.) could cause serious losses to brassica crops (Fig. 1). Adults move to the brassica field at various plant stages and lay eggs at the base of the plant (Fig. 2A). The emerging larvae of cabbage maggot feed on plant roots (Fig. 2B). Crop losses to cabbage maggot depend primarily on two factors, time of infestation relative to crop stage, and the severity of infestation or number of maggots attacking individual plants. Their persistent feeding on root system affects normal growth and development of plants resulting in an uneven crop stand and reduced crop yield.
3. Goals
1) Understand the relative susceptibility of crops to maggot attack-oviposition/larval development. 2) Compare the level of cabbage maggot resistance/tolerance present in commercial cultivars. 3) Understand post-harvest crop residue handling practice especially effects of temporal spacing between crops on maggot fly infestation of the successive crop. 4) Evaluate the efficacy of plant health products and reduced risk pesticide active ingredients against maggot pests and determine their optimal mode of delivery, placement, application timing, and impact on horticultural properties such as maggot tolerance.
The objective numbers refer to the original grant document.
4. Objective 2: Evaluate the relative susceptibility of cole crops, broccoli, a n d cauliflower to maggot attack.
Specific goal of the objective: To determine the relative susceptibility of cabbage maggot infestation on broccoli when broccoli is planted side-by-side with other brassica hosts.
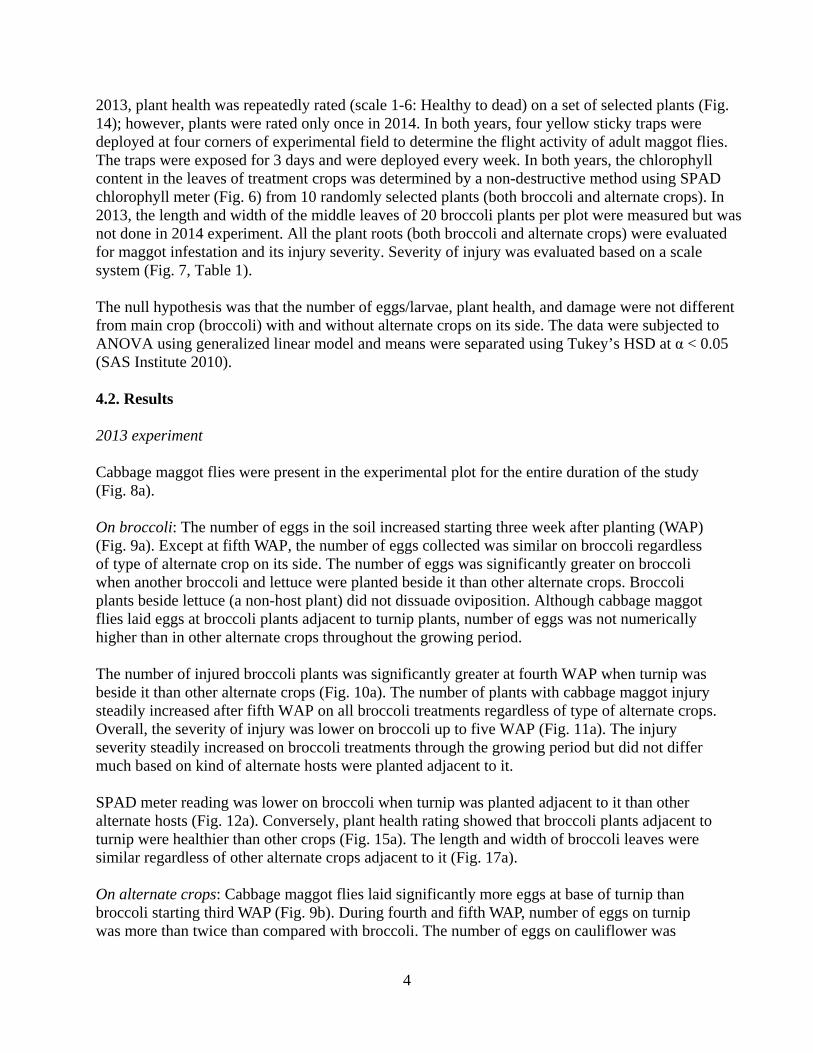
4.1. Method: This experiment was conducted in the USDA ARS in Salinas in 2013 and 2014. In 2013, host seeds were planted on 14 September whereas, in 2014, seeds were planted on 18 June. In 2013, four brassica crops, turnip, lettuce, cauliflower, and cabbage were planted side-by-side with broccoli using a tractor (Fig. 3). Thus, the five treatments were turnip-broccoli, cabbage-broccoli, lettuce-broccoli, cauliflower-broccoli and broccoli-broccoli (check) whereas, in 2014, cabbage was dropped and experiment had four treatments, turnip-broccoli, lettuce-broccoli, cauliflower-broccoli and broccoli-broccoli (check). In both years, the treatments were replicated five times in a randomized complete block design (Figs. 4 and 5). The plot size was 10 beds by 30 feet. The plots did not receive pre-emergence herbicide because commonly used herbicides were not compatible to all the crops alike. Weeds were managed by manual removal at regular intervals for the duration of the study. The plots were irrigated twice a week for 3 hours.
Ten randomly selected plants – both alternate brassica crops and broccoli were sampled from each plot at weekly intervals for Delia spp. eggs and maggots starting at plant emergence. For sampling eggs, top soil from the crown areas of plant (5-cm radius, 2-cm in depth) was removed and was placed into 250-ml plastic containers. Sampling continued up to 10 weeks after plant emergence. In
3
2013, plant health was repeatedly rated (scale 1-6: Healthy to dead) on a set of selected plants (Fig. 14); however, plants were rated only once in 2014. In both years, four yellow sticky traps were deployed at four corners of experimental field to determine the flight activity of adult maggot flies. The traps were exposed for 3 days and were deployed every week. In both years, the chlorophyll content in the leaves of treatment crops was determined by a non-destructive method using SPAD chlorophyll meter (Fig. 6) from 10 randomly selected plants (both broccoli and alternate crops). In 2013, the length and width of the middle leaves of 20 broccoli plants per plot were measured but was not done in 2014 experiment. All the plant roots (both broccoli and alternate crops) were evaluated for maggot infestation and its injury severity. Severity of injury was evaluated based on a scale system (Fig. 7, Table 1).
The null hypothesis was that the number of eggs/larvae, plant health, and damage were not different from main crop (broccoli) with and without alternate crops on its side. The data were subjected to ANOVA using generalized linear model and means were separated using Tukey’s HSD at α < 0.05 (SAS Institute 2010).
4.2. Results
2013 experiment
Cabbage maggot flies were present in the experimental plot for the entire duration of the study (Fig. 8a).
On broccoli: The number of eggs in the soil increased starting three week after planting (WAP) (Fig. 9a). Except at fifth WAP, the number of eggs collected was similar on broccoli regardless of type of alternate crop on its side. The number of eggs was significantly greater on broccoli when another broccoli and lettuce were planted beside it than other alternate crops. Broccoli plants beside lettuce (a non-host plant) did not dissuade oviposition. Although cabbage maggot flies laid eggs at broccoli plants adjacent to turnip plants, number of eggs was not numerically higher than in other alternate crops throughout the growing period.
The number of injured broccoli plants was significantly greater at fourth WAP when turnip was beside it than other alternate crops (Fig. 10a). The number of plants with cabbage maggot injury steadily increased after fifth WAP on all broccoli treatments regardless of type of alternate crops. Overall, the severity of injury was lower on broccoli up to five WAP (Fig. 11a). The injury severity steadily increased on broccoli treatments through the growing period but did not differ much based on kind of alternate hosts were planted adjacent to it.
SPAD meter reading was lower on broccoli when turnip was planted adjacent to it than other alternate hosts (Fig. 12a). Conversely, plant health rating showed that broccoli plants adjacent to turnip were healthier than other crops (Fig. 15a). The length and width of broccoli leaves were similar regardless of other alternate crops adjacent to it (Fig. 17a).
On alternate crops: Cabbage maggot flies laid significantly more eggs at base of turnip than broccoli starting third WAP (Fig. 9b). During fourth and fifth WAP, number of eggs on turnip was more than twice than compared with broccoli. The number of eggs on cauliflower was
4
significantly lower than other brassicas during four to six WAP. The lowest number of eggs was collected from lettuce.
The number of cabbage maggot injured plants was significantly greater on turnip than other crops during fourth, fifth and sixth WAP (Fig.10b). At fifth, sixth, and seventh WAP, number of cauliflower plants injured was significantly lower than other crops. Severity of cabbage maggot feeding injury advanced early on turnip than any other crops when broccoli was planted on its side (Fig. 11b). On cauliflower, severity of injury developed at slower pace than other brassica crops. Plant health rating indicated that health of broccoli plants improved through growing period but rating of turnip declined consistently (Fig. 15b). The length and width of turnip leaves were significantly greater than cabbage and broccoli leaves, which were greater than cauliflower and lettuce (Fig. 17b).
2014 experiment
Although cabbage maggot flies were present in the experimental plot for the entire duration of the study, the captures increased toward end of August in 2014 (Fig. 8b).
On broccoli: Overall, the number of eggs in the soil was low in the experimental plots. The average number of eggs collected was within 1-4 eggs (Fig. 9c). There was no significant treatment difference within sample dates throughout the study. The number of injured broccoli was significantly greater at sixth WAP when turnip was beside it (Fig. 10c). The number of plants with cabbage maggot injury steadily increased after sixth WAP on all broccoli treatments regardless of type of alternate crops beside it. Similarly, the severity of injury was low on broccoli up to five WAP (Fig. 11c). The injury severity steadily increased on broccoli treatments after sixth week but did not differ much based on kind of alternate hosts were planted adjacent to it. SPAD meter reading did not differ on broccoli when alternate crops were planted beside it (Fig. 13a). Similarly, plant health rating showed that broccoli plants adjacent to turnip were healthier than other crops (Fig. 16a).
On alternate crops: Cabbage maggot eggs were collected starting third WAP but were collected from all alternate hosts. There was no significant difference in the number of eggs captured between various hosts (Fig. 9d). The lowest number of eggs was collected from lettuce. The number of injured plants was significantly greater on turnip than other hosts during fourth and fifth WAP (Fig. 10d). No injury was detected on lettuce. Similarly, severity of cabbage maggot feeding injury advanced early on turnip than any other hosts when broccoli was planted on its side and this was evident on fourth and fifth WAP (Fig. 11d). On cauliflower, severity of injury developed at slower pace than other brassica crops. In 2014, the plant health rating indicated some significant difference among host plants (Fig 16b). However, it is not certain if the difference is related to cabbage maggot infestation. Overall cabbage maggot infestation was lesser compared with previous year.
4.3. Conclusion: After completion of two years, results show that turnip as a potential to be considered as trap crop for cabbage maggot in the Central Coast of California. The incidence and severity of cabbage maggot injury was high during the early stages of turnip relative to other host tested in the experiment. Lettuce being a non-brassica host did not affect the incidence or
5
severity of cabbage maggot infestation on the broccoli. Perhaps, planting turnip early along the borders of the field may delay the incidence of cabbage maggot infestation providing the young plants a chance to establish.
4.4. Modifications from the original protocol: Seeds of brassica and lettuce were directly planted in the field instead of using transplants from the greenhouse because the main crop, broccoli is mostly seeded in the Salinas Valley. Cabbage was not included in the 2014 experiment because in 2014 study cabbage did not elicited intermediate susceptibility and moreover, it is not a major crop in the Salinas Valley. Overall goal of the project is to determine relative susceptibility of host when planted side-by-side with broccoli; hence, plants were not maintained through harvest.
5. Objective 3: Identify host plant resistance or tolerance to maggot infestation within commercially grown cultivars of broccoli.
Specific goal of this objective: To determine the most vulnerable broccoli growth stages to cabbage maggot infestation.
5.1. Method
The study was conducted in the USDA Spence farm, Salinas, CA in 2014 and 2015. Broccoli was ‘directly seeded’ on to two beds. Seventy-five seedlings were individually caged after plant emergence. Treatments were plants that received second instar cabbage maggot larvae at 3, 5, 7, 9 weeks after planting. An additional, fifth treatment was included where plants were always caged and never exposed to maggots which served as control. The treatments were replicated with 15 plants where individual plant served as a replicate. The exclusion cage design is presented in Figure 18. Larvae were collected from the field and were temporarily stored in cooler (~10oC) until introduction into the cage. Fifteen (15) larvae were released at the crown area of the caged plant (Fig. 19A). Two weeks after inoculation, plastic discs were deployed at the crown area of the plant to prevent any re-infestation within the cage (Fig. 19B). Close to maturity, all the plants were harvested from the cage and evaluated for severity of injury using scale system (Table 1).
5.2. Results
2014 experiment
There was no cabbage maggot infestation on plants always caged or never exposed to cabbage maggot flies throughout the study. Of 15 plants, six plants died after cabbage maggot inoculation at three week after plant emergence whereas, only one and two plants died at weeks five and seven. No plants died due to cabbage maggot feeding at week nine and always caged plants. Severity of cabbage maggot injury was significantly greater on plants inoculated at week nine than at weeks five and seven (Fig. 20a). Health rating of the plants following days after inoculation suggests that health declined steadily in all the inoculation weeks (Fig. 21).
2015 experiment
6
Similar to 2014 results, plants caged always did not have any cabbage maggot larval infestation. However, none of the plants died after inoculation with cabbage maggot larvae. Severity of cabbage maggot injury was similar among exposure treatments (Fig. 20b). Health rating of the plants following days after inoculation suggests it did not decline in all the inoculation weeks.
5.3. Modifications from original protocol: Seeds of broccoli were planted instead of transplants. Initially, this study was planned with introduction of eggs. In order to obtain sufficient eggs for the study, many grower fields were routinely monitored. The eggs collected from the field and laboratory rearing were not enough for a successful trial therefore larvae were used.
5.4. Conclusion: Overall, the data suggest that early stages of broccoli plant is more vulnerable to cabbage maggot feeding injury than infestation in the later stages of plant development. Although it was not clear why the results varied in 2014 and 2015 experiments, the caged plants in 2015 experiment definitely developed at a faster rate even in the first exposure treatment (three weeks after planting).
6. Objective 4: Evaluate resistance/tolerance to maggot pests in commercial cultivars
Specific goal of the objective: To determine resistance to cabbage maggot infestation in the commercial cultivars of broccoli and cauliflower.
6.1. Method
Broccoli
This study was conducted in USDA Spence farm in 2014 and 2015. Five broccoli varieties were selected based on distinctly different genetic lines and those were ‘Centennial’, Marathon’, ‘Patron’, ‘Imperial’, Green magic’ and ‘Heritage’. These six varieties (treatments) were replicated four times in a randomized complete block design. The seeds were planted on 17 June 2014 and on 28 May 2015. In 2014 experiment, the plot size was 10 beds × 30 feet long whereas in 2015, the plot size was 2 beds × 30 feet long. Ten soil and plant samples were collected weekly from every plot to determine the number of eggs and larvae. The number of cabbage maggot injured plants and their severity of feeding injury were quantified at weekly basis. Four yellow sticky cards were deployed at four corners of the field to determine the adult activity. The sticky traps were exposed for two days in the field every week.
Cauliflower
In 2014, this experiment was conducted in the grower’s field in Soledad, CA whereas in 2015, the experiment was conducted in Gonzales, CA. Five varieties of cauliflower, ‘Casper’, ‘Natividad 1’, ‘Symphony’, ‘Neeblina’, and ‘Revella’ was selected based on Pest Control Adviser’s anecdotal observations. One additional grower variety was added and grower variety was ‘Casper’ in both years. The cauliflower seeds were planted in the commercial greenhouse (King City Nursery, King City, CA) in the trays and seedling were transplanted into the field 30
7
days later. The six treatments were replicated four times in a randomized completely block design. The cauliflower seedlings were transplanted on 25 August 2014 and 10 August 2015. The plot size was 2 beds × 30 feet long. Ten soil and plants samples were collected every two weeks from plots to determine the number of eggs and larvae. Also, number of cabbage maggot injured plants and their severity of feeding injury were quantified. Four yellow sticky cards were deployed at four corners of the field to determine the adult activity. The sticky traps were exposed for two days in the field every week.
6.2. Results
Broccoli
In both years, the cabbage maggot fly captures increased on the yellow sticky traps after mid to late growing period (Fig. 22). Overall, low number of cabbage maggot eggs was collected for the duration of the study in both years (Fig. 23). Number of cabbage maggot larvae collected from the plant roots was lower for several weeks after planting the seeds (Fig. 24). In 2014, infestation was not clearly evident on the plants until final weeks to harvest (Fig. 25a). The data did not show any difference in cabbage maggot infestation among broccoli varieties.
Cauliflower
Similar to broccoli varietal study in 2014, cabbage maggot fly activity was evident toward later part of the growing season in 2014 and 2015 (Fig. 26). There were no significant differences in the number of cabbage maggot eggs, injured plants, or injury severity among cauliflower varieties (Figs. 27 and 28). In 2014, the fresh and dry weight of cauliflower plants (aboveground structures) sampled close to harvest did not vary among varieties (Fig. 29).
6.3. Conclusion: The results suggest that cabbage maggot infestation was not affected by the broccoli and cauliflower varieties and may not be a tactic cabbage maggot control.
7. Objective 5: Investigate the effects on maggot infestation of a post-harvest interval before planting broccoli after lettuce.
Specific goal of the objective: To determine if the gap between incorporation of plant residue (after harvest) into the soil and planting a brassica crop affect the cabbage maggot infestation on the brassica crop.
7.1. Method
This experiment was conducted in 2014 and 2015 at USDA ARS research farm, Salinas, CA. The treatments were time intervals between crops. Lettuce was the first crop which was later followed by a second crop, broccoli. The lettuce plants were planted in staggered pattern i.e., at 2-week intervals (four plantings) into the plots then 60 days later, the plants were harvested (simulated commercial harvest) and the residues were incorporated into the soil within the same plot. The cabbage maggot infestation was evaluated on second crop. Broccoli seeds for all the time interval treatments were planted on the same day. In 2014, the treatments of the study were
8

7, 20, 33, and 48 days between crops. In 2015, treatments of the study were 7, 21, 36, and 49 days between crops and additional treatment, with no lettuce crop prior to broccoli was added. The treatments were replicated four times in a randomized complete block design. The plot size was 10 beds × 100 feet long. Ten soil and plant samples were collected at weekly basis from every plot to determine the eggs and larvae numbers. Similarly, number of cabbage maggot injured plants and their severity of feeding injury per plot were quantified at weekly intervals. Yellow sticky cards were deployed in the center of every plot to determine the cabbage maggot adult activity staring plant emergence of both crops. The sticky traps were exposed for two days in the field for every week.
7.2. Results
2014 experiment
Overall, number of eggs collected by week (after planting) was significantly more on 7-day between the crops treatment than on other treatments (Fig. 30a). A significantly greater number of eggs was collected in 7-day than in 33-day between the crops treatments (Fig. 30b) when eggs were averaged through the season. Similarly, severity of cabbage maggot injury on roots by week was significantly greater on 7-day time interval between the crops than on other treatments (Fig. 31a). The severity of injury was significantly more on 7 and 20-day time intervals between the crops than 48-day time interval between the crops (Fig. 31b). Number of cabbage maggot larvae collected from the roots was significantly greater in two sample dates on 7 days between the crops than on other treatments (Fig. 32a). However, seasonal average of larvae collected from roots did not differ among time intervals between the crops (Fig. 32b).
2015 experiment
Similarly, number of eggs collected by sample date was significantly more on 7-day between the crops treatment than on other treatments (Fig. 33a). Similarly, severity of cabbage maggot injury on roots by week was significantly greater on 7-day time interval between the crops than on other treatments (Fig. 34a). The treatment that had no prior lettuce crop had the least severe cabbage maggot infestation (Fig. 34a). Number of cabbage maggot larvae collected from the roots was significantly greater in one sample dates on 7 days between the crops than on other treatments (Fig. 35a). When the seasonal average was taken, there was no difference in number of eggs and larvae as well as severity of injury among treatments (Fig. 33b, 34b, and 35b).
7.4. Conclusion: The results suggest that incidence of cabbage maggot infestation increased as the gap between crops reduced. Based on 2014 and 2015 data, a month gap between crops will reduce cabbage infestation on broccoli but is not a stand-alone tactic for cabbage maggot control.
7.5. Modifications from original protocol: For phase I, first planting (lettuce seeds) was planted in a staggered pattern than the second planting (broccoli). This way, all the broccoli plants will be exposed to the same cabbage maggot populations for the entire duration of the study. The plot size was increased from 10 m by 10 m to 10 m by to 30.4 m to enable adequate irrigation. At the same time, 10 m by to 30.4 m spacing between plots and blocks was provided to reduce the drift from irrigated water and enable farm operations such as planting, thinning,
9

and applications of fertilizer etc. using farm equipment. In 2015, an additional treatment was added for the second crop, broccoli where no lettuce was planted previously.
8. Objective 6. Determine the efficacy of low-risk insecticides and plant health products for preventing or mitigating maggot damage to broccoli
Specific goal of the objective: To determine the efficacy of insecticides to cabbage maggot in the field.
8.1. Method
2013 trial
In 2013, this trial was conducted in seeded broccoli in Chualar, CA to compare the effectiveness of 13 insecticides against cabbage maggot. Four replicates of each treatment were assigned to two 25-feet long 40” beds (with two seed lines/bed) according to a randomized complete block design. All the treatments were applied two times, at 3 and 4 weeks after plant emergence except Belay treatment were applied three times (including an at-plant application). All applications were done using two-nozzle sprayer on 7-inch wide band along the seed line at 30 PSI. The water volume used for all application was 100 gal/acre. No adjuvant was added. The details on insecticide products, rates and application dates are presented in Table 2.
Twenty root samples were randomly collected from each plot at five (12 September), and seven (24 September) WAP. Sampling timing was determined based on current knowledge of peak incidence of egg laying and maggot infestation in broccoli in the Salinas Valley (Joseph and Martinez 2014). Incidence and severity of cabbage maggot injury were documented. For severity of injury, we used the scale system described in Table 1 and Fig. 7.
2014 trial
The trial was conducted on seeded broccoli as well. The insecticides were applied twice using a CO2 powered, one nozzle sprayer along the seed line (3 inches wide). The water volume was 100 gal/acre. Plot size: two beds (40-inch bed with two seed lines) × 25 feet long. The design was randomized complete block design with 4 replications. Ten plants were sampled during each sampling date and were evaluated for incidence and severity of cabbage maggot injury. The insecticide treatments were chosen based on previous field and laboratory studies (Joseph and Zarate 2015). Verimark is a newer product labelled on broccoli for cabbage maggot. The details on insecticide products, rates and application dates are presented in Tables 4 and 5)
8.2. Results
2013 trial
Following the application, incidence of cabbage maggot injury was not significantly different among treatments at fifth WAP (Table 3). Severity of cabbage maggot injury at fifth WAP showed a significant suppression with Belay treatment than untreated check. At seventh WAP, suppression in cabbage maggot injury severity was noted with Verimark treatment than untreated
10

check. It is interesting to note that even Lorsban treatment did not show any sign of suppression of cabbage maggot infestation. It appears that cabbage maggot infestation was not affected by these treatments.
2014 trial
The cabbage maggot pressure was lower in 2014 than in 2013 trial. There was no significant difference among insecticide treatments based on number of plants injured with cabbage maggot or injury severity (Tables 4 and 5).
8.3. Conclusion: After repeating the study for two years, results do not show any concrete evidence of insecticide efficacy in the field setup when applied a directed spray at planting or couple of weeks after plant emergence. Belay (clothianidin) was only product that showed evidence of efficacy and was consistent with the laboratory bioassay (Joseph and Zarate 2015).
8.4. Modifications from original protocol: In 2013, only Belay was applied thrice and other insecticides were applied twice based on phenology of cabbage maggot infestation (Joseph and Martinez 2014). Based on other studies, none of insecticides showed efficacy to cabbage maggot when applied at planting (Joseph 2014a). We found that Belay was the strongest insecticide based on tray drench applications (Joseph 2014b); thus, we only selected Belay at planting. In 2014, five insecticides were selected based on efficacy against cabbage maggot larvae in the laboratory (Joseph and Zarate 2015).
9. Objective 7. Effect of mode of delivery plus timing on speed and length of residual activity
Specific goal of the objective: To determine the efficacy of insecticides to cabbage maggot in the field when insecticide were applied using various methods.
9.1. Method
Two experiments were initiated in 27 May (experiment 1) and 19 August (experiment 2) 2015 on direct seeded broccoli. Plants were under sprinkler irrigation for 3 weeks then drip irrigation system was deployed. One insecticide (clothianidin) was selected for the study. The six treatments are:
1. No insecticide in drip 2. Insecticide in drip (3 WAP - one application) 3. Seed treatment + no insecticide in drip 4. Seed treatment + insecticide in drip (3 WAP - one application) 5. Spray at plant + no insecticide in drip 6. Spray at plant + insecticide in drip (3 WAP - one application)
The treatments were deployed in randomized complete block design. The experiment 1 was conducted with four replicates whereas experiment 2 had six replications. The spray application for the experiment 1 and 2 was done on 28 May and 20 August 2015, respectively. The treatments, 2, 4, and 6 received clothianidin through drip irrigation where insecticide was injected into drip system using a pump. For the first experiment, chemigation through drip was
11
done on 13 July (6 weeks after planting the seed) and on 14 September (three weeks after planting the seeds) 2015 for the second experiment. Nipslt broccoli (clothianidin coated) seeds was used for the seed treatments in the study. Belay (clothianidin) was sprayed at maximum label rate (12 fl oz/acre) in treatments, 5 and 6 using a CO2 powered, two nozzle sprayer just after sowing along the seed line (3-inch wide) before the sprinkler irrigation was set on. Sprinkler irrigation was replaced with drip irrigation at 5 and 3 weeks after planting for first and second experiment. Ten plant samples were collected every alternate week, and the incidence and severity of cabbage maggot injury were evaluated on the roots. Additional ten soil samples per plot from top 10-cm diameter around the crown area of the plants were collected to quantify the eggs in the soil.
9.2. Results
Experiment 1: The data, number of eggs and larvae per treatment did not show any specific trend, although there were a few significant differences among treatments on sample dates (Fig. 36). Similarly, there was no difference among treatments for the plants with cabbage maggot injury and severity of injury (Fig. 37).
Experiment 2: The number of eggs collected from the base of the plants was greater on a treatment with seed-coating on couple of sample dates (Fig. 38a). In contrary, the cabbage maggot larvae collected from the infested roots were lower from the seed treatment on 20 October than in other treatments (Fig 38b). The severity of cabbage maggot injury was significantly lower in the seed treatments than in other treatments, although there was no difference in number of plants with cabbage maggot injury (Fig. 39).
9.3. Conclusion: The results suggest that seed treatment has a potential to suppress cabbage maggot infestation on broccoli. The drip chemigation, and directed spray did not provide any suppression of cabbage maggot.
10. Summary
Control of cabbage maggot on Brassica crops primarily involves the use of soil applied organophosphate insecticides such as chlorpyrifos and diazinon. However, the persistent use of these insecticides has resulted in high concentrations of insecticide residues in water bodies posing risks to non-target organisms and public health. Currently, use of organophosphate insecticides is strictly regulated by California Department of Pesticide Regulation leaving growers with no clear options to combat cabbage maggot problems in Brassica. Therefore, an urgent need exists to determine IPM-based solutions for cabbage maggot control. These projects examined various tactics to manage cabbage maggot. However, with the maggot pressure in the Salinas area, none of the methods are stand-alone. Increasing period between crops can help and may fit in some situations but the high value of the land in the Salinas Valley makes this difficult. There may be some situations for this and the crop residue should be destroyed as soon as possible to promote decay. Seed treatments look like a viable option but again may not provide complete control. Border planting with most attractive host plants has very limited benefit but may have slight usefulness. Crop varieties didn’t provide any evidence of resistance to reduce cabbage maggot infestation. Chemigation through drip irrigation should be further
12
investigated because drip irrigation and fertigation through drip irrigation are gaining more popularity among growers as it increases the efficacy of water and fertilizer use.
11. References
Joseph, S. V. and J. Martinez. 2014. Incidence of cabbage maggot (Diptera: Anthomyiidae) infestation and plant damage in seeded brassica fields in California's central coast. Crop Protection 62: 72-78.
Joseph, S. V. and J. Zarate. 2015. Comparing Efficacy of Insecticides against Cabbage Maggot (Diptera: Anthomyiidae) in the Laboratory. Crop Protection 77: 148-156.
Joseph, S. V. 2014a. Efficacy of at-planting and basal applications of insecticides on cabbage maggot in seeded-broccoli. New letter – UCCE. Monterey County. January/February: 10-13.
Joseph, S. V. 2014b. Comparing alternative methods of insecticide application for cabbage maggot management in transplanted-broccoli. CAPCA Advisor. April. Vol. XVII, No. 2: 46-48.
SAS Institute. 2012. Version 9.3, SAS Institute Inc., Cary, NC.
13
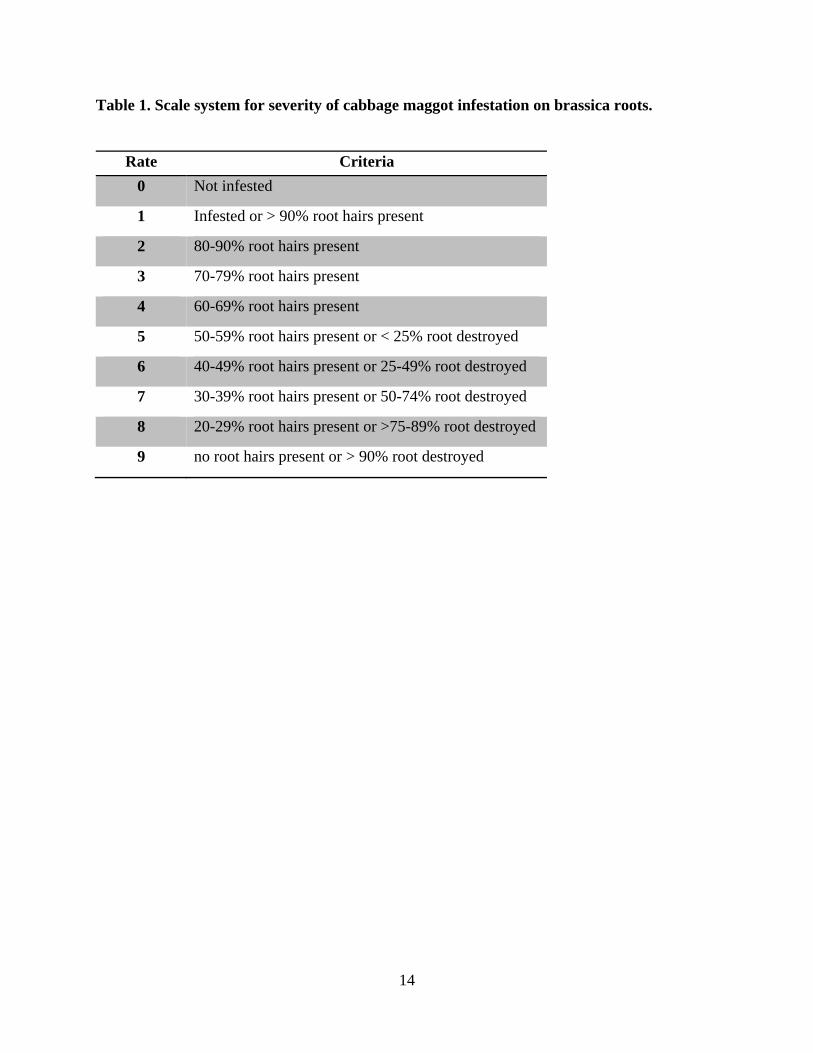
Table 1. Scale system for severity of cabbage maggot infestation on brassica roots.
Rate Criteria
0 Not infested
1 Infested or > 90% root hairs present
2 80-90% root hairs present
3 70-79% root hairs present
4 60-69% root hairs present
5 50-59% root hairs present or < 25% root destroyed
6 40-49% root hairs present or 25-49% root destroyed
7 30-39% root hairs present or 50-74% root destroyed
8 20-29% root hairs present or >75-89% root destroyed
9 no root hairs present or > 90% root destroyed
14
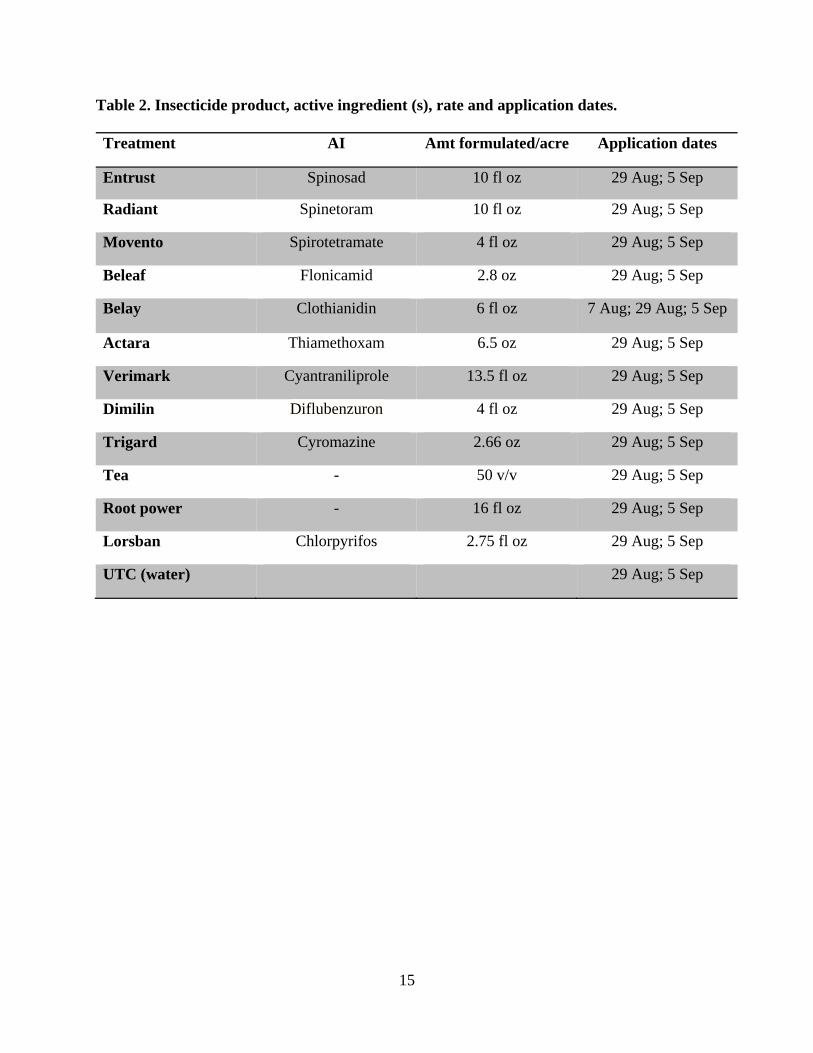
UTC (water) 29 Aug; 5 Sep
Table 2. Insecticide product, active ingredient (s), rate and application dates.
Treatment AI Amt formulated/acre Application dates
Entrust Spinosad 10 fl oz 29 Aug; 5 Sep
Radiant Spinetoram 10 fl oz 29 Aug; 5 Sep
Movento Spirotetramate 4 fl oz 29 Aug; 5 Sep
Beleaf Flonicamid 2.8 oz 29 Aug; 5 Sep
Belay Clothianidin 6 fl oz 7 Aug; 29 Aug; 5 Sep
Actara Thiamethoxam 6.5 oz 29 Aug; 5 Sep
Verimark Cyantraniliprole 13.5 fl oz 29 Aug; 5 Sep
Dimilin Diflubenzuron 4 fl oz 29 Aug; 5 Sep
Trigard Cyromazine 2.66 oz 29 Aug; 5 Sep
Tea - 50 v/v 29 Aug; 5 Sep
Root power - 16 fl oz 29 Aug; 5 Sep
Lorsban Chlorpyrifos 2.75 fl oz 29 Aug; 5 Sep
15

Table 3. Incidence and severity of cabbage maggot injury at 5, and 7 weeks after planting (WAP) in broccoli in 2013. Treatment 5 WAP 7 WAP
Incidence Severity Severity
Entrust 19.0 ± 0.4 a 4.9 ± 0.5 ab 7.1 ± 0.3 ab
Radiant 20.0 ± 0.0 a 5.9 ± 0.8 ab 6.6 ± 0.2 ab
Movento 19.8± 0.3 a 5.6 ± 0.4 ab 7.8 ± 0.1 a
Beleaf 19.5 ± 0.5 a 5.3 ± 0.3 ab 7.5 ± 0.2 a
Belay* 20.0 ± 0.0 a 3.5 ± 0.2 b 6.8 ± 0.3 ab
Actara 19.3 ± 0.5 a 5.4 ± 0.5 ab 7.6 ± 0.1 a
Verimark 19.8 ± 0.3 a 4.5 ± 0.2 ab 5.7 ± 0.6 b
Dimilin 19.8 ± 0.3 a 5.7 ± 0.9 ab 7.3 ± 0.5 a
Trigard 20.0 ± 0.0 a 5.9 ± 0.5 ab 7.6 ± 0.1 a
Tea 19.3 ± 0.5 a 5.4 ± 0.4 ab 7.5 ± 0.2 a
Root power 20.0 ± 0.0 a 5.9 ± 0.4 ab 7.6 ± 0.1 a
Lorsban 18.8 ± 0.5 a 5.6 ± 0.7 ab 7.4 ± 0.2 a
UTC 19.3 ± 0.5 a 6.4 ± 0.4 a 7.6 ± 0.2 a
Same letters within column are not significantly different from each other (Tukey’s HSD, α < 0.05).
16
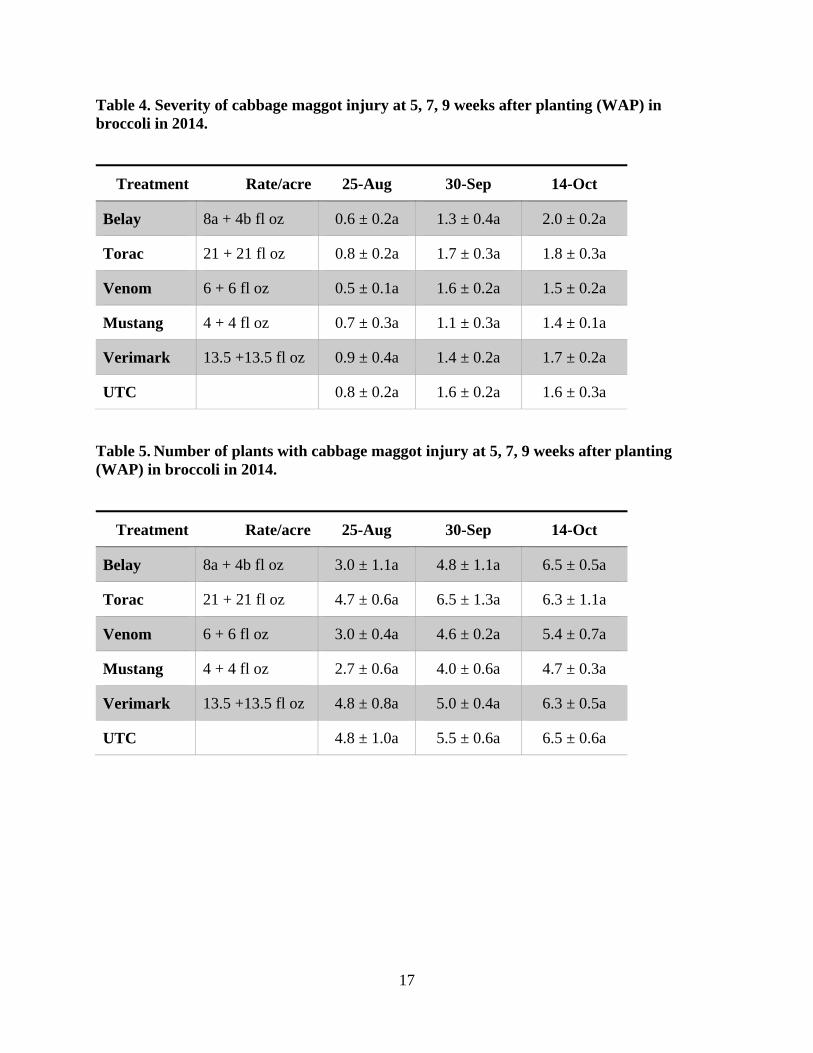
Table 4. Severity of cabbage maggot injury at 5, 7, 9 weeks after planting (WAP) in broccoli in 2014.
Treatment Rate/acre 25-Aug 30-Sep 14-Oct
Belay 8a + 4b fl oz 0.6 ± 0.2a 1.3 ± 0.4a 2.0 ± 0.2a
Torac 21 + 21 fl oz 0.8 ± 0.2a 1.7 ± 0.3a 1.8 ± 0.3a
Venom 6 + 6 fl oz 0.5 ± 0.1a 1.6 ± 0.2a 1.5 ± 0.2a
Mustang 4 + 4 fl oz 0.7 ± 0.3a 1.1 ± 0.3a 1.4 ± 0.1a
Verimark 13.5 +13.5 fl oz 0.9 ± 0.4a 1.4 ± 0.2a 1.7 ± 0.2a
UTC 0.8 ± 0.2a 1.6 ± 0.2a 1.6 ± 0.3a
Table 5. Number of plants with cabbage maggot injury at 5, 7, 9 weeks after planting (WAP) in broccoli in 2014.
Treatment Rate/acre 25-Aug 30-Sep 14-Oct
Belay 8a + 4b fl oz 3.0 ± 1.1a 4.8 ± 1.1a 6.5 ± 0.5a
Torac 21 + 21 fl oz 4.7 ± 0.6a 6.5 ± 1.3a 6.3 ± 1.1a
Venom 6 + 6 fl oz 3.0 ± 0.4a 4.6 ± 0.2a 5.4 ± 0.7a
Mustang 4 + 4 fl oz 2.7 ± 0.6a 4.0 ± 0.6a 4.7 ± 0.3a
Verimark 13.5 +13.5 fl oz 4.8 ± 0.8a 5.0 ± 0.4a 6.3 ± 0.5a
UTC 4.8 ± 1.0a 5.5 ± 0.6a 6.5 ± 0.6a
17
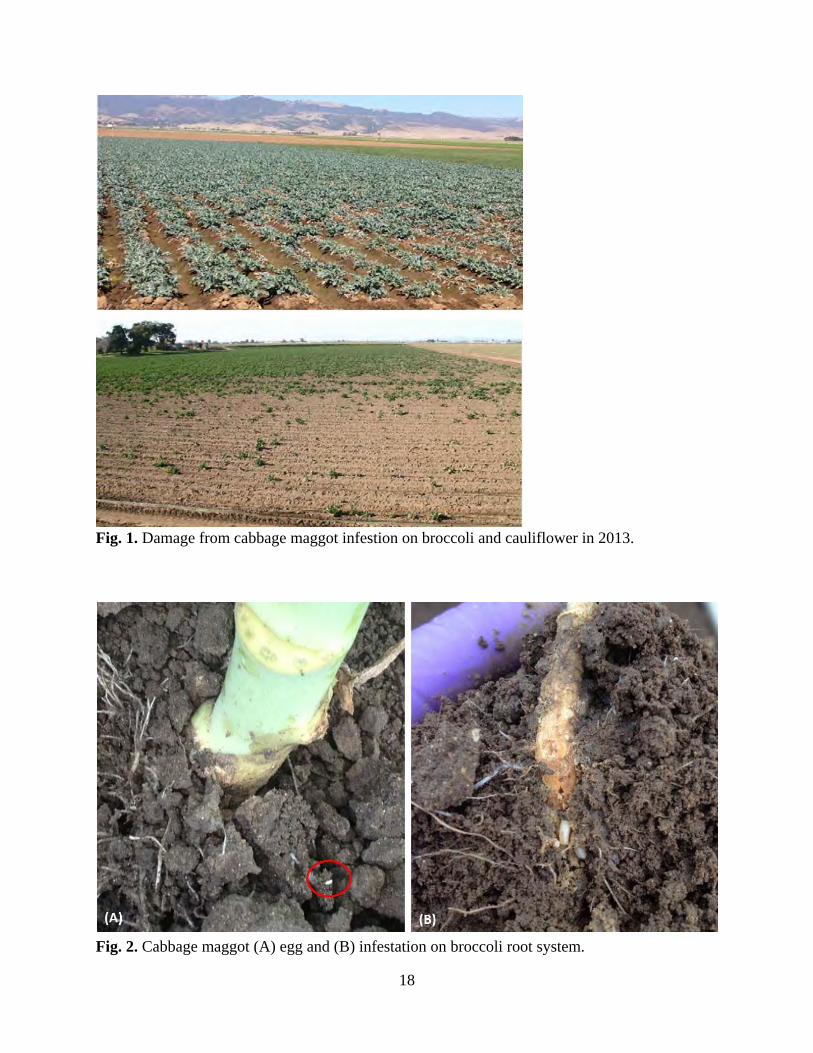
Fig. 1. Damage from cabbage maggot infestion on broccoli and cauliflower in 2013.
Fig. 2. Cabbage maggot (A) egg and (B) infestation on broccoli root system.
18
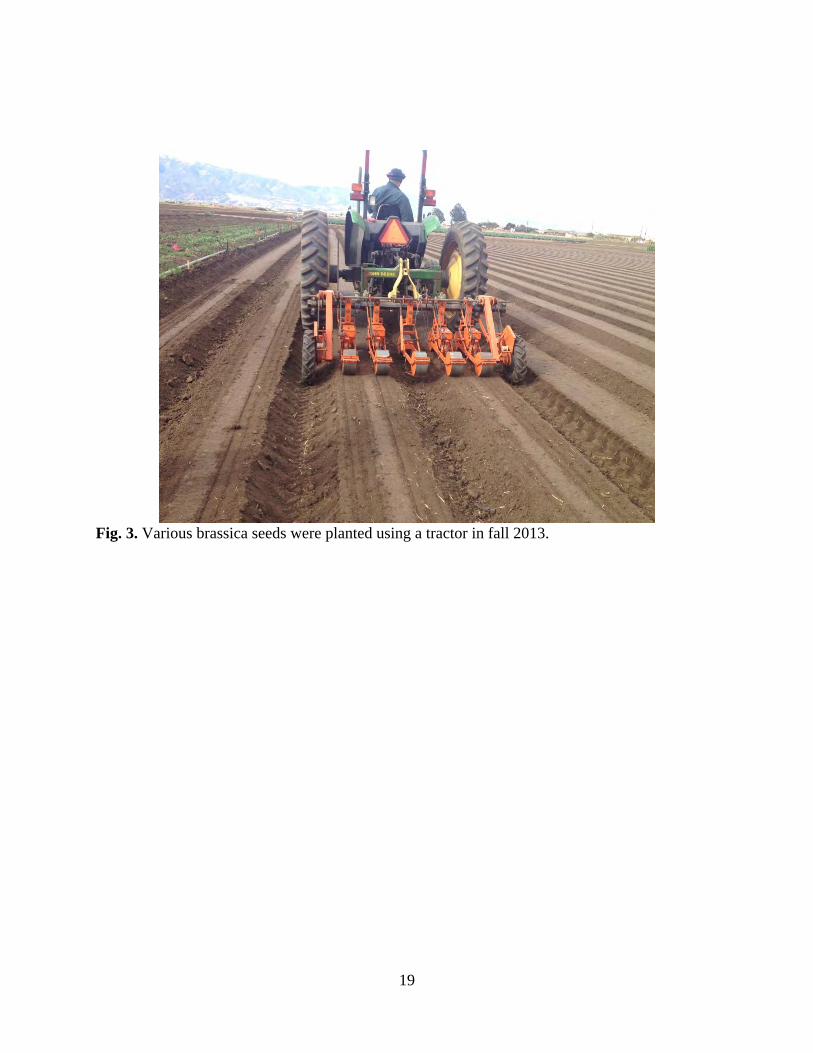
Fig. 3. Various brassica seeds were planted using a tractor in fall 2013.
19
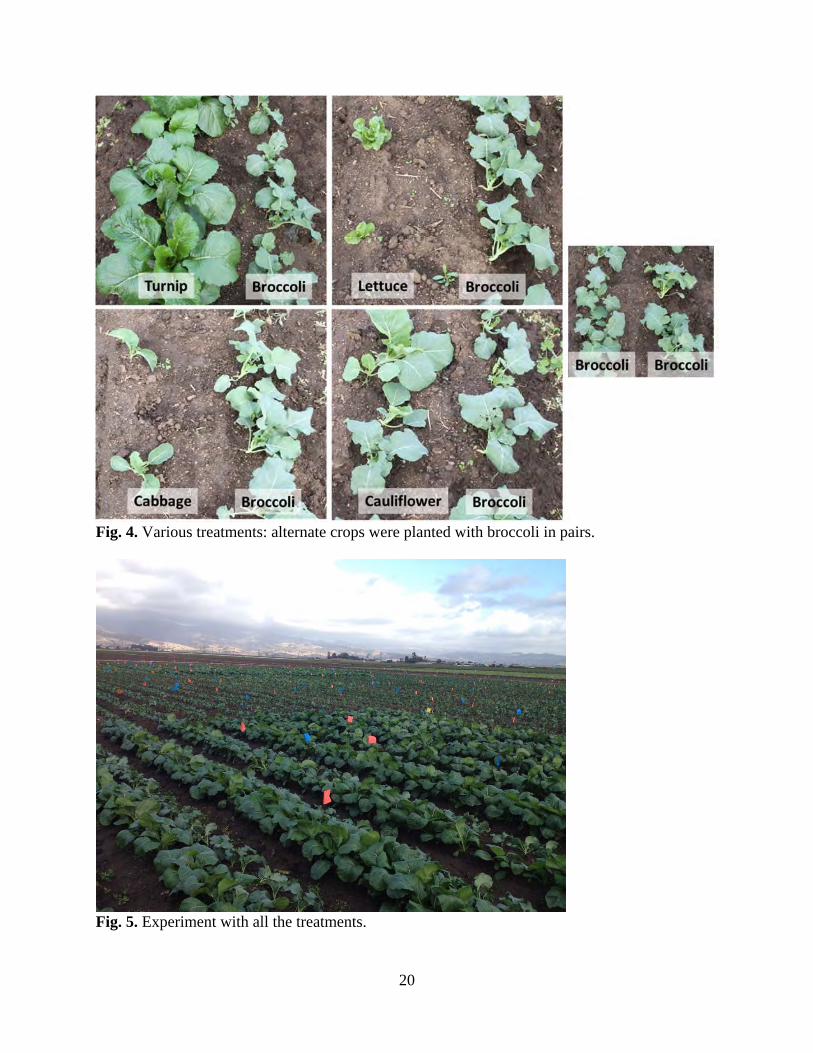
Fig. 4. Various treatments: alternate crops were planted with broccoli in pairs.
Fig. 5. Experiment with all the treatments.
20
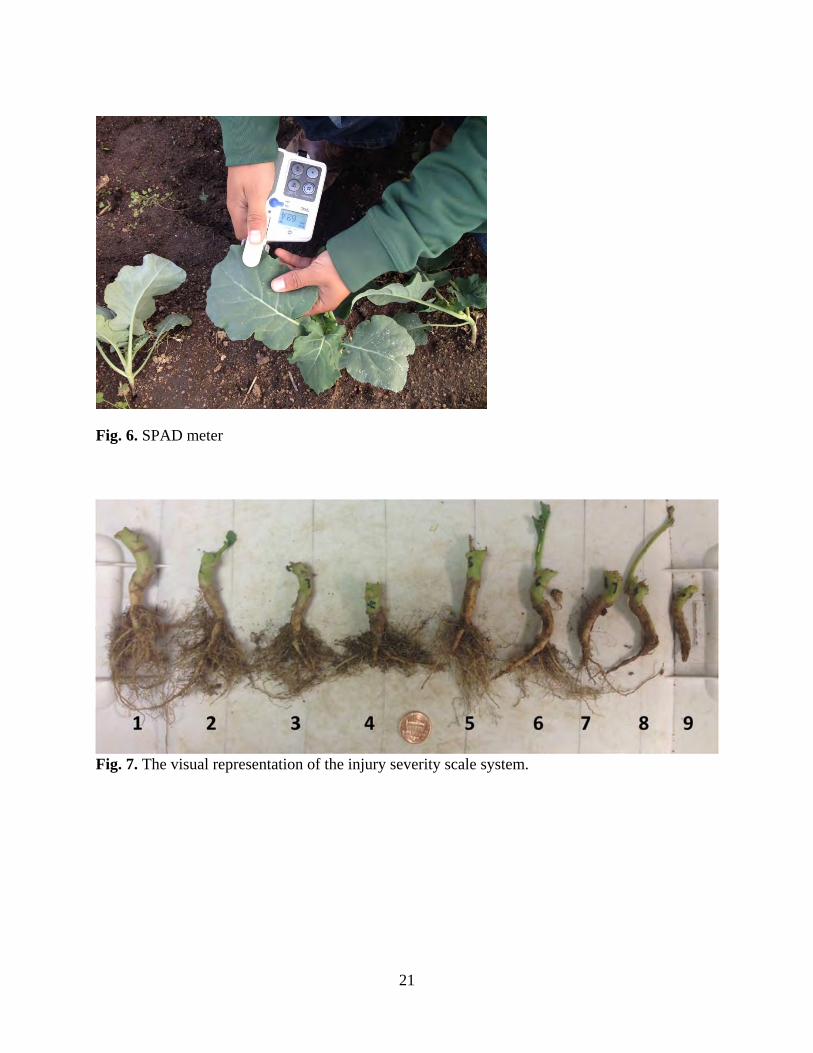
Fig. 6. SPAD meter
Fig. 7. The visual representation of the injury severity scale system.
21
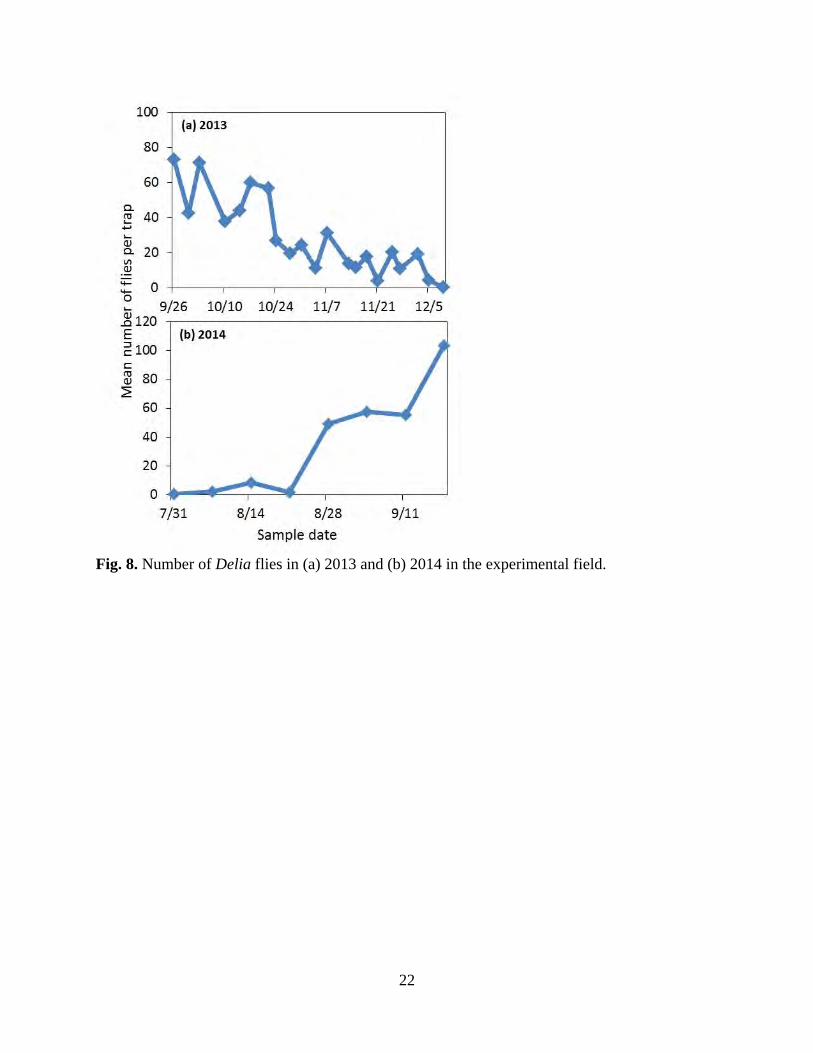
Fig. 8. Number of Delia flies in (a) 2013 and (b) 2014 in the experimental field.
22
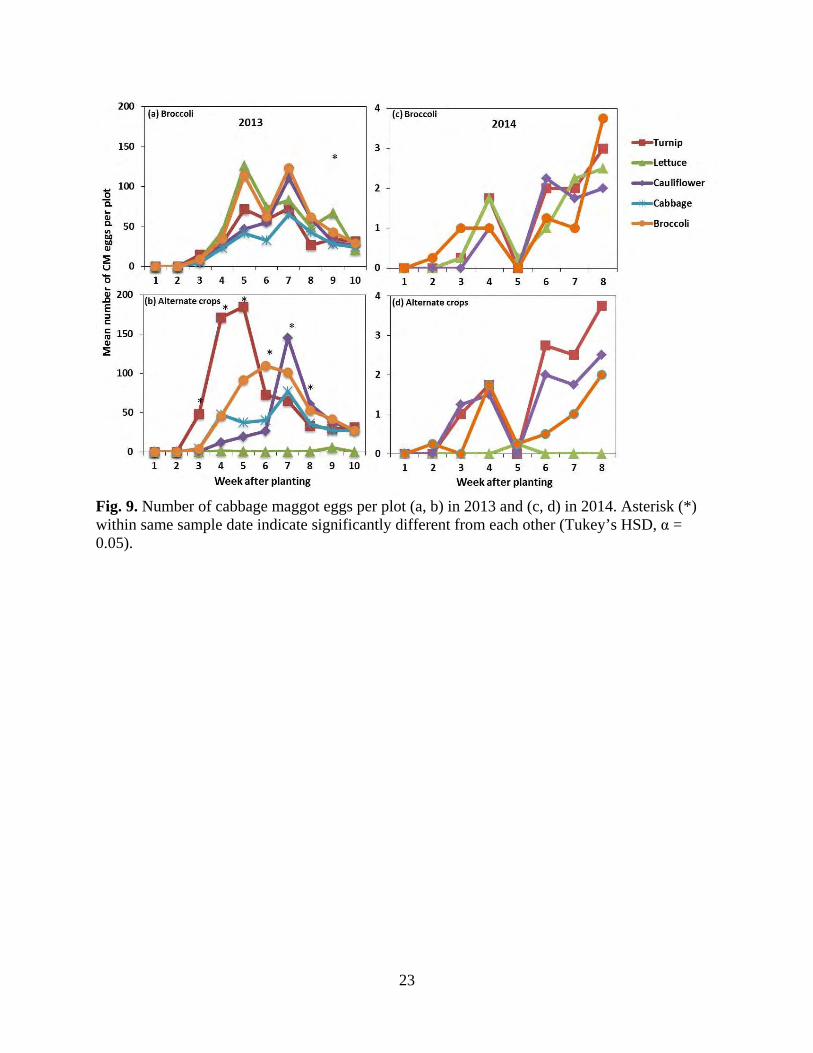
Fig. 9. Number of cabbage maggot eggs per plot (a, b) in 2013 and (c, d) in 2014. Asterisk (*) within same sample date indicate significantly different from each other (Tukey’s HSD, α = 0.05).
23
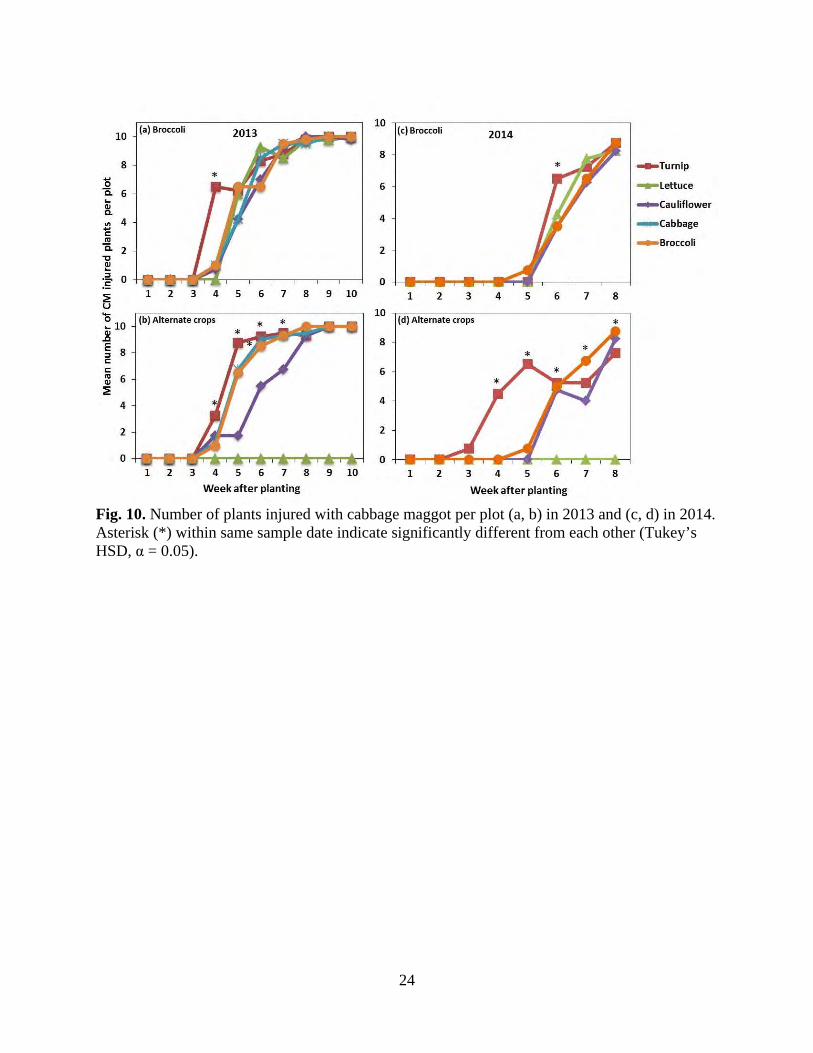
Fig. 10. Number of plants injured with cabbage maggot per plot (a, b) in 2013 and (c, d) in 2014. Asterisk (*) within same sample date indicate significantly different from each other (Tukey’s HSD, α = 0.05).
24

Fig. 11. Severity of cabbage maggot infestation per plot (a, b) in 2013 and (c, d) in 2014. Asterisk (*) within same sample date indicate significantly different from each other (Tukey’s HSD, α = 0.05).
25
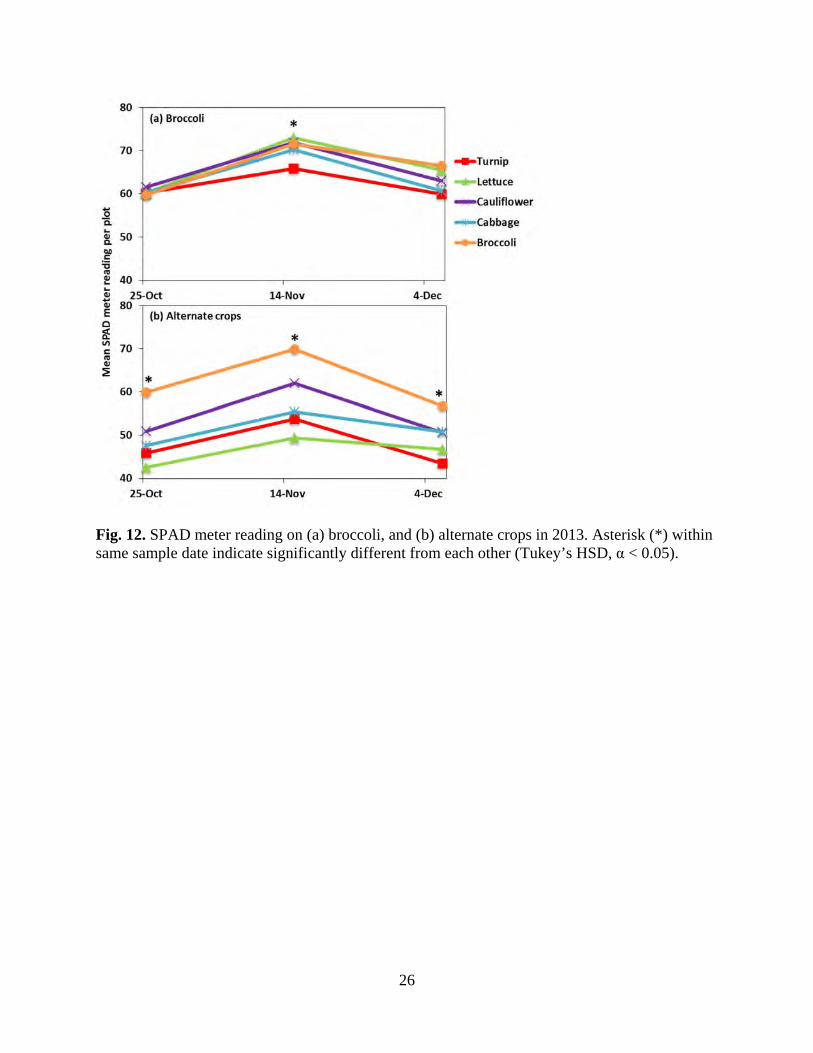
Fig. 12. SPAD meter reading on (a) broccoli, and (b) alternate crops in 2013. Asterisk (*) within same sample date indicate significantly different from each other (Tukey’s HSD, α < 0.05).
26
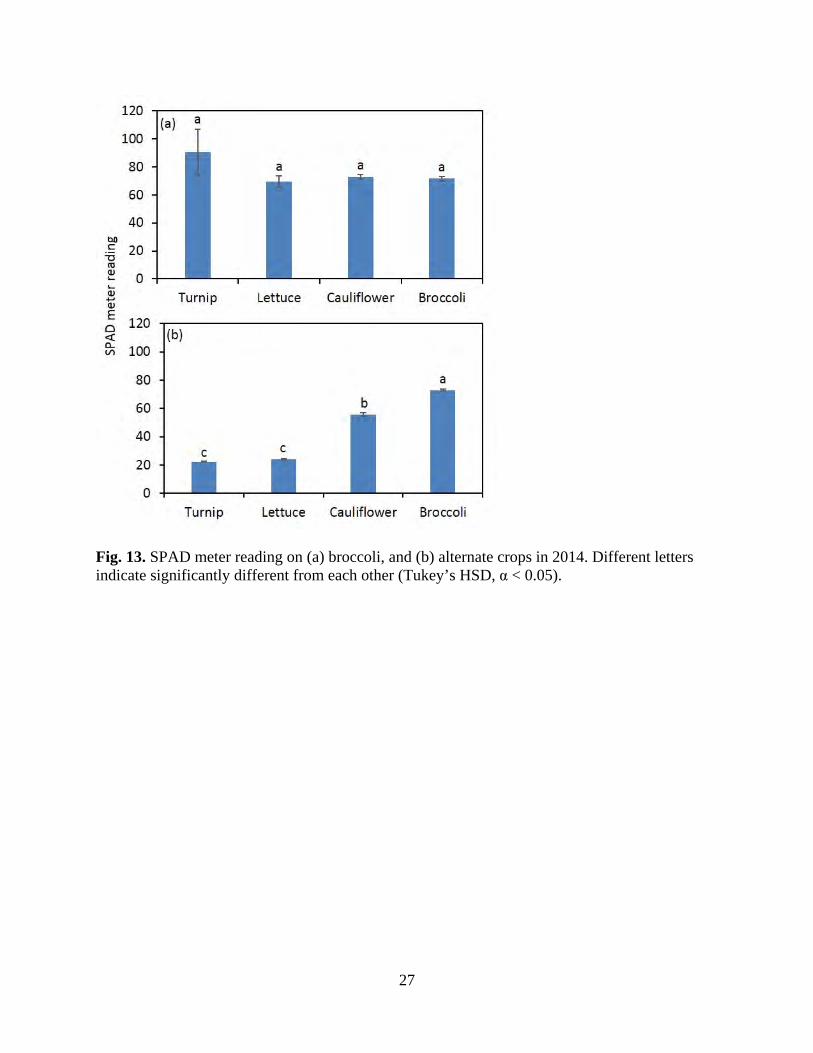
Fig. 13. SPAD meter reading on (a) broccoli, and (b) alternate crops in 2014. Different letters indicate significantly different from each other (Tukey’s HSD, α < 0.05).
27

Fig. 14. Plant health rating developed on broccoli.
28
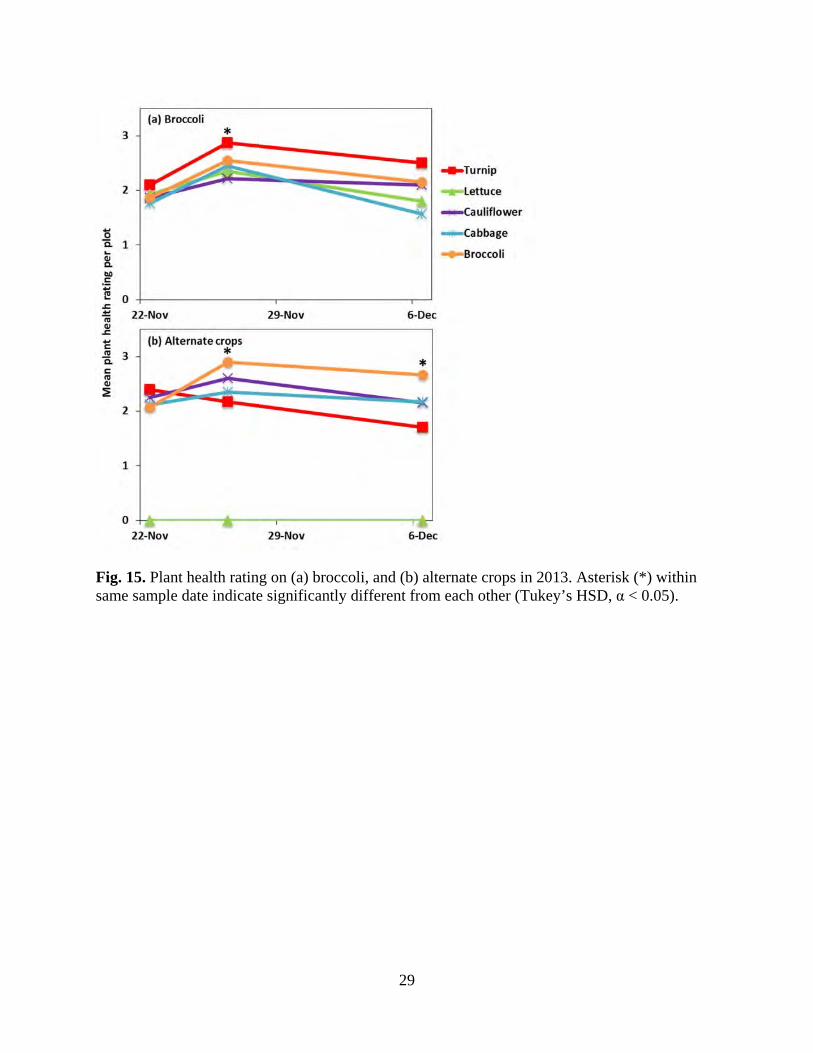
Fig. 15. Plant health rating on (a) broccoli, and (b) alternate crops in 2013. Asterisk (*) within same sample date indicate significantly different from each other (Tukey’s HSD, α < 0.05).
29
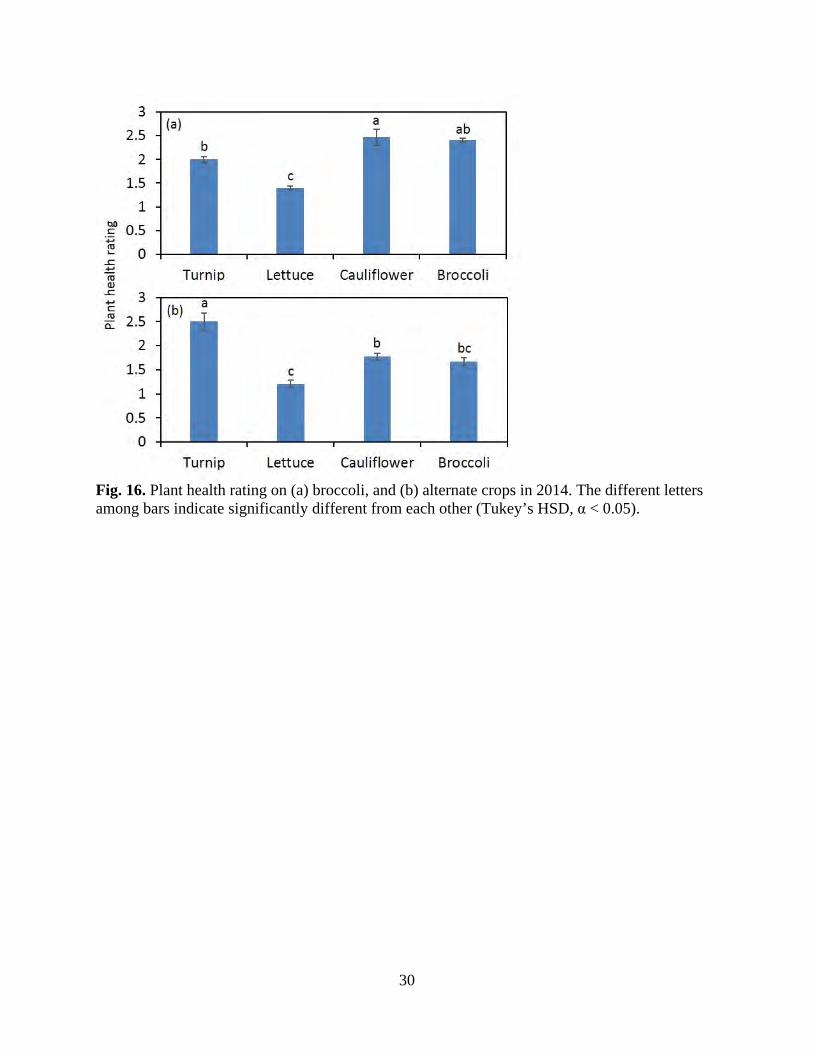
Fig. 16. Plant health rating on (a) broccoli, and (b) alternate crops in 2014. The different letters among bars indicate significantly different from each other (Tukey’s HSD, α < 0.05).
30
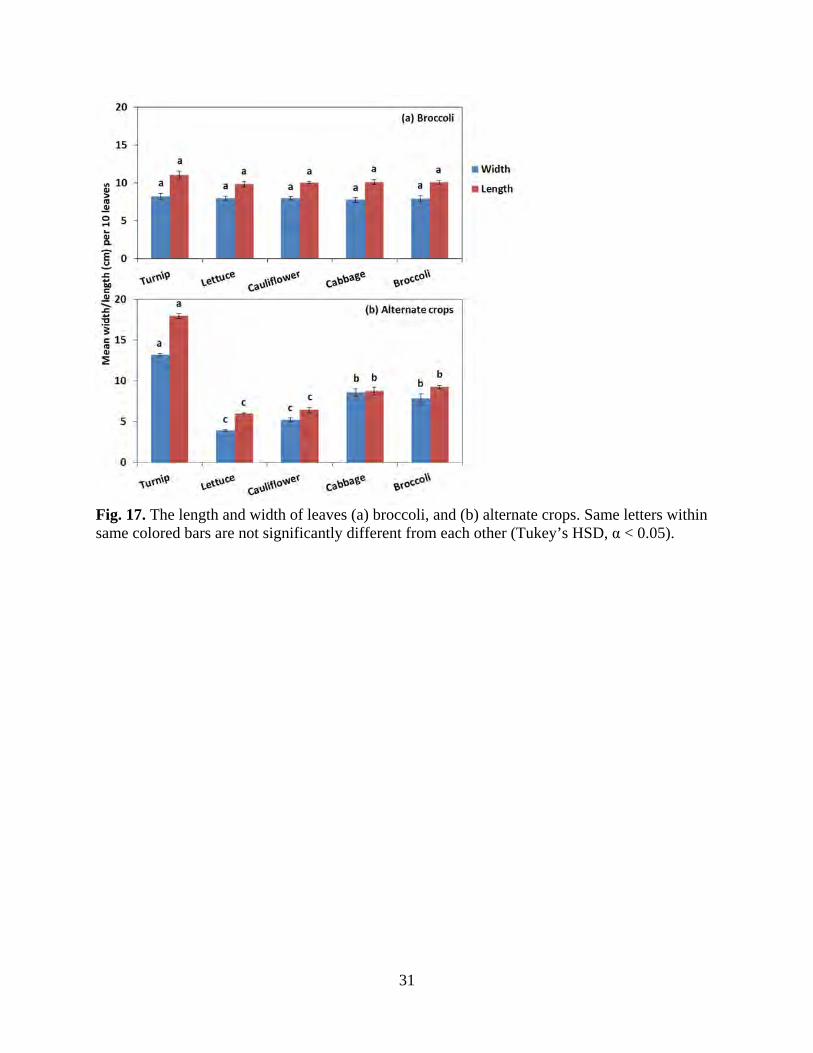
Fig. 17. The length and width of leaves (a) broccoli, and (b) alternate crops. Same letters within same colored bars are not significantly different from each other (Tukey’s HSD, α < 0.05).
31
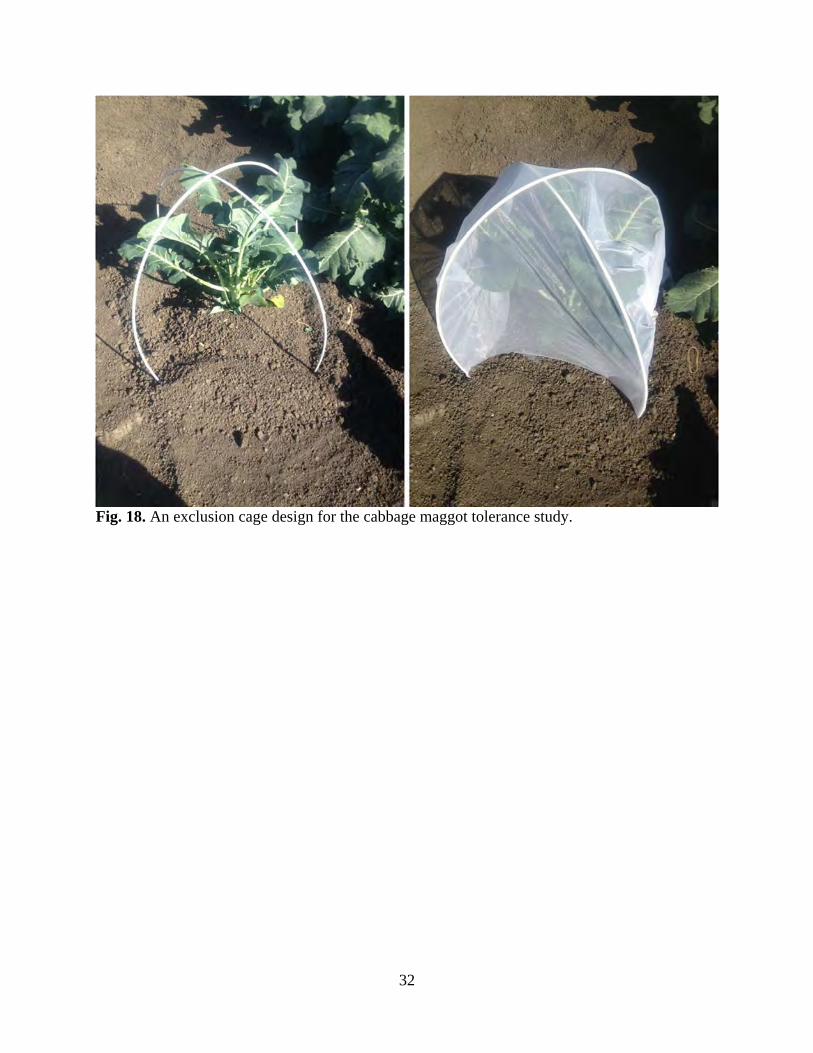
Fig. 18. An exclusion cage design for the cabbage maggot tolerance study.
32
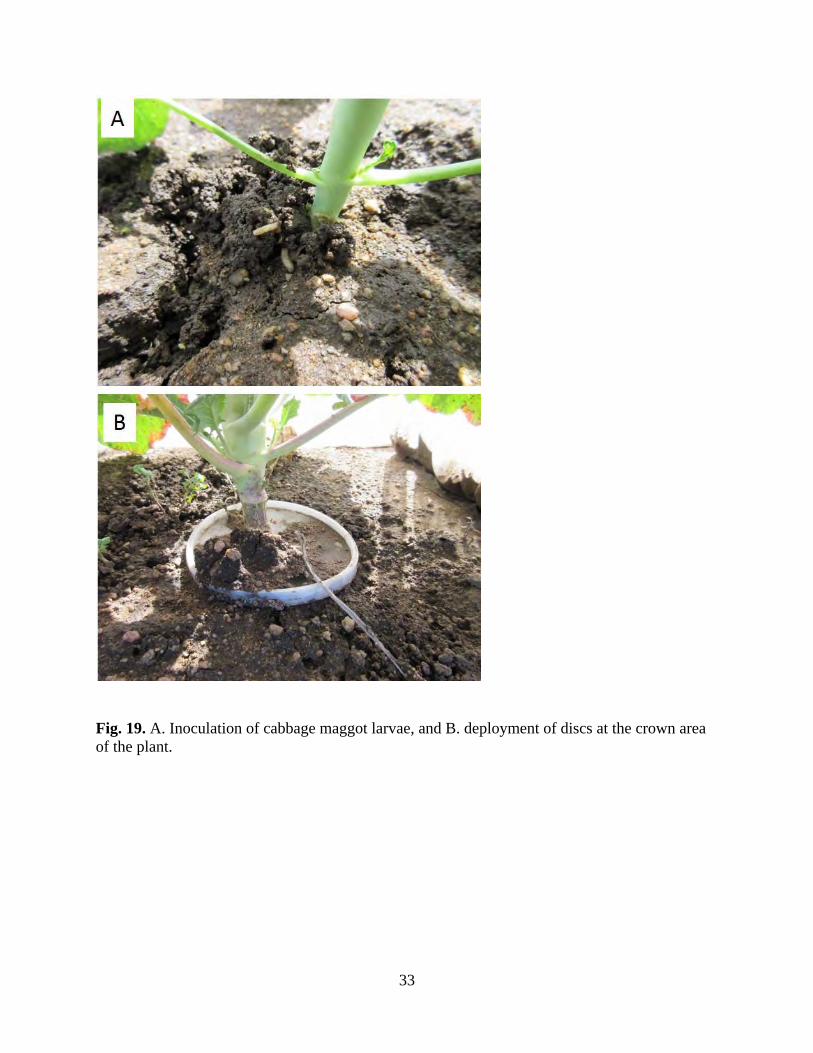
Fig. 19. A. Inoculation of cabbage maggot larvae, and B. deployment of discs at the crown area of the plant.
33
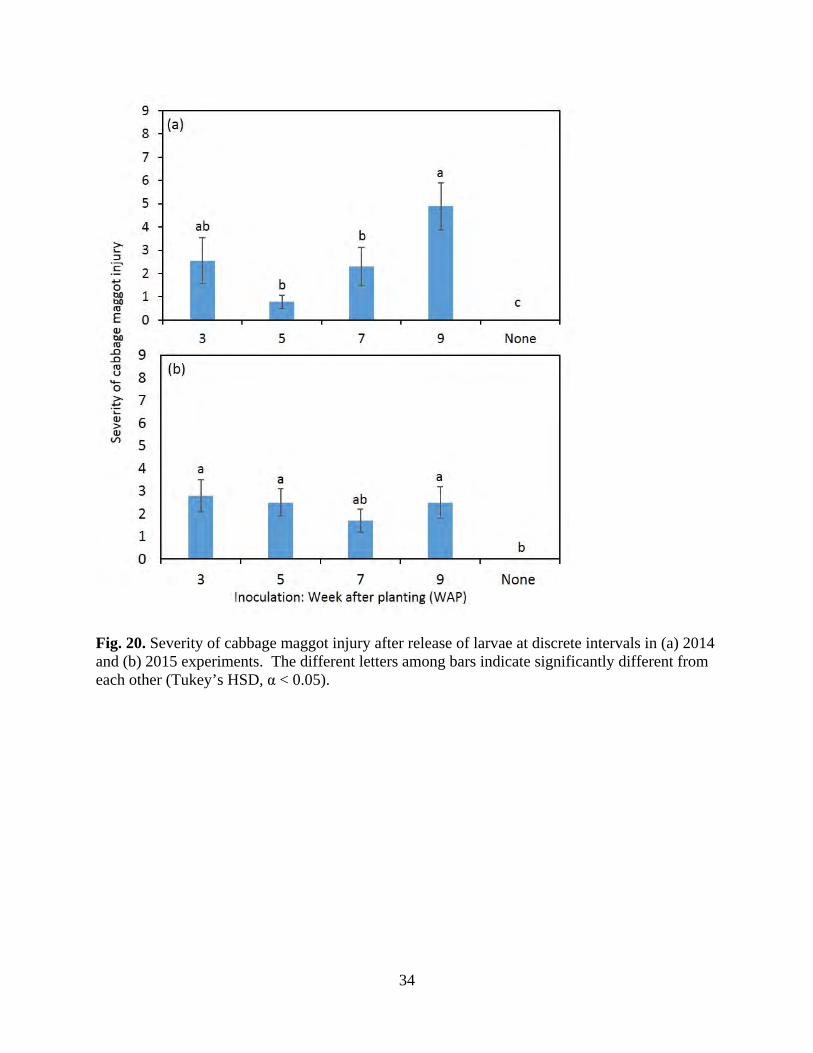
Fig. 20. Severity of cabbage maggot injury after release of larvae at discrete intervals in (a) 2014 and (b) 2015 experiments. The different letters among bars indicate significantly different from each other (Tukey’s HSD, α < 0.05).
34

Fig. 21. Plant health status days after inoculation for every discrete interval release of cabbage maggot larvae in 2014 experiment. The different letters among bars within inoculation week indicate significantly different from each other (Tukey’s HSD, α < 0.05).
35
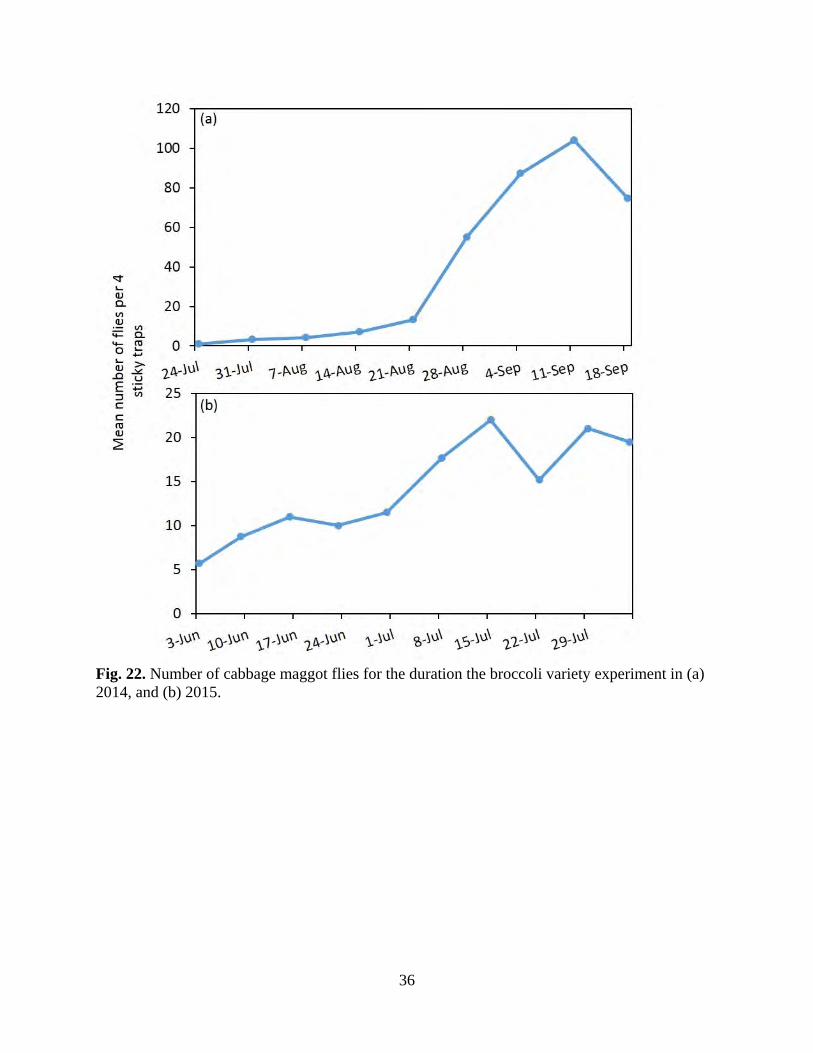
Fig. 22. Number of cabbage maggot flies for the duration the broccoli variety experiment in (a) 2014, and (b) 2015.
36
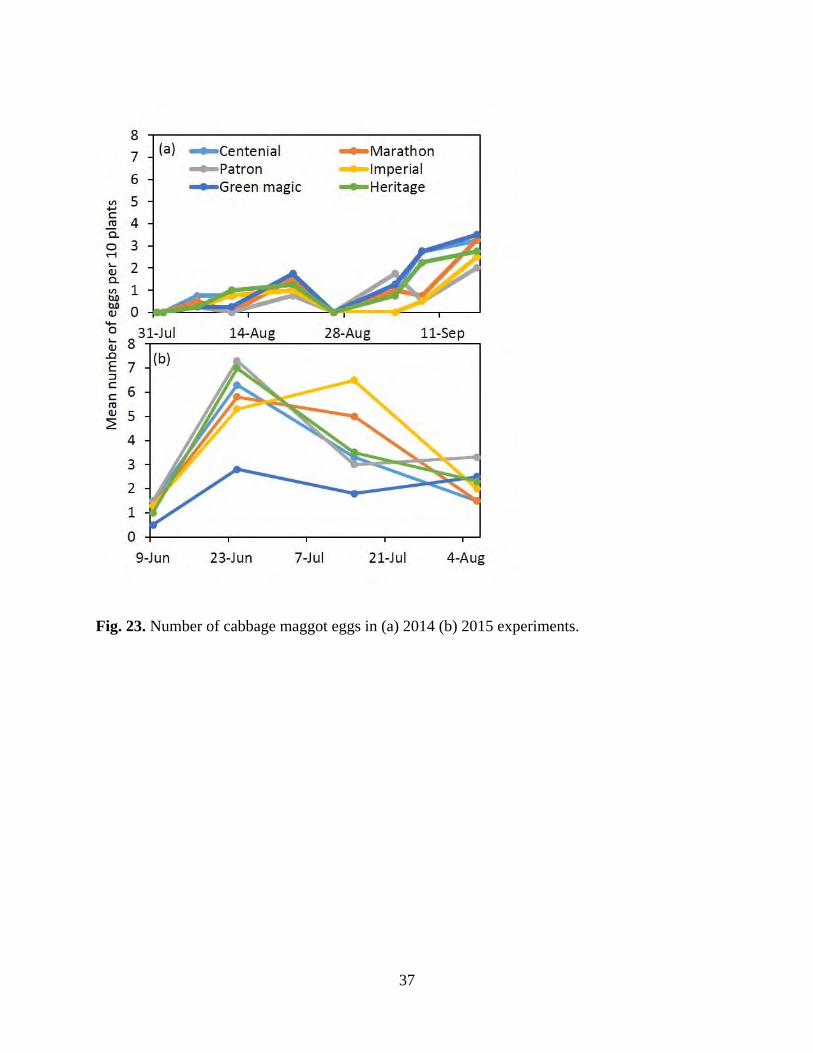
Fig. 23. Number of cabbage maggot eggs in (a) 2014 (b) 2015 experiments.
37

Fig. 24. Number of cabbage maggot larvae in (a) 2014 and b) 2015 experiments.
38
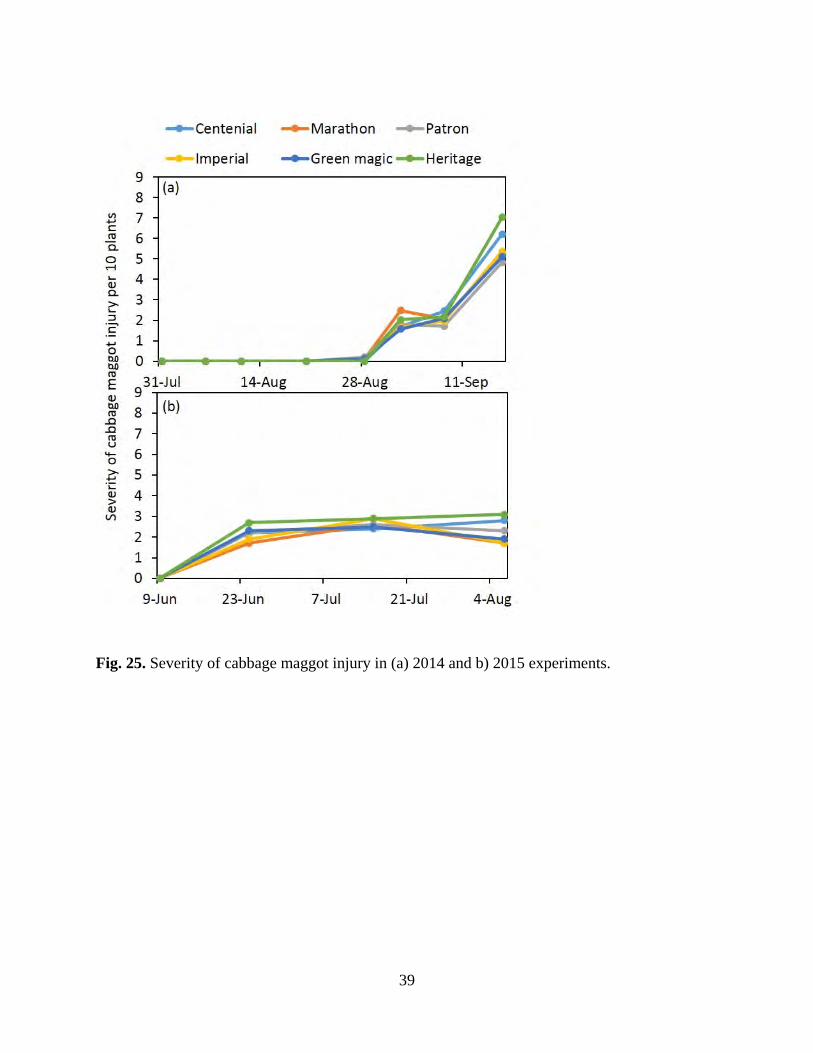
Fig. 25. Severity of cabbage maggot injury in (a) 2014 and b) 2015 experiments.
39

Fig. 26. Number of cabbage maggot flies for the duration the cauliflower variety experiment in (a) 2014 and (b) 2015.
40
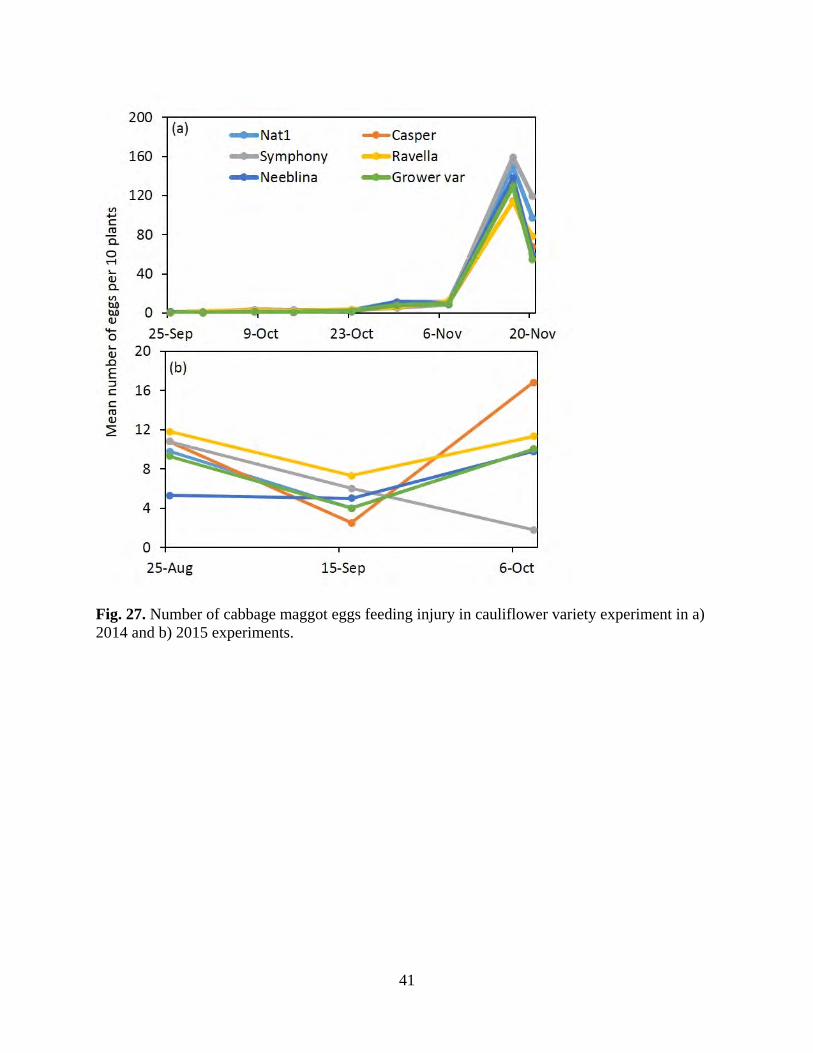
Fig. 27. Number of cabbage maggot eggs feeding injury in cauliflower variety experiment in a) 2014 and b) 2015 experiments.
41

Fig. 28. Severity of cabbage maggot feeding injury in cauliflower variety experiment in a) 2014 and b) 2015 experiments.
42

Fig. 29. Fresh and dry weight of 7 cauliflower above-ground plant parts near harvest in cauliflower variety experiment.
43

Fig. 30. Number of cabbage maggot eggs at various time intervals between crops by (a) week, and (b) seasonal average in 2014. The asterisks indicate significant difference among treatments by sample date (P < 0.05). The different letters among bars indicate significantly different from each other (Tukey’s HSD, α < 0.05).
44
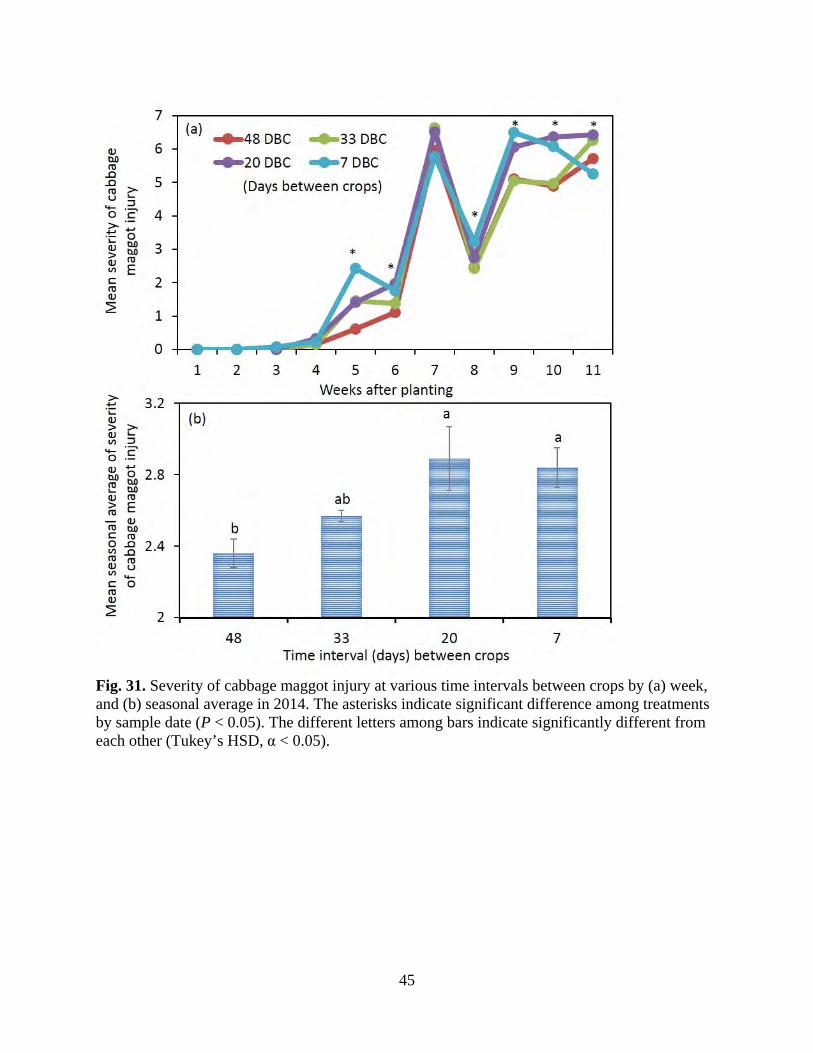
Fig. 31. Severity of cabbage maggot injury at various time intervals between crops by (a) week, and (b) seasonal average in 2014. The asterisks indicate significant difference among treatments by sample date (P < 0.05). The different letters among bars indicate significantly different from each other (Tukey’s HSD, α < 0.05).
45

Fig. 32. Number of cabbage maggot larvae at various time intervals between crops by (a) week, and (b) seasonal average in 2014. The asterisks indicate significant difference among treatments by sample date (P < 0.05). The different letters among bars indicate significantly different from each other (Tukey’s HSD, α < 0.05).
46
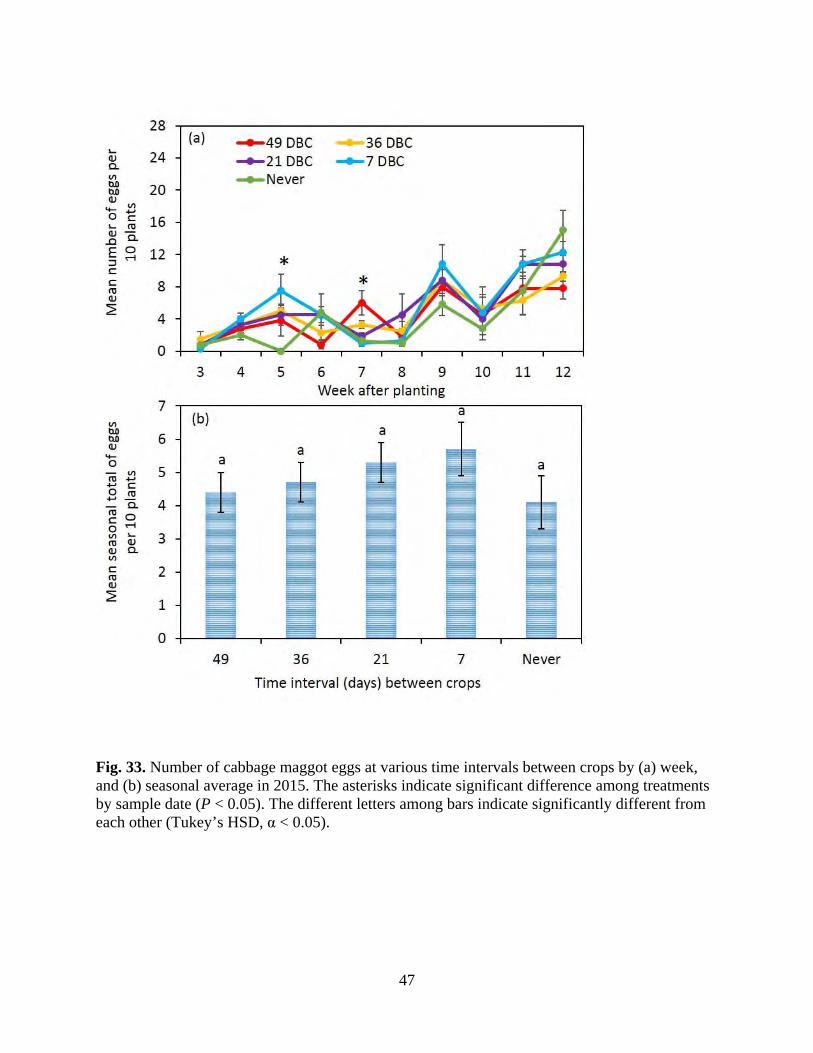
Fig. 33. Number of cabbage maggot eggs at various time intervals between crops by (a) week, and (b) seasonal average in 2015. The asterisks indicate significant difference among treatments by sample date (P < 0.05). The different letters among bars indicate significantly different from each other (Tukey’s HSD, α < 0.05).
47
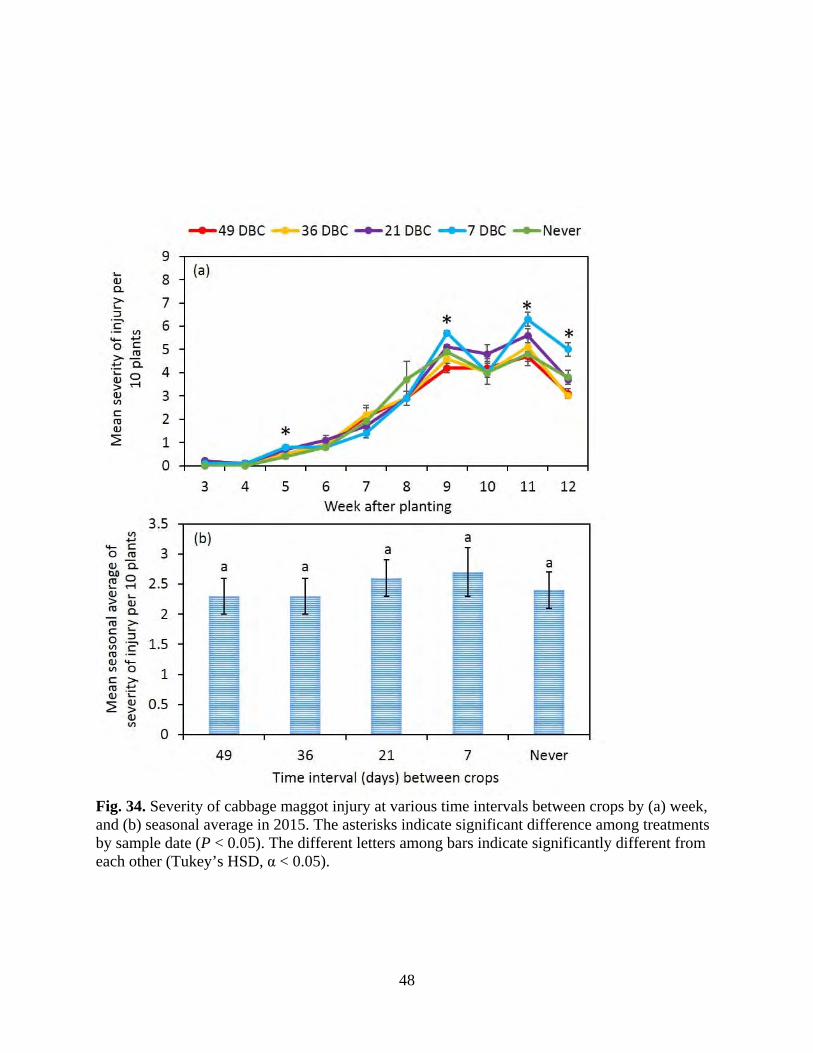
Fig. 34. Severity of cabbage maggot injury at various time intervals between crops by (a) week, and (b) seasonal average in 2015. The asterisks indicate significant difference among treatments by sample date (P < 0.05). The different letters among bars indicate significantly different from each other (Tukey’s HSD, α < 0.05).
48
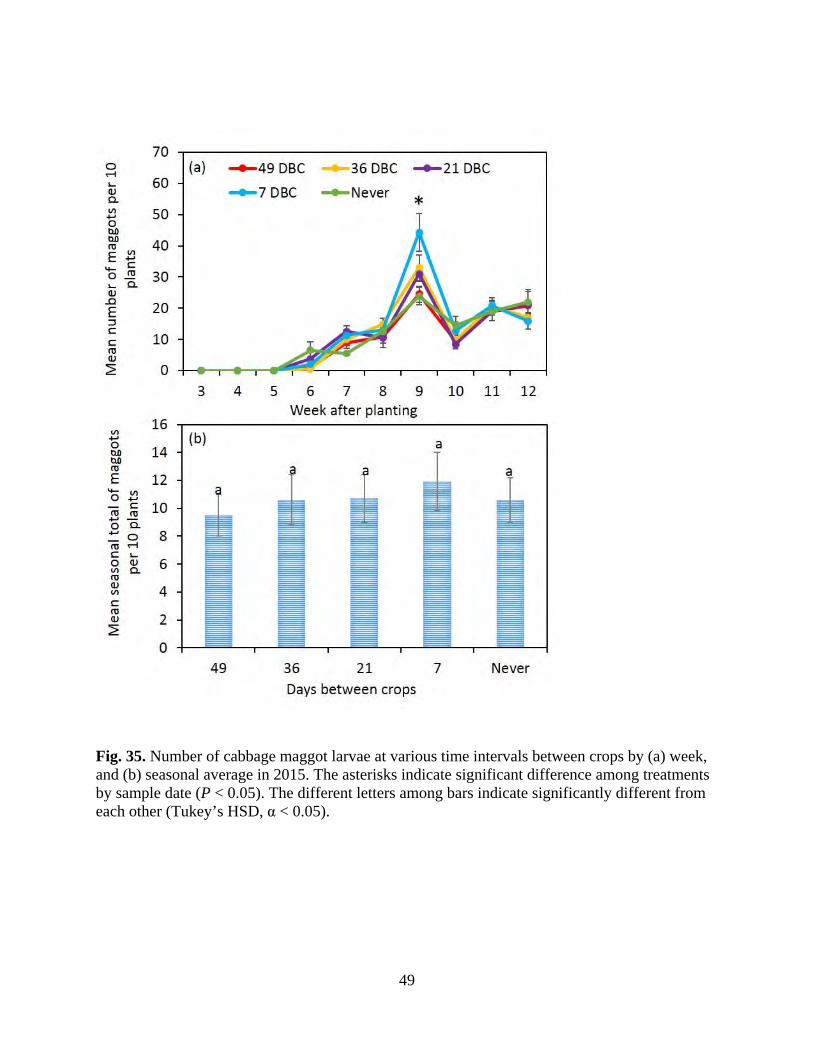
Fig. 35. Number of cabbage maggot larvae at various time intervals between crops by (a) week, and (b) seasonal average in 2015. The asterisks indicate significant difference among treatments by sample date (P < 0.05). The different letters among bars indicate significantly different from each other (Tukey’s HSD, α < 0.05).
49
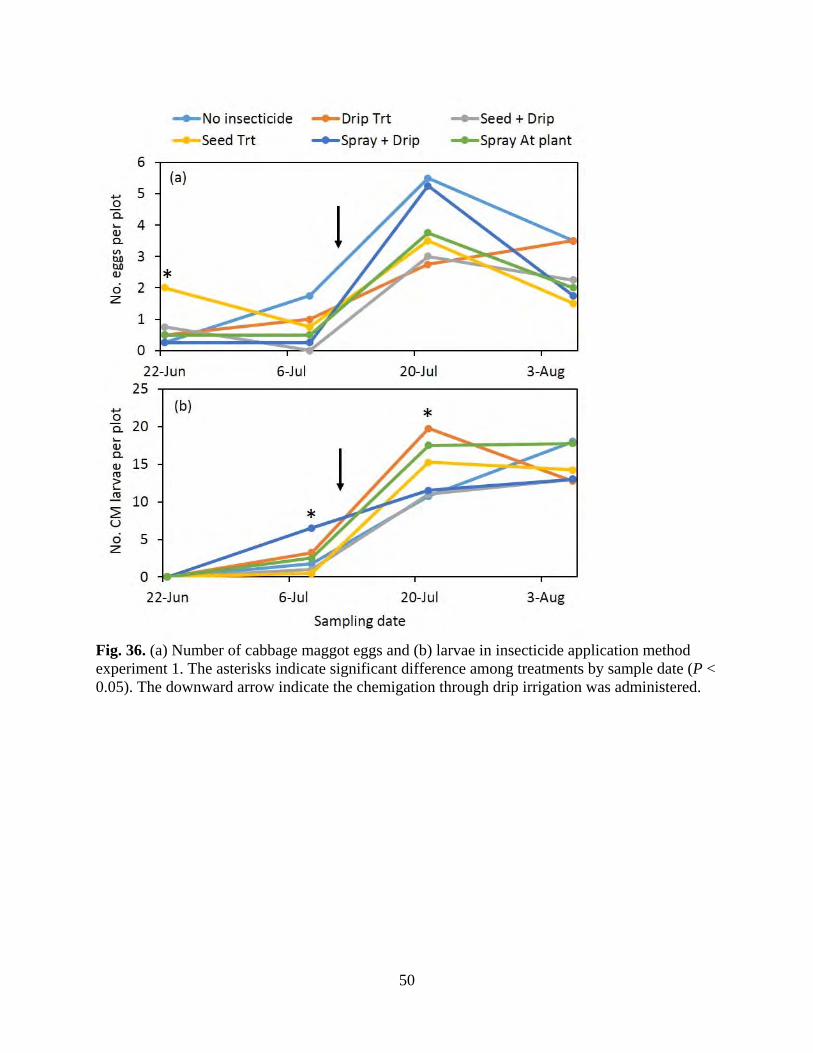
Fig. 36. (a) Number of cabbage maggot eggs and (b) larvae in insecticide application method experiment 1. The asterisks indicate significant difference among treatments by sample date (P < 0.05). The downward arrow indicate the chemigation through drip irrigation was administered.
50
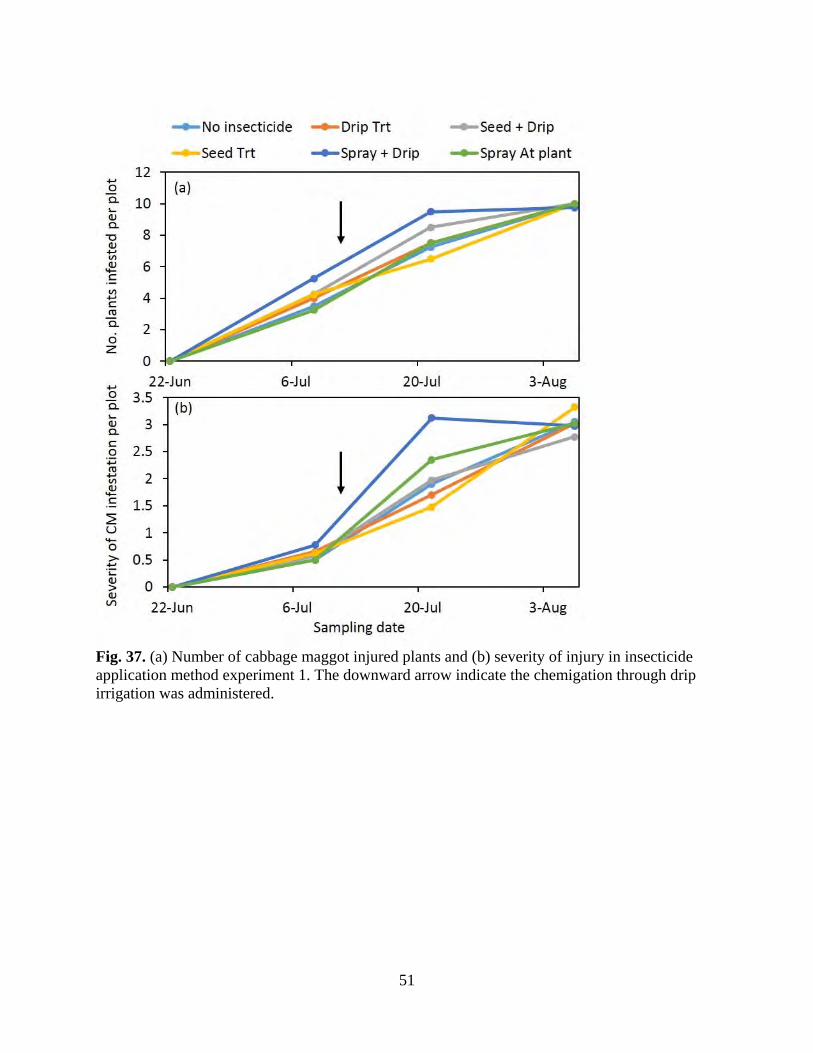
Fig. 37. (a) Number of cabbage maggot injured plants and (b) severity of injury in insecticide application method experiment 1. The downward arrow indicate the chemigation through drip irrigation was administered.
51
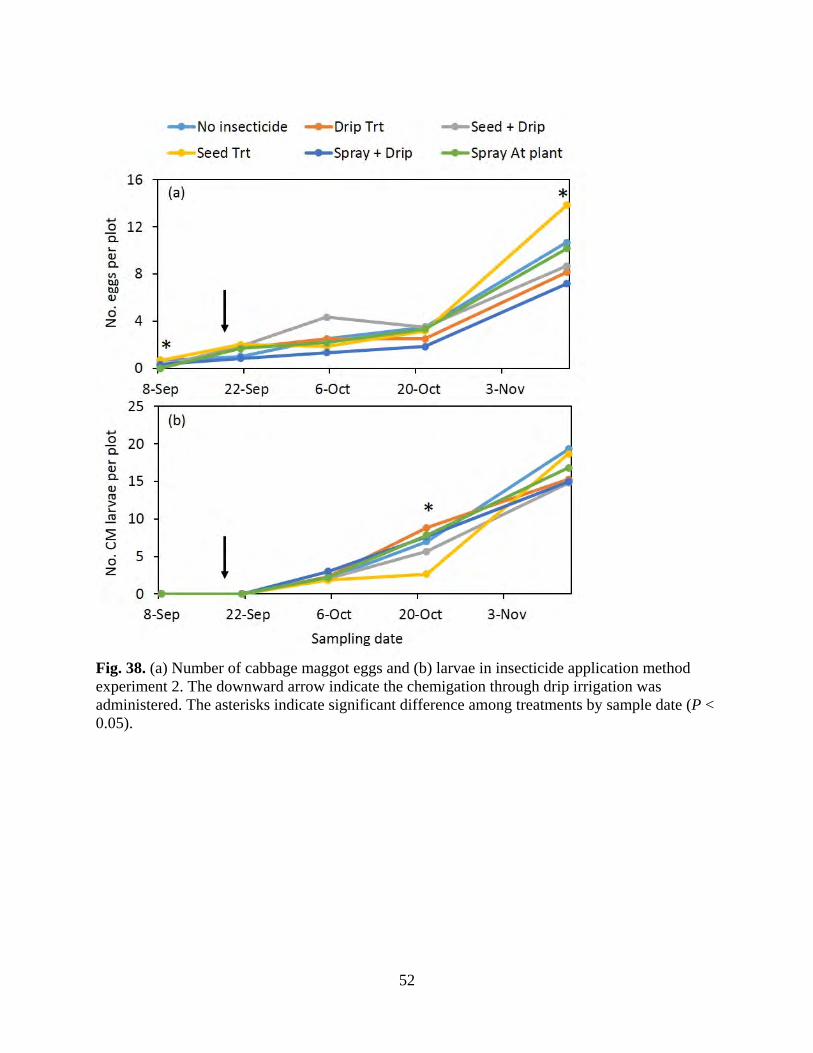
Fig. 38. (a) Number of cabbage maggot eggs and (b) larvae in insecticide application method experiment 2. The downward arrow indicate the chemigation through drip irrigation was administered. The asterisks indicate significant difference among treatments by sample date (P < 0.05).
52

Fig. 39. (a) Number of cabbage maggot injured plants and (b) severity of injury in insecticide application method experiment 2. The asterisks indicate significant difference among treatments by sample date (P < 0.05). The downward arrow indicate the chemigation through drip irrigation was administered.
53