Embed Size (px)
Citation preview
Linkoping University — Department of Management and EngineeringMaster’s thesis, 30 ECTS credits — Operations Management
Spring 2020 — LIU-IEI-TEK-A–20/03871—SE
Reducing Delays for UnplannedMaintenance of Service Parts inMRO Workshops- A case study at an aerospace and defencecompany
Mattias JenvaldMikael Hovmoller
Supervisor: Ou TangExaminer: Fredik Persson
Linkopings universitetSE-581 83 Linkoping
013-28 10 00, www.liu.se

Abstract
Service parts sometimes break down unexpectedly and require maintenance. The irregularnature of the need for this type of maintenance makes forecasting difficult and unreliable.Saab currently experiences problems with long delays when performing unplanned main-tenance of service parts used in the two models of Gripen aircraft, Gripen C and GripenD. These delays are source of monetary waste, as late delivery of maintained service partsresults in Saab having to pay penalty fines to the customers. The purpose of this masterthesis was to analyze data collected during a case study at Saab in Linkoping, and sug-gest improvements for how to reduce these delays. This study focused on analyzing whatcaused the delays, and how the information provided by the customers can be used by theoperative planners at the Maintenance, Repair & Overhaul (MRO) workshops in orderto be more efficient. The data was collected during the case study using semi-structuredinterviews of 16 people working with the current system, as well as by collecting historicaldata from an internal database at Saab. This data was analyzed in parallel with a liter-ature study of relevant research related to service parts supply chains, MRO workshops,and unplanned maintenance operations.
The analysis showed that there were four types of interruptions of maintenance; Internalstock-out of spare parts, internal stock-out of sub-units, external delays at the OriginalEquipment Manufacturer (OEM), and internal equipment breakdowns. A root causeanalysis found that the four root causes of delays were:
• Saab does not have any contracts that incentivizes their OEM’s to deliver on time.
• The data from the technical report is not used to provide the operative plannerswith information about incoming orders.
• The MRO workshops do not have a standardized system for prioritizing maintenanceof service parts.
• The MRO workshops currently lacks a method for predicting certain types of ma-chine breakdowns.

Master Thesis
Acknowledgement
This master thesis marks the end of our master’s degree and is the embodiment of all thetheory and knowledge we have acquired during our five years of education at LinkopingUniversity. During the 20 weeks that we have worked on this master thesis, we havetaken the opportunity to learn valuable practical skills that complement the theoreticalknowledge acquired at Linkoping University. It has been a rewarding experience that wewill benefit from in our future careers. We would like to express our sincere appreciationto the following people, without whom the completion of this master thesis would nothave been possible.
• Martin Larsson, our supervisor at Saab, for providing us with excellent support anddiscussions throughout the whole master thesis.
• Lars Mattsson, Head of Logistics Engineering at Saab, for giving us the resourceswe needed to complete this master thesis and welcoming us to his department.
• Dino Besic, MRO planner at Saab, for happily answering our never-ending questions.
• Ou Tang, our supervisor at Linkopings University, for his invaluable advice and foralways believing in us.
• Fredrik Persson, our examiner at Linkopings University, for an objective and pro-fessional audit of our master thesis.
• Our opponents, Christoffer Lind and Jonas Lilja, for interesting discussions andvaluable feedback.
In addition to these people, we would like to thank all the people at Saab whom weinterviewed during our case study.
i
Contents
1 Introduction 11.1 Theoretical Background . . . . . . . . . . . . . . . . . . . . . . . . . . . . 11.2 Company Background . . . . . . . . . . . . . . . . . . . . . . . . . . . . . 3
1.2.1 Gripen Support . . . . . . . . . . . . . . . . . . . . . . . . . . . . . 51.3 Gripen C/D . . . . . . . . . . . . . . . . . . . . . . . . . . . . . . . . . . . 6
1.3.1 Aircraft Maintenance . . . . . . . . . . . . . . . . . . . . . . . . . . 61.4 Problem Description . . . . . . . . . . . . . . . . . . . . . . . . . . . . . . 81.5 Purpose . . . . . . . . . . . . . . . . . . . . . . . . . . . . . . . . . . . . . 9
1.5.1 Research Questions . . . . . . . . . . . . . . . . . . . . . . . . . . . 91.6 Delimitations . . . . . . . . . . . . . . . . . . . . . . . . . . . . . . . . . . 91.7 The structure of the report . . . . . . . . . . . . . . . . . . . . . . . . . . . 10
2 Methods and Methodology 112.1 Research Approach . . . . . . . . . . . . . . . . . . . . . . . . . . . . . . . 112.2 Data Collection . . . . . . . . . . . . . . . . . . . . . . . . . . . . . . . . . 12
2.2.1 Interviews . . . . . . . . . . . . . . . . . . . . . . . . . . . . . . . . 122.2.2 Historical/Archival Methods . . . . . . . . . . . . . . . . . . . . . . 13
2.3 Literature Review . . . . . . . . . . . . . . . . . . . . . . . . . . . . . . . . 132.4 Analysis . . . . . . . . . . . . . . . . . . . . . . . . . . . . . . . . . . . . . 13
2.4.1 Empirical data analysis . . . . . . . . . . . . . . . . . . . . . . . . . 142.4.2 ABC analysis . . . . . . . . . . . . . . . . . . . . . . . . . . . . . . 142.4.3 Lead time analysis . . . . . . . . . . . . . . . . . . . . . . . . . . . 142.4.4 Process Mapping . . . . . . . . . . . . . . . . . . . . . . . . . . . . 152.4.5 Root cause analysis . . . . . . . . . . . . . . . . . . . . . . . . . . . 17
2.5 Execution Plan . . . . . . . . . . . . . . . . . . . . . . . . . . . . . . . . . 172.6 Validity and Reliability . . . . . . . . . . . . . . . . . . . . . . . . . . . . . 18
2.6.1 Reliability . . . . . . . . . . . . . . . . . . . . . . . . . . . . . . . . 182.6.2 Validity . . . . . . . . . . . . . . . . . . . . . . . . . . . . . . . . . 18
3 Frame of References 193.1 Service Parts . . . . . . . . . . . . . . . . . . . . . . . . . . . . . . . . . . 193.2 Maintenance, Repair, and Overhaul . . . . . . . . . . . . . . . . . . . . . . 19
3.2.1 Planned and Unplanned Maintenance . . . . . . . . . . . . . . . . . 203.2.2 Service Contracts . . . . . . . . . . . . . . . . . . . . . . . . . . . . 213.2.3 Lead time . . . . . . . . . . . . . . . . . . . . . . . . . . . . . . . . 213.2.4 Big Data Analytics and Predictive Maintenance . . . . . . . . . . . 22
3.3 Supply Chain . . . . . . . . . . . . . . . . . . . . . . . . . . . . . . . . . . 223.3.1 Inventory Management . . . . . . . . . . . . . . . . . . . . . . . . . 23
ii

CONTENTS Master Thesis
3.3.2 Supply Chain Configuration . . . . . . . . . . . . . . . . . . . . . . 233.3.3 Information Flow . . . . . . . . . . . . . . . . . . . . . . . . . . . . 233.3.4 Material Flow . . . . . . . . . . . . . . . . . . . . . . . . . . . . . . 243.3.5 Forecasting . . . . . . . . . . . . . . . . . . . . . . . . . . . . . . . 253.3.6 Decision Support . . . . . . . . . . . . . . . . . . . . . . . . . . . . 253.3.7 Prioritization . . . . . . . . . . . . . . . . . . . . . . . . . . . . . . 26
3.4 Manufacturing Planning and Control . . . . . . . . . . . . . . . . . . . . . 263.4.1 Enterprise Resource Planning . . . . . . . . . . . . . . . . . . . . . 263.4.2 Demand Management . . . . . . . . . . . . . . . . . . . . . . . . . 29
4 Current State 314.1 Gripen C/D Customers . . . . . . . . . . . . . . . . . . . . . . . . . . . . . 314.2 Service Parts . . . . . . . . . . . . . . . . . . . . . . . . . . . . . . . . . . 334.3 Service Parts Supply Chain . . . . . . . . . . . . . . . . . . . . . . . . . . 334.4 MRO workshops . . . . . . . . . . . . . . . . . . . . . . . . . . . . . . . . 344.5 OEM . . . . . . . . . . . . . . . . . . . . . . . . . . . . . . . . . . . . . . . 37
5 Analysis 405.1 Service Parts . . . . . . . . . . . . . . . . . . . . . . . . . . . . . . . . . . 405.2 ABC - Analysis . . . . . . . . . . . . . . . . . . . . . . . . . . . . . . . . . 405.3 A-class Items . . . . . . . . . . . . . . . . . . . . . . . . . . . . . . . . . . 415.4 Process Map Analysis . . . . . . . . . . . . . . . . . . . . . . . . . . . . . . 425.5 Lead Time Analysis . . . . . . . . . . . . . . . . . . . . . . . . . . . . . . . 44
5.5.1 Internal stock-out (spare parts) . . . . . . . . . . . . . . . . . . . . 455.5.2 Internal stock-out (sub-units) . . . . . . . . . . . . . . . . . . . . . 475.5.3 External work at OEM . . . . . . . . . . . . . . . . . . . . . . . . . 485.5.4 Internal faulty equipment . . . . . . . . . . . . . . . . . . . . . . . 50
5.6 Root Cause Analysis . . . . . . . . . . . . . . . . . . . . . . . . . . . . . . 515.6.1 5-Why analysis . . . . . . . . . . . . . . . . . . . . . . . . . . . . . 52
6 Conclusions 586.1 Answers to research questions . . . . . . . . . . . . . . . . . . . . . . . . . 60
6.1.1 Research Question 1 . . . . . . . . . . . . . . . . . . . . . . . . . . 606.1.2 Research Question 2 . . . . . . . . . . . . . . . . . . . . . . . . . . 606.1.3 Research Question 3 . . . . . . . . . . . . . . . . . . . . . . . . . . 60
6.2 Recommendations to SAAB . . . . . . . . . . . . . . . . . . . . . . . . . . 616.2.1 Contracts . . . . . . . . . . . . . . . . . . . . . . . . . . . . . . . . 616.2.2 Service Part Prioritization . . . . . . . . . . . . . . . . . . . . . . . 616.2.3 Utilizing the Data . . . . . . . . . . . . . . . . . . . . . . . . . . . . 626.2.4 Predicting Machine Breakdowns . . . . . . . . . . . . . . . . . . . . 626.2.5 Recommendation prioritization . . . . . . . . . . . . . . . . . . . . 63
6.3 Ethics and Sustainability . . . . . . . . . . . . . . . . . . . . . . . . . . . . 646.3.1 Ethics . . . . . . . . . . . . . . . . . . . . . . . . . . . . . . . . . . 646.3.2 Sustainability . . . . . . . . . . . . . . . . . . . . . . . . . . . . . . 64
6.4 Future Work . . . . . . . . . . . . . . . . . . . . . . . . . . . . . . . . . . . 65
Appendices 71
A Keywords I
iii

CONTENTS Master Thesis
B Interview Subjects - Planning II
C Interview Subjects - Current State III
D Service parts that contributed to penalty fines 2019 IV
E A-class service parts VI
F Causes for delays XXXIF.1 Service Part 1 . . . . . . . . . . . . . . . . . . . . . . . . . . . . . . . . . . XXXIF.2 Service Part 2 . . . . . . . . . . . . . . . . . . . . . . . . . . . . . . . . . . XXXIF.3 Service Part 3 . . . . . . . . . . . . . . . . . . . . . . . . . . . . . . . . . . XXXIF.4 Service Part 4 . . . . . . . . . . . . . . . . . . . . . . . . . . . . . . . . . . XXXIF.5 Service Part 5 . . . . . . . . . . . . . . . . . . . . . . . . . . . . . . . . . . XXXIIF.6 Service Part 6 . . . . . . . . . . . . . . . . . . . . . . . . . . . . . . . . . . XXXIIF.7 Service Part 7 . . . . . . . . . . . . . . . . . . . . . . . . . . . . . . . . . . XXXIIF.8 Service Part 8 . . . . . . . . . . . . . . . . . . . . . . . . . . . . . . . . . . XXXIIF.9 Service Part 9 . . . . . . . . . . . . . . . . . . . . . . . . . . . . . . . . . . XXXIIF.10 Service Part 10 . . . . . . . . . . . . . . . . . . . . . . . . . . . . . . . . . XXXIIF.11 Service Part 11 . . . . . . . . . . . . . . . . . . . . . . . . . . . . . . . . . XXXIIIF.12 Service Part 12 . . . . . . . . . . . . . . . . . . . . . . . . . . . . . . . . . XXXIIIF.13 Service Part 13 . . . . . . . . . . . . . . . . . . . . . . . . . . . . . . . . . XXXIIIF.14 Service Part 14 . . . . . . . . . . . . . . . . . . . . . . . . . . . . . . . . . XXXIIIF.15 Service Part 15 . . . . . . . . . . . . . . . . . . . . . . . . . . . . . . . . . XXXIIIF.16 Service Part 16 . . . . . . . . . . . . . . . . . . . . . . . . . . . . . . . . . XXXIII
G Lead time analysis timelines XXXIVG.1 Aggregated timeline of internal stock-out (spare parts) . . . . . . . . . . . XXXIVG.2 Aggregated timeline of internal stock-out (sub-units) . . . . . . . . . . . . XXXVG.3 Aggregated timeline of external delay at OEM . . . . . . . . . . . . . . . . XXXVIG.4 Aggregated timeline of internal faulty equipment . . . . . . . . . . . . . . . XXXVII
iv

List of Figures
1.1 Conventional Supply Chain (Mentzer et al. 2001) . . . . . . . . . . . . . . 21.2 Service Parts Supply Chain (Muckstadt 2004) . . . . . . . . . . . . . . . . 21.3 Countries where Saab operates (SAAB 2018) . . . . . . . . . . . . . . . . . 31.4 Organizational structure of Saab (SAAB 2018) . . . . . . . . . . . . . . . . 51.5 Organizational structure of Saab Support and Services (SAAB 2018) . . . 61.6 Gripen C . . . . . . . . . . . . . . . . . . . . . . . . . . . . . . . . . . . . 61.7 Gripen D . . . . . . . . . . . . . . . . . . . . . . . . . . . . . . . . . . . . 61.8 The bathtub curve (Wilkins 2002) . . . . . . . . . . . . . . . . . . . . . . . 71.9 A simplified figure of the service part supply chain for Gripen C/D . . . . 8
2.1 Flowchart symbols used to visualize a process map (Brook 2017) . . . . . . 16
3.1 ERP connecting business units to a common database (Jacobs et al. 2018) 283.2 The role of Demand Management in MRP (Jacobs et al. 2018). . . . . . . 30
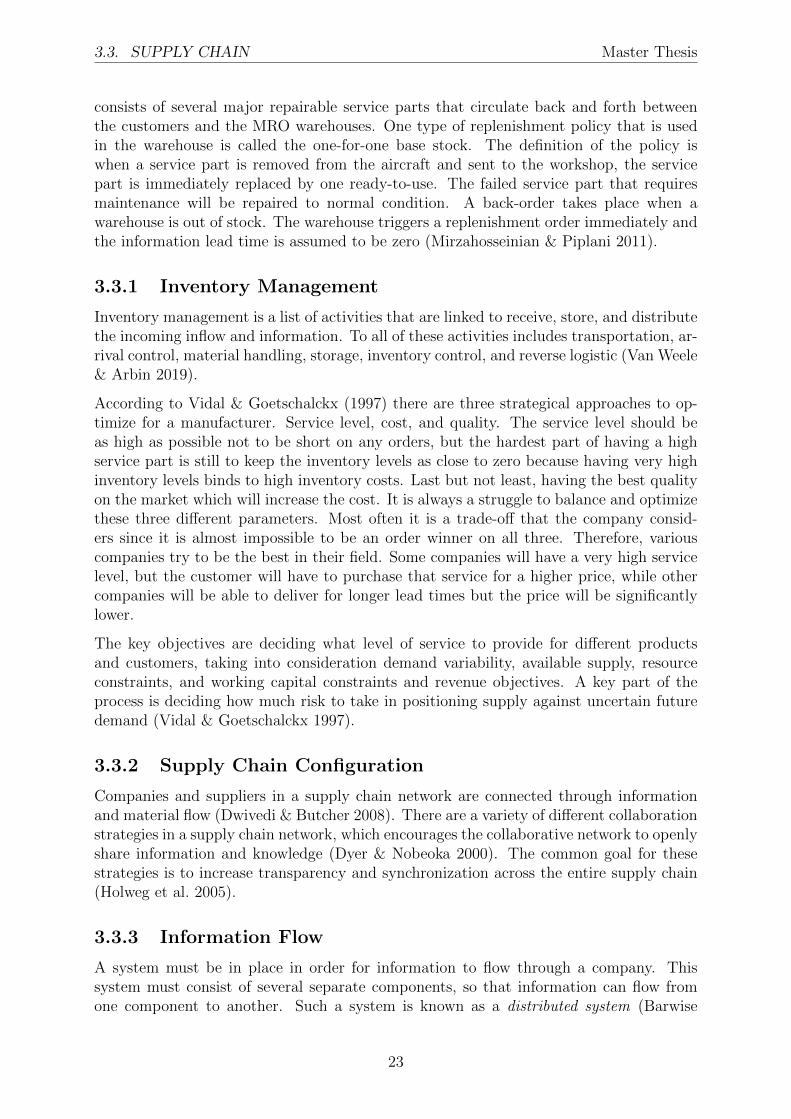
4.1 Number of Gripen C/D aircraft used by each customer (Saab Group 2020) 324.2 Gripen C/D service parts supply chain . . . . . . . . . . . . . . . . . . . . 334.3 MRO in detail . . . . . . . . . . . . . . . . . . . . . . . . . . . . . . . . . . 354.4 Information flow from customers to Saab . . . . . . . . . . . . . . . . . . . 364.5 Information flow to OEM . . . . . . . . . . . . . . . . . . . . . . . . . . . . 384.6 The three types of OEM . . . . . . . . . . . . . . . . . . . . . . . . . . . . 39
5.1 Service Part 1 . . . . . . . . . . . . . . . . . . . . . . . . . . . . . . . . . . 425.2 Volume Distribution . . . . . . . . . . . . . . . . . . . . . . . . . . . . . . 425.3 Penalty Fines Distribution . . . . . . . . . . . . . . . . . . . . . . . . . . . 425.4 Process map of Unplanned Maintenance . . . . . . . . . . . . . . . . . . . 435.5 Aggregated time line for internal stock-out (spare parts) . . . . . . . . . . 465.6 Aggregated time line for internal stock-out (sub-units) . . . . . . . . . . . 475.7 Aggregated time line for external delay at OEM . . . . . . . . . . . . . . . 495.8 Aggregated time line for internal faulty equipment . . . . . . . . . . . . . . 50
E.1 Service Part 1 . . . . . . . . . . . . . . . . . . . . . . . . . . . . . . . . . . VIE.2 Service Part 2 . . . . . . . . . . . . . . . . . . . . . . . . . . . . . . . . . . VIIIE.3 Service Part 3 . . . . . . . . . . . . . . . . . . . . . . . . . . . . . . . . . . XE.4 Service Part 4 . . . . . . . . . . . . . . . . . . . . . . . . . . . . . . . . . . XIIE.5 Service Part 5 . . . . . . . . . . . . . . . . . . . . . . . . . . . . . . . . . . XIVE.6 Service Part 6 . . . . . . . . . . . . . . . . . . . . . . . . . . . . . . . . . . XVE.7 Service Part 7 . . . . . . . . . . . . . . . . . . . . . . . . . . . . . . . . . . XVIE.8 Service Part 8 . . . . . . . . . . . . . . . . . . . . . . . . . . . . . . . . . . XVIII
v

LIST OF FIGURES Master Thesis
E.9 Service Part 9 . . . . . . . . . . . . . . . . . . . . . . . . . . . . . . . . . . XXE.10 Service Part 10 . . . . . . . . . . . . . . . . . . . . . . . . . . . . . . . . . XXIIE.11 Service Part 11 . . . . . . . . . . . . . . . . . . . . . . . . . . . . . . . . . XXIIIE.12 Service Part 12 . . . . . . . . . . . . . . . . . . . . . . . . . . . . . . . . . XXIVE.13 Service Part 13 . . . . . . . . . . . . . . . . . . . . . . . . . . . . . . . . . XXVIE.14 Service Part 14 . . . . . . . . . . . . . . . . . . . . . . . . . . . . . . . . . XXVIIIE.15 Service Part 15 . . . . . . . . . . . . . . . . . . . . . . . . . . . . . . . . . XXIXE.16 Service Part 16 . . . . . . . . . . . . . . . . . . . . . . . . . . . . . . . . . XXX
G.1 Aggregated timeline for internal stock-out (spare parts) . . . . . . . . . . . XXXIVG.2 Aggregated timeline for internal stock-out (sub-units) . . . . . . . . . . . . XXXVG.3 Aggregated timeline of external delay at OEM) . . . . . . . . . . . . . . . XXXVIG.4 Aggregated timeline of internal faulty equipment ) . . . . . . . . . . . . . . XXXVII
vi

Nomenclature
Acronyms
MRO Maintenance, Repair and Overhaul
OEM Original Equipment Manufacturer
BER Beyond Economical Repair
FIFO First-In-First-Out
RL Reverse Logistics
MPC Manufacturing Planning and Control
ERP Enterprise Resource Planning
MPS Master Production Scheduling
S&S Support and Services
PM Planned Maintenance
UPM Unplanned Maintenance
AOG Aircraft on Ground
LRU Line Replacement Unit
ICT Information and communication technology
HR Human Resources
Terms
Service Parts Defective components or parts that are replaced
Availability The degree to which a system is operable
Gripen C/D Denotation for the single seat Gripen C and two-seat Gripen D
vii

Chapter 1
Introduction
This chapter consists of a description of the underlying theoretical background as well asa description of the case company. This is followed by a problem description, the purposeof this master thesis and the research questions that will be answered.
Keywords: Maintenance, Repair, Overhaul, MRO, Service, Saab, Service Part, Sup-ply Chain, Data, Information, Utilization, Information Logistics, Information System,Strategy, Optimization, Traceability.
1.1 Theoretical Background
The globalization of markets has enabled improvements in transportation and commu-nication possibilities. Global companies are able to sell the same standardized productsand services all over the world (Levitt 1993). A globalized market enables global supplychains which provide companies with more options when it comes to suppliers. Globalsupply chains are a source of competitive advantage through access to benefits such asmore financing options, cheaper labor, and cheaper raw materials (Manuj & Mentzer2008). All manufacturing companies must choose what parts of their products to produceby themselves and what to buy from suppliers. The supplier might sell materials, compo-nents, sub-assemblies, or final assemblies to the manufacturing company. These strategicdecisions have a substantial impact on supply chains and are important for all moderncompanies (Hill & Hill 2009).
A conventional supply chain is illustrated in figure 1.1 where the flow of material isrepresented by the solid black arrows and the flow of information by the dashed arrowswith a data sheet. A supply chain consists of different tiers of practitioners. Mentzeret al. (2001) defines a supply chain as ”A set of three or more companies directly linkedby one or more of the upstream and downstream flows of products, services, finance,and information from a source to a customer.” This definition is shared by Carter et al.(2015), who defines a supply chain as ”... A network of firms where information, financialresources, and material flows”.
1

1.1. THEORETICAL BACKGROUND Master Thesis
Figure 1.1: Conventional Supply Chain (Mentzer et al. 2001)
A service part supply chain is a supply chain that handles the flow of information andmaterial when providing maintenance and repair of products already sold to customers.Muckstadt (2004) defines Service Parts as the replacements parts used to replace defectiveparts or components when equipment is repaired. In the aviation industry, componentsin need of maintenance are removed from the aircraft and immediately replaced witha functional one. The broken component is then sent to a Maintenance, Repair, andOverhaul (MRO) facility where it is repaired. A typical service parts supply chain isillustrated in figure 1.2 where the flow of material is represented by the solid black arrowsand the flow of information by the dashed arrows with a data sheet.
Figure 1.2: Service Parts Supply Chain (Muckstadt 2004)
A critical factor for manufacturing companies to succeed is to efficiently manage infor-mation about the customer’s demand, the companies internal production capabilities,and supplier’s ability to deliver goods and services. A common trend for manufacturingcompanies is to use information technology to establish interconnected supply chains thatutilize connectivity and coordination. By sharing information within the supply chain, thecompanies involved will be able to cooperate and improve forecasting and reduce uncer-tainties and delays in manufacturing operations (Benhabib 2003). Being able to collectdata, convert it to useful information, and distribute this information within a supplychain is crucial when aiming to improve the overall performance of a business organiza-tion. The efficient use of data regarding the current needs and capacities from all partsof the supply chain can help an organization reach a competitive advantage compared toits competitors (Ganesh et al. 2014).
2

1.2. COMPANY BACKGROUND Master Thesis
The theory of Ganesh et al. (2014) can be used in the context of a service parts supplychain where it is important that an MRO workshop can utilize information regardingincoming orders, supplier capabilities, and its current internal situation in order to syn-chronize its operations with the capacity of its suppliers and demand from its customers.This allows for better planning and shorter maintenance lead times as the ability of theMRO to act proactively to the physical arrival of components in need of maintenance willincrease significantly.
1.2 Company Background
Saab was founded in 1937 in Linkoping, Sweden, and is currently a developer and manufac-turer of highly technological products and services in the aerospace and defense industry.As of 2018, 17 096 people were employed by Saab, and Saab had a turnover of 33 billionSEK. Saab’s products are sold in over 100 countries and the company operates in 35 coun-tries. Research and development is concentrated in Sweden, where more than 14000 ofSaab’s employees live and work. The majority of Saab’s employees are located in Europe,South Africa, the U.S, Australia, and Brazil (SAAB 2018). Saab’s biggest competitorsare:
• Lockheed Martin
• Boeing Defence
• Dassault Aviation
• Eurofighter Fighter aircraft GmbH
A map showing the countries where Saab operates is shown in figure 1.3.
Figure 1.3: Countries where Saab operates (SAAB 2018)
3
1.2. COMPANY BACKGROUND Master Thesis
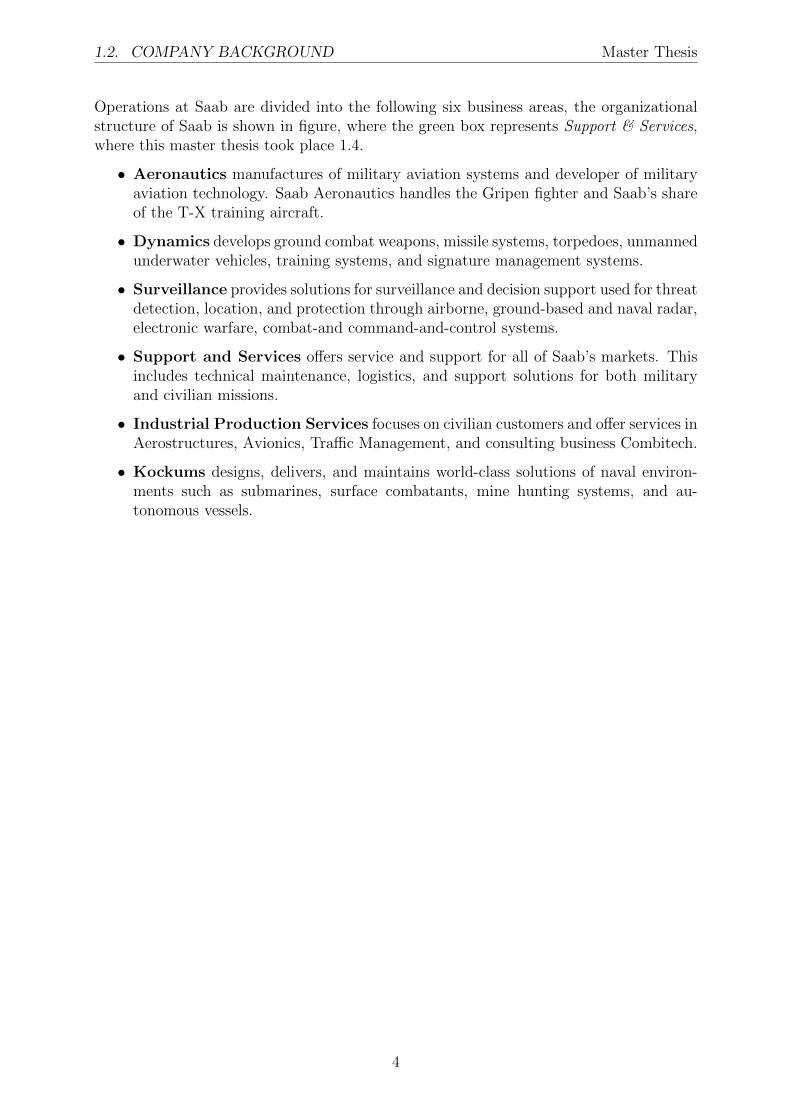
Operations at Saab are divided into the following six business areas, the organizationalstructure of Saab is shown in figure, where the green box represents Support & Services,where this master thesis took place 1.4.
• Aeronautics manufactures of military aviation systems and developer of militaryaviation technology. Saab Aeronautics handles the Gripen fighter and Saab’s shareof the T-X training aircraft.
• Dynamics develops ground combat weapons, missile systems, torpedoes, unmannedunderwater vehicles, training systems, and signature management systems.
• Surveillance provides solutions for surveillance and decision support used for threatdetection, location, and protection through airborne, ground-based and naval radar,electronic warfare, combat-and command-and-control systems.
• Support and Services offers service and support for all of Saab’s markets. Thisincludes technical maintenance, logistics, and support solutions for both militaryand civilian missions.
• Industrial Production Services focuses on civilian customers and offer services inAerostructures, Avionics, Traffic Management, and consulting business Combitech.
• Kockums designs, delivers, and maintains world-class solutions of naval environ-ments such as submarines, surface combatants, mine hunting systems, and au-tonomous vessels.
4

1.2. COMPANY BACKGROUND Master Thesis
CEO
Group Functions
Finance
Strategy
Human Resources
Legal Affairs
Communication
Government Affairs, Procurement, Quality and
Environment, ICT
Market Area
Nordic & Baltic
Europe
North America
Latin America
Asia Pacific
Middle East & Africa
Business Area
Aeronautics
Dynamics
Industrial Products and Services
Kockums
Support and Services
Surveillance
Figure 1.4: Organizational structure of Saab (SAAB 2018)
1.2.1 Gripen Support
This master thesis conducted a case study of Gripen Support which is a part of Saab Sup-port & Services in Linkoping, Sweden. In 2018 Gripen Support employed a total numberof 493 people distributed over 21 sites around Sweden, the majority of which are locatedin Linkoping. Saab Support & Services provides Saab’s customers with maintenance andsupport of their aircraft that are currently in use. Support & Services also provide newcustomers with suggestions for maintenance and logistical solutions. The organizationalstructure of Saab Support & Services is shown in figure 1.5.
5

1.3. GRIPEN C/D Master Thesis
Figure 1.5: Organizational structure of Saab Support and Services (SAAB 2018)
1.3 Gripen C/D
In 1979, the Swedish government began a study calling for a versatile platform capableof JAS - Jakt, Attack, Spaning, which is Swedish for air-to-air, air-to-surface, and re-connaissance missions, that could fulfill multiple roles during the same mission. A newphase of studies for a Swedish solution to the multi-role aircraft requirement began atSaab in March 1979. In 1988, the first prototype of the Gripen 39A made its 51-minutemaiden flight. 39 Gripen A was the first aircraft of a new generation of multi-purposeaircraft. Since that day both development and production have occurred in parallel withthe delivery of aircraft to Saabs customers.
The model currently in use is Gripen C/D. Gripen C is the single-seat version of theaircraft and Gripen D is the two-seat version of the aircraft. Both Gripen C and GripenD retains full operational capability, and Gripen D can be used for both pilot trainingand combat missions. These two different versions are shown in figure 1.6 and figure 1.7.The figures were collected from Saab Group (2020).
In addition to developing and manufacturing the next generation of fighter aircraft, Saabensures the availability of their aircraft by offering maintenance and repair services ofmore than 600 service parts used in Gripen C/D to their customers. A comprehensivesupply chain for service parts is provided by Saab Support & Services to ensure Saab’scustomers that they have a steady flow of functional spare parts.
Figure 1.6: Gripen C Figure 1.7: Gripen D
1.3.1 Aircraft Maintenance
When a customer purchases Gripen C/D, they do not simply buy the aircraft, but thefunctionality of the Gripen System. This means that Saab is responsible for the mainte-nance, repair, and upgrades of the Gripen aircraft. These service contracts are made for
6

1.3. GRIPEN C/D Master Thesis
several years at a time and usually lasts for the entire lifetime of a Gripen aircraft, whichcan be up to several decades1. This means that Saab will be a part of the aircraft duringits entire life cycle. The amount of maintenance needed on a Gripen aircraft changes overtime. The aircraft needs more maintenance in the early stages of its life cycle due to ’In-fant Mortality ’ failures. The need for maintenance of the aircraft reaches its lowest pointduring the middle of its life cycle but increases again at the end of the life cycle whenthe aircraft starts getting old and the failures are caused by wear1. This phenomenon isknown as the Bathtub Curve (Wilkins 2002), and is shown in figure 1.8.
Figure 1.8: The bathtub curve (Wilkins 2002)
Figure 1.9 illustrates the service parts supply chain at Saab Support and Services. Thisservice part supply chain starts from the operating customer, the process of repairing acomponent is initialized when the component that Saab is responsible for maintainingis removed from the aircraft. There are two reasons for removing a component from anaircraft; planned maintenance, and unplanned maintenance2. The green MRO representsthe workshops that are operated by Saab. There are three different types of OEM suppli-ers that support the MRO workshops, and these are illustrated as three different nodes infigure ??. One type supports the MRO by doing all maintenance for certain components.For these components, the MRO can be seen as a middleman that sends the service partto the right OEM. The second type supports the MRO by doing parts of the maintenance,in this type, the MRO is responsible for maintaining part of the components and sendingthe other part to the correct OEM. The third type of OEM supports the MRO by pro-ducing and delivering disposable replacement parts, while the MRO performs all of themaintenance. It is important to note that there are several hundred different suppliersin each category of OEM. The lines between the different entities in figure 1.9 illustrates
1Martin Larsson, Logistics Analytics, Support & Services, 2020-01-202Martin Brantemo & Marcus Karlsson, Flight Monitoring, Support & Services, 2020-02-10
7

1.4. PROBLEM DESCRIPTION Master Thesis
the information flow between the different components in the supply chain. The directionof the arrows represents the flow of physical material and information flow within thesystem.
Figure 1.9: A simplified figure of the service part supply chain for Gripen C/D
Planned maintenance is performed according to certain criteria specified by the manu-facturer. There are three different kinds of criteria; Calendar Time, Flight Hours, andCycles. Calendar time is the number of days that have passed since the service part wasmanufactured, regardless of how the aircraft is used. This is for example used for compo-nents made of rubber or the gunpowder used in the ejection seat. The number of flighthours is used for components that only experience wear when the aircraft is used, forexample, hydraulic cylinders. Cycles are used for components that take wear accordingto how many times they are used, regardless of the number of flight hours, such as thelanding gear.
Unplanned maintenance is needed whenever something unexpected happens, such as whena component malfunctions or breaks. The only type of planning that Saab does forunplanned maintenance is using historical data. The historical data is used to predicthow many service parts will arrive at the workshops in the future. Despite this type ofplanning approach, service parts in need of unplanned maintenance are often delayed. Asthe aircraft gets older, so do the service parts, which causes them to break down morefrequently. This causes a higher flow of service parts than expected, which leads to longdelays and puts pressure on the MRO workshops.
1.4 Problem Description
When Saab sells Gripen aircraft to a customer, the deal usually includes maintenance ofcertain service parts used in the aircraft. When a service part needs maintenance, it is
8

1.5. PURPOSE Master Thesis
removed from the aircraft and sent to Saab for maintenance. The faulty service part isimmediately replaced with a functional one by the customer to ensure that the aircraftcan be used. The customer has a limited number of spare parts stored at their airbases.To ensure a certain level of availability of the aircraft, and that the customer never runsout of service parts, each service part has a specified maintenance lead time. Saab isresponsible for completing the maintenance of each service part within this specified leadtime. In cases where the maintenance is delayed, Saab has to pay a penalty fine to thecustomer to compensate for the delay.
There are two types of maintenance, planned and unplanned. Planned maintenance isdone according to pre-determined conditions and is expected. Unplanned maintenance isdone when a service part malfunctions or breaks unexpectedly without warning. Saab iscurrently experiencing difficulties in completing unplanned maintenance on time as theyare unable to accurately predict future demand for unplanned maintenance. The MROworkshops need different resources depending on the type of service part and why theservice part needs maintenance. As this is currently unknown to the MRO workshopbefore the service part has physically arrived and been inspected, planning how to usethe resources available to the MRO workshops becomes difficult. As a result of thisuncertainty, many service parts in need of unplanned maintenance are delayed whichleads to heavy penalty fines for Saab.
This problem is important to solve as the delays impose large and unnecessary costs toSaab which are expected to increase in the future due to the effects of the bathtub curveif nothing is done to improve the situation3.
1.5 Purpose
The purpose of this master thesis is to identify and analyze the cause of delays for un-planned maintenance of service parts in an MRO workshop, and to recommend improve-ments that can reduce these delays. This is important for Saab as these delays currentlycause penalty fines.
1.5.1 Research Questions
1. What service parts have an impact on the penalty fines at Saab and how late arethey?
2. Why are these service parts delayed?
3. How can information be utilized by an MRO workshop to synchronize all parts ofits service parts supply chain and reduce delays of unplanned maintenance?
1.6 Delimitations
The case study was conducted at a single company, Saab in Linkoping. The study con-sidered one part of the service parts supply chain of Gripen C/D, namely the MROworkshops. Although it would have been possible to study the entire service parts supplychain, this study focused on the MRO workshops since this is the part of the service parts
3Martin Larsson, Logistics Analytics, Support & Services, 2020-01-20
9

1.7. THE STRUCTURE OF THE REPORT Master Thesis
supply chain that Saab operates and can influence. As such, the study considered allflow of data, information, and material to the MRO workshops from the rest of the ser-vice parts supply chain as given variables. The study only collected data to be analyzedregarding the service parts that induced penalty fines in 2019.
1.7 The structure of the report
The following section provides a brief introduction to each chapter of this report and alsothe structure of this report.
1. Chapter 1 - Introduction This chapter gives an introduction to the theoreticalbackground, the company background, the problem description, the purpose of thisstudy together with the research questions. The delimitations that have been madetogether with the structure of this report is also described in this chapter.
2. Chapter 2 - Method This chapter describes the research approach, the datacollection methods, information about the literature review, the analysis method,the execution plan, and the validity and reliability of this master thesis.
3. Chapter 3 - Frame of Reference In this chapter the theory that is relevant tothis master thesis is described. The theory is later used as support for the analysis,and as a foundation for the conclusion and discussions in the later chapters.
4. Chapter 4 - Current State The current state of the service parts supply chainused by Saab is described in this chapter.
5. Chapter 5 - Analysis In this chapter the analysis based on the frame of referenceof collected data is presented.
6. Chapter 6 - Conclusion This chapter presents the answers to the research ques-tions, as well as the conclusions. Finally, the recommendations the authors have forthe case company are presented. In addition to this, the potential outcomes of thegiven recommendations as well as the generalization of this study are discussed.
10

Chapter 2
Methods and Methodology
This chapter presents how the study has been conducted. The chapter includes detailedinformation about the research approach and the type of strategy used, how the data hasbeen collected and how the method was used during the analysis.
2.1 Research Approach
A descriptive research approach aims to understand the relevance of a certain problemand to describe what caused the problem. A descriptive approach is conducted to give abetter understanding of a problem and clarify the purpose of the study, collect and analyzeempirical data to obtain deeper knowledge, and provide a solution to the problem. Fordescriptive research, the study starts with a general idea of the cause of the problem anduses this in the research as a topic to identify issues that can be the focus for futureresearch (Forza 2002). This master thesis used a descriptive research approach becausethe study started by understanding the service part supply chain for Gripen C/D at Saaband identified the problems. Empirical data were then collected for analysis. This researchapproach was used during this master thesis to understand the problem and to describehow to implement suggestions in order to eliminate or reduce the effects of the identifiedproblems.
A quantitative study analyzes numerical data while a qualitative study analyzes non-numerical data (Karlsson 2009). The results are often more precise in a quantitativestudy than in a qualitative study, as a quantitative study uses large amounts of numericaldata. This can allow the researcher to generalize the observations made. The conclusionsbased on numerical data are often more precise because the data is taken from a realproblem, unlike qualitative data, which is often based on theory and existing studies.(Bryman & Bell 2003). However, John & Creswell (2000) claims that the quantitativeand qualitative research are two differences on a continuum rather than complete oppositesof each other and that the two approaches share several common elements. This leadsto the conclusion that a study is never purely qualitative or quantitative. During thismaster thesis, both qualitative and quantitative data were collected which is preferablefor a descriptive research approach. The qualitative data was collected from interviewsand observations and quantitative data was collected from historical records. As a result,the research approach used was a combination of qualitative and quantitative research.Bryman & Bell (2003) states that a quantitative study uses a deductive research approach
11

2.2. DATA COLLECTION Master Thesis
and a qualitative study uses an inductive research approach. John & Creswell (2000)states that deductive research is used when the researcher begins with a theory andthen collects data to add to, or contradict, the theory. In contrast, inductive researchbegins with a broad base of data that can be used to generate a general theory. Thismaster thesis used a combination of quantitative and qualitative data. Consequently,a combination of inductive and deductive research approach was used. Deduction wasused when quantitative data was analyzed to find patterns. Induction was used whenqualitative data from interviews and observations were analyzed to formulate generalsolutions and recommendations.
According to Yin (2003), a case study should be used to describe a situation, generateimprovements based on the empirical data, and implement these in the real world. Duringthis master thesis, a case study was conducted at Saab to study the service part supplychain for Gripen C/D, and implement the theoretical findings in a real supply chain.A case study can include both single or multiple case companies with different levels ofanalysis (Yin et al. 1984). This study only considered one company. This decision wasmade based on the limited amount of time available and because of the unique nature ofthe supply chain at Saab makes it hard to compare it to another case. According to Voss(2010) the fewer the case studies, the greater the opportunity for depth of observations.By conducting a case study the focus is to understand the dynamics of the problem toget more information (Eisenhardt 1989). An investigation is needed to receive a deeperknowledge of the problem, this is normally carried out through one or more studies withinthe topic to generate a list of research questions (Voss 2010).
The shift of focus can occur several times during a thesis which contributes to the succes-sive configuration of the thesis’s theoretical frame of reference (Melin 2002). Empiricaldata were collected in parallel with a literature study to ensure that relevant theorywas selected. This master thesis contributed to research through the formulation andrecommendations of how to reduce delays of unplanned maintenance in an MRO work-shop.
2.2 Data Collection
The use of appropriate methods to collect data is crucial in the initial stage of a researchprocess. The outcome of the study is dependent on the choice of methods and how theseare connected to the research question, as well as the consideration of time available toapply these methods. A case study is normally based on a combination of different datacollection methods, such as surveys, studying archival records, interviews, focus groups,and observations, these methods can include both primary and secondary data. Primarydata is collected by the researchers from first-hand sources such as interviews and surveysand is also called raw data. Secondary data is existing data that is available from thelibrary, internet, or the case companies database (Eisenhardt 1989). In the followingsubsections, the different data collection methods that were used during the case studyconducted in this master thesis will be described in detail:
2.2.1 Interviews
The interviews conducted during the planning phase of this master thesis were semi-structured and the aim was to create an understanding of the current problem. A list
12

2.3. LITERATURE REVIEW Master Thesis
of the people interviewed during the current state mapping phase of the study is shownin appendix C. According to Gordon & Fleisher (2010) the definition of an interview,is a conversation between two or more people, to gather information. Data collectionthrough interviews allows the collection of primary data required for the research. Dur-ing an interview, the process must be non-leading, meaning that the person asking thequestions should have an objective determination and should not have any inputs to theanswers. The interviewer is there to collect useful data. In a structured or semi-structuredinterview, the interviewer is using a structured question format. According to Gordon &Fleisher (2010), the questionnaire should take approximately 30-60 minutes. A structuredinterview has all of the questions pre-made and the same set of questions are asked toeach and every interviewee. A semi-structured interview also has pre-defined questionsbut allows for follow-up questions and discussions. A non-structured interview consistsof a discussion where questions arise as the discussion progresses and can be called quali-tative interviewing (Merriam 1998). A list of the people interviewed during the planningphase of the study is shown in appendix B. The interviews conducted during the currentstate mapping were a combination of structured and semi-structured and the aim was tomap the current state of a specific MRO workshop in the service supply chain.
2.2.2 Historical/Archival Methods
According to Axinn & Pearce (2006), searching for published studies can sometimes beunstructured. When using documents or other secondary sources, the researcher mustinvolve a personal opinion if the content may be valid for the study. A disadvantagefor historical data is that the researcher can not decide either a level of structure of thedocuments or a possibility for later interviewing the person responsible for the historicaldocument (Axinn & Pearce 2006). In this study, historical data was gathered from thecompany’s database. This was done in order to understand which service parts that thecase study should focus on.
2.3 Literature Review
A literature review was conducted with the purpose of finding relevant sources of informa-tion. UniSearch, Diva, and Google Scholar were used in order to find trustworthy sources.The key-words that were used during the search are shown in Appendix A
The literature was primarily be used in the theoretical background, the method, and theframe of references. The theory collected was then be used further on in analysis to drawconclusions.
2.4 Analysis
What type of analysis method that is suitable for a study depends on the characteristics ofthe collected data and how that data is structured. The first thing that needs to be done isto structure the collected data. This can be done according to a pre-structured schedule, orit can be defined iteratively as the data is received. When analyzing qualitative data thereare no strict rules that have to be followed. The methods that exist are guidelines ratherthan rules to help to find patterns and structuring the data (Saunders et al. 2007). Thefollowing section describes two different analysis methods. The first one describes the time
13

2.4. ANALYSIS Master Thesis
each event a product goes through, from the beginning until it reaches the customer. Thesecond method describes how to categorize the products into three different groups.
2.4.1 Empirical data analysis
The empirical analysis was based on the interviews and the data collected at the casecompany. The idea was to find patterns in the interviews and historical data. Theempirical analysis resulted in the current state chapter which gives an overview of whatis happening at the company and find problems to solve.
2.4.2 ABC analysis
ABC analysis is a method where all the products a company deals with are classified intothree different categories. The purpose of an ABC analysis is to determine how to allocatethe resources available to the company efficiently. The products can be sorted accordingto different attributes such as value or demand. The products can then be monitored andmanaged according to their ABC classification. The most important products are includedin the A-category which should be thoroughly monitored on an individual level. The A-category usually contains 20% of all products. B-class products are not as important asthe ones in the A-category but should still be monitored, only on a less detailed level.The B-class items usually constitute about 30% of all products and are of medium valueand are subject to medium demand. The final category is the C-category which consistsof the last 50% of all products. These products are usually expensive but in low demandwhich means that there is no need to keep any in storage or monitor them very frequently.(Flores & Whybark 1986)
According to Sanders et al. (2013), an ABC analysis can be conducted by going throughthese following steps:
• Determine annual usage or sales for each item.
• Determine the percentage of the total usage or sales by item
• Rank the items from highest to lowest percentage
• Classify the items into groups
As the ABC-analysis conducted in this master thesis was based on each service part’scontribution to total penalty fines, the framework presented by Sanders et al. (2013) wasused, but adapted slightly to suit better in the context of a service parts supply chain.Instead of usage or sales, the items were sorted according to their contribution to penaltyfines paid in 2019.
2.4.3 Lead time analysis
According to Oskarsson et al. (2013), a lead-time analysis involves analyzing informationor material flow in a structured way with the aim of reducing the total time in the flow.To carry out a lead time analysis, a map of the flow of material and information isneeded.
A lead-time analysis can be used to identify flaws and find alternative solutions to thecurrent situation. Which alternative solutions are appropriate is largely situational, but
14

2.4. ANALYSIS Master Thesis
there are two ways to find good alternatives. One is to base on the general principlesfound in the literature, the other is to base on practical knowledge. Such knowledge canbe found from people in the organization who have ideas on what can be done differently,but it can also be found in other companies. Finding good alternative solutions is one ofthe major difficulties with lead-time analyzes (Oskarsson et al. 2013).
One of the most common methods in lead-time analysis is when the total time in a processsequence is divided into value-adding and non-value-adding time. Value-adding time isthe time when some form of activity is performed assembly or processed. The remainingtime, the non-value adding time is when products are waiting in front of a machine orlaying in a warehouse. It is mainly the non-value adding time that is interesting to reduce.The passive time adds no value to the product and it is almost always longer than theactive one (Oskarsson et al. 2013).
Oskarsson et al. (2013) claims that it is not possible to give clear answers to what shouldbe done to reduce lead times as that depends so much on the specific situation. Instead,they mention the eight principle measures that describe how to work with time reductionin a structured way. The steps described below can be used in any flow or process.
Storhagen (2003) writes that lead time analysis seeks clarity in what the time is used for,and how efficiently it is used. The workflow of a lead-time analysis can be summarized inthe following points:
1. Define and determine the total lead time
2. Include both material and information flows
3. Identify all activities that consume time
4. Identify value-added time
5. Identify non-value-added time
6. Question all the time that has no customer value
7. Analyze and propose new solutions
8. Follow up
2.4.4 Process Mapping
Brook (2017) defines process mapping as a way to visually represent how a process actuallyworks, and that it can be used as a foundation for further analysis of the process. Processmapping is a graphic illustration of a process which can be used to identify, document,analyze, and develop a process. It visualizes work processes including activities, theconnections between them, and inputs and outputs. A process map can be visualized bya flow chart. Brook (2017) suggests using the most common flowchart symbols which areillustrated in figure 2.1
15

2.4. ANALYSIS Master Thesis
Figure 2.1: Flowchart symbols used to visualize a process map (Brook 2017)
Jacka & Keller (2009) has stated the steps to conduct a process mapping. These stepsare:
• Process Identification: The process should be identified and the boundaries ofthe scope should be made clear.
• Information Gathering: Information should be gathered from all process activi-ties to get a better understanding of the whole process.
• Interviewing and Map Generation: Interviews conducted from this step shouldcome from those who perform each task in the process.
• Map Analysis and Presentation: Analysing the process map should be contin-uously done during the whole mapping, but when the process has been identifiedand all information has been gathered, all the pieces can be tied together to makea final process map.
Brook (2017) highlights the usefulness of process mapping when dealing with complexsystems as it can be used to bring clarity and find what parts of the process can beimproved and how. Process mapping can bring information about which steps of theprocess add value to the customer and which do not when decisions are made whatinformation the decisions are based on. Process mapping can also be used to find reworkloops in a process and identify redundant or repeated process steps (Brook 2017).
16
2.5. EXECUTION PLAN Master Thesis
2.4.5 Root cause analysis
The 5-Why Method
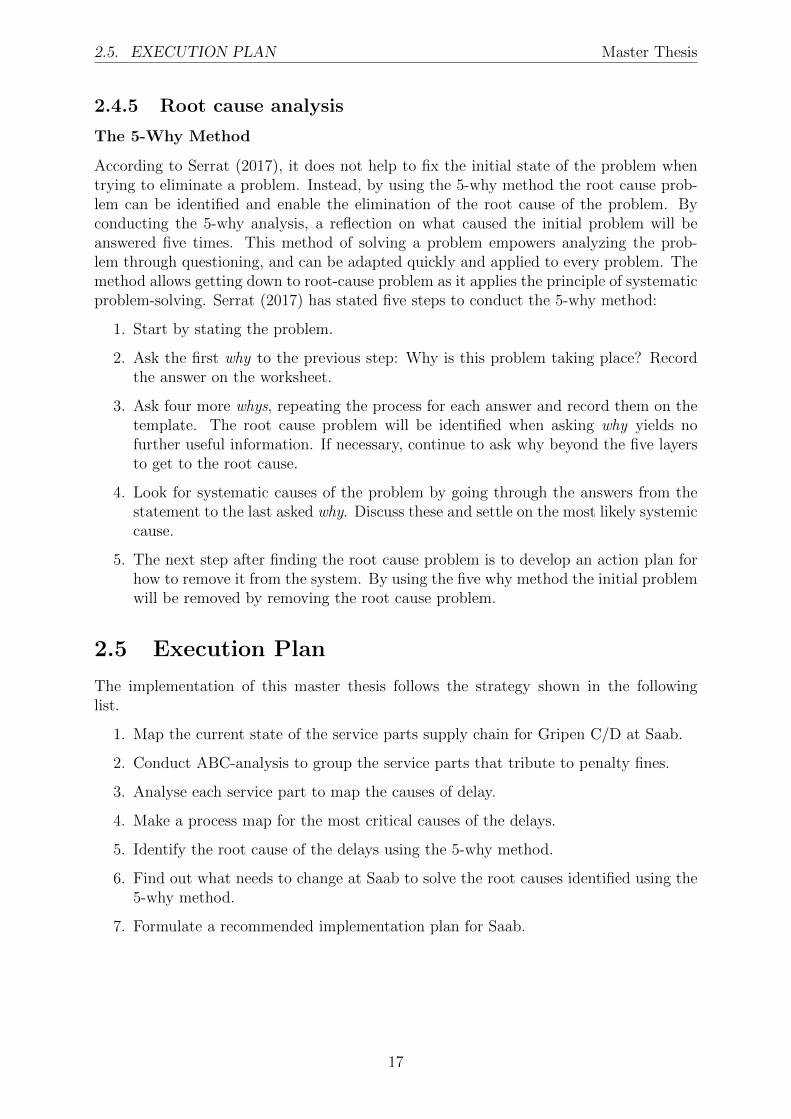
According to Serrat (2017), it does not help to fix the initial state of the problem whentrying to eliminate a problem. Instead, by using the 5-why method the root cause prob-lem can be identified and enable the elimination of the root cause of the problem. Byconducting the 5-why analysis, a reflection on what caused the initial problem will beanswered five times. This method of solving a problem empowers analyzing the prob-lem through questioning, and can be adapted quickly and applied to every problem. Themethod allows getting down to root-cause problem as it applies the principle of systematicproblem-solving. Serrat (2017) has stated five steps to conduct the 5-why method:
1. Start by stating the problem.
2. Ask the first why to the previous step: Why is this problem taking place? Recordthe answer on the worksheet.
3. Ask four more whys, repeating the process for each answer and record them on thetemplate. The root cause problem will be identified when asking why yields nofurther useful information. If necessary, continue to ask why beyond the five layersto get to the root cause.
4. Look for systematic causes of the problem by going through the answers from thestatement to the last asked why. Discuss these and settle on the most likely systemiccause.
5. The next step after finding the root cause problem is to develop an action plan forhow to remove it from the system. By using the five why method the initial problemwill be removed by removing the root cause problem.
2.5 Execution Plan
The implementation of this master thesis follows the strategy shown in the followinglist.
1. Map the current state of the service parts supply chain for Gripen C/D at Saab.
2. Conduct ABC-analysis to group the service parts that tribute to penalty fines.
3. Analyse each service part to map the causes of delay.
4. Make a process map for the most critical causes of the delays.
5. Identify the root cause of the delays using the 5-why method.
6. Find out what needs to change at Saab to solve the root causes identified using the5-why method.
7. Formulate a recommended implementation plan for Saab.
17

2.6. VALIDITY AND RELIABILITY Master Thesis
2.6 Validity and Reliability
There are two terms related to strengthening the quality and credibility of this study,which are reliability and validity. The purpose is to minimize the risk of misleadingresults. This risk can never be completely eliminated, but knowledge of the risk andprecautions regarding reliability and validity reduces this risk.
2.6.1 Reliability
Reliability is the term to which the results of this study can be repeated. The use ofinterviews where the same questions are asked with the same results ensures a higher levelof reliability. That was why the Two question-survey was used during every interview toensure that this study would focus on the biggest problem. The researchers’ subjectivitycan never be eliminated but can be reduced by having open and non-leading questions.There is a risk that the people interviewed might be incorrectly quoted. To reduce thisrisk, all information collected should be checked again with the interviewed person andcompared with hard facts (Patel & Davidson 2003).
2.6.2 Validity
Validity can be divided into two general terms, internal and external validity. Internalvalidity focuses on checking that there is no support for other factors being responsiblefor the variation. External validity describes the extent to which the study’s results applyto other studies (Patel & Davidson 2003).
To check and ensure the validity of the study, a continuous dialogue has been conductedwith supervisors at the case company as well as Linkoping university. Since the study wasconducted only on one case company and their specific environment, there may be somelimitations on external validity. In order to validate that the collected data where correct,an email was sent after each interview to the person to ensure that all information hadbeen written down correctly.
18

Chapter 3
Frame of References
This chapter contains the theoretical framework used to analyze the findings of the casestudy and answer the research questions. The theory are then used as a base for analyzethe current situation at the case study company. Furthermore, the theory will act as adecision base for conclusion and discussion.
3.1 Service Parts
The replacement of defective components is often needed in order to repair a piece ofbroken equipment. Components used to repair broken equipment are known as serviceparts. Service parts are an essential part of all aspects of modern society, from the personallives of individuals to the commercial and military industry. Domestic appliances, cars,power-plants, and aircraft are examples of common objects that society relies on. Theseobjects rely on the constant availability of services parts in order to function properly.The term service parts encompass a vast array of different types of products, from cheapreplaceable parts such as air filters too expensive parts such as jet engines (Muckstadt2004).
The availability of the service parts secures the utilization of the aircraft by providingspare units to the critical functions of the aircraft. An aircraft is designed so that themost critical parts can easily be removed if required maintenance. The critical partscan then be sent to a workshop for maintenance. These easily replaceable modules ofthe aircraft are called Line Replaceable Units (LRU). Every time a failed service part isremoved from an aircraft, the same one has to be installed before the next flight. Thefailed service part triggers a demand from the spares supply. A failed service part can takeweeks to repair and flight delays are expensive, the airbase manages this by having spareparts in stock and repair the failed units. The availability service, part of the aircraftMRO services, is responsible for providing a supply of those spare units as economicallyas possible (Mirzahosseinian & Piplani 2011).
3.2 Maintenance, Repair, and Overhaul
Maintenance, repair, and overhaul (MRO) is the term used to describe all activities in-volved in restoring broken systems, machines, or pieces of equipment to an operable state.
19

3.2. MAINTENANCE, REPAIR, AND OVERHAUL Master Thesis
These activities are done as a result of planned or unplanned maintenance and usuallyinvolve the disassembly and reassembly of the unit in need of maintenance, the use ofservice parts as well as functional testing of the unit to ensure that the maintenance hasreturned the unit to the desired performance level. The MRO industry faces differentchallenges than the traditional manufacturing industry does. As much of the mainte-nance done is unplanned, meaning the need arises virtually without any warning, theMRO industry needs to deal with large demand variability, unreliable supplier responsetimes, unpredictable and complex flows of material and customer demand, and limitedtechnical data about the units that need maintenance. Some of these challenges exist inregular manufacturing as well, but not to the same extent. For this reason, managing anMRO process is seen as one of the most complex tasks in modern industry. (Srinivasanet al. 2014)
MRO operations rely on machinery and equipment to test and maintain service parts.According to Epperly et al. (1997), operating equipment until failure can result in heavyfinancial losses in the form of damaged goods and lost production time as well as humanlosses as operators are at risk of injury. Being able to predict when a piece of equipmentis going to break down allows for preemptive actions to restore the equipment to a safestate before the breakdown occurs. Epperly et al. (1997) states that when using equip-ment where the condition of the equipment can be indicated by heat patterns, infraredthermography can be used to measure relative heat differences on the surface of the ob-ject. Kohli (2017) highlights the importance of preventing malfunctions and breakdownswhen possible, and that in situations where big data sets are available, machine learningalgorithms can be used to predict equipment failures.
3.2.1 Planned and Unplanned Maintenance
The two main types of maintenance used in industry are planned maintenance and un-planned maintenance. Planned maintenance is scheduled at fixed intervals of a certainnumber of days, months, quarters, seasons, years, or some other predetermined interval.The intervals are based on how much the service part in question has been used. The twomain elements of planned maintenance are discipline and procedure. Discipline refers tothe firms’ ability to correctly perform all necessary activities in the correct order. Theprocedure means that the tasks are done correctly. Both of these activities are impor-tant and require accurate planning to create an efficient system for planned maintenance(Mobley 2004). The bathtub curve, which is illustrated in figure 1.8 indicates that a newmachine has a high probability of failure because of installation problems during the firstfew weeks of operation. After this initial period, the probability of failure is relatively lowfor an extended period. After this normal machine life period, the probability of failureincreases sharply with elapsed time. In preventive maintenance management, machinerepairs or rebuilds are scheduled based on what the manufacturer states for each product(Wilkins 2002).
Unplanned maintenance is any maintenance that is needed unexpectedly. Unplannedmaintenance is commonly the result of equipment failure that was not expected (Mobley2002). When an unplanned event happens, the defective part is replaced with a new one.It is tough to estimate the unplanned maintenance, compared to the planned maintenance.This is because of the complex variety of forecasting when unplanned maintenance willoccur (Tracht et al. 2013).
20

3.2. MAINTENANCE, REPAIR, AND OVERHAUL Master Thesis
The ratio of stock-outs with the total number of demand is defined as the service level.The amount of service part in stock is normally depending on the service level plannedto achieve. A service level of 100 % for a part is only achieved by a very high amountof material in safety stock which leads to high holding costs in the warehouse. But onthe other hand, customer satisfaction is reduced with a low service level (Tracht et al.2013).
The challenge of keeping a high service level is to have the right service parts at the righttime. This can be predicted when the service part requires service. It is possible to predictwhen a service part is being removed for the planned maintenance. According to Kilpiet al. (2009), the service part supply chain can be considered as a closed-loop system.Meissner et al. (2002) states that incomplete information has to be detected or, the userhas to be notified about the failure. There are often thousands of parts in the system ofan MRO supply chain with each service part having a unique feature and modification.The challenge is to have a proper and structured categorizing of these parts. Inaccurateor incomplete information of the service part can lead to an increased chance of stock-outsor an increase in inventory due to duplication (Khandelwal 2011).
3.2.2 Service Contracts
Morris & Fuller (1989) states that industrial services can be distinguished from industrialproducts in several significant ways.
• Services are intangible
• Services are consumed at the time of purchase and can not be stored in inventory.
• Services must be customized to suit individual users.
• Services tend to be consumed in irregular patterns.
The purchasing of services is often integrated into the whole company. Buying services isoften handled without any participation from the purchasing specialist. Tonks & Flanagan(1994) states that the purchasing of service is a large expense, because of a major part ofthese costs are maintenance costs.
3.2.3 Lead time
Lead time is the total time that elapses from the time when an order has been madeto the time when the ordered material arrives at the recipient (Storhagen 2003). Leadtime is now a common concept in many companies and there are several reasons whya company measures lead times. Short lead times lead to faster deliveries and is oftenseen as a competitive advantage in the hope of winning an order (Storhagen 2003). Leadtime is a term that is given different meanings in different contexts. Olhager & Wikner(2000) defines it ”Lead time refers to the time that elapses from the need for an activity orgroup of activities to arise until one has knowledge that the activity or activities have beenperformed”. There are several different types of lead time, product development lead time,and delivery lead time. Product development lead time is the time from the discovery ofthe need for a new product until the product is launched in production mode. Deliverylead time is the time from order to delivery of the order (Olhager & Wikner 2000).
21

3.3. SUPPLY CHAIN Master Thesis
3.2.4 Big Data Analytics and Predictive Maintenance
According to Russom et al. (2011) big data analytics is a method to perform advancedanalytical techniques on big data sets, and has three major attributes known as the threeVs;
• Volume, because of the sheer amount of data.
• Variety, because the data can be organized in structured sets, semi-structured sets,unstructured sets, or any combination of the three.
• Velocity, because of the speed of the data as it can be collected in real-time.
Ashton et al. (2009) defines the Internet of Things as a system where computers are ableto collect data without human interaction. According to Xia et al. (2012), the Internet ofThings is a network of interconnected objects with the ability to communicate with otherobjects and human beings.
Big data analytics is an important method of uncovering hidden patterns in big datasets. These patterns can bring valuable knowledge and useful information to managersand help them make information-based decisions by capturing and utilizing data usingsensors, the Internet of Things, and big data analytics in all stages of the product lifecycle (Ren et al. 2019).
Zhang et al. (2017) states that big data analytics can be used in combination with theInternet of Things to uncover hidden trends in large amounts of data collected from anitem when it is used. If this data can successfully be collected and analyzed, customer sat-isfaction can be increased by allowing for predictive maintenance services. By combininghistorical maintenance data with real-time data, the interrelationship between differentparts of the product life cycle can be identified and the breakdown of a product canbe predicted which allows for maintenance actions to be taken in order to prevent thebreakdown before it actually occurs.
3.3 Supply Chain
Mentzer et al. (2001) defines a supply chain as a set of several different units that togethercontribute to the flow of products, services, finances, and information from its source tothe customer, this flows in both directions, forward and reverse, along the supply chain.Rogers & Tibben-Lembke (2001) claims that the focus of forward logistics is movingthe material from the original manufacturer to the customer, and reverse logistics is theopposite. Rogers et al. (1999) defines reverse logistics as the activities that involve thereturned products from a customer. The materials that are related to reverse logisticsare often products or spare parts that require service. There are many activities to whichboth reverse logistics and forward logistics can be equally applied. For example, it isequally important to forecast how many products will arrive as how many products theconsumer will be purchasing (Rogers & Tibben-Lembke 2001). According to Sandberg(2015), the supply chain has an important role in a competitive market, and the coreproduct becomes less important but services such as logistics and support become moreimportant.
The service parts supply chain can be considered as a closed-loop system consisting ofa repair facility and warehouse, to support the customer. A service part supply chain
22
3.3. SUPPLY CHAIN Master Thesis
consists of several major repairable service parts that circulate back and forth betweenthe customers and the MRO warehouses. One type of replenishment policy that is usedin the warehouse is called the one-for-one base stock. The definition of the policy iswhen a service part is removed from the aircraft and sent to the workshop, the servicepart is immediately replaced by one ready-to-use. The failed service part that requiresmaintenance will be repaired to normal condition. A back-order takes place when awarehouse is out of stock. The warehouse triggers a replenishment order immediately andthe information lead time is assumed to be zero (Mirzahosseinian & Piplani 2011).
3.3.1 Inventory Management
Inventory management is a list of activities that are linked to receive, store, and distributethe incoming inflow and information. To all of these activities includes transportation, ar-rival control, material handling, storage, inventory control, and reverse logistic (Van Weele& Arbin 2019).
According to Vidal & Goetschalckx (1997) there are three strategical approaches to op-timize for a manufacturer. Service level, cost, and quality. The service level should beas high as possible not to be short on any orders, but the hardest part of having a highservice part is still to keep the inventory levels as close to zero because having very highinventory levels binds to high inventory costs. Last but not least, having the best qualityon the market which will increase the cost. It is always a struggle to balance and optimizethese three different parameters. Most often it is a trade-off that the company consid-ers since it is almost impossible to be an order winner on all three. Therefore, variouscompanies try to be the best in their field. Some companies will have a very high servicelevel, but the customer will have to purchase that service for a higher price, while othercompanies will be able to deliver for longer lead times but the price will be significantlylower.
The key objectives are deciding what level of service to provide for different productsand customers, taking into consideration demand variability, available supply, resourceconstraints, and working capital constraints and revenue objectives. A key part of theprocess is deciding how much risk to take in positioning supply against uncertain futuredemand (Vidal & Goetschalckx 1997).
3.3.2 Supply Chain Configuration
Companies and suppliers in a supply chain network are connected through informationand material flow (Dwivedi & Butcher 2008). There are a variety of different collaborationstrategies in a supply chain network, which encourages the collaborative network to openlyshare information and knowledge (Dyer & Nobeoka 2000). The common goal for thesestrategies is to increase transparency and synchronization across the entire supply chain(Holweg et al. 2005).
3.3.3 Information Flow
A system must be in place in order for information to flow through a company. Thissystem must consist of several separate components, so that information can flow fromone component to another. Such a system is known as a distributed system (Barwise
23

3.3. SUPPLY CHAIN Master Thesis
& Seligman 1997). Information and communication technology (ICT) plays a key rolein managing today’s logistics operations. For example, data availability has become aprincipal element to the responsiveness of an organization. Therefore the supply chainand its associated logistics operations have become 100 percent dependent on ICT, both atthe intra-organizational and inter-organizational levels. ICT has become a visible elementof the required infrastructure of companies, regions, and countries (Dwivedi & Butcher2008).
Zhao et al. (2013) states that the information system of service parts supply shouldbe constructed based on the supply chain. Supply chain management is an effectivemethod to organize the supplier, manufacturer, storehouse, distribution center, and supplychannel. Zhao et al. (2013) also states that some companies focus on improving the supplychain, while others have a specific focus on improving the information sharing amongsupply chain partners. Khandelwal (2011) states that the MRO supply chain can be oneof the best opportunities to reduce cost, this is because of the MRO has traditionallybeen seen as having low value and have been not received focus and investments in newsystems, which has resulted in the MRO supply chain as not as important. Zhao et al.(2013) highlights the effective benefits of having an information system that is linked withthe supplier, the demand, the distribution personnel, and the store-keeper. This should bedone by collecting, transmitting, analyzing, changing, and processing the data so that allparts of the supply chain can be more efficient. The information system should include twoparts. The first part is a common information platform of every spare part and the secondis a data-collecting platform of spare parts. The first one is used as a guide to understandeach spare part and the second one should be used to collect all the necessary information.The processed information can be uploaded to a common information platform and sharedwith those partners that require it (Zhao et al. 2013).
Zhao et al. (2013) describes that the goal of constructing an information system is toprovide information to personnel or organization through more effective information flow.Khandelwal (2011) also states that the most crucial and important activity in an MROsupply chain is data management. The data management acts as the foundation stonefor the success of the planning and execution functions. Since an MRO supply chain hasmany different service parts and each part differs in feature and characteristics, makesthe warehouse extremely complex and challenging to plan Khandelwal (2011).
3.3.4 Material Flow
According to Goldsby & Martichenko (2005), the planning of the material flow must bemanaged continuously over time, which means that the flow must be constantly planned,measured, and improved regularly. The products that are delivered to meet customerrequirements are the material included in the flow. This flow should be investigatedto find an improvement that can be implemented for a more efficient flow of material.Goldsby & Martichenko (2005) also states that it is common that businesses know thedemand for their products. The fact is that all demand follows some kind patterns thatcan be documented, described, and understood. By understanding the pattern of businessdemand, the material flow can be observed to determine accurate cycle times, orderingpoints, and efficient storage and transport systems.
24

3.3. SUPPLY CHAIN Master Thesis
3.3.5 Forecasting
A forecast is a prediction of the future. In the industry, forecasting is often associated withpredicting customer demand, but other parts of a business organization must be predictedas well; such as the availability of goods from suppliers, which markets their products andservices will be successful in, and the affect future political situations might have on thecompany. Since all other business decisions are based on the results of a forecast of thefuture, accurate forecasting is an important part of business operations for all companies(Sanders 2016). According to Wallace et al. (1927), every business actor regardless ofindustry must forecast in order to be successful, and these forecasts must be based onstatistics. Forecasts are used in a large number of decisions, ranging from long termstrategic decisions such as where to construct a new factory based on business trends andthe general state of the economy, to short term operational decisions such as productionscheduling and procurement of supplies. Information regarding current, as well as futurecustomer demand is necessary in order to produce accurate forecasts. According to Marx-Gomez et al. (2002) the high level of uncertainty for unplanned maintenance makes thetraditional forecasting methods impossible.
3.3.6 Decision Support
According to Liberatore (2012), strategic, tactical, and operational managerial decisionsmade in a supply chain can be supported by a decision support system. By collecting andanalyzing data, the decision support system can improve the decision making process in asupply chain by allowing fast information-based decision making on an operative level aswell as faster responses to changing circumstances. Decision support systems for supplychains include a wide range of methodologies and tools such as mathematical optimizationalgorithms and information technology tools. Liberatore (2012) claims that in order tosuccessfully use a decision support system in a supply chain there are two fundamentalrequirements:
1. Comprehensive data regarding historical information about logistics activities mustbe available
2. A planning system that can analyze the data must be available
Liberatore (2012) provides a list of standardized tools that can be used to improve man-agerial decisions at an operative level in a supply chain:
• A customer logistics scorecard.
• An order cycle monitoring tool.
• An on-time delivery monitoring tool.
• An inventory level and turns monitoring tool.
• An overage, shortage, and damages monitoring tool.
• A detention and delivery unload monitoring tool.
• Daily alerts to transportation load planners on schedule improvement opportunities.
• Daily alerts to the planner on on-time delivery performance results.
• Daily alerts to customers detailing any back-orders that occurred.
25

3.4. MANUFACTURING PLANNING AND CONTROL Master Thesis
3.3.7 Prioritization
Hatton (2007) describes a simple ranking system technique in software development whichranks tasks from 1 to n, where n is an integer value. Items ranked as 1 are of the highestpriority, and the priority decreases as the ranking number decreases. This can be used tosystematically prioritize tasks in a limited resource environment.
3.4 Manufacturing Planning and Control
Manufacturing Planning and Control (MPC) encompasses decisions regarding the acqui-sition, utilization, and allocation of resources, and the flow of material and informationavailable to an organization. The goal is to provide customers with value in the mostefficient way. For this reason, MPC operations can be seen as an optimization prob-lem, where the goal is to maximize certain outputs from the organization. Examplesof MPC activities include the allocation of resources such as equipment, personnel, andresources, as well as decisions regarding lot sizes, inventory levels, and sequence planningin a production system. (Graves 1999)
An MPC system can be used to support managers by providing them with the informationthey need in order to make effective decisions. An MPC system is not meant to replacehuman managers, but rather to assist these managers in their efforts to manage thefirm’s resources in an efficient way to improve their ability to respond to changes incustomer requirements. An MPC system is able to do this through the utilization ofthe manufacturing company’s internal capacity in combination with the capacity of itssuppliers and customers. In a supply chain environment, an MPC system should aimto coordinate the planning and control of the entire supply chain. This can be done byusing internet-based systems that have the ability to support the coordination of severalcompanies. The goal is to reduce inventory levels and lead times between the differentparts of the supply chain and replace them with a rapid exchange of information. Theability to acquire and utilize information regarding customer needs as well as to providecustomers with information regarding the current status and expected delivery date forcurrent orders is one of the strengths of an MPC system. An efficient MPC system canbring great value to a company if used right, but it also brings costs as it requires skilledprofessionals and supporting resources in order to operate. An MPC system should beadapted in order to support the strategy chosen by the firm in which it is implemented.An MPC system should also be able to change over time to stay up to date with the firm’scurrent tactics to increase customer value. Whether this is through increasing the speed ofdelivery, availability, delivery reliability, product flexibility, or other competing prioritiessuch as a reduction of product prices or response times to changes in the market, the MPCsystem will have to be designed and operated accordingly. If implemented correctly, theuse of an MPC system can contribute to an increase in the competitive performance ofthe company. (Jacobs et al. 2018)
3.4.1 Enterprise Resource Planning
Enterprise Resource Planning (ERP) is used to integrate all of the different functions anddepartments of a firm into a unified system through the use of a common database. Byusing the same database, information sharing, and communication within the firm will be
26

3.4. MANUFACTURING PLANNING AND CONTROL Master Thesis
improved. If an ERP system is implemented correctly it can have a great positive effectfor the firm by improving its efficiency. (Parthasarthy 2007)
An ERP system enables integrated planning and execution of operations across all thedifferent functional areas of a company. These functional areas include sales and market-ing, human resources, finance, and more. An ERP system can in many cases be used tosupport the coordination of planning and execution of operations across different depart-ments in a company or different companies within a supply chain. From the viewpoint ofmanagement, ERP can be seen as a tool used to support managers with decision makingwhen planning and controlling operations performed by the company by integrating thedifferent aspects of the company into a single system with a shared database. One ofthe benefits of using a centralized database is that humans no longer need to manuallyreenter data in each step of the production process which reduces work and the risk forerrors. The use of a shared database requires the company to use consistent definitionsof how to collect and classify data across its different functional areas. For example, thedefinition of how to measure sales can have a great impact on the applicability of an ERPsystem. A sale could be recognized by the company when the customer places the orderwhen the order arrives at the company, payment is collected, when manufacturing starts,when the product physically leaves the finished goods inventory, or when the product orservice is delivered to the customer, or in some other way. If the company uses consistentdefinitions of key measurements such as sales, demand, and inventory levels, the efficiencyof the company can be increased through the use of an ERP system. If these key mea-surements differ between the different departments of the company, however, confusionand mistakes will inevitably occur and bring unnecessary expenses to the company. Es-tablishing consistency is important when implementing an ERP system. (Jacobs et al.2018)
An ERP system gives a company direct benefits such as improved information integrationand communication which allows for better and faster decision making and responses tocustomer orders to improve the efficiency of the company. The ERP system can also bringindirect benefits such as better customer relations, and an improved corporate image. Byintegrating disconnected business units in a company to a single system, ERP allowsfor rapid decisions based on real-time information. ERP also increases the flexibilityof the company, as large amounts of data regarding languages, accounting standards,currencies, or other measurements are all stored in the same centralized system. This isespecially important for large, global companies. (Parthasarthy 2007) A company usingan ERP system can save money through the use of a centralized information systemand common definitions for informed decision making. The quick access to centralizeddata from different parts of the company allows for new synergies to be formed. This istrue especially for large global organizations where different business units are located inseveral different locations around the world. In addition to these benefits, an ERP systemwill increase the company’s ability to respond quickly to changes in customer expectationsas real-time updates to the information in the centralized database allows for fast decisionmaking based on up to date information. (Jacobs et al. 2018)
An ERP system usually consists of several modules representing different business unitsthat are integrated into a common data system. Figure 3.1 illustrates how an ERP systemintegrates disconnected business units in a company to a common database.
27

3.4. MANUFACTURING PLANNING AND CONTROL Master Thesis
Figure 3.1: ERP connecting business units to a common database (Jacobs et al. 2018)
ERP in Finance
The centralized database provided by the ERP system will collect financial data in real-time automatically. For example, the ERP system enables customer orders to be usednot only to trigger manufacturing but also to trigger orders to its suppliers and updatethe financial statements of accounts payable. When the customer pays, the financialstatements for accounts receivable can be automatically updated as well. (Jacobs et al.2018)
ERP in Supply Chain Management
When managing a supply chain, a large number of activities needs to be overseen. Theseactivities include manufacturing, materials management, sales and marketing, logistics,warehousing, distribution, transportation, and coordination of supply chain members.Decisions regarding these activities need to be made and take into account things suchas the volume and weight of the products and material flowing in the supply chain. Theimplementation of an ERP system assists managers when dealing with all of these thingsin a complex network by centralizing and standardizing data which allows for decisionmaking based on up to date information. (Jacobs et al. 2018)
ERP in Manufacturing
An ERP system can help generate purchase orders to suppliers and assist manufacturingmanagers with the planning of maintenance and repairs of factory equipment, productquality assurance, and control, production planning, inventory management, capacityleveling, material requirements planning, product costing and bill of material processingby enabling information-based decision support. (Jacobs et al. 2018)
28

3.4. MANUFACTURING PLANNING AND CONTROL Master Thesis
ERP in Sales and Marketing
This part of the ERP system is used to support the management of sales orders, cus-tomer relations, forecasting, marketing, delivery, credit checking, export controls, cus-toms, billing, and invoicing. The use of a common, centralized database allows for quickresponses to customer orders, for example; if a customer in Asia places an order for anitem that is not available locally, the ERP system will update the database and allowmanagers to procure this item from internal warehouses in other parts of the world andship the requested item to the customer. (Jacobs et al. 2018)
The sales and marketing module of an ERP system assists managers with pricing strate-gies, selling, customer order management, shipping, and billing of products to customers.The data available in the centralized database will allow for efficient marketing cam-paigns, accurate pricing strategies, and better forecasts of future demand (Parthasarthy2007).
ERP in Human Resources
The Human Resources (HR) module of an ERP system supports the management ofemployees regarding scheduling work hours, travel expense accounting, wages, benefitsand payment administration, training existing employees and hiring new ones (Jacobset al. 2018).
In large organizations with thousands of employees, the benefits of the HR module of anERP system are evident. By automating many of the activities performed by the humanresources department the company can improve the management of the employees of thecompany by making faster and more accurate decisions. Since human behavior variesamong each individual, the HR department can focus their attention on special cases,while the HR module of the ERP system handles large amounts of standardized data(Parthasarthy 2007).
3.4.2 Demand Management
Demand Management is the act of integrating information from customers to the man-ufacturing planning and control system. All potential customer demand is collected andcoordinated by the firm. This can be done by taking existing customer orders and de-termining delivery dates and balance supply with demand. This ensures that promisesabout delivery dates to customers can be held. As demand management is used to con-nect the information from customers to the MPC system, demand management can beseen as the link between the firm and the market, as well as the firm and its partners inits supply chain which is illustrated in figure 3.2 where the arrows depict the flow infor-mation between the customers and the MRP system, as well as within the MRP system.The arrow between demand management and customers is double-headed to illustrate theimportance of two-way communication with customers in addition to pure informationgathering. Demand management provides Sales and Operations Planning with informa-tion regarding customer demand which is used to plan sales and manufacturing operationson a high aggregation level, usually about one year ahead in time. Demand managementalso provides Master Production Scheduling (MPS) with forecasts and information aboutactual customer demand which is used by the MPS for short-term manufacturing planningfor specific products. (Jacobs et al. 2018)
29

3.4. MANUFACTURING PLANNING AND CONTROL Master Thesis
Figure 3.2: The role of Demand Management in MRP (Jacobs et al. 2018).
30

Chapter 4
Current State
This chapter presents the current state of the Gripen C/D service parts supply chain atGripen Support, Saab Support & Services in Linkoping. All the information in this chapteris based on interviews, documents and historical data from SAAB.
4.1 Gripen C/D Customers
In 2019 there were 167 Gripen C/D aircraft in use by six different customers who areillustrated in figure 4.1. 100 of these aircraft were used by the Swedish Royal Air Force,14 aircraft by the Hungarian Air Force, as well as the Czech Air Force. 26 aircraft wereused by the South African Air Force, and 12 aircraft by the Royal Thai Air Force. Inaddition to these five air forces, one Gripen C was used by The Empire Test Pilots’School, which is a British school for flight test engineers and test pilots. Saab handles themaintenance of these aircraft except for the one used by Empire Test Pilot’s School. Thecustomer owns the aircraft as well as all of the service parts1.
When a service part is in need of maintenance it is removed from the aircraft and replacedwith a new one from the customer’s inventory. When the service part has been removedfrom the aircraft the personnel at the airbase writes a technical report. This technicalreport is a large set of detailed data that among other things describes why the service partwas removed and contains information about the historical usage of the service part. Theremoved service part is sent to Saab for maintenance. The transportation time dependson where the customer is located. A service part sent from an airbase in Sweden usuallyarrives within a few days, whereas a service part sent from overseas might take severalweeks2.
1Martin Larsson, Logistics Analytics, Support & Services, 2020-04-092Martin Larsson, Logistics Analytics, Support & Services, 2020-01-24
31

4.1. GRIPEN C/D CUSTOMERS Master Thesis
Figure 4.1: Number of Gripen C/D aircraft used by each customer (Saab Group 2020)
Saab divides all maintenance into two different categories; planned and unplanned main-tenance. Planned maintenance is performed according to certain criteria specified by themanufacturer. There are three different kinds of criteria; Calendar Time, Flight Hours,and Cycles. Calendar time is the number of days that have passed since the service partwas manufactured, regardless of how the aircraft is used. This is for example used forservice parts made of rubber or the gunpowder used in the ejection seat. The number offlight hours is used for service parts that only experience wear when the aircraft is used,for example, hydraulic cylinders. The number of cycles is used for service parts that areworn down in relation to how many times they are used, regardless of the number of flighthours, such as the landing gear.
Every year the customer plans how much and when the aircraft will be used. With thisinformation, the customer predicts when each service part will need maintenance. Thiscalculation is based on the usage of the aircraft combined with the maximum amount ofhours a service part is allowed to be used before maintenance. This type of maintenanceis called planned maintenance. The customer is required to send the information toSaab3.
Unplanned maintenance is needed whenever something unexpected happens, such as whena service part malfunctions or breaks. The only type of planning that Saab does forunplanned maintenance is using historical data. The historical data is used to predict howmany service parts will arrive at the workshops in the future. Despite this type of planningapproach, service parts in need of unplanned maintenance are often delayed.
3Kristian Lundberg, Director of Technology & Innovation, Support & Services, 2020-02-05
32

4.2. SERVICE PARTS Master Thesis
4.2 Service Parts
There are about 600 different service parts that can be removed from a Gripen C/Daircraft. All service parts have a specified expected maintenance lead time. The expectedmaintenance lead time ranges from 25 days to 200 days for different service parts. If Saabis unable to complete the maintenance within the specified maintenance lead time, Saabhas to pay a penalty fine based on the value of the service part and the number of daysit is delayed.
4.3 Service Parts Supply Chain
In order to provide their customers with maintenance service, Saab Support & Servicesuses a service parts supply chain, which is illustrated in figure 4.2.
Figure 4.2: Gripen C/D service parts supply chain
Nodes in the service parts supply chain
The following list explains each part of the Gripen C/D service parts supply chain shownin figure 4.2.
• Customer - This blue node represents all of Saab’s customers who use Gripen C/Dand for whom Saab conducts maintenance. This is where the flow of service partsbegins.
• External OEM - This purple node represents Original Equipment Manufacturers(OEM) that provide service parts directly to the customer. Saab is not involvedin this part of the service parts supply chain. The engine is an example of such aservice part, as it is wholly handled by its original manufacturer. These externalOEM’s are excluded from further analysis in this master thesis.
33

4.4. MRO WORKSHOPS Master Thesis
• MRO 1 & MRO 2 - Saab has two different workshops where they perform Main-tenance, Repair, and Overhaul (MRO). The two workshops are located in differentlocations and handle different types of service parts. MRO 1 handles mechanicalparts, and MRO 2 handles avionics. In some instances, the service part is sent tothe wrong MRO and has to be transported between MRO 1 and MRO 24
• Discard - Saab handles the disposal of old and broken equipment. This is repre-sented by the red square labeled Discard in the figure. This part of the service partssupply chain is excluded from further analysis in this master thesis.
• OEM - Both MRO 1 and MRO 2 has three different types of Original EquipmentManufacturers (OEM). The difference between the three types is as follows: OEM1.1 and 2.1 handles all the maintenance of a service part. OEM 1.2 and 2.2 handlespart of the maintenance of a service part. OEM 1.3 and 2.3 are not directly involvedin the maintenance of service parts but supply the MRO workshops with spare parts.There are several hundred suppliers of each type of OEM in the service parts supplychain.
Each part has an expected lead time for maintenance. If the part is delivered to thecustomer too late, Saab has to pay a fine based on the value of the service part and thenumber of days the service part is delayed. The measurement of this lead time beginswhen the service part arrives at the loading platform of the MRO and ends when the partleaves the MRO again5.
4.4 MRO workshops
The scope of this master thesis was limited to the MRO workshops at Saab. The bound-aries for this system are illustrated in figure 4.3 as the translucent blue boxes marked SaabSupport & Services and MRO. The figure illustrates the flow of information and materialwithin, to, and from the MRO workshop in detail.
4Frida Liljenroth, Planning Manager, Support & Services, 2020-02-125Dino Besic, Production Planner, Support & Services, 2020-02-14
34

4.4. MRO WORKSHOPS Master Thesis
Figure 4.3: MRO in detail
The following text describes figure 4.3. The material and information flow of this sup-ply chain begins at the Customer. The Customer sends the service parts that requiremaintenance to the part of the MRO labeled Maintenance. Twice a year the customersends information regarding the service parts that require planned maintenance. This isillustrated in the figure as Usage Information. Flight Monitoring at Saab uses this infor-mation to inform the Planner and Purchaser at the MRO when maintenance is neededfor each service part. The Planner uses that information to plan the maintenance andthe Purchaser orders goods and services from OEM. Flight Monitoring receives HistoricalData from a database that only Saab has access to. This data is used to predict futureneed for unplanned maintenance. The database is based on Historical data from the Us-age Information from previous years. The Planner and Purchaser at Saab use HistoricalData to predict how many unplanned events that will occur. The OEM facilitates theMaintenance with spare parts, and some service parts are transported directly to theOEM for maintenance. When a service part is repaired and is ready to be installed in anaircraft again, it is sent back to Customer from Maintenance.
The customer provides Saab with forecasts of future aircraft maintenance. This is theplanned maintenance. These forecasts are used as input data to an optimization pro-gram that produces statistical data that is used by Saab Support & Services as a basisfor purchases from the OEMs for planned maintenance6. All operations for unplannedmaintenance is planned when these service parts arrive at the MRO7.
The technical reports written by the customers when a service part is removed froman aircraft are available to Saab digitally. The flow of information from the customersto Saab is illustrated in figure 4.4. The technical reports are written by hand and putinto Computer System 1 manually. The data form the technical report is sent fromComputer System 1 to Computer System 2 which in turn sends the data to ComputerSystem 3 at Saab, also automatically. The third computer system provides Saab with
6Kristian Lundberg, Director of Technology & Innovation, Support & Services, 2020-02-057Martin Brantemo & Marcus Karlsson, Flight Monitoring, Support & Services, 2020-02-10
35
4.4. MRO WORKSHOPS Master Thesis
data sheets regarding all the service parts that have been removed. These data sheetsoften lack certain information that has to be manually retrieved from Computer System2 by employees at Saab Support & Services8.
Figure 4.4: Information flow from customers to Saab
When a service part arrives at an MRO workshop it is placed in a First-In-First-Out(FIFO) queue. The personnel can access information about what is wrong with theservice part in the technical report. Each service part goes through a process calledarrival inspection when it enters the MRO workshop for the first time. This test verifiesthe fault reported in the technical report and finds additional errors that might not havebeen identified by the customer. After this initial test, the service part goes throughmaintenance work to restore it to a functional condition. When this is done the servicepart goes through a final test to make sure that the maintenance has been done correctlyand that the service part is safe to use. If the service part should fail this final test, itgoes through the entire process again.
The FIFO-queue can be altered by the customer when they want other service parts tobe prioritized. This prioritization can be caused when the customer runs out of a certainservice part and marks it as Aircraft On Ground (AOG) which means that an aircraftis unable to operate as it can not fly without this particular service part. This can alsooccur when the customer is running low on a certain service part in their own inventoryand risks reaching AOG soon. Whenever these changes in the production queue occur,the measurement of the maintenance lead time is ’paused’ for other service parts to avoidfines caused by these delays, as it is not something Saab can control. This is reported asa clock-stopping interruption code in the MRO workshop9.
In addition to the clock-stopping interruption code, there are regular interruption codes.These codes are used to classify and log interruptions that may occur in the maintenancework. These interruptions can occur when the MRO workshop runs out of spare parts,
8Marcus Karlsson, Flight Monitoring, Support & Services, 2020-02-209Dino Besic, Production Planner, Support & Services, 2020-02-14
36

4.5. OEM Master Thesis
or when a service part has been delayed at an OEM. Saab uses 47 unique interruptionscodes to log the different disturbances that may occur during maintenance.
Saab is responsible to calculate the cost to repair the service parts that they maintain.Each service part has a certain percentage level of its purchasing cost which is calledBeyond Economical Repair (BER). Saab contacts the customer if the calculation exceedsthe limit of the BER to decide if maintenance of the service part should continue or anew service part should be purchased. Some times maintenance continues despite the costas it is usually faster than waiting for a new service part. This decision is made by thecustomer as they own the service parts10.
Since many spare parts used to maintain the service parts are expensive, and some spareparts have a limited lifetime, the MRO workshops avoid purchasing anything until theyknow for sure what they need. Often when there is a service part that requires plannedmaintenance, the MRO has a good idea of what type of service is required. It could be astandardized service after a certain amount of hours, and a spare part that always has tobe changed. This allows the MRO workshops to complete planned maintenance on timemore often. These things are much harder to know for unplanned maintenance as the typeof maintenance needed is unknown before an operator has tested what type of problemthat needs to be fixed. To handle the complexity of not knowing what type of fault thata service part has, Saab uses historical data to predict what spare parts that are neededto be purchased each year. The problem with using historical data is that the aircraftand the service parts are getting older. This means that relying on historical data onlyshows what demand has looked like in the past. The operators have seen an increase inservice parts arriving at the MRO throughout the years. This is illustrated in figure 1.8,which illustrates as the service part gets older the maintenance is required more often.As a result, much of the unplanned maintenance suffers from severe delays10.
4.5 OEM
There are two purchasing units at Saab. Firstly the strategic procurement departmentat Saab Support & Services handles strategic purchases and deal with long term con-tracts and supplier relationships with OEM. Secondly, the operative planners at MROhandle operative purchasing where orders of goods and services are actually placed tothe OEM’s according to the contracts set up by the strategic purchasers. The flow ofinformation to OEM in the Gripen C/D service parts supply chain regarding unplannedmaintenance is illustrated in figure 4.5 which is described below. The flow begins withthe node labeled Aeronautics which designs the Gripen aircraft and provides the StrategicProcurement with product specifications for all service parts. Strategic Procurement thenuses this information to find and select OEM companies that can provide Saab with goodsand services that meet the product specification. The strategic purchasers at StrategicProcurement make long term contracts and establishes a relationship with these com-panies. The Operative Planning at the MRO workshops handles operative purchasing.For unplanned maintenance, decisions regarding operative purchasing are based partly onForecasts based on historical data. These forecasts are not 100% accurate which meansthat service parts arrive unexpectedly from time to time. This is represented in figure 4.5by the node labeled Service Part Arrive at MRO. The operative planners place orders to
10Dino Besic, Production Planner, Support & Services 2020-02-14
37

4.5. OEM Master Thesis
the OEM according to the contracts made by the strategic purchasers based on a combi-nation of the forecasts and the requirements of the service parts that are present in theMRO workshop.
Figure 4.5: Information flow to OEM
Saab uses three different types of OEM. What distinguishes them from each other is theway they are used to support the MRO as shown in figure 4.6, where the black arrowsillustrate the flow of material. The first type of OEM handles all the maintenance of aservice part, and Saab’s MRO workshop is not involved in the work. This is illustratedas Scenario 1 in figure 4.6. The second type of OEM helps by performing some of themaintenance, while Saab’s MRO workshop performs the rest, illustrated as Scenario 2 infigure 4.6. The third and final type only provides Saab’s MRO workshop with disposableitems such as spare parts or lubricants, illustrated by Scenario 3 in figure 4.6. Saab usesseveral hundred different OEMs of each type to support and supply their MRO workshopswith the correct material and services11.
11Timmy Svensson & Johan Haraldsson, Purchaser, Support & Services, 2020-02-17
38

4.5. OEM Master Thesis
Figure 4.6: The three types of OEM
39

Chapter 5
Analysis
This chapter analyzes the data found at Saab and connects it with the theoretical frame-work. The analysis is divided into four major sections. The first section is an ABC-analysis where the service parts that contribute the most to penalty fines are identified.The second part is a process map analysis which analyzes the activities that make upthe maintenance process in the MRO workshops. The third section is a lead time analysiswhere the lead time of the each activity in the maintenance process is analysed for all unitsof the A-category service parts identified in the ABC-analysis, and identifies interruptionsin the maintenance process. The final section is a root cause analysis which exposes thereasons behind the interruptions and delays of the maintenance process.
5.1 Service Parts
The names and identification numbers for the service parts are classified. As a result ofthis, the service parts have been given new names in this report. They are all referred toas Service part followed by a number. The amount of penalty fines paid is also classified.Instead of presenting a number, each service part will be presented with its share of thetotal penalty fines paid in 2019.
In 2019, 4277 units of service parts were maintained by Saab’s MRO workshops. Out ofthese units, 895 units of 82 different types of service parts were delayed and inducedpenalty fines. Information about these 82 service parts is presented in table D.2 inappendix D together with their contribution to the total sum of penalty fines paid in2019.
5.2 ABC - Analysis
An ABC analysis was conducted in order to determine which service parts contributedthe most to the penalty fines paid by Saab in 2019. This ABC analysis was based on theservice parts’ contribution to the total amount of money paid in fines in 2019. The 82service parts that contributed to penalty fines in 2019 are shown in table D.2 in appendixD. These service parts were sorted according to their share of the total penalty fines paidin 2019. The ABC-analysis divided them into three categories; A, B, and C. The top 20% of the units on the list were assigned to the A-category. The next 30% of the service
40

5.3. A-CLASS ITEMS Master Thesis
parts were assigned to the B-category, and the final 50% were assigned to the C-categoryaccording to the theory presented by Flores & Whybark (1986) in chapter 2. The resultof the ABC analysis is shown in table 5.1. The units in the A-category amounts to 86% ofthe total penalty fines paid in 2019. The 16 service parts in the A-category were selectedfor further analysis.
Category Proportion of Service Parts Share of total fines 2019A 20 % 86 %B 30 % 12 %C 50 % 2 %
Table 5.1: ABC analysis of service parts contribution to penalty fines 2019
5.3 A-class Items
Figure E.1 to figure E.16 in appendix E illustrates bar charts showing the differencebetween actual maintenance lead time and planned maintenance lead time for each indi-vidual unit of the service parts. An example is shown for service part 1 in figure 5.1. Thelength of the bars illustrates the difference between actual maintenance lead time andplanned lead time in workdays for each unit. That is, positive bars represent late comple-tion of maintenance, and the negative bars represent early completion of maintenance. Ifa unit is delivered right on time, the length of the bar will be zero. The blue bars representunplanned maintenance, and the orange bars represent planned maintenance.
27 individual units of service part 1 were maintained by Saab’s MRO workshops in 2019.8 of these units underwent planned maintenance, and 19 units underwent unplannedmaintenance. Figure 5.1 shows the difference between the actual lead time for eachindividual unit compared to the expected lead time of 30 days. The unit with the longestobserved delay is unit number 6, which was completed 250 days later than expected, witha total lead time of 280 days.
41

5.4. PROCESS MAP ANALYSIS Master Thesis
Figure 5.1: Service Part 1
In total 486 individual units of the 16 A-category service parts were maintained anddelivered in 2019. 71% of these 486 units required unplanned maintenance, and theremaining 29% required planned maintenance. 86% of all penalty fines paid in 2019were caused by delays in unplanned maintenance. The relationship between volume andpenalty fines 2019 is illustrated in figures 5.2 and 5.3. In total, there were 190 units ofthe 16 service parts in the A-category that required unplanned maintenance and weredelayed.
Figure 5.2: Volume Distribution Figure 5.3: Penalty Fines Distribution
As a result of this information, only unplanned maintenance was analyzed from this pointonward.
5.4 Process Map Analysis
A process map was conducted in order to visualize all the activities and to identify whatinformation the decisions are based on. This process map analysis is based on the theoryof Brook (2017) and Jacka & Keller (2009) which is described in detail in Chapter 2.
42

5.4. PROCESS MAP ANALYSIS Master Thesis
The process begins when a service part is removed from an aircraft due to a need forunplanned maintenance. The next step is that the service part is transported to an MROworkshop for maintenance. The process map illustrated in figure 5.4 shows what happensduring maintenance in greater detail. After maintenance is completed, the service part istransported back to the customer.
Figure 5.4: Process map of Unplanned Maintenance
The maintenance process begins when a service part arrives at the MRO workshop andis placed in a FIFO-queue. The operators at the MRO workshop then perform an arrivalinspection where the service part is examined and the information in the technical isverified. After the arrival inspection has been completed, the operators document inSaab’s database that the service part has been received and that arrival inspection hasbeen completed. Whether or not the service part should be maintained in the MROworkshop or at its OEM is pre-determined for each type of service part, As illustrated infigure 4.6 in chapter 4.
If the service part should be maintained by the OEM, the operative MRO planner informsthe operative purchasers who in turn order maintenance from the OEM and sends theservice part to its OEM for maintenance. When the service part returns from the OEM itis tested by the operators at the MRO workshop to make sure that the service part is safeto use in an aircraft. If the service part fails this test it is sent back to the OEM, but ifit passes the final test it is shipped back to the customer, and maintenance of the servicepart is deemed as completed. This is illustrated as Scenario 1 in figure 4.6 in chapter4.
If the service part should be maintained in the MRO workshop, it is instead sent into aFIFO storage at the MRO workshop. The service part then goes through a series of testscalled Fault Isolation where the operators at the MRO workshop identify what type ofmaintenance is required to restore the service part to a working condition. These testsvary between different types of service parts.
If the service part uses sub-units, and the fault isolation identifies broken sub-units, these
43
5.5. LEAD TIME ANALYSIS Master Thesis
sub-units are removed from the service part and sent to the OEM to be repaired. Newsub-units are put into the service part. This is illustrated as Scenario 2 in figure 4.6 inchapter 4.
If the fault isolation identifies that a type of maintenance that requires spare parts isneeded, the inventory of spare parts at the MRO workshop is checked. If the MROworkshop does not have enough spare parts to perform the maintenance, new spare partsare ordered from the OEM. This is illustrated as Scenario 3 in figure 4.6 in chapter 4.
If the MRO workshop does not have enough sub-units or spare parts in stock to maintainthe service part, the service part is put in storage until the MRO workshop has access toall sub-units and spare parts necessary to maintain the service part. Maintenance of theservice part begins when the MRO workshop has access to all necessary resources.
The final step of the maintenance process at the MRO workshop is the final test of theservice part. During this test, the operators make sure that the service part reaches pre-determined levels of performance and is safe to use in an aircraft. If the service part failsthe final test, it is sent back to fault isolation and goes through the entire maintenanceprocess again. If the service part passes the final test, it is shipped back to the customer,and maintenance of the service part is completed.
5.5 Lead Time Analysis
A lead time analysis was conducted for all 190 units of the 16 service parts classified intothe A-category that needed unplanned maintenance and were delayed in 2019. The leadtime analysis analyzed the steps and interruptions that occurred during maintenance ofthe service part as described by Oskarsson et al. (2013) in chapter 2.
As described in chapter 4, Saab uses codes to log when maintenance is stopped due to aninterruption in a database. When investigating the data regarding maintenance for all ofthe 190 units of the 16 service parts in category A in need of unplanned maintenance thatwere delayed in 2019, these interruption codes were used to identify the cause of each eventthat happened during maintenance. This data was available in an extensive database atSaab. For each of these 190 units, data from the database was analyzed to understandwhat transpired during the time from the removal of the unit from the aircraft untilmaintenance was completed. The database contains information about when the unitwas removed from the aircraft, when it arrived at the MRO workshop, the maintenanceactivities that were performed in the MRO workshop, and how long they took to complete.Data regarding the interruptions of the maintenance were available together with the timeneeded to resolve the interruption. The database also contained information about whenmaintenance was completed.
Data was collected regarding what type of interruptions occurred and how long it tookto resolve the issue for each unit. This data was then aggregated for each service partto make sure that data from all cases were included in the extensive lead time analysispresented below. This data for all 16 service parts is available in appendix F.
The analysis from the 190 units showed that four types of interruptions caused delays, asshown in table 5.2.
44

5.5. LEAD TIME ANALYSIS Master Thesis
Type of Interruption Share of Interruptions Share of TimeExternal Delay at OEM 38 % 57 %Internal stock-out (sub-units) 22 % 24 %Internal stock-out (spare parts) 25 % 18 %Internal machinery breakdown 15 % 1 %
Table 5.2: Summary of the different interruptions that occurred the A-category items2019
The first column in table 5.2 shows the interruption that caused a delay as it was reportedin the database at Saab. The second column shows what proportion of the number ofoccurrences each type of interruption was responsible for. For example, 25% of all inter-ruptions were caused by an internal stock-out of spare parts. The third and final columnshows what proportion of the total time needed to resolve the issues each interruptionhas caused. For example, the time needed to resolve the interruptions caused by internalfaulty equipment amounted to 1% of the total time needed to resolve all the interrup-tions. The four causes of delays identified were; internal stock-out of spare parts, internalstock-out of sub-units, external delay at OEM, and internal faulty equipment.
Cause of delay Average Interruption TimeInternal stock-out (spare parts) 120 daysInternal stock-out (sub-units) 171 daysExternal delay at OEM 242 daysInternal faulty equipment 15 days
Table 5.3: Average number of days needed to resolve each cause of delay
Timelines are illustrated in figures 5.5, 5.6, 5.7, 5.8 in the following sub-sections. Thebars and numbers in the timelines are color coded as follows:
• Blue: Transportation time from customer to MRO workshop.
• Yellow: Time spent by the service part in inventory at the MRO workshop.
• Green: Time spent doing maintenance work.
• Red: Time spent waiting for an interruption be resolved.
• Purple: The expected due-date or deadline of the maintenance.
5.5.1 Internal stock-out (spare parts)
An interruption reported as an internal stock-out of spare parts means that maintenancehad been interrupted as the MRO workshop did not have enough spare parts and dispos-able material, such as screws, O-rings, or lubricant on hand. The issue is resolved when adelivery of new spare parts or disposable material is received at the MRO workshop. Thisis a one-way flow of spare parts and material from OEM to the MRO workshops.
In order to illustrate this interruption, the aggregated timeline shown in figure 5.5 wascreated using data from all 48 units that were delayed of an internal stock-out of spareparts. A larger time-line is illustrated in Appendix G.
45

5.5. LEAD TIME ANALYSIS Master Thesis
Figure 5.5: Aggregated time line for internal stock-out (spare parts)
The numbers in the timeline correlate to the events described by the same numbers inthe following list. The maintenance process is illustrated in the process map in figure5.4.
1. The service part was removed from the aircraft by mechanics at the airbase. Atechnical report was written and submitted to a database. The information in thetechnical report is available to Saab, but it is not used.
2. The service part arrived at the MRO workshop after being transported for 9 days.The service part went through arrival inspection and put in storage where it waitedfor fault isolation.
3. The service part went through fault isolation after 22 days in storage. During thefault isolation, the operators at the MRO workshop identified that the service partrequired maintenance that needed spare parts. The operators at the MRO workshopchecked the inventory and discovered a lack of the specific spare parts needed tomaintain the service part. The operative planner informed the operative purchasersthat new spare parts are needed.
4. 1 day later, the operative purchasers placed an order for new spare parts to theOEM.
5. Deadline. Maintenance of the service part should be finished by now.
6. New spare parts arrived at the MRO workshop 120 days after the order was placedby the operative purchasers. There is no expected delivery lead time from the OEM.The service part was still in storage for another 5 days before maintenance began.
7. 4 days later, maintenance was complete and the service part passed the final in-spection and was shipped back to the customer.
The expected maintenance lead time was on average 56 calendar days. As shown in figure5.5, the average actual maintenance lead time was 152 calendar days. On average, thedelay was 96 calendar days.
As figure 5.5 shows, the maintenance was on average interrupted for 120 days because
46
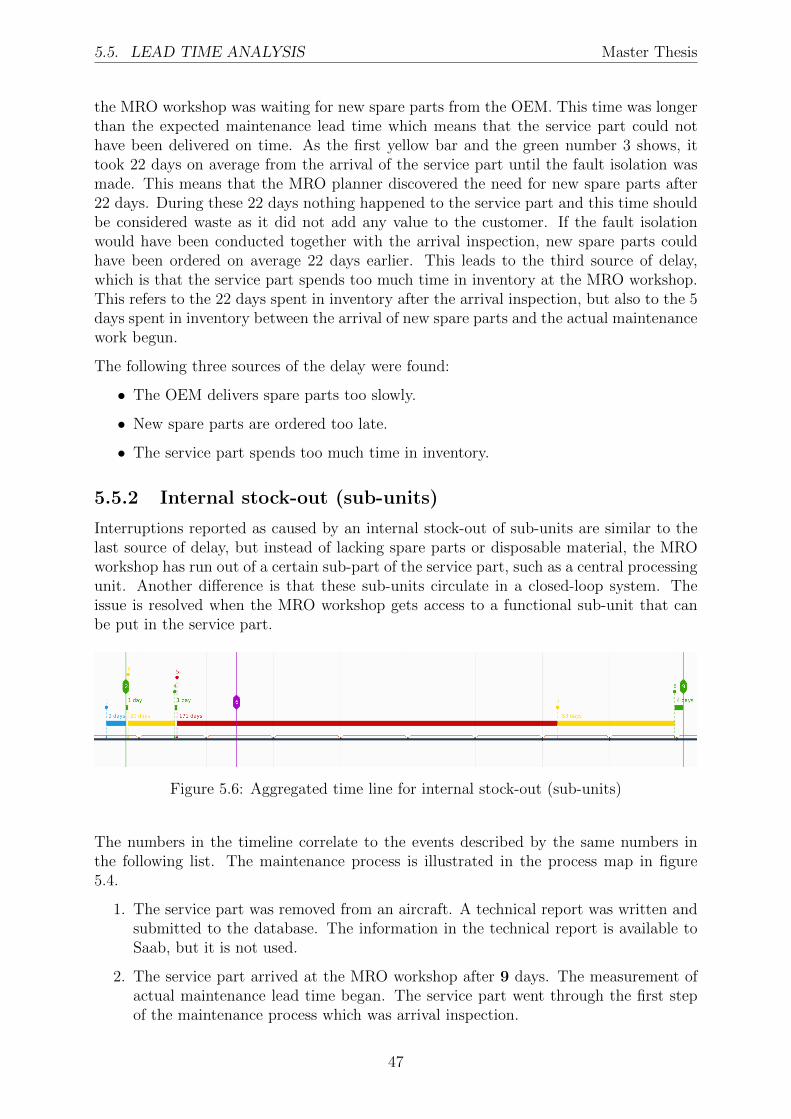
5.5. LEAD TIME ANALYSIS Master Thesis
the MRO workshop was waiting for new spare parts from the OEM. This time was longerthan the expected maintenance lead time which means that the service part could nothave been delivered on time. As the first yellow bar and the green number 3 shows, ittook 22 days on average from the arrival of the service part until the fault isolation wasmade. This means that the MRO planner discovered the need for new spare parts after22 days. During these 22 days nothing happened to the service part and this time shouldbe considered waste as it did not add any value to the customer. If the fault isolationwould have been conducted together with the arrival inspection, new spare parts couldhave been ordered on average 22 days earlier. This leads to the third source of delay,which is that the service part spends too much time in inventory at the MRO workshop.This refers to the 22 days spent in inventory after the arrival inspection, but also to the 5days spent in inventory between the arrival of new spare parts and the actual maintenancework begun.
The following three sources of the delay were found:
• The OEM delivers spare parts too slowly.
• New spare parts are ordered too late.
• The service part spends too much time in inventory.
5.5.2 Internal stock-out (sub-units)
Interruptions reported as caused by an internal stock-out of sub-units are similar to thelast source of delay, but instead of lacking spare parts or disposable material, the MROworkshop has run out of a certain sub-part of the service part, such as a central processingunit. Another difference is that these sub-units circulate in a closed-loop system. Theissue is resolved when the MRO workshop gets access to a functional sub-unit that canbe put in the service part.
Figure 5.6: Aggregated time line for internal stock-out (sub-units)
The numbers in the timeline correlate to the events described by the same numbers inthe following list. The maintenance process is illustrated in the process map in figure5.4.
1. The service part was removed from an aircraft. A technical report was written andsubmitted to the database. The information in the technical report is available toSaab, but it is not used.
2. The service part arrived at the MRO workshop after 9 days. The measurement ofactual maintenance lead time began. The service part went through the first stepof the maintenance process which was arrival inspection.
47

5.5. LEAD TIME ANALYSIS Master Thesis
3. 1 day later the service part was placed in a FIFO inventory for 20 days.
4. Fault isolation showed that the service part needed new sub-units. The inventoryof sub-units at the MRO workshop was empty. The operative planner informed theoperative purchasers.
5. The broken sub-units removed from the service part were sent to the OEM to berepaired by the operative purchasers.
6. Deadline. Maintenance of the service part should be finished by now.
7. Repaired sub-units arrived at the MRO from the OEM after 171 days. The servicepart stays in the FIFO inventory. for another 53 days before maintenance continues.
8. 53 days later, the service part went through the final stages of maintenance for 4days.
9. The service part passed the final test and was shipped to the customer.
The expected lead time was on average 50 calendar days. As shown in figure 5.6 theaverage actual lead time was 250 calendar days. On average, the delay was 200 calendardays for the service parts that were interrupted by an internal stock-out of sub-units. Alarger time-line is illustrated in Appendix G.
As shown in figure 5.6, this type of interruption is related to the same sources of delaysas the service parts that were interrupted by a stock-out of spare parts. The OEM tookon average 171 days to deliver new sub-units, which was more time than the expectedmaintenance lead time of the service part. New sub-units were not ordered until the faultisolation process was conducted, which on average was done after 20 days. Finally, theservice part spent an unnecessary amount of time in inventory at the MRO workshopduring the 20 days before fault isolation, but also during the 53 days between the arrivalof new sub-units and the final maintenance work was done.
The following three sources were found:
• The OEM delivers sub-units too slowly.
• Old sub-units are sent to the OEM too late.
• The service part spends too much time in inventory.
5.5.3 External work at OEM
As described in chapter 4, the maintenance of some service parts is completely handledby the OEM, and Saab’s MRO workshops only send the service parts to the correct OEM.If these service parts are delayed at the OEM, the interruption is reported as externaldelay at OEM. The issue is reported as resolved when the service part has returned tothe MRO workshop.
48

5.5. LEAD TIME ANALYSIS Master Thesis
Figure 5.7: Aggregated time line for external delay at OEM
The numbers in the timeline correlate to the events described by the same numbers inthe following list. The maintenance process is illustrated in the process map in figure 5.4.A larger time-line is illustrated in Appendix G.
1. The service part was removed from an aircraft. A technical report was written andsubmitted to the computer system. Saab has access to the information, but it isnot used.
2. The service part arrived at the MRO workshop 6 days after being removed fromthe aircraft. An arrival inspection was made when the service part arrived at theMRO workshop. The service part should be maintained entirely by the OEM. Theoperative planner informs the operative purchasers that the service part should besent to its OEM for maintenance.
3. 4 days after the service parts’ arrival to the MRO workshop, the operative purchasersplace the order and ship the service part to the OEM.
4. Deadline. Maintenance of the service part should according to the contract befinished by now.
5. The service part returns from the OEM to the MRO workshop 242 days after theorder was sent to the purchasers at Saab.
6. The service part went through the final test 3 days after arriving at the MROworkshop to make sure that the service part was correctly maintained by the OEM.
7. The service part was shipped back to the customer 1 day after beginning the finaltest. Measurement of actual maintenance lead time was stopped.
The expected maintenance lead time was on average 112 calendar days. As shown infigure 5.7, the average actual maintenance lead time was 250 calendar days. On average,the delay was 138 calendar days.
As shown in figure 5.7, the service part was sent to the OEM for maintenance almost assoon as it arrived at the MRO workshop. The service part then spent on average 242 daysat the OEM, which was longer than the expected maintenance lead time for the servicepart.
The following source of delays was found:
• The OEM takes too long time to maintain the service part
49

5.5. LEAD TIME ANALYSIS Master Thesis
In this case, sending the service part to the OEM is supposed to happen. For some reason,the service part was delayed, but since that happened at another company it is out of thescope of this master thesis.
5.5.4 Internal faulty equipment
An interruption reported as internal faulty equipment means that maintenance had tostop because necessary tools or machinery was not functional at the time. The issue isresolved when the appropriate tools or machinery has been repaired.
Figure 5.8: Aggregated time line for internal faulty equipment
In order to illustrate this interruption, the aggregated timeline shown in figure 5.8 wascreated using data from all 48 units that were delayed of an internal stock-out of spareparts. A larger timeline is illustrated in Appendix G.
1. The service part was removed from an aircraft. A technical report was written andsubmitted to the computer system. Saab has access to the information, but it isnot used.
2. The service part arrives at the MRO workshop after 3 days. An arrival inspectionwas made when the service part arrived at the MRO workshop.
3. After 31 days a fault isolation was conducted. The MRO workshop does not haveto order any sub-units or spare parts.
4. 1 day after the fault isolation the service part was put into storage.
5. After 13 days in storage, maintenance of the service part was supposed to beginbut it was interrupted when a piece of machinery broke down.
6. The equipment was restored and maintenance could continue after 14 days, but theservice part remains in storage for another 62 days.
7. The service part was maintained during 3 days.
8. After the maintenance was completed the service part was put in storage for 105days.
9. Deadline. Maintenance of the service part should according to the contract befinished by now.
50
5.6. ROOT CAUSE ANALYSIS Master Thesis
10. The service part went through the final inspection and the test was successfullycompleted.
11. One day after the final test began the service part was put in storage for another14 days.
12. The service part was shipped to the customer, the maintenance was completed.
The expected lead time was on average 98 calendar days. As shown in figure 5.8 theaverage actual lead time was 244 calendar days. On average, the delay was 200 calendardays for the service parts that were interrupted by an internal stock-out of sub-units.
As shown in figure 5.8, the service part spent on average 31 days in inventory before thefault isolation was conducted. The service part was then stored in inventory for another13 days before maintenance work was supposed to begin, but then the maintenance wasinterrupted due to machinery breakdown. On average, it took 14 days to repair the brokenmachinery, and the service part spends another 43 days in inventory before the servicepart was successfully maintained for 3 days. The service part then spent on average 105days in storage before going through the final test. Finally, the service part spent 14 daysin inventory before being shipped back to the customer.
The following two sources of delays were found:
• The service part spends too much time in inventory
• The machinery broke down
5.6 Root Cause Analysis
The lead time analysis of the aggregated timelines exposed seven different causes of delaysrelated to the interruptions of maintenance of service parts. The causes were divided intotwo categories; the ones that were caused by the OEM, and the ones that were caused bythe MRO.
Delays caused by OEM
1. The OEM delivers spare parts too late.
2. The OEM delivers sub-units too late.
3. The OEM takes too long to maintain service parts.
Even though the three causes related to OEM are specific to different types of interrup-tions, all three can be aggregated into one cause of delay. The three types of interruptionhave one thing in common, which was the fact that they provide the MRO workshopswith some kind of service, and this service was not always provided in time. Thereforethe three causes were aggregated to the following cause of delay: The OEM takes too longto deliver its service to the MRO workshop.
Delays caused by MRO
1. Spare parts are ordered too late.
2. Broken sub-units are sent to OEM too late.
51

5.6. ROOT CAUSE ANALYSIS Master Thesis
3. Service parts spend too much time in inventory.
4. Machines brake down.
The two first causes of delays related to the MRO workshop can be aggregated as well.The two types of causes are related to different types of interruptions but stem from thesame problem which was: The MRO workshop places orders to the OEM too late.
The third cause of delay was related to service parts spend too much time in inventory atthe MRO workshop. This type of delay was not related to a particular type of interruptionas it has been observed together with several types of interruptions.
The final cause of delay at the MRO workshop was machinery broke down which hap-pened when maintenance was interrupted as a result of machinery necessary to performmaintenance malfunctions.
5.6.1 5-Why analysis
The 5-Why method was used to identify the root causes of the reasons for interruptionsof maintenance, according to the theory presented by Serrat (2017) in chapter 2.
The following four types of causes of delays were investigated using the 5-why method.
1. The OEM takes too long to deliver its service to the MRO workshop.
2. The MRO workshop places orders to the OEM too late.
3. Service parts spend too much time in inventory.
4. Machines brake down.
The OEM takes too long to deliver its service to the MRO workshop
The lead time analysis showed that the OEM takes too much time to deliver its service tothe MRO workshops. As the aggregated timelines illustrated in figures 5.5, figure 5.6, andfigure 5.7, the OEM takes more time to deliver their service to the MRO workshop thanthe time allocated for Saab to complete the maintenance of the service part. This makes itimpossible for the MRO workshops to deliver maintained service parts on time. Togetherwith the lead time analysis and interviews of operative planners and purchasers at SaabSupport & Services the 5-why method was conducted. The complete 5-why analysis isshown in table 5.4 and began with the question: Why does it take too long for OEM todeliver its service to the MRO workshops?
Question Answer
Why?Because there is no incentivefor OEM to deliver on time
Why?The OEM does not loose anythingif they do not deliver on time
Why?Saab does not have any contracts thatstates that the OEM’s have to deliver on time
Table 5.4: Root cause analysis - Late deliveries from OEM
52

5.6. ROOT CAUSE ANALYSIS Master Thesis
The lead time analysis showed that late deliveries from OEM was the single largest sourceof delays of unplanned maintenance in 2019. As shown in table 5.2, external delay at OEMis responsible for 57% of the downtime caused by interruptions. The lead time analysisshowed that the interruptions caused by stock-outs also led to delays largely due to thefact that OEM’s are delivering their services to the MRO workshops too late.
The root cause analysis showed that the reason that services from the OEM are delayedis that Saab does not currently have strictly written contracts with their OEM’s to ensurethat they deliver within a specified time frame. If contracts were used, Saab could ensurethat the MRO workshops are able to complete the maintenance of service parts in time.Interviews with strategic purchasers at Saab Support & Services revealed that Saab isusing contracts that specify the expected lead time for some of their OEM’s. However,these expected lead times do not match the expected maintenance lead times in the MROworkshops. For example, service part 2 has an expected maintenance lead time of 30working days, but the OEM who provides maintenance of sub-units is allowed 90 workingdays to repair the sub-units. In addition to this, Saab never issues penalty fines to theirOEM’s if they are late. Holweg et al. (2005) discusses the importance of synchronizing thedifferent parts of a supply chain. To synchronize the OEM’s with the MRO workshops,Saab needs to use contracts that specify the expected lead time for the service that theOEM provides the MRO workshops with. It is important that these expected lead timesfrom the OEM’s match the expected maintenance lead times in the MRO workshop inorder to synchronize the different parts of the service parts supply chain, as this wouldensure that Saab has the capability to deliver maintained service parts to their customersin time. In addition to synchronizing the expected lead times, Saab should start issuingpenalty fines based on delays to their OEM’s. While this will not directly reduce thedelay of service part maintenance, it will incentives the OEMs to deliver on time, andbalance out the penalty fine Saab needs to pay to their customers, effectively eliminatingthe negative effect of these delays from Saab’s financial perspective.
The MRO workshop places orders to the OEM too late
The lead time analysis of the aggregated timelines of service parts that were delayed byinternal stock-outs of spare parts and sub-units shown in figure 5.5 and figure 5.6 revealedthat one type of waste was that orders to OEM were placed too late. Both types had anaverage waiting time between arrival inspection and fault isolation of about 3 weeks. Theoperative planners currently only place orders for OEM services after the completion offault isolation as this process shows what type of maintenance is required to restore theservice part to a normal condition. The 5-why analysis is shown in table 5.5.
53

5.6. ROOT CAUSE ANALYSIS Master Thesis
Question Answer
Why?Because the operative planner at the MRO workshopwas not aware of the need of OEM services in time.
Why? Because fault isolation was conducted too late.
Why?Because the MRO workshop had not planned for thearrival of service parts in need of unplanned maintenance.
Why?The operative planner at the MRO workshop was not awareof the need of unplanned maintenance before the service partphysically arrived at the MRO workshop.
Why?The operative planner at the MRO workshop did not receiveany information about incoming service parts in need of unplanned maintenance.
Why?The data from the technical report was not used to provide the operative plannerwith information about incoming orders.
Table 5.5: Root cause analysis - Late orders to OEM
The challenges with unplanned maintenance are to predict which type of maintenance willbe needed for each unit of different service parts, and what type of spare parts that will berequired to perform this maintenance. This makes planning the procurement of spare partsand other resources difficult for the operative planners at the MRO workshops. Meissneret al. (2002) states that the operative planners at the MRO workshops have to be notifiedabout the need for maintenance of a service part as soon as possible to plan the resourcesneeded to perform maintenance. Tracht et al. (2013) states that it is very hard to estimateunplanned maintenance, compared to the planned maintenance. This is because of thecomplexity and variety of demand for unplanned maintenance which makes forecastingwhen unplanned maintenance will be needed difficult. If incomplete or no information isgiven to the operative planners, this can lead to an increased risk of stock-outs, or theother way around, too much inventory due to over-purchasing (Khandelwal 2011).
According to Sandberg (2015), having a well-functioning supply chain is important ina competitive market, and services such as support and logistics are in some situationseven more important than the actual core product. Dyer & Nobeoka (2000) states thatcollaborative planning and information sharing is possible in a connected network if theright collaboration strategy is used. Holweg et al. (2005) explains that the goal of suchstrategies is, among other things, to increase synchronization between the different actorsin a supply chain.
There is no information given to inform the operative planners that a service part inneed of unplanned maintenance is on its way to the MRO workshop. The technicalreport contains information about the date on which a service part was removed fromthe aircraft. The blue bars in the aggregated timelines illustrated in figures 5.5, 5.6,5.7, and 5.8 illustrates the time between the removal of the service part and its arrivalto the MRO workshop. The fault description that is included in the technical report isa description of what problems that the pilot or mechanics at the airbase have found.This fault description could give the operative planners an indication of what type ofmaintenance is required. This information could be useful to the operative planners asit would allow them to make informed decisions about planning for the maintenance ofincoming service parts before they physically arrive at the MRO workshop. This wouldallow the operative planners to better plan the operations for unplanned maintenance at
54
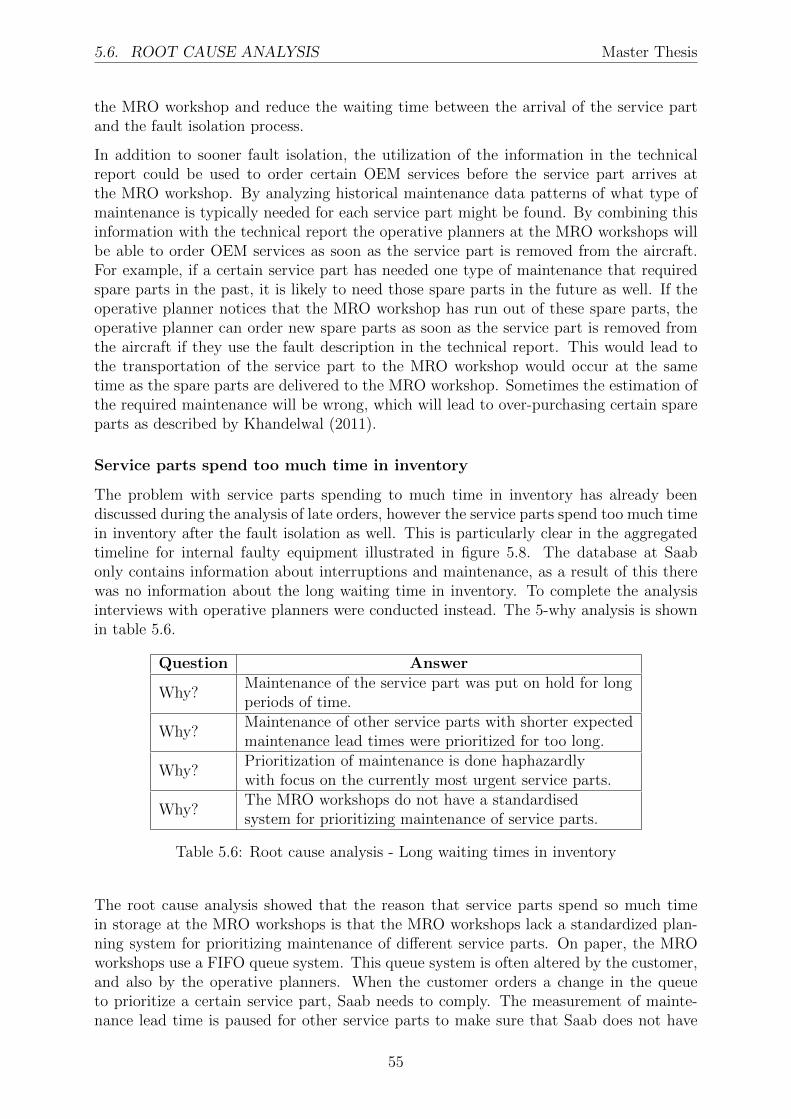
5.6. ROOT CAUSE ANALYSIS Master Thesis
the MRO workshop and reduce the waiting time between the arrival of the service partand the fault isolation process.
In addition to sooner fault isolation, the utilization of the information in the technicalreport could be used to order certain OEM services before the service part arrives atthe MRO workshop. By analyzing historical maintenance data patterns of what type ofmaintenance is typically needed for each service part might be found. By combining thisinformation with the technical report the operative planners at the MRO workshops willbe able to order OEM services as soon as the service part is removed from the aircraft.For example, if a certain service part has needed one type of maintenance that requiredspare parts in the past, it is likely to need those spare parts in the future as well. If theoperative planner notices that the MRO workshop has run out of these spare parts, theoperative planner can order new spare parts as soon as the service part is removed fromthe aircraft if they use the fault description in the technical report. This would lead tothe transportation of the service part to the MRO workshop would occur at the sametime as the spare parts are delivered to the MRO workshop. Sometimes the estimation ofthe required maintenance will be wrong, which will lead to over-purchasing certain spareparts as described by Khandelwal (2011).
Service parts spend too much time in inventory
The problem with service parts spending to much time in inventory has already beendiscussed during the analysis of late orders, however the service parts spend too much timein inventory after the fault isolation as well. This is particularly clear in the aggregatedtimeline for internal faulty equipment illustrated in figure 5.8. The database at Saabonly contains information about interruptions and maintenance, as a result of this therewas no information about the long waiting time in inventory. To complete the analysisinterviews with operative planners were conducted instead. The 5-why analysis is shownin table 5.6.
Question Answer
Why?Maintenance of the service part was put on hold for longperiods of time.
Why?Maintenance of other service parts with shorter expectedmaintenance lead times were prioritized for too long.
Why?Prioritization of maintenance is done haphazardlywith focus on the currently most urgent service parts.
Why?The MRO workshops do not have a standardisedsystem for prioritizing maintenance of service parts.
Table 5.6: Root cause analysis - Long waiting times in inventory
The root cause analysis showed that the reason that service parts spend so much timein storage at the MRO workshops is that the MRO workshops lack a standardized plan-ning system for prioritizing maintenance of different service parts. On paper, the MROworkshops use a FIFO queue system. This queue system is often altered by the customer,and also by the operative planners. When the customer orders a change in the queueto prioritize a certain service part, Saab needs to comply. The measurement of mainte-nance lead time is paused for other service parts to make sure that Saab does not have
55

5.6. ROOT CAUSE ANALYSIS Master Thesis
to pay penalty fines as a result of the customers request. But the customer is not alonein altering the maintenance queue at the MRO workshop, as this is frequently done bythe operative planners as well. The sequence of service parts that shall be maintained isaltered regularly which leads to inefficient work and the fact that service parts spend toomuch time in storage between maintenance processes. The prioritization technique de-scribed by Hatton (2007) could be used in an MRO workshop environment to ensure thata systematic approach is used to select which service parts to maintain first in a changingMRO environment. The use of a systematic approach when planning maintenance ofservice parts would ensure that fewer service parts were delayed as a result of spendingtoo much time in storage. Saab could rank the different service parts according to theirdue date, lead times of maintenance processes, and possible penalty fines induced shouldthe service part be delayed. This would help the operative planners to make informedand structured decisions when planning with the purpose of reducing penalty fines. Incases where a delay is inevitable, the service part that would induce the highest penaltyfine should be prioritized.
Machines brake down
The lead time analysis of the aggregated timeline of the service parts that were interruptedby machinery break down illustrated in figure 5.8 showed that the broken machinery wasrepaired relatively quickly and that this was actually not the major cause of the delay.This is shown in table 5.2 which shows that interruptions caused by internal faulty ma-chinery represent 15% of all interruptions, but only 1% of the downtime caused by thatinterruption. The problem was not that the machines broke down, as the service partswould on average have been delayed nonetheless due to long times in inventory. Despitethe fact that machine breakdowns are not causing very long delays, it is worth investi-gating how they can be reduced. In order to find out why machines broke down duringmaintenance in the MRO workshop, MRO planners and operators were interviewed. The5-why analysis is shown in table 5.7.
Question AnswerWhy? Because the machinery is used until it breaks down.
Why?Because the operators at the MRO workshops arecurrently unable to predict these types of breakdowns.
Why?Because they do currently not have a method forpredicting breakdowns of machinery.
Table 5.7: Root cause analysis - Machinery broke down
As these break-downs affect the efficiency of the MRO workshops in a negative way, it isrecommended to predict machinery break-downs in the future, such as through machinelearning as proposed by Kohli (2017) or infrared thermography as suggested by Epperlyet al. (1997). The method of machine learning suggested by Kohli (2017) is a highlytechnological solution that requires a large amount of sensors and a system that canhandle big data. Data collected from the machines using the sensors would allow theoperators at the MRO workshop to predict breakdowns before they occur. The methodsuggested by Epperly et al. (1997) is a more practical solution that involves measuring thesurface temperature of the machines in order to detect heat patterns that might reveal
56

5.6. ROOT CAUSE ANALYSIS Master Thesis
a cause of a breakdown before it happens. This method is only viable where the wearof the machine can be correlated to the surface temperature of the machine when it isused. These are two different approaches to predicting breakdowns and the need formaintenance before the breakdown occurs.
Summary of the root cause analysis
The root cause analysis identified the four following root causes for delays of unplannedmaintenance.
• Saab did not have any contracts that states that the OEM’s have to deliver on time.
• The data from the technical reports were not used to provide the operative plannersat the MRO workshops with information about incoming orders.
• The MRO workshops did not have a standardized system for prioritizing mainte-nance of service parts.
• The MRO workshops did not use methods to predict breakdowns of certain ma-chines.
57

Chapter 6
Conclusions
This part of the report presents a discussion of the chosen methods used during this masterthesis, as well as ethics, and sustainability related to the study. This chapter also includesthe conclusions of the study and the answers to the research questions. A generalizationof the findings from the study is also presented.
This master thesis was conducted at one case company, by only investigating one companythere will be limitations regarded how the conclusions and recommendations have beengeneralized. This master thesis can be seen as an inspiration for how this case study hasbeen conducted.
The need of collecting data is recommended to be able to make decisions based on in-formation. By using standardization information, decisions can be made faster whichwill reduce lead times. However, collecting this amount of data will cause companiesto invest in software and educate their personal to get all the information. So, even ifthis study was conducted at just one case company, the methods used to find the rootcauses for delays of unplanned maintenance in an MRO workshop can be used by othercompanies as well. Furthermore, the recommendations presented in this master thesis,though specifically formulated for Saab, can be implemented by other companies whosell service contracts to their customers. For example, using contracts to synchronizelead times and penalty fines within a service parts supply chain is not a solution thatis unique to Saab. Another recommendation is that Saab should use the information inthe technical report to plan operations at their MRO workshop. This recommendationbuilds on the principle that information should be shared within a system and used toplan for future activities, and can thus be implemented in any organization with minorsituational adjustments to provide all parts of the organization with useful information.Any company will have an easier time making decisions if they use a standardized prior-itization system, and any company that uses machinery to provide their customers withvalue can benefit from predicting and preventing breakdowns before they occur. For thisreason, the recommendations presented in this master thesis are applicable to companiesthat use MRO workshops to provide their customers with maintenance services.
The suggestions that have been given to Saab are improvements related to reducing thelate deliveries of service parts from the MRO. These implementations will need to beimplemented from the management of the division within Support & Services. Theseimplementations will reduce delays, which will lead to reduced penalty fines.
58

Master Thesis
The biggest challenge during the thesis was initially when the problem was given tothe researchers, the problem description was that data was not utilized. The LogisticsEngineering Department of Gripen Support highlighted that there were some problemswith the service supply chain, but not specifically what. The first task was to map thecurrent state to identify where the problem occurred and to get a deeper understandingof the scope. This required a lot of time and 16 people were interviewed to get a widerpicture of the scope. This caused the thesis to jump from one direction one week, toanother one the next.
This could have been eliminated by understanding the boundaries of the problem, as thiswould have helped to gain an overall understanding of which people were involved andto understand whom to interview. Another thing that could have been done differently,would have been to make the trip to MRO1 much earlier and also tried to visit MRO2.During this thesis, only three trips were made to MRO1, and the first one was made aftera few weeks. This could have helped to understand the material and information flow inan MRO workshop. Last but not least, the software used to find all the data should havebeen installed much earlier, because when it was needed it caused some problem and tooksome time to sort it out.
During the planning phase, the researchers decided to delimit all the data collection fromMRO2, because of the limit of time but also from interviews from Saab employees thatstated the highest volume and highest penalty fines were from MRO1. When the phasewent over to collecting and analyzing data, the researchers found out that Service Part1 and 2 that stood for most of the penalty fines came from MRO2. This changed thefocus of the scope and the researchers decided to include both MRO1 and MRO2 in theanalysis. This states that it is very important to not only trust the information givenfrom interviews but to also clarify it with secondary data, if possible.
The literature in the area of unplanned maintenance of service parts in an MRO workshopis very scarce. This master thesis has contributed to research within the area of usingexisting methods to analyze the service part supply chain in the MRO workshop to reducelead times using one company as a case study.
Initially, the researches planned to visit the MRO workshops, and at least one airbaseat a customer. However, these visits were canceled due to the out-brake of the Covid-19 virus. This caused problems as the researchers were unable to make observations atthe MRO workshops, and because some interviews could not be conducted in person. Ifthe situation would have been different, a more detailed analysis of the information flowwithin the MRO workshops would have been possible.
In detail, this master thesis aimed to understand how maintenance lead times for serviceparts in need of unplanned maintenance could be reduced, and in particular, how theinformation flow in the MRO supply chain could be utilized to improve the current systemat Saab.
The purpose of this master thesis was to develop improvement suggestions for how toreduce delays of unplanned maintenance for service parts in an MRO workshop, theserecommendations are presented in section 6.2.
Delays of unplanned maintenance is an important issue for Saab to solve for severalreasons; most obviously as the current delays result in substantial financial losses in theform of penalty fines. Saab will benefit in other ways in addition to saving money. By
59

6.1. ANSWERS TO RESEARCH QUESTIONS Master Thesis
improving Saab’s ability to provide maintenance in time, customer relations and thecompany’s reputation can improve. This improvement should increase the probability ofdoing profitable business in the future as well.
6.1 Answers to research questions
6.1.1 Research Question 1
What service parts have an impact on the penalty fines at Saab and how lateare they?
Out of all the 600 service parts that can be removed in Gripen C/D, 82 of them hadan impact on the penalty fines Saab paid in 2019. These 82 service parts are shown inAppendix D along with their contribution to penalty fines in 2019. It is not possible toanswer in a general manner how late the service parts are due to the large variety indelays between different units and service parts. The delays vary between a few days toover a year. An ABC analysis showed that 16 of the service parts were the source of 86% of the total penalty fines in 2019. The delay of each unit from the 16 service parts isshown in appendix E.
6.1.2 Research Question 2
Why are these service parts delayed?
The lead time analysis in chapter 5 showed that there were four types of interrup-tions.
• Internal stock-out of spare parts
• Internal stock-out of sub-units
• Internal faulty machinery
• External delay at OEM
Each type of interruption was related to at least one cause of delay, which were analyzedin a root cause analysis using the 5-why method. The root cause analysis showed thatthe delays were caused by the following problems:
• Saab does not have any contracts that forces the OEM’s to deliver on time.
• The data available in the technical report is not used to provide the operativeplanners with information about incoming orders.
• The MRO workshops do not have a standardized. system for prioritizing mainte-nance of service parts.
• The MRO workshops do not have a method for predicting breakdowns of machinery.
6.1.3 Research Question 3
How can information be utilized by an MRO workshop to synchronize allparts of its service parts supply chain and reduce delays for unplanned main-tenance?
60

6.2. RECOMMENDATIONS TO SAAB Master Thesis
If the data that is given by the customer in the technical report when a service part isremoved from an aircraft is used to provide the operative planners at the MRO workshopswith information about incoming service parts in need of unplanned maintenance, thedelays of unplanned maintenance should be reduced. The operative planners at the MROworkshops should be given information about the identification number of the incomingservice part, when the service part was shipped and when it is expected to arrive at theMRO workshop, the fault description that gives information about why the service partneeds maintenance, the maintenance deadline, and the priority rank of the service part.This information will allow the MRO workshop to be more proactive when maintainingservice parts in need of unplanned maintenance.
6.2 Recommendations to SAAB
Since the study was initiated by Saab Support & Services to gain a greater understandingof how to reduce the long delays for unplanned maintenance of service parts, the followingrecommendations have been formulated. The recommendations are actions that can beimplemented by Saab Support & Services to reduce the delays of service parts in need ofunplanned maintenance and reduce penalty fines.
The following recommendations should be implemented for the 16 service parts in categoryA from the ABC-analysis in chapter 5. Since these service parts were the source of 86 %of the penalty fines paid in 2019, they should be the focus of improvements. When therecommendations have been implemented for the A-class service parts, Saab can continuedoing this for other service parts according to their ranking shown in appendix D.
6.2.1 Contracts
In order to better synchronize the activities within the service parts supply chain witheach other, the OEM contracts should be updated. The expected lead time for the OEMmust be synchronized with the expected lead time at the MRO workshops to ensure thatservice parts can be delivered on time. In addition to this, Saab should include penaltyfines in the contracts with the OEM’s to ensure that they deliver their services on time.If a service part is delayed and Saab needs to pay a penalty fine to the customer as aresult of a delay at the OEM, this fine should be directly transferred to the OEM.
6.2.2 Service Part Prioritization
There will be times when the MRO workshops can not deliver all service parts on time.In such times difficult choices must be made regarding which service parts to prioritize. IfSaab were to formulate a prioritization strategy these choices would become mere routines.Such a strategy could rank the service parts based on attributes such as their deadlines,expected maintenance lead time, and related penalty fines if the service part should bedelayed. In a scenario where two service parts need maintenance, but the MRO workshopcan only deliver one of them on time, the service priority number will determine which ofthe two service parts gets maintained first, and which gets delayed.
61

6.2. RECOMMENDATIONS TO SAAB Master Thesis
6.2.3 Utilizing the Data
Saab receives large amounts of data regarding service parts from their customers in tech-nical reports whenever a service part is removed from an aircraft. These technical reportsshould be used to provide the operative planners at the MRO workshop with the informa-tion they need to plan for the arrival of service parts in need of unplanned maintenance.The information in the technical report can be combined with historical data regard-ing what type of maintenance a certain service part usually needs. This would allowthe operative planners to prepare the arrival inspection and fault isolation processes, aswell as notify the operative purchasers that certain OEM services will be needed whenthe service part arrives, and sometimes ordered before the physical arrival of the servicepart. This would allow the MRO workshop to be more proactive rather than reactiveto unplanned maintenance. This will lead to reduced waste as service parts in need ofunplanned maintenance will spend less time in storage, waiting for these processes to beavailable.
The MRO workshops should be notified with the following information when a servicepart is removed from an aircraft in order to prepare for the arrival of service parts asdescribed above:
1. The identification number of the service part - This information can be usedto check if the service part should be maintained at the MRO workshop or sent toits OEM, as well as what type of maintenance the MRO workshop can expect todo.
2. When the service part will be shipped and when it is expected to arrive- This information can be used to make operational plans at the MRO workshopand make sure that sufficient capacity is available.
3. Fault description that gives information about why the service part needsmaintenance - This information can be used by the MRO workshop to be betterprepared for what needs to be done to restore the service part to a functionalcondition. Historical maintenance data can be used in combination with this datato check if there are patterns in the type of maintenance required. This would allowthe operative purchasers to place orders for OEM services that have been neededin the past and are likely to be needed when the service part arrives at the MROworkshop.
4. Maintenance Deadline - The latest day maintenance of the service part must becompleted.
5. Service priority - A prioritization of each service part should be included in orderto use a systematic approach to select which service part to maintain first.
6.2.4 Predicting Machine Breakdowns
Zhang et al. (2017) states that by combining historical maintenance data with real-timedata, the interrelationship between different parts of the product life cycle can be identifiedand the breakdown of a machine can be predicted which allows for maintenance actionsto be taken in order to prevent the breakdown before it actually occurs. This combinationis important of uncovering hidden patterns and determine the current state of a machine.This will bring valuable knowledge and useful information to managers and help them
62

6.2. RECOMMENDATIONS TO SAAB Master Thesis
make information-based decisions. To be able to capture this type of real-time data, Renet al. (2019) claims that sensors, internet of things and big data analytics in all stages ofthe product life cycle have to be fully utilized. This could turn unplanned maintenanceinto planned maintenance.
6.2.5 Recommendation prioritization
The four different types of interruptions are shown in table 6.1 below. As shown, theinterruption that caused the longest delays was external delays at OEM. The root causeanalysis showed that the only root cause to this type of delay was that Saab lacks contractsthat states that the OEM’s have to deliver their services on time. Implementing contractsfor each OEM that specifies an expected lead time and penalty fine will reduce the numberof delays at OEM’s. This recommendation will also benefit two internal stock-outs, asthese the lead time analysis showed that these interruptions were also related to latedeliveries from Saab’s OEM’s. As a result of this, it is recommended that the contractsare implemented first. This recommendation would not be easy to implement as it requiresa lot of work regarding writing unique contract with each individual OEM, but it wouldreduce the delays greatly, as the majority of the delays are caused by late deliveries fromthe OEM’s.
The second most important recommendation is the utilization of the data available inthe technical report. As shown in the lead time analysis, this improvement would benefitthe MRO workshops in all situations, both in terms of planning and execution. Thisrecommendation would be easy to implement as all the data is available in the currentsystem and just needs to be utilized.
The third most important recommendation to implement is the prioritization system forservice parts. This recommendation would reduce the amount of time service parts spendsidle in inventory at the MRO workshops when maintenance work could be performed. Thisrecommendation is estimated to be both cheap and easy to implement, as it only requiresa small change in how operative planning is done at the MRO workshops.
The least important recommendation to implement is to predict machine breakdowns, asthis interruption is only responsible for 1 % of the delays caused by interruptions. Thisrecommendations is also estimated to be both expensive and difficult to implement.
Type of Interruption Share of Interruptions Share of TimeExternal Delay at OEM 38 % 57 %Internal stock-out (sub-units) 22 % 24 %Internal stock-out (spare parts) 25 % 18 %Internal machinery breakdown 15 % 1 %
Table 6.1: Types of interruptions
• Contracts
• Utilizing the Data
• Service Part Prioritization
• Predicting Machine Breakdowns
63

6.3. ETHICS AND SUSTAINABILITY Master Thesis
6.3 Ethics and Sustainability
6.3.1 Ethics
It is important that the management of the company understands the ethical implicationswhen implementing the recommendations presented in this master thesis. The ethicalimplications of working in the defense industry are many, and are worth considering.Saab considers it a human right to feel safe, and claims that their products and servicesprotects society and makes people feel safe. Saab works vigorously with export control tomake sure that their products do not end up in ”the wrong hands”.
6.3.2 Sustainability
Sustainability plays an important role in modern society and companies must take it intoconsideration when conducting their business. According to Assembly (2005), there arethree main goals in terms of sustainable development. These three are social, economical,and environmental sustainability. All aspects need to be fulfilled simultaneously if acompany wishes to be considered to be a fully sustainable company. Long term thinkingis needed to achieve sustainable development, which is something that Saab does naturally,as most of their projects span several decades.
Economic Sustainability
The main purpose of this study was to analyze delays of unplanned maintenance andsuggest improvements that would reduce the delays of unplanned maintenance of serviceparts. This is very important for Saab as these improvements can reduce the penaltyfines induced by the delays in their MRO workshops. Since the company is working withvery expensive products and the service contracts that they sell to customers often lastfor 20-30 years, these implementations will have a positive impact on the economy in thelong run. The implementations will help the company to reduce the delays of unplannedmaintenance will not only benefit the company but also their customers. By implementingthe improvements the company will be able to reduce delays of unplanned maintenanceas well as reduce the occurrence of errors in the MRO workshops and for the OEM fromwhich the company will benefit financially in the future.
Social Sustainability
Some of the improvements may cause some negative impact on the employees due tochanged and added work tasks. This will require effort from the management to makesure that the implementations are not causing too much stress on the staff. The man-agement has to make sure that they encourage and educate all their employees so thatthey are prepared for the implementation of new routines. By working in this mannerthe company will be able to work with cooperative employees that are comfortable withthe change working. The positive aspect of educating their employees, is that the man-agement can create meaningful work for the employees and make the employees proud oftheir work.
64

6.4. FUTURE WORK Master Thesis
Environmental Sustainability
Saab works with three main areas regarding environmental sustainability. Reducing theircontributions to greenhouse gas emissions, phase out the use of hazardous substances,and improving their resource efficiency (SAAB 2018). It is difficult to tell if the improve-ments suggested in this master thesis will contribute to a change in Saab’s environmentalsustainability, but hopefully Saab’s resource efficiency will improve as a result of theseimprovements.
6.4 Future Work
This master thesis has addressed how to reduce delays of unplanned maintenance in anMRO workshop in the context of a service parts supply chain through the utilizationof data. The nature of unplanned maintenance is just that, unplanned. The solutionspresented in this master thesis can help companies become more proactive, but the methodis still reactive in a certain way. The next step is to find a way to eliminate the need forunplanned maintenance. For this reason, we recommend future research on how to predictbreakdowns using the internet of things and big data analytic. This would give companiesinformation about the current state of all service parts in real-time and allow them toremove service parts just in time before a breakdown occurs. Big data analytics andmachine learning could also be used to predict breakdowns of machinery and equipmentinside MRO workshops.
This master thesis excluded the internal operative planning at the MRO, this should belooked into further to optimize the work flow of the MRO workshop. A recommendationwould be to make a Value Stream Mapping of the work flow to reduce time that isconsidered non-value adding in the MRO workshop.
This master thesis aimed to synchronize the activities in the different parts of the serviceparts supply chain through efficient information sharing from the perspective of the MROworkshops. If Saab were to optimize the supply chain on a higher level to truly reach aglobal optimum rather than a set of local optimal solutions, the efficiency of the serviceparts supply chain would increase further.
65

Bibliography
Ashton, K. et al. (2009), ‘That ‘internet of things’ thing’, RFID journal 22(7), 97–114.
Assembly, U. N. G. (2005), ‘2005 world summit outcome, resolution a/60/1, adopted bythe general assembly on 15 september 2005.’.
Axinn, W. G. & Pearce, L. D. (2006), Mixed method data collection strategies, CambridgeUniversity Press.
Barwise, J. & Seligman, J. (1997), Information flow: the logic of distributed systems,Vol. 44, Cambridge University Press.
Benhabib, B. (2003), Manufacturing: design, production, automation, and integration,CRC Press.
Brook, Q. (2017), Lean Six Sigma & Minitab: The complete toolbox guide for businessimprovement, OPEX Resources Limited.
Bryman, A. & Bell, E. (2003), ‘Breaking down the quantitative/qualitative divide’, Busi-ness Research Methods 2(1), 465–478.
Carter, C. R., Rogers, D. S. & Choi, T. Y. (2015), ‘Toward the theory of the supplychain’, Journal of Supply Chain Management 51(2), 89–97.
Dwivedi, A. & Butcher, T. (2008), Supply chain management and knowledge management,Springer. (pages 8-9 ).
Dyer, J. H. & Nobeoka, K. (2000), ‘Creating and managing a high-performance knowledge-sharing network: the toyota case’, Strategic management journal 21(3), 345–367.
Eisenhardt, K. M. (1989), ‘Building theories from case study research’, Academy of man-agement review 14(4), 532–550.
Epperly, R. A., Heberlein, G. E. & Eads, L. G. (1997), A tool for reliability and safety:predict and prevent equipment failures with thermography, in ‘Record of ConferencePapers. IEEE Industry Applications Society 44th Annual Petroleum and ChemicalIndustry Conference’, IEEE, pp. 59–68.
Flores, B. E. & Whybark, D. C. (1986), ‘Multiple criteria abc analysis’, InternationalJournal of Operations & Production Management .
Forza, C. (2002), ‘Survey research in operations management: a process-based perspec-tive’, International journal of operations & production management .
66

BIBLIOGRAPHY Master Thesis
Ganesh, K., Mohapatra, S., Anbuudayasankar, S. & Sivakumar, P. (2014), Enterpriseresource planning: fundamentals of design and implementation, Springer. (pages 1-4).
Goldsby, T. J. & Martichenko, R. (2005), Lean six sigma logistics: Strategic developmentto operational success, J. Ross Publishing.
Gordon, N. J. & Fleisher, W. L. (2010), Effective interviewing and interrogation tech-niques, Academic Press.
Graves, S. C. (1999), ‘Manufacturing planning and control’, Massachusetts institute oftechnology pp. 1–26.
Hatton, S. (2007), Early prioritisation of goals, in ‘International Conference on ConceptualModeling’, Springer, pp. 235–244.
Hill, A. & Hill, T. (2009), Manufacturing operations strategy, Palgrave Macmillan.
Holweg, M., Disney, S., Holmstrom, J. & Smaros, J. (2005), ‘Supply chain collaboration::Making sense of the strategy continuum’, European management journal 23(2), 170–181.
Jacka, J. M. & Keller, P. J. (2009), Business Process Mapping: Workbook, Wiley OnlineLibrary.
Jacobs, F. R., Berry, W. L., Whybark, D. C., Vollmann, T. E. & Vollmann, T. (2018),Manufacturing planning and control for supply chain management, The CPIM Refer-ence, Second Edition, McGraw-Hill Education.
John, W. & Creswell, P. C. (2000), Designing and conducting mixed methods research,SAG.
Karlsson, C. (2009), Researching Operations Management, Routledge, United Kingdom,pp. 6–41. Trykt i løbenummer: 092160.
Khandelwal, L. (2011), ‘Mro supply chain optimization in manufacturing and utility in-dustries’.
Kilpi, J., Toyli, J. & Vepsalainen, A. (2009), ‘Cooperative strategies for the availabilityservice of repairable aircraft components’, International Journal of Production Eco-nomics 117(2), 360–370.
Kohli, M. (2017), ‘Using machine learning algorithms on data residing in sap erp applica-tion to predict equipment failures’, International Journal of Engineering & Technology7(2.28), 312–319.
Levitt, T. (1993), ‘The globalization of markets’, Readings in international business: adecision approach 249. (pages 249-252).
Liberatore, M. J. (2012), Supply chain planning: practical frameworks for superior per-formance, Business Expert Press.
Manuj, I. & Mentzer, J. T. (2008), ‘Global supply chain risk management strategies’,International Journal of Physical Distribution & Logistics Management .
67

BIBLIOGRAPHY Master Thesis
Marx-Gomez, J., Rautenstrauch, C., Nurnberger, A. & Kruse, R. (2002), ‘Neuro-fuzzyapproach to forecast returns of scrapped products to recycling and remanufacturing’,Knowledge-Based Systems 15(1-2), 119–128.
Meissner, A., Luckenbach, T., Risse, T., Kirste, T. & Kirchner, H. (2002), Design chal-lenges for an integrated disaster management communication and information system,in ‘The First IEEE Workshop on Disaster Recovery Networks (DIREN 2002)’, Vol. 24,pp. 1–7.
Melin, U. (2002), Koordination och informationssystem i foretag och natverk, PhD thesis,Linkoping University Electronic Press.
Mentzer, J. T., DeWitt, W., Keebler, J. S., Min, S., Nix, N. W., Smith, C. D. &Zacharia, Z. G. (2001), ‘Defining supply chain management’, Journal of Business logis-tics 22(2), 1–25.
Merriam, S. B. (1998), Qualitative Research and Case Study Applications in Education.Revised and Expanded from” Case Study Research in Education.”., ERIC.
Mirzahosseinian, H. & Piplani, R. (2011), ‘A study of repairable parts inventory sys-tem operating under performance-based contract’, European Journal of OperationalResearch 214(2), 256–261.
Mobley, R. K. (2002), An introduction to predictive maintenance, Elsevier.
Mobley, R. K. (2004), Maintenance fundamentals, Elsevier.
Morris, M. H. & Fuller, D. A. (1989), ‘Pricing an industrial service’, Industrial MarketingManagement 18(2), 139–146.
Muckstadt, J. A. (2004), Analysis and algorithms for service parts supply chains, SpringerScience & Business Media.
Olhager, J. & Wikner, J. (2000), ‘Production planning and control tools’, ProductionPlanning & Control 11(3), 210–222.
Oskarsson, B., Aronsson, H. & Ekdahl, B. (2013), Modern logistik: for okad lonsamhet,Liber.
Parthasarthy, S. (2007), Enterprise resource planning: a managerial & Technical perspec-tive, New Age International.
Patel, R. & Davidson, B. (2003), Forskningsmetodikens grunder. Att planera, genomforaoch rapportera en undersokning., Studentlitteratur.
Ren, S., Zhang, Y., Liu, Y., Sakao, T., Huisingh, D. & Almeida, C. M. (2019), ‘A compre-hensive review of big data analytics throughout product lifecycle to support sustainablesmart manufacturing: A framework, challenges and future research directions’, Journalof cleaner production 210, 1343–1365.
Rogers, D. S. & Tibben-Lembke, R. (2001), ‘An examination of reverse logistics practices’,Journal of business logistics 22(2), 129–148.
68

BIBLIOGRAPHY Master Thesis
Rogers, D. S., Tibben-Lembke, R. S. et al. (1999), Going backwards: reverse logisticstrends and practices, Vol. 2, Reverse Logistics Executive Council Pittsburgh, PA.
Russom, P. et al. (2011), ‘Big data analytics’, TDWI best practices report, fourth quarter19(4), 1–34.
SAAB (2018), Annual and sustainability report 2018, SAAB.
Saab Group (2020), https://saabgroup.com.
Sandberg, E. (2015), Logistik och strategi - For lonsamhet och tillvaxt, StudenlitteraturAB, Lund.
Sanders, N. (2016), Forecasting fundamentals, Business Expert Press.
Sanders, N. R. et al. (2013), The Definitive Guide to Manufacturing and Service Opera-tions: Master the Strategies and Tactics for Planning, Organizing, and Managing howProducts and Services are Produced, Pearson Education.
Saunders, M., Lewis, P. & Thornhill, A. (2007), ‘Research methods’, Business Students4th edition Pearson Education Limited, England .
Serrat, O. (2017), The five whys technique, in ‘Knowledge solutions’, Springer, pp. 307–310.
Srinivasan, M. M., Bowers, M. R. & Gilbert, K. C. (2014), Lean Maintenance Repair andOverhaul: Changing the Way You Do Business, McGraw Hill Professional.
Storhagen, N. G. (2003), Logistik: grunder och mojligheter, Liber ekonomi.
Tonks, P. & Flanagan, H. (1994), ‘Positioning the human resource business using servicelevel agreements’, Health manpower management 20(1), 13–17.
Tracht, K., Niestegge, A. & Schuh, P. (2013), ‘Demand planning based on performancemeasurement systems in closed loop supply chains’, Procedia CIRP 12, 324–329.
Van Weele, A. & Arbin, K. (2019), Inkop och supply chain management: analys, strategi,planering och praktik, Studentlitteratur AB.
Vidal, C. J. & Goetschalckx, M. (1997), ‘Strategic production-distribution models: Acritical review with emphasis on global supply chain models’, European journal of op-erational research 98(1), 1–18.
Voss, C. (2010), Case research in operations management, in ‘Researching operationsmanagement’, Routledge, pp. 176–209.
Wallace, W. et al. (1927), ‘Business forecasting and its practical application’.
Wilkins, D. J. (2002), ‘The bathtub curve and product failure behavior part one - thebathtub curve, infant mortality and burn-in’, Reliability Hot Wire 21.
Xia, F., Yang, L. T., Wang, L. & Vinel, A. (2012), ‘Internet of things’, Internationaljournal of communication systems 25(9), 1101.
69

BIBLIOGRAPHY Master Thesis
Yin, R. K. (2003), ‘Case study research design and methods third edition’, Applied socialresearch methods series 5.
Yin, R. et al. (1984), ‘case study research. beverly hills’.
Zhang, Y., Ren, S., Liu, Y. & Si, S. (2017), ‘A big data analytics architecture for cleanermanufacturing and maintenance processes of complex products’, Journal of CleanerProduction 142, 626–641.
Zhao, W. K., Zhang, C. & Zhao, X. (2013), Information system construction of spareparts supply based on supply chain, in ‘Advanced Materials Research’, Vol. 765, TransTech Publ, pp. 3245–3248.
70

Appendices
71

Appendix A
Keywords
The following keywords were used during the master thesis in order to find relevantliterature.
• Saab
• Maintenance
• Servicification in Manufacturing
• Planned Maintenance
• Unplanned Maintenance
• Corrective Maintenance
• Availability
• Service Parts Supply Chain
• Service Part
• Supply Chain Management
• Maintenance, Repair and Overhaul
• Lean MRO
• Reverse Logistics
• Manufacturing Planning and Control
• Enterprise Resource Planning
• Information Flow
• Forecasting
• Decision Support
• Predicting equipment failure
I

Appendix B
Interview Subjects - Planning
The following people were interviewed during the planning phase of the study.
• Lars Mattsson, Head of Logistics Engineering, Support & Services
• Martin Larsson, Logistics analytics, Support & Services
• Frida Liljenroth, Planning Manager, Support & Services
II
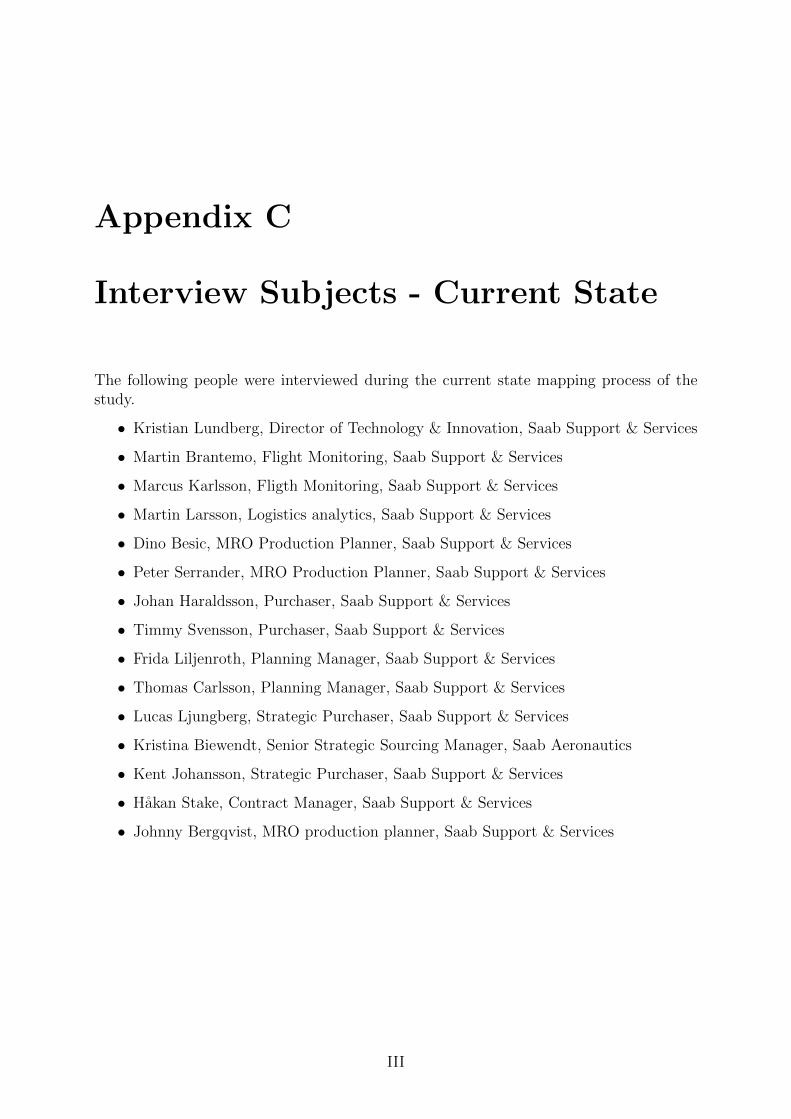
Appendix C
Interview Subjects - Current State
The following people were interviewed during the current state mapping process of thestudy.
• Kristian Lundberg, Director of Technology & Innovation, Saab Support & Services
• Martin Brantemo, Flight Monitoring, Saab Support & Services
• Marcus Karlsson, Fligth Monitoring, Saab Support & Services
• Martin Larsson, Logistics analytics, Saab Support & Services
• Dino Besic, MRO Production Planner, Saab Support & Services
• Peter Serrander, MRO Production Planner, Saab Support & Services
• Johan Haraldsson, Purchaser, Saab Support & Services
• Timmy Svensson, Purchaser, Saab Support & Services
• Frida Liljenroth, Planning Manager, Saab Support & Services
• Thomas Carlsson, Planning Manager, Saab Support & Services
• Lucas Ljungberg, Strategic Purchaser, Saab Support & Services
• Kristina Biewendt, Senior Strategic Sourcing Manager, Saab Aeronautics
• Kent Johansson, Strategic Purchaser, Saab Support & Services
• Hakan Stake, Contract Manager, Saab Support & Services
• Johnny Bergqvist, MRO production planner, Saab Support & Services
III
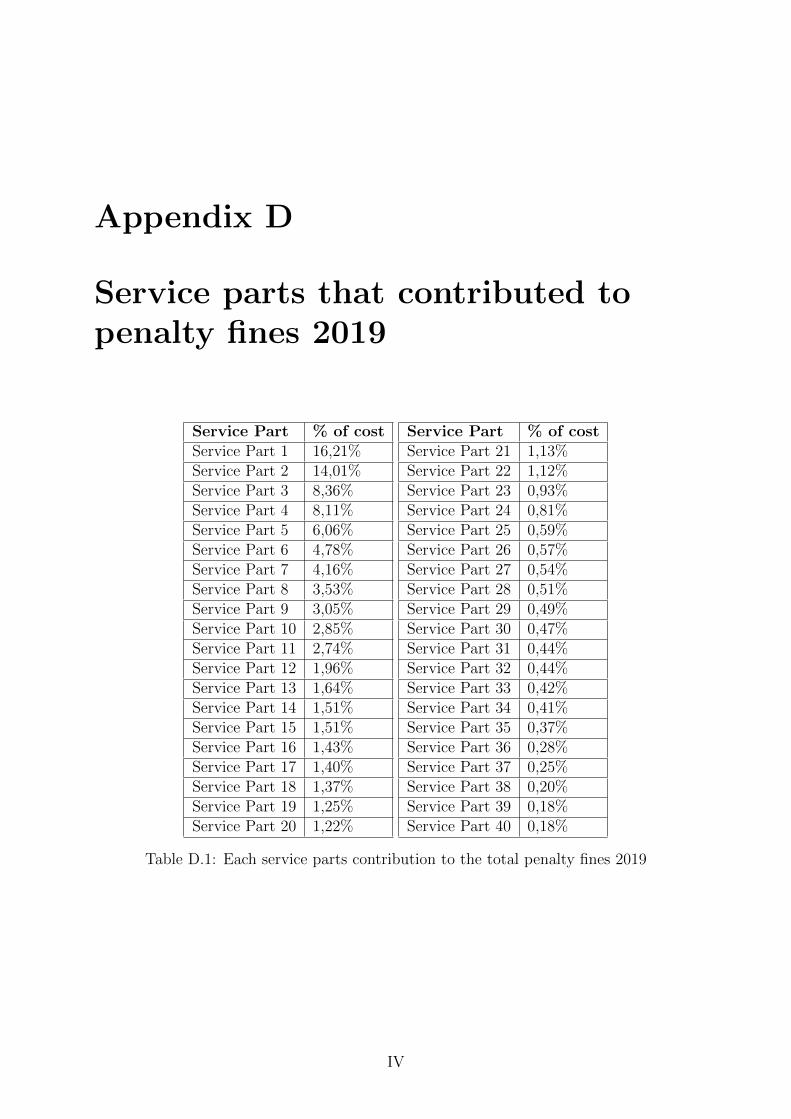
Appendix D
Service parts that contributed topenalty fines 2019
Service Part % of costService Part 1 16,21%Service Part 2 14,01%Service Part 3 8,36%Service Part 4 8,11%Service Part 5 6,06%Service Part 6 4,78%Service Part 7 4,16%Service Part 8 3,53%Service Part 9 3,05%Service Part 10 2,85%Service Part 11 2,74%Service Part 12 1,96%Service Part 13 1,64%Service Part 14 1,51%Service Part 15 1,51%Service Part 16 1,43%Service Part 17 1,40%Service Part 18 1,37%Service Part 19 1,25%Service Part 20 1,22%
Service Part % of costService Part 21 1,13%Service Part 22 1,12%Service Part 23 0,93%Service Part 24 0,81%Service Part 25 0,59%Service Part 26 0,57%Service Part 27 0,54%Service Part 28 0,51%Service Part 29 0,49%Service Part 30 0,47%Service Part 31 0,44%Service Part 32 0,44%Service Part 33 0,42%Service Part 34 0,41%Service Part 35 0,37%Service Part 36 0,28%Service Part 37 0,25%Service Part 38 0,20%Service Part 39 0,18%Service Part 40 0,18%
Table D.1: Each service parts contribution to the total penalty fines 2019
IV

Master Thesis
Service Part % of costService Part 41 0,16%Service Part 42 0,16%Service Part 43 0,16%Service Part 44 0,16%Service Part 45 0,14%Service Part 46 0,13%Service Part 47 0,13%Service Part 48 0,12%Service Part 49 0,09%Service Part 50 0,08%Service Part 51 0,07%Service Part 52 0,06%Service Part 53 0,06%Service Part 54 0,05%Service Part 55 0,04%Service Part 56 0,04%Service Part 57 0,04%Service Part 58 0,04%Service Part 59 0,03%Service Part 60 0,03%Service Part 61 0,02%
Service Part % of costService Part 62 0,02%Service Part 63 0,02%Service Part 64 0,02%Service Part 65 0,02%Service Part 66 0,02%Service Part 67 0,02%Service Part 68 0,02%Service Part 69 0,02%Service Part 70 0,02%Service Part 71 0,01%Service Part 72 0,01%Service Part 73 0,0048%Service Part 74 0,0044%Service Part 75 0,0043%Service Part 76 0,0041%Service Part 77 0,0028%Service Part 78 0,0011%Service Part 79 0,0005%Service Part 80 0,0002%Service Part 81 0,0002%Service Part 82 0,0002%
Table D.2: Each service parts contribution to the total penalty fines 2019
V

Appendix E
A-class service parts
Service Part 1
27 individual units of service part 1 were maintained by Saab’s MRO workshops in 2019.8 of these units underwent planned maintenance, and 19 units underwent unplannedmaintenance. Figure E.1 shows the difference between the actual lead time for eachindividual unit compared to the expected lead time of 30 days. The unit with the longestobserved delay is unit number 6, which was completed 250 days later than expected, witha total lead time of 280 days.
Figure E.1: Service Part 1
VI

Master Thesis
Unit Type Difference1 PM -52 UPM -233 UPM -234 UPM -105 UPM -96 UPM 2527 UPM -228 PM -129 UPM -1310 UPM -1211 PM -1812 UPM 5313 PM 014 UPM 21115 PM -816 PM -817 UPM 17418 UPM -919 UPM 3820 UPM 19821 UPM 5322 PM -2023 PM -2124 UPM 1925 UPM 19726 UPM -2227 UPM -23
Table E.1: Raw data for service part 1
VII
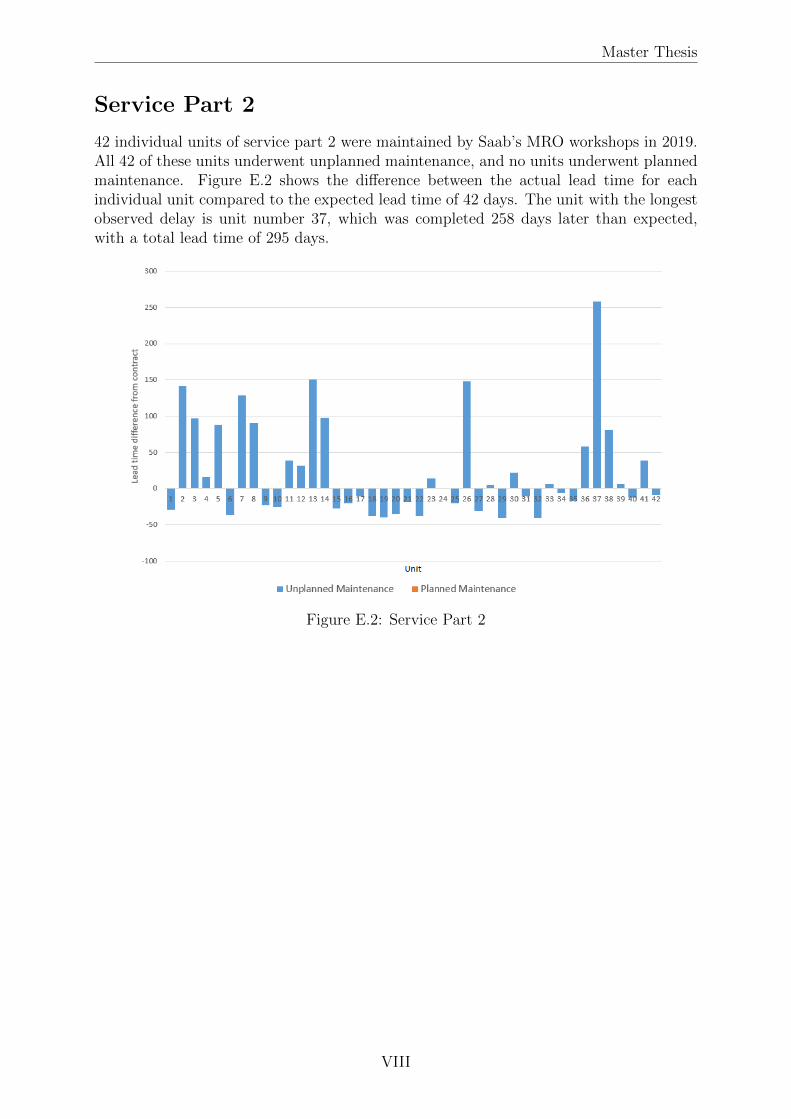
Master Thesis
Service Part 2
42 individual units of service part 2 were maintained by Saab’s MRO workshops in 2019.All 42 of these units underwent unplanned maintenance, and no units underwent plannedmaintenance. Figure E.2 shows the difference between the actual lead time for eachindividual unit compared to the expected lead time of 42 days. The unit with the longestobserved delay is unit number 37, which was completed 258 days later than expected,with a total lead time of 295 days.
Figure E.2: Service Part 2
VIII

Master Thesis
Unit Type Difference1 UPM -292 UPM 1423 UPM 974 UPM 165 UPM 886 UPM -367 UPM 1298 UPM 919 UPM -2310 UPM -2611 UPM 3912 UPM 3213 UPM 15114 UPM 9815 UPM -2716 UPM -2017 UPM -1118 UPM -3819 UPM -4020 UPM -3521 UPM -1922 UPM -3823 UPM 1424 UPM 125 UPM -2026 UPM 14827 UPM -3128 UPM 529 UPM -4130 UPM 2231 UPM -1132 UPM -4133 UPM 634 UPM -635 UPM -1736 UPM 5837 UPM 25838 UPM 8139 UPM 640 UPM -1241 UPM 3942 UPM -9
Table E.2: Raw data for service part 2
IX

Master Thesis
Service Part 3
18 individual units of service part 3 were maintained by Saab’s MRO workshops in 2019.2 of these units underwent planned maintenance, and 16 units underwent unplannedmaintenance. Figure E.3 shows the difference between the actual lead time for eachindividual unit compared to the expected lead time of 90 days. The unit with the longestobserved delay is unit number 12, which was completed 188 days later than expected,with a total lead time of 278 days.
Figure E.3: Service Part 3
X
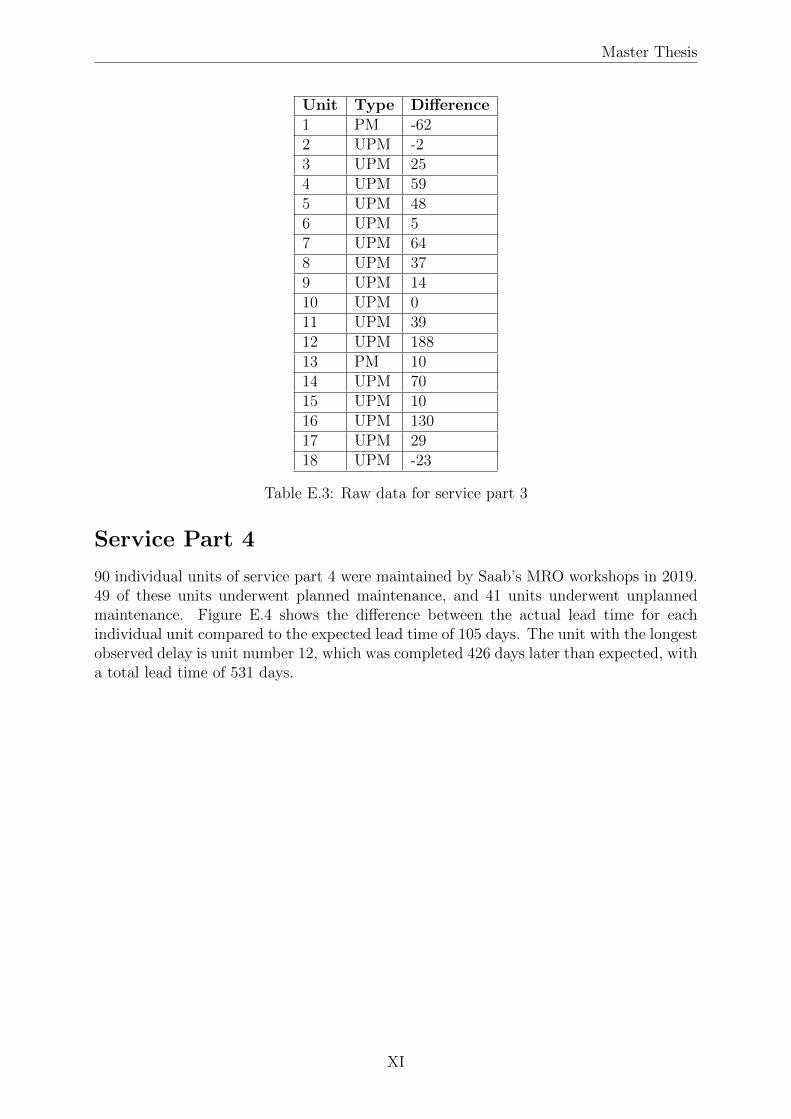
Master Thesis
Unit Type Difference1 PM -622 UPM -23 UPM 254 UPM 595 UPM 486 UPM 57 UPM 648 UPM 379 UPM 1410 UPM 011 UPM 3912 UPM 18813 PM 1014 UPM 7015 UPM 1016 UPM 13017 UPM 2918 UPM -23
Table E.3: Raw data for service part 3
Service Part 4
90 individual units of service part 4 were maintained by Saab’s MRO workshops in 2019.49 of these units underwent planned maintenance, and 41 units underwent unplannedmaintenance. Figure E.4 shows the difference between the actual lead time for eachindividual unit compared to the expected lead time of 105 days. The unit with the longestobserved delay is unit number 12, which was completed 426 days later than expected, witha total lead time of 531 days.
XI
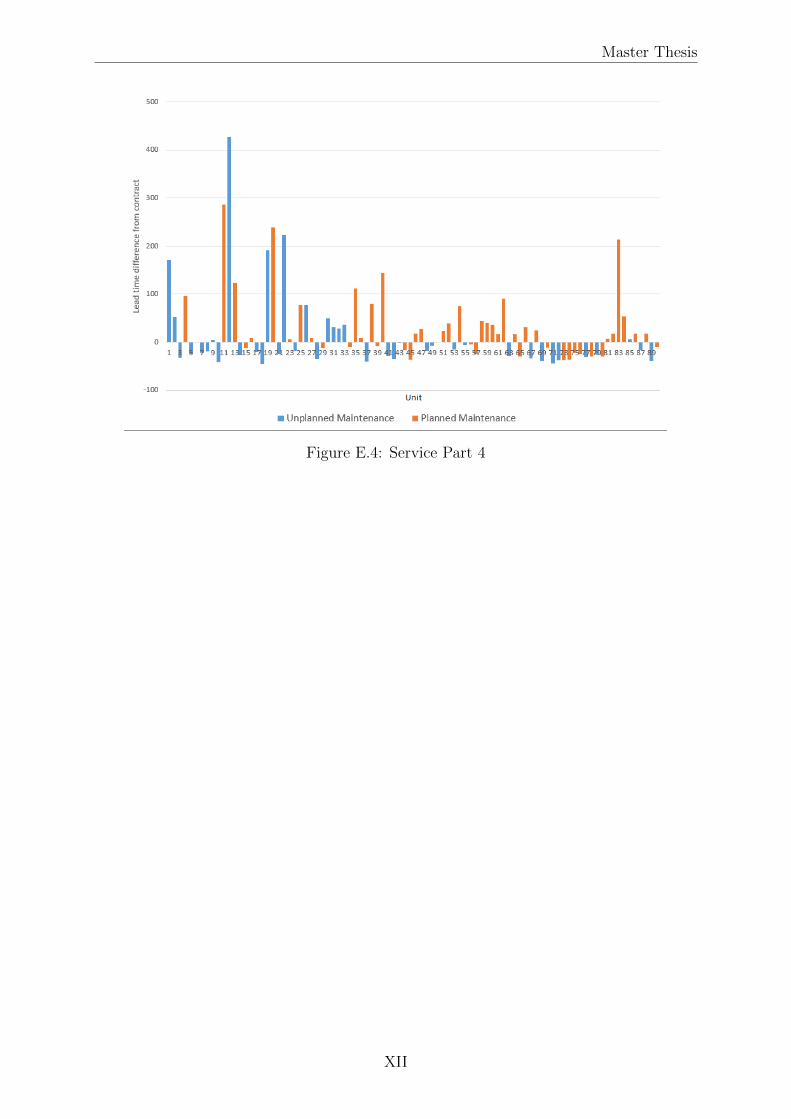
Master Thesis
Figure E.4: Service Part 4
XII
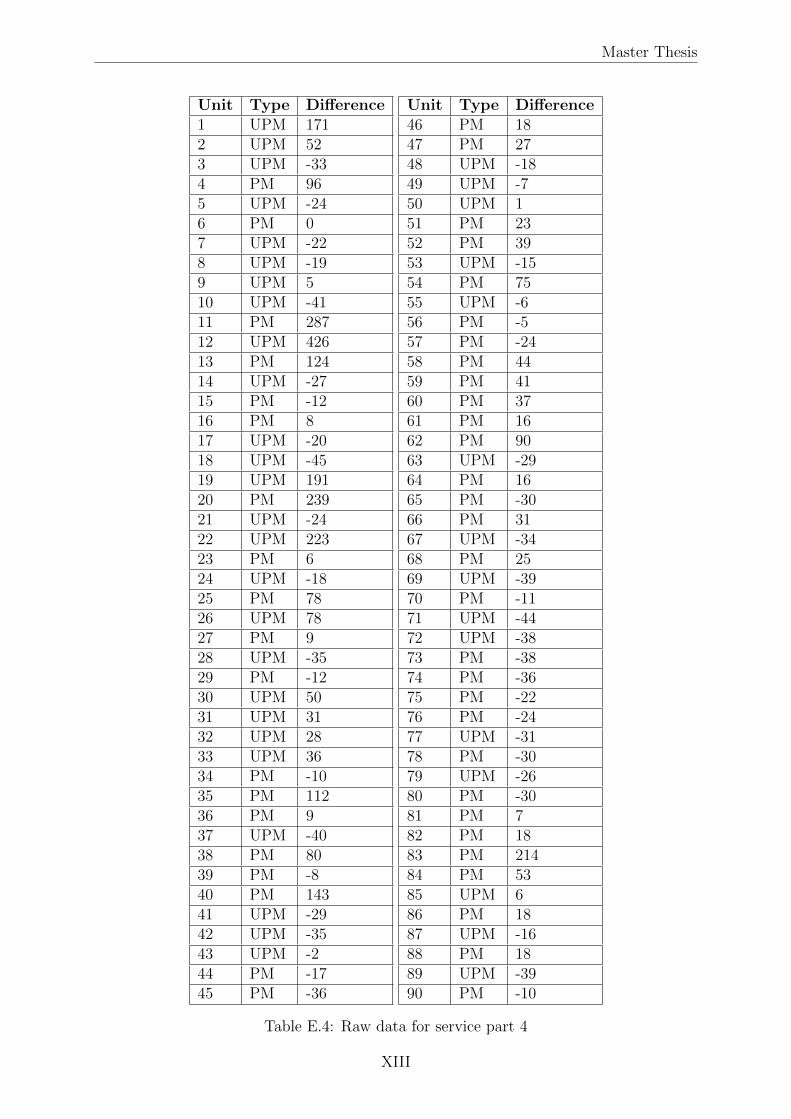
Master Thesis
Unit Type Difference1 UPM 1712 UPM 523 UPM -334 PM 965 UPM -246 PM 07 UPM -228 UPM -199 UPM 510 UPM -4111 PM 28712 UPM 42613 PM 12414 UPM -2715 PM -1216 PM 817 UPM -2018 UPM -4519 UPM 19120 PM 23921 UPM -2422 UPM 22323 PM 624 UPM -1825 PM 7826 UPM 7827 PM 928 UPM -3529 PM -1230 UPM 5031 UPM 3132 UPM 2833 UPM 3634 PM -1035 PM 11236 PM 937 UPM -4038 PM 8039 PM -840 PM 14341 UPM -2942 UPM -3543 UPM -244 PM -1745 PM -36
Unit Type Difference46 PM 1847 PM 2748 UPM -1849 UPM -750 UPM 151 PM 2352 PM 3953 UPM -1554 PM 7555 UPM -656 PM -557 PM -2458 PM 4459 PM 4160 PM 3761 PM 1662 PM 9063 UPM -2964 PM 1665 PM -3066 PM 3167 UPM -3468 PM 2569 UPM -3970 PM -1171 UPM -4472 UPM -3873 PM -3874 PM -3675 PM -2276 PM -2477 UPM -3178 PM -3079 UPM -2680 PM -3081 PM 782 PM 1883 PM 21484 PM 5385 UPM 686 PM 1887 UPM -1688 PM 1889 UPM -3990 PM -10
Table E.4: Raw data for service part 4
XIII

Master Thesis
Unit Type Difference1 UPM 1392 UPM 523 UPM -244 PM 155 UPM -266 UPM 57
Table E.5: Raw data for service part 5
Service Part 5
6 individual units of service part 5 were maintained by Saab’s MRO workshops in 2019. 1of these units underwent planned maintenance, and 5 units underwent unplanned main-tenance. Figure E.5 shows the difference between the actual lead time for each individualunit compared to the expected lead time of 42 days. The unit with the longest observeddelay is unit number 1, which was completed 139 days later than expected, with a totallead time of 181 days.
Figure E.5: Service Part 5
XIV

Master Thesis
Unit Type Difference1 UPM -122 UPM 923 UPM 354 UPM -175 UPM 1066 UPM 197 UPM 1098 UPM 129 UPM 2410 UPM -311 UPM 2312 UPM 57
Table E.6: Raw data for service part 6
Service Part 6
12 individual units of service part 6 were maintained by Saab’s MRO workshops in 2019.All 12 of these units underwent unplanned maintenance, and no units underwent plannedmaintenance. Figure E.6 shows the difference between the actual lead time for eachindividual unit compared to the expected lead time of 42 days. The unit with the longestobserved delay is unit number 7, which was completed 109 days later than expected, witha total lead time of 151 days.
Figure E.6: Service Part 6
XV

Master Thesis
Service Part 7
127 individual units of service part 7 were maintained by Saab’s MRO workshops in 2019.62 of these units underwent planned maintenance, and 65 units underwent unplannedmaintenance. Figure E.7 shows the difference between the actual lead time for eachindividual unit compared to the expected lead time of 42 days. The unit with the longestobserved delay is unit number 43, which was completed 243 days later than expected,with a total lead time of 285 days.
Figure E.7: Service Part 7
XVI

Master Thesis
Unit Type Dif1 PM 192 PM 23 PM 594 UPM -65 UPM 26 PM -27 PM -18 UPM 29 PM -310 PM 811 PM 1512 PM 11813 PM 1814 UPM 1815 PM 316 UPM -317 PM 518 UPM 219 PM 120 UPM 1421 UPM 522 UPM 4223 UPM 14124 PM -325 PM -826 PM -1927 UPM -628 UPM 829 UPM 1830 UPM 331 PM -832 PM 333 UPM -634 UPM 235 UPM -736 UPM 1037 UPM 038 PM -1639 UPM -440 UPM 2341 UPM 442 PM -9
Unit Type Dif43 UPM 24344 UPM 3845 UPM 8146 UPM 7947 PM 2048 UPM 4949 UPM 7050 PM -1451 PM 8952 PM 453 UPM 1454 PM -1055 UPM -156 UPM 18457 PM 1858 UPM 9959 UPM -760 UPM 4961 UPM -462 UPM -1263 UPM 6564 UPM 14765 UPM 9466 UPM 6167 UPM 6268 UPM -469 UPM -3270 UPM -971 UPM 2772 PM -473 UPM 2074 PM 375 UPM 3776 PM 477 UPM 2378 PM -479 PM 380 UPM 1181 PM 1182 PM -1483 UPM 1784 PM 68
Unit Type Dif85 UPM 786 PM -787 PM 588 PM -1289 PM 890 PM -1191 PM -492 PM 1793 PM 794 PM 195 PM -496 PM -197 PM -498 PM 1399 UPM 24100 UPM 15101 UPM -8102 UPM -7103 PM 66104 PM -3105 UPM 9106 PM 7107 PM 18108 UPM 28109 UPM -1110 PM -27111 UPM 8112 PM -4113 UPM 1114 UPM 0115 UPM 136116 UPM 10117 PM 6118 UPM -2119 PM -17120 PM -3121 PM -3122 PM 12123 PM -15124 PM -8125 PM -11126 UPM -4127 PM -13
Table E.7: Raw data for service part 7
XVII

Master Thesis
Service Part 8
30 individual units of service part 8 were maintained by Saab’s MRO workshops in 2019.2 of these units underwent planned maintenance, and 28 units underwent unplannedmaintenance. Figure E.8 shows the difference between the actual lead time for eachindividual unit compared to the expected lead time of 30 days. The unit with the longestobserved delay is unit number 11, which was completed 132 days later than expected,with a total lead time of 162 days.
Figure E.8: Service Part 8
XVIII

Master Thesis
Unit Type Difference1 UPM -92 UPM 213 UPM -74 UPM -405 UPM -366 UPM 177 UPM 108 UPM -29 UPM -2110 UPM -1911 UPM 13212 PM 3713 UPM 9914 UPM -915 PM 1116 UPM -4117 UPM -618 UPM -119 UPM -1420 UPM 9021 UPM 8522 UPM -2523 UPM 9024 UPM 3525 UPM -4026 UPM -1227 UPM -3928 UPM -829 UPM 1830 UPM -35
Table E.8: Raw data for service part 8
XIX

Master Thesis
Service Part 9
19 individual units of service part 9 were maintained by Saab’s MRO workshops in 2019.2 of these units underwent planned maintenance, and 17 units underwent unplannedmaintenance. Figure E.9 shows the difference between the actual lead time for eachindividual unit compared to the expected lead time of 42 days. The unit with the longestobserved delay is unit number 8, which was completed 82 days later than expected, witha total lead time of 124 days.
Figure E.9: Service Part 9
XX
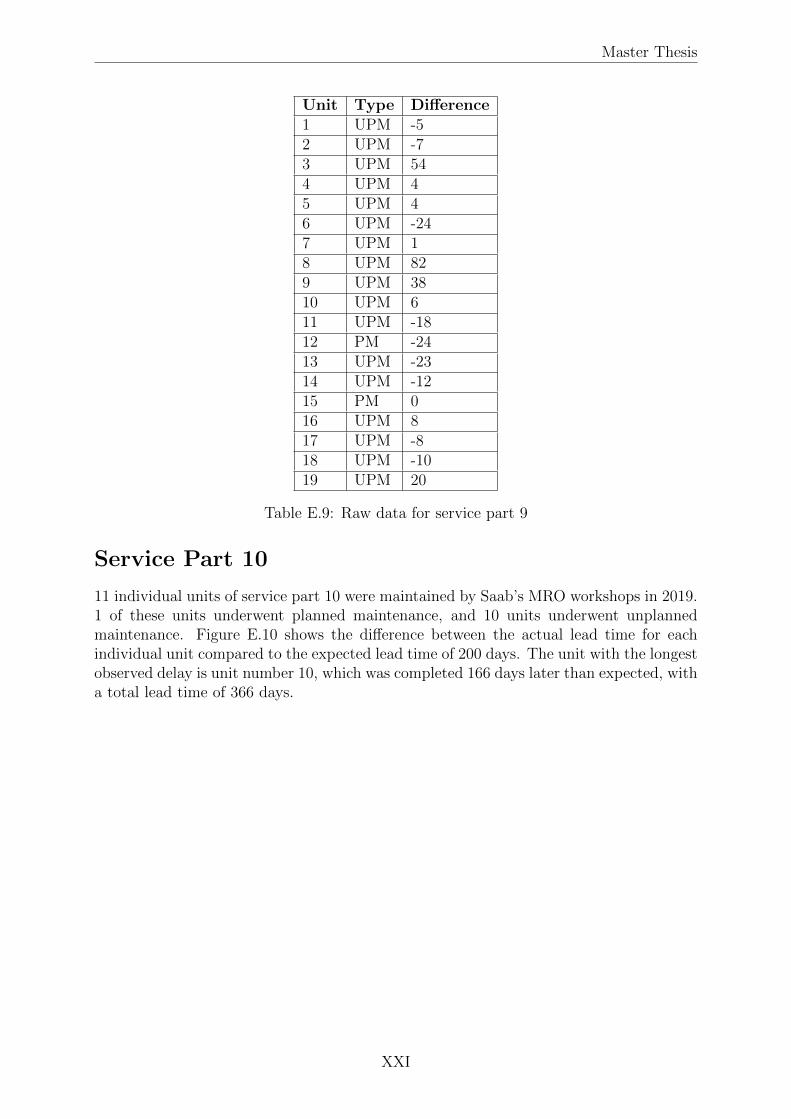
Master Thesis
Unit Type Difference1 UPM -52 UPM -73 UPM 544 UPM 45 UPM 46 UPM -247 UPM 18 UPM 829 UPM 3810 UPM 611 UPM -1812 PM -2413 UPM -2314 UPM -1215 PM 016 UPM 817 UPM -818 UPM -1019 UPM 20
Table E.9: Raw data for service part 9
Service Part 10
11 individual units of service part 10 were maintained by Saab’s MRO workshops in 2019.1 of these units underwent planned maintenance, and 10 units underwent unplannedmaintenance. Figure E.10 shows the difference between the actual lead time for eachindividual unit compared to the expected lead time of 200 days. The unit with the longestobserved delay is unit number 10, which was completed 166 days later than expected, witha total lead time of 366 days.
XXI

Master Thesis
Figure E.10: Service Part 10
Unit Type Difference1 UPM 82 UPM 853 UPM 804 UPM 855 PM 806 UPM 117 UPM 818 UPM 809 UPM 8110 UPM 16611 UPM 57
Table E.10: Raw data for service part 10
XXII
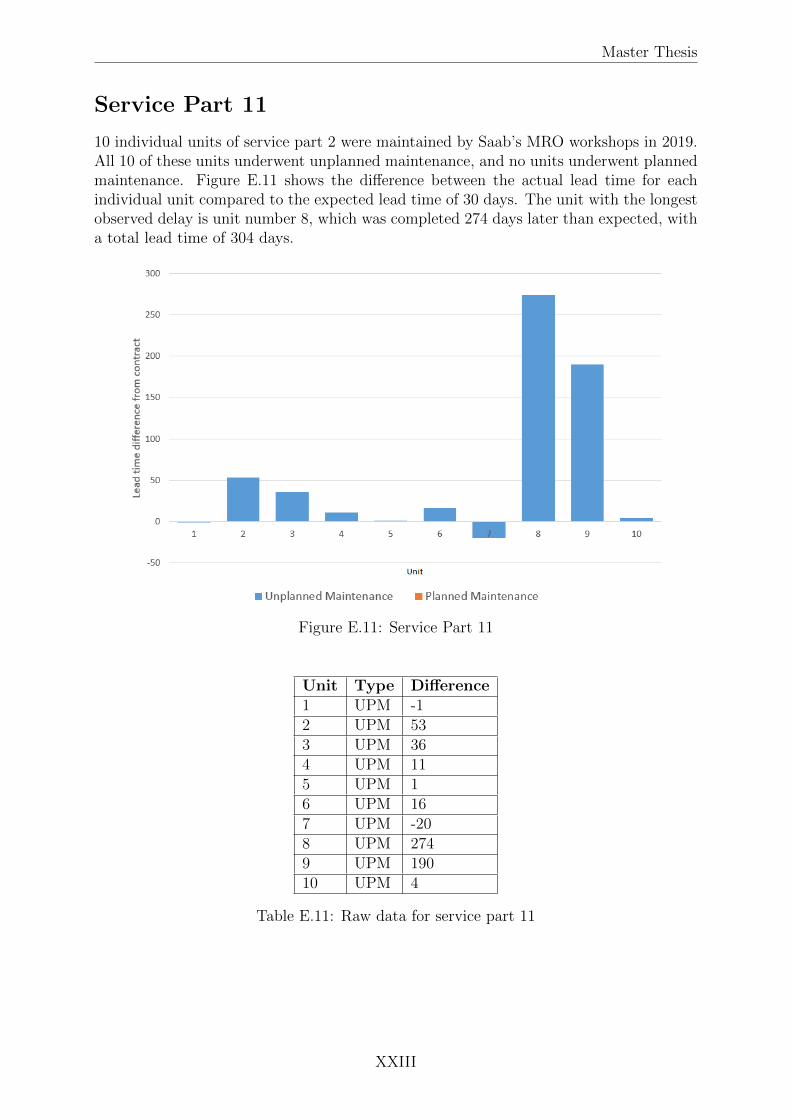
Master Thesis
Service Part 11
10 individual units of service part 2 were maintained by Saab’s MRO workshops in 2019.All 10 of these units underwent unplanned maintenance, and no units underwent plannedmaintenance. Figure E.11 shows the difference between the actual lead time for eachindividual unit compared to the expected lead time of 30 days. The unit with the longestobserved delay is unit number 8, which was completed 274 days later than expected, witha total lead time of 304 days.
Figure E.11: Service Part 11
Unit Type Difference1 UPM -12 UPM 533 UPM 364 UPM 115 UPM 16 UPM 167 UPM -208 UPM 2749 UPM 19010 UPM 4
Table E.11: Raw data for service part 11
XXIII
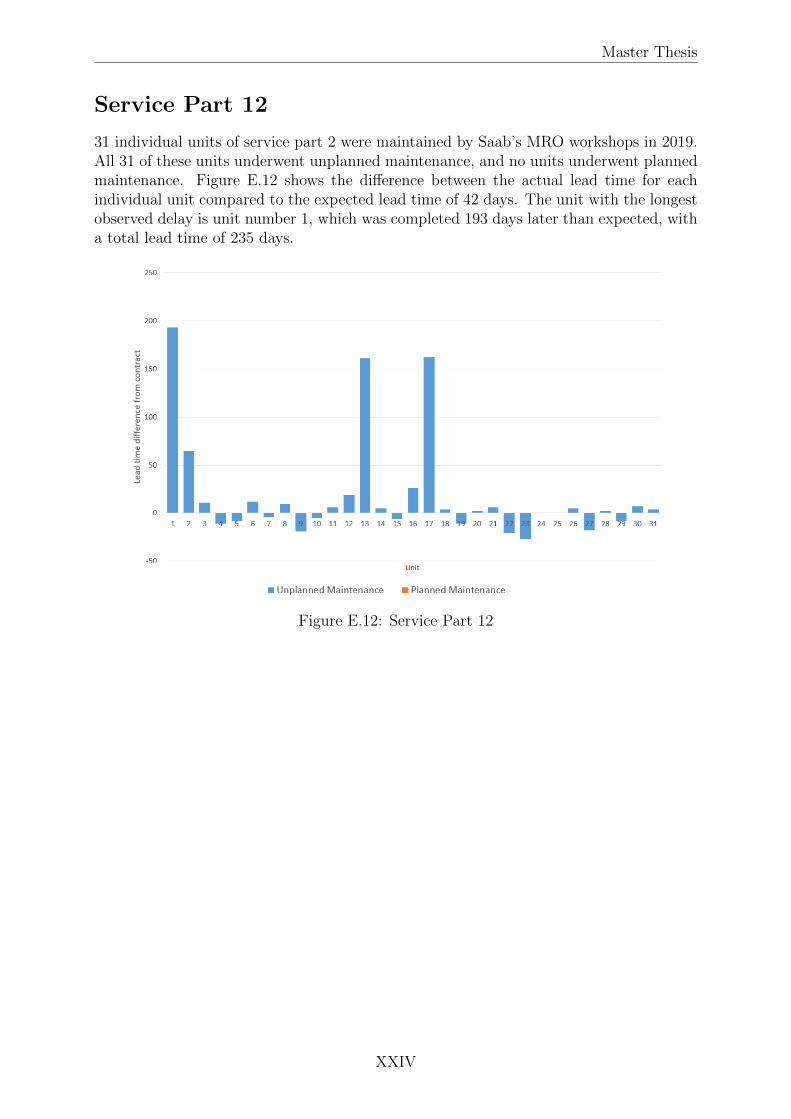
Master Thesis
Service Part 12
31 individual units of service part 2 were maintained by Saab’s MRO workshops in 2019.All 31 of these units underwent unplanned maintenance, and no units underwent plannedmaintenance. Figure E.12 shows the difference between the actual lead time for eachindividual unit compared to the expected lead time of 42 days. The unit with the longestobserved delay is unit number 1, which was completed 193 days later than expected, witha total lead time of 235 days.
Figure E.12: Service Part 12
XXIV

Master Thesis
Unit Type Difference1 UPM 1932 UPM 653 UPM 114 UPM -115 UPM -86 UPM 127 UPM -48 UPM 99 UPM -1910 UPM -511 UPM 612 UPM 1913 UPM 16114 UPM 515 UPM -616 UPM 2617 UPM 16218 UPM 419 UPM -1120 UPM 221 UPM 622 UPM -2123 UPM -2724 UPM 025 UPM 026 UPM 527 UPM -1828 UPM 229 UPM -830 UPM 731 UPM 4
Table E.12: Raw data for service part 12
XXV
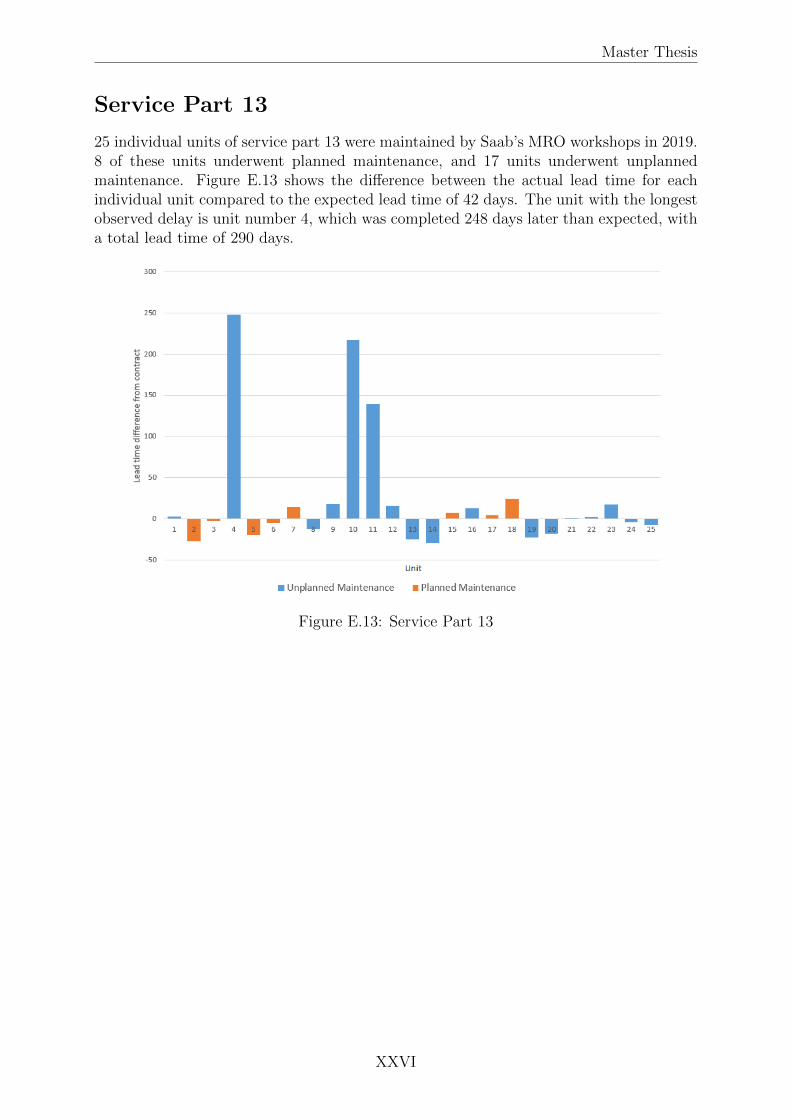
Master Thesis
Service Part 13
25 individual units of service part 13 were maintained by Saab’s MRO workshops in 2019.8 of these units underwent planned maintenance, and 17 units underwent unplannedmaintenance. Figure E.13 shows the difference between the actual lead time for eachindividual unit compared to the expected lead time of 42 days. The unit with the longestobserved delay is unit number 4, which was completed 248 days later than expected, witha total lead time of 290 days.
Figure E.13: Service Part 13
XXVI

Master Thesis
Unit Type Difference1 UPM 32 PM -273 PM -34 UPM 2485 PM -206 PM -57 PM 148 UPM -139 UPM 1810 UPM 21711 UPM 13912 UPM 1613 UPM -2514 UPM -3015 PM 716 UPM 1317 PM 418 PM 2419 UPM -2320 UPM -1821 UPM 122 UPM 223 UPM 1724 UPM -425 UPM -7
Table E.13: Raw data for service part 13
XXVII
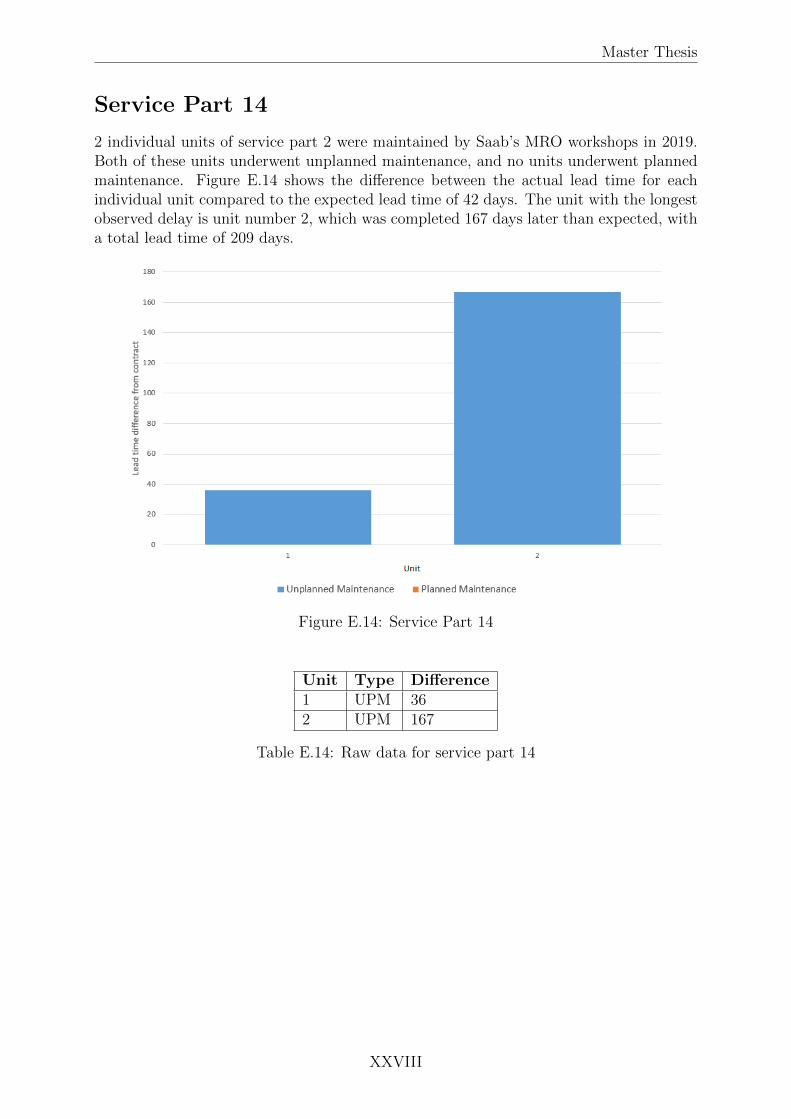
Master Thesis
Service Part 14
2 individual units of service part 2 were maintained by Saab’s MRO workshops in 2019.Both of these units underwent unplanned maintenance, and no units underwent plannedmaintenance. Figure E.14 shows the difference between the actual lead time for eachindividual unit compared to the expected lead time of 42 days. The unit with the longestobserved delay is unit number 2, which was completed 167 days later than expected, witha total lead time of 209 days.
Figure E.14: Service Part 14
Unit Type Difference1 UPM 362 UPM 167
Table E.14: Raw data for service part 14
XXVIII
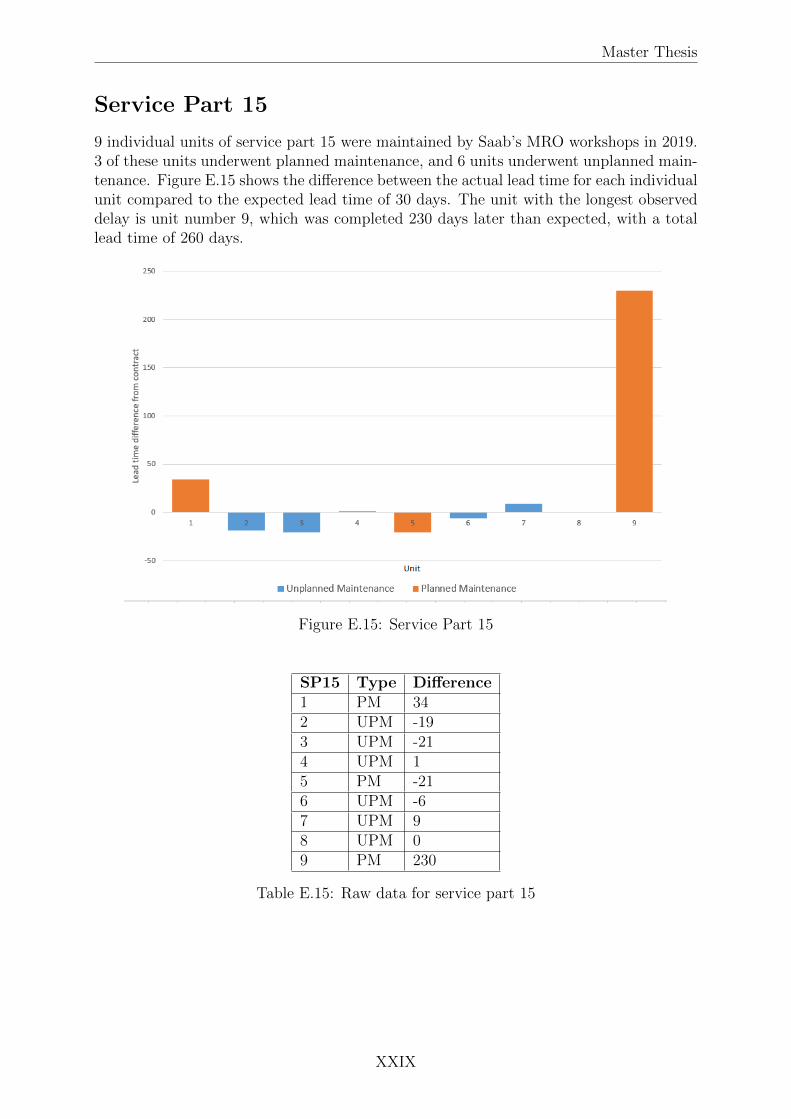
Master Thesis
Service Part 15
9 individual units of service part 15 were maintained by Saab’s MRO workshops in 2019.3 of these units underwent planned maintenance, and 6 units underwent unplanned main-tenance. Figure E.15 shows the difference between the actual lead time for each individualunit compared to the expected lead time of 30 days. The unit with the longest observeddelay is unit number 9, which was completed 230 days later than expected, with a totallead time of 260 days.
Figure E.15: Service Part 15
SP15 Type Difference1 PM 342 UPM -193 UPM -214 UPM 15 PM -216 UPM -67 UPM 98 UPM 09 PM 230
Table E.15: Raw data for service part 15
XXIX

Master Thesis
Service Part 16
9 individual units of service part 15 were maintained by Saab’s MRO workshops in 2019.1 of these units underwent planned maintenance, and 8 units underwent unplanned main-tenance. Figure E.16 shows the difference between the actual lead time for each individualunit compared to the expected lead time of 30 days. The unit with the longest observeddelay is unit number 9, which was completed 133 days later than expected, with a totallead time of 163 days.
Figure E.16: Service Part 16
SP16 Type Difference1 UPM 1082 UPM -173 UPM -174 UPM -55 UPM 696 UPM -207 UPM -158 UPM 19 PM 133
Table E.16: Raw data for service part 16
XXX

Appendix F
Causes for delays
F.1 Service Part 1
Interruption Number of occurrences Total daysInternal stock-out (sub-units) 7 1606Internal stock-out (spare parts) 1 307External Delay at OEM 1 46
Table F.1: Causes for delays - Service part 1
F.2 Service Part 2
Interruption Number of occurrences Total daysInternal stock-out (sub-units) 10 1710External delay at OEM 1 274
Table F.2: Causes for delays - Service part 2
F.3 Service Part 3
Interruption Number of occurrences Total daysExternal Delay at OEM 5 528Internal faulty equipment 10 140
Table F.3: Causes for delays - Service part 3
F.4 Service Part 4
Interruption Number of occurrences Total daysExternal delay at OEM 13 3929
Table F.4: Causes for delays - Service part 4
XXXI

F.5. SERVICE PART 5 Master Thesis
F.5 Service Part 5
Interruption Number of occurrences Total daysInternal stock-out (spare parts) 5 555External delay at OEM 3 40
Table F.5: Causes for delays - Service part 5
F.6 Service Part 6
Interruption Number of occurrences Total daysInternal stock-out (spare parts) 17 2077External delay at OEM 2 202Internal equipment breakdown 4 61
Table F.6: Causes for delays - Service part 6
F.7 Service Part 7
Interruption Number of occurrences Total daysInternal stock-out (sub-units) 5 564Internal equipment breakdown 4 64
Table F.7: Causes for delays - Service part 7
F.8 Service Part 8
Interruption Number of occurrences Total daysInternal stock-out (sub-units) 5 564Internal equipment breakdown 4 64
Table F.8: Causes for delays - Service part 8
F.9 Service Part 9
No interruptions reported.
F.10 Service Part 10
Interruption Number of occurrences Total daysExternal delay at OEM 10 3797
Table F.9: Causes for delays - Service part 10
XXXII
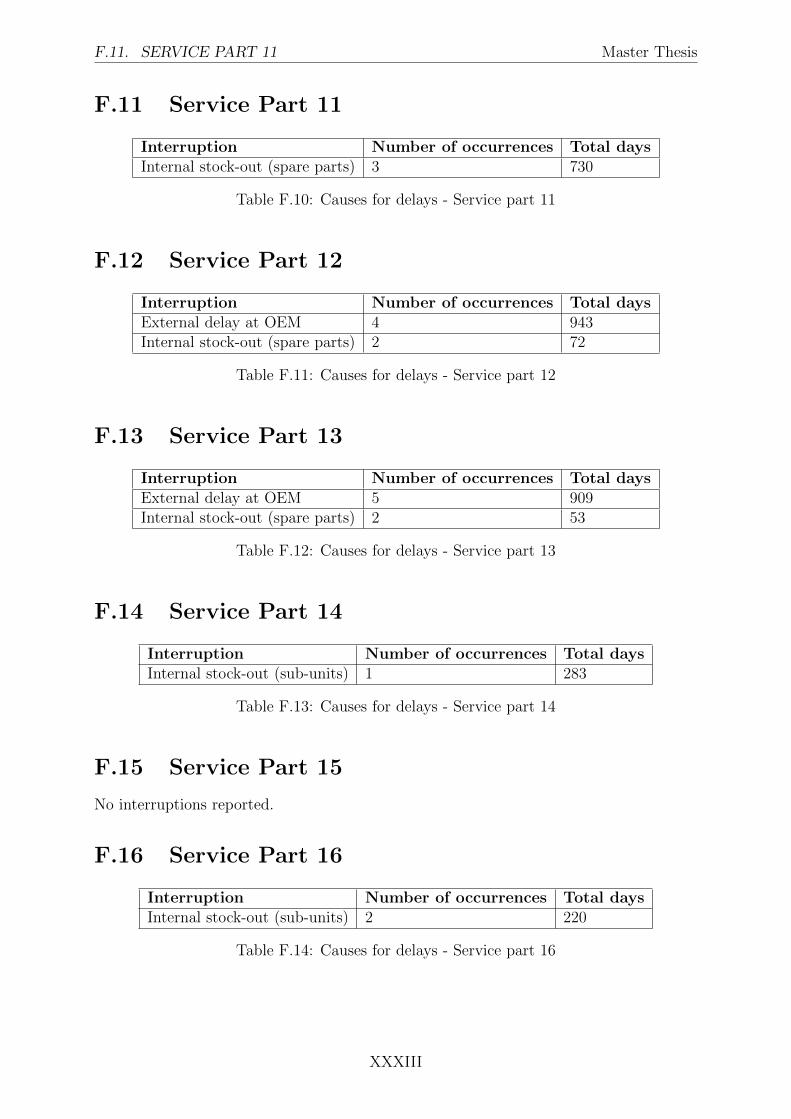
F.11. SERVICE PART 11 Master Thesis
F.11 Service Part 11
Interruption Number of occurrences Total daysInternal stock-out (spare parts) 3 730
Table F.10: Causes for delays - Service part 11
F.12 Service Part 12
Interruption Number of occurrences Total daysExternal delay at OEM 4 943Internal stock-out (spare parts) 2 72
Table F.11: Causes for delays - Service part 12
F.13 Service Part 13
Interruption Number of occurrences Total daysExternal delay at OEM 5 909Internal stock-out (spare parts) 2 53
Table F.12: Causes for delays - Service part 13
F.14 Service Part 14
Interruption Number of occurrences Total daysInternal stock-out (sub-units) 1 283
Table F.13: Causes for delays - Service part 14
F.15 Service Part 15
No interruptions reported.
F.16 Service Part 16
Interruption Number of occurrences Total daysInternal stock-out (sub-units) 2 220
Table F.14: Causes for delays - Service part 16
XXXIII

Appendix G
Lead time analysis timelines
G.1 Aggregated timeline of internal stock-out (spare
parts)
Figure G.1: Aggregated timeline for internal stock-out (spare parts)
XXXIV

G.2. AGGREGATED TIMELINE OF INTERNAL STOCK-OUT (SUB-UNITS)Master Thesis
G.2 Aggregated timeline of internal stock-out (sub-
units)
Figure G.2: Aggregated timeline for internal stock-out (sub-units)
XXXV
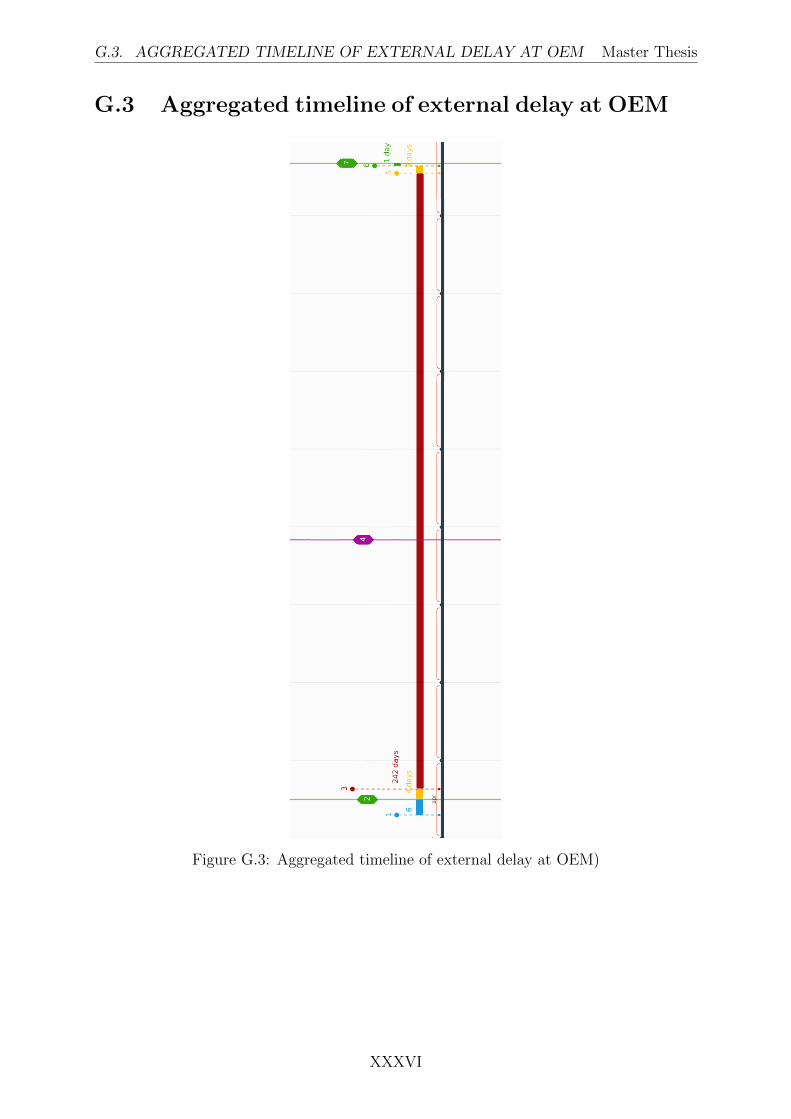
G.3. AGGREGATED TIMELINE OF EXTERNAL DELAY AT OEM Master Thesis
G.3 Aggregated timeline of external delay at OEM
Figure G.3: Aggregated timeline of external delay at OEM)
XXXVI
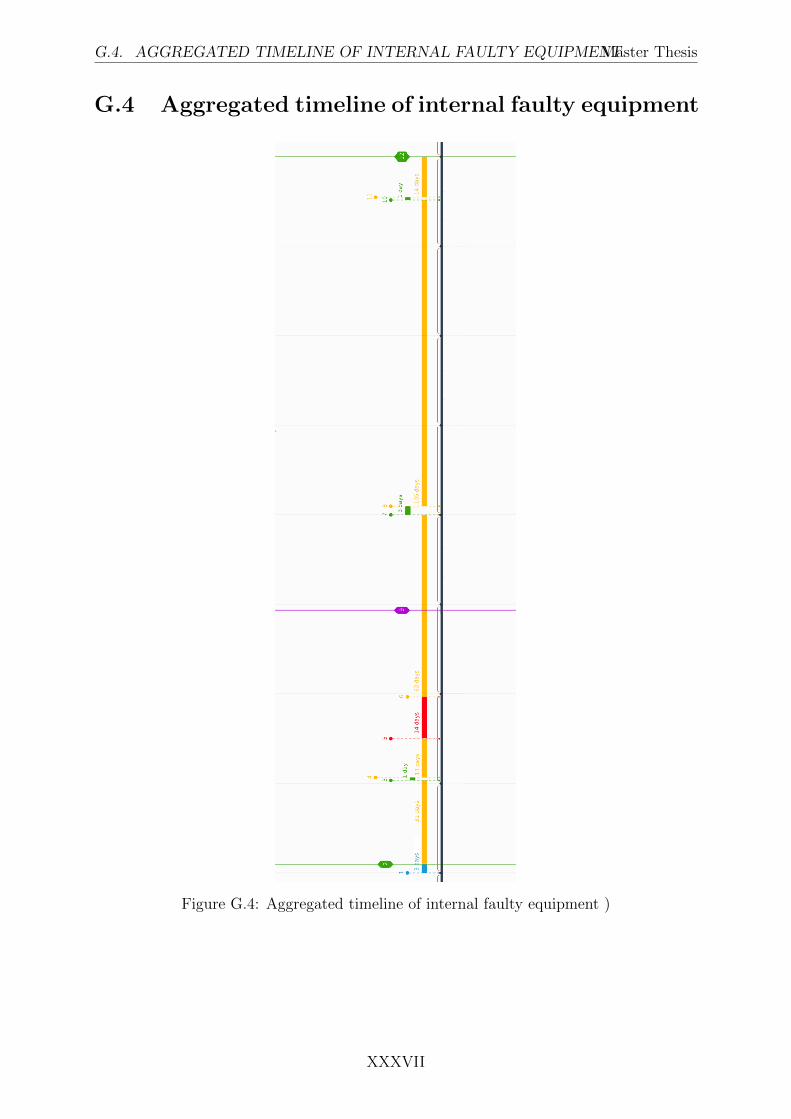
G.4. AGGREGATED TIMELINE OF INTERNAL FAULTY EQUIPMENTMaster Thesis
G.4 Aggregated timeline of internal faulty equipment
Figure G.4: Aggregated timeline of internal faulty equipment )
XXXVII