Embed Size (px)
Citation preview

Reducing Evaporative Water Losses from Irrigation Ponds1
Through the Re-Use of PET Bottles2
K. Simon 1, A. H. Slocum2, R. Shanbhag33
ABSTRACT4
Evaporation can be a source of water loss from artificial reservoirs used in agriculture.5
Current methods of covering artificial reservoirs are too costly to use by poor, small-scale6
farmers. This paper presents a method for using waste PET bottles to reduce the evaporative7
losses from open tanks. This water-conservation method was tested using eight evaporation8
pans with daily water-level measurements to record evaporation rate. Four pans were used9
as controls, two were covered with empty waste PET bottles, and two were covered with10
bottles partially filled with soil. The experiment showed an average reduction in evaporation11
by 40% with the PET bottle treatment, with a 90% confidence of reducing evaporation by at12
least 18%. The addition of soil did not affect the degree of evaporation reduction. Given the13
local economics of the region surrounding Pune, India, it was found that this intervention14
can save water at a cost of 0.09 USD/m3.15
BACKGROUND AND INTRODUCTION16
Agriculture is the main source of water use, representing 70% of global water consump-17
tion. In 2013, 25% of the world’s irrigated agricultural systems were withdrawing water18
faster than the regional replenishment rate (Rengel 2013). This challenge of sustainably19
managing water is acutely noticed in developing countries. In 2010, India consumed 761 x20
109 m3 of water. 90% of that water was used in agriculture (FAO 2011).21
1Engineering Systems Division, MIT, 77 Massachusetts Ave., Cambridge, MA 02139. E-mail: Kev-
[email protected] Engineering, MIT, 77 Massachusetts Ave., Cambridge, MA 021393Vigyan Ashram, Pabal, Dist. Pune, Maharashtra, India 412403
1 Simon, May. 20, 2014
Evaporation accounts for a little over 2% (16.95 x 10⁹ m3/year in 2011) of India’s effective22
water consumption (Frenken 2011). This paper proposes the use of waste PET bottles as23
floating covers to reduce water-scarcity as a less expensive and potentially scalable solution24
to reduce evaporation from man-made irrigation storage systems by approximately 40%.25
Discussions with farmers near Pabal, India identified concerns about the rate of water26
evaporation from their water retaining ponds, often referred to as ‘irrigation tanks’ in India.27
They noted that solutions to this problem already exist. Suspended and floating covers28
have been used to reduce evaporation in industrial applications and with large reservoirs29
(Yao 2010) These existing solutions cost between 8 and 30 USD/m2 of reservoir and are too30
expensive. In addition to being too costly, suspended and floating covers are either unable31
to handle high-winds or unable to capture rain. This paper proposes and tests a method32
for using PET bottles as floating covers. These bottles are less expensive than existing33
evaporation reduction methods. In preliminary tests, it was found that these bottle rotate,34
exposing water film to air and increasing evaporation. To address this challenge, and to35
prevent the bottle from being blown away in stronger winds, a small amount of soil was36
added to each bottle in half of the treatments. Subsequently, it was discovered that square37
bottles (with rounded corners) naturally resist rotation and may not need to be filled with38
soil. In either case, bottles blown by the wind pile up on one side of a pond and fall back39
in to a low energy state. When rain falls on the floating mass of bottles, it merely passes40
between them.41
There are popular concerns about chemicals leaching from PET bottles into water when42
exposed to sunlight and heat. However, surveys of the literature on chemical leaching has43
shown that the leaching of dangerous chemicals into irrigation ponds is well below the dan-44
gerous limits (Gorbaty 2013).45
MATERIALS AND METHODS46
The experiment consisted of daily measurements taken from 8 evaporation pans, which47
can be seen in Figure 1, from March 5th to May 24th 2014. This time-window was chosen48
2 Simon, May. 20, 2014

because it is the hottest and driest in Maharasthra. Of those 8 pans, 4 were uncovered49
controls, 2 were covered with empty PET bottles, and the last 2 were covered with 500 ml50
PET bottles containing 10 g of soil. Each pan was made from a rolled piece of metal, welded51
into a 400 mm tall, 1.5 meter diameter cylinder and lined with white tarpaulin. Those pans52
were filled with approximately 270 mm of water and refilled when empty. A wire mesh was53
placed over the evaporation pans to prevent the bottles from blowing away in high wind,54
and to prevent animals drinking from the pans. The Vigyan Ashram, based near the village55
of Pabal, outside of Pune, conducted the experiment by recording the depth of the water in56
each pan every day at 5:00 pm IST. Depth measurements were taken with a ruler mounted57
to a stand, for stiffness and repeatability, which was placed in the pan for each measurement.58
Variations in the weather would not induce error in the mean-shift because the analysis59
is based on the difference in evaporation rates between the control and treatments. Measure-60
ment errors were symmetric about the true average evaporation rate because the evaporation61
rate is calculated from daily measurements of the water height. The remaining sources of62
error could be caused by albedo, surface area, or leakage. Using the same tarpaulin in each63
pond ensures that their albedo is similar. The difference in pond surface area caused by64
construction is small compared to the effect of PET bottle coverage. Leakage is the only65
major source of error that is unaccounted for in the experimental design, which can be found66
if the average water level drop increases suddenly. This could be improved in the future by67
periodically and randomly changing which pond has which treatment.68
Due to the non-normality of the data, which can be seen in Table 1 and Figure 3, the69
Bootstrap method with 106 resamples was used to evaluate the confidence intervals on the70
results (Efron 1979).71
RESULTS72
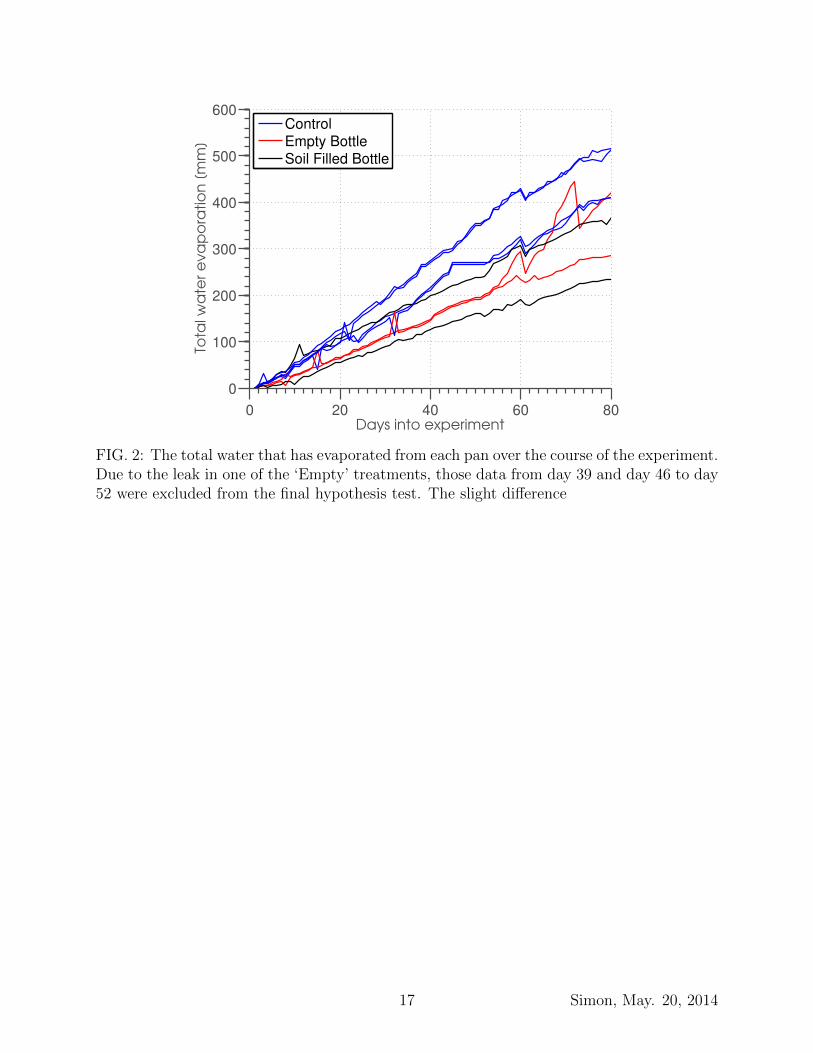
The cumulative evaporation rate can be seen in Figure 2. Two of the four control pans73
(C1 and C2) have unmeasured evaporation rates between day 46 and day 52 because they74
became empty and not refilled. Two other control pans (C3, and C4) were re-filled on day75
3 Simon, May. 20, 2014

39, resulting in another unmeasured day. To maintain the parallelism of the results, those76
days were excluded from the evaporation analysis.77
The data has low skewness, because evaporation rates are calculated from a running78
water-level, making the measurement error symmetric.79
The evaporation rate data has high kurtosis. This quality is expected because of the80
outlying evaporation rates caused by measurement error. These measurement errors are81
identified by examining the net evaporation rate, and are likely the cause of the long tails.82
This high kurtosis brings the normality of the data into question, requiring a Bootstrap83
resampling to test confidence intervals. This kurtosis can be reduced in the future by using84
a more consistent measurement method such as a sight glass.85
One of the empty-bottle treatments began to leak after being refilled on day 51. Those86
results were left from the final hypothesis testing. However, the data from the first 51 days87
were used to show that the addition of dirt does not reduce the effectiveness of the solution.88
The ANOVA-multicompare in Figure 4, performed in MATLAB, from the pre-leak data89
showed that there is an insignificant difference between the two treatments, and a significant90
difference (p = 0.1) between the bottle treatments and the control.91
The collected data has a mean-shift from 6.0 mm/day with the control to 3.8 mm/day92
with the sand-bottle treatment. This is a 2.2 mm/day reduction in evaporation, amounting93
to a 37% mean shift (%reduced = ∆xxcontrol
). It was found, within a 90% confidence interval, that94
the average evaporation rate can be reduced by at least 1.1 mm/day (18%). The histogram95
of the resampling that was used can be seen in Figure 5. The control evaporation rate of 6.096
mm/day closely matches the data presented by the Indian government (Sinha 2006), so the97
analysis in this paper will be based on the Indian government’s data for yearly evaporation98
rates in Pabal: 2250 mm/year. It is assumed that the fractional reduction in evaporation99
remains constant.100
ANALYSIS101
The value of this evaporation reduction method is dependent on the economics of PET102
4 Simon, May. 20, 2014
waste and the price or value of water. This section considers the costs and benefits associated103
with using waste PET bottles as floating covers by examining the price of irrigation water104
and the price of PET bottles. In this paper, the value of the intervention is calculated as105
the difference between the cost of water saved, and the cost of covering a pond with PET106
bottles.107
Price of Water108
There are many ways to determine the value of water (market price, cost of production,109
social value). The most simple metric is the price paid for irrigation water by farmers. This110
metric does not capture the value of water in water strained regions, where increased water111
could improve or save the yield of a crop, but it does provide a baseline.112
There is a large variability in the pricing of water schemes (Cornish 2004; Saleth 1997).113
The cost of pumped groundwater is used as the benchmark for the price of water. A farmer114
in Pabal, Maharashtra who consumes 100 m3 of water per day on average consumes approx-115
imately 300 USD/year in electricity. A pump capable of providing that amount of water116
would likely cost about 150 USD and needs to be replaced every 4 years on average. This117
farmer would consume about 10,000 m3 of water over the course of 100 days of irrigation each118
year. Not accounting for the cost of digging a well, the estimated cost of pumped irrigation119
water in Pabal which will be used in this paper is 0.035 USD/m3 of water. This value is120
reasonable because it is close to 0.032 USD/kWh; the energy cost of lifting 1 m3 an average121
of 30m with a 20% efficient pump and an electricity cost of 0.08 USD/kWh. It should be122
noted that other farmers in the region receive subsidized irrigation and only pay 1/10th the123
electricity rate that this farmer does.124
Other regions in Maharasthra, Aurangabad in this case, have reported groundwater ir-125
rigation costs as great as 0.50 USD/m3(Foster 2008). Furthermore, irrigation wells run dry126
for many farmers in Pabal after April. Some farmers overcome this challenge by importing127
water from nearby reservoirs to irrigate high-value crops such as mango-trees. The cost of128
importing water via truck for one farmer was 11.60 USD for one 10 m3 tank truck, and sets129
5 Simon, May. 20, 2014

the upper bound for acceptable water costs.130
Price of PET Bottles131
The net value of using PET bottles for irrigation needs to include the value of those132
PET bottles, either as the opportunity cost or the price to purchase. This determines the133
cost-benefit of using these bottles for evaporation reduction.134
The price of recycled PET bottles in India has been reported to vary from 0.03 USD/kg to135
0.02 USD/bottle (Dasgupta 2008). It was found that wholesalers in Pune typically purchase136
PET scrap for between 0.50 and 0.67 USD/kg (Gorbaty 2013). The value 0.58 USD/kg137
will be used in this calculation. The PET bottle used in this calculation weighs 20 g. The138
common PET bottle, seen in Figure 6, has a height of 267 mm and a width of 76 mm.139
This gives a cross-section of approximately 0.02 m2. Under these assumptions, the cost of140
covering an irrigation tank is approximately 0.82 USD/m2.141
The recorded mean-reduction in evaporation demonstrated in this paper is approximately142
40 %. The average annual evaporation rate presented above comes from a report published143
by the Government of India’s Central Water Commission (Sinha 2006).144
If it takes 1 minute to add soil to a bottle, and a typical unskilled laborer is paid 0.30145
USD/hour, it will cost an additional 0.005 USD/bottle. The cost of transporting bottles can146
vary significantly, and is left out of this calculation. Note that many regions that use water147
tanks as storage will be in places with low population density and low income. This fact will148
require that the bottles be shipped in. The regional cost of transporting whole PET bottles149
will need to be considered. One estimate of shipping costs is provided below.150
A summary of the analysis presented in this paper, with additional upper and lower151
bounds for estimations, is in Table 2. The estimated cost to conserve water with PET bottle152
floating covers, assuming that the bottles will last for five years, is 0.09 USD/m3 of water.153
This is greater than the estimated cost of pumping water in Pabal; slightly less than the cost154
of pumping water in Aurangabad; and less than cost of importing water. There are many155
places in India where water cannot be found in ground-wells during the summer season. In156
6 Simon, May. 20, 2014

those places the PET bottles could enable increased yield in addition to reduced costs. Pabal157
is one of those locations.158
PET bottle availability159
The availability of PET bottles affects how broad of an impact that this innovation could160
have. It is estimated that Pune produces about 1,168 tons of PET bottles/year (Gorbaty161
2013). The most common irrigation tank size in Maharashtra is 30 m wide by 30 m long,162
and 3 meters deep. With a surface area of 900 m2, it would take approximately 45,000 1L163
bottles, or 900 kg, to cover one typical tank. If all PET bottle waste produced by Pune were164
used as floating covers, they could cover approximately 1,300 tanks each year. There are a165
total of 208,000 irrigation tanks in India (Vaidyanathan 2001). If the bottles last 10 years,166
16 cities of equivalent size to Pune would be required to cover all of the irrigation tanks in167
India.168
Shipping the bottles have been estimated to cost 0.66 USD to ship 2000 bottles 1 km169
(Gorbaty 2013). At 0.00033 USD/bottle/km, the transportation costs for bottles with 0.02170
m2 cross-sectional area are 0.0165 USD/m2/km. At this rate, shipping the bottles 50 km to171
an irrigation tank doubles the cost of the intervention, putting it at 0.18 USD/m3. Adapting172
the solution to keep the bottle sources as local as possible will be important to preserving173
the economic value of this intervention.174
CONCLUSION AND FUTURE WORK175
This paper identifies a method for putting a common waste to use for reducing water176
evaporation by at least 18% (p = 0.1) with a mean reduction of 40%. The effect of using177
PET bottles as floating covers has been demonstrated in the village of Pabal, India, near178
Pune. It has been shown that the cost of this intervention can be greater or less than the179
value of the saved water depending on the context. Compared to other interventions, this180
can save water at 1/3rd the cost or less (Sinha 2006).181
Due to the cost of PET bottles, this solution will be effective in regions where water is182
scarce and waste PET bottles are available. In poor areas with low-population density, the183
7 Simon, May. 20, 2014

bottles will need to be shipped to the irrigation tanks, adding a cost to the solution that will184
need to be taken into account.185
This paper also discusses the nature of data collected remotely with high measurement186
induced kurtosis. The measurement method described above produces statistically useful187
data with a simple, and low-cost setup when combined with a bootstrap analysis. This188
setup can be scaled to engage farmers in different regions of India to test and compare this189
and other evaporation reduction methods.190
While this paper focuses on the use of waste PET bottles as floating covers in India, this191
solution will have even more value in parts of the world where water is more expensive and192
evaporation rates are very high. The yearly evaporation estimate in Pune is 2250 mm/year.193
In places like Australia, which also use open water storage tanks, annual evaporation can be194
as great as 3,000 mm/year (Craig 2005), further increasing the value of this intervention. The195
application of this solution to other water scarce regions in the world should be investigated196
further.197
Filling the bottles with soil accounts for 1/3rd of the cost of the bottles. In some regions,198
the soil filling may be unnecessary if the winds are not strong enough to blow the bottles199
away. Square bottles (which have more resistance to rotation) could be used without soil200
if the dynamics of bottle rotation, which can bring a film of water to the surface which201
then evaporates, are better understood. A further benefit of reducing evaporation is that202
many farmers currently do not use the last bit of water in their pond because evaporation203
has caused such a dramatic increase in salt or other chemicals. Additional future work will204
include studying the effects of reducing the concentration of these undesired chemicals in the205
water by reducing evaporation.206
ACKNOWLEDGEMENTS207
We would like to thank Vishal Jagtap, Dr. Yogesh Kulkarny, and the rest of the Energy &208
Environment section of the Vigyan Ashram for conducting the evaporation pan experiment,209
evaluating water quality, helping our understanding of small scale farming around Pune, and210
8 Simon, May. 20, 2014

their excellent hospitality.211
9 Simon, May. 20, 2014

APPENDIX I. REFERENCES212
Craig, I., Green, A., Scobie, M., and Schmidt, E. (2005) “Controlling Evaporation Loss from213
Water Storages.” National Centre for Engineering in Agriculture (NCEA) Publication No214
1000580/1.215
Cornish, G. and Bosworth, B. (2004) “Annex 1.” Water Charging for Irrigation,216
<http://www.fao.org/docrep/008/y5690e/y5690e0b.htm> (Oct 20, 2014).217
Dasgupta, B. and Khurana, S. (2008) “Waste Management of PET Bottles.” Journal of218
Environmental Research And Development vol. 2, no. 4, 862-867.219
Efron, B. (1979) “Bootstrap Methods: Another Look at the Jacknife.” The Annals of Statis-220
tics. 1979221
Food and Agriculture Organization of the United Nations (FAO) (2011) “India,” Aqua-222
stat, <http://www.fao.org/nr/water/aquastat/countries_regions/IND/index.stm>223
(Oct. 20, 2014).224
Frenken, K. (2011) “Water Resources” Irrigation in Southern and Eastern Asia in figures.225
FAO, 43.226
Gorbaty, E. (2013) “Development of an efficient off-grid pumping system and evaporation227
reduction strategies to increase access to irrigation for smallholder farmers in India.” M.S.228
thesis, MIT, Cambridge, MA.229
Rengel, Z. (2013) “Current State and Future Potential of Global Food Production and230
Consumption.” Improving Water and Nutrient-use Efficiency in Food Production Systems.231
Oxford: Wiley-Blackwell, 10.232
Saleth, R. (1997) “Water pricing Experinces: an international perspective.” World Bank.233
Sinha, S. (2006) “Evaporation Control in Reservoirs.” Government of India, Central Water234
Commission, Basin Planning and Management Organisation, New Delhi.235
Foster, S. (2008) “Ground water Use in Aurangabad - A Survey and Analysis of Social Signif-236
icance and Policy Implications for a Medium-sized Indian City” Sustainable Groundwater237
Management: Lessons from Practice.238
10 Simon, May. 20, 2014

Vaidyanathan, A. (2001) “Tanks of South India.” New Delhi: Centre for Science and Envi-239
ronment.240
Yao, X., Zhang, H., Lemckert, C., Brook, A., and Schouten, P. (2010) “Evaporation Re-241
duction by Suspended and Floating Covers: Overview, Modeling, and Efficiency.” Urban242
Water Security Research Alliance Technical Report No. 28. Griffith University, Queens-243
land, Australia.244
11 Simon, May. 20, 2014

List of Tables245
1 The skew and kurtosis of the datasets. The very high kurtosis indicates that246
the data is not normal. Thus the Bootstrap method is used to find confidence247
intervals. . . . . . . . . . . . . . . . . . . . . . . . . . . . . . . . . . . . . . . 13248
2 A summary of the estimated price of water conserved by using PET bottles249
as floating covers. . . . . . . . . . . . . . . . . . . . . . . . . . . . . . . . . . 14250
12 Simon, May. 20, 2014

TABLE 1: The skew and kurtosis of the datasets. The very high kurtosis indicates that thedata is not normal. Thus the Bootstrap method is used to find confidence intervals.
Variable Skew KurtosisControl 0.59 11.57
Empty Bottles 3.63 31.76Sand-filled Bottles 0.64 12.40
13 Simon, May. 20, 2014

TABLE 2: A summary of the estimated price of water conserved by using PET bottles asfloating covers.
Value Optimistic Estimate Pessimistic
Price of Water [USD/m3] 1.16 0.50 0.035Price of PET Waste [USD/kg] 0.03 0.58 0.75Bottle Weight [g] 20 20 28Cross-section [m2] 0.028 0.02 0.012Avg. Yearly Evaporation [mm/year] 2250 2250 2250Evaporation Reduction [%] 58 40 18Bottle lifetime [years] 20 10 1Bottle Price [USD] 0.001 0.012 0.015Filled Bottle Price [USD] 0.006 0.017 0.020Filled Coverage Price [USD/m2] 0.28 0.82 0.98Cost of Saved Water [USD/m3] 0.01 0.09 2.42
14 Simon, May. 20, 2014

List of Figures251
1 The evaporation ponds from the experimental setup. . . . . . . . . . . . . . 16252
2 The total water that has evaporated from each pan over the course of the253
experiment. Due to the leak in one of the ‘Empty’ treatments, those data254
from day 39 and day 46 to day 52 were excluded from the final hypothesis255
test. The slight difference . . . . . . . . . . . . . . . . . . . . . . . . . . . . 17256
3 Above are the histograms of the evaporation rates for the treatments and the257
control. The long tails indicate that the data collected is not normal. . . . . 18258
4 The graphical results of a multi compare test with a p-value of 0.1. Both259
treatments are significantly different from the control, but are not significantly260
different from each other. The addition of the soil does not significantly affect261
the evaporation reduction of the intervention even though there appears to be262
a small difference in Figure 2. . . . . . . . . . . . . . . . . . . . . . . . . . . 19263
5 A histogram of resampled with replacement. It shows that 90% of resampled264
days reduce evaporation by at least 1.1 mm/day . . . . . . . . . . . . . . . . 20265
6 An evaporation pond from the experiment with the empty bottle treatment. 21266
15 Simon, May. 20, 2014

FIG. 1: The evaporation ponds from the experimental setup.
16 Simon, May. 20, 2014
0 20 40 60 80
0
100
200
300
400
500
600
Days into experiment
Tota
l w
ate
r e
va
po
ratio
n [
mm
]
Control
Empty Bottle
Soil Filled Bottle
FIG. 2: The total water that has evaporated from each pan over the course of the experiment.Due to the leak in one of the ‘Empty’ treatments, those data from day 39 and day 46 to day52 were excluded from the final hypothesis test. The slight difference
17 Simon, May. 20, 2014

−5 0 5
0
10
20
30
40
50
60
70
80
90
Control evaporation rate histogram
Evaporation rate (mm/day)
Nu
mb
er
of
oc
cu
rre
nc
es
−5 0 5
0
10
20
30
40
50
60
70
80
90
Treatment evaporation rate histogram
Evaporation rate (mm/day)
Nu
mb
er
of
oc
cu
rre
nc
es
FIG. 3: Above are the histograms of the evaporation rates for the treatments and the control.The long tails indicate that the data collected is not normal.
18 Simon, May. 20, 2014

2 3 4 5 6 7 8
Sand−filled
Empty
Control
Multiple Comparison (p=0.1)
Mean Daily Evaporation Rate [mm/day]
FIG. 4: The graphical results of a multi compare test with a p-value of 0.1. Both treatmentsare significantly different from the control, but are not significantly different from eachother. The addition of the soil does not significantly affect the evaporation reduction of theintervention even though there appears to be a small difference in Figure 2.
19 Simon, May. 20, 2014

−0.2 0 0.2 0.4 0.6
0
0.5
1
1.5
2
2.5
3
3.5
4
4.5x 10
4 Resampled Distribution
Mean−shift for Reduced Evaporation
Nu
mb
er
of
Re
sults
FIG. 5: A histogram of resampled with replacement. It shows that 90% of resampled daysreduce evaporation by at least 1.1 mm/day
20 Simon, May. 20, 2014

FIG. 6: An evaporation pond from the experiment with the empty bottle treatment.
21 Simon, May. 20, 2014