Embed Size (px)
Citation preview
Reducing Hybrid Disk Write Latency with Flash-Backed I/O Requests
Timothy Bisson, Scott A. BrandtUniversity of California, Santa Cruz
Speaker: Sehwan Lee
MASCOTS 2007
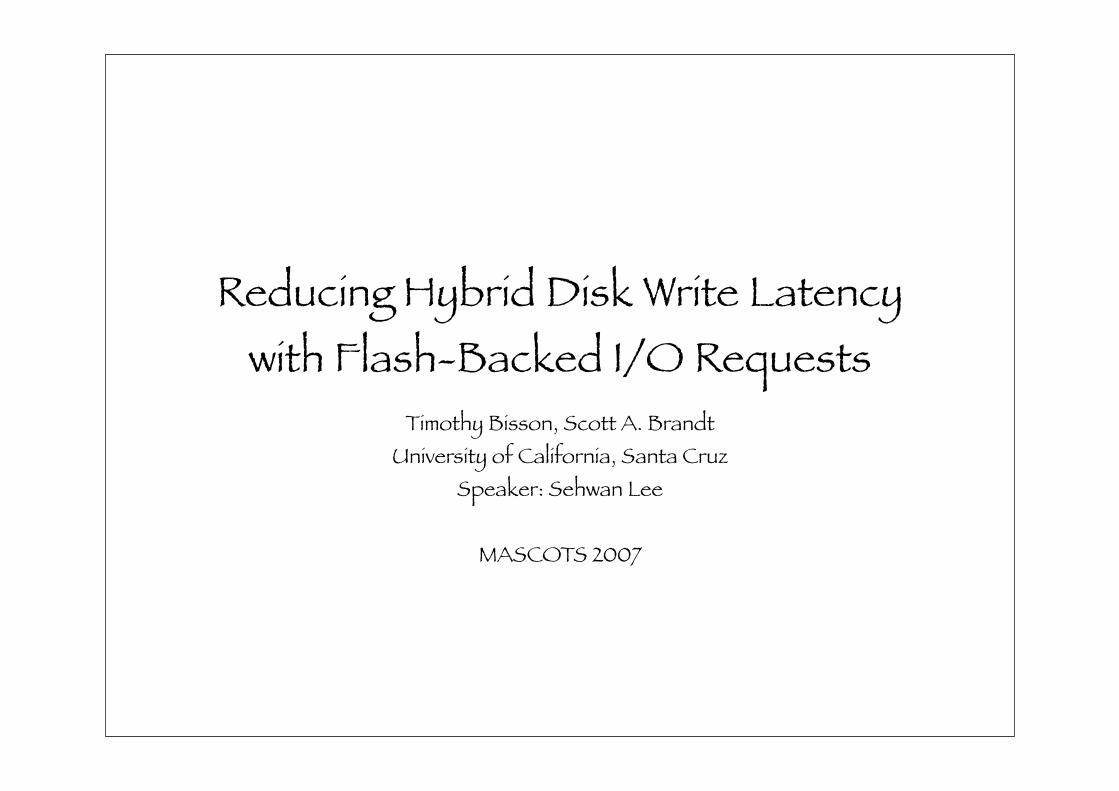
IntroductionHard Disks
Slow, mainly due to seek time
Techniques to Improve the PerformancePage cachingI/O schedulingFile system allocation/defragmentation
Flash-Backed I/ORedirecting write requests to flash media
MotivationI/O Write Latency
is responsible for a large portion of total disk access time
File System Allocation Policiestry to minimize write latency by providing spatial locality of file data through contiguous file block allocation
Flash-Backed I/O RequestsThe Goal of Flash-Backed I/O requests
Reducing I/O latencyAdditional I/O queues persist both in main memory and in NVCache
Certain write requests persist in main memory, but are backed in the NV Cache
Data integrity is preserved in the event of a power failure
Flash-Backed I/O RequestsHybrid Drives
ATA commands for controlling NVCache on hybrid disks are specified in the ATA8 spec.Sectors stored in the NVCache
Pinned sectorsA host specifies multiple sectors with an extent-like interface, called LBA Range Entries by setting Popilate Immediately bit
Unpinned sectors
NV Cache Power ModeThe drive will redirect all I/O to the NVCahce if possible and use an aggressive disk spin-down pollicy
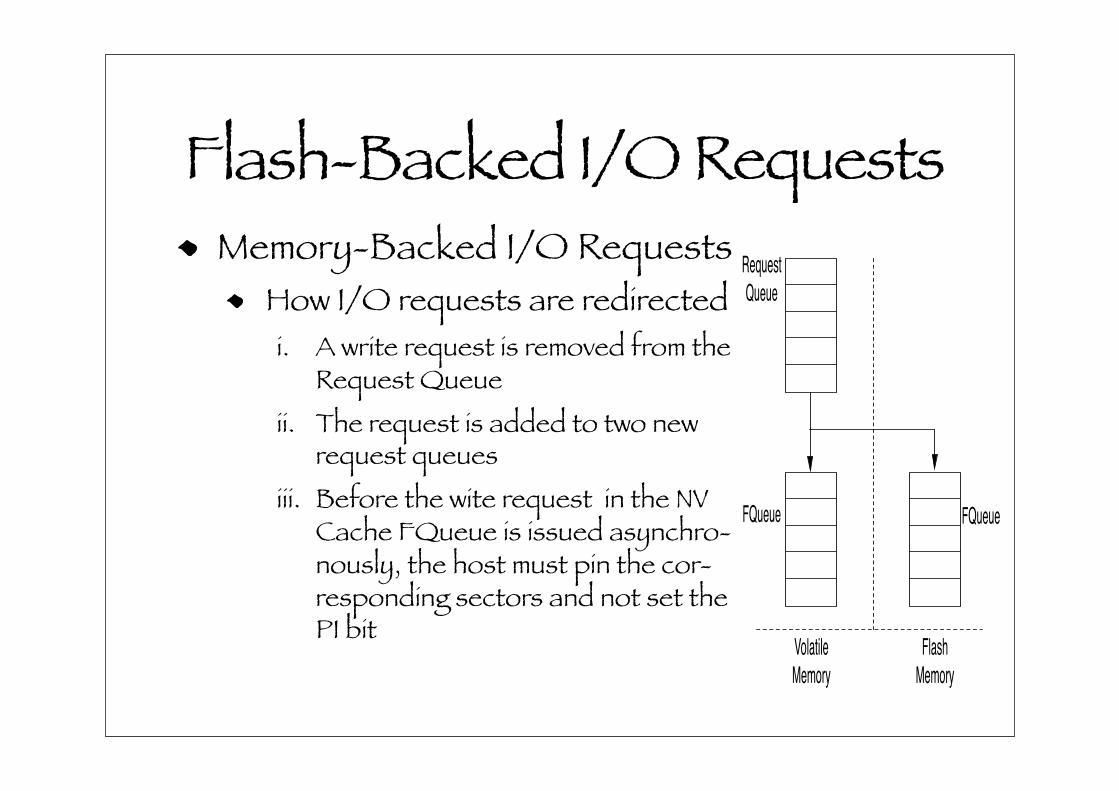
Flash-Backed I/O RequestsMemory-Backed I/O Requests
How I/O requests are redirectedi. A write request is removed from the
Request Queueii. The request is added to two new
request queuesiii. Before the wite request in the NV
Cache FQueue is issued asynchro-nously, the host must pin the cor-responding sectors and not set the PI bit
!"#$"%&
'$"$"
('$"$" ('$"$"
)*+,&-+"
."/*01
(+,%2
."/*01
(a) Redirection
!"#$"%&
'$"$"
('$"$" ('$"$"
)*+,&-+"
."/*01
(+,%2
."/*01
!*&,&-34
."5-,
6*,+"%7" 8 8
(b) Coalesce
Figure 5. HIO Scheduling
3.2 Memory-Backed IO Requests
This section describes how I/O requests are redirected
and coalesced with Flash Backed I/O Requests. Figure 5(a)
shows how I/O requests are redirected. When a write re-
quest is redirected, it is removed from the Request Queue,
which exists in main memory. The Request Queue refers to
the traditional I/O scheduling queue. After being removed
from the Request Queue, the request is added to two new re-
quest queues: the main memory FQueue and a non-volatile
FQueue (NVCache). Adding the request to the main mem-
ory FQueue moves the request reference between the two
queues. Adding the request to the non-volatile FQueue in-
volves issuing an asynchronous write request to it. How-
ever, before the write request is issued, the host must pin
the corresponding sectors and not set the Populate Immedi-
ate bit. The pinning and unpinning operations is very fast
(microseconds) because the disk need only set bits in its
volatile memory to accomplish this.
Although the goal is to reduce write latency, we still
must push FQueue requests back to rotating media. As a
result, the volatile FQueue is fundamentally a cache for ro-
tating media, but backed by non-volatile memory. There-
fore, the content of the two FQueues at any given time are
identical—the sole purpose of the flash FQueue is to pre-
vent data loss from the volatile FQueue in the case of power
failure. Since the volatile FQueue is akin to a cache, when
requests are kept in memory longer more opportunities ex-
ist to coalesce the volatile FQueue contents with write and
read requests from the Request Queue.
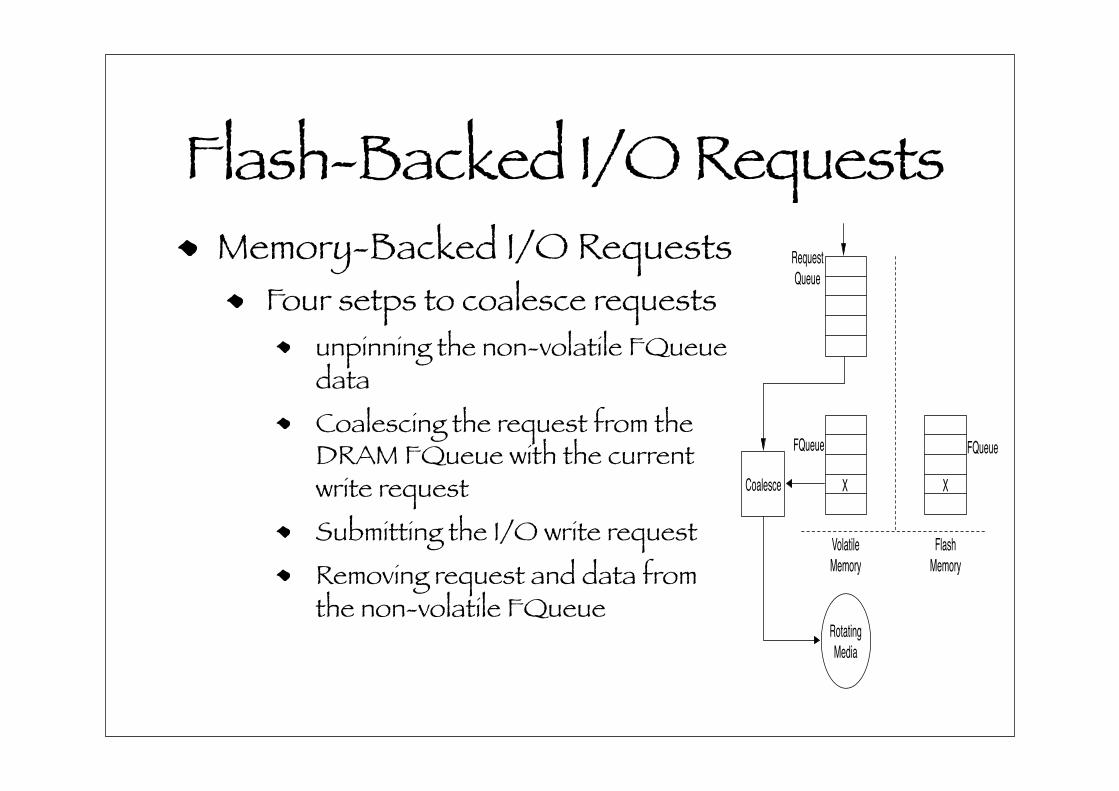
Figure 5(b) shows how I/O requests are coalesced. Co-
alescing requests involves four steps: (1) unpin the non-
volatile FQueue data, (2) coalesce the request from the
DRAM FQueue with the current write request, (3) submit-
ting the I/O write request, and (4) removing request and data
from the non-volatile FQueue.
The first step is to use the ATA NVCache unpin
command to remove a particular set of LBAs from the
NVCache. Step two coalesces the in-memory requests data
and step three submits the requests with the modified re-
quest data and request itself to reflect the new content. Since
none of the LBAs in the request are pinned, the request is
directed entirely to rotating media and not the NVCache.
Finally the last step is to remove the request and its data
from the non-volatile FQueue.
It must be noted that the DRAM and flash size of the
FQueue for hybrid I/O scheduling must be the same. It
doesn’t make sense to have more or less DRAM FQueue
than flash FQueue. If there is more DRAM FQueue mem-
ory, then safety is lost because any requests in the DRAM
FQueue may not be backed by the NVCache. If there
is more non-volatile FQueue, the performance benefit of
I/O redirection is mitigated because fewer requests can be
stored in the DRAM FQueue.
3.3 When to Redirect
The fundamental goal of flash-backed I/O request is to
reduce the overall I/O write bottleneck. To that end, only
if an I/O request will reduce write latency should it be
placed on the volatile and non-volatile FQueues. In order
to make such a decision, the redirection algorithm relies on
the inter-block random access times of flash and rotating
media. Since random access time is a function of the inter-
block distance for rotating media, it is necessary to know the
location of the last I/O (head location). However for flash,
4
Flash-Backed I/O RequestsMemory-Backed I/O Requests
Four setps to coalesce requestsunpinning the non-volatile FQueue dataCoalescing the request from the DRAM FQueue with the current write requestSubmitting the I/O write requestRemoving request and data from the non-volatile FQueue
!"#$"%&
'$"$"
('$"$" ('$"$"
)*+,&-+"
."/*01
(+,%2
."/*01
(a) Redirection
!"#$"%&
'$"$"
('$"$" ('$"$"
)*+,&-+"
."/*01
(+,%2
."/*01
!*&,&-34
."5-,
6*,+"%7" 8 8
(b) Coalesce
Figure 5. HIO Scheduling
3.2 Memory-Backed IO Requests
This section describes how I/O requests are redirected
and coalesced with Flash Backed I/O Requests. Figure 5(a)
shows how I/O requests are redirected. When a write re-
quest is redirected, it is removed from the Request Queue,
which exists in main memory. The Request Queue refers to
the traditional I/O scheduling queue. After being removed
from the Request Queue, the request is added to two new re-
quest queues: the main memory FQueue and a non-volatile
FQueue (NVCache). Adding the request to the main mem-
ory FQueue moves the request reference between the two
queues. Adding the request to the non-volatile FQueue in-
volves issuing an asynchronous write request to it. How-
ever, before the write request is issued, the host must pin
the corresponding sectors and not set the Populate Immedi-
ate bit. The pinning and unpinning operations is very fast
(microseconds) because the disk need only set bits in its
volatile memory to accomplish this.
Although the goal is to reduce write latency, we still
must push FQueue requests back to rotating media. As a
result, the volatile FQueue is fundamentally a cache for ro-
tating media, but backed by non-volatile memory. There-
fore, the content of the two FQueues at any given time are
identical—the sole purpose of the flash FQueue is to pre-
vent data loss from the volatile FQueue in the case of power
failure. Since the volatile FQueue is akin to a cache, when
requests are kept in memory longer more opportunities ex-
ist to coalesce the volatile FQueue contents with write and
read requests from the Request Queue.
Figure 5(b) shows how I/O requests are coalesced. Co-
alescing requests involves four steps: (1) unpin the non-
volatile FQueue data, (2) coalesce the request from the
DRAM FQueue with the current write request, (3) submit-
ting the I/O write request, and (4) removing request and data
from the non-volatile FQueue.
The first step is to use the ATA NVCache unpin
command to remove a particular set of LBAs from the
NVCache. Step two coalesces the in-memory requests data
and step three submits the requests with the modified re-
quest data and request itself to reflect the new content. Since
none of the LBAs in the request are pinned, the request is
directed entirely to rotating media and not the NVCache.
Finally the last step is to remove the request and its data
from the non-volatile FQueue.
It must be noted that the DRAM and flash size of the
FQueue for hybrid I/O scheduling must be the same. It
doesn’t make sense to have more or less DRAM FQueue
than flash FQueue. If there is more DRAM FQueue mem-
ory, then safety is lost because any requests in the DRAM
FQueue may not be backed by the NVCache. If there
is more non-volatile FQueue, the performance benefit of
I/O redirection is mitigated because fewer requests can be
stored in the DRAM FQueue.
3.3 When to Redirect
The fundamental goal of flash-backed I/O request is to
reduce the overall I/O write bottleneck. To that end, only
if an I/O request will reduce write latency should it be
placed on the volatile and non-volatile FQueues. In order
to make such a decision, the redirection algorithm relies on
the inter-block random access times of flash and rotating
media. Since random access time is a function of the inter-
block distance for rotating media, it is necessary to know the
location of the last I/O (head location). However for flash,
4
Flash-Backed I/O RequestsWhen to Redirect
Case I. coalsecing!"#$%&'(')*#+)#,%-',%&+#,%./%(+#"!
!"#$!"%&'!"()"*&+,-./012-34-5678
####!"#0++%12+#+)#&)34%(&%#,%./%(+#5'+6#-3+3#7,)1#-,31#7./%/%#"!
!!!!9:;.<-5:-/8#=->'2-39#:;#%?@A"*%"'B$&C'D()")"+2-34-567
1111EF1+:;.<-5:-/1GG1624-716,-=
11111111!"#<%1)=%#&)34%(&%-#-3+3#7,)1#!3(6#"!
11111111)HI$H'!"()"*&'D!?J'DA@*C+2-34-5601=->'2-37
11111111!"#>/?1'+#&)34%(&%-#,%./%(+#"!
11111111*)KJ$&'%?@A"*%"#'!"()"*&+=->'2-37
11111111!"#@4%3,#&)34%(&%-#-3+3#7,)1#-,31#7./%/%#"!
11111111%A"@!'#!@J'D()")"'!"()"*&+2-34-5601=->'2-37
111111112-642=
1111-=/EF
1111!"A%+#B!C#3&&%((#+'1%("!
1111,'=18G1@%%"**'&$J"+,-./012-34-56LM<N=7
1111='==18G1@%%"**'&$J"+2-34-56LM<N=012-34-56LM=-O6LM<N=7
1111F=18G1DA@*C'@%%"**'&$J"+2-34-56LM5EP-7
1111,'==18G1@%%"**'&$J"+,-./012-34-56LM=-O6LM<N=7#
1111
1111!">6)/4-#,%-',%&+')*#)&&/,"!
1111EF1++,'=1Q1='==71M1+F=1Q1,'==7716,-=
########!"2'*#,%./%(+#'*#!3(6"!
########I$H'!"()"*&'$H'DA@*C+2-34-567
1111111
11111111!"3--#,%./%(+#+)#-,31#7./%/%"!
11111111@##'!"()"*&'&?'#!@J'D()")"+2-34-567
1111-=/EF
1111!"(/?1'+#,%-',%&+%-#,%./%(+"!111
1111*)KJ$&'!"()"*&+2-34-56711111111
Figure 6. Algorithm for REDIRECT REQUEST
such information is unnecessary as it has constant random
access time, as previously shown in Figure 2.
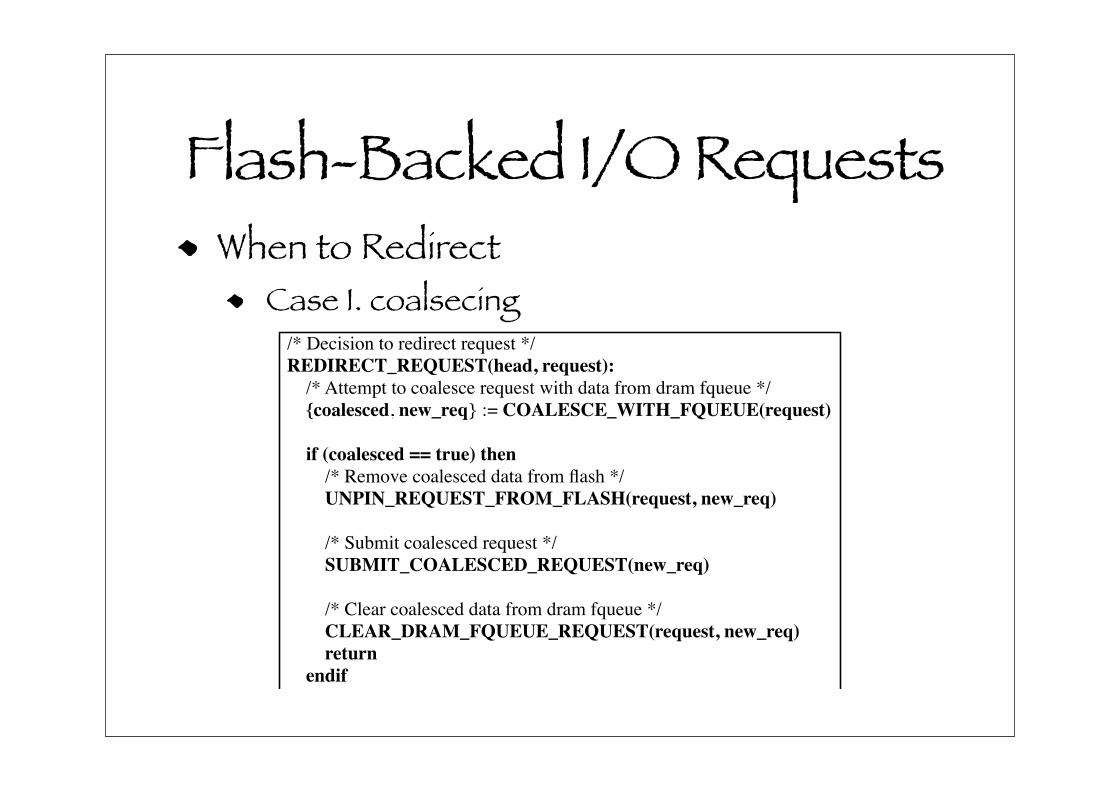
We have developed a algorithm to determine which re-
quests are redirected to the FQueue. The decision takes as
input the disk drive’s head location, current request infor-
mation, and information about the next request information.
The algorithm is shown in Figure 6. The first thing to no-
tice is that the algorithm first tries to coalesce the current
request with a request from the FQueue. If this is possible
the algorithm will not attempt to redirect I/O because the
corresponding FQueue request is able to piggy-back on the
current request to rotating media. Note that this algorithm
is only entered on a write request. If the request isn’t co-
alesced (coalesced = false) we extract I/O access times for
four possible requests for the NVCache and rotating media.
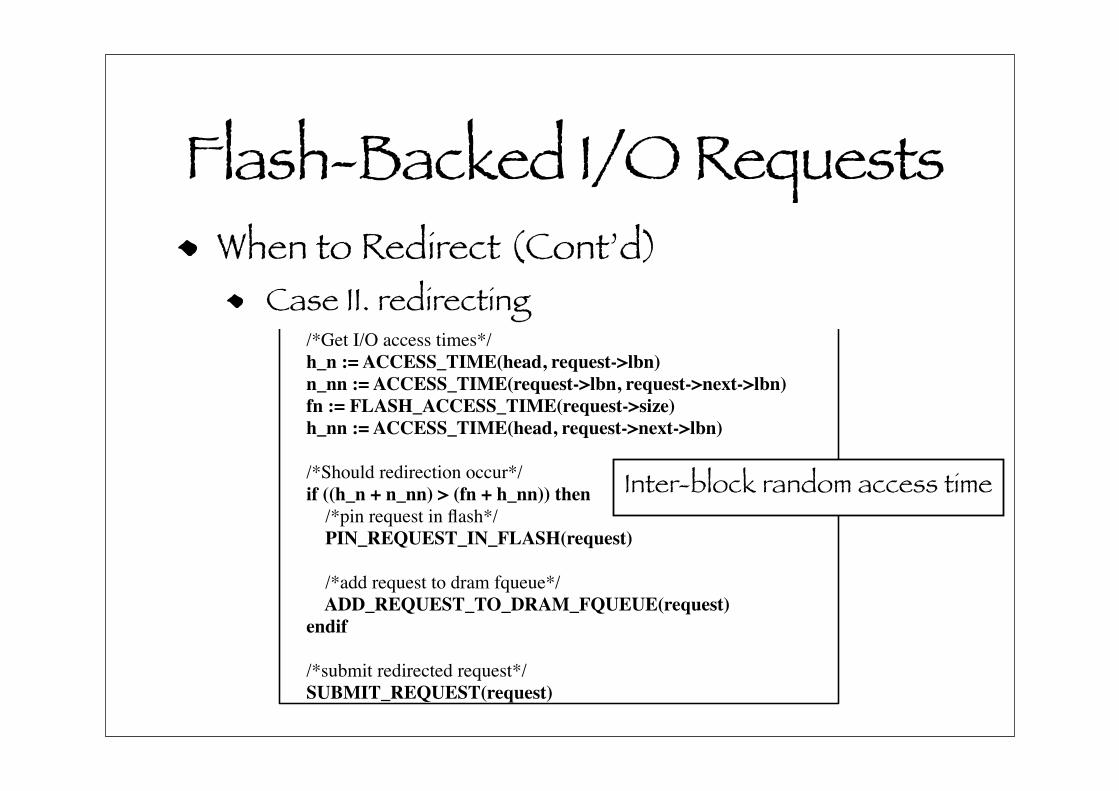
Given these access times, if the inequality:
(h n+n nn) ! (fn+h nn)is true, the current request is redirected to the FQueues. In
this inequality, h n is the access time from the current LBA
location of the disk head to the current request’s LBA lo-
cation. Correspondingly, n nn is the access time from the
current request’s LBA location to the next request’s LBA lo-
cation. fn is the flash access time for current request, which
dependent only on the request size, while h n is the access
time from the current LBA location of the disk head to the
next request’s LBA location.
The goal of the redirection inequality is to redirect I/O
requests to the FQueues that will result in less disk head
seeking. In effect, this algorithm is looking into the future to
see whether redirecting the current request to the FQueues
is more efficient than sending it to rotating media because it
includes the access time of the next request into the redirec-
tion decision.
For example, consider a request with a starting sector far
away from the head’s current location but in between sev-
eral requests spatially near each other. If the decision to
redirect is based solely on the head’s current position and
the next request, no consideration is given about the impact
of the decision on following requests. If the request is redi-
rected to flash, the head will remain at the same location. As
a result, the following requests (spatially near each other)
will also be redirected to flash because of the disk head’s rel-
ative location to the spatially nearby requests, and cause the
FQueue space to quickly become polluted. However, since
the following requests are spatially near each other, it would
have been more efficient to service them with rotating me-
dia. In order to do that, the scheduling algorithm needs to
consider the following request’s location when making a de-
cision about whether or not to redirect a given request. This
is in effect what the algorithm in Figure 6 does.
3.4 Idle-Time Processing
A benefit of flash-backed I/O requests is that the FQueue
requests act like a cache for disk requests, but are backed by
non-volatile storage. We propose that an operating system
leverage the FQueue to perform delayed I/O. By waiting un-
til the Request Queue is empty, and then flushing FQueue
requests back to rotating media, requests can be written to
rotating media asynchronously. From the user’s perspec-
tive, any requests that exist in the FQueue are considered
completed because they are backed in non-volatile media.
Therefore flushing requests from the FQueue to rotating
media while the Request Queue is empty is considered Idle-
Time Processing, and another example application of Gold-
ing’s hypothesis that idleness is not a sloth [3].
The order in which idle-time processing purges the
FQueue occurs is the same order as flushing—FIFO order
with request merging. Additionally, it should be noted that
more opportunities to perform idle-time processing exist
with larger FQueue sizes, further reducing user perceived
I/O latency. Perceived I/O latency is the time to push an in-
coming user request to a non-volatile media, be it flash or
rotating media.
3.5 Flushing Requests
The volatile and non-volatile FQueues have a finite size.
If the rate at which requests are redirected to the FQueues
is higher than the coalescing rate, the FQueues will become
5
Flash-Backed I/O RequestsWhen to Redirect (Cont’d)
Case II. redirecting
!"#$%&'(')*#+)#,%-',%&+#,%./%(+#"!
!"#$!"%&'!"()"*&+,-./012-34-5678
####!"#0++%12+#+)#&)34%(&%#,%./%(+#5'+6#-3+3#7,)1#-,31#7./%/%#"!
!!!!9:;.<-5:-/8#=->'2-39#:;#%?@A"*%"'B$&C'D()")"+2-34-567
1111EF1+:;.<-5:-/1GG1624-716,-=
11111111!"#<%1)=%#&)34%(&%-#-3+3#7,)1#!3(6#"!
11111111)HI$H'!"()"*&'D!?J'DA@*C+2-34-5601=->'2-37
11111111!"#>/?1'+#&)34%(&%-#,%./%(+#"!
11111111*)KJ$&'%?@A"*%"#'!"()"*&+=->'2-37
11111111!"#@4%3,#&)34%(&%-#-3+3#7,)1#-,31#7./%/%#"!
11111111%A"@!'#!@J'D()")"'!"()"*&+2-34-5601=->'2-37
111111112-642=
1111-=/EF
1111!"A%+#B!C#3&&%((#+'1%("!
1111,'=18G1@%%"**'&$J"+,-./012-34-56LM<N=7
1111='==18G1@%%"**'&$J"+2-34-56LM<N=012-34-56LM=-O6LM<N=7
1111F=18G1DA@*C'@%%"**'&$J"+2-34-56LM5EP-7
1111,'==18G1@%%"**'&$J"+,-./012-34-56LM=-O6LM<N=7#
1111
1111!">6)/4-#,%-',%&+')*#)&&/,"!
1111EF1++,'=1Q1='==71M1+F=1Q1,'==7716,-=
########!"2'*#,%./%(+#'*#!3(6"!
########I$H'!"()"*&'$H'DA@*C+2-34-567
1111111
11111111!"3--#,%./%(+#+)#-,31#7./%/%"!
11111111@##'!"()"*&'&?'#!@J'D()")"+2-34-567
1111-=/EF
1111!"(/?1'+#,%-',%&+%-#,%./%(+"!111
1111*)KJ$&'!"()"*&+2-34-56711111111
Figure 6. Algorithm for REDIRECT REQUEST
such information is unnecessary as it has constant random
access time, as previously shown in Figure 2.
We have developed a algorithm to determine which re-
quests are redirected to the FQueue. The decision takes as
input the disk drive’s head location, current request infor-
mation, and information about the next request information.
The algorithm is shown in Figure 6. The first thing to no-
tice is that the algorithm first tries to coalesce the current
request with a request from the FQueue. If this is possible
the algorithm will not attempt to redirect I/O because the
corresponding FQueue request is able to piggy-back on the
current request to rotating media. Note that this algorithm
is only entered on a write request. If the request isn’t co-
alesced (coalesced = false) we extract I/O access times for
four possible requests for the NVCache and rotating media.
Given these access times, if the inequality:
(h n+n nn) ! (fn+h nn)is true, the current request is redirected to the FQueues. In
this inequality, h n is the access time from the current LBA
location of the disk head to the current request’s LBA lo-
cation. Correspondingly, n nn is the access time from the
current request’s LBA location to the next request’s LBA lo-
cation. fn is the flash access time for current request, which
dependent only on the request size, while h n is the access
time from the current LBA location of the disk head to the
next request’s LBA location.
The goal of the redirection inequality is to redirect I/O
requests to the FQueues that will result in less disk head
seeking. In effect, this algorithm is looking into the future to
see whether redirecting the current request to the FQueues
is more efficient than sending it to rotating media because it
includes the access time of the next request into the redirec-
tion decision.
For example, consider a request with a starting sector far
away from the head’s current location but in between sev-
eral requests spatially near each other. If the decision to
redirect is based solely on the head’s current position and
the next request, no consideration is given about the impact
of the decision on following requests. If the request is redi-
rected to flash, the head will remain at the same location. As
a result, the following requests (spatially near each other)
will also be redirected to flash because of the disk head’s rel-
ative location to the spatially nearby requests, and cause the
FQueue space to quickly become polluted. However, since
the following requests are spatially near each other, it would
have been more efficient to service them with rotating me-
dia. In order to do that, the scheduling algorithm needs to
consider the following request’s location when making a de-
cision about whether or not to redirect a given request. This
is in effect what the algorithm in Figure 6 does.
3.4 Idle-Time Processing
A benefit of flash-backed I/O requests is that the FQueue
requests act like a cache for disk requests, but are backed by
non-volatile storage. We propose that an operating system
leverage the FQueue to perform delayed I/O. By waiting un-
til the Request Queue is empty, and then flushing FQueue
requests back to rotating media, requests can be written to
rotating media asynchronously. From the user’s perspec-
tive, any requests that exist in the FQueue are considered
completed because they are backed in non-volatile media.
Therefore flushing requests from the FQueue to rotating
media while the Request Queue is empty is considered Idle-
Time Processing, and another example application of Gold-
ing’s hypothesis that idleness is not a sloth [3].
The order in which idle-time processing purges the
FQueue occurs is the same order as flushing—FIFO order
with request merging. Additionally, it should be noted that
more opportunities to perform idle-time processing exist
with larger FQueue sizes, further reducing user perceived
I/O latency. Perceived I/O latency is the time to push an in-
coming user request to a non-volatile media, be it flash or
rotating media.
3.5 Flushing Requests
The volatile and non-volatile FQueues have a finite size.
If the rate at which requests are redirected to the FQueues
is higher than the coalescing rate, the FQueues will become
5
Inter-block random access time
Flash-Backed I/O RequestsIdle-Time Processing
Benefits of flash-backed I/O requestsFQueue requests act like a cache for disk requestsFQueue requests are backed by non-bolatile storage
Idle-Time Processing Flushing requests from the FQueue to ratating media while the Request Queue is empty
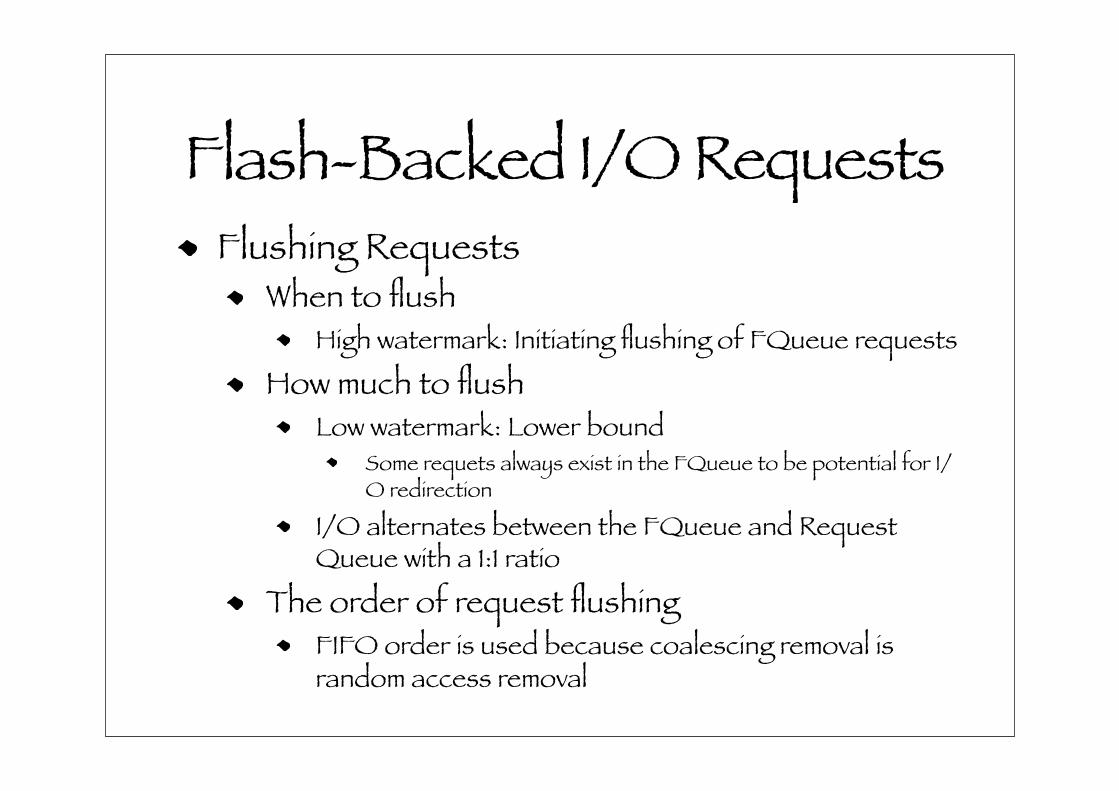
Flash-Backed I/O RequestsFlushing Requests
When to flushHigh watermark: Initiating flushing of FQueue requests
How much to flushLow watermark: Lower bound
Some requets always exist in the FQueue to be potential for I/O redirection
I/O alternates between the FQueue and Request Queue with a 1:1 ratio
The order of request flushingFIFO order is used because coalescing removal is random access removal
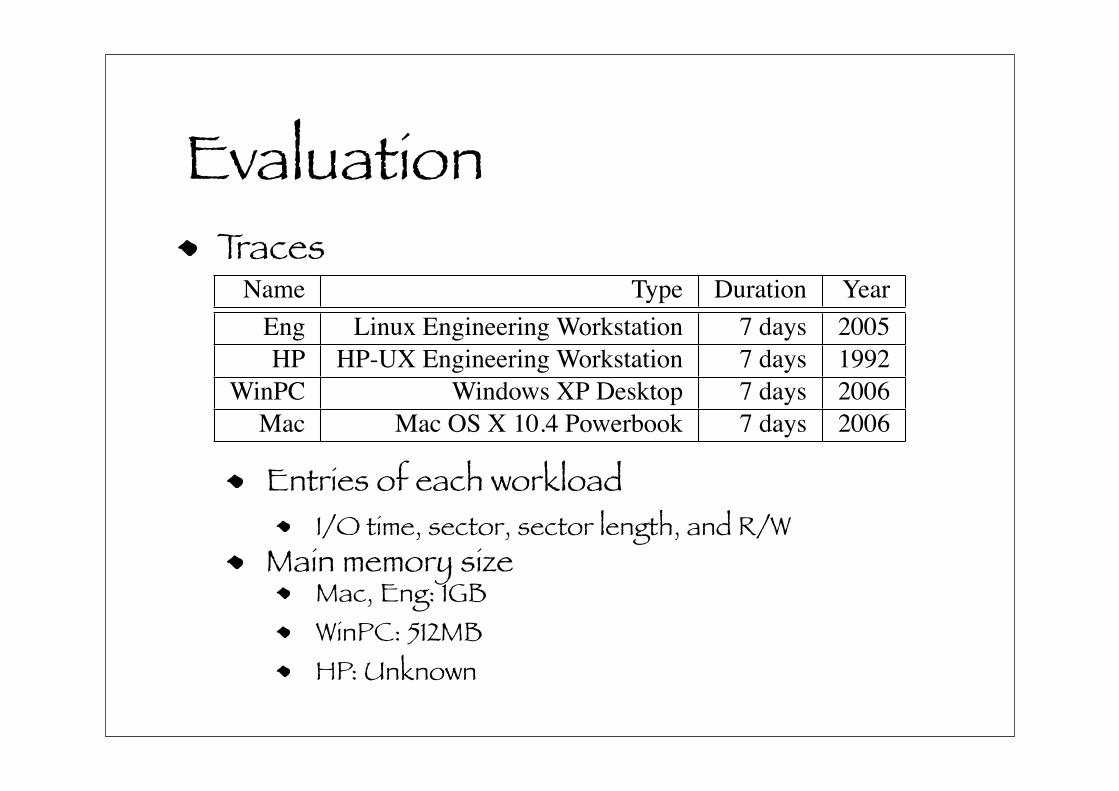
Evaluation
Name Type Duration Year
Eng Linux Engineering Workstation 7 days 2005
HP HP-UX Engineering Workstation 7 days 1992
WinPC Windows XP Desktop 7 days 2006
Mac Mac OS X 10.4 Powerbook 7 days 2006
Table 2. Block-Level Trace Workloads
full. As a result FQueue requests need to be flushed. Fortu-
nately, because there is a copy of the FQueue request (and
request data) in volatile memory, only an unpin and write
request operation are needed—reading the redirected data
from the flash is unnecessary.
Flushing requests from the FQueue is comprised of three
steps: (1) when to flush, (2) how much to flush, and (3)
the order of request flushing. In order to minimize flush-
ing overhead, we use two watermarks (high and low) to
guide when to begin flushing and how much to flush. The
high watermark is used to initiate flushing of FQueue re-
quests back to rotating media. Requests are flushed from
the FQueue until a low watermark is reached. While flush-
ing occurs, I/O alternates between the FQueue and Re-
quest Queue with a 1:1 ratio. All I/O operations orig-
inating from the Request Queue only execute the COA-
LESCE WITH FQUEUE phase from Figure 6 and are di-
rected to rotating media. The goal of the low watermark
is that some requests always exist in the FQueue and as
a result there is always potential for I/O redirection. The
high-watermark prevents FQueue flushing from the block-
ing Request Queue processing.
The order of request flushing from the FQueue is done
in FIFO order. FIFO is used because coalescing removal
is random access removal. This means the oldest FQueue
requests haven’t been coalesced yet and may be unlikely to
be coalesced with a Request Queue request. Therefore, such
requests should be removed from the FQueue to make room
for other FQueue requests. To minimize the total number
of FQueue requests issued back to rotating media, FQueue
flushing first attempts to merge any existing requests in the
FQueue with the next request scheduled to be written to ro-
tating media.
4 Evaluation
In order to evaluate the potential benefit of Hybrid I/O
scheduling, we implemented a hybrid disk simulator using
the I/O access times from a Hitachi EK1000 2.5 in drive
and a Sandisk Ultra II Compact Flash media card shown
in Figure 2. Using the access times from the two devices
we replayed several block-level I/O traces through an aug-
mented I/O scheduler. The following sections describe the
workload and results of flash-backed I/O requests.
4.1 Traces
To evaluate the proposed enhancements, we use block-
level access traces gathered from four different desktop ma-
chines, which are shown in Table 2. Each workload is a
trace of disk requests from a single disk, and each entry is
contains: I/O time, sector, sector length, and read or write.
The first workload, Eng, is a trace from the root disk of
a Linux desktop used for software engineering tasks; the
ReiserFS file system resides on the root disk. The trace was
extracted by instrumenting the disk driver to record all ac-
cesses for the root disk to a memory buffer, and transfer
it to userland (via a system call) when it became full. A
corresponding userland application appended the memory
buffer to a file on a separate disk. The trace, HP, is from
a single-user HP-UX workstation [12]. The WinPC trace is
from an Windows XP desktop used mostly for web brows-
ing, electronic mail, and Microsoft Office applications. The
trace was extracted through the use of a filter driver. The
final trace, Mac is from a Macintosh PowerBook running
OS X 10.4. The trace was recorded using the Macintosh
command line tool, fs usage, by filtering out file system op-
erations and redirecting disk I/O operations for the root disk
to a USB thumb drive.
Since main memory is a resource that will be directly
consumed by flash-backed I/O requests, it is important to
know how much memory each system had at the time the
trace was taken. The Mac and Eng systems both had 1GB
of DRAM, while the WinPc had 512MB of memory. We
do not know how much memory HP had at the time the
traces were taken. Therefore, for those systems in which
we are aware of the memory capacity, 100 megabytes for
flash-backed I/O request is a 10–20% overhead.
4.2 Results
In this section we present results for flash-backed I/O
requests. We use several I/O schedulers for the Request
Queue: FCFS, SSTF, and CLOOK. Figure 7 shows the nor-
malized write access time for each trace using the three I/O
schedulers. Each scheduler is normalized to itself without
flash-backed I/O requests. This figure shows two things: (1)
there is a significant decrease in write latency when using
flash-backed I/O requests, and (2) the relative performance
of individual I/O schedulers does not differ significantly.
Although the relative performance of each I/O scheduler
6
Traces
Entries of each workloadI/O time, sector, sector length, and R/W
Main memory sizeMac, Eng: 1GBWinPC: 512MBHP: Unknown
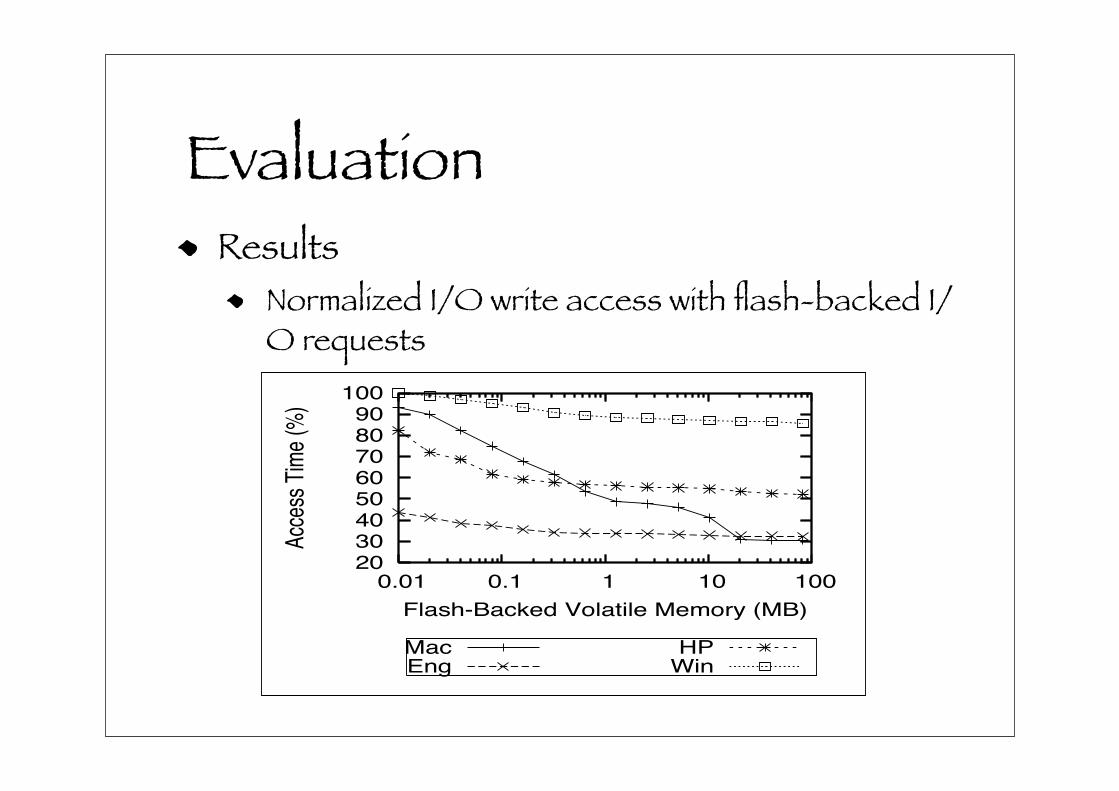
EvaluationResults
Normalized I/O write access with flash-backed I/O requests
20 30 40 50 60 70 80 90
100
0.01 0.1 1 10 100
Acc
ess
Tim
e (%
)
Flash-Backed Volatile Memory (MB)
MacEng
HPWin
(a) FCFS
20 30 40 50 60 70 80 90
100
0.01 0.1 1 10 100
Acc
ess
Tim
e (%
)
Flash-Backed Volatile Memory (MB)
MacEng
HPWin
(b) SSTF
20 30 40 50 60 70 80 90
100
0.01 0.1 1 10 100
Acc
ess
Tim
e (%
)
Flash-Backed Volatile Memory (MB)
MacEng
HPWin
(c) CLOOK
Figure 7. Normalized I/O write access with flash-backed I/O requests
0
10
20
30
40
50
0.01 0.1 1 10 100
Acc
ess
Tim
e (%
)
Flash-Backed Volatile Memory (MB)
MacEng
HPWin
(a) Idle-time FQueue purging
0
10
20
30
40
50
0.01 0.1 1 10 100
Acc
ess
Tim
e(%
)
Flash-Backed Volatile Memory (MB)
MacEng
HPWin
(b) FQueue flush purging
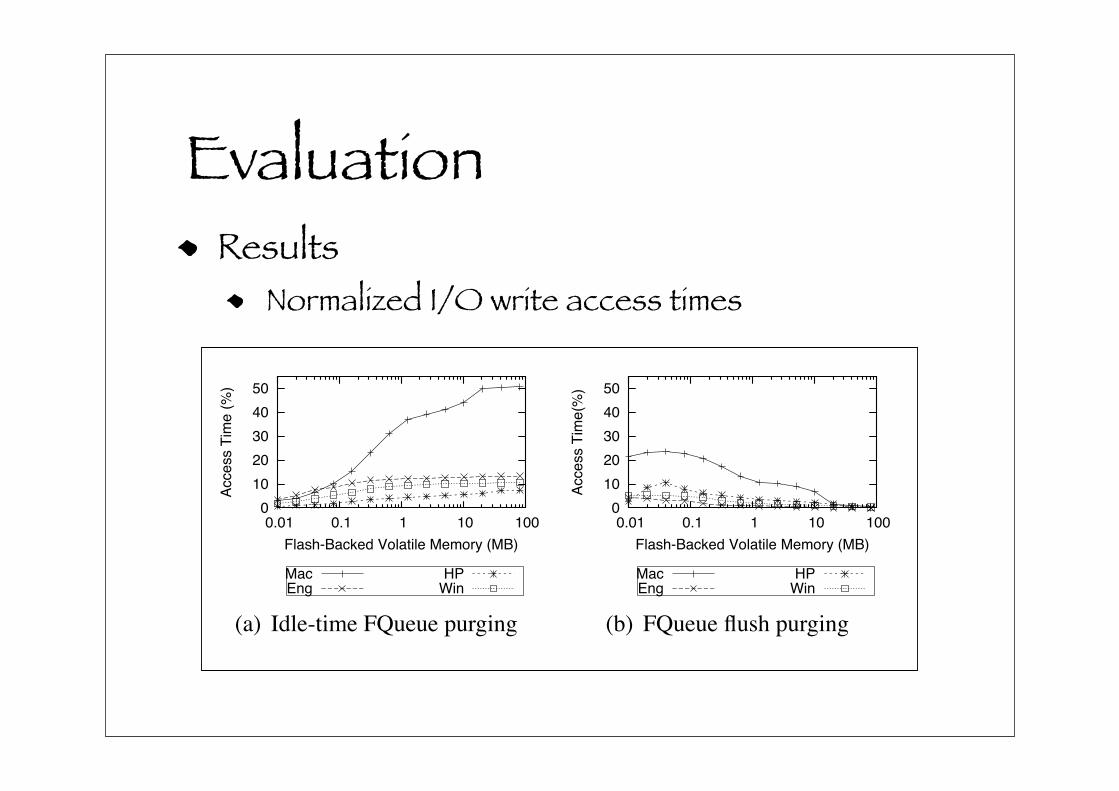
Figure 8. Normalized I/O write access times
does not change, the raw numbers do. Since the Request
Queue scheduling algorithm does not significantly impact
performance, for the remainder of the paper we only show
results for CLOOK, a fair and efficient I/O scheduler [16].
One additional thing to note about these figures is that flash-
backed I/O request performance varies significantly from
workload to workload, even though they are each classified
as desktop computing.
One reason flash-backed I/O requests can reduce write
latency by up to 75% is that flash-backed I/O request syn-
chronization (back to rotating media) can be deferred un-
til the Request Queue is empty. Figure 8(a) shows the to-
tal time spent synchronizing flash-backed I/O requests to
rotating media relative to total write-latency without flash-
backed I/O requests. This figure shows that at least 20% of
total write latency work is performed by idle-time process-
ing, and 90% of the HP workload is synchronized with only
10MB of FQueue. The significance of this result is that with
the proposed redirection algorithm we can defer writing to
the disk until the Request Queue is empty without any out-
standing I/O requests.
The next figure, Figure 8(b), shows the percentage of I/O
that occurs due to flush-back I/O. As the number of flush
operations increases the benefit of I/O redirection decreases.
In these figures we don’t flush the entire FQueue, rather,
we only flush 1/10th of the FQueue, and since we flush in
FIFO order, we flush the oldest requests first, which weren’t
overwritten or removed through a coalesced I/O.
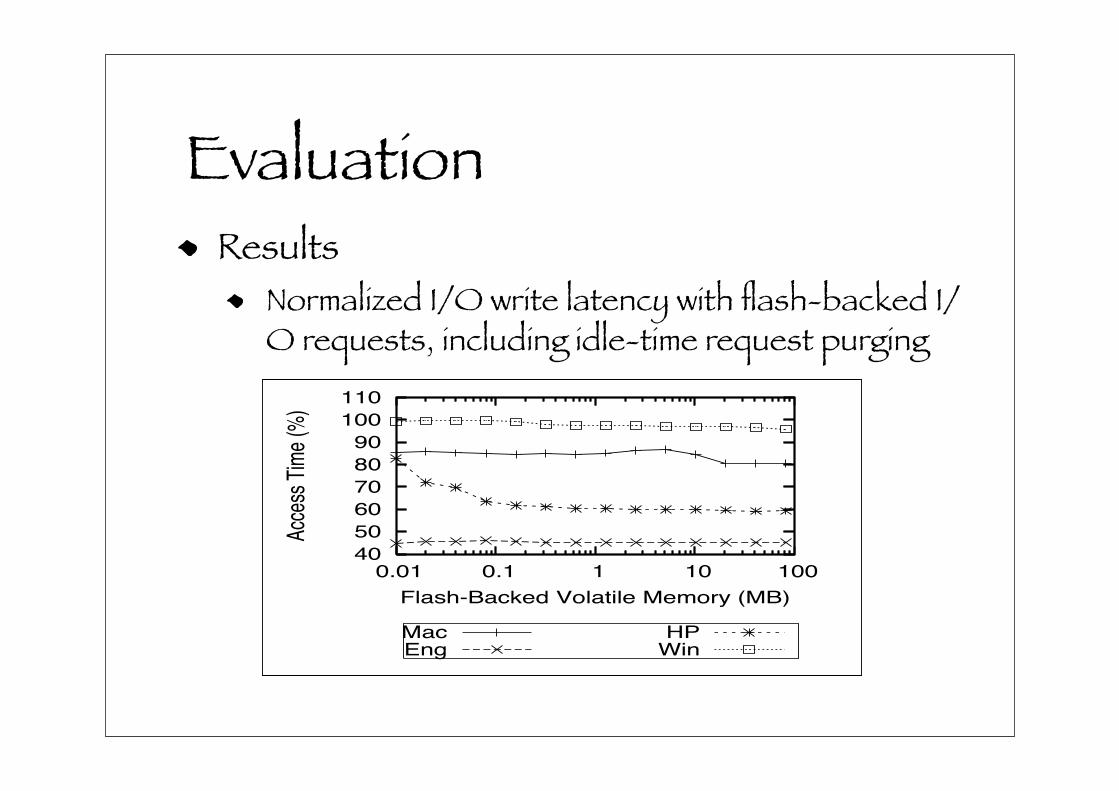
It is also useful to see what the total write latency is when
idle-time processing is included, as it shows total write la-
40
50
60
70
80
90
100
110
0.01 0.1 1 10 100
Acc
ess
Tim
e (%
)
Flash-Backed Volatile Memory (MB)
MacEng
HPWin
Figure 9. Normalized I/O write latency with
flash-backed I/O requests, including idle-time
request purging
tency for data to be committed on rotating media. The re-
sults of this experiment are shown in Figure 9, and normal-
ized to the total write-latency without flash-backed I/O re-
quests. This figure shows that, if idle-time processing is
included in the write latency, the benefit of flash-backed I/O
requests is workload dependent. The Eng and HP work-
loads show that write latency decreases by 30–50%, while
the Mac and Win trace actually increase write latency. The
increase in write-latency occurs because the cost of pushing
requests out of flash and then back rotating media negates
the benefit of redirecting to flash in the first place.
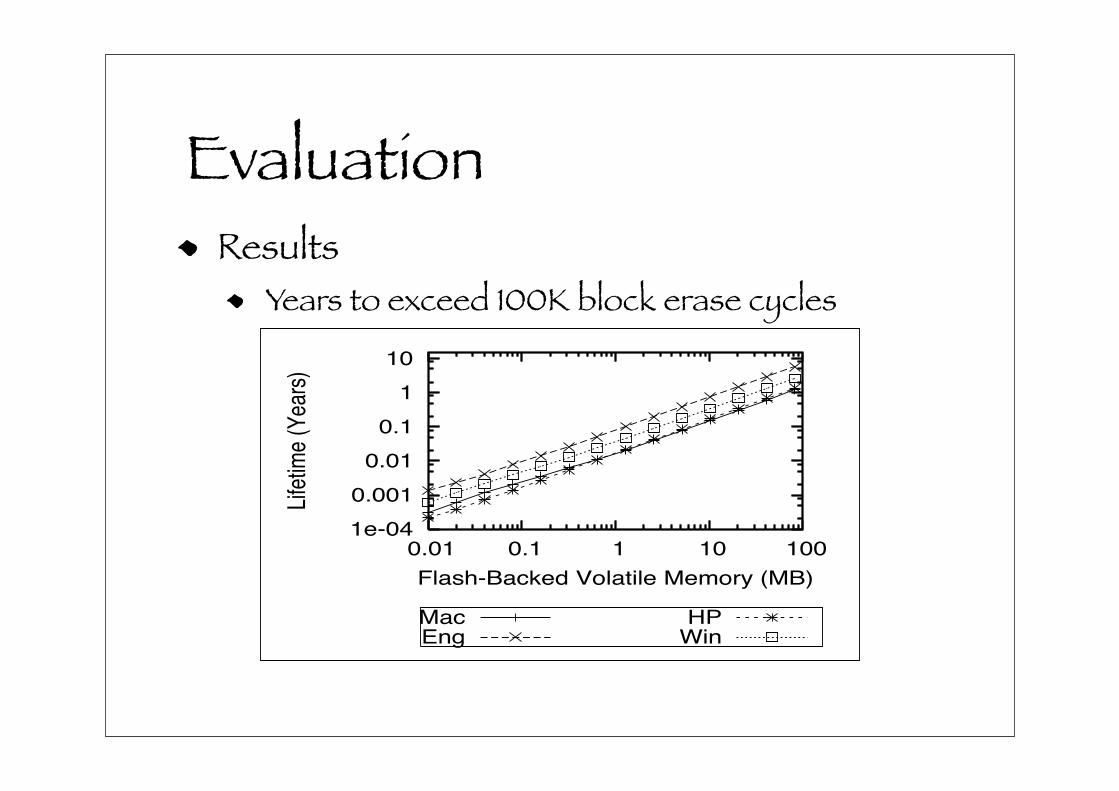
In order to assess the impact of using the NVCache for
selective write caching, we measured how many erase op-
erations occur during the 7 day traces, and then use the
observed frequency to extrapolate the number of years to
exceed an NVCache with 100,000 block erase count. We
assume an optimal wear-leveling algorithm which spreads
all writes across the entire device’s physical address space.
Figure 10 shows the results of this experiment. This figure
shows that the flash endurance increases linearly with re-
spect to the flash size, and that there is a 10/1 ratio between
the NVCache size (MB) and endurance years.
We used the performance of flash-backed I/O requests
with a current flash device to present the benefit of flash-
7
EvaluationResults
Normalized I/O write access times
20 30 40 50 60 70 80 90
100
0.01 0.1 1 10 100
Access T
ime (
%)
Flash-Backed Volatile Memory (MB)
MacEng
HPWin
(a) FCFS
20 30 40 50 60 70 80 90
100
0.01 0.1 1 10 100
Access T
ime (
%)
Flash-Backed Volatile Memory (MB)
MacEng
HPWin
(b) SSTF
20 30 40 50 60 70 80 90
100
0.01 0.1 1 10 100
Access T
ime (
%)
Flash-Backed Volatile Memory (MB)
MacEng
HPWin
(c) CLOOK
Figure 7. Normalized I/O write access with flash-backed I/O requests
0
10
20
30
40
50
0.01 0.1 1 10 100
Access T
ime (
%)
Flash-Backed Volatile Memory (MB)
MacEng
HPWin
(a) Idle-time FQueue purging
0
10
20
30
40
50
0.01 0.1 1 10 100
Access T
ime(%
)
Flash-Backed Volatile Memory (MB)
MacEng
HPWin
(b) FQueue flush purging
Figure 8. Normalized I/O write access times
does not change, the raw numbers do. Since the Request
Queue scheduling algorithm does not significantly impact
performance, for the remainder of the paper we only show
results for CLOOK, a fair and efficient I/O scheduler [16].
One additional thing to note about these figures is that flash-
backed I/O request performance varies significantly from
workload to workload, even though they are each classified
as desktop computing.
One reason flash-backed I/O requests can reduce write
latency by up to 75% is that flash-backed I/O request syn-
chronization (back to rotating media) can be deferred un-
til the Request Queue is empty. Figure 8(a) shows the to-
tal time spent synchronizing flash-backed I/O requests to
rotating media relative to total write-latency without flash-
backed I/O requests. This figure shows that at least 20% of
total write latency work is performed by idle-time process-
ing, and 90% of the HP workload is synchronized with only
10MB of FQueue. The significance of this result is that with
the proposed redirection algorithm we can defer writing to
the disk until the Request Queue is empty without any out-
standing I/O requests.
The next figure, Figure 8(b), shows the percentage of I/O
that occurs due to flush-back I/O. As the number of flush
operations increases the benefit of I/O redirection decreases.
In these figures we don’t flush the entire FQueue, rather,
we only flush 1/10th of the FQueue, and since we flush in
FIFO order, we flush the oldest requests first, which weren’t
overwritten or removed through a coalesced I/O.
It is also useful to see what the total write latency is when
idle-time processing is included, as it shows total write la-
40
50
60
70
80
90
100
110
0.01 0.1 1 10 100
Access T
ime (
%)
Flash-Backed Volatile Memory (MB)
MacEng
HPWin
Figure 9. Normalized I/O write latency with
flash-backed I/O requests, including idle-time
request purging
tency for data to be committed on rotating media. The re-
sults of this experiment are shown in Figure 9, and normal-
ized to the total write-latency without flash-backed I/O re-
quests. This figure shows that, if idle-time processing is
included in the write latency, the benefit of flash-backed I/O
requests is workload dependent. The Eng and HP work-
loads show that write latency decreases by 30–50%, while
the Mac and Win trace actually increase write latency. The
increase in write-latency occurs because the cost of pushing
requests out of flash and then back rotating media negates
the benefit of redirecting to flash in the first place.
In order to assess the impact of using the NVCache for
selective write caching, we measured how many erase op-
erations occur during the 7 day traces, and then use the
observed frequency to extrapolate the number of years to
exceed an NVCache with 100,000 block erase count. We
assume an optimal wear-leveling algorithm which spreads
all writes across the entire device’s physical address space.
Figure 10 shows the results of this experiment. This figure
shows that the flash endurance increases linearly with re-
spect to the flash size, and that there is a 10/1 ratio between
the NVCache size (MB) and endurance years.
We used the performance of flash-backed I/O requests
with a current flash device to present the benefit of flash-
7
EvaluationResults
Normalized I/O write latency with flash-backed I/O requests, including idle-time request purging
20 30 40 50 60 70 80 90
100
0.01 0.1 1 10 100
Acc
ess
Tim
e (%
)
Flash-Backed Volatile Memory (MB)
MacEng
HPWin
(a) FCFS
20 30 40 50 60 70 80 90
100
0.01 0.1 1 10 100
Acc
ess
Tim
e (%
)
Flash-Backed Volatile Memory (MB)
MacEng
HPWin
(b) SSTF
20 30 40 50 60 70 80 90
100
0.01 0.1 1 10 100
Acc
ess
Tim
e (%
)
Flash-Backed Volatile Memory (MB)
MacEng
HPWin
(c) CLOOK
Figure 7. Normalized I/O write access with flash-backed I/O requests
0
10
20
30
40
50
0.01 0.1 1 10 100
Acc
ess
Tim
e (%
)
Flash-Backed Volatile Memory (MB)
MacEng
HPWin
(a) Idle-time FQueue purging
0
10
20
30
40
50
0.01 0.1 1 10 100
Acc
ess
Tim
e(%
)
Flash-Backed Volatile Memory (MB)
MacEng
HPWin
(b) FQueue flush purging
Figure 8. Normalized I/O write access times
does not change, the raw numbers do. Since the Request
Queue scheduling algorithm does not significantly impact
performance, for the remainder of the paper we only show
results for CLOOK, a fair and efficient I/O scheduler [16].
One additional thing to note about these figures is that flash-
backed I/O request performance varies significantly from
workload to workload, even though they are each classified
as desktop computing.
One reason flash-backed I/O requests can reduce write
latency by up to 75% is that flash-backed I/O request syn-
chronization (back to rotating media) can be deferred un-
til the Request Queue is empty. Figure 8(a) shows the to-
tal time spent synchronizing flash-backed I/O requests to
rotating media relative to total write-latency without flash-
backed I/O requests. This figure shows that at least 20% of
total write latency work is performed by idle-time process-
ing, and 90% of the HP workload is synchronized with only
10MB of FQueue. The significance of this result is that with
the proposed redirection algorithm we can defer writing to
the disk until the Request Queue is empty without any out-
standing I/O requests.
The next figure, Figure 8(b), shows the percentage of I/O
that occurs due to flush-back I/O. As the number of flush
operations increases the benefit of I/O redirection decreases.
In these figures we don’t flush the entire FQueue, rather,
we only flush 1/10th of the FQueue, and since we flush in
FIFO order, we flush the oldest requests first, which weren’t
overwritten or removed through a coalesced I/O.
It is also useful to see what the total write latency is when
idle-time processing is included, as it shows total write la-
40
50
60
70
80
90
100
110
0.01 0.1 1 10 100
Acc
ess
Tim
e (%
)
Flash-Backed Volatile Memory (MB)
MacEng
HPWin
Figure 9. Normalized I/O write latency with
flash-backed I/O requests, including idle-time
request purging
tency for data to be committed on rotating media. The re-
sults of this experiment are shown in Figure 9, and normal-
ized to the total write-latency without flash-backed I/O re-
quests. This figure shows that, if idle-time processing is
included in the write latency, the benefit of flash-backed I/O
requests is workload dependent. The Eng and HP work-
loads show that write latency decreases by 30–50%, while
the Mac and Win trace actually increase write latency. The
increase in write-latency occurs because the cost of pushing
requests out of flash and then back rotating media negates
the benefit of redirecting to flash in the first place.
In order to assess the impact of using the NVCache for
selective write caching, we measured how many erase op-
erations occur during the 7 day traces, and then use the
observed frequency to extrapolate the number of years to
exceed an NVCache with 100,000 block erase count. We
assume an optimal wear-leveling algorithm which spreads
all writes across the entire device’s physical address space.
Figure 10 shows the results of this experiment. This figure
shows that the flash endurance increases linearly with re-
spect to the flash size, and that there is a 10/1 ratio between
the NVCache size (MB) and endurance years.
We used the performance of flash-backed I/O requests
with a current flash device to present the benefit of flash-
7
EvaluationResults
Years to exceed 100K block erase cycles
1e-04
0.001
0.01
0.1
1
10
0.01 0.1 1 10 100
Life
time
(Yea
rs)
Flash-Backed Volatile Memory (MB)
MacEng
HPWin
Figure 10. Years to exceed 100K block erase
cycles
65
70
75
80
85
90
95
100
1 1.5 2 2.5 3 3.5 4 4.5 5
Acc
ess
Tim
e (%
)
Flash Write Performance Factor
MacEng
HPWin
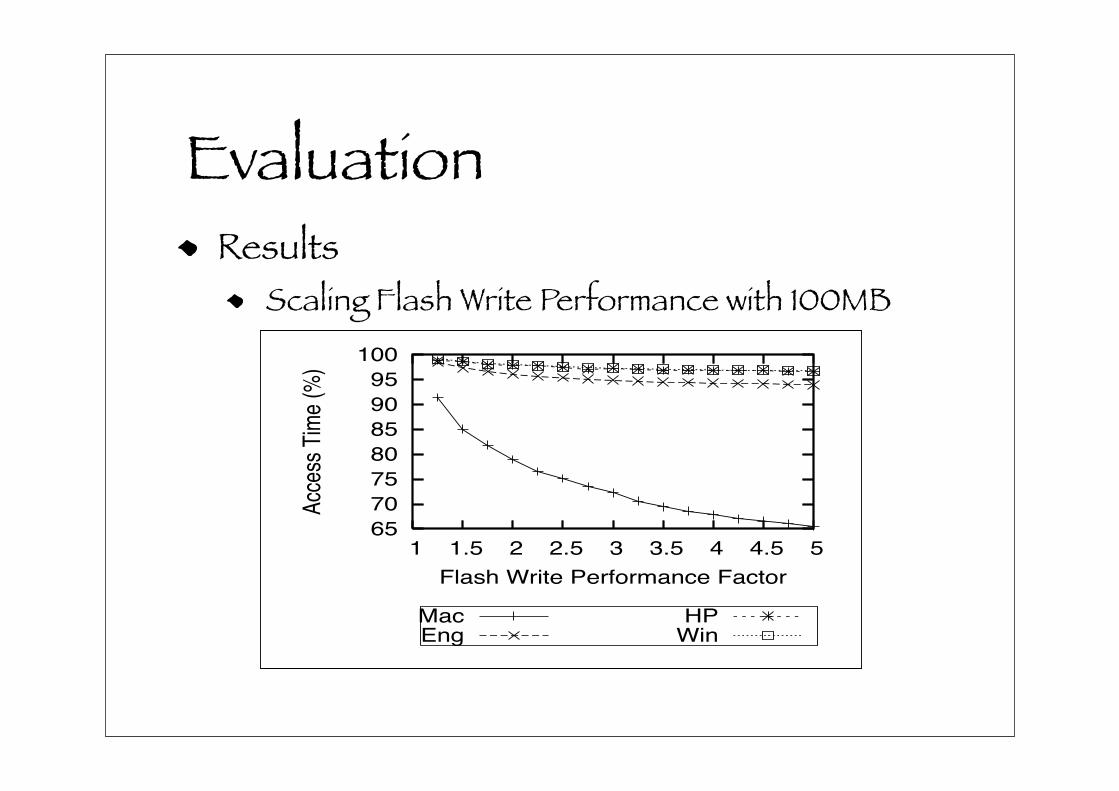
Figure 11. Scaling Flash Write Performance
with 100MB
backed I/O requests. However, we also wanted to see the
implications with faster performing flash memory. Fig-
ure 11 shows the results of scaling flash write perfor-
mance for a 100MB FQueue, normalized against flash-
performance factor of 1. This figures shows that after about
2-3 times increase, improvement flattens. Note, a 2X im-
provement means a 10ms I/O will only take 5ms.
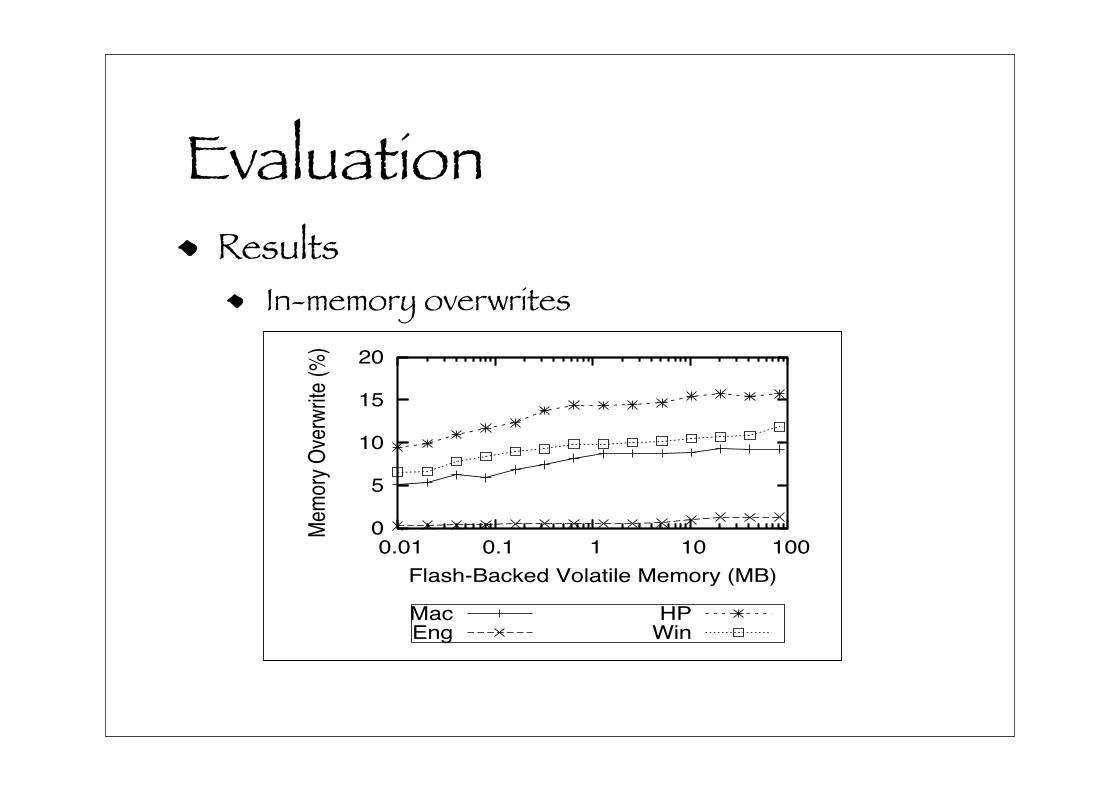
Figure 12 shows the percentage of DRAM FQueue over-
writes. This is an important figure because it shows what
percentage of redirected I/Os that do not have to be coa-
lesced or flushed back to rotating media. This figure shows
that as the size of the FQueue grows more operations that
are redirected to the FQueue result in overwrites - at most
15% of all writes are redirected.. If all I/Os were cached in
the FQueue, this fraction would be 100% higher but would
also contribute to a significantly larger access time.
Figure 13(a) shows total disk time, which can be trans-
lated into duty cycle. These results are also normalized to
no FQueue. One of the benefits of redirecting I/O to flash,
in addition to reducing write latency, is that we can increase
the chances of coalescing and overwrite operations, thus re-
ducing the effective rotating media duty cycle (one of many
variables that dictate hard disk reliability). Figure 13(b)
0
5
10
15
20
0.01 0.1 1 10 100
Mem
ory
Ove
rwrit
e (%
)
Flash-Backed Volatile Memory (MB)
MacEng
HPWin
Figure 12. In-memory overwrites
30
40
50
60
70
80
90
100
0.01 0.1 1 10 100
Dis
k T
ime
(%)
Flash-Backed Volatile Memory (MB)
MacEng
HPWin
(a) Total Disk Time
20 30 40 50 60 70 80 90
100
0.01 0.1 1 10 100
Tot
al W
rites
(%
)
Flash-Backed Volatile Memory (MB)
MacEng
HPWin
(b) Total Disk Writes
Figure 13. Disk duty cycle
shows the total disk writes normalized to total disk writes
without an FQueue, which can also be interpreted as a form
of duty cycle. These results show that total normalized disk
writes decreases slightly which means that by adding the
FQueue, more requests are merged or forgotten because of
FQueue use.
5 Related Works
There are several works that propose or leverage a
non-volatile cache to reduce disk I/O. Ruemmler and
Wilkes [12], Baker et al. [1], and Huet al. [6] have all ar-
gued that NVRAM can be used to reduce disk I/O. Hu’s
Rapid-Cache leverages NVRAM to aggregate larger writes
to a log-disk, whose content is eventually written out to a
backing store. This 2-level hierarchical caching model im-
proves upon other systems which also use NVRAM, such
as WAFL [5].
Haining et al. also investigated the use of non-volatile
caches to buffer disk I/O [4, 9]. Their primary focus was on
NVRAM cache replacement policies. Their most success-
ful algorithm leveraged track-layout knowledge along with
spatial and temporal locality to reduce disk I/O. Our work
differs in that we are selective about what I/O is redirected
to the non-volatile backing store. Therefore this work is
complementary to our own.
Hybrid disks place a small amount of flash memory log-
ically adjacent to the rotating media. Interfaces to leverage
the NVCache are specified in the ATA8 specification [13].
However, implementation functionality is largely left to the
manufacturer. Unfortunately, this means most manufacturer
8
EvaluationResults
Scaling Flash Write Performance with 100MB
1e-04
0.001
0.01
0.1
1
10
0.01 0.1 1 10 100
Life
time
(Yea
rs)
Flash-Backed Volatile Memory (MB)
MacEng
HPWin
Figure 10. Years to exceed 100K block erase
cycles
65
70
75
80
85
90
95
100
1 1.5 2 2.5 3 3.5 4 4.5 5
Acc
ess
Tim
e (%
)
Flash Write Performance Factor
MacEng
HPWin
Figure 11. Scaling Flash Write Performance
with 100MB
backed I/O requests. However, we also wanted to see the
implications with faster performing flash memory. Fig-
ure 11 shows the results of scaling flash write perfor-
mance for a 100MB FQueue, normalized against flash-
performance factor of 1. This figures shows that after about
2-3 times increase, improvement flattens. Note, a 2X im-
provement means a 10ms I/O will only take 5ms.
Figure 12 shows the percentage of DRAM FQueue over-
writes. This is an important figure because it shows what
percentage of redirected I/Os that do not have to be coa-
lesced or flushed back to rotating media. This figure shows
that as the size of the FQueue grows more operations that
are redirected to the FQueue result in overwrites - at most
15% of all writes are redirected.. If all I/Os were cached in
the FQueue, this fraction would be 100% higher but would
also contribute to a significantly larger access time.
Figure 13(a) shows total disk time, which can be trans-
lated into duty cycle. These results are also normalized to
no FQueue. One of the benefits of redirecting I/O to flash,
in addition to reducing write latency, is that we can increase
the chances of coalescing and overwrite operations, thus re-
ducing the effective rotating media duty cycle (one of many
variables that dictate hard disk reliability). Figure 13(b)
0
5
10
15
20
0.01 0.1 1 10 100
Mem
ory
Ove
rwrit
e (%
)
Flash-Backed Volatile Memory (MB)
MacEng
HPWin
Figure 12. In-memory overwrites
30
40
50
60
70
80
90
100
0.01 0.1 1 10 100
Dis
k T
ime
(%)
Flash-Backed Volatile Memory (MB)
MacEng
HPWin
(a) Total Disk Time
20 30 40 50 60 70 80 90
100
0.01 0.1 1 10 100
Tot
al W
rites
(%
)
Flash-Backed Volatile Memory (MB)
MacEng
HPWin
(b) Total Disk Writes
Figure 13. Disk duty cycle
shows the total disk writes normalized to total disk writes
without an FQueue, which can also be interpreted as a form
of duty cycle. These results show that total normalized disk
writes decreases slightly which means that by adding the
FQueue, more requests are merged or forgotten because of
FQueue use.
5 Related Works
There are several works that propose or leverage a
non-volatile cache to reduce disk I/O. Ruemmler and
Wilkes [12], Baker et al. [1], and Huet al. [6] have all ar-
gued that NVRAM can be used to reduce disk I/O. Hu’s
Rapid-Cache leverages NVRAM to aggregate larger writes
to a log-disk, whose content is eventually written out to a
backing store. This 2-level hierarchical caching model im-
proves upon other systems which also use NVRAM, such
as WAFL [5].
Haining et al. also investigated the use of non-volatile
caches to buffer disk I/O [4, 9]. Their primary focus was on
NVRAM cache replacement policies. Their most success-
ful algorithm leveraged track-layout knowledge along with
spatial and temporal locality to reduce disk I/O. Our work
differs in that we are selective about what I/O is redirected
to the non-volatile backing store. Therefore this work is
complementary to our own.
Hybrid disks place a small amount of flash memory log-
ically adjacent to the rotating media. Interfaces to leverage
the NVCache are specified in the ATA8 specification [13].
However, implementation functionality is largely left to the
manufacturer. Unfortunately, this means most manufacturer
8
EvaluationResults
In-memory overwrites
1e-04
0.001
0.01
0.1
1
10
0.01 0.1 1 10 100
Life
time
(Yea
rs)
Flash-Backed Volatile Memory (MB)
MacEng
HPWin
Figure 10. Years to exceed 100K block erase
cycles
65
70
75
80
85
90
95
100
1 1.5 2 2.5 3 3.5 4 4.5 5
Acc
ess
Tim
e (%
)
Flash Write Performance Factor
MacEng
HPWin
Figure 11. Scaling Flash Write Performance
with 100MB
backed I/O requests. However, we also wanted to see the
implications with faster performing flash memory. Fig-
ure 11 shows the results of scaling flash write perfor-
mance for a 100MB FQueue, normalized against flash-
performance factor of 1. This figures shows that after about
2-3 times increase, improvement flattens. Note, a 2X im-
provement means a 10ms I/O will only take 5ms.
Figure 12 shows the percentage of DRAM FQueue over-
writes. This is an important figure because it shows what
percentage of redirected I/Os that do not have to be coa-
lesced or flushed back to rotating media. This figure shows
that as the size of the FQueue grows more operations that
are redirected to the FQueue result in overwrites - at most
15% of all writes are redirected.. If all I/Os were cached in
the FQueue, this fraction would be 100% higher but would
also contribute to a significantly larger access time.
Figure 13(a) shows total disk time, which can be trans-
lated into duty cycle. These results are also normalized to
no FQueue. One of the benefits of redirecting I/O to flash,
in addition to reducing write latency, is that we can increase
the chances of coalescing and overwrite operations, thus re-
ducing the effective rotating media duty cycle (one of many
variables that dictate hard disk reliability). Figure 13(b)
0
5
10
15
20
0.01 0.1 1 10 100
Mem
ory
Ove
rwrit
e (%
)
Flash-Backed Volatile Memory (MB)
MacEng
HPWin
Figure 12. In-memory overwrites
30
40
50
60
70
80
90
100
0.01 0.1 1 10 100
Dis
k T
ime
(%)
Flash-Backed Volatile Memory (MB)
MacEng
HPWin
(a) Total Disk Time
20 30 40 50 60 70 80 90
100
0.01 0.1 1 10 100
Tot
al W
rites
(%
)
Flash-Backed Volatile Memory (MB)
MacEng
HPWin
(b) Total Disk Writes
Figure 13. Disk duty cycle
shows the total disk writes normalized to total disk writes
without an FQueue, which can also be interpreted as a form
of duty cycle. These results show that total normalized disk
writes decreases slightly which means that by adding the
FQueue, more requests are merged or forgotten because of
FQueue use.
5 Related Works
There are several works that propose or leverage a
non-volatile cache to reduce disk I/O. Ruemmler and
Wilkes [12], Baker et al. [1], and Huet al. [6] have all ar-
gued that NVRAM can be used to reduce disk I/O. Hu’s
Rapid-Cache leverages NVRAM to aggregate larger writes
to a log-disk, whose content is eventually written out to a
backing store. This 2-level hierarchical caching model im-
proves upon other systems which also use NVRAM, such
as WAFL [5].
Haining et al. also investigated the use of non-volatile
caches to buffer disk I/O [4, 9]. Their primary focus was on
NVRAM cache replacement policies. Their most success-
ful algorithm leveraged track-layout knowledge along with
spatial and temporal locality to reduce disk I/O. Our work
differs in that we are selective about what I/O is redirected
to the non-volatile backing store. Therefore this work is
complementary to our own.
Hybrid disks place a small amount of flash memory log-
ically adjacent to the rotating media. Interfaces to leverage
the NVCache are specified in the ATA8 specification [13].
However, implementation functionality is largely left to the
manufacturer. Unfortunately, this means most manufacturer
8
EvaluationResults
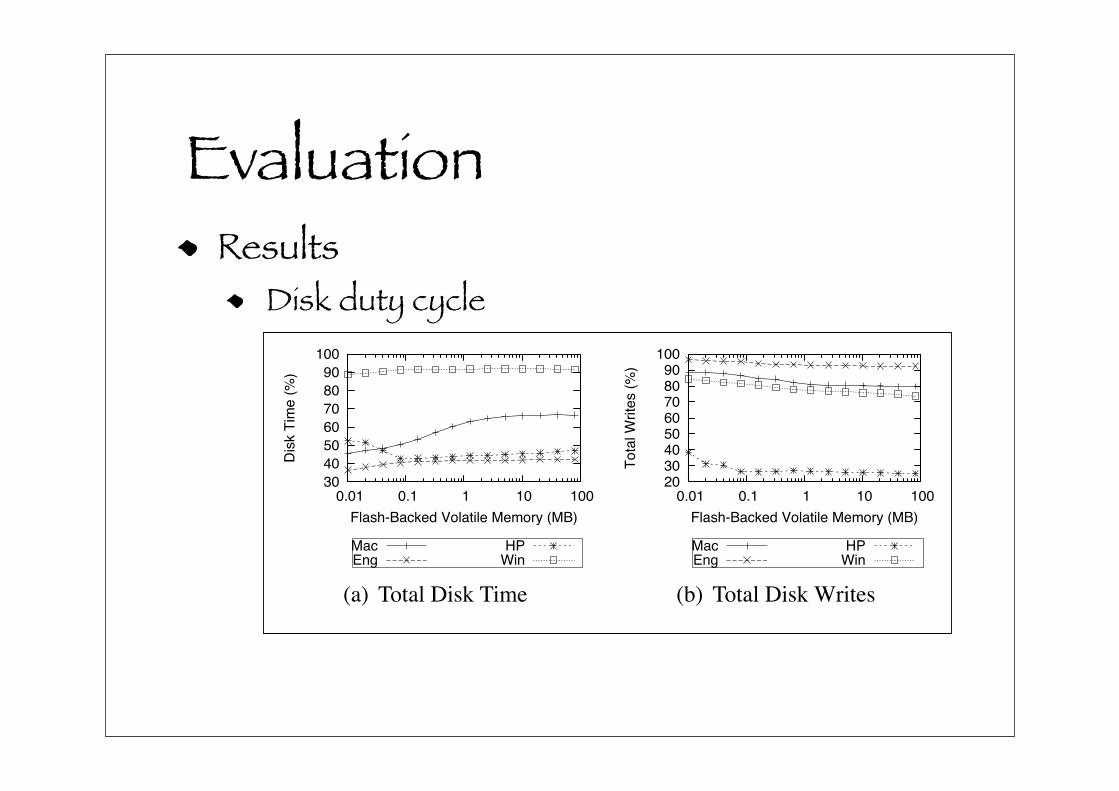
Disk duty cycle
1e-04
0.001
0.01
0.1
1
10
0.01 0.1 1 10 100
Lifetim
e (
Years
)
Flash-Backed Volatile Memory (MB)
MacEng
HPWin
Figure 10. Years to exceed 100K block erase
cycles
65
70
75
80
85
90
95
100
1 1.5 2 2.5 3 3.5 4 4.5 5
Access T
ime (
%)
Flash Write Performance Factor
MacEng
HPWin
Figure 11. Scaling Flash Write Performance
with 100MB
backed I/O requests. However, we also wanted to see the
implications with faster performing flash memory. Fig-
ure 11 shows the results of scaling flash write perfor-
mance for a 100MB FQueue, normalized against flash-
performance factor of 1. This figures shows that after about
2-3 times increase, improvement flattens. Note, a 2X im-
provement means a 10ms I/O will only take 5ms.
Figure 12 shows the percentage of DRAM FQueue over-
writes. This is an important figure because it shows what
percentage of redirected I/Os that do not have to be coa-
lesced or flushed back to rotating media. This figure shows
that as the size of the FQueue grows more operations that
are redirected to the FQueue result in overwrites - at most
15% of all writes are redirected.. If all I/Os were cached in
the FQueue, this fraction would be 100% higher but would
also contribute to a significantly larger access time.
Figure 13(a) shows total disk time, which can be trans-
lated into duty cycle. These results are also normalized to
no FQueue. One of the benefits of redirecting I/O to flash,
in addition to reducing write latency, is that we can increase
the chances of coalescing and overwrite operations, thus re-
ducing the effective rotating media duty cycle (one of many
variables that dictate hard disk reliability). Figure 13(b)
0
5
10
15
20
0.01 0.1 1 10 100
Mem
ory
Overw
rite
(%
)
Flash-Backed Volatile Memory (MB)
MacEng
HPWin
Figure 12. In-memory overwrites
30
40
50
60
70
80
90
100
0.01 0.1 1 10 100
Dis
k T
ime (
%)
Flash-Backed Volatile Memory (MB)
MacEng
HPWin
(a) Total Disk Time
20 30 40 50 60 70 80 90
100
0.01 0.1 1 10 100
Tota
l W
rite
s (
%)
Flash-Backed Volatile Memory (MB)
MacEng
HPWin
(b) Total Disk Writes
Figure 13. Disk duty cycle
shows the total disk writes normalized to total disk writes
without an FQueue, which can also be interpreted as a form
of duty cycle. These results show that total normalized disk
writes decreases slightly which means that by adding the
FQueue, more requests are merged or forgotten because of
FQueue use.
5 Related Works
There are several works that propose or leverage a
non-volatile cache to reduce disk I/O. Ruemmler and
Wilkes [12], Baker et al. [1], and Huet al. [6] have all ar-
gued that NVRAM can be used to reduce disk I/O. Hu’s
Rapid-Cache leverages NVRAM to aggregate larger writes
to a log-disk, whose content is eventually written out to a
backing store. This 2-level hierarchical caching model im-
proves upon other systems which also use NVRAM, such
as WAFL [5].
Haining et al. also investigated the use of non-volatile
caches to buffer disk I/O [4, 9]. Their primary focus was on
NVRAM cache replacement policies. Their most success-
ful algorithm leveraged track-layout knowledge along with
spatial and temporal locality to reduce disk I/O. Our work
differs in that we are selective about what I/O is redirected
to the non-volatile backing store. Therefore this work is
complementary to our own.
Hybrid disks place a small amount of flash memory log-
ically adjacent to the rotating media. Interfaces to leverage
the NVCache are specified in the ATA8 specification [13].
However, implementation functionality is largely left to the
manufacturer. Unfortunately, this means most manufacturer
8
ConclusionsDisk write latency is a significant component of the overall I/O bottleneckThis paper have proposed
to use the flash memory to reduce write latency by selectively caching write requests to the NV Cache
Redirection and Coalescing


![Ultra Low Latency with CMAF - Paris Video Tech€¢Backed by many other companies (Google, Netflix, Akamai…) Approach ... (open source) [link] CDN Akamai Media Delivery [link] Player](https://img.pdfslide.net/doc/110x75/5b1f54b87f8b9a1b1e8b4bf5/ultra-low-latency-with-cmaf-paris-video-tech-backed-by-many-other-companies.jpg)