Embed Size (px)
Citation preview
Reducing Network Documentation Effort by Visio Automation
David Cuthbertson
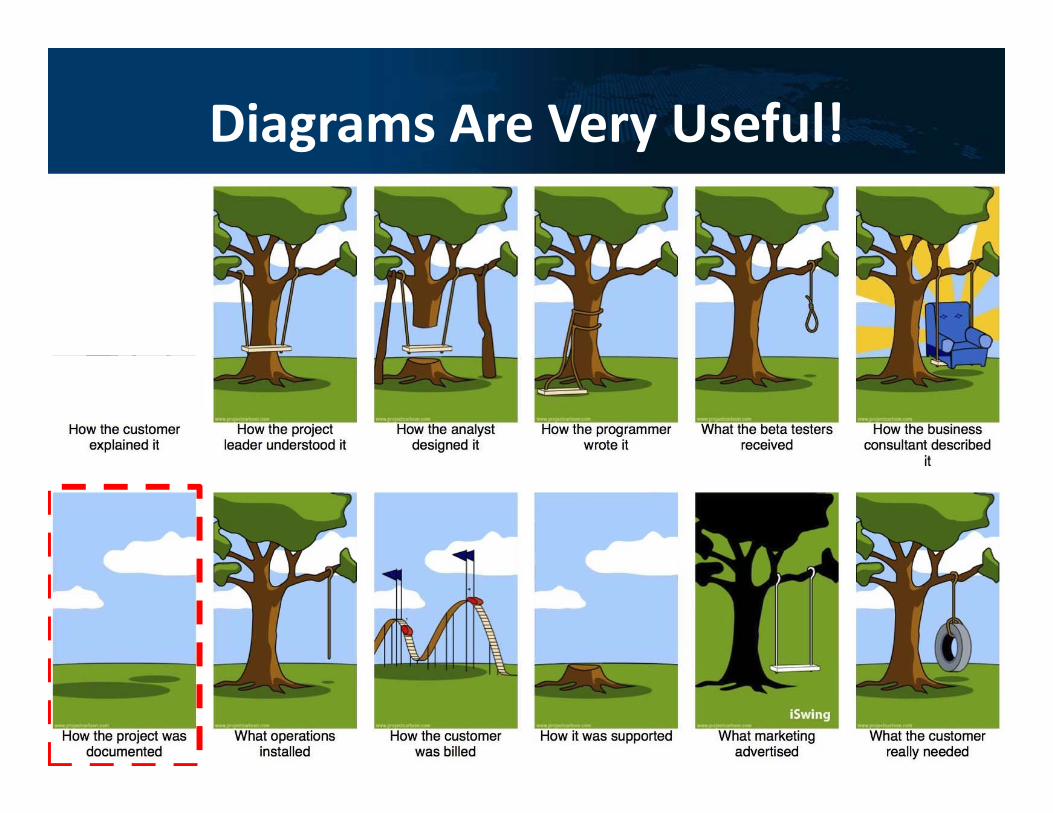
Diagrams Are Very Useful!g y
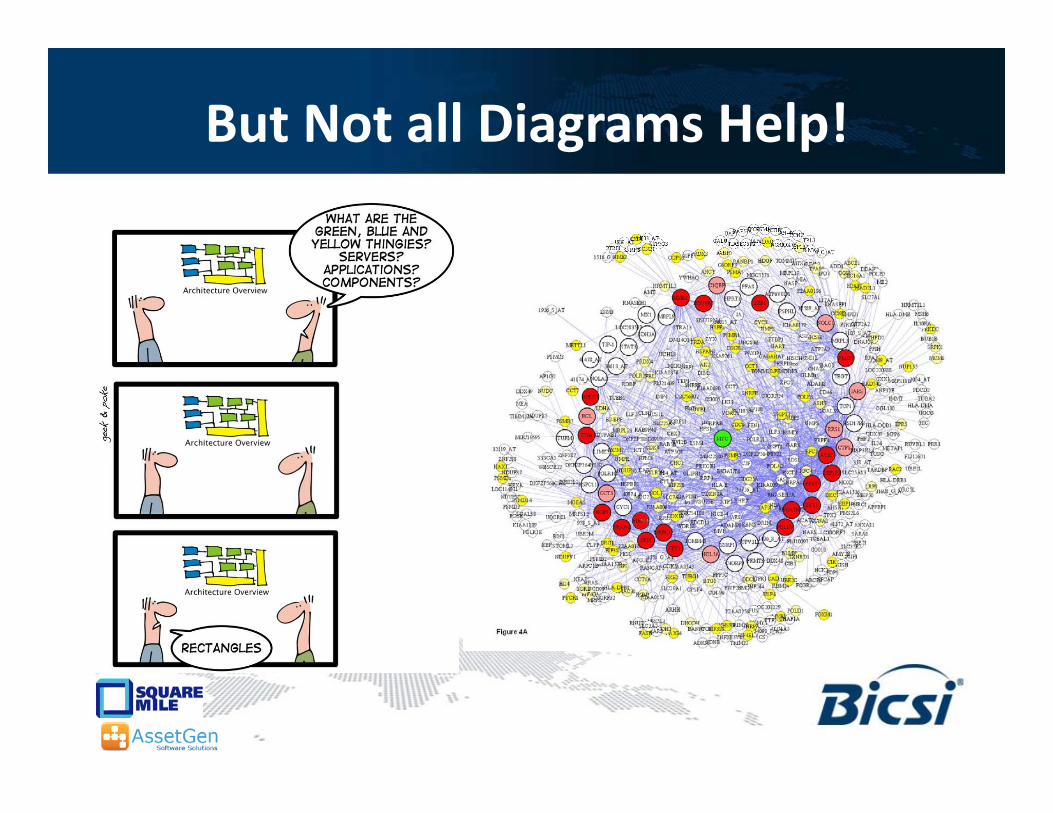
But Not all Diagrams Help!g p
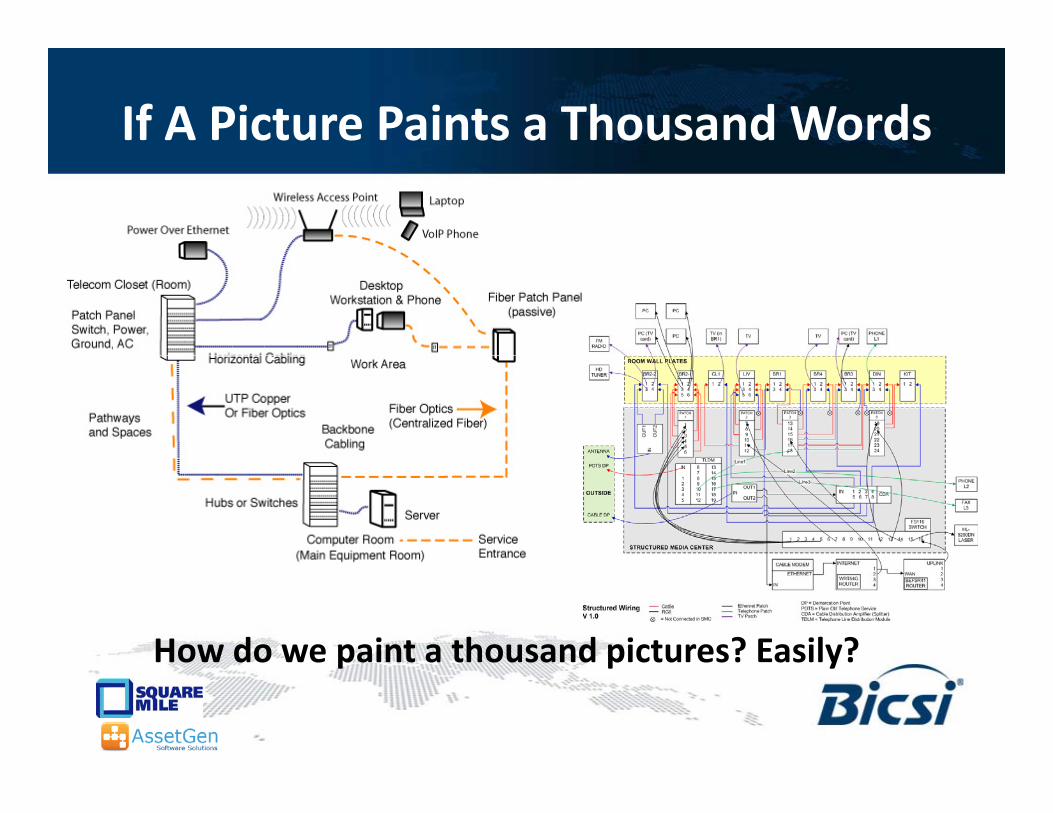
If A Picture Paints a Thousand Words
How do we paint a thousand pictures? Easily?p p y

Reducing Your Workloadg
Architecture Overviews
/
LAN/WAN/SAN Diagrams
Automation
Current Method
l k
Inventory / Connection Lists
0% 20% 40% 60% 80% 100%
Floor & Rack Diagrams
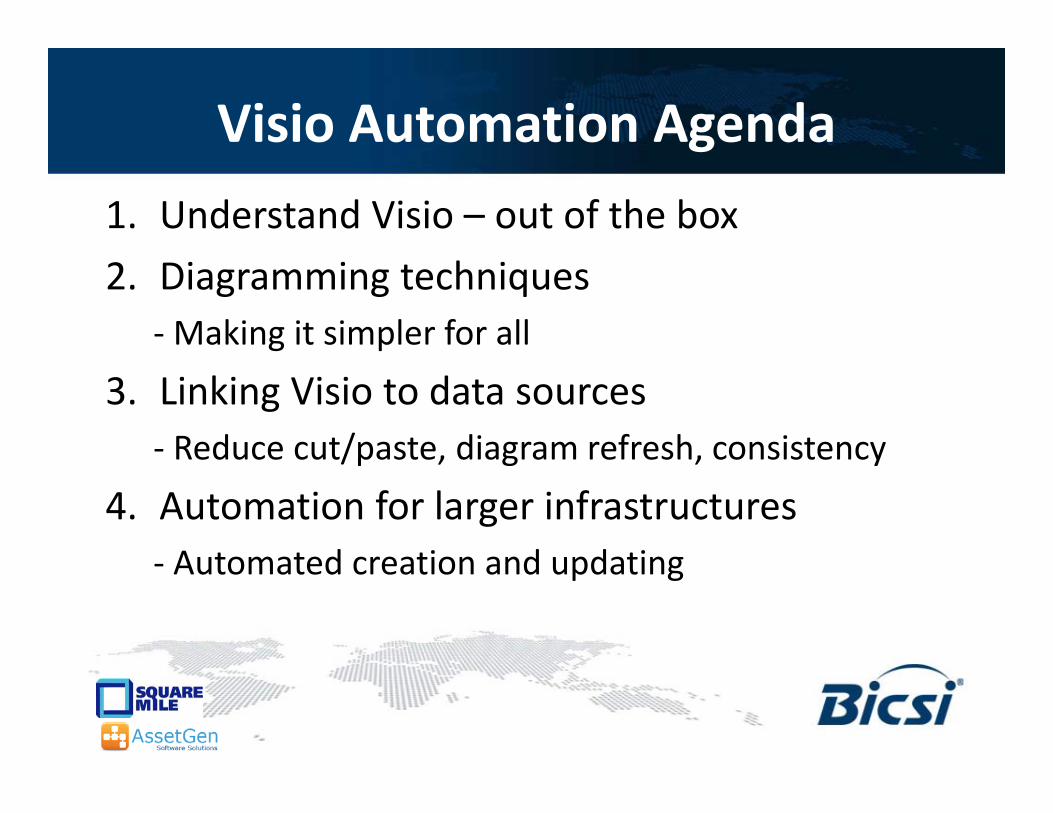
Visio Automation Agendag
1. Understand Visio – out of the box
2. Diagramming techniques- Making it simpler for all
3. Linking Visio to data sources- Reduce cut/paste, diagram refresh, consistencyReduce cut/paste, diagram refresh, consistency
4. Automation for larger infrastructuresAutomated creation and updating- Automated creation and updating
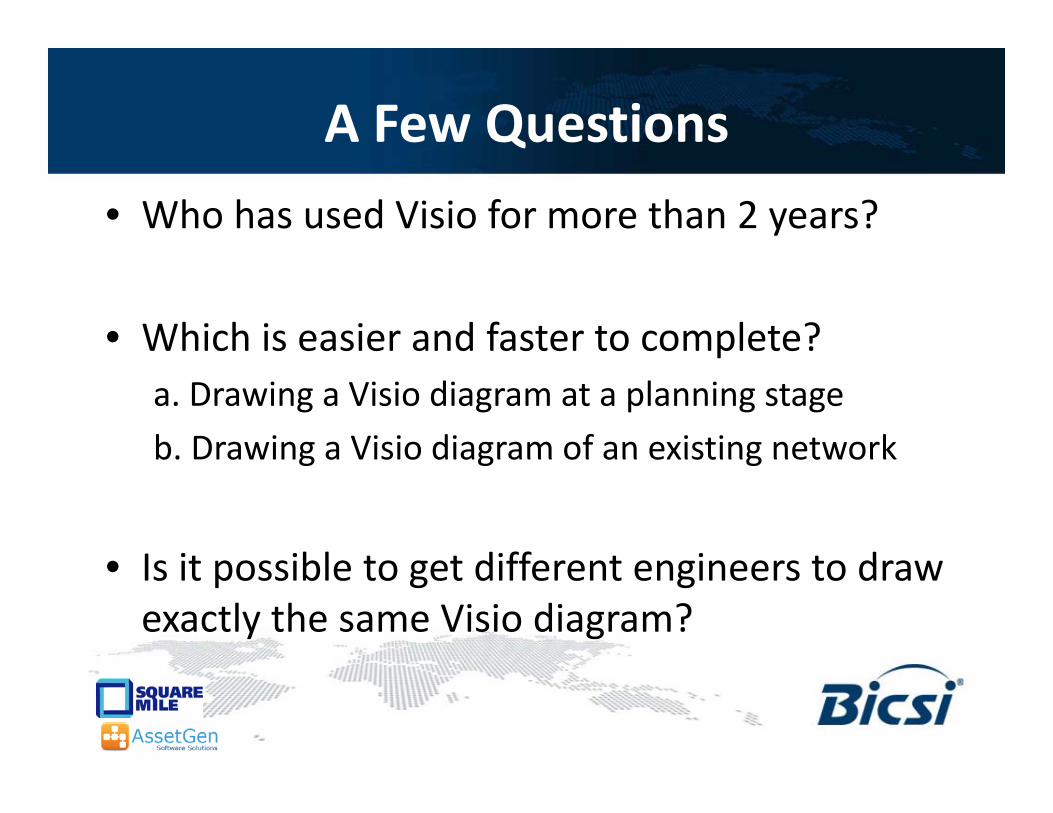
A Few Questions
• Who has used Visio for more than 2 years?
• Which is easier and faster to complete?pa. Drawing a Visio diagram at a planning stage
b. Drawing a Visio diagram of an existing networkb. Drawing a Visio diagram of an existing network
• Is it possible to get different engineers to dra• Is it possible to get different engineers to draw exactly the same Visio diagram?
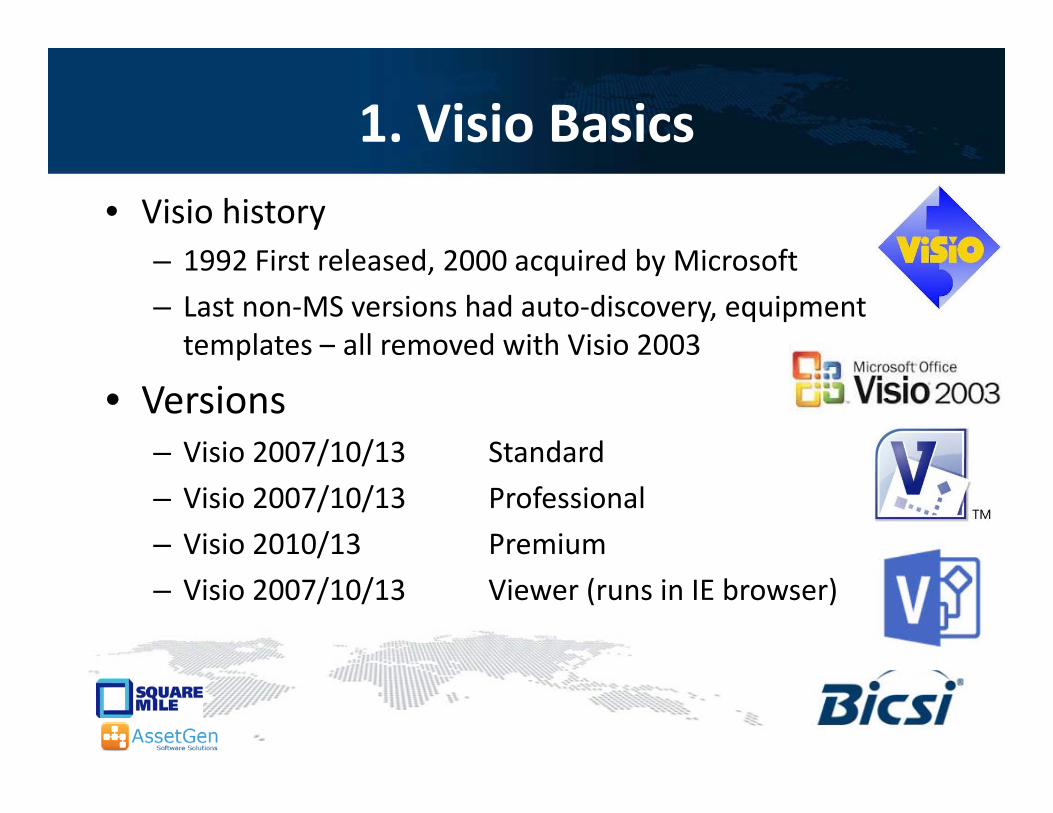
1. Visio Basics• Visio history
1992 Fi t l d 2000 i d b Mi ft– 1992 First released, 2000 acquired by Microsoft
– Last non-MS versions had auto-discovery, equipment templates – all removed with Visio 2003p
• Versions– Visio 2007/10/13 StandardVisio 2007/10/13 Standard
– Visio 2007/10/13 Professional
– Visio 2010/13 Premium
– Visio 2007/10/13 Viewer (runs in IE browser)
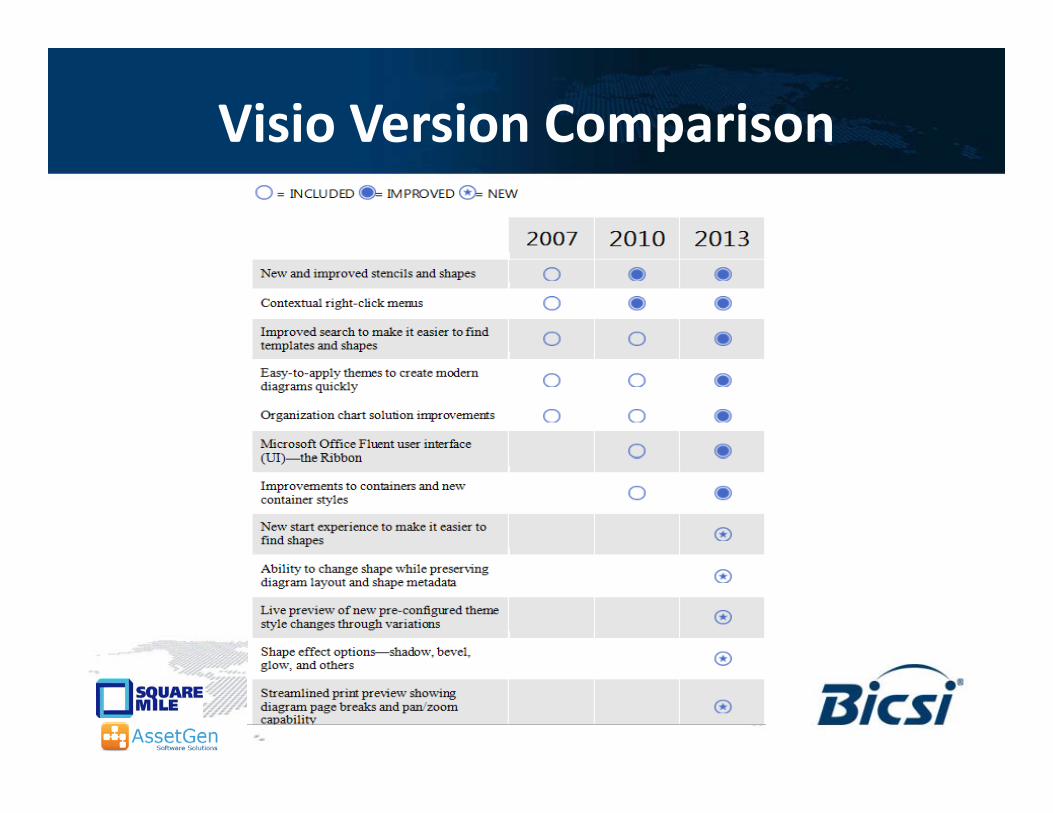
Visio Version Comparisonp
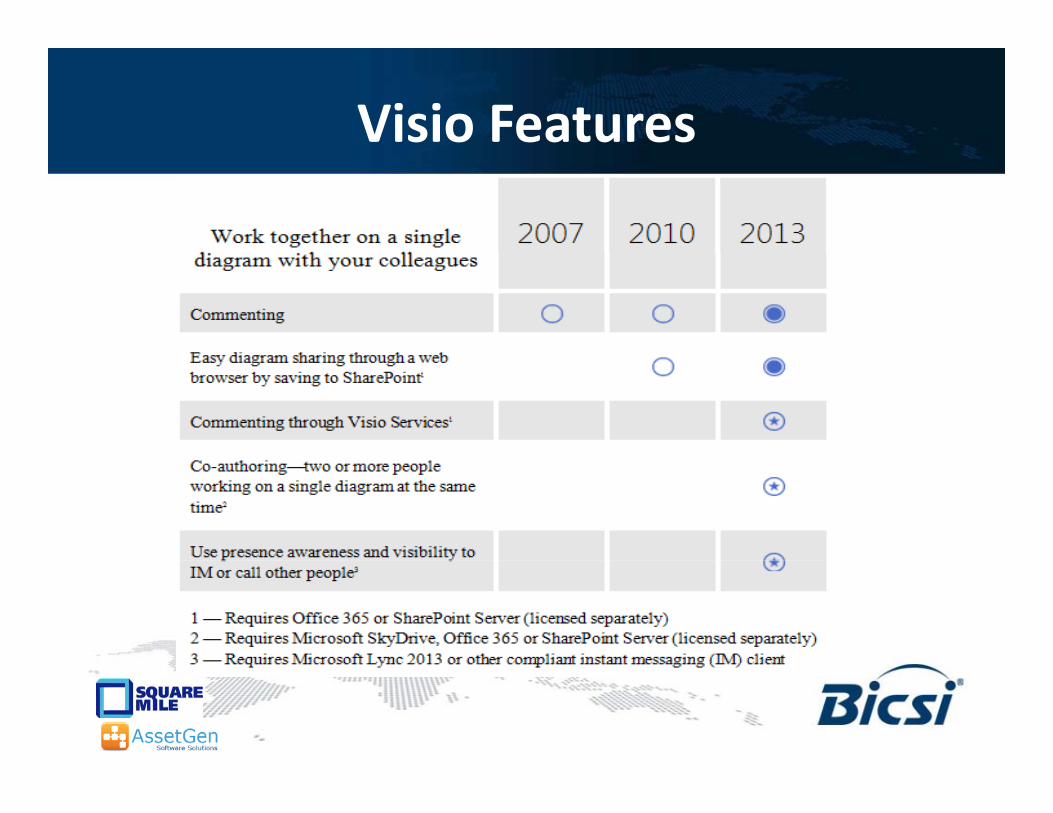
Visio Features
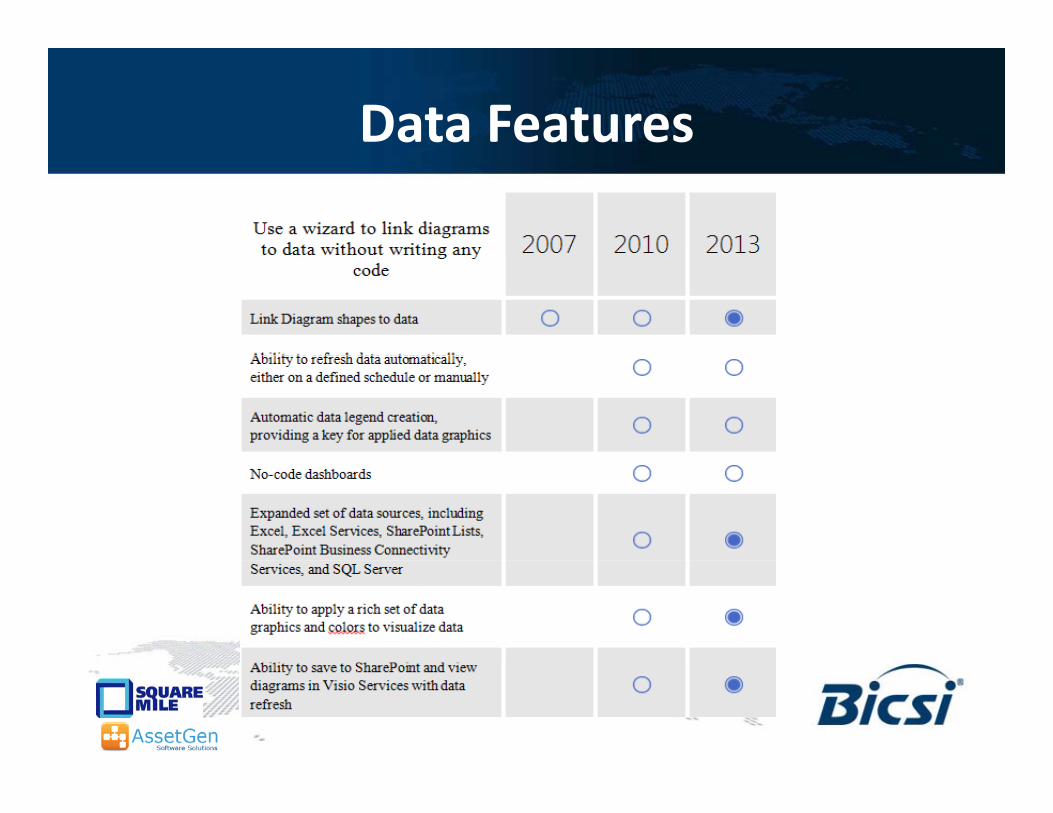
Data Features
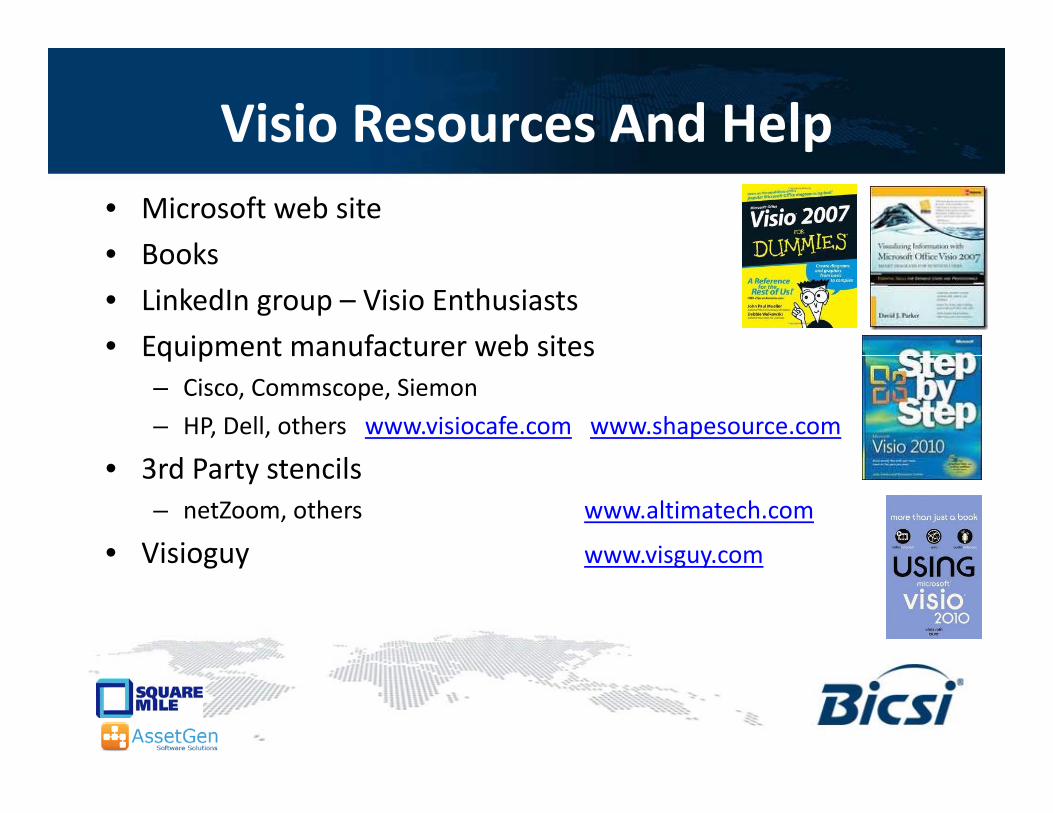
Visio Resources And Helpp• Microsoft web site
• Books• Books
• LinkedIn group – Visio Enthusiasts
• Equipment manufacturer web sitesEquipment manufacturer web sites– Cisco, Commscope, Siemon
– HP, Dell, others www.visiocafe.com www.shapesource.com
d il• 3rd Party stencils– netZoom, others www.altimatech.com
• Visioguy www.visguy.comVisioguy www.visguy.com
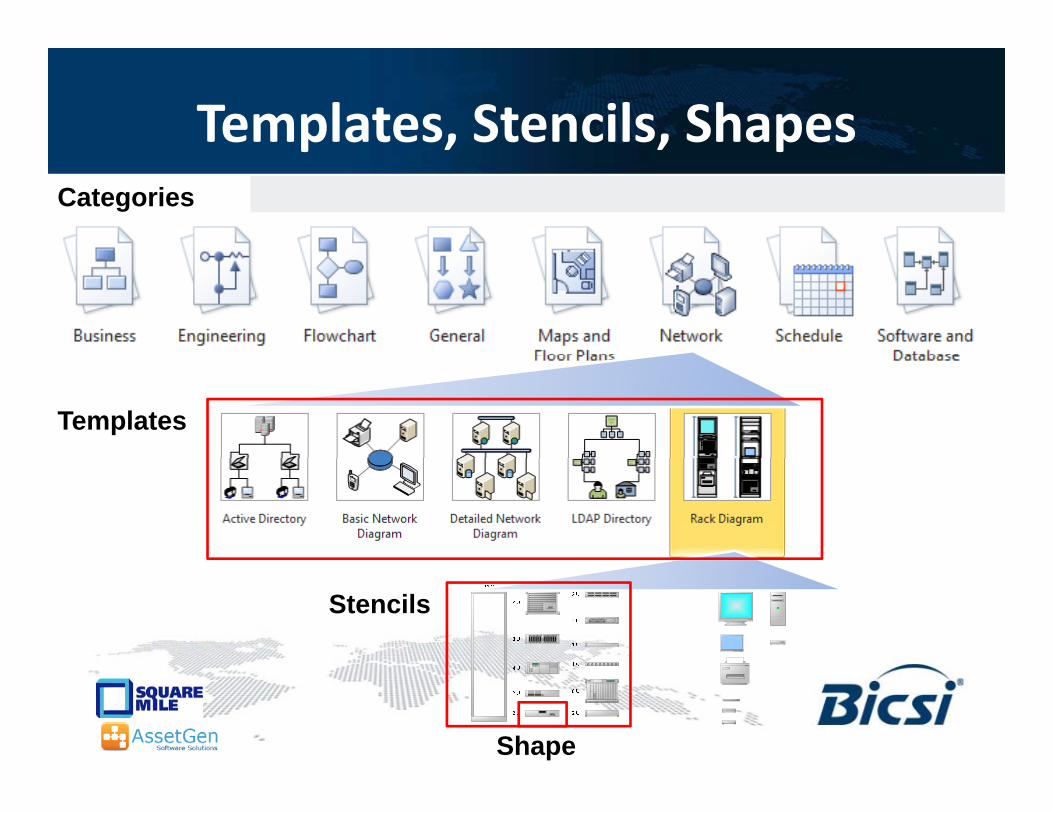
Templates, Stencils, Shapesp pCategories
Templates
Stencils
Shape
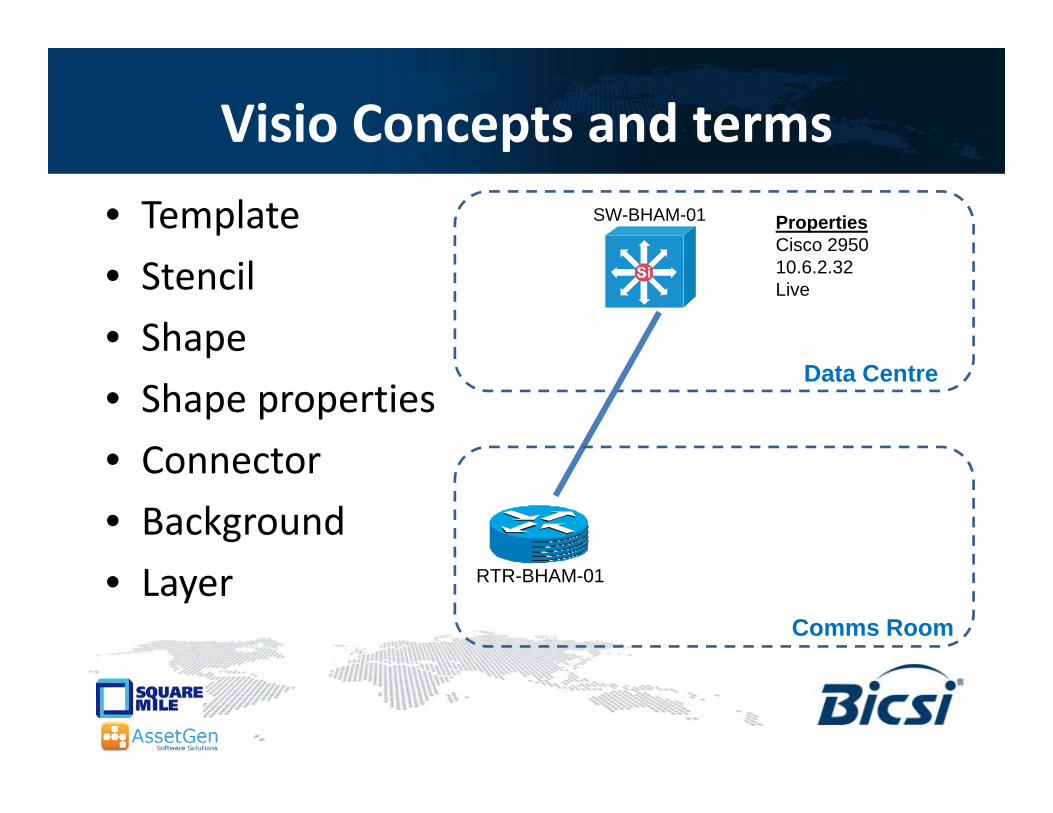
Visio Concepts and termsp
• Template SW-BHAM-01 PropertiesCisco 2950
• Stencil
• Shape
10.6.2.32Live
p
• Shape properties
• Connector
Data Centre
• Connector
• Background
• Layer RTR-BHAM-01
Comms Room
Visio Basics -1• Creating new diagram from a template
i l i h• Manipulating shapes on a page
• Aligning and Distributing Shapes
• Copy, Paste and Duplicate Shapes
• Grouping and ungrouping shapes
• Foreground and Background options
• Zooming in and Out of the Page
• Using the Drawing Toolbar to create basic shapes
Visio Basics - 2• Connectors
S i d d i l• Static and dynamic glue
• Adding, deleting and moving connector points
• Using different stencils– Stencil search
• Shape behaviour -1d, 2d, drill down
• Working with text– Object text
– Freeform text
Text block tool– Text block tool
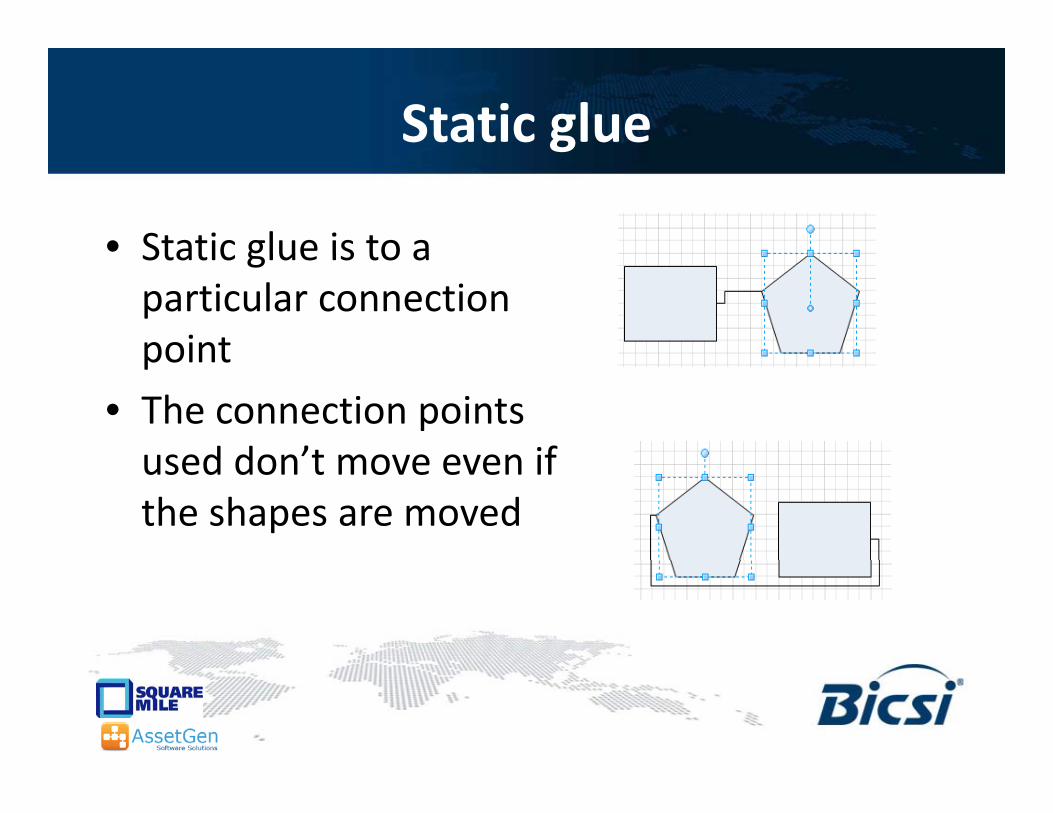
Static glueg
• Static glue is to aStatic glue is to a particular connection pointpoint
• The connection points used don’t move even ifused don t move even if the shapes are moved
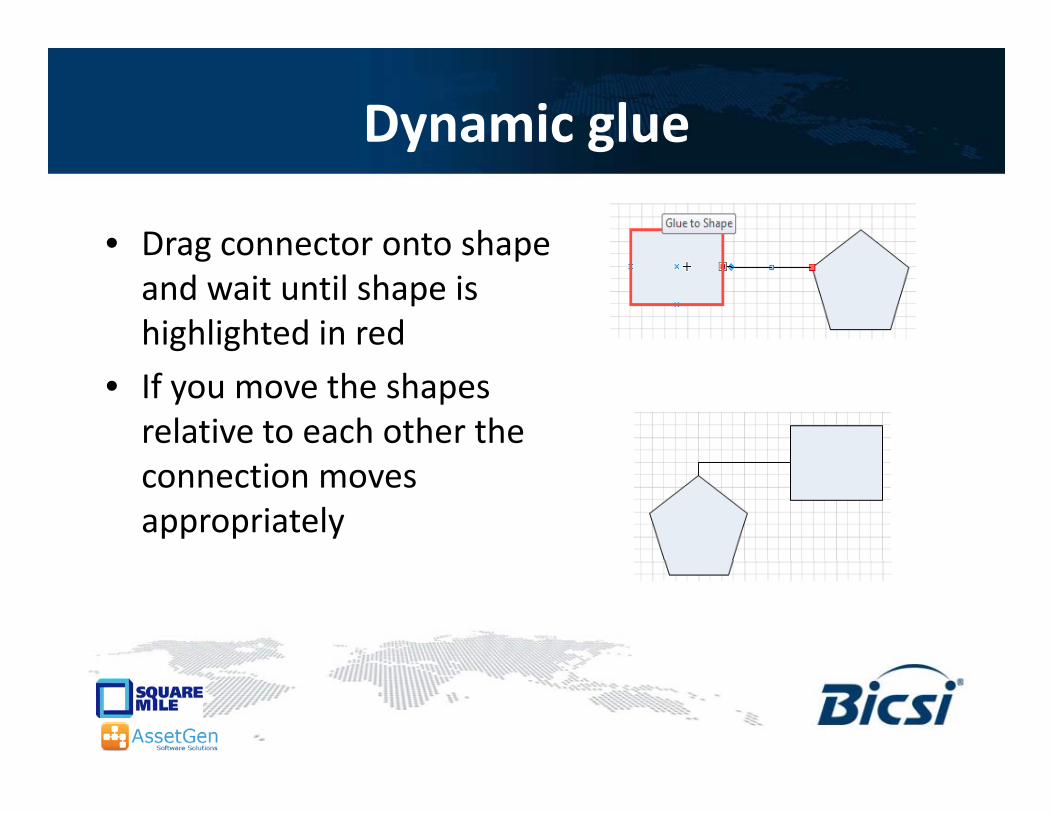
Dynamic gluey g
• Drag connector onto shapeDrag connector onto shape and wait until shape is highlighted in red
• If you move the shapes relative to each other the connection moves appropriately
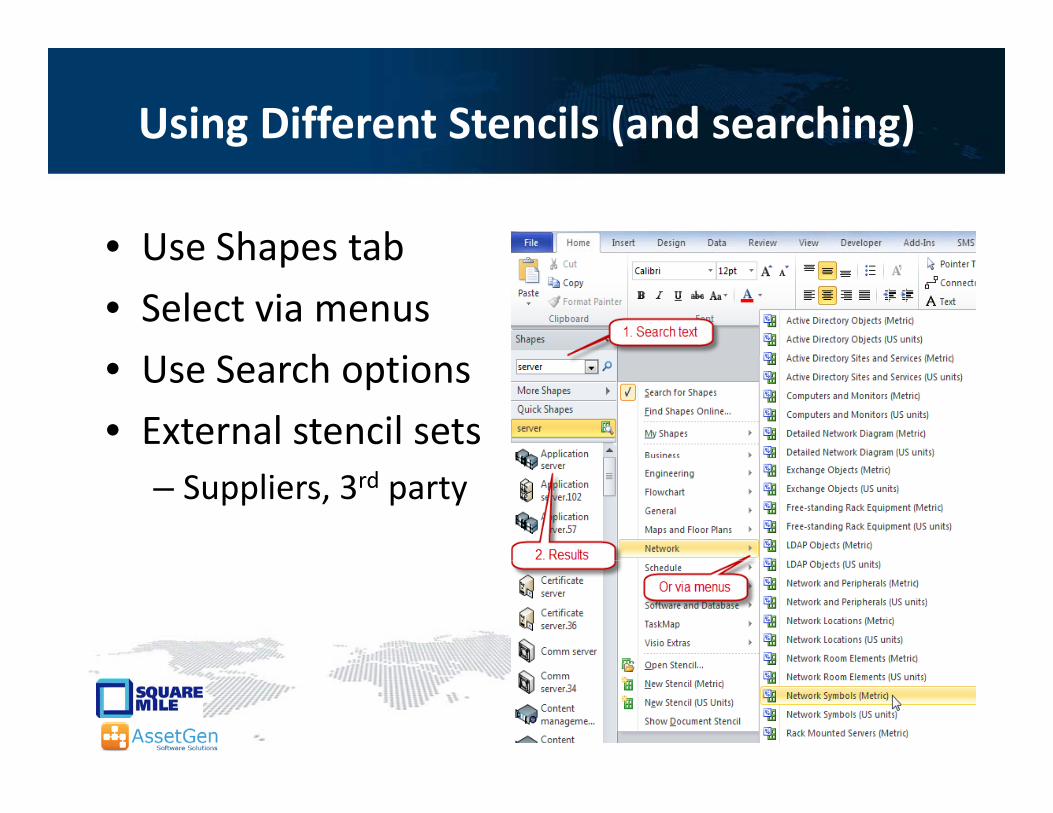
Using Different Stencils (and searching)
• Use Shapes tabUse Shapes tab
• Select via menus
S h i• Use Search options
• External stencil sets– Suppliers, 3rd party
19
Using External /3rd Party Stencilsg y
• There are lots to choose from
• Free– www.visiocafe.com
– www.shapesource.com
– Manufacturers Cisco, Commscope, etc.p
– 3rd Party custom sets
• PurchasePurchase– NetZoom
– Other products with embedded stencils / graphics– Other products with embedded stencils / graphics
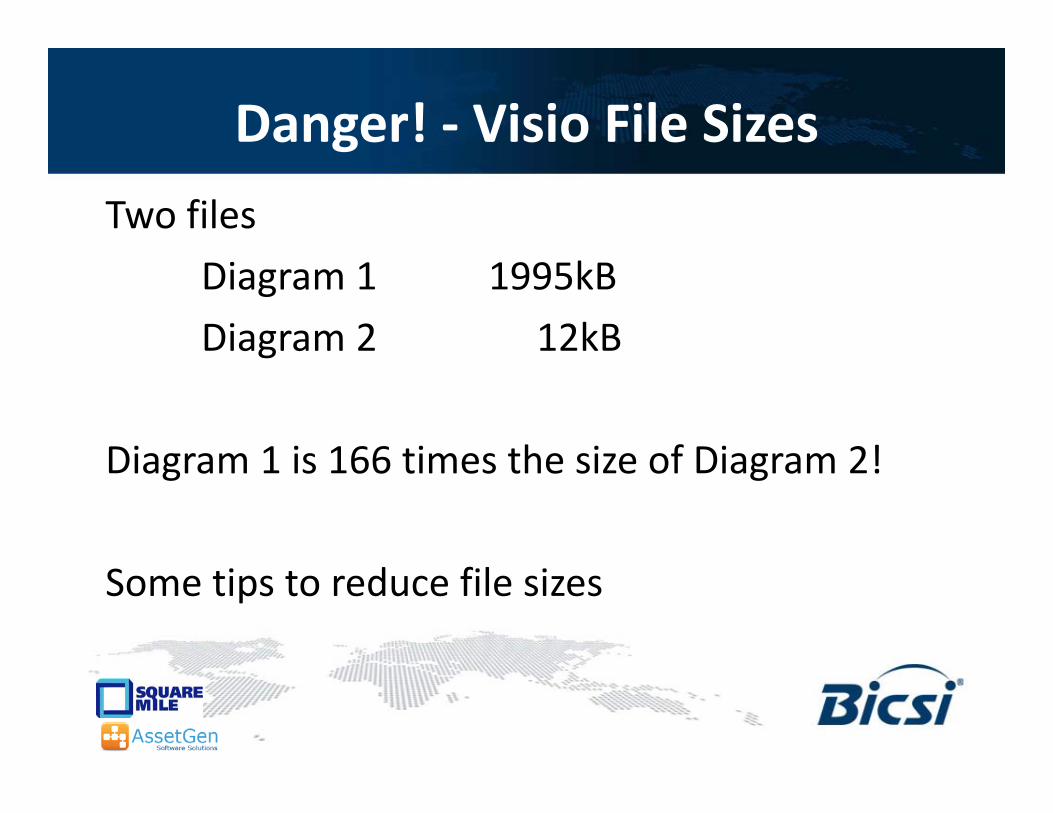
Danger! - Visio File Sizesg
Two files
Diagram 1 1995kB
Diagram 2 12kBg
Diagram 1 is 166 times the size of Diagram 2!Diagram 1 is 166 times the size of Diagram 2!
Some tips to reduce file sizes
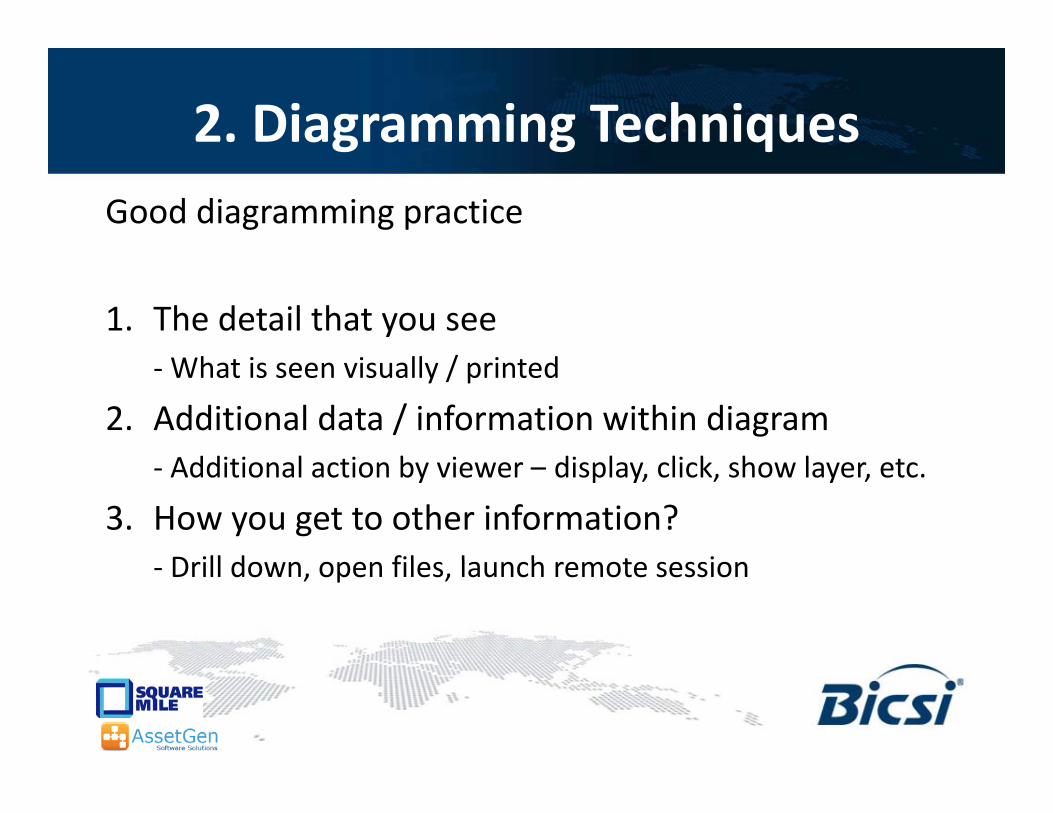
2. Diagramming Techniquesg g qGood diagramming practice
1. The detail that you see/- What is seen visually / printed
2. Additional data / information within diagramAddi i l i b i di l li k h l- Additional action by viewer – display, click, show layer, etc.
3. How you get to other information?D ill d fil l h t i- Drill down, open files, launch remote session
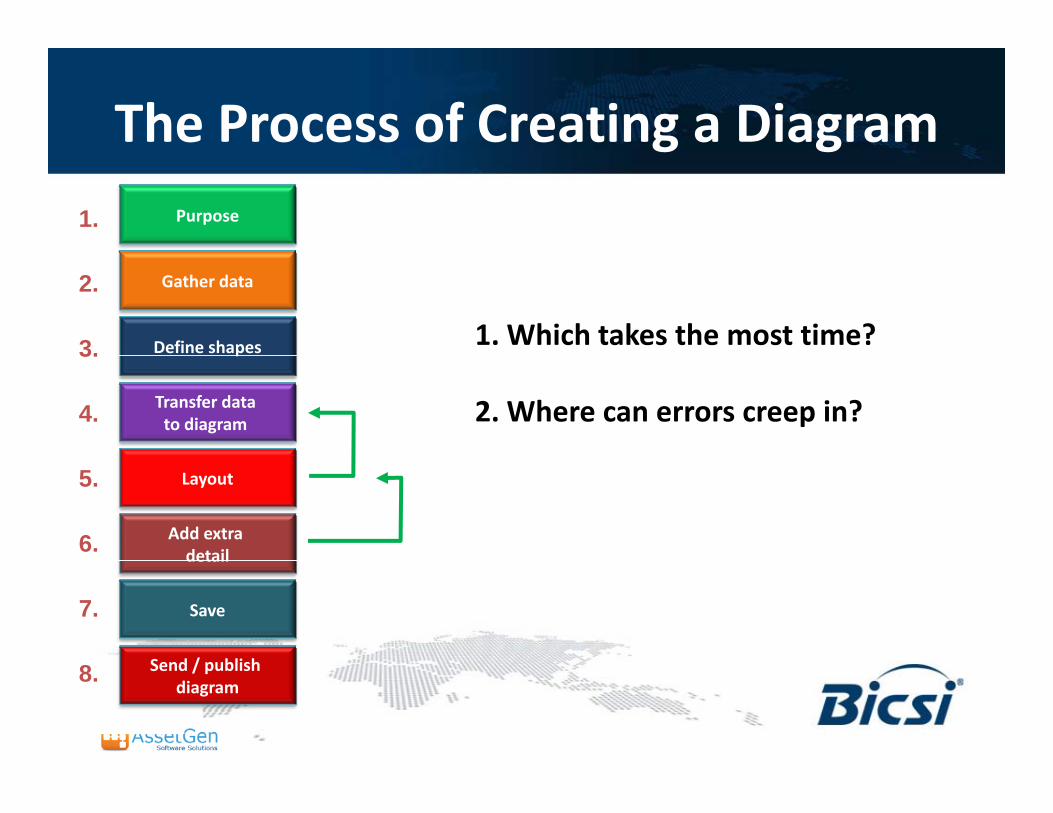
The Process of Creating a Diagramg g
1. Purpose
2.
3. 1. Which takes the most time?
Gather data
Define shapes3.
4. 2. Where can errors creep in?Transfer data to diagram
p
5.
6.
Layout
Add extra detail
7.
detail
Save
Send / publish8. Send / publish diagram

Diagram Process Examplesg p1. Purpose Rack Diagram R01
Network DiagramOrlando LAN
2.
3.
Gather data
Define shapes
Select Rack R01Inventory
Match to Physical Shapes
Switches / Routerin Orlando
Match to Logical Shapes
SW-BHAM-Trade01FAN
STATUS
C6509-E-FAN
1
2
3
4
5
6
7
8
9
WS-C6509-E
INPUT 110 0-2 40V ~
INPU T 110 0-2 40 V ~
SW-BHAM-CORE1.Card3
STATUS
WS- X6 748- GE-T X 4748
3738
3536
2526
2324
1314
1112
12
4 8 P O R T12119 107 85 63 41 2 242321 2219 2017 1815 1613 14 363533 3431 3229 3027 2825 26 484745 4643 4441 4239 4037 38
10/100/1000GE MO D
FAB RIC E NABLEDRJ45
SW-BHAM-CORE1.Card4
STATUS
WS- X6 748- GE-T X 4748
3738
3536
2526
2324
1314
1112
12
4 8 P O R T12119 107 85 63 41 2 242321 2219 2017 1815 1613 14 363533 3431 3229 3027 2825 26 484745 4643 4441 4239 4037 38
10/100/1000GE MO D
FAB RIC E NABLEDRJ45
SW-BHAM-CORE1.Card5
SW-BHAM-CORE1.Card9
WS-X6K-SUP1A-2GE
SUPERVISOR 1
STA
TU
S
SYS
TE
M
AC
TIV
E
PWR
MG
MT
RE
SET
CONSOLE
DT
E/D
CE
SWITCH LOAD
100%
1%
PORT 1
PCMCIA EJECT
PORT 2
LINK
LINK
SW-BHAM-CORE1.Card1
4. Transfer data to diagram
Create Shapes
l /
Physical Shapes
Create Shapesand connections
/
Logical Shapes1
FANOK
OUTPU TFAIL
2
INPU TOK
SWITCH M US T BE IN OFF “O” P OSITION TO INSTALL/REMOV E P OWER S UP PLY . FASTENE R MUST BE FULLYENGAGED P RIOR TO OP ERATING POWER SUPPL Y.
CISC O SYSTEMS, IN C.
INPUT 210 0-2 40V ~16 A60 /5 0 Hz
16 A60 /5 0 Hz
INSTALL
RUN
1
FANOK
OU TPU TFAIL
2
INP UTOK
S WITCH MUST BE IN OFF “O” POSITION T O INST ALL/REMOV E POWER S UP PLY . FASTE NE R MUST BE FULLYE NGAGED P RIOR TO OP ERATING P OWE R SUPP LY.
C ISC O SYS TEMS , INC.
INPU T 210 0-2 40 V ~16 A60 /50 Hz
16 A60 /50 Hz
INSTALL
RUN
SW-BHAM-CORE1
440
I
CRITICAL
MAJOR
MINOR
USER
COMP ACT
microsystems
440
I
CRITICAL
MAJOR
MINOR
USER
COMP ACT
microsystems
5.
6.
Layout
Add extra detail
Place/size to position in rack
Notes, etc.
Move/size for readability
Notes, etc.
8
7. Save
Send / publish
Save as Rack R01
Store on server
Save as Orlando LAN
Store on server8. Send / publish diagram
Store on serverIntranet/SharePoint
Store on serverIntranet/SharePoint
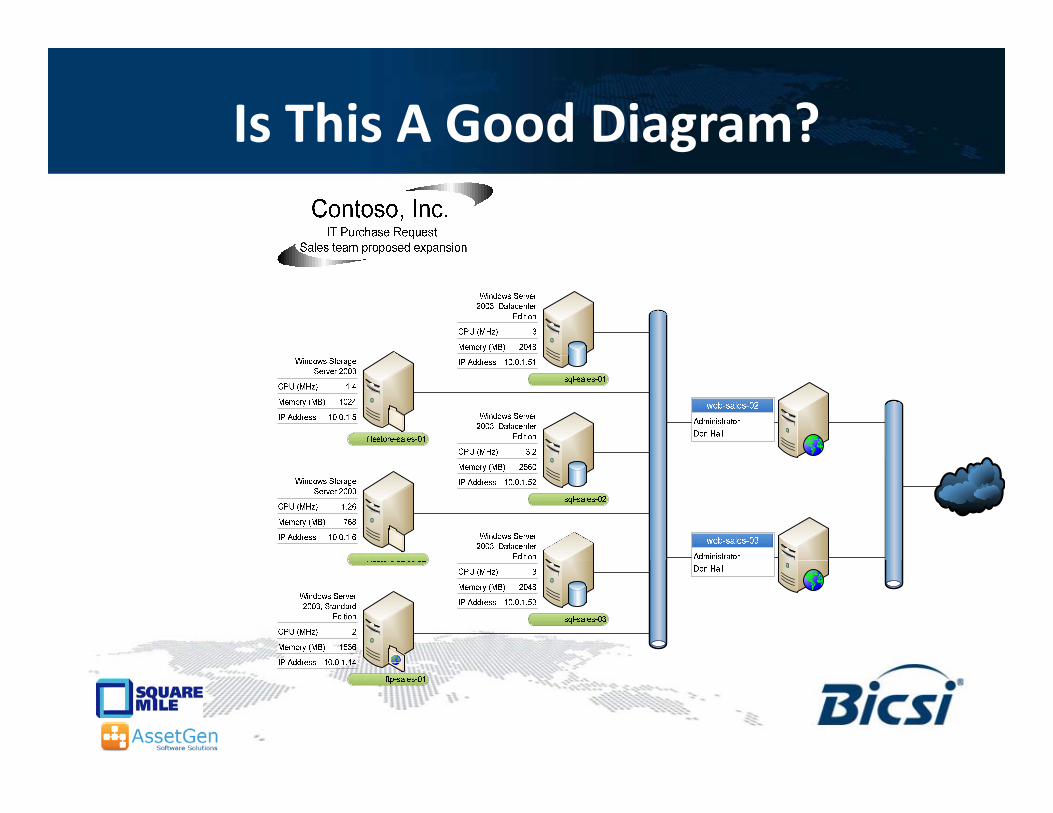
Is This A Good Diagram?g
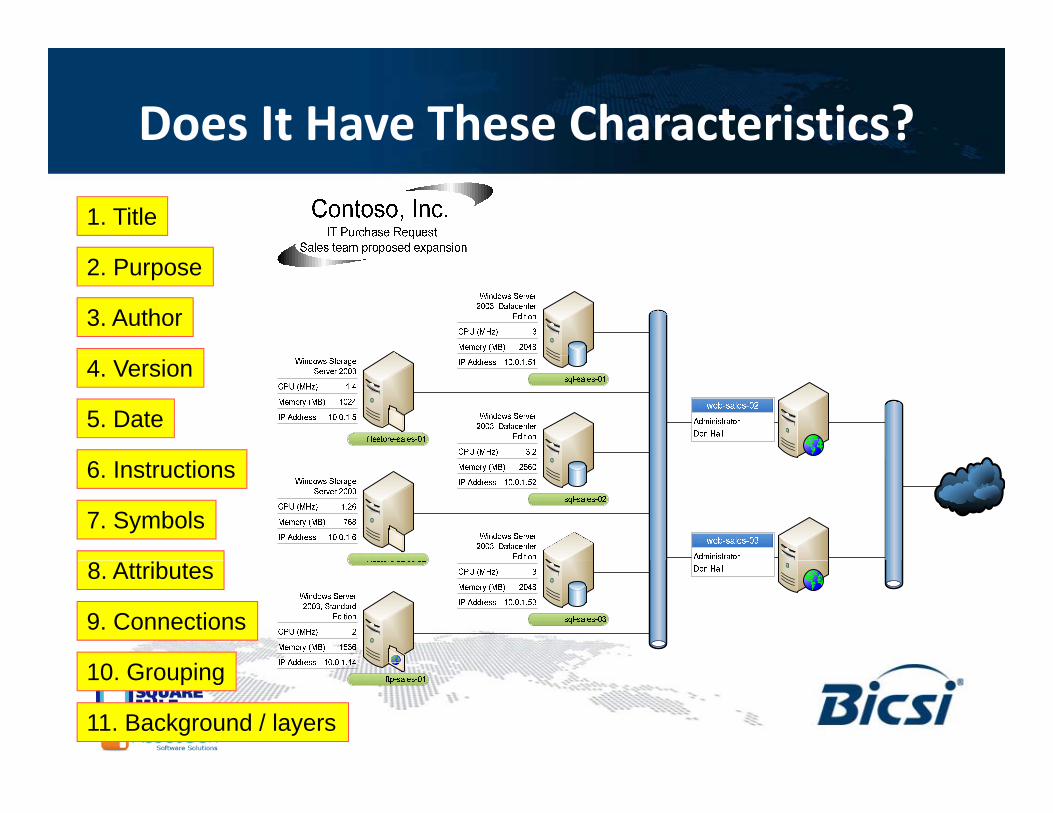
Does It Have These Characteristics?
1. Title
2. Purpose
3. Author
4. Version
5. Date
7. Symbols
6. Instructions
8. Attributes
9. Connections
10 G i10. Grouping
11. Background / layers
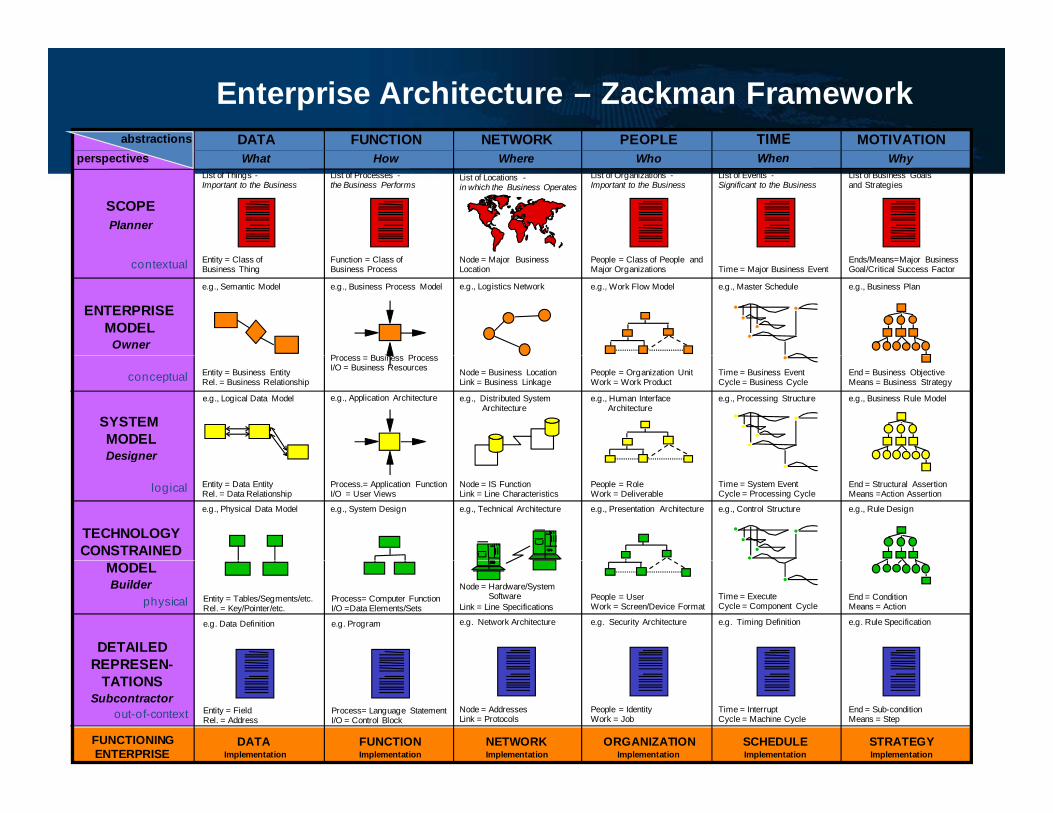
Enterprise Architecture – Zackman FrameworkDATA FUNCTION NETWORK MOTIVATIONPEOPLEabstractionsWhat How Where
List of Things -Important to the Business
List of Processes -the Business Performs
List of Locations -in which the Business Operates
WhyWhoList of Business Goals and Strategies
List of Events -Significant to the Business
List of Organizations -Important to the Business
SCOPEPlanner
perspectives
e.g., Semantic Model
Entity = Class ofBusiness Thing
Function = Class ofBusiness Process
e.g., Business Process Model
P B i P
Node = Major BusinessLocation
e.g., Logistics Network
Ends/Means=Major BusinessGoal/Critical Success FactorTime = Major Business Event
e.g., Master Schedule
People = Class of People andMajor Organizations
e.g., Work Flow Model e.g., Business Plan
ENTERPRISE MODEL
Owner
contextual
e.g., Logical Data Model
Entity = Business EntityRel. = Business Relationship
e.g., Application Architecture
Process = Business ProcessI/O = Business Resources Node = Business Location
Link = Business Linkage
e.g., Distributed SystemArchitecture
e.g., Business Rule Model
End = Business ObjectiveMeans = Business Strategy
e.g., Processing Structure
Time = Business EventCycle = Business Cycle
People = Organization UnitWork = Work Product
e.g., Human InterfaceArchitecture
SYSTEM MODELDesigner
conceptual
e.g., Physical Data Model
Entity = Data EntityRel. = Data Relationship
Process.= Application FunctionI/O = User Views
e.g., System Design
Node = IS FunctionLink = Line Characteristics
e.g., Technical Architecture e.g., Rule Design
End = Structural AssertionMeans =Action Assertion
Time = System EventCycle = Processing Cycle
e.g., Control Structure
People = RoleWork = Deliverable
e.g., Presentation Architecture
Designer
TECHNOLOGYCONSTRAINED
logical
e.g. Data Definition
Entity = Tables/Segments/etc.Rel. = Key/Pointer/etc.
Process= Computer FunctionI/O =Data Elements/Sets
e.g. Program
Node = Hardware/SystemSoftware
Link = Line Specifications
e.g. Network Architecture e.g. Rule Specification
End = ConditionMeans = Action
Time = ExecuteCycle = Component Cycle
e.g. Timing Definition
People = UserWork = Screen/Device Format
e.g. Security Architecture
MODELBuilder
DETAILEDREPRESEN
physical
DATA Implementation
Entity = FieldRel. = Address
Process= Language StatementI/O = Control Block
FUNCTIONImplementation
Node = AddressesLink = Protocols
NETWORKImplementation
End = Sub-conditionMeans = Step
Time = InterruptCycle = Machine Cycle
SCHEDULEImplementation
People = IdentityWork = Job
ORGANIZATIONImplementation
STRATEGYImplementation
REPRESEN-TATIONS
Subcontractorout-of-context
FUNCTIONINGENTERPRISE
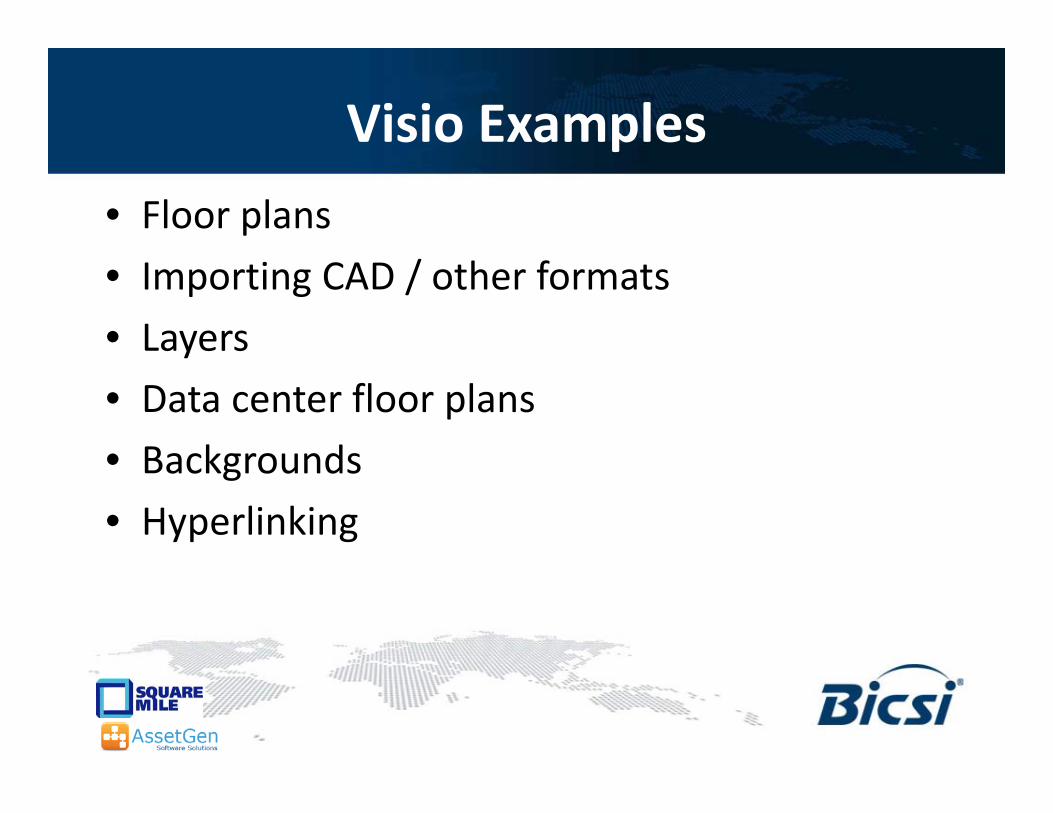
Visio Examplesp
• Floor plans
• Importing CAD / other formats
• Layers y
• Data center floor plans
• Backgrounds• Backgrounds
• Hyperlinking
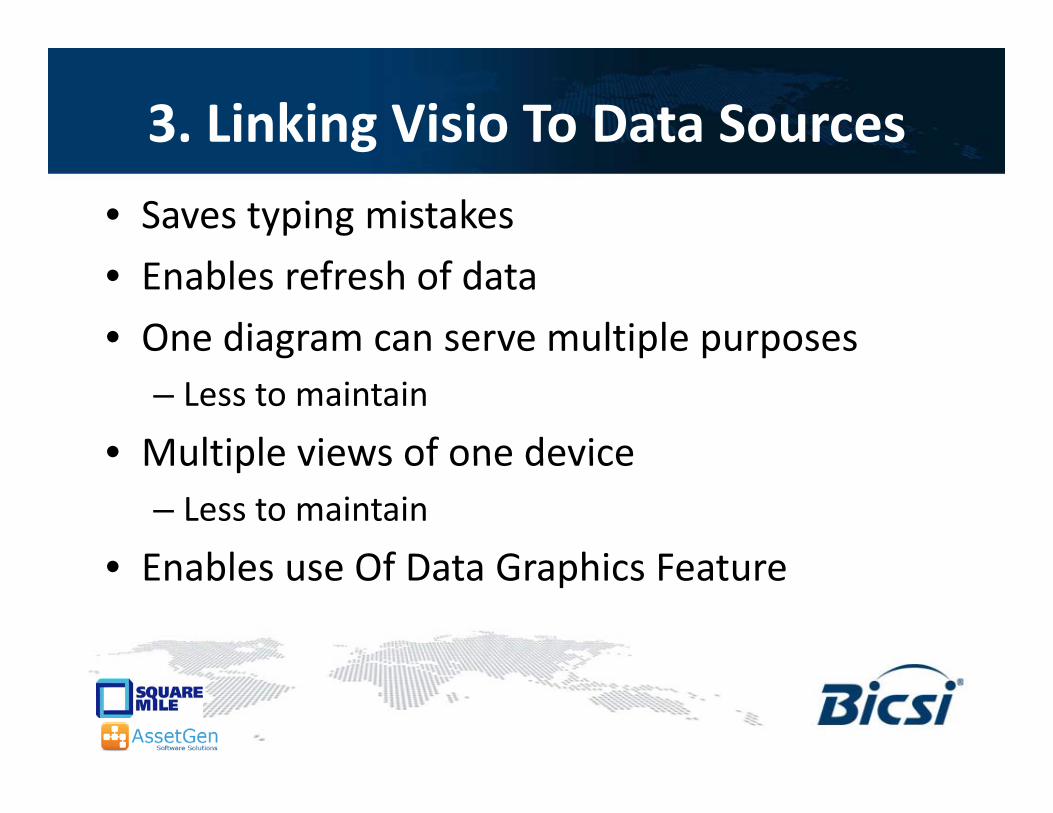
3. Linking Visio To Data Sourcesg
• Saves typing mistakes
• Enables refresh of data
• One diagram can serve multiple purposesg p p p– Less to maintain
• Multiple views of one deviceMultiple views of one device– Less to maintain
• Enables se Of Data Graphics Feat re• Enables use Of Data Graphics Feature
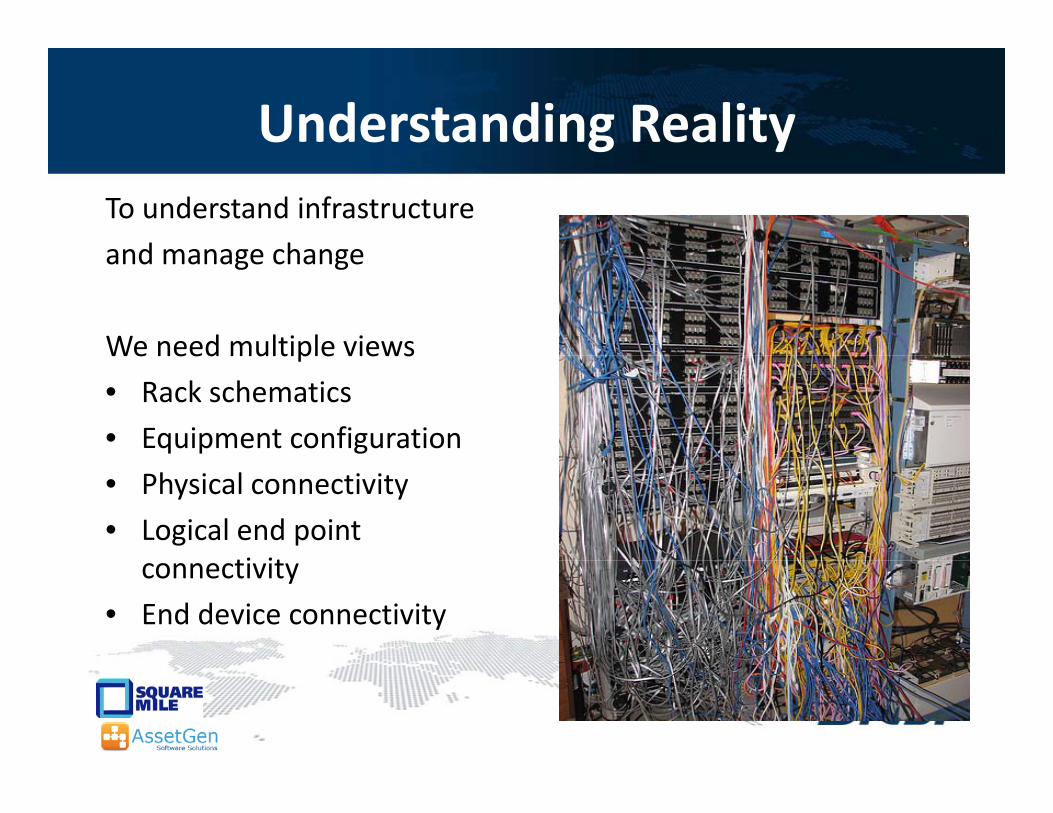
Understanding Realityg yTo understand infrastructure
and manage changeand manage change
We need multiple viewsWe need multiple views
• Rack schematics
• Equipment configuration
• Physical connectivity
• Logical end point ti itconnectivity
• End device connectivity
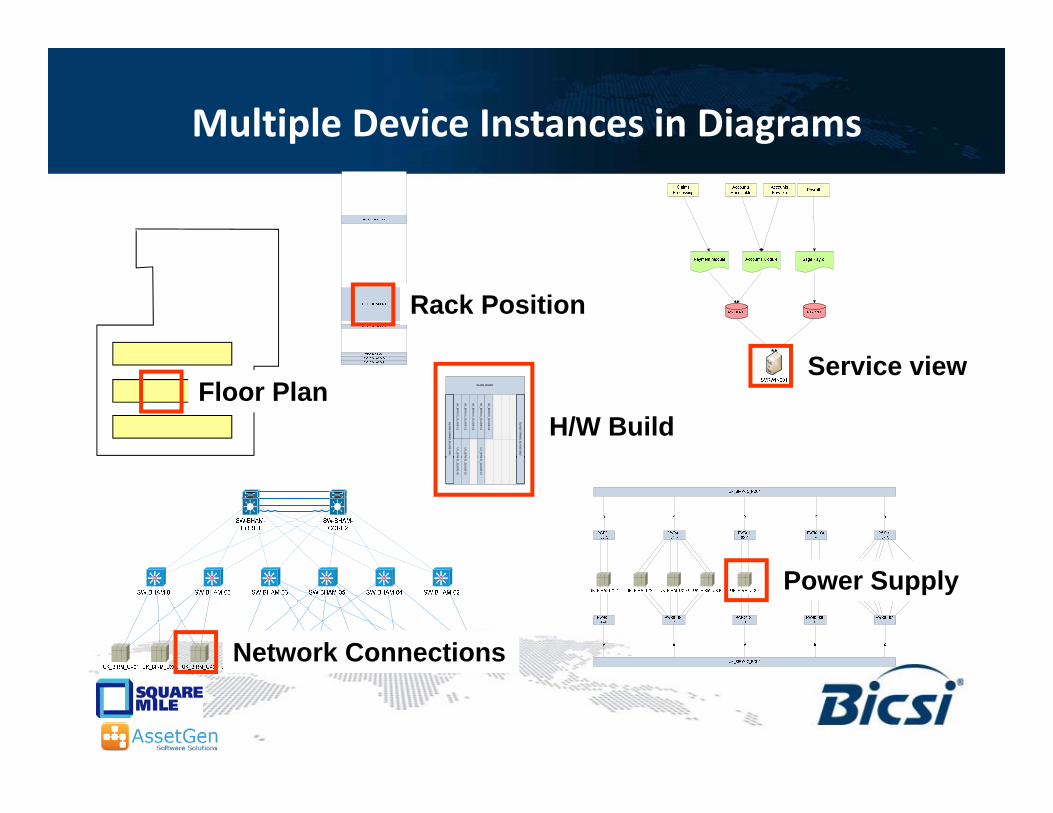
Multiple Device Instances in Diagrams
Rack Position
Floor PlanService view
BLADE_BIRM01
UK
_BIRM
01_BLADE-01
UK
_BIRM
01_BLADE-02
UK
_BIRM
01_BLADE-03
UK
_BIRM
01_BLADE-04
BLADE-BIR
M01.BLAD
E-SW1
BLADE-BIR
M01.BLAD
E-SW2
UK
_BIRM
01_BLADE-05
UK_BIR
M
UK_BIR
M
UK_BIR
M
H/W Build
M01_BLAD
E-09
M01_BLAD
E-10
M01_BLAD
E-12
Power Supply
Network Connections
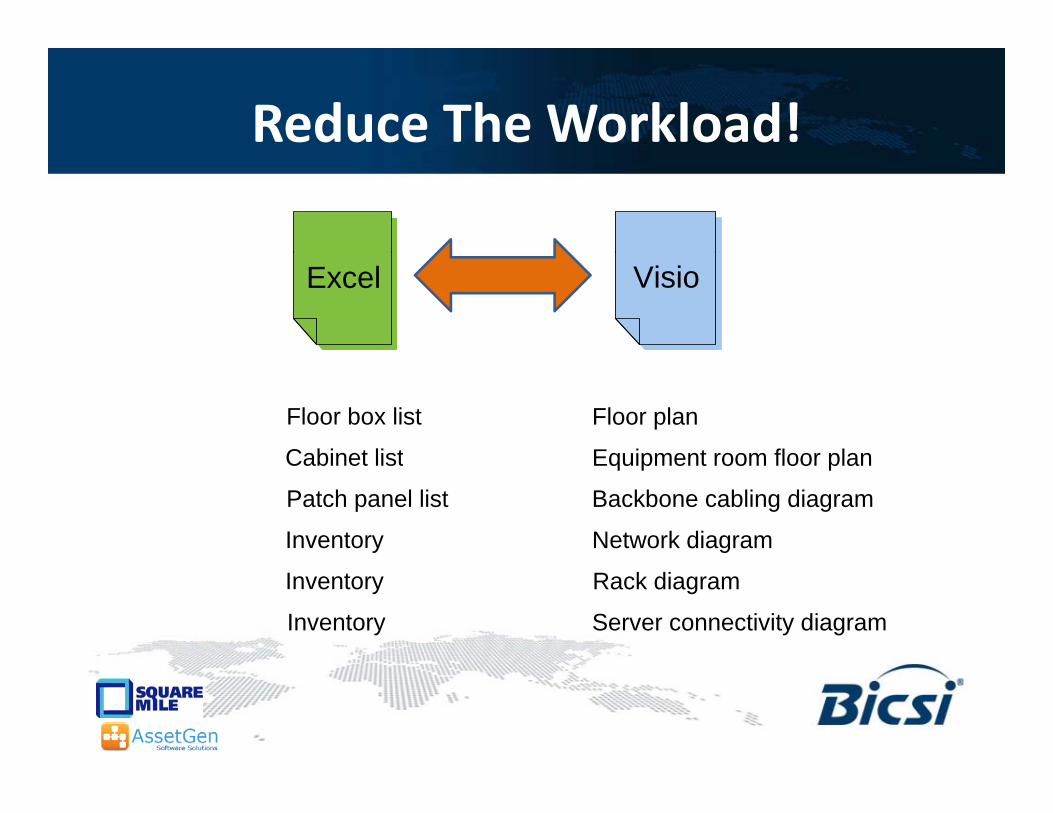
Reduce The Workload!
Excel Visio
Floor box list Floor plan
Cabinet list Equipment room floor planCabinet list Equipment room floor plan
Patch panel list Backbone cabling diagram
Inventory Network diagram
Inventory Rack diagram
Inventory Server connectivity diagram
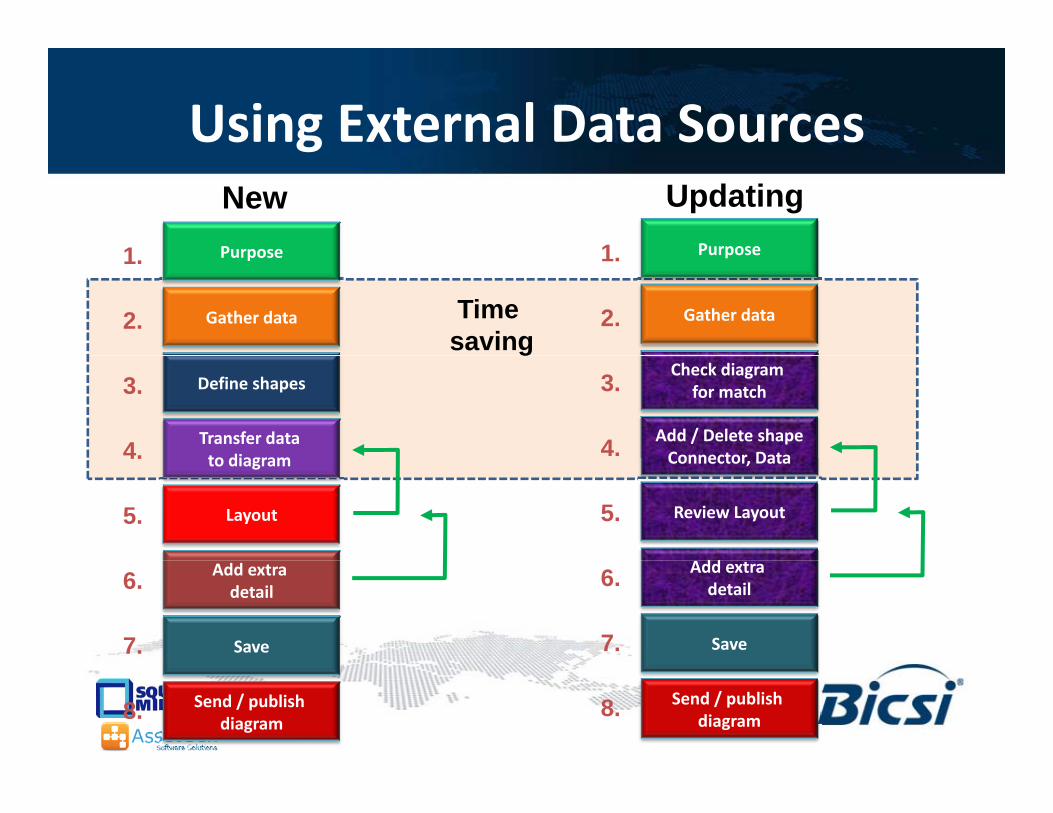
Using External Data Sourcesg
1
NewPurpose 1
UpdatingPurpose1.
2.
Purpose
Gather data
1.
2.
Purpose
Gather dataTime saving
3.
4. Transfer data to diagram
Define shapes 3.
4. Add / Delete shapeConnector Data
Check diagram for match
g
4.
5.
to diagram
Layout 5.
Connector, Data
Review Layout
dd6.
7.
Add extra detail
Save
6.
7.
Add extra detail
Save
8. Send / publish diagram
8. Send / publish diagram
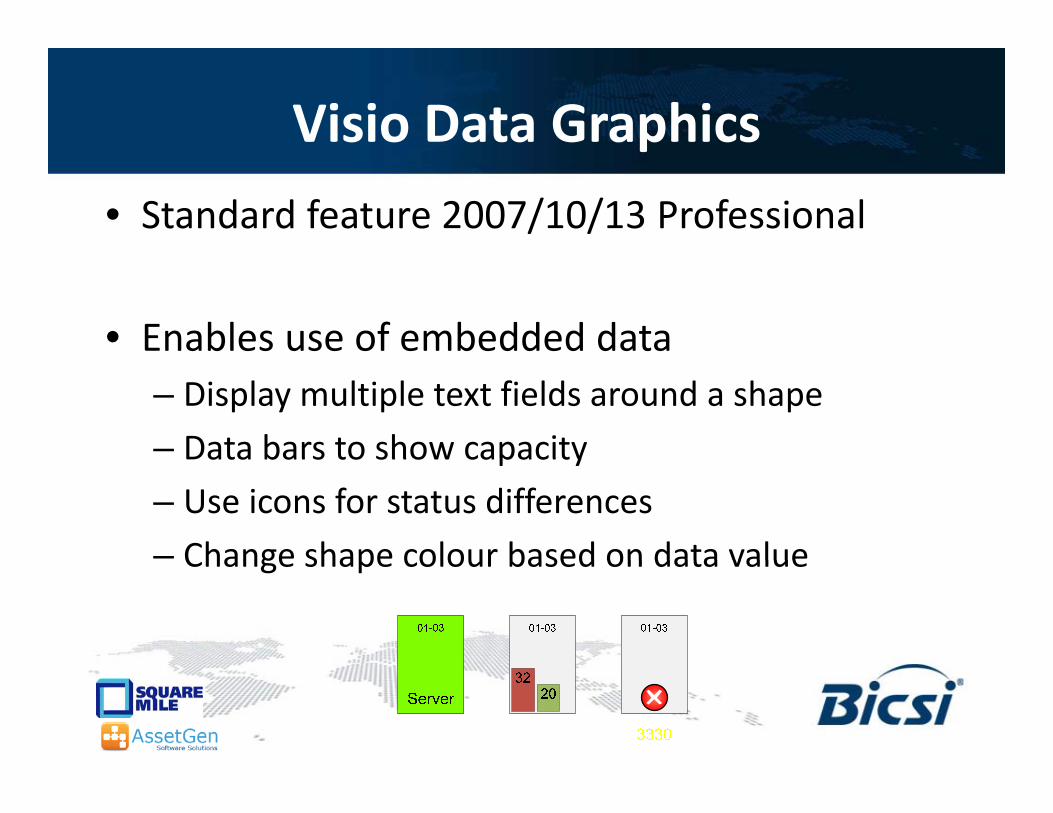
Visio Data Graphicsp
• Standard feature 2007/10/13 Professional
• Enables use of embedded data– Display multiple text fields around a shape
– Data bars to show capacityData bars to show capacity
– Use icons for status differences
– Change shape colour based on data valueChange shape colour based on data value
Limitations Of Visio / Data Source
• Good for quick diagrams
• The data transfer and refresh is automated, but the filtering and selection is manual
• It doesn’t connect shapes together– Limits value in a network environment
• New devices are not added to diagrams
First Steps For Multiple Diagramsp p g• Control use of shapes / stencils
ll b i f di i f i• Follow best practices for diagram information
• Save reference versions in common areas– File locations
– Web site
SharePoint– SharePoint
• Use a common source where possible for shape data– Databases preferred to spreadsheets– Databases preferred to spreadsheets
– Create views to suit diagram information need
4. Automation For Larger Infrastructures
• Looking beyond a few spreadsheets
• Minimise manual maintenance effort– Scale and separation of roles demands it
• Improving accuracy and consistency– Software driven diagram productionSoftware driven diagram production
• Infrastructure document managementShared across teams controlled access– Shared across teams, controlled access
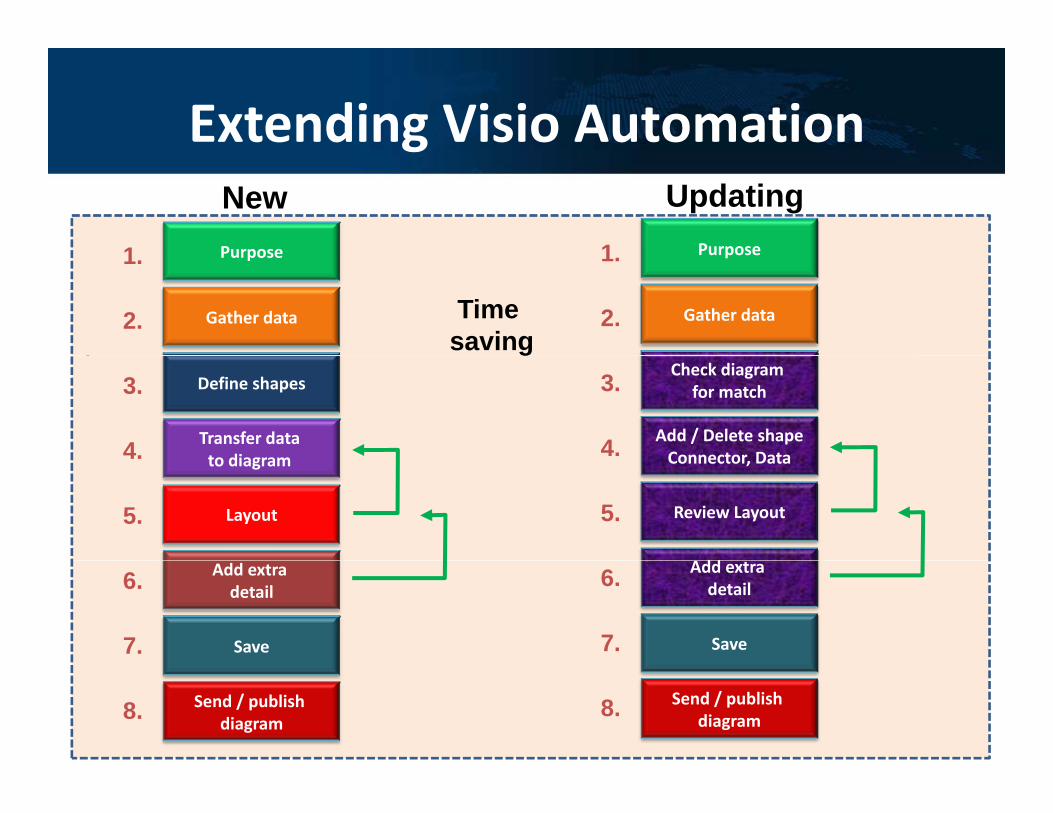
Extending Visio Automationg
1
NewPurpose 1
UpdatingPurpose
Time saving
1.
2.
Purpose
Gather data
1.
2.
Purpose
Gather data
g3.
4. Transfer data to diagram
Define shapes 3.
4. Add / Delete shapeConnector Data
Check diagram for match
4.
5.
to diagram
Layout 5.
Connector, Data
Review Layout
dd6.
7.
Add extra detail
Save
6.
7.
Add extra detail
Save
8. Send / publish diagram
8. Send / publish diagram
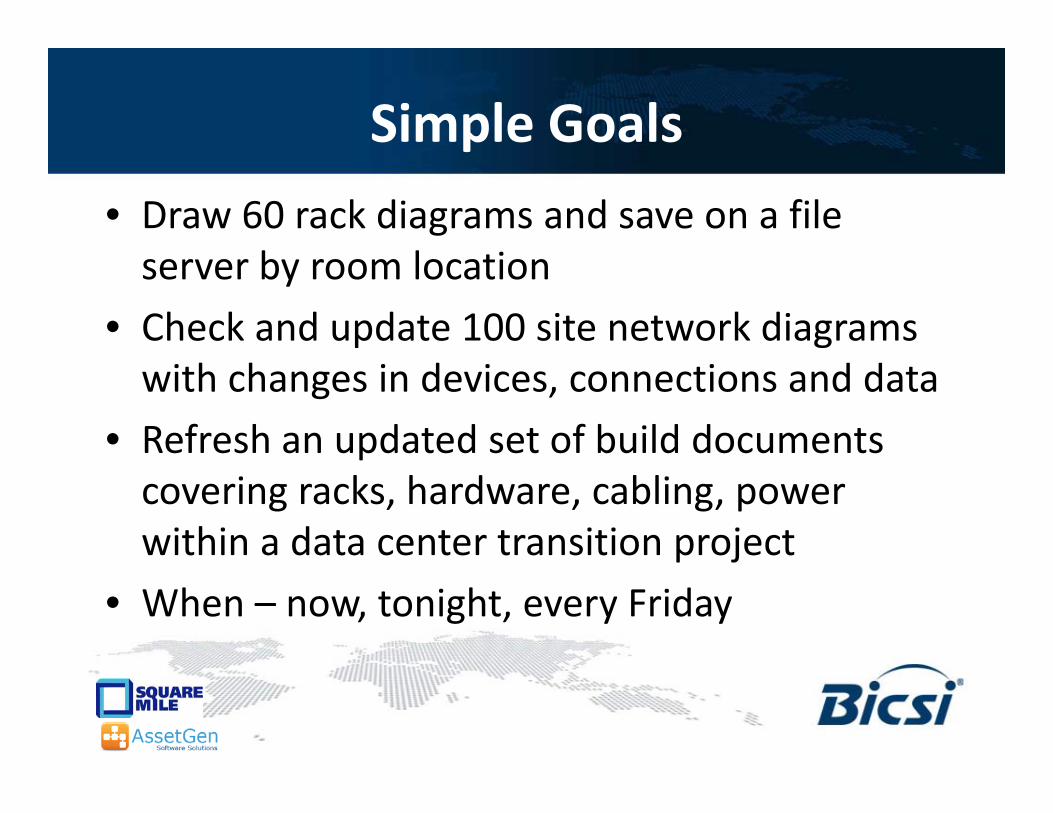
Simple Goalsp
• Draw 60 rack diagrams and save on a file b l iserver by room location
• Check and update 100 site network diagrams with changes in devices, connections and data
• Refresh an updated set of build documents pcovering racks, hardware, cabling, power within a data center transition projectp j
• When – now, tonight, every Friday
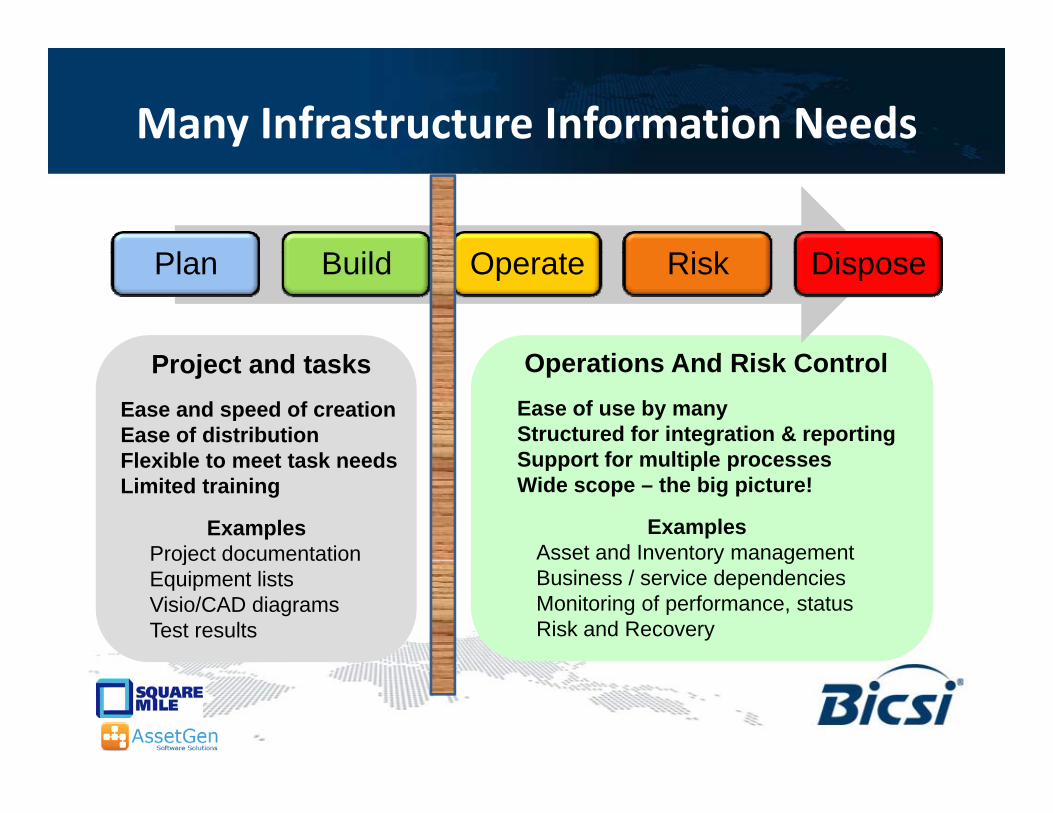
Many Infrastructure Information Needs
Pl B ild O t Ri k DiPlan Build Operate Risk Dispose
P j t d t k O ti A d Ri k C t lProject and tasks Operations And Risk ControlEase and speed of creationEase of distributionFlexible to meet task needs
Ease of use by manyStructured for integration & reportingSupport for multiple processes
ExamplesProject documentation
ExamplesAsset and Inventory management
Flexible to meet task needsLimited training
Support for multiple processesWide scope – the big picture!
Project documentationEquipment listsVisio/CAD diagramsTest results
y gBusiness / service dependenciesMonitoring of performance, statusRisk and Recovery
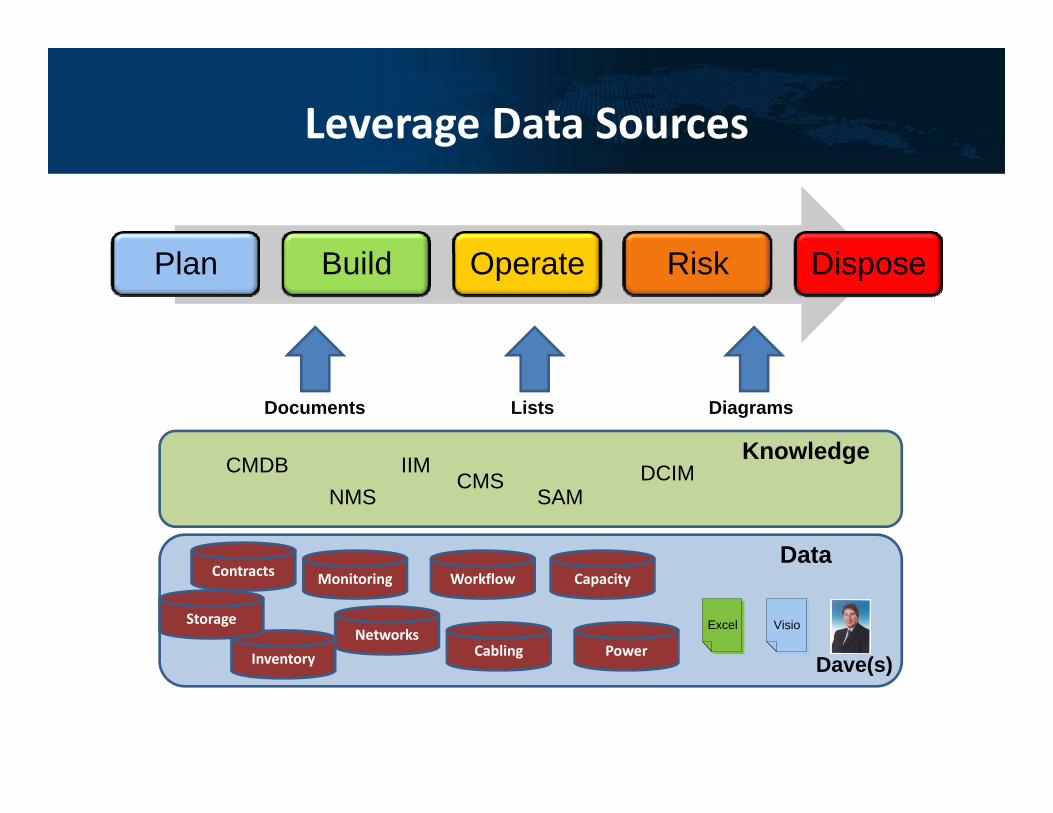
Leverage Data Sources
Pl B ild O t Ri k DiPlan Build Operate Risk Dispose
ListsDocuments Diagrams
KnowledgeIIMCMDB Knowledge IIMCMDB DCIMCMSNMS SAM
Data
Inventory
Monitoring Workflow Capacity
Cabling
Contracts
PowerNetworks
Storage
Dave(s)
Excel Visio
Data
Inventory Dave(s)
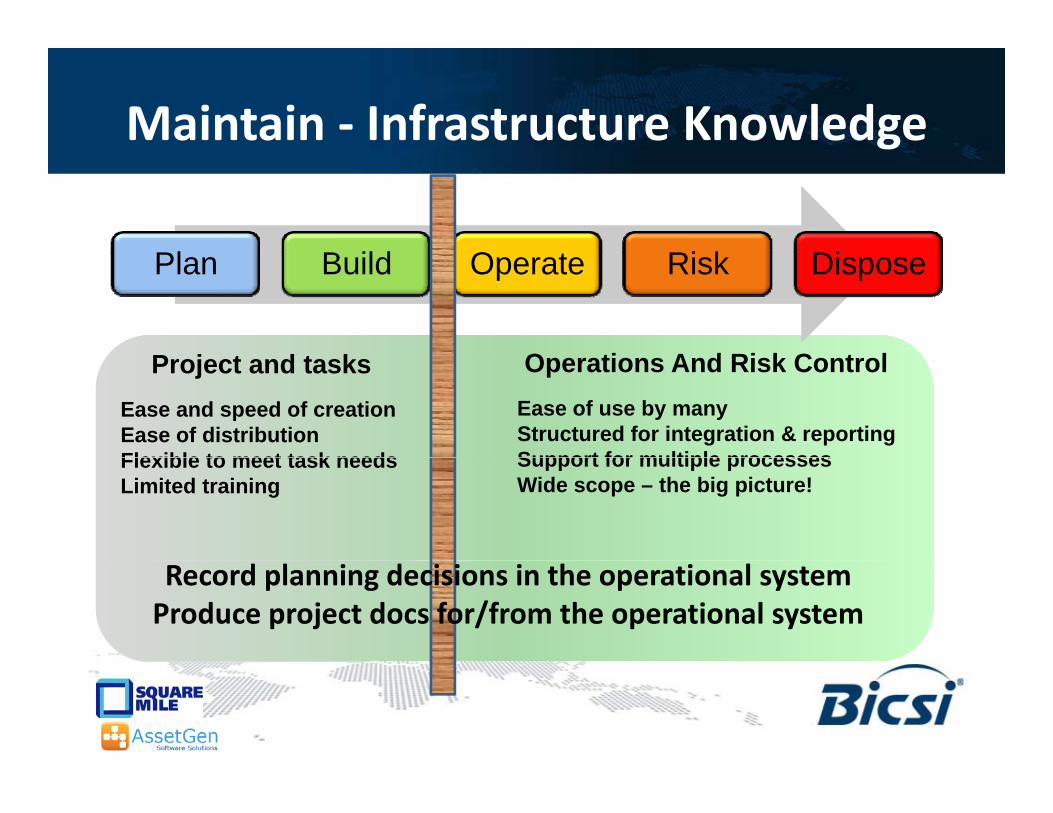
Maintain - Infrastructure Knowledge
Pl B ild O t Ri k DiPlan Build Operate Risk Dispose
P j t d t k O ti A d Ri k C t lProject and tasks Operations And Risk ControlEase and speed of creationEase of distributionFlexible to meet task needs
Ease of use by manyStructured for integration & reportingSupport for multiple processesFlexible to meet task needs
Limited trainingSupport for multiple processesWide scope – the big picture!
Record planning decisions in the operational systemProduce project docs for/from the operational system
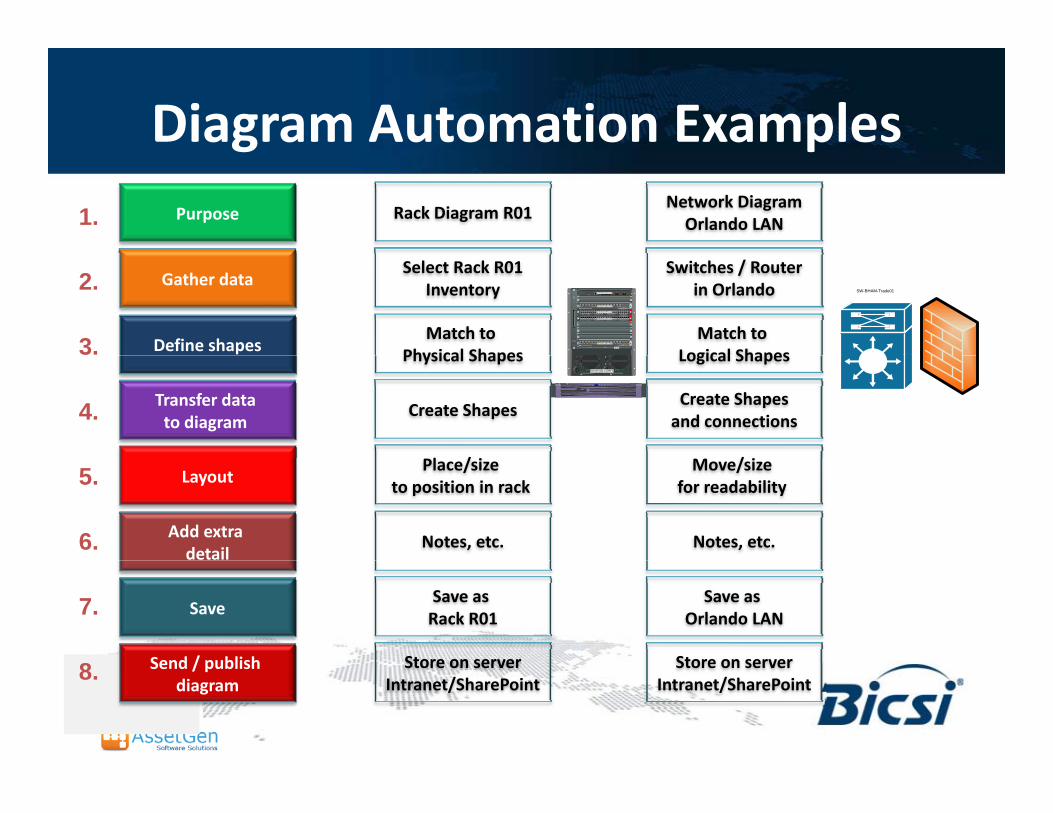
Diagram Automation Examplesg p1. Purpose Rack Diagram R01
Network DiagramOrlando LAN
2.
3.
Gather data
Define shapes
Select Rack R01Inventory
Match to Physical Shapes
Switches / Routerin Orlando
Match to Logical Shapes
SW-BHAM-Trade01FAN
STATUS
C6509-E-FAN
1
2
3
4
5
6
7
8
9
WS-C6509-E
INPUT 110 0-2 40V ~
INPU T 110 0-2 40 V ~
SW-BHAM-CORE1.Card3
STATUS
WS- X6 748- GE-T X 4748
3738
3536
2526
2324
1314
1112
12
4 8 P O R T12119 107 85 63 41 2 242321 2219 2017 1815 1613 14 363533 3431 3229 3027 2825 26 484745 4643 4441 4239 4037 38
10/100/1000GE MO D
FAB RIC E NABLEDRJ45
SW-BHAM-CORE1.Card4
STATUS
WS- X6 748- GE-T X 4748
3738
3536
2526
2324
1314
1112
12
4 8 P O R T12119 107 85 63 41 2 242321 2219 2017 1815 1613 14 363533 3431 3229 3027 2825 26 484745 4643 4441 4239 4037 38
10/100/1000GE MO D
FAB RIC E NABLEDRJ45
SW-BHAM-CORE1.Card5
SW-BHAM-CORE1.Card9
WS-X6K-SUP1A-2GE
SUPERVISOR 1
STA
TU
S
SYS
TE
M
AC
TIV
E
PWR
MG
MT
RE
SET
CONSOLE
DT
E/D
CE
SWITCH LOAD
100%
1%
PORT 1
PCMCIA EJECT
PORT 2
LINK
LINK
SW-BHAM-CORE1.Card1
4. Transfer data to diagram
Create Shapes
l /
Physical Shapes
Create Shapesand connections
/
Logical Shapes1
FANOK
OUTPU TFAIL
2
INPU TOK
SWITCH M US T BE IN OFF “O” P OSITION TO INSTALL/REMOV E P OWER S UP PLY . FASTENE R MUST BE FULLYENGAGED P RIOR TO OP ERATING POWER SUPPL Y.
CISC O SYSTEMS, IN C.
INPUT 210 0-2 40V ~16 A60 /5 0 Hz
16 A60 /5 0 Hz
INSTALL
RUN
1
FANOK
OU TPU TFAIL
2
INP UTOK
S WITCH MUST BE IN OFF “O” POSITION T O INST ALL/REMOV E POWER S UP PLY . FASTE NE R MUST BE FULLYE NGAGED P RIOR TO OP ERATING P OWE R SUPP LY.
C ISC O SYS TEMS , INC.
INPU T 210 0-2 40 V ~16 A60 /50 Hz
16 A60 /50 Hz
INSTALL
RUN
SW-BHAM-CORE1
440
I
CRITICAL
MAJOR
MINOR
USER
COMP ACT
microsystems
440
I
CRITICAL
MAJOR
MINOR
USER
COMP ACT
microsystems
5.
6.
Layout
Add extra detail
Place/size to position in rack
Notes, etc.
Move/size for readability
Notes, etc.
8
7. Save
Send / publish
Save as Rack R01
Store on server
Save as Orlando LAN
Store on server8. Send / publish diagram
Store on serverIntranet/SharePoint
Store on serverIntranet/SharePoint
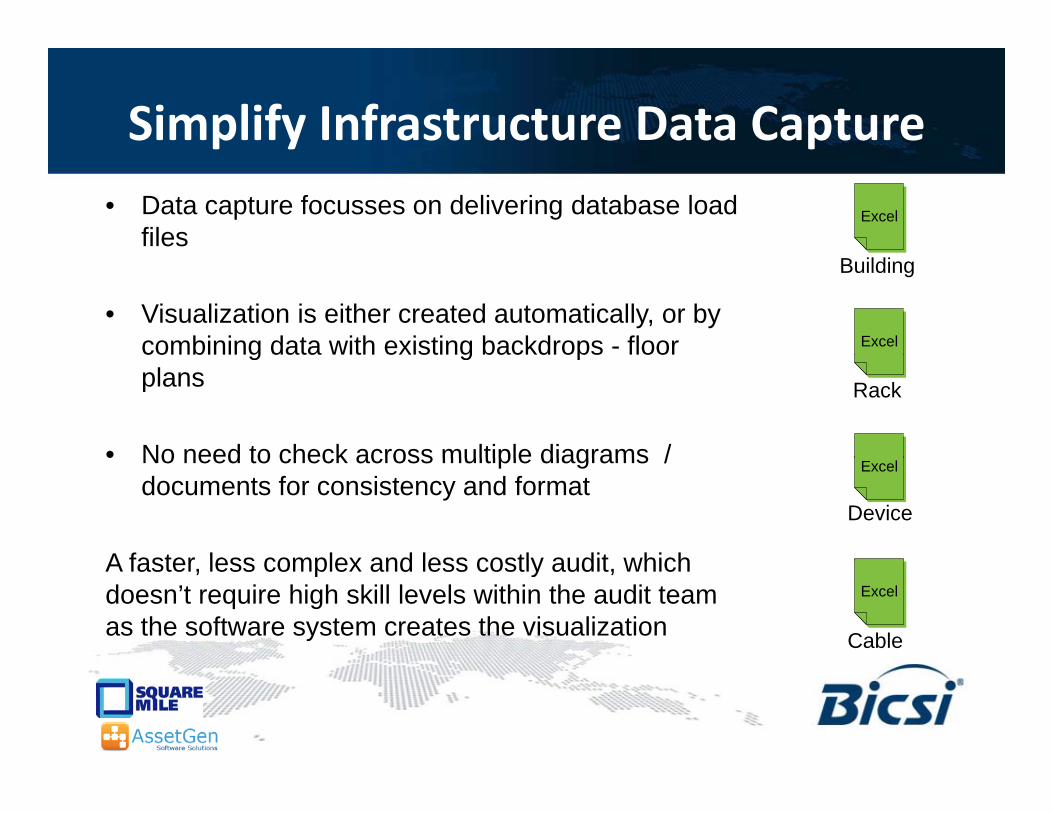
Simplify Infrastructure Data Capture• Data capture focusses on delivering database load
filesExcel
• Visualization is either created automatically, or by combining data with existing backdrops - floor Excel
Building
g g pplans
• No need to check across multiple diagrams /
Rack
No need to check across multiple diagrams / documents for consistency and format
A faster less complex and less costly audit which
Excel
Device
A faster, less complex and less costly audit, which doesn’t require high skill levels within the audit team as the software system creates the visualization
Excel
Cable
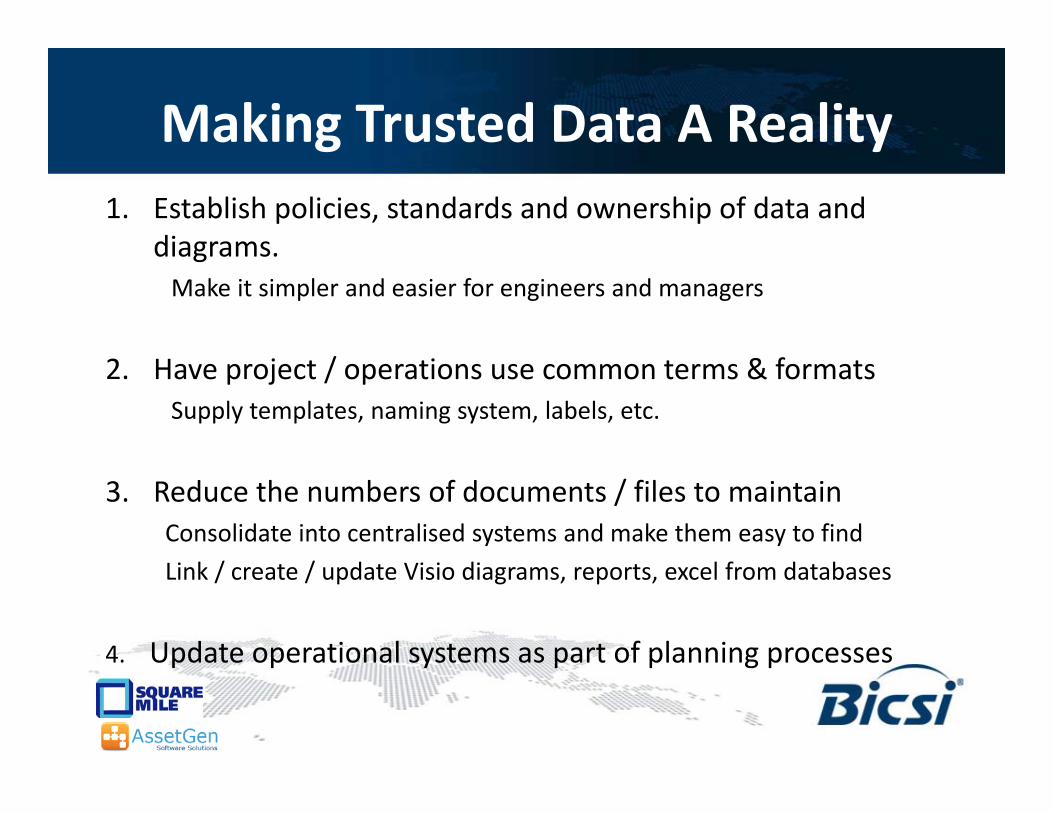
Making Trusted Data A Realityg y1. Establish policies, standards and ownership of data and
diagramsdiagrams.Make it simpler and easier for engineers and managers
2. Have project / operations use common terms & formatsSupply templates, naming system, labels, etc.
3. Reduce the numbers of documents / files to maintainConsolidate into centralised systems and make them easy to find
/ /Link / create / update Visio diagrams, reports, excel from databases
4. Update operational systems as part of planning processesp p y p p g p
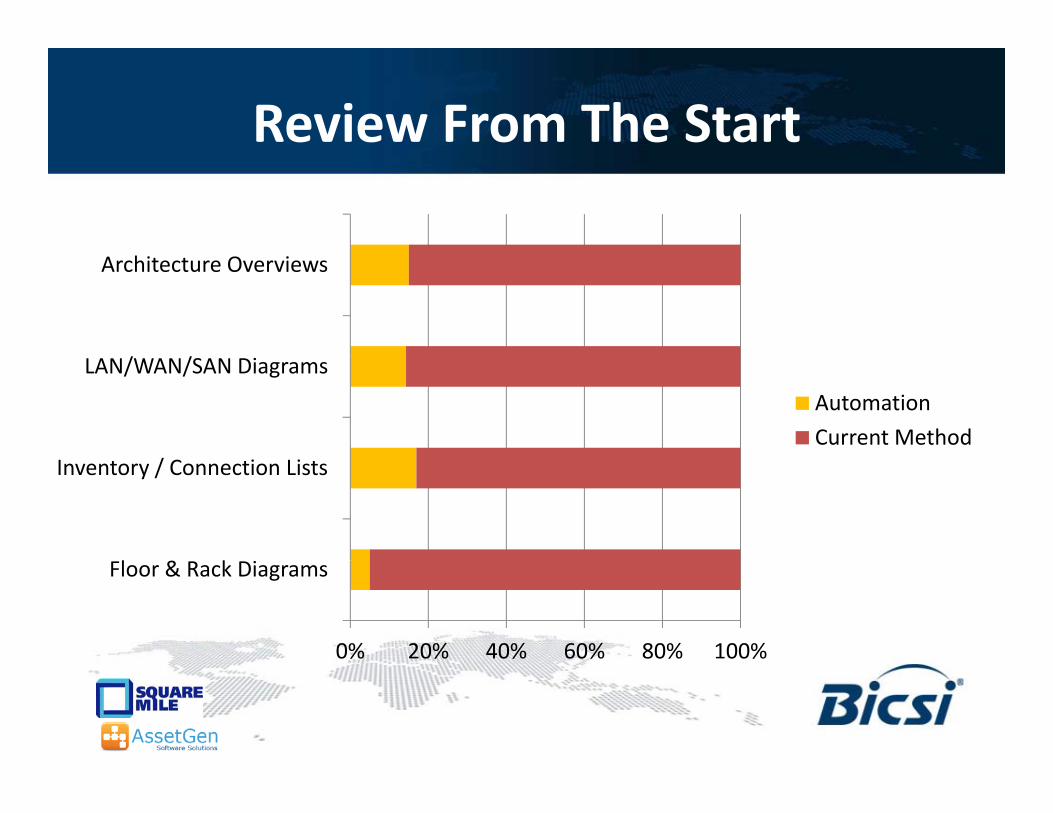
Review From The Start
Architecture Overviews
/
LAN/WAN/SAN Diagrams
Automation
Current Method
l k
Inventory / Connection Lists
0% 20% 40% 60% 80% 100%
Floor & Rack Diagrams
Visio Automation Tips and Techniques
• Lots of productivity features are unknownS lf d th l t f ff t!– Save yourself and others a lot of effort!
– Learn more about Visio
• Linking to existing data sources has many benefitsLess errors easier to refresh diagrams and update them– Less errors, easier to refresh diagrams and update them
– Use the data graphics feature to reduce diagram numbers
• For larger environments Assess the value of database driven systems– Assess the value of database driven systems
Additional Material
www.microsoft.comhttp://blogs.office.com/b/visio/
https://www.facebook.com/MicrosoftVisio
www.squaremilesystems.comFree SMS Visio utilities Downloads and videos
Webinars/videos Visio automation, documenting cabling, etc.
www.assetgen.comEvaluation software Free “DCIM/CMS” evaluation version
Webinars Data center practices Visio integrationWebinars Data center practices, Visio integration