Embed Size (px)
Citation preview
1
Dr. Boris ZibitskerBEZ [email protected]
Reducing Risk of Surprises in
Changing Oracle RAC Environment
2
Outline
Major issues affecting Oracle RAC scalability for large EDW with mixed workloads
– Shared Storage – Variable DOP affects consistency of RT and throughput– Memory management– Workload management
Role of workload characterization and performance prediction in organizing Proactive Performance ManagementHow to set up realistic expectationsSystems approach includes analysis of all interdependent components of the multi-tier distributed environment, including web servers, application servers and DBMS serversCase studies illustrate justification of strategic, tactical andoperational decisions during different phases of EDW life cycleSummary
©2007 BEZ Systems
3
Introduction
Dr. Boris Zibitsker, Chairman, CTO BEZ SystemsBoris founded BEZ Systems, a software development company focused on Predictive Performance Management, in 1983Boris and his colleagues developed performance prediction software supporting Oracle, DB2 UDB ESE, Teradata, Java EE applications in multi-tier distributed environment:
– BEZPlus — 1992– BEZProphet — 2005– BEZVision — 2007
Boris was Adjunct Associate Professor at DePaul University (1983 – 1990)He has worked on modeling and performance prediction for relational DBMS since 1983 and has taught seminars around the world for Relational Institute, which was organized by the pioneers of relational technology, Ted Codd and Chris DateBoris has consulted over 200 Fortune 500 companies on Proactive Performance Management
©2007 BEZ Systems
4
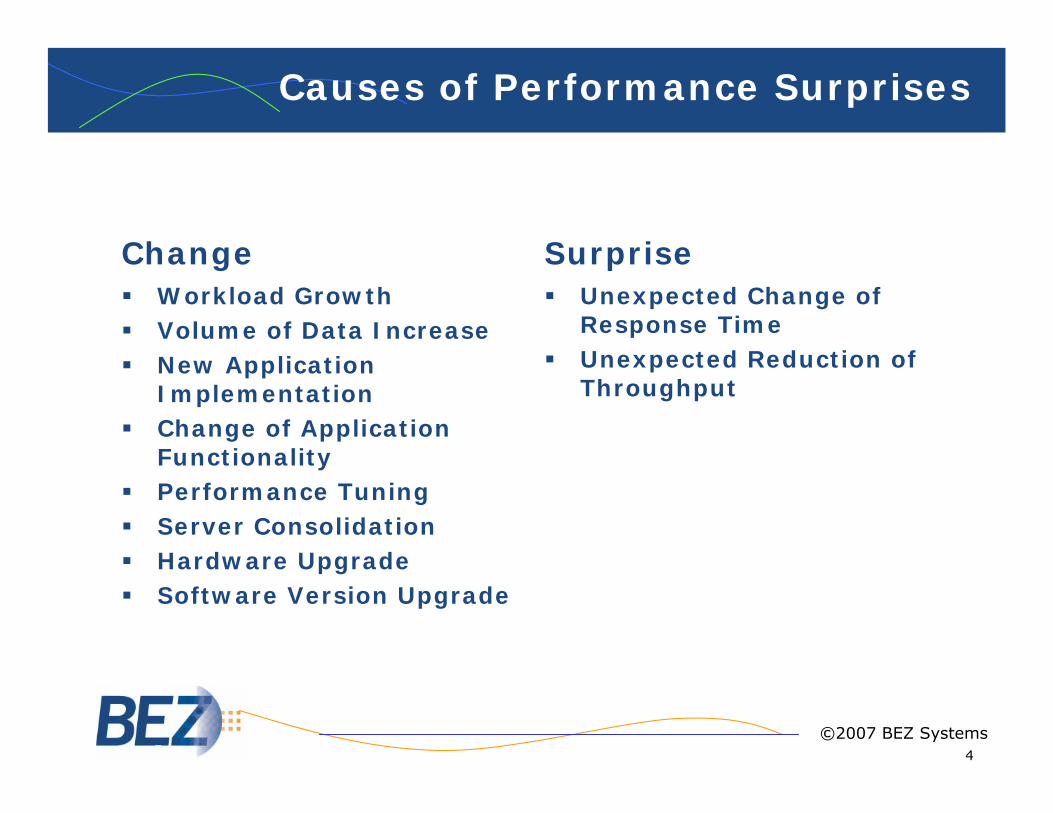
Causes of Performance Surprises
SurpriseUnexpected Change of Response TimeUnexpected Reduction of Throughput
ChangeWorkload GrowthVolume of Data IncreaseNew Application ImplementationChange of Application FunctionalityPerformance TuningServer ConsolidationHardware UpgradeSoftware Version Upgrade
©2007 BEZ Systems
5
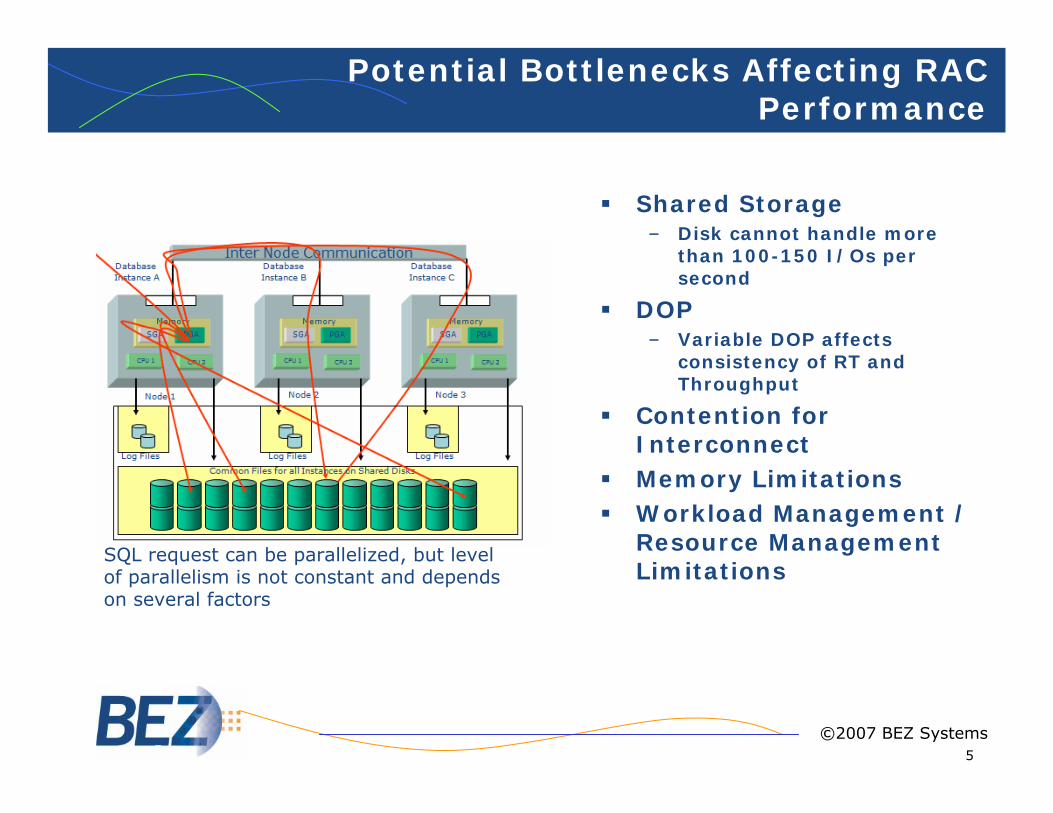
Potential Bottlenecks Affecting RAC Performance
Shared Storage– Disk cannot handle more
than 100-150 I/Os per second
DOP– Variable DOP affects
consistency of RT and Throughput
Contention for InterconnectMemory LimitationsWorkload Management / Resource Management Limitations
SQL request can be parallelized, but level of parallelism is not constant and depends on several factors
©2007 BEZ Systems
6
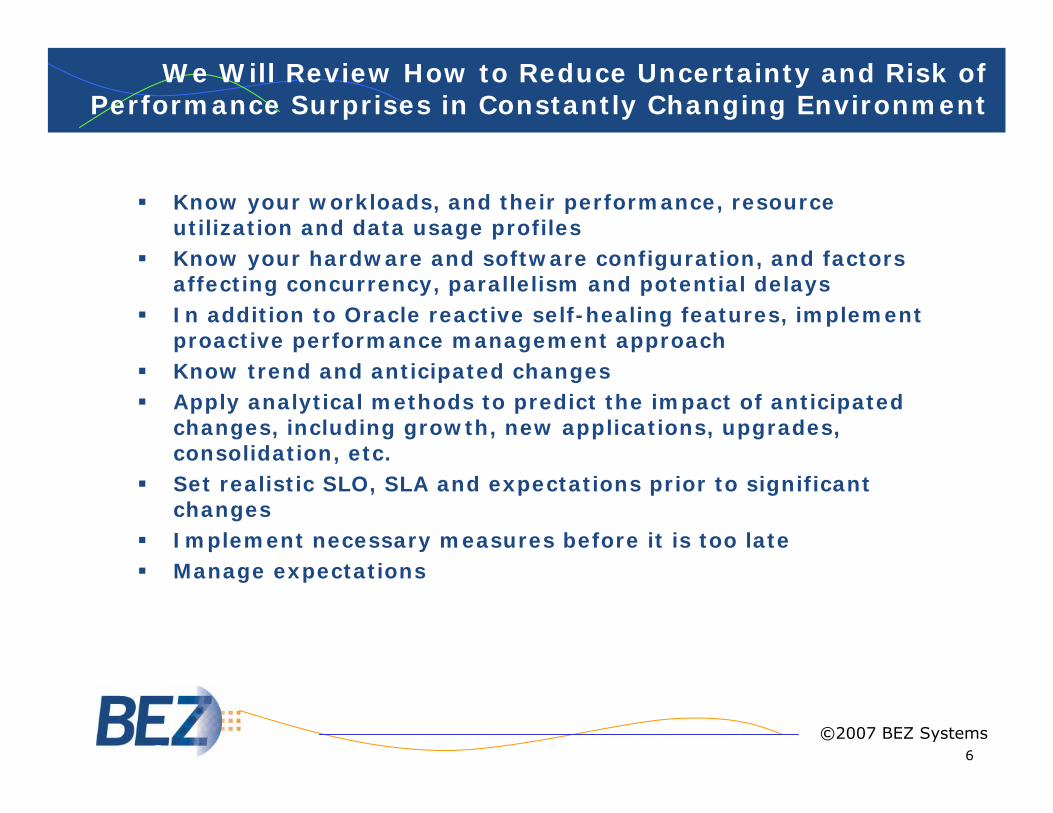
We Will Review How to Reduce Uncertainty and Risk of Performance Surprises in Constantly Changing Environment
Know your workloads, and their performance, resource utilization and data usage profiles Know your hardware and software configuration, and factors affecting concurrency, parallelism and potential delaysIn addition to Oracle reactive self-healing features, implement proactive performance management approachKnow trend and anticipated changesApply analytical methods to predict the impact of anticipated changes, including growth, new applications, upgrades, consolidation, etc.Set realistic SLO, SLA and expectations prior to significant changesImplement necessary measures before it is too lateManage expectations
©2007 BEZ Systems
7
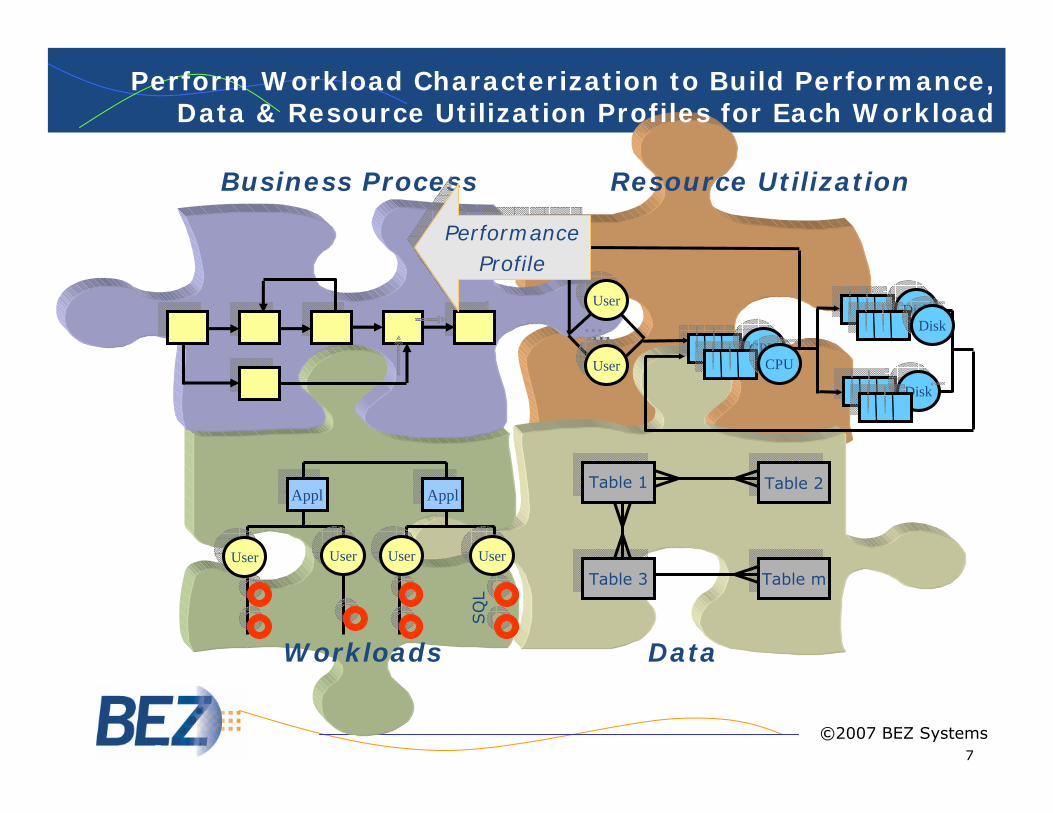
Perform Workload Characterization to Build Performance, Data & Resource Utilization Profiles for Each Workload
Table 1Table 1
Table 3Table 3 Table mTable m
Table 2Table 2ApplAppl ApplApplSQ
L
UserUser UserUser UserUser UserUser
…… CPUCPU
DiskDisk
DiskDisk
CPUCPU
DiskDisk
UserUser
UserUser
Business Process
Workloads
Resource Utilization
Data
PerformanceProfile
PerformanceProfile
©2007 BEZ Systems
8
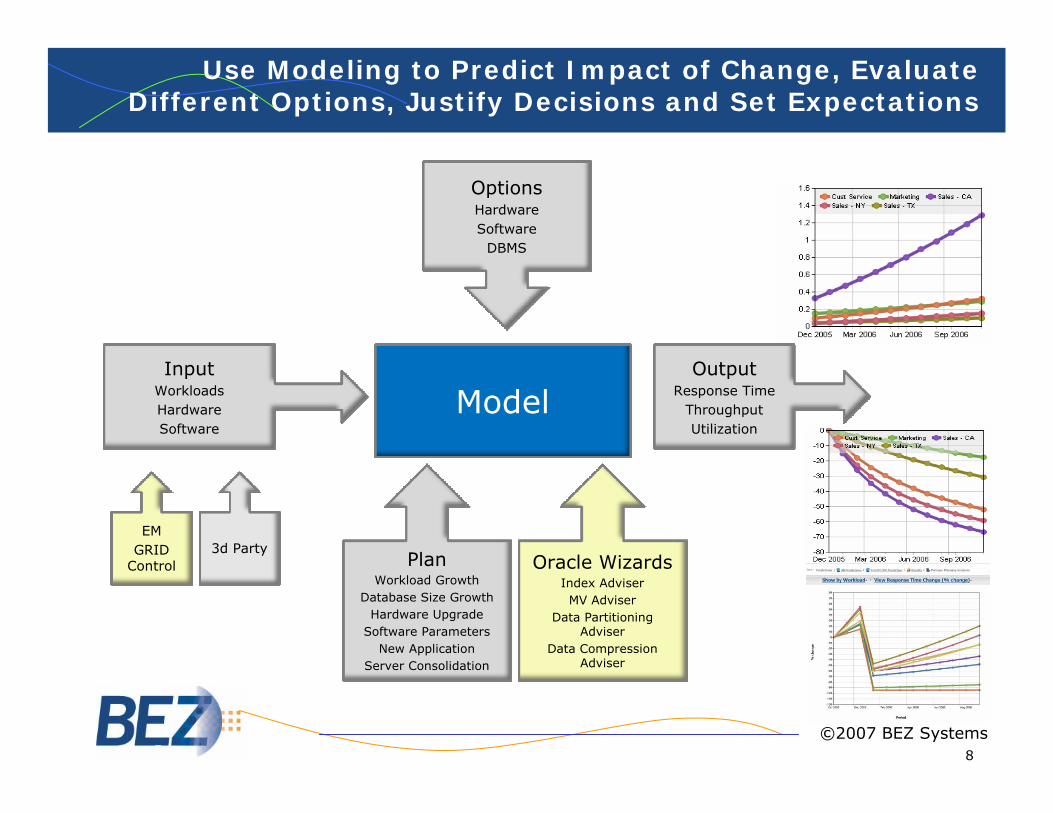
InputWorkloadsHardwareSoftware
OptionsHardwareSoftware
DBMS
PlanWorkload Growth
Database Size GrowthHardware Upgrade
Software ParametersNew Application
Server Consolidation
OutputResponse Time
ThroughputUtilization
Oracle WizardsIndex AdviserMV Adviser
Data Partitioning Adviser
Data Compression Adviser
Model
EMGRID
Control3d Party
Use Modeling to Predict Impact of Change, Evaluate Different Options, Justify Decisions and Set Expectations
©2007 BEZ Systems
9
Several Vendors Offer Analytical Queueing Network Models
Queueing Network Model represents RAC as a network of interconnected servers and queues where each device of the system is a server and a queueSoftware limitations affecting concurrency limitations, latchingdelays, and parallelism are represented as queues as wellInput of the model includes result of the workload characterization, hardware configuration, and software parametersPlan describes expected growth, proposed changes, including new application implementation, hardware upgrade, database design changes, proposed change of the workload priority, etc.Interface with DBMS wizard allows us to process critical SQL and to obtain the wizards’ DBMS, application, memory reallocation and other recommendations, which is also used as input to modelSeveral vendors, including BEZ, BMC, Metron, Hyperformix, Team Quest and others offer their performance prediction tools
©2007 BEZ Systems
10
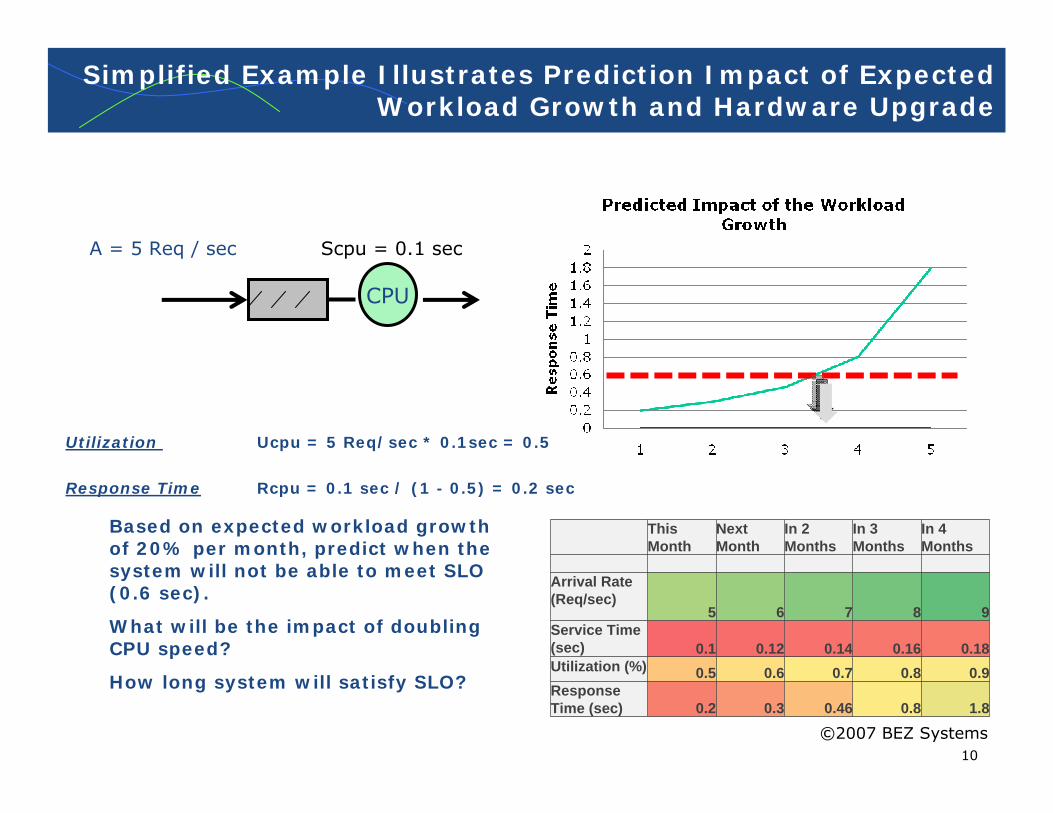
Simplified Example Illustrates Prediction Impact of Expected Workload Growth and Hardware Upgrade
This Month
Next Month
In 2 Months
In 3 Months
In 4 Months
Arrival Rate (Req/sec)
5 6 7 8 9Service Time (sec) 0.1 0.12 0.14 0.16 0.18Utilization (%) 0.5 0.6 0.7 0.8 0.9Response Time (sec) 0.2 0.3 0.46 0.8 1.8
A = 5 Req / sec Scpu = 0.1 sec
Utilization Ucpu = 5 Req/sec * 0.1sec = 0.5
Response Time Rcpu = 0.1 sec / (1 - 0.5) = 0.2 sec
CPU
Based on expected workload growth of 20% per month, predict when the system will not be able to meet SLO (0.6 sec).
What will be the impact of doubling CPU speed?
How long system will satisfy SLO?
©2007 BEZ Systems
11
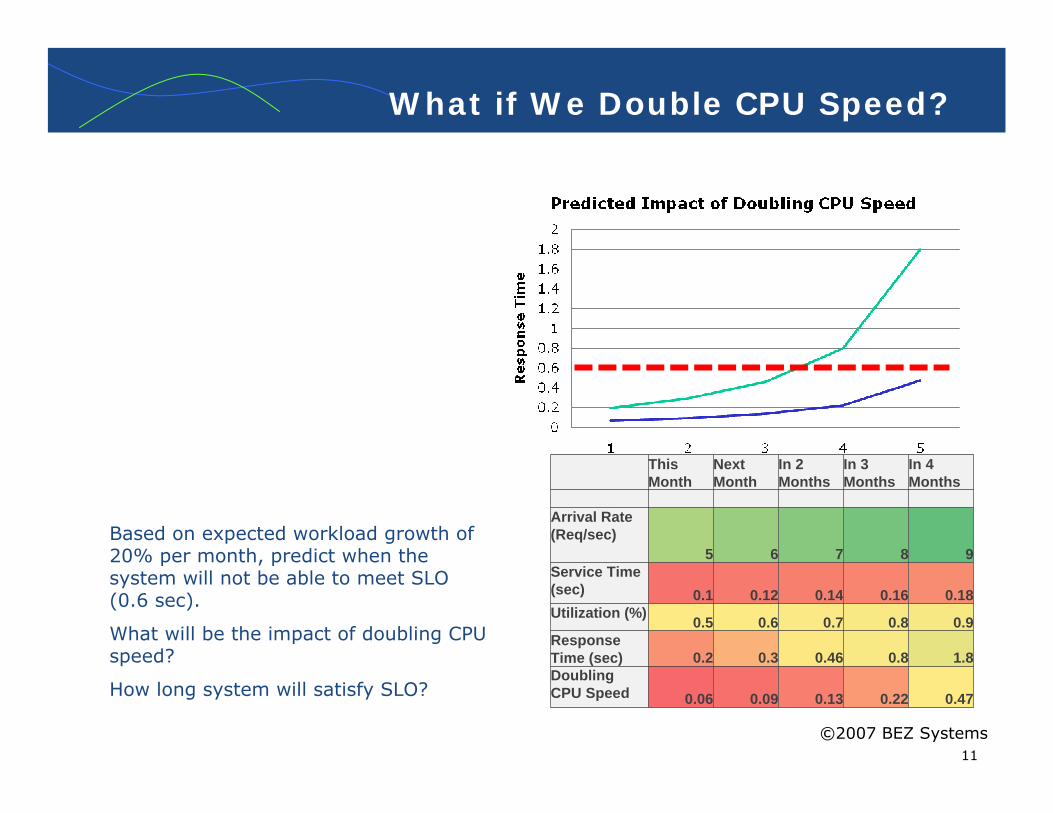
What if We Double CPU Speed?
This Month
Next Month
In 2 Months
In 3 Months
In 4 Months
Arrival Rate (Req/sec)
5 6 7 8 9Service Time (sec) 0.1 0.12 0.14 0.16 0.18Utilization (%) 0.5 0.6 0.7 0.8 0.9Response Time (sec) 0.2 0.3 0.46 0.8 1.8Doubling CPU Speed 0.06 0.09 0.13 0.22 0.47
Based on expected workload growth of 20% per month, predict when the system will not be able to meet SLO (0.6 sec).
What will be the impact of doubling CPU speed?
How long system will satisfy SLO?
©2007 BEZ Systems
12
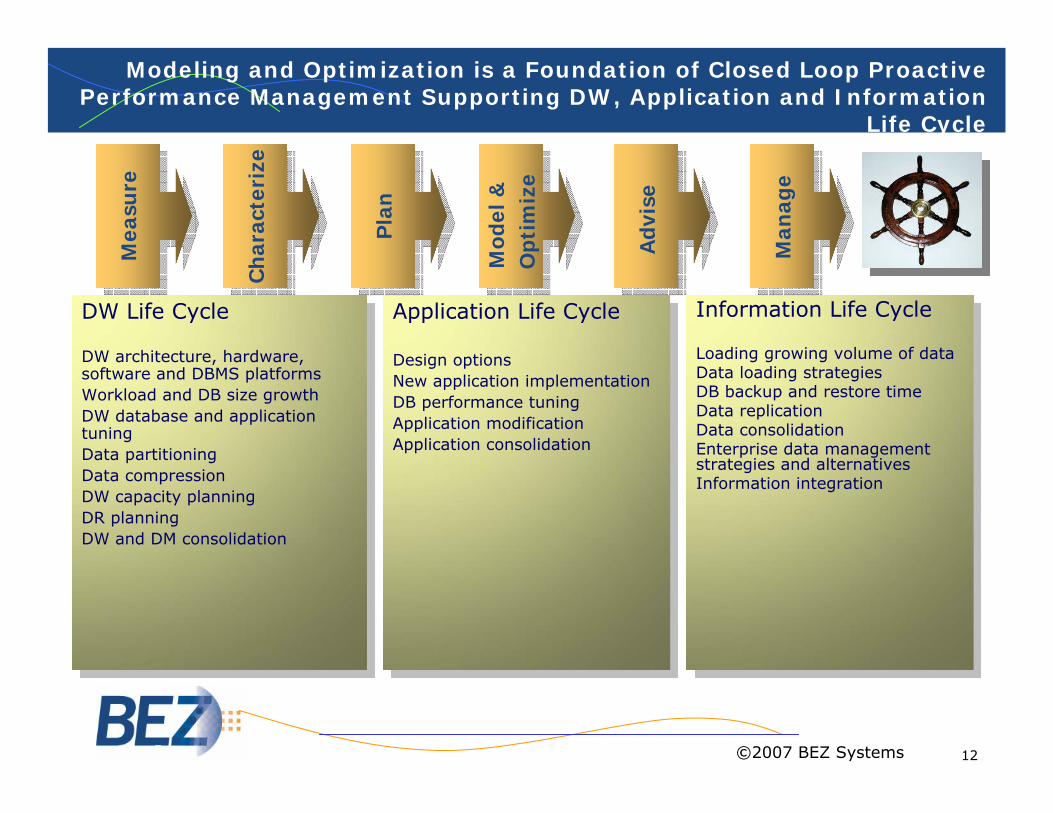
Modeling and Optimization is a Foundation of Closed Loop Proactive Performance Management Supporting DW, Application and Information
Life Cycle
Application Life Cycle
Design optionsNew application implementationDB performance tuning Application modificationApplication consolidation
Information Life Cycle
Loading growing volume of dataData loading strategies DB backup and restore timeData replicationData consolidation Enterprise data management strategies and alternatives Information integration
Mea
sure
Ch
arac
teri
ze
Pla
n
Adv
ise
Man
age
Mod
el &
O
ptim
ize
DW Life Cycle
DW architecture, hardware, software and DBMS platformsWorkload and DB size growthDW database and application tuningData partitioningData compressionDW capacity planningDR planningDW and DM consolidation
©2007 BEZ Systems
13
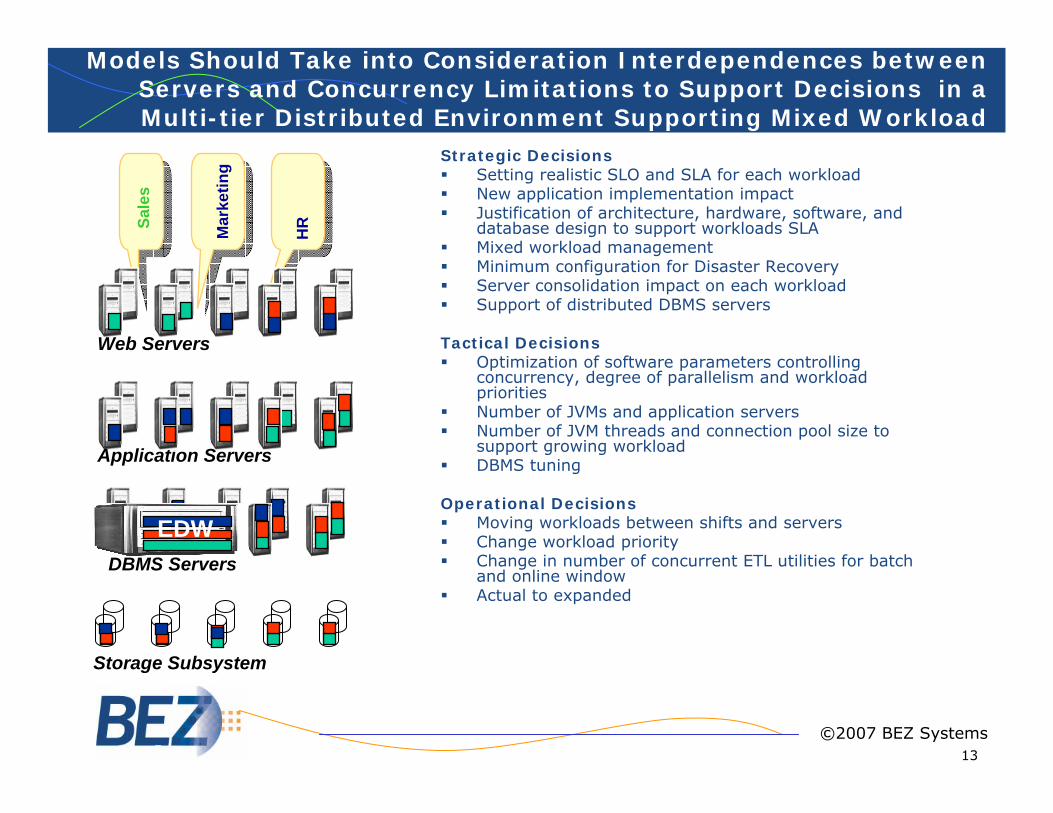
Models Should Take into Consideration Interdependences between Servers and Concurrency Limitations to Support Decisions in a Multi-tier Distributed Environment Supporting Mixed Workload
Strategic DecisionsSetting realistic SLO and SLA for each workloadNew application implementation impactJustification of architecture, hardware, software, and database design to support workloads SLA Mixed workload managementMinimum configuration for Disaster Recovery Server consolidation impact on each workloadSupport of distributed DBMS servers
Tactical DecisionsOptimization of software parameters controlling concurrency, degree of parallelism and workload priorities Number of JVMs and application servers Number of JVM threads and connection pool size to support growing workloadDBMS tuning
Operational DecisionsMoving workloads between shifts and serversChange workload priorityChange in number of concurrent ETL utilities for batch and online window Actual to expanded
DBMS Servers
Web Servers
Application Servers
Sale
s
Mar
ketin
g
Storage Subsystem
EDW
HR
©2007 BEZ Systems
14
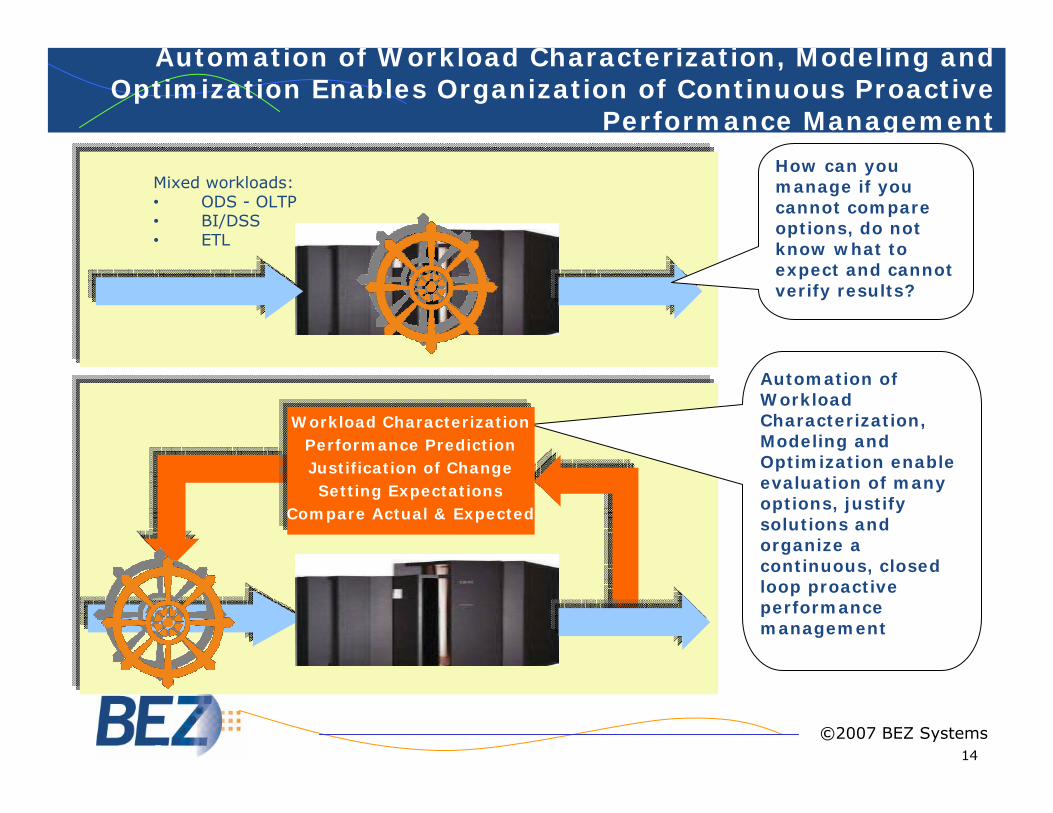
Automation of Workload Characterization, Modeling and Optimization Enables Organization of Continuous Proactive
Performance Management
Automation of Workload Characterization, Modeling and Optimization enable evaluation of many options, justify solutions and organize a continuous, closed loop proactive performance management
Mixed workloads:• ODS - OLTP• BI/DSS • ETL
How can you manage if you cannot compare options, do not know what to expect and cannot verify results?
Workload CharacterizationPerformance PredictionJustification of ChangeSetting Expectations
Compare Actual & Expected
©2007 BEZ Systems

15
1) Modeling Results Show
How Contention for Shared
Storage Affects RAC Scalability
and Allow Setting Realistic SLO and
SLA
16
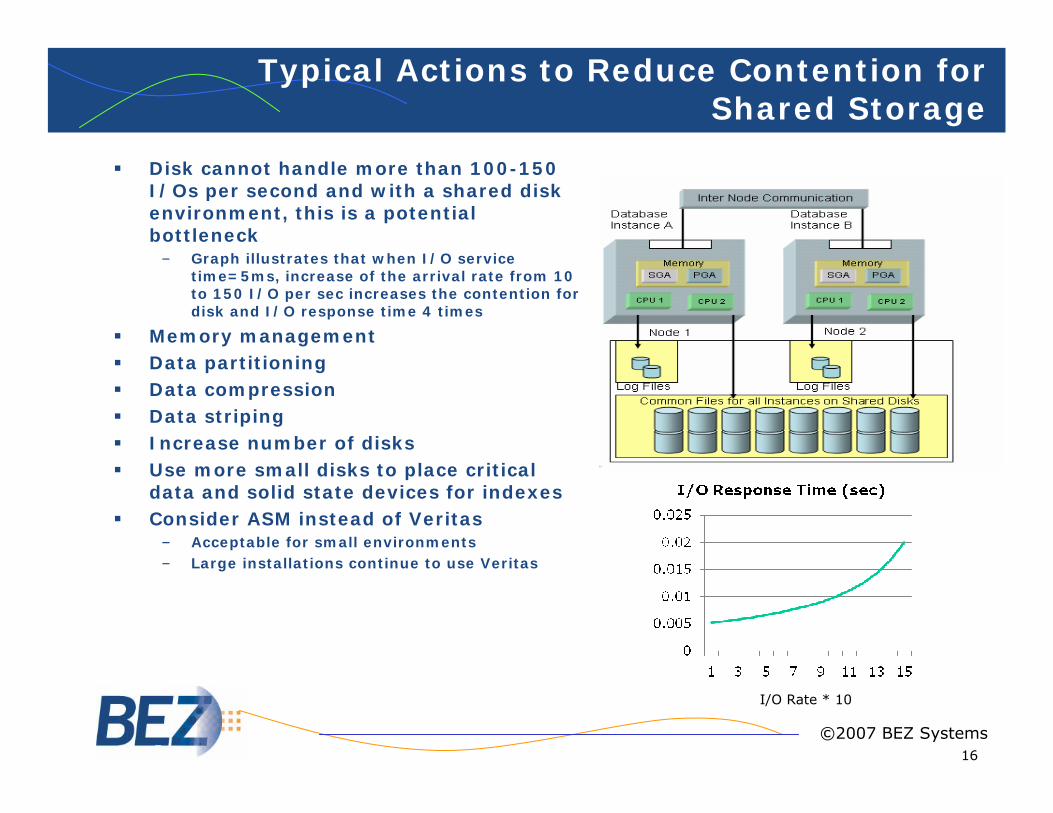
Typical Actions to Reduce Contention for Shared Storage
Disk cannot handle more than 100-150 I/Os per second and with a shared disk environment, this is a potential bottleneck
– Graph illustrates that when I/O service time=5ms, increase of the arrival rate from 10 to 150 I/O per sec increases the contention for disk and I/O response time 4 times
Memory managementData partitioningData compressionData striping Increase number of disksUse more small disks to place critical data and solid state devices for indexesConsider ASM instead of Veritas
– Acceptable for small environments– Large installations continue to use Veritas
I/O Rate * 10
©2007 BEZ Systems
17
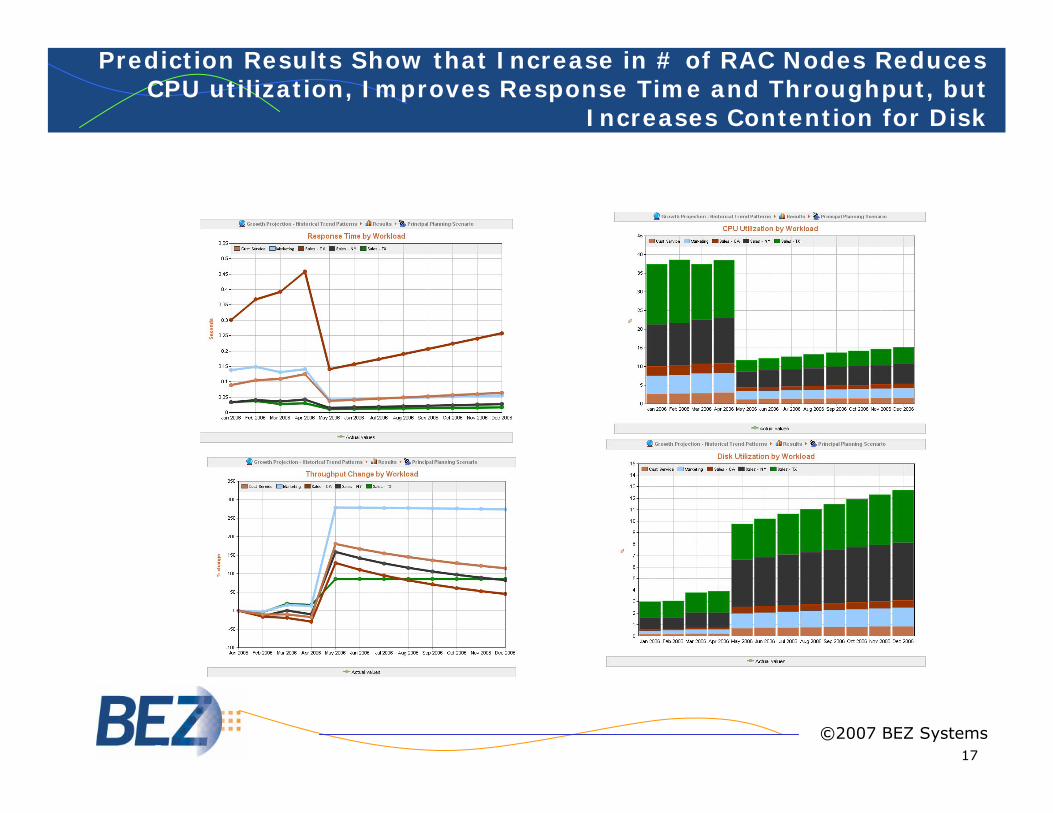
Prediction Results Show that Increase in # of RAC Nodes Reduces CPU utilization, Improves Response Time and Throughput, but
Increases Contention for Disk
©2007 BEZ Systems
18
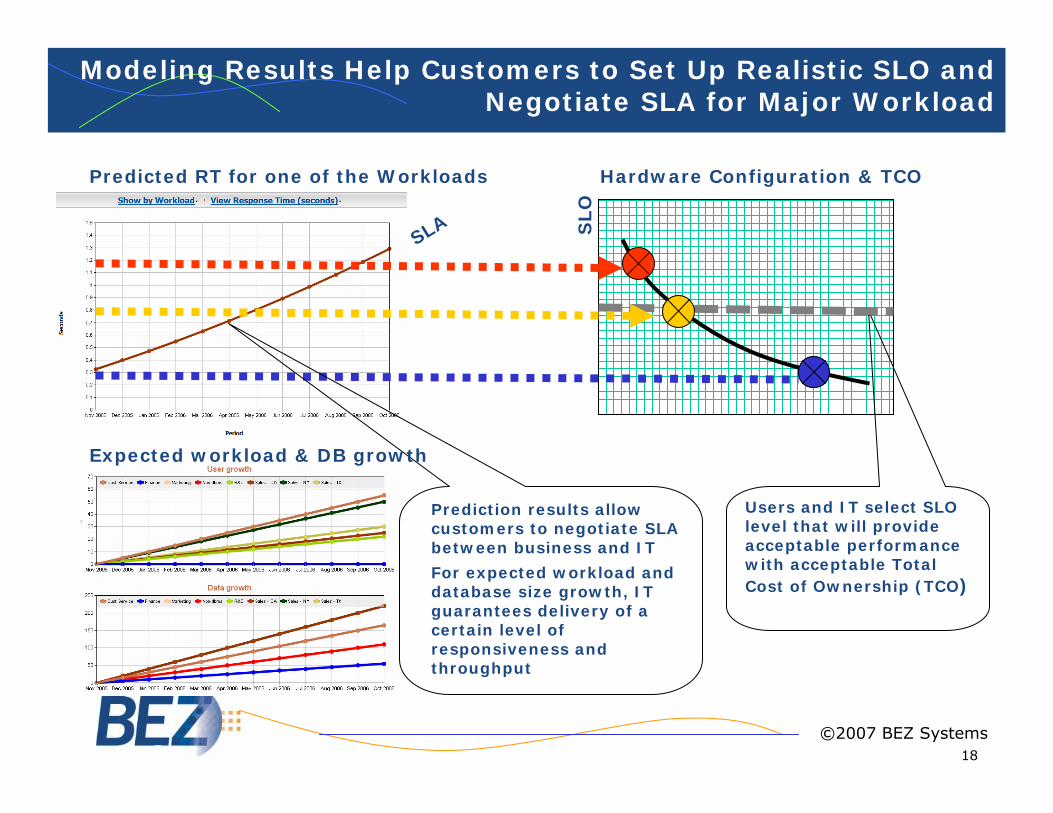
Modeling Results Help Customers to Set Up Realistic SLO and Negotiate SLA for Major Workload
Hardware Configuration & TCO
SLO
Users and IT select SLO level that will provide acceptable performance with acceptable Total Cost of Ownership (TCO)
Prediction results allow customers to negotiate SLA between business and IT
For expected workload and database size growth, IT guarantees delivery of a certain level of responsiveness and throughput
Expected workload & DB growth
Predicted RT for one of the Workloads
©2007 BEZ Systems
SLA
19
2) Modeling Results Show
Impact of Parallel Processing and
Allow Comparison of the
Performance of Oracle RAC,
Teradata and DB2 UDB ESE during Selection of the
Platform for EDW
20
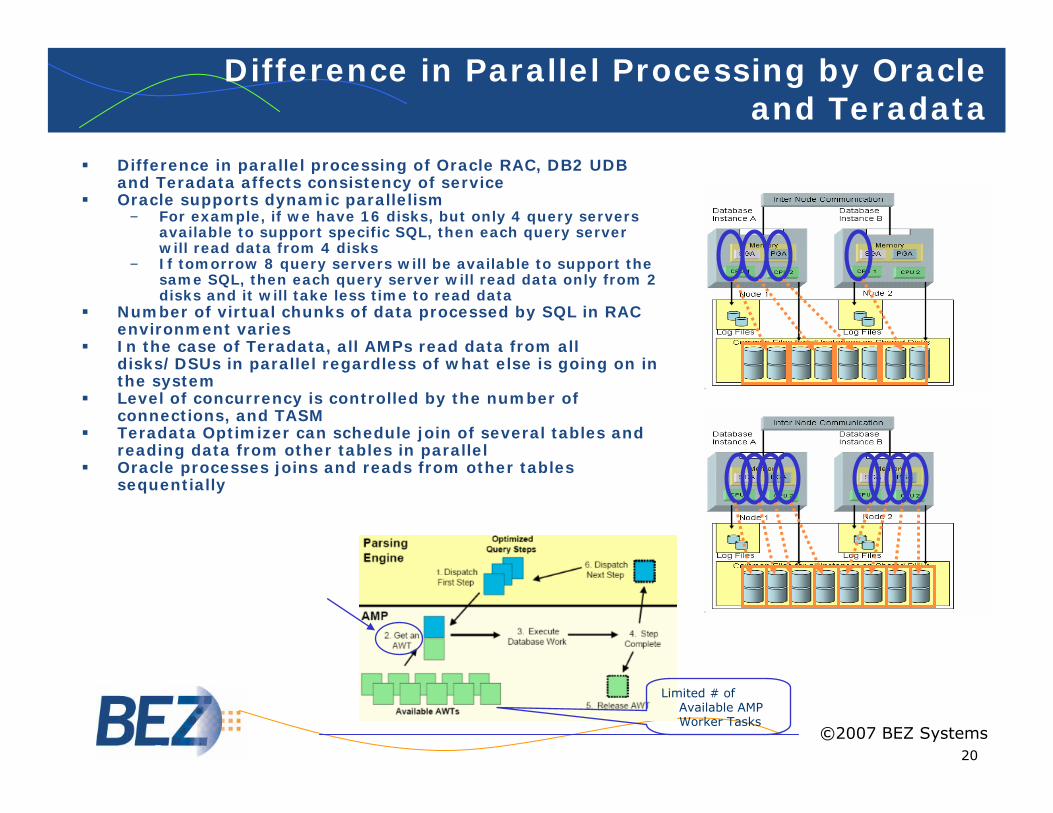
Difference in Parallel Processing by Oracle and Teradata
Difference in parallel processing of Oracle RAC, DB2 UDB and Teradata affects consistency of service Oracle supports dynamic parallelism
– For example, if we have 16 disks, but only 4 query servers available to support specific SQL, then each query server will read data from 4 disks
– If tomorrow 8 query servers will be available to support the same SQL, then each query server will read data only from 2 disks and it will take less time to read data
Number of virtual chunks of data processed by SQL in RAC environment varies In the case of Teradata, all AMPs read data from all disks/DSUs in parallel regardless of what else is going on in the systemLevel of concurrency is controlled by the number of connections, and TASMTeradata Optimizer can schedule join of several tables and reading data from other tables in parallelOracle processes joins and reads from other tables sequentially
Limited # of Available AMP Worker Tasks
©2007 BEZ Systems
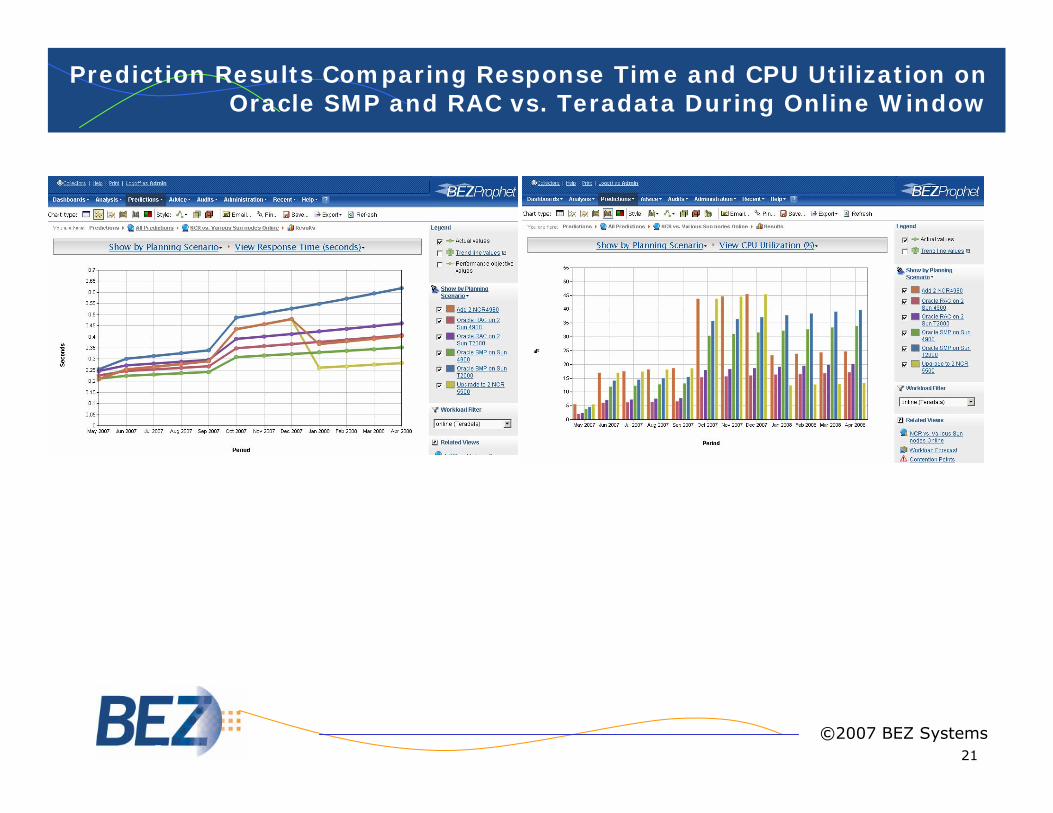
21
Prediction Results Comparing Response Time and CPU Utilization on Oracle SMP and RAC vs. Teradata During Online Window
©2007 BEZ Systems
22
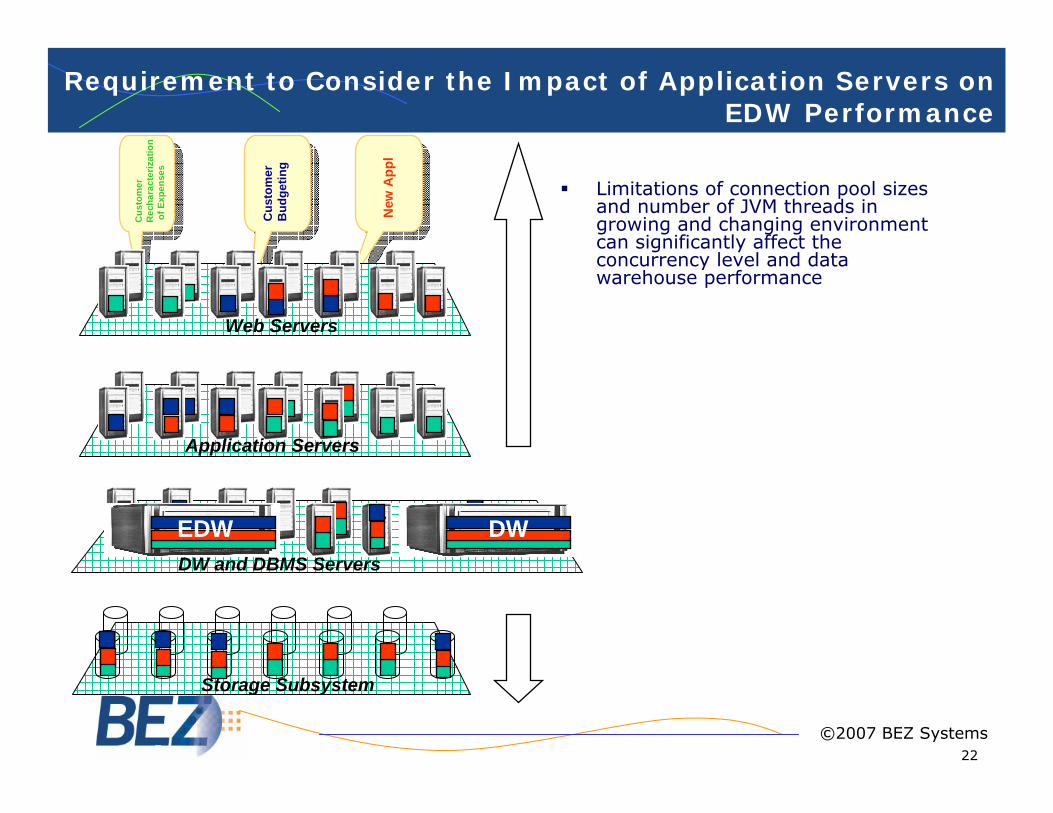
Requirement to Consider the Impact of Application Servers on EDW Performance
DW and DBMS Servers
Web Servers
Application Servers
Cus
tom
erR
echa
ract
eriz
atio
nof
Exp
ense
s
Cus
tom
er
Bud
getin
g
New
App
l
Storage Subsystem
EDW
Limitations of connection pool sizes and number of JVM threads in growing and changing environment can significantly affect the concurrency level and data warehouse performance
DW
©2007 BEZ Systems
23
Example shows the evaluation of contention for the interconnect on Egenera
vs. IBM BCU1 Power5 and BCU Power6 during selection of a platform for Oracle RAC
EDW
3) Modeling Results Show How Expected Changes
Will Affect Contention for the
Interconnect for Different
Architectures
24
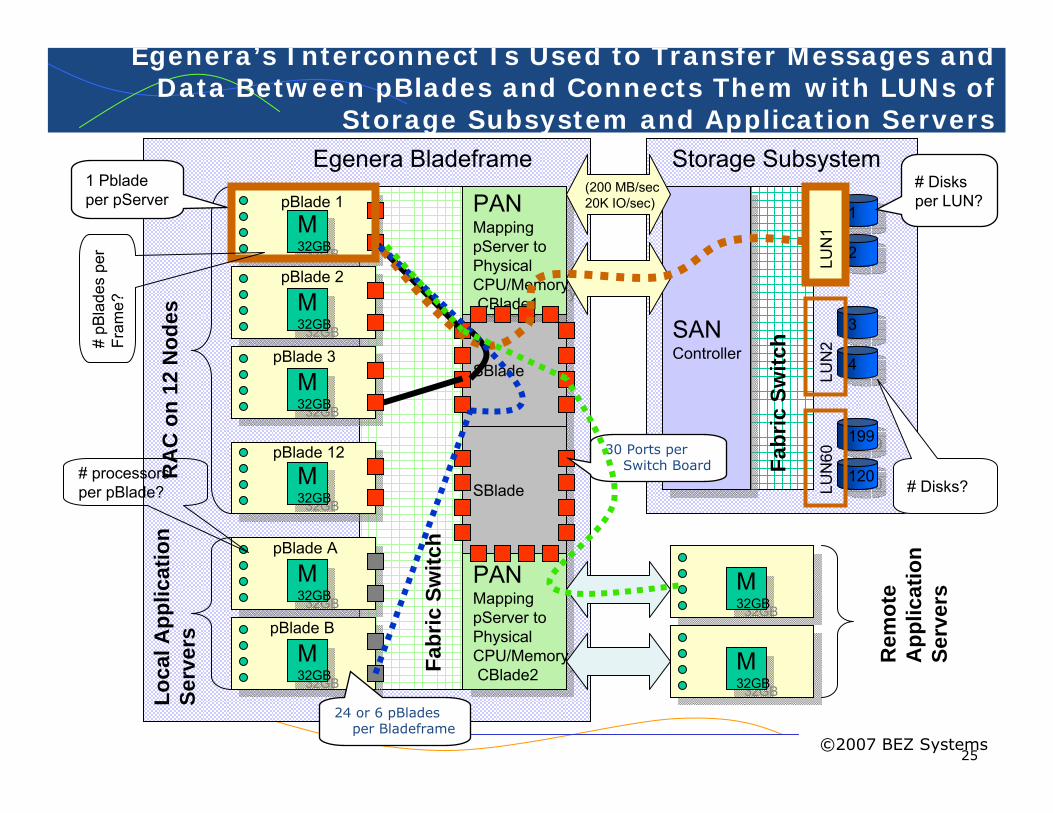
Predicting Interconnect Scalability on Different Platforms
Increasing contention for the Interconnect caused by workload and DB size growth and increase in number of nodes can affect different workloads differently on different platformsExample below shows prediction results evaluating the difference between Egeneraand IBM pSeries in supporting EDW RAC workload, taking into consideration the impact of the workload and volume of data growth on interconnect utilization and each workload’s performancePerformance prediction results compare Egenera and IBM pSeries Scaling Up and Scaling Out capabilities for EDW RAC workload
How will workload growth increase the contention for internode communication?How will volume of data growth affect the traffic through the interconnect, and how will it affect the performance of each workload?How will adding more nodes affect the message traffic and performance of each workload?Predict each workload’s interconnect response time, including service time, queueing time during transferring messages, and data and latency time
©2007 BEZ Systems
25
SBladeSBlade
SBladeSBlade
Egenera’s Interconnect Is Used to Transfer Messages and Data Between pBlades and Connects Them with LUNs of
Storage Subsystem and Application Servers
M32GB
M32GB
M32GB
M32GB
M32GB
M32GB
M32GB
M32GB
Fabr
ic S
witc
h
PANMapping pServer to Physical CPU/MemoryCBlade1
PANMapping pServer to Physical CPU/MemoryCBlade1
PANMapping pServer to Physical CPU/MemoryCBlade2
PANMapping pServer to Physical CPU/MemoryCBlade2
SANController
SANController
11
22
199199
120120
LUN
1LU
N60
RA
C o
n 12
Nod
es
M32GB
M32GB
M32GB
M32GB
Loca
l App
licat
ion
Serv
ers
pBlade 1
pBlade 2
pBlade 3
pBlade 12
33
44
LUN
2
Fabr
ic S
witc
h
Egenera Bladeframe(200 MB/sec20K IO/sec)
Storage Subsystem
M32GB
M32GB
M32GB
M32GB
Rem
ote
App
licat
ion
Serv
ers
pBlade A
pBlade B
1 Pbladeper pServer
# Disks per LUN?
# processors per pBlade?
# pB
lade
spe
r Fr
ame?
# Disks?
30 Ports per Switch Board
24 or 6 pBladesper Bladeframe
©2007 BEZ Systems
26
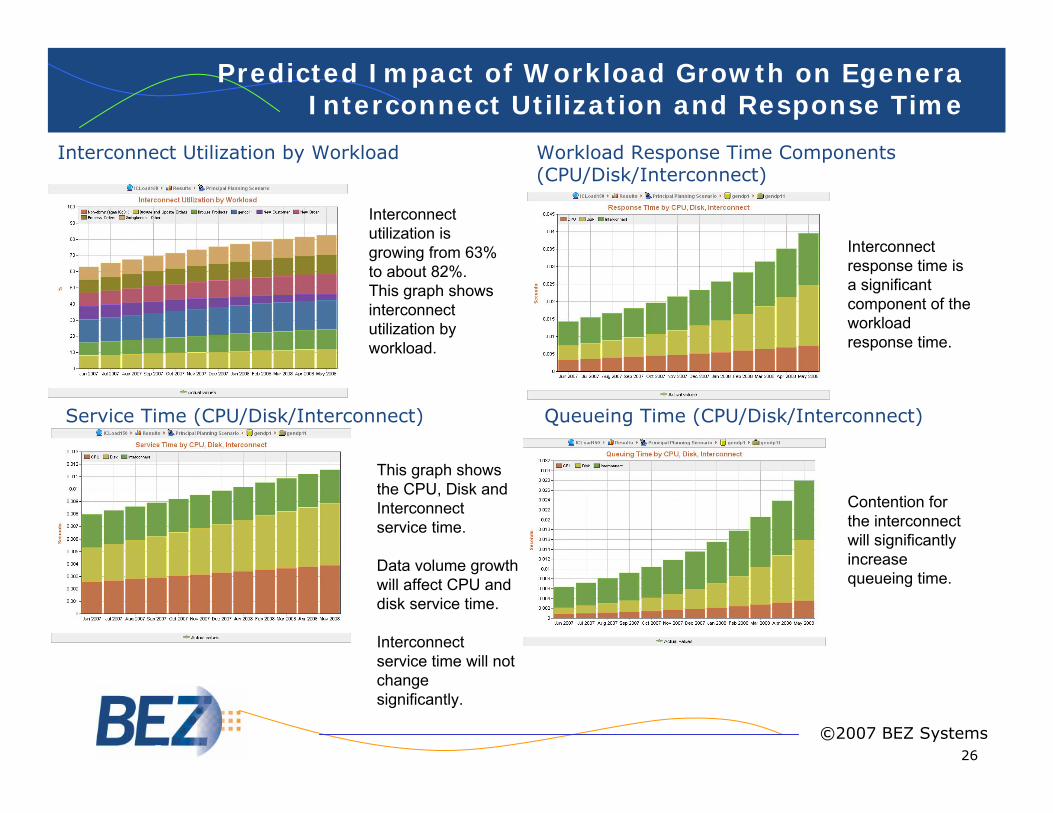
Predicted Impact of Workload Growth on EgeneraInterconnect Utilization and Response Time
Interconnect utilization is growing from 63% to about 82%. This graph shows interconnect utilization by workload.
This graph shows the CPU, Disk and Interconnect service time.
Data volume growth will affect CPU and disk service time.
Interconnect service time will not change significantly.
Interconnect response time is a significant component of the workload response time.
Contention for the interconnect will significantly increase queueing time.
Interconnect Utilization by Workload Workload Response Time Components (CPU/Disk/Interconnect)
Service Time (CPU/Disk/Interconnect) Queueing Time (CPU/Disk/Interconnect)
©2007 BEZ Systems
27
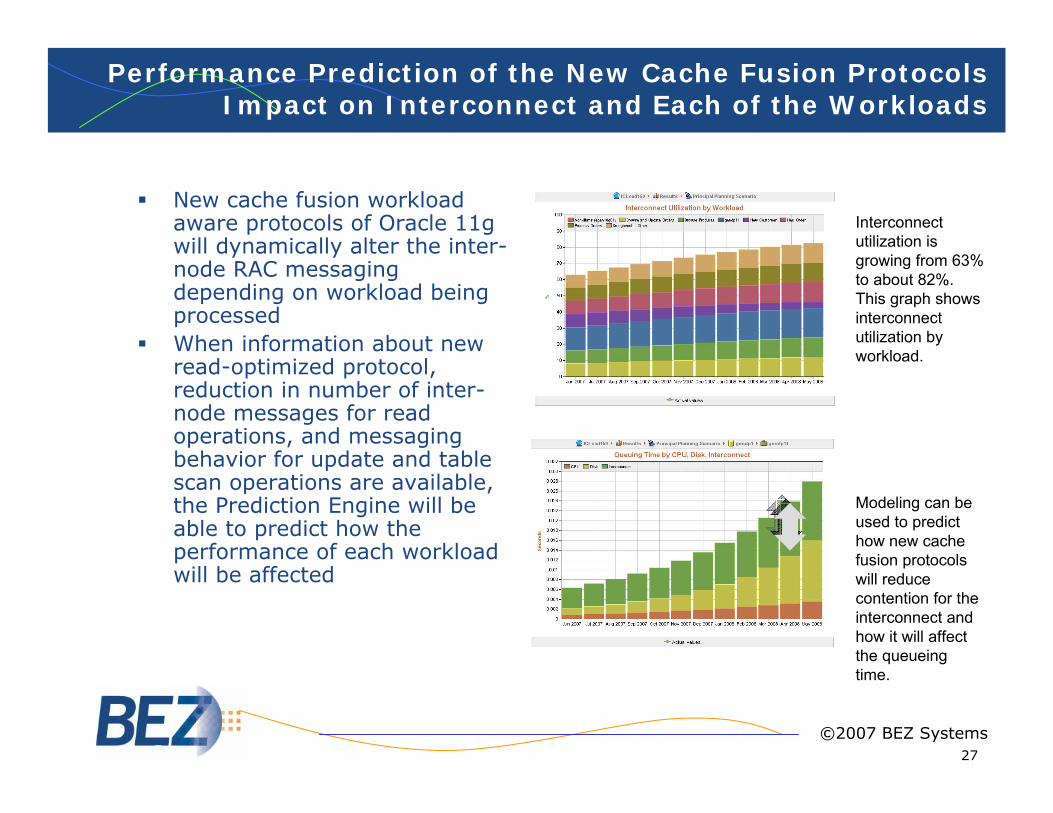
Performance Prediction of the New Cache Fusion Protocols Impact on Interconnect and Each of the Workloads
New cache fusion workload aware protocols of Oracle 11g will dynamically alter the inter-node RAC messaging depending on workload being processed When information about new read-optimized protocol, reduction in number of inter-node messages for read operations, and messaging behavior for update and table scan operations are available, the Prediction Engine will be able to predict how the performance of each workload will be affected
Interconnect utilization is growing from 63% to about 82%. This graph shows interconnect utilization by workload.
Modeling can be used to predict how new cache fusion protocols will reduce contention for the interconnect and how it will affect the queueingtime.
©2007 BEZ Systems
28
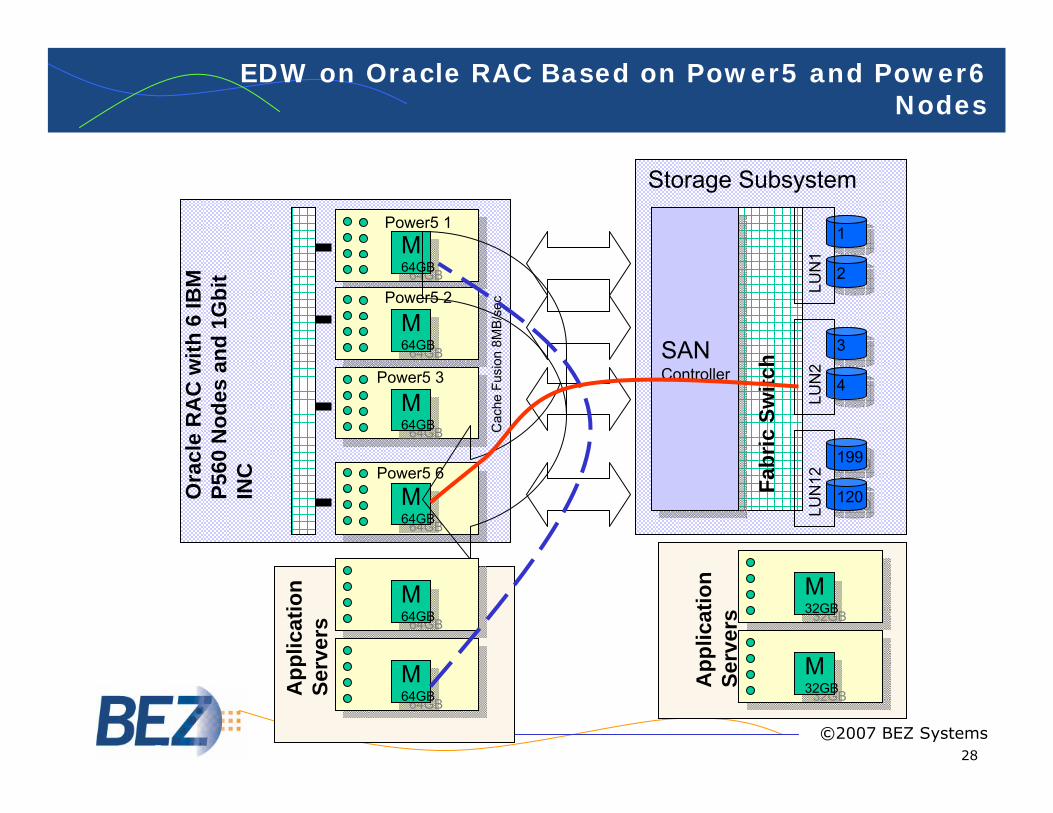
EDW on Oracle RAC Based on Power5 and Power6 Nodes
M64GB
M64GB
M64GB
M64GB
M64GB
M64GB
M64GB
M64GB
Cac
he F
usio
n 8M
B/se
c
Ora
cle
RA
C w
ith 6
IBM
P5
60 N
odes
and
1G
bit
INC
M64GB
M64GB
M64GB
M64GBA
pplic
atio
nSe
rver
s
Power5 1
Power5 2
Power5 3
Power5 6
Storage Subsystem
SANController
SANController
11
22
199199
120120
LUN
1LU
N12
33
44
LUN
2
Fabr
ic S
witc
h
M32GB
M32GB
M32GB
M32GBA
pplic
atio
nSe
rver
s©2007 BEZ Systems
29
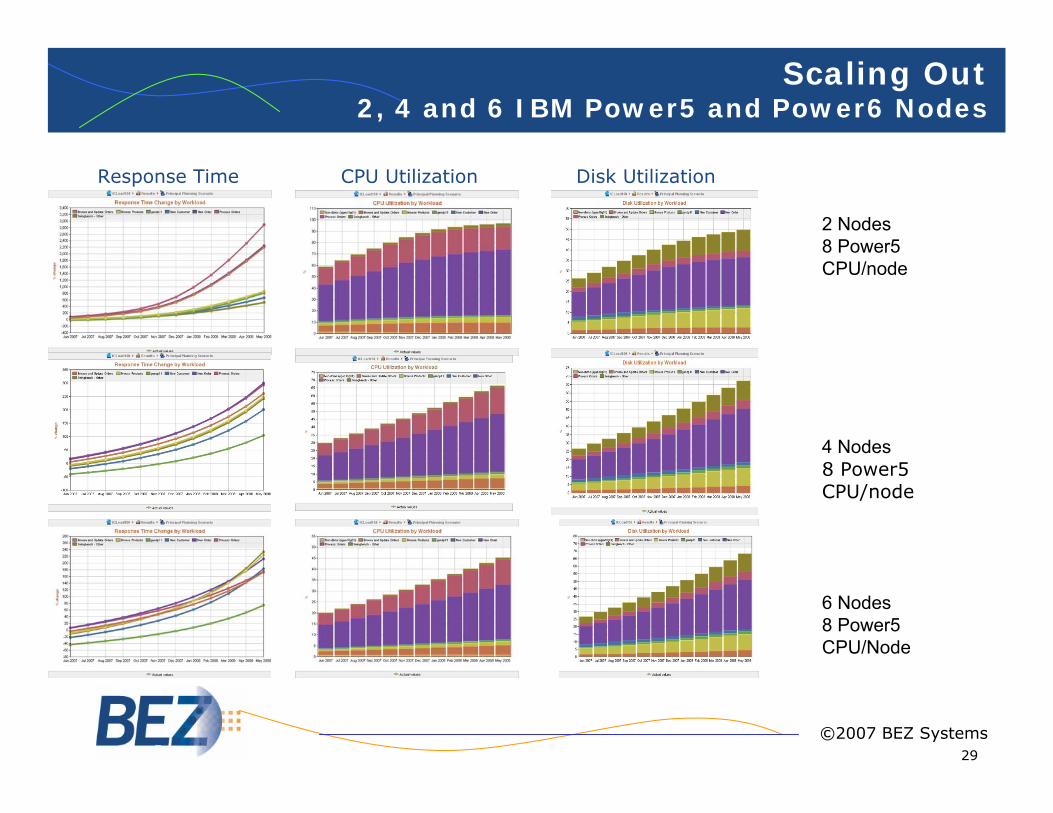
Scaling Out2, 4 and 6 IBM Power5 and Power6 Nodes
2 Nodes8 Power5CPU/node
4 Nodes8 Power5 CPU/node
6 Nodes8 Power5 CPU/Node
Response Time CPU Utilization Disk Utilization
©2007 BEZ Systems
30
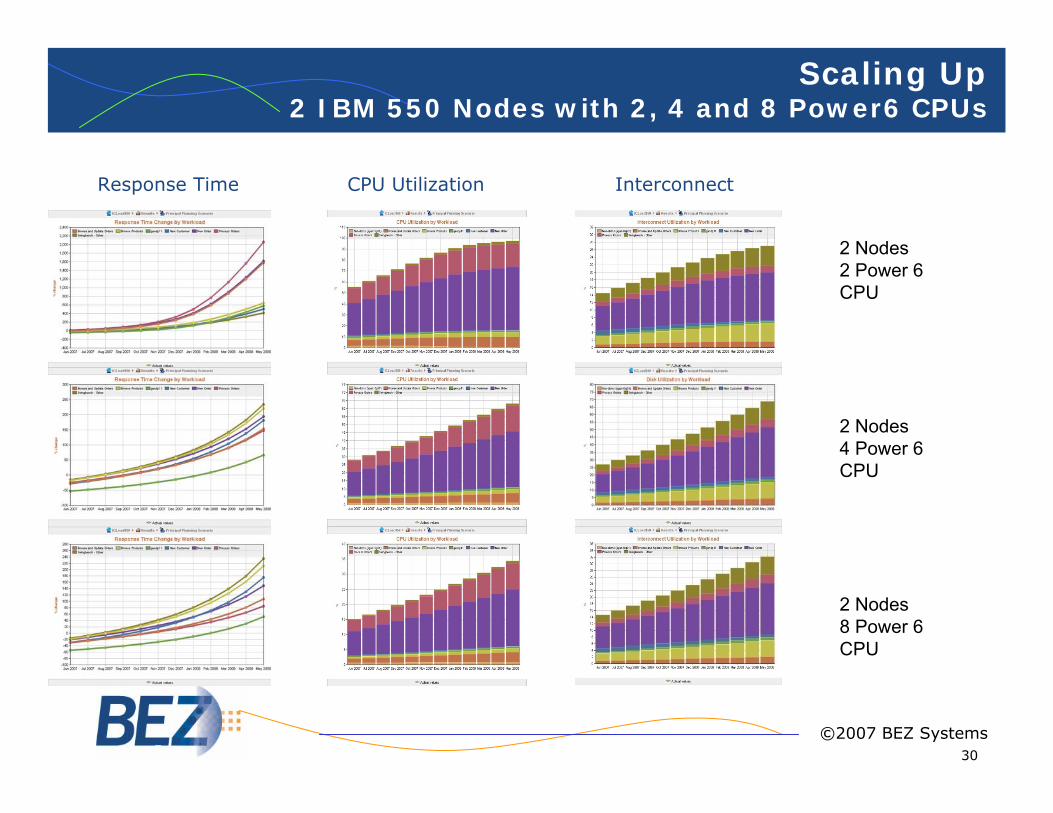
Scaling Up 2 IBM 550 Nodes with 2, 4 and 8 Power6 CPUs
2 Nodes2 Power 6 CPU
2 Nodes4 Power 6 CPU
2 Nodes 8 Power 6 CPU
Response Time CPU Utilization Interconnect
©2007 BEZ Systems
31
4) Modeling Results Show
Impact of Memory Management Decisions in
Mixed Workload Environment
32
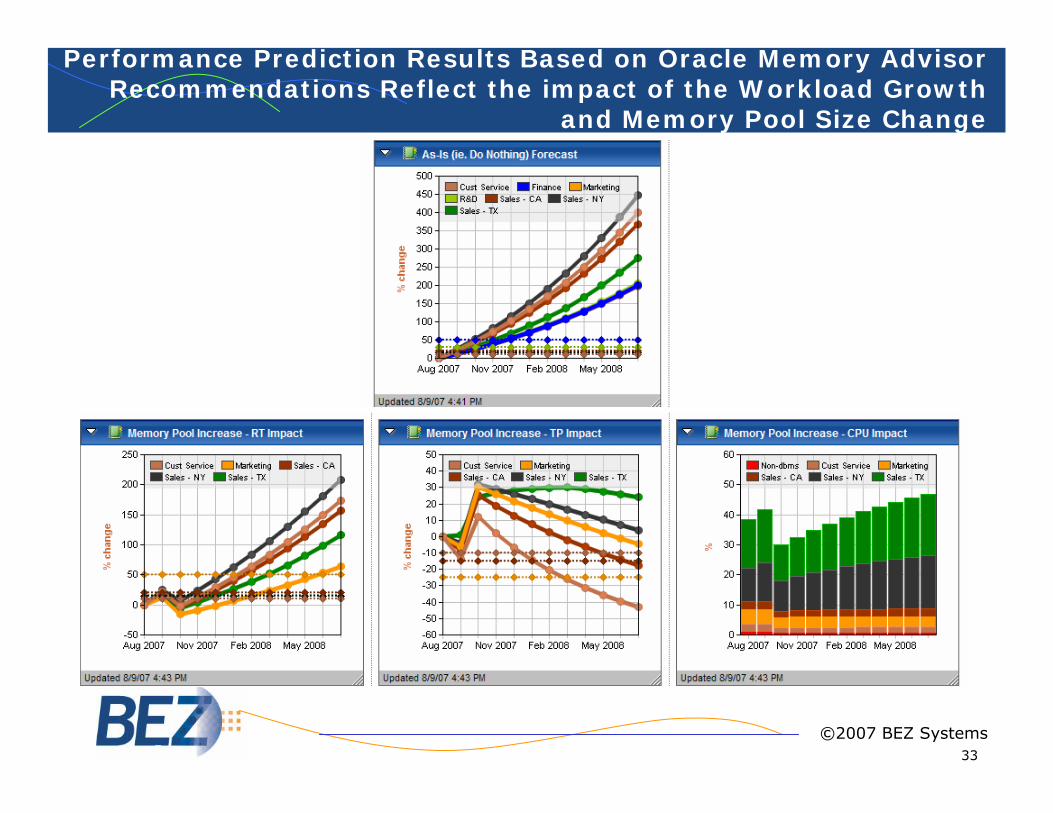
Impact of Memory Management Decisions
PGA size should be sufficient to support complex queries OLTP workload needs large SGA, but BI/DSS workload SGA should have just enough size to handle indexes, because complex requests bypass SGA and over-allocation of memory for SGA can negatively impact other workloadsPerformance prediction based on Oracle Memory Advisor recommendations can be used to evaluate different alternatives
©2007 BEZ Systems
33
Performance Prediction Results Based on Oracle Memory Advisor Recommendations Reflect the impact of the Workload Growth
and Memory Pool Size Change
©2007 BEZ Systems
34
5) Modeling Results Show the
Impact of the Workload
Management, New Application
Implementation and Resource
Manager Changes on Mixed Workload
Performance
35
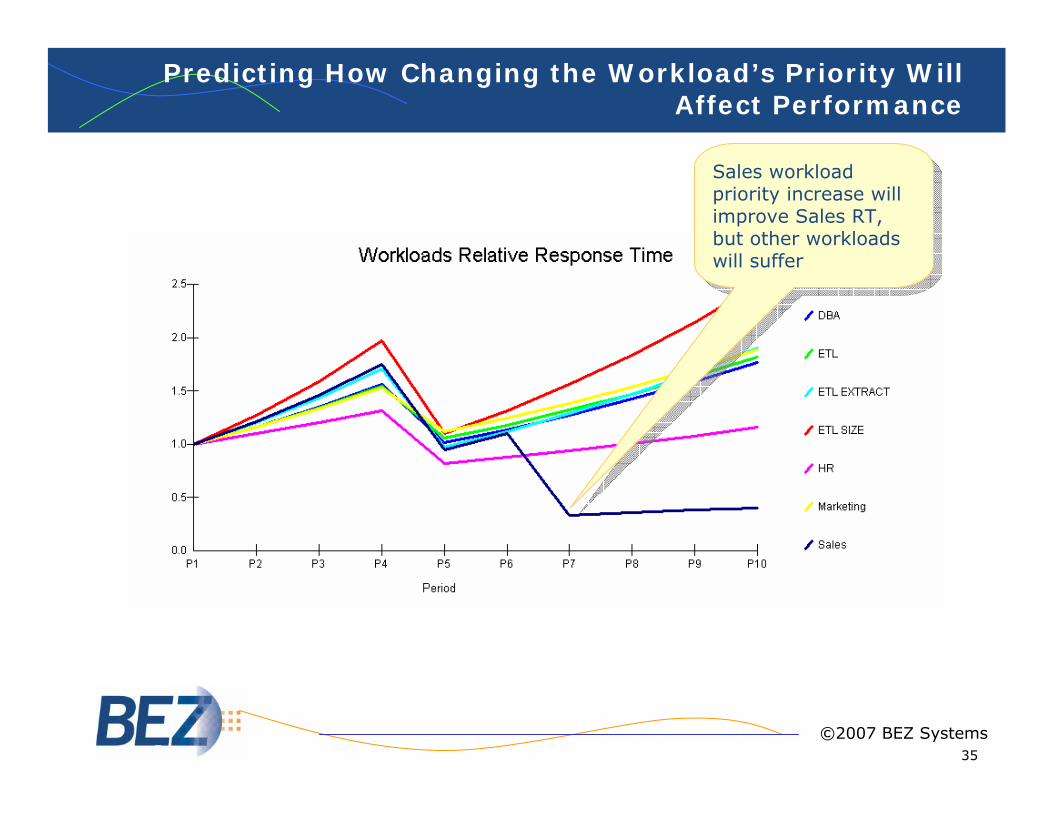
Predicting How Changing the Workload’s Priority Will Affect Performance
Sales workload priority increase will improve Sales RT, but other workloads will suffer
Sales workload priority increase will improve Sales RT, but other workloads will suffer
©2007 BEZ Systems
36
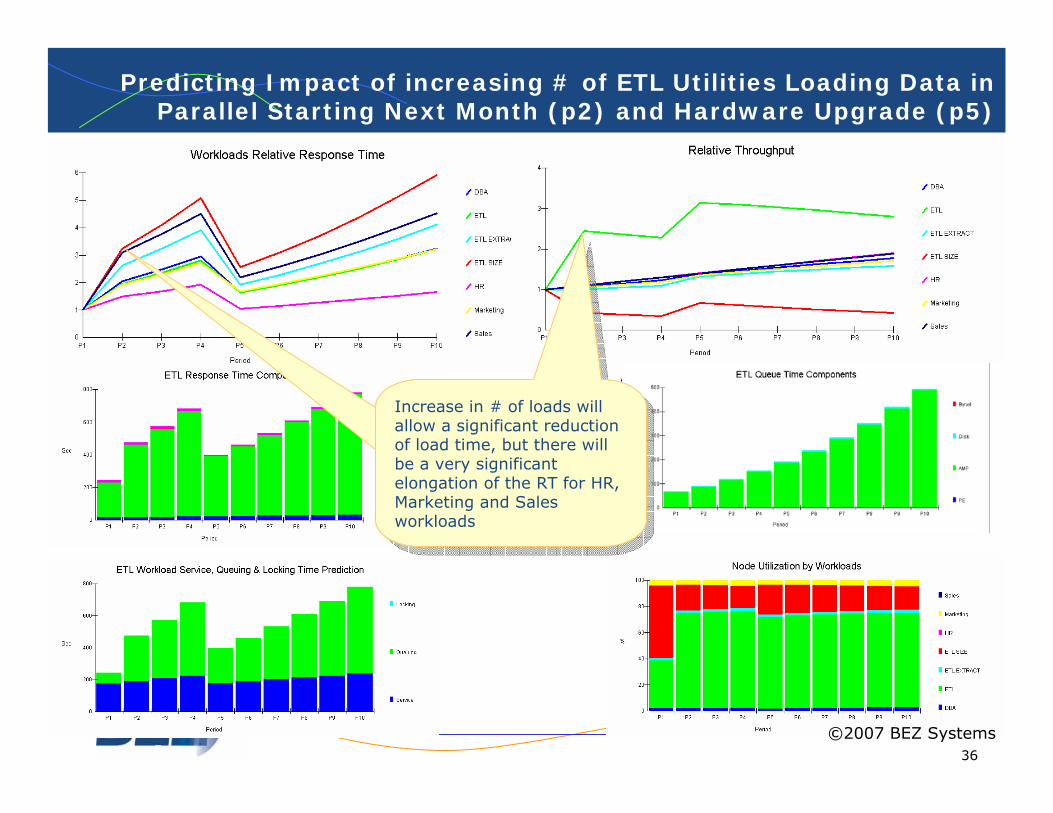
Predicting Impact of increasing # of ETL Utilities Loading Data in Parallel Starting Next Month (p2) and Hardware Upgrade (p5)
Increase in # of loads will allow a significant reduction of load time, but there will be a very significant elongation of the RT for HR, Marketing and Sales workloads
Increase in # of loads will allow a significant reduction of load time, but there will be a very significant elongation of the RT for HR, Marketing and Sales workloads
©2007 BEZ Systems
37
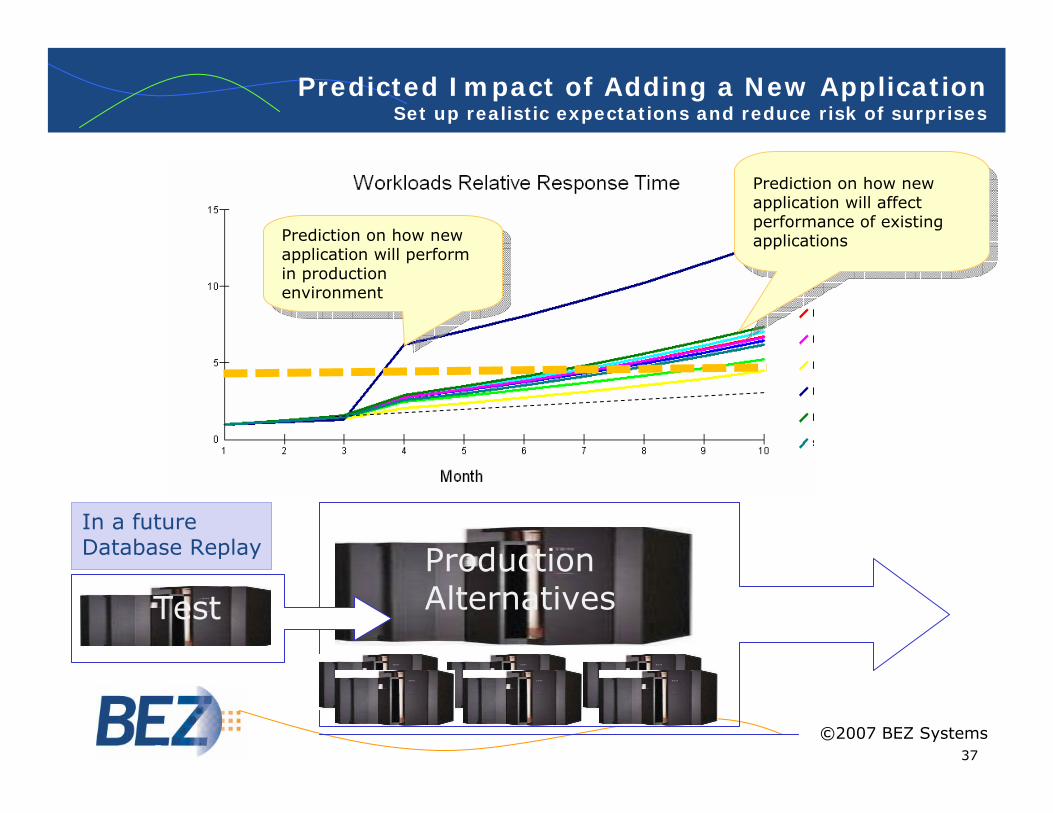
Predicted Impact of Adding a New Application Set up realistic expectations and reduce risk of surprises
Prediction on how new application will perform in production environment
Prediction on how new application will perform in production environment
Prediction on how new application will affect performance of existing applications
Prediction on how new application will affect performance of existing applications
TestProductionAlternatives
©2007 BEZ Systems
In a futureDatabase Replay
38
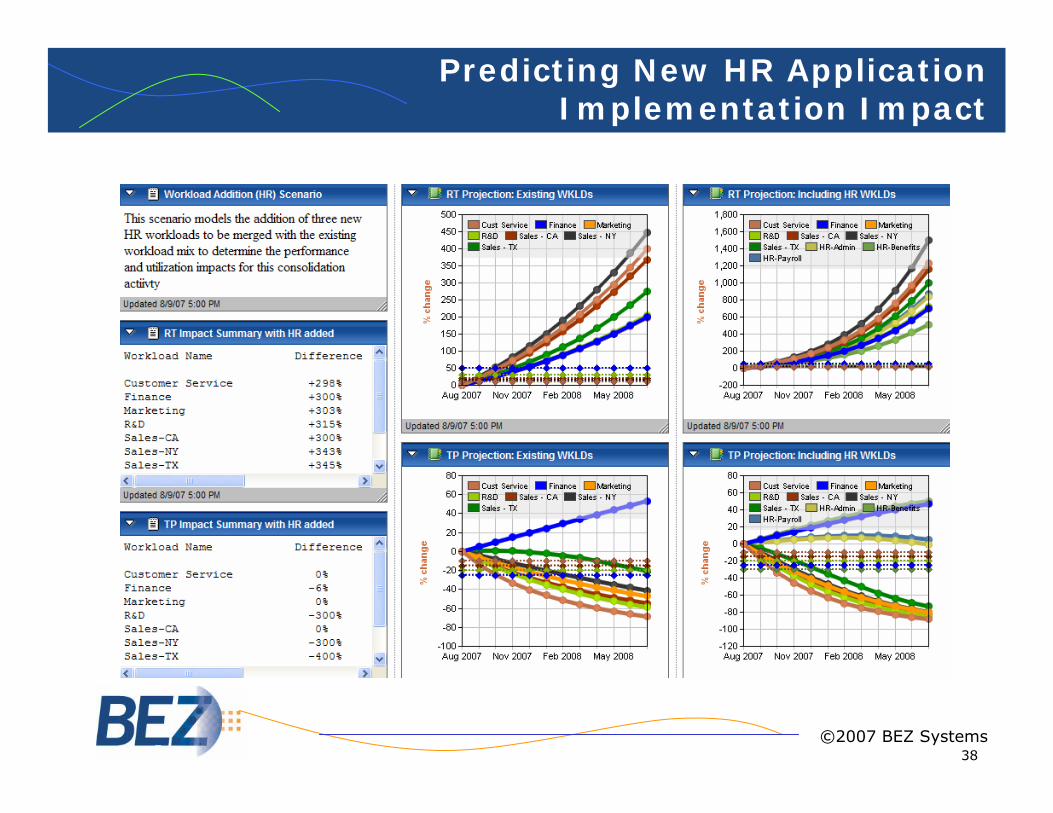
Predicting New HR Application Implementation Impact
©2007 BEZ Systems
39
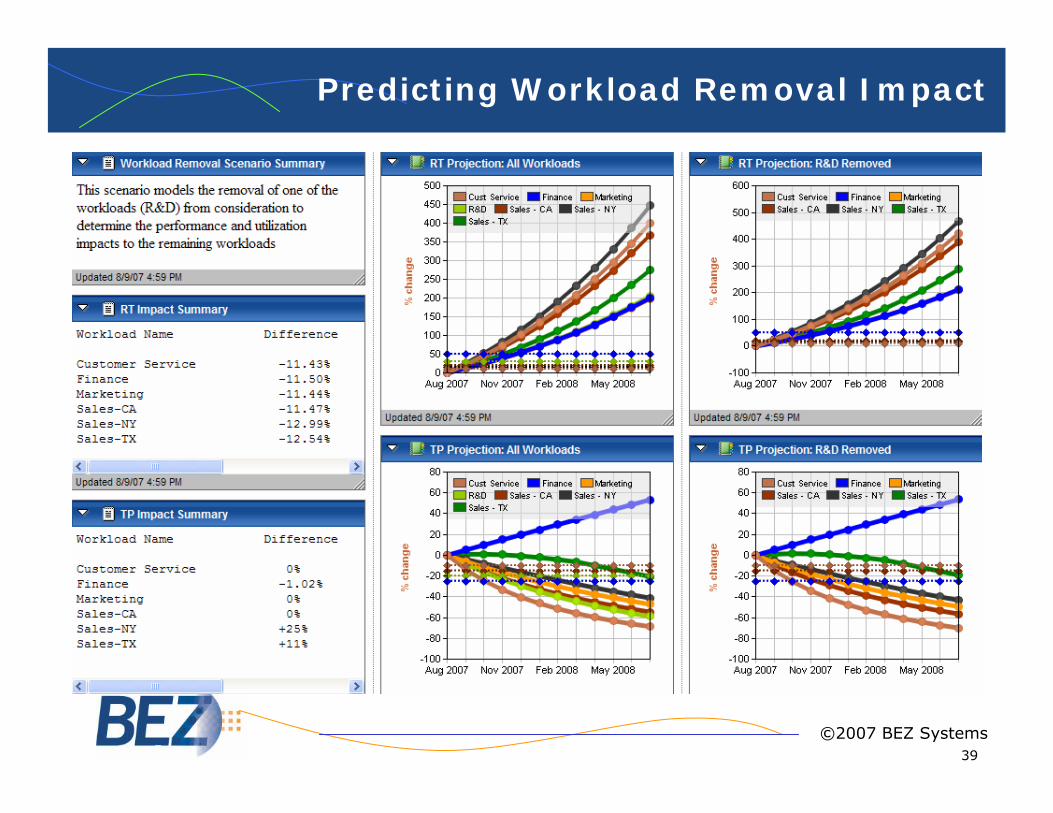
Predicting Workload Removal Impact
©2007 BEZ Systems
40
Example Showing How Modeling
Results Were Used to Justify EDW and
Server Consolidation by Financial
Organization
41
EDW
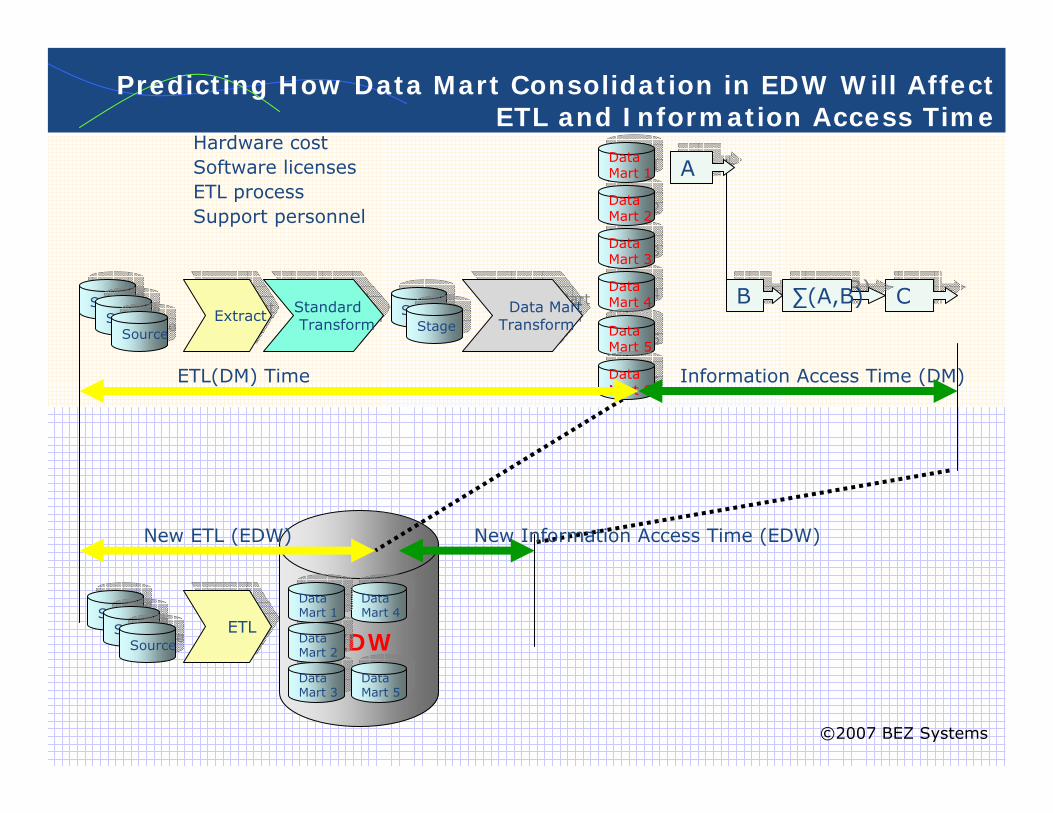
Predicting How Data Mart Consolidation in EDW Will Affect ETL and Information Access Time
DataMart 3Data
Mart 3
DataMart 4Data
Mart 4DataMart 2Data
Mart 2DataMart 5Data
Mart 5
DataMart 1Data
Mart 1SourceSourceSourceSourceETLETL
SourceSource
Information Access Time (DM)
SourceSourceSourceSourceSourceSource
ExtractExtractStandardTransform
StandardTransform
StageStageStageStage
Data MartTransformData Mart
Transform
ETL(DM) Time
New ETL (EDW)
DataMart 4Data
Mart 4
DataMart 5Data
Mart 5
Data Mart 3Data
Mart 3
DataMart 2Data
Mart 2
DataMart 1Data
Mart 1
DataMart 6Data
Mart 6
AA
BB CC∑(A,B)∑(A,B)
New Information Access Time (EDW)
Hardware costSoftware licensesETL processSupport personnel
©2007 BEZ Systems
42
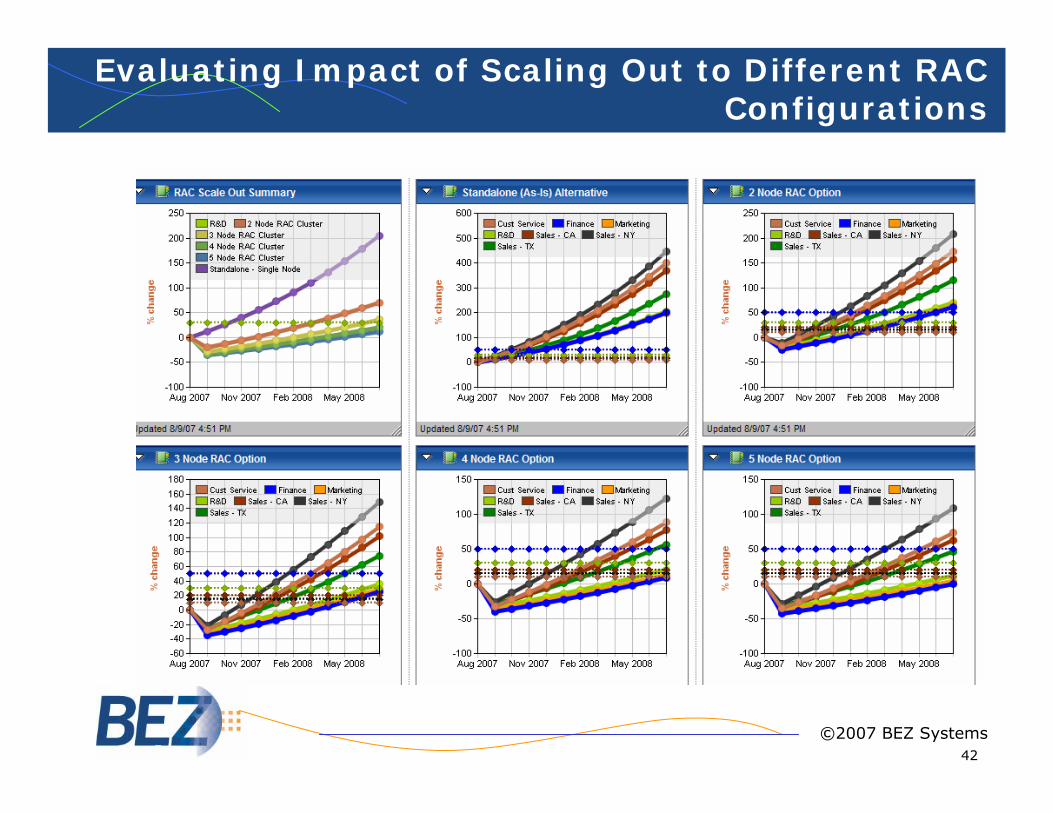
Evaluating Impact of Scaling Out to Different RAC Configurations
©2007 BEZ Systems
43
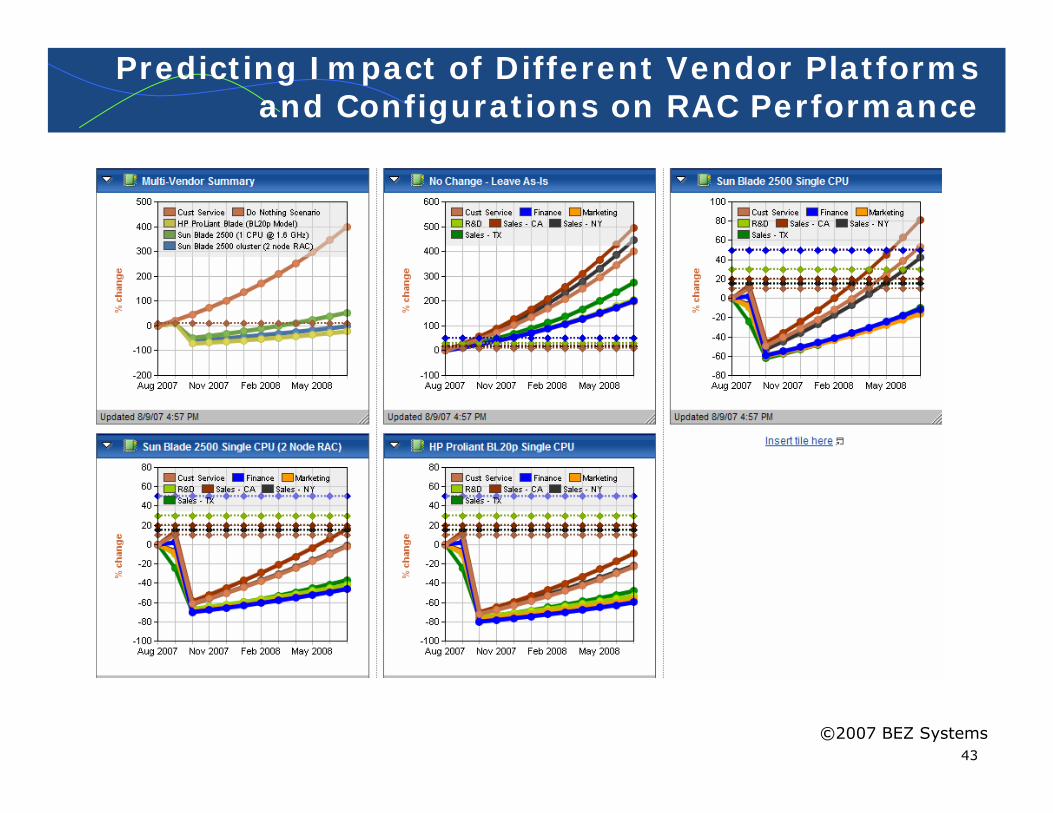
Predicting Impact of Different Vendor Platforms and Configurations on RAC Performance
©2007 BEZ Systems
44
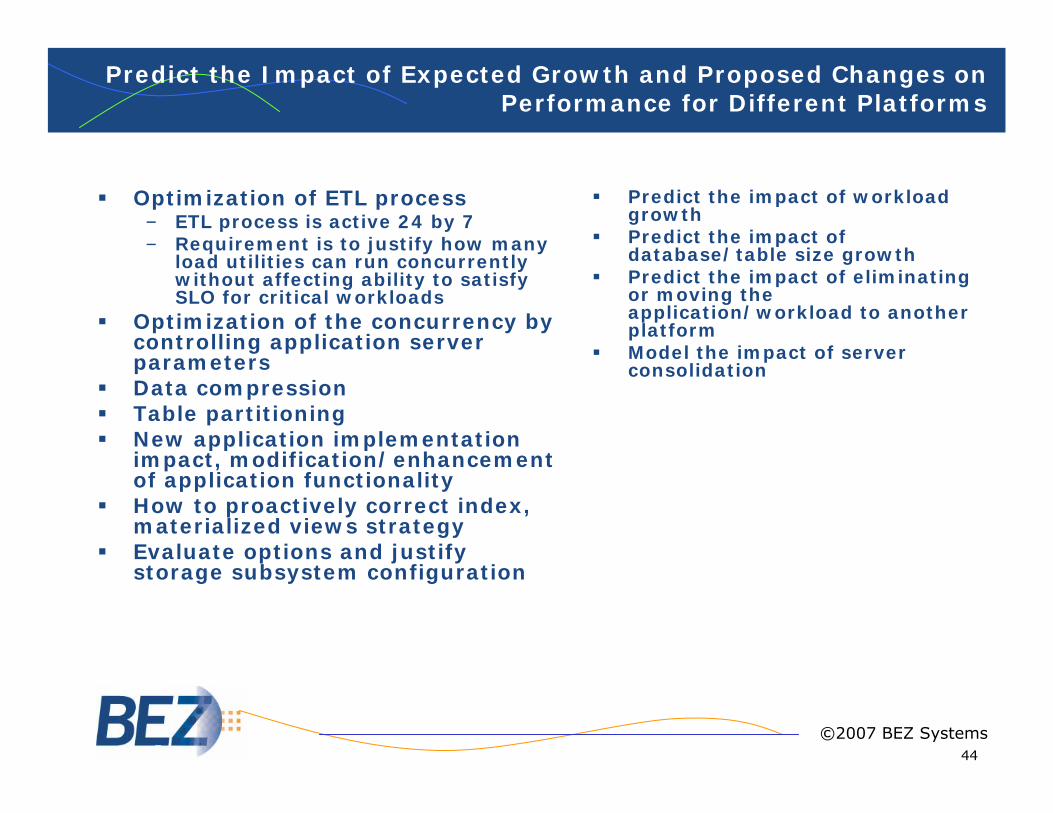
Predict the Impact of Expected Growth and Proposed Changes on Performance for Different Platforms
Optimization of ETL process– ETL process is active 24 by 7 – Requirement is to justify how many
load utilities can run concurrently without affecting ability to satisfy SLO for critical workloads
Optimization of the concurrency by controlling application server parameters Data compressionTable partitioningNew application implementation impact, modification/enhancement of application functionalityHow to proactively correct index, materialized views strategyEvaluate options and justify storage subsystem configuration
Predict the impact of workload growth Predict the impact of database/table size growthPredict the impact of eliminating or moving the application/workload to another platform Model the impact of server consolidation
©2007 BEZ Systems
45
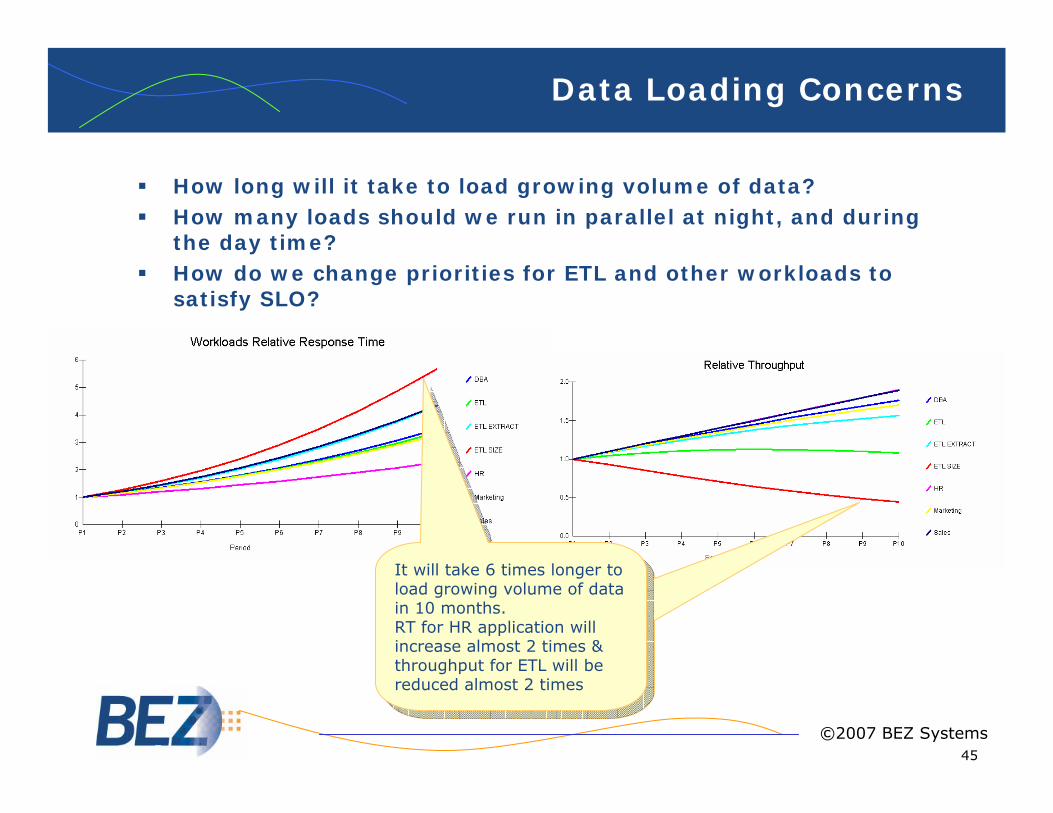
Data Loading Concerns
How long will it take to load growing volume of data?How many loads should we run in parallel at night, and during the day time?How do we change priorities for ETL and other workloads to satisfy SLO?
It will take 6 times longer to load growing volume of data in 10 months. RT for HR application will increase almost 2 times & throughput for ETL will be reduced almost 2 times
It will take 6 times longer to load growing volume of data in 10 months. RT for HR application will increase almost 2 times & throughput for ETL will be reduced almost 2 times
©2007 BEZ Systems
46
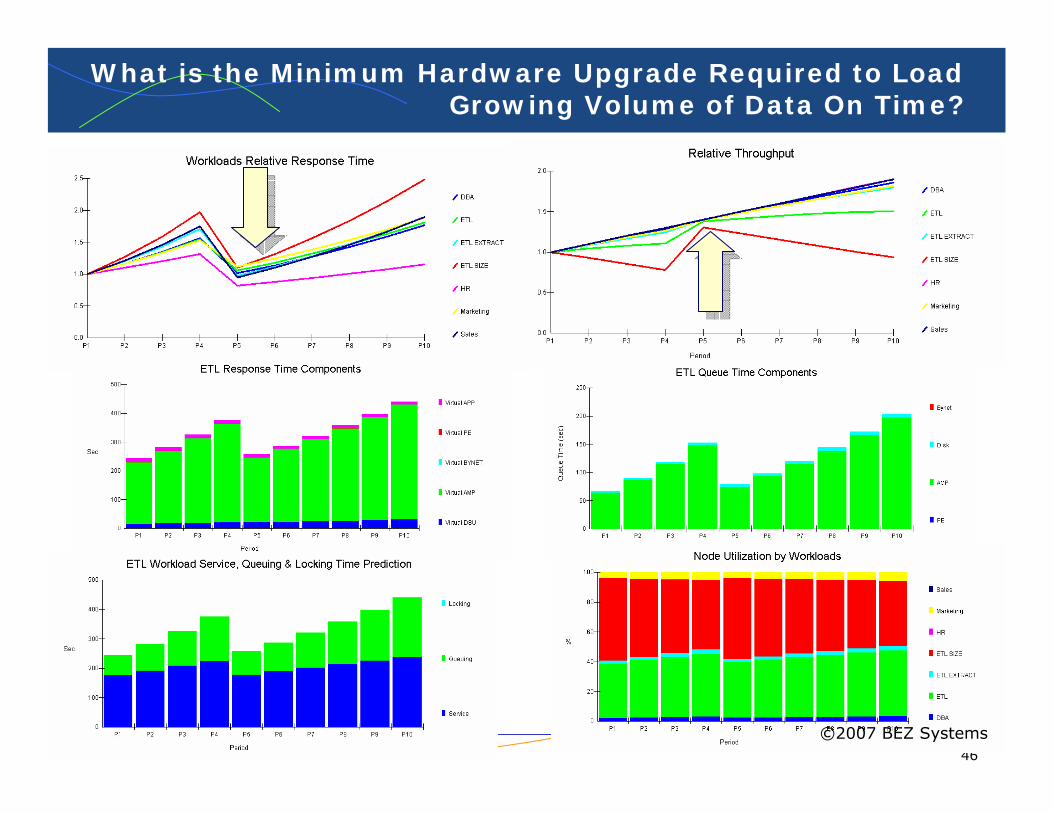
What is the Minimum Hardware Upgrade Required to Load Growing Volume of Data On Time?
©2007 BEZ Systems
47
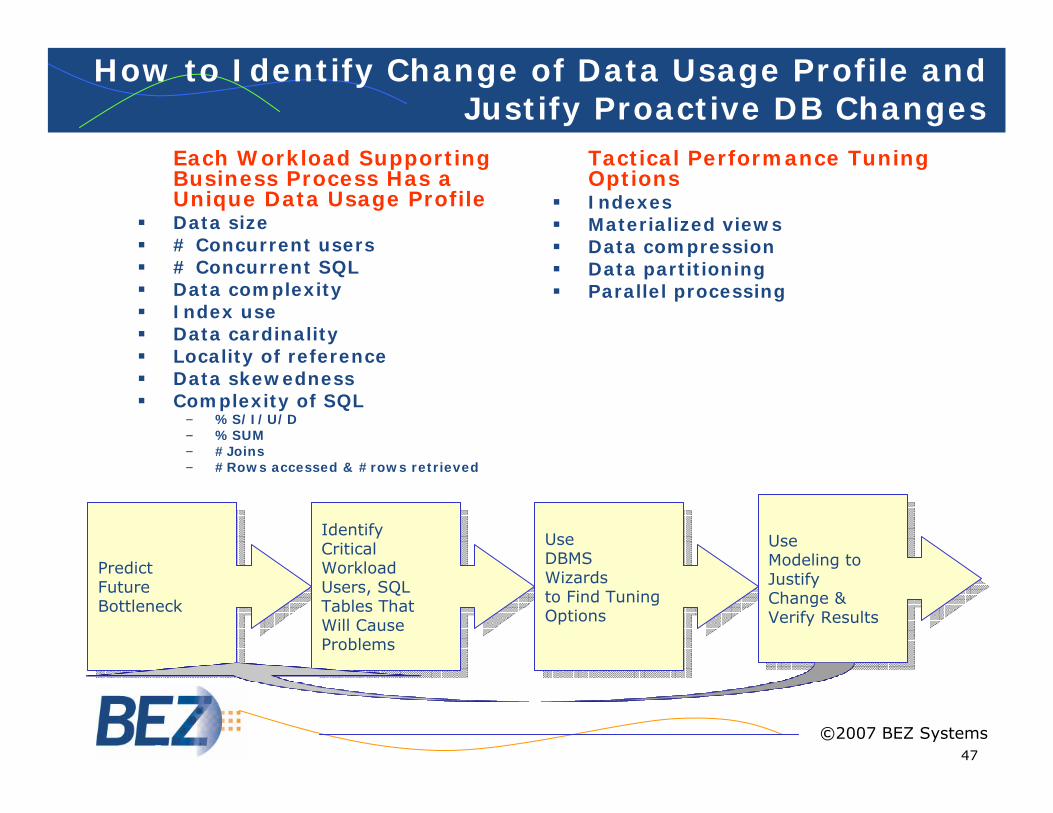
How to Identify Change of Data Usage Profile and Justify Proactive DB Changes
Each Workload Supporting Business Process Has a Unique Data Usage ProfileData size# Concurrent users # Concurrent SQLData complexityIndex useData cardinalityLocality of referenceData skewednessComplexity of SQL
– %S/I/U/D– %SUM– #Joins– #Rows accessed & #rows retrieved
Tactical Performance Tuning OptionsIndexesMaterialized viewsData compressionData partitioningParallel processing
PredictFuture Bottleneck
PredictFuture Bottleneck
Identify Critical WorkloadUsers, SQLTables ThatWill CauseProblems
Identify Critical WorkloadUsers, SQLTables ThatWill CauseProblems
UseDBMS Wizardsto Find TuningOptions
UseDBMS Wizardsto Find TuningOptions
UseModeling toJustify Change &Verify Results
UseModeling toJustify Change &Verify Results
©2007 BEZ Systems
48
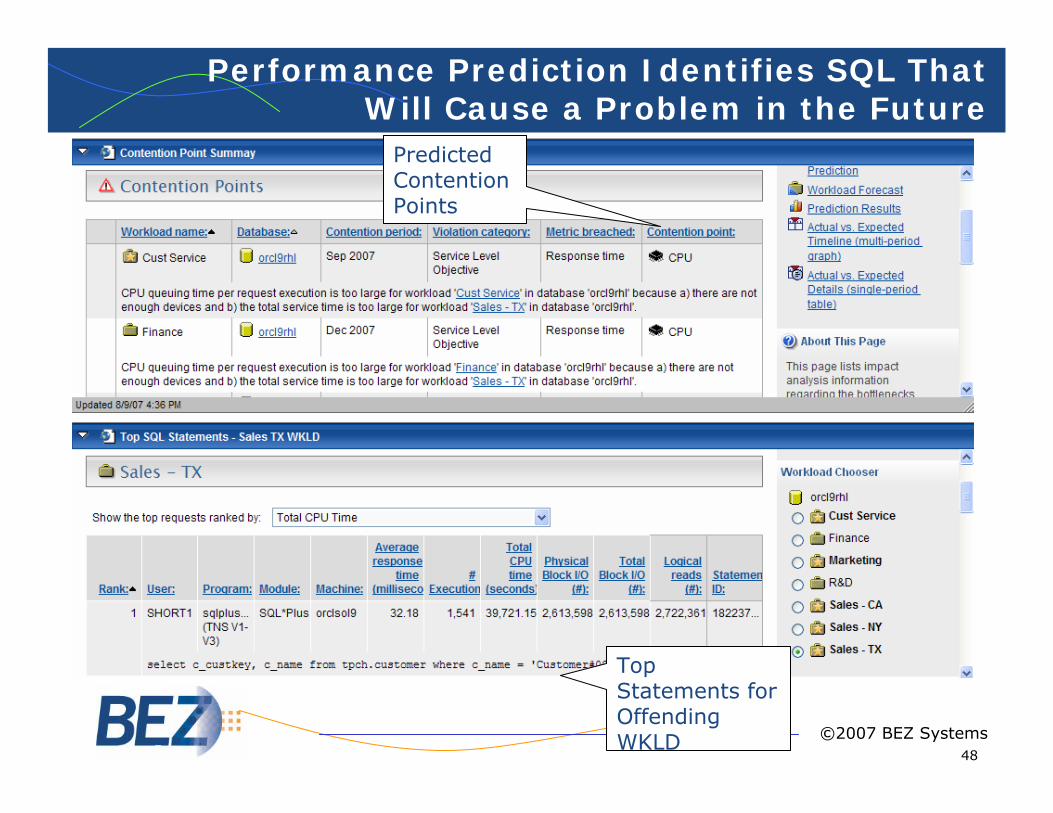
Top Statements for Offending WKLD
Predicted Contention Points
Performance Prediction Identifies SQL That Will Cause a Problem in the Future
©2007 BEZ Systems
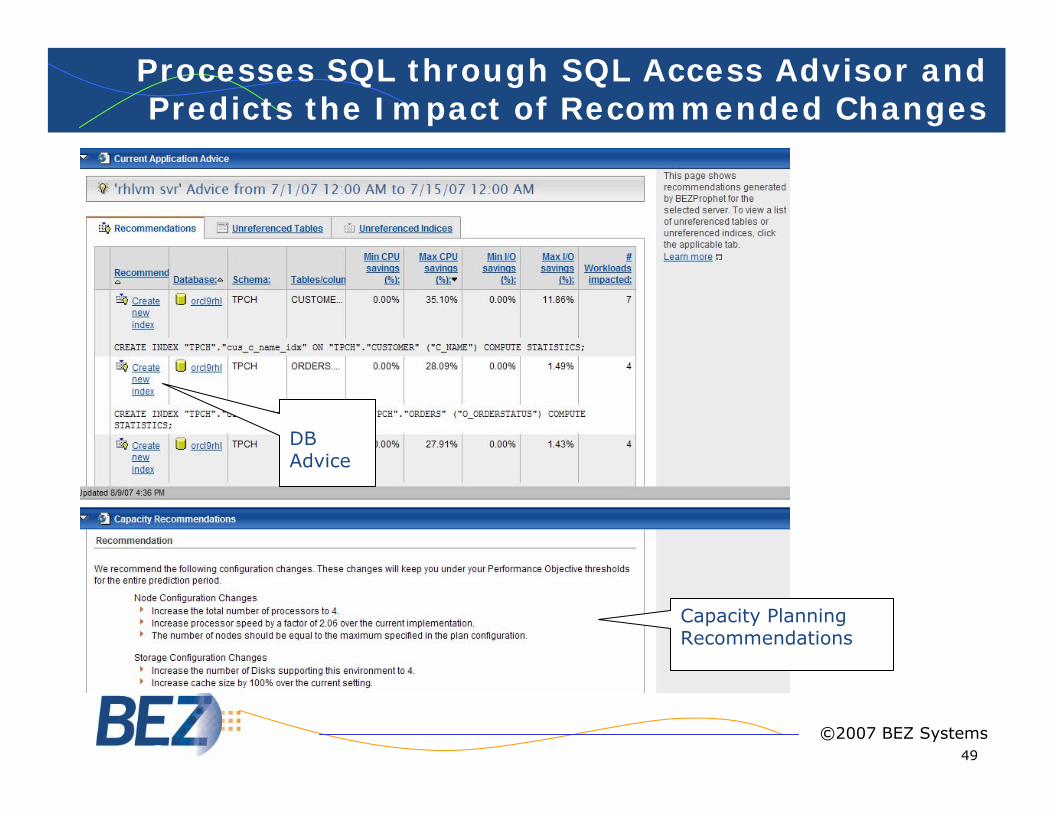
49
DBAdvice
Capacity PlanningRecommendations
Processes SQL through SQL Access Advisor and Predicts the Impact of Recommended Changes
©2007 BEZ Systems
50
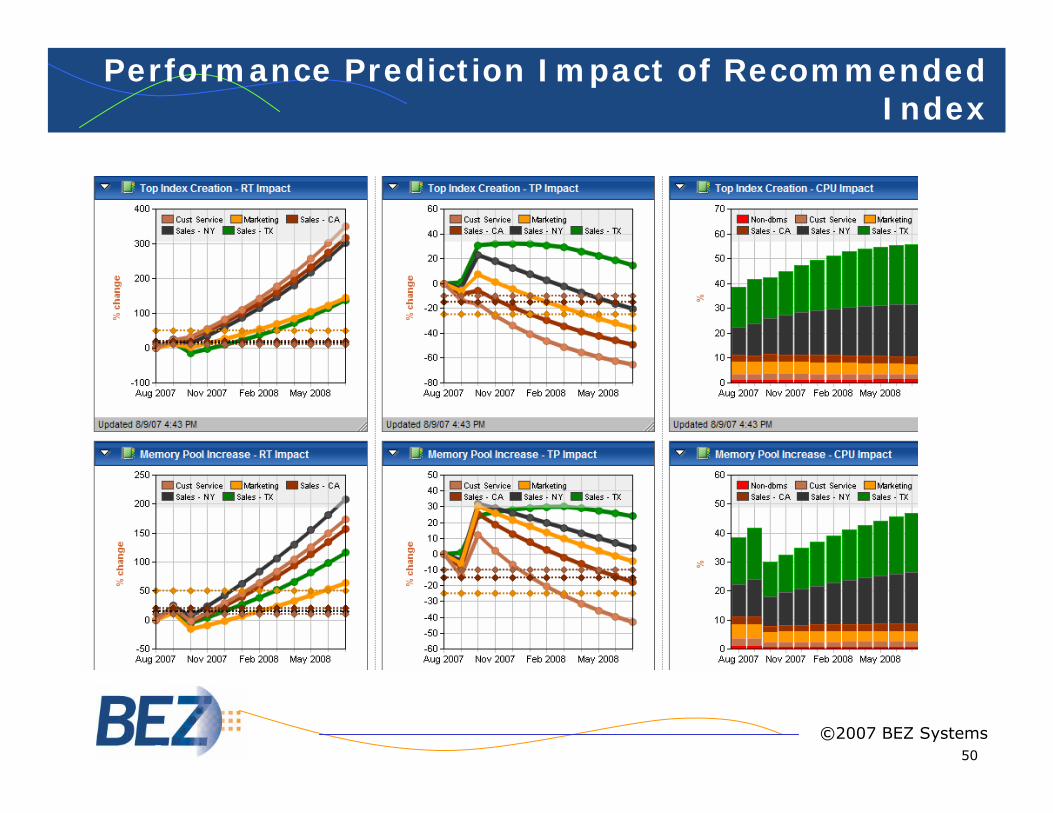
Performance Prediction Impact of Recommended Index
©2007 BEZ Systems
51
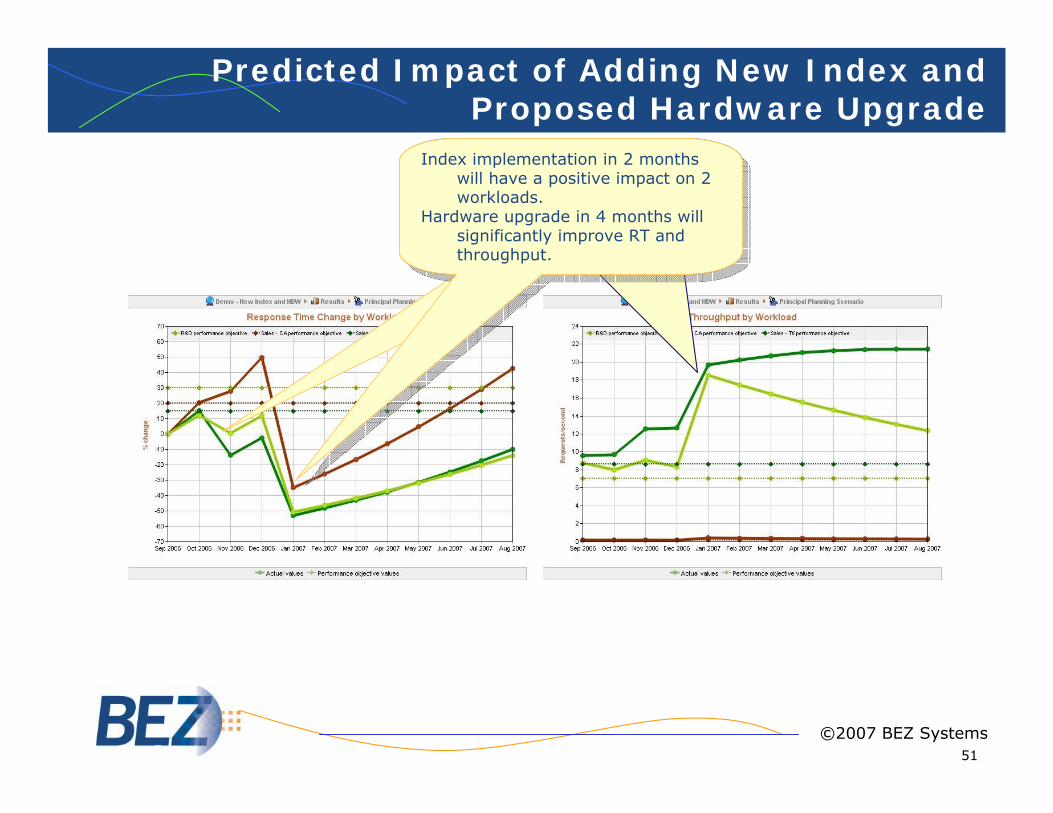
Predicted Impact of Adding New Index and Proposed Hardware Upgrade
Index implementation in 2 months will have a positive impact on 2 workloads.
Hardware upgrade in 4 months will significantly improve RT and throughput.
Index implementation in 2 months will have a positive impact on 2 workloads.
Hardware upgrade in 4 months will significantly improve RT and throughput.
©2007 BEZ Systems
52
Data Compression Impact
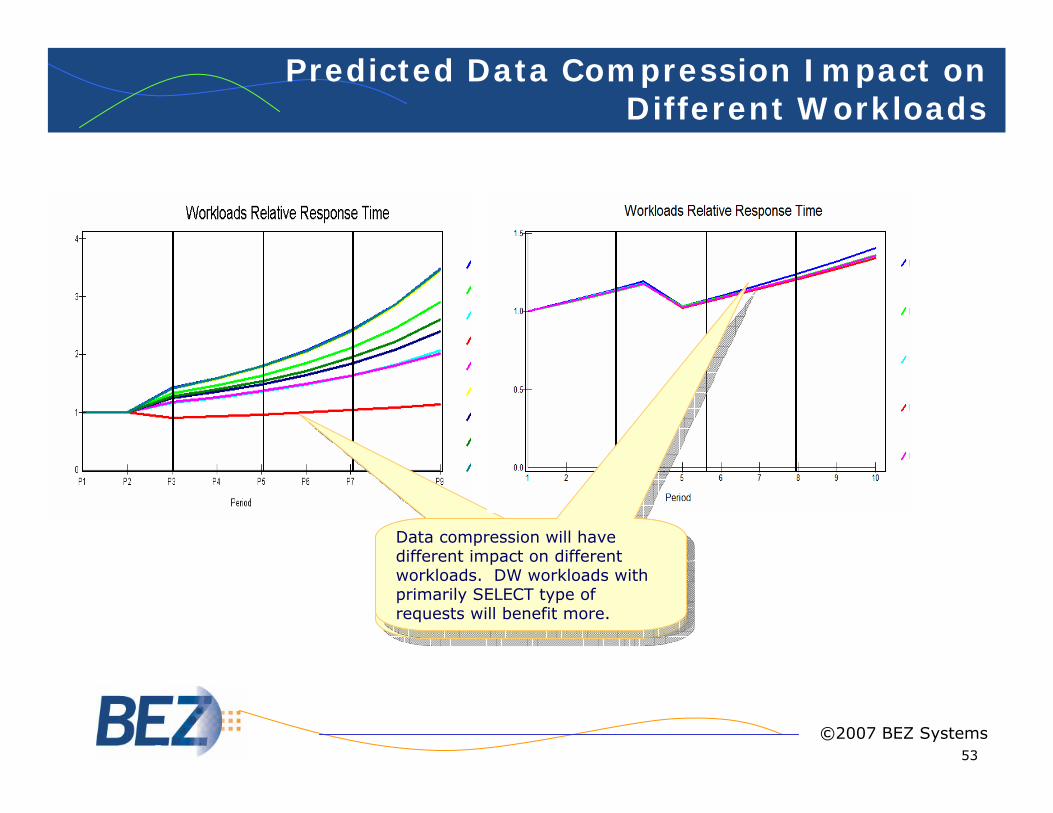
Oracle 11g expands DW data compression to OLTP tables and allows DML statements (INSERT, UPDATE, and DELETE) on compressed tables – Reduction in storage capacity demand – Increase in application performance
Reduce physical IO and enhance cache efficiencyAs a result of data compression, users observe up to 50-70% savings in disk space for large tablesAssumption that reduction in I/O rate to table is proportional to reduction in table space usage as result of data compressionData compression causes increase in CPU overhead due to data decompression for read operations and data compression for inserts and updates, and reduction in CPU overhead caused by reduction in number of I/O operationsOne of the important benefits of data compression is reduction of the volume of data that should be logged to support insert/update operations
©2007 BEZ Systems
53
Predicted Data Compression Impact on Different Workloads
Data compression will have different impact on different workloads. DW workloads with primarily SELECT type of requests will benefit more.
Data compression will have different impact on different workloads. DW workloads with primarily SELECT type of requests will benefit more.
©2007 BEZ Systems
54
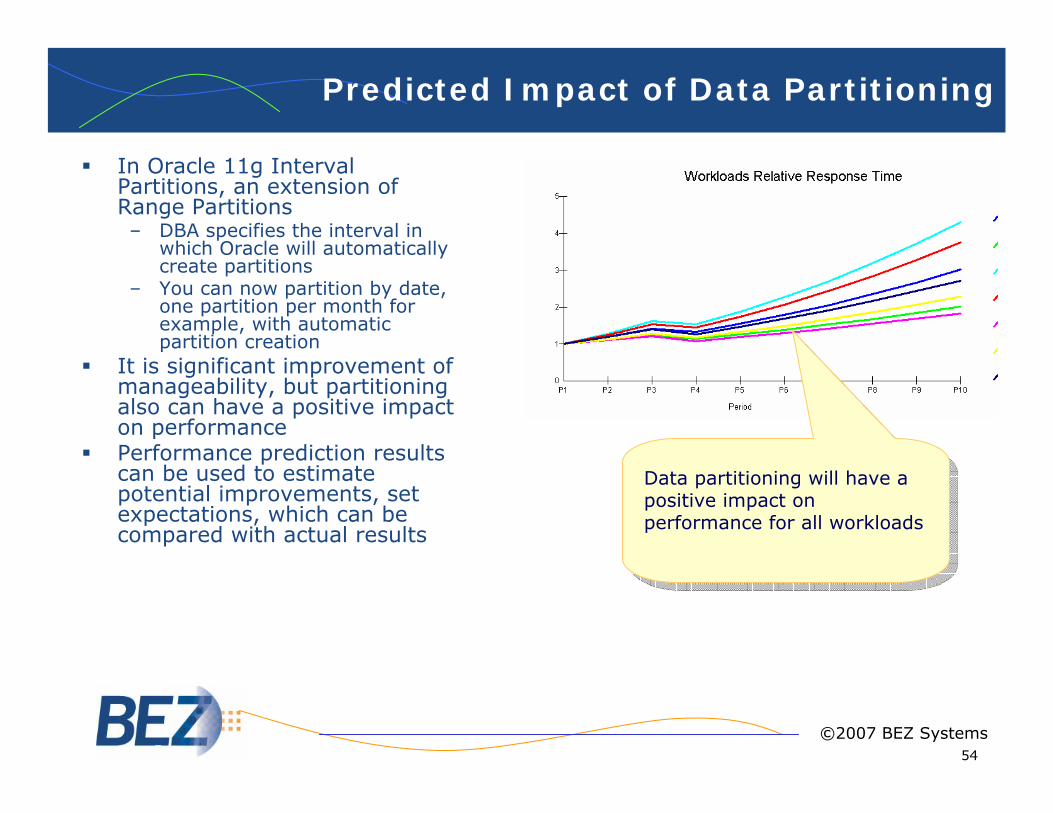
Data partitioning will have a positive impact on performance for all workloads
Data partitioning will have a positive impact on performance for all workloads
Predicted Impact of Data Partitioning
©2007 BEZ Systems
In Oracle 11g Interval Partitions, an extension of Range Partitions– DBA specifies the interval in
which Oracle will automatically create partitions
– You can now partition by date, one partition per month for example, with automatic partition creation
It is significant improvement of manageability, but partitioning also can have a positive impact on performancePerformance prediction results can be used to estimate potential improvements, set expectations, which can be compared with actual results
55
Example Showing How Modeling
Results Can Be Used to Predict
the Impact of Implementation of
New Oracle 11g Features on
Performance of Each of the Workloads
56
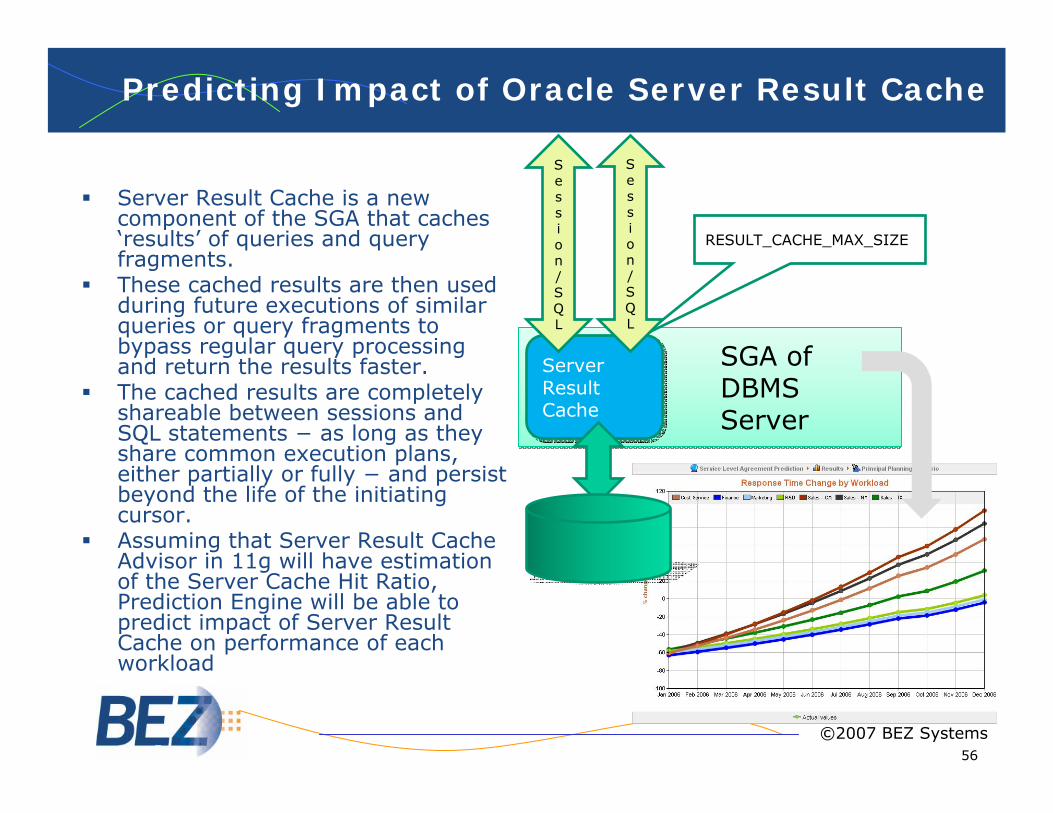
Predicting Impact of Oracle Server Result Cache
Server Result Cache is a new component of the SGA that caches ‘results’ of queries and query fragments. These cached results are then used during future executions of similar queries or query fragments to bypass regular query processing and return the results faster. The cached results are completely shareable between sessions and SQL statements − as long as they share common execution plans, either partially or fully − and persist beyond the life of the initiating cursor. Assuming that Server Result Cache Advisor in 11g will have estimation of the Server Cache Hit Ratio, Prediction Engine will be able to predict impact of Server Result Cache on performance of each workload
SGA of DBMSServer
SGA of DBMSServer
Server Result Cache
Server Result Cache
RESULT_CACHE_MAX_SIZE
Session/SQL
Session/SQL
©2007 BEZ Systems
57
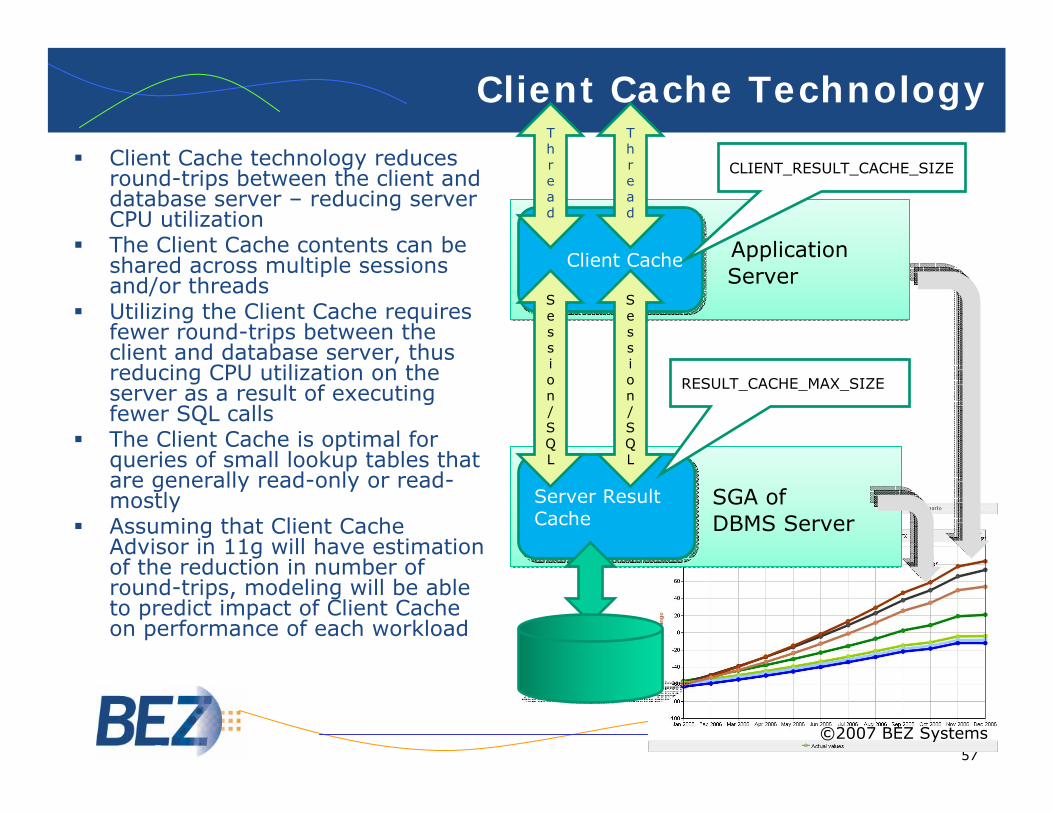
Client Cache Technology
Client Cache technology reduces round-trips between the client and database server – reducing server CPU utilizationThe Client Cache contents can be shared across multiple sessions and/or threadsUtilizing the Client Cache requires fewer round-trips between the client and database server, thus reducing CPU utilization on the server as a result of executing fewer SQL callsThe Client Cache is optimal for queries of small lookup tables that are generally read-only or read-mostlyAssuming that Client Cache Advisor in 11g will have estimation of the reduction in number of round-trips, modeling will be able to predict impact of Client Cache on performance of each workload
SGA of DBMS ServerSGA of DBMS Server
Server Result CacheServer Result Cache
RESULT_CACHE_MAX_SIZE
ApplicationServer ApplicationServer
Client CacheClient Cache
CLIENT_RESULT_CACHE_SIZE
Thread
Thread
Session/SQL
Session/SQL
©2007 BEZ Systems
58
Comparison of the Actual Results with Expected
and Organization of a Continuous
Proactive Performance Management
Process
59
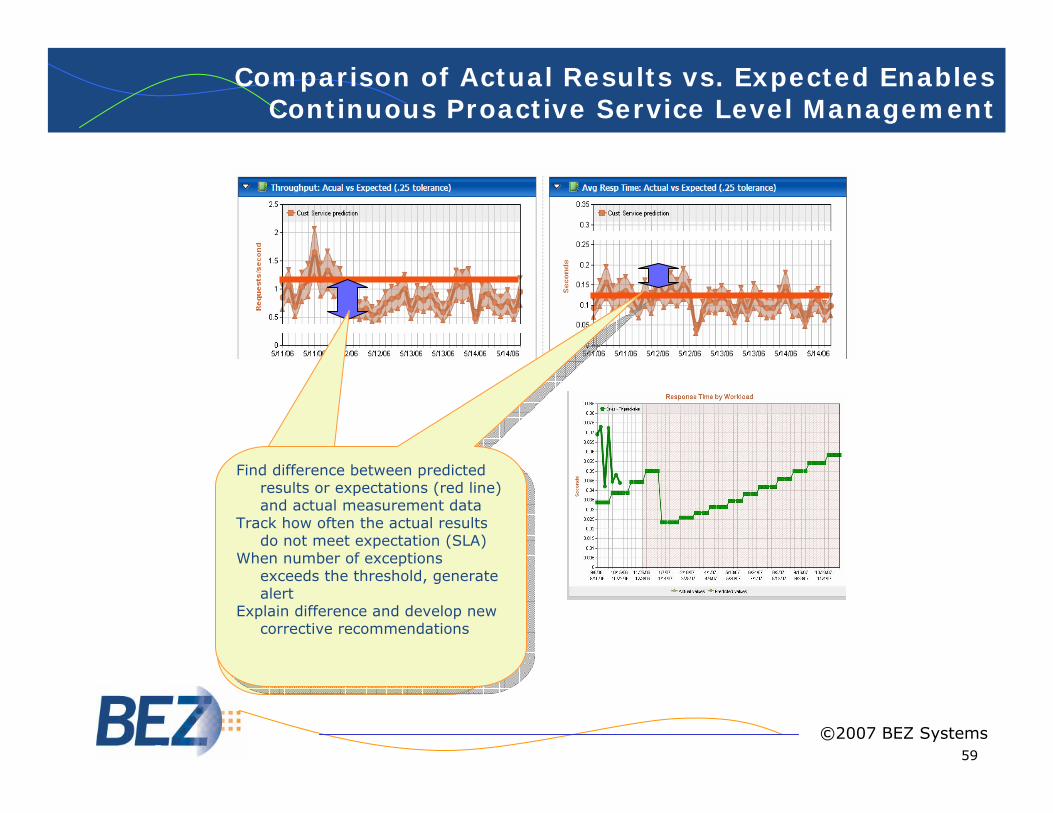
Comparison of Actual Results vs. Expected Enables Continuous Proactive Service Level Management
Find difference between predicted results or expectations (red line) and actual measurement data
Track how often the actual results do not meet expectation (SLA)
When number of exceptions exceeds the threshold, generate alert
Explain difference and develop new corrective recommendations
Find difference between predicted results or expectations (red line) and actual measurement data
Track how often the actual results do not meet expectation (SLA)
When number of exceptions exceeds the threshold, generate alert
Explain difference and develop new corrective recommendations
©2007 BEZ Systems
60
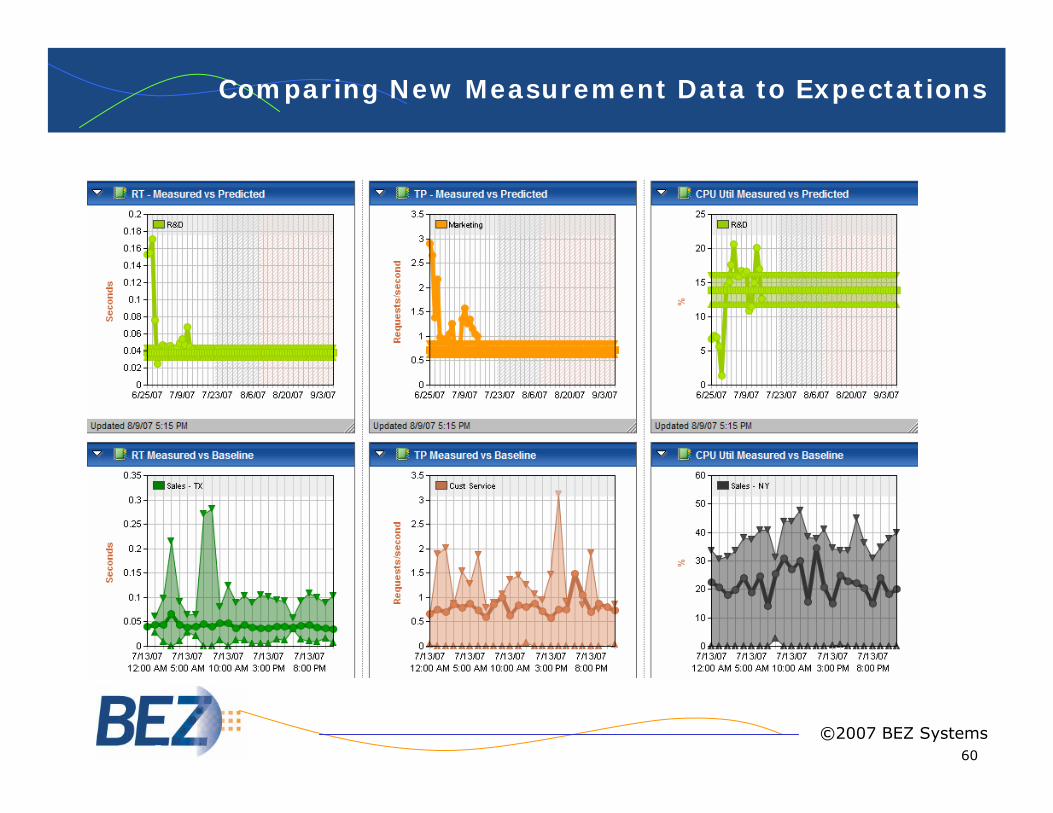
Comparing New Measurement Data to Expectations
©2007 BEZ Systems
61
Conclusion
62
Conclusion
We reviewed different factors affecting RAC performance in EDW environment with mixed workloads, including Contention for Shared Storage, DOP, Contention for Interconnect, Memory management, Workload managementWe discussed how modeling results can be used to evaluate and justify strategic, tactical and operational decisions, and minimize risk of performance surprises, including:
– Platform selection for DW and EDW – New applications implementation– Hardware and storage upgrades – Disaster recovery – Data compression – Database tuning– Data partitioning – Server consolidation
Presented methodology enables organization of the continuous proactive performance management process This process is based on automation of workload characterization, modeling, optimization and setting realistic expectations, and automation of comparing the actual results with expected and applying necessary changes before it is too late.
©2007 BEZ Systems