Embed Size (px)
Citation preview

REDUCING THE PRISON POPULATION IN FINLAND
Tapio Lappi-Seppälä National Research Institute of Legal Policy
Finland

The Nordic Position

FINLAND• Population of 5.4 million; fairly homogenous, but
with increasing number of foreigners (now exceeding 3 % of the total population)
• Juridical system manifestly rooted in western, continental legal culture with strong influence from neighbouring Nordic Countries.
• Nordic countries: internationally high level of social security and equality (nordic welfare state), higher levels of social trust and political legitimacy, and lower levels of penal repression.

Prisoner rates by regions 2012
4761
717474
768387
9597104109115
125152155157
173184
223225
252276
304
0 100 200 300 400 500 600 700 800
..ICEFIN
DENNORSWE
…SWZGER
NLIR
BELAUSITA
FRAPOR
SpainE&W
SCOT…
HUNSLOPOLCZE
…ESTLIT
LAT…
RUS
USA
Baltic 277
Eastern Europe 201
Western Europe 107
Scandinavia 65
USA 730
Russia
4

Phases in penal change in Finland• During the last Century, Finland experienced three wars
(the 1918 Civil War and the two wars against Soviet Union between 1939 and 1944). This has left its mark also in the penal development.
• The first half of the century reflects the struggles under severe social and political crisis with a resulting very high incarceration rates (peaking 250/100 000 post WW2).
• The 1960s started a period of reform and penal liberalization. By the 1990s Finland had reduced its prison population rates to the “common Nordic level” of around 60-65 prisoners / 100 000.
• The 1990s onwards is characterized by stabilization.

LOOKING BACK OVER 50 YEARS
0
50
100
150
200
250
300
350
400
450
500
1945 1950 1955 1960 1965 1970 1975 1979 1984 1989 1994 1999 2004
PRISONERS IN THE USA 1945-2003
Federal and State (/100 000 pop)
0
20
40
60
80
100
120
140
160
180
200
220
240
260
1945 1950 1955 1960 1965 1970 1975 1980 1985 1990 1995 2000 2005
PRISONERS IN FINLAND 1945-2003
(/100 000 pop)

Nordic prisoners rates 1950-2010 / pop
8

The Finnish ”decarceration program”
Background: Research findings and policy principles 1960/70S->
1. General distrust in institutional treatment2. Criticism of coercive care and the lack of legal
safeguards3. ”Downgrading” the role of criminal law in crime
prevention (predominance of social policy and situational prevention).
4. The demand of conscious weighting of the costs and benefits of available alternatives
5. The urge to harmonize the Nordic criminal justice systems
6. Political consensus: Prison is overused

Questions asked: Which groups…
• Don’t belong in the prison in the first place– Fine defaulters
• Are over-presented and create the overcrowding problem– Small property offenders and drunk drivers
• Stay in the prison too long– Persistent property offenders
• The prison harms the most– Juveniles

Backing up political support
• Well functioning network of active researchers, civil servants and policy makers (with close personal contacts, small country!)
• Using the ”Nordic card”: – we need to harmonize our systems with the
other Scandinavian countries (with more enlightened and advanced methods)

Realizing the reform plan: 1960/1970s->
1. Preventive detention 712. Fine defaulters 69/063. Penalties for theft 72/914. Reform of drunken driving 77 5. Conditional sentence 76/006. Sentencing principles 767. Juvenile justice 70-90S8. Community service 929. Parole and early release 60-90S

1. Restricting the use of indeterminate sanctions (preventive detention) early 70s
0
50
100
150
200
250
300
350
400
1950 1953 1956 1959 1962 1965 1968 1971 1974 1977 1980 1983 1986 1989 1992 1995 1998
REPEAT RECIDIVISTS 1950-2000
(Absolute figures)

2. Restricting the use of default imprisonment (and decriminalizing public drunkenness) late 60s
0
200
400
600
800
1000
1200
1400
1600
1800
1950 1953 1956 1959 1962 1965 1968 1971 1974 1977 1979 1982 1985 1988 1991 1994 1997 2000
FINE DEFAULTERS IN PRISONS 1950-2000 (Absolute figures )

• Mean prison term for theft– 12 months (-50s) -> 3 mths (-90s)
• The share of imprisonment of all court dispostions– 50 % (1975); 20 % (2010)
• The total number of imposed prison years– 2500 (1975) to 250 (2000)
• The number of prisoners serving a sentence for theft– 2000 (1975) to 500 (2000)
• The share of prisoners sentenced for theft of all convicted prisoners– 50 % (1975) to 15 % (2000s)
3. Reducing penalties for theft 1972 and 1991

Prisoners serving a sentence for theft offenses 1975-2010
0
500
1000
1500
2000
2500
1975
1980
1985
1990
1995
2000
2005
2010
0
5
10
15
20
25
30
35
40
45
50
Theft N Theft %

4. Extending the use of conditional imprisonment 1970s
Prison Conditional
1960 7000 4000
1970 10000 5000
2000 8000 14000
2010 6500 15000

Unconditional and conditional prison sentences in the courts 1960-2010
6 90010 212 10 326 11 657
8 147 6271
3 686
5 215
14 55617 428
13 97415 098
0
5 000
10 000
15 000
20 000
25 000
30 000
35 000
1960 1970 1980 1990 2000 2010
ConditionalPrison

Conditional imprisonment: ”Key-device”
• Prison sentences below 2 years• Very strong presumption for all first
offenders• In borderline cases may be combined with
fines or community service (between 1-2 years)
• Revocation only because of a new offense leading to imprisonment

5. Reducing penalties for Drunken Driving 1977 1960s prison 90 %; 1990s 15 %
Prison-% Conditional-%
Fine-%
0 %
20 %
40 %
60 %
80 %
100 %
1950
1960
1970
1980
1990

• Role of recidivism in sentencing restricted (no mechanical rules)
• Providing means to reduce unwarranted disparities in sentencing
• Providing a framework and platforms for reasoned discussions in sentenceing between different actors
6. Sentencing rules 1970s

Co-ordinated ”sentencing package” of four laws – mid 1970s
1. Expanding the use of conditional imprisonment (providing a combination of conditional + fines)
2. Increasing the credibility of fines as an alternative by raising the value of dayfines
3. Altering the penalty scales for drunk driving and replacing prison sentences with the new combination conditional+ (heavier) fines
4. Establishing a framework for reasoned discussions and sentenecing guidance through the sentencing reform
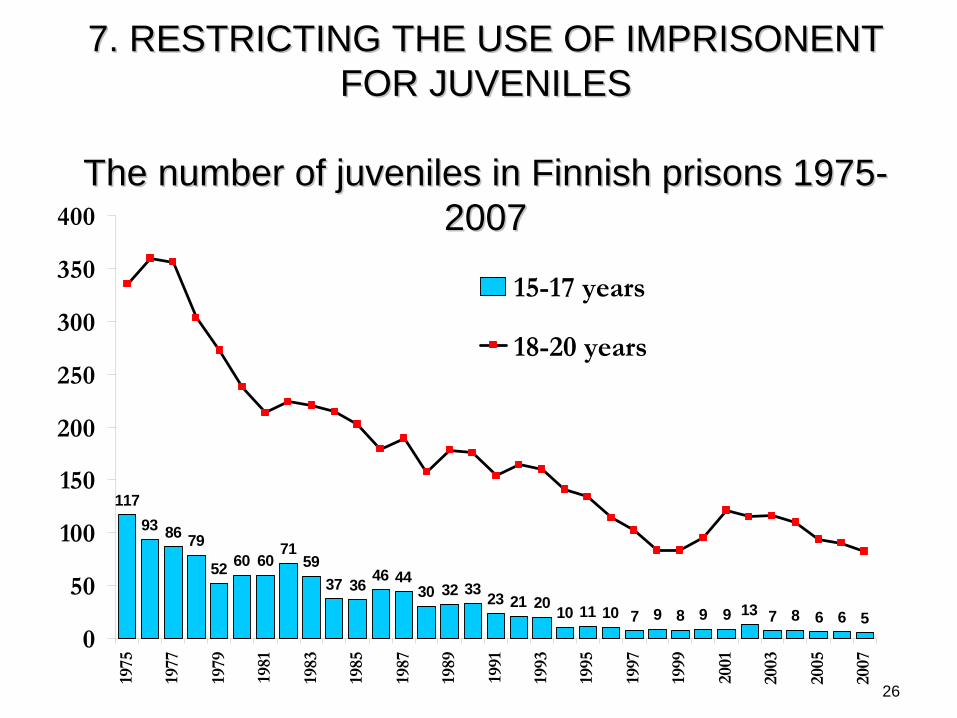
7. RESTRICTING THE USE OF IMPRISONENT 7. RESTRICTING THE USE OF IMPRISONENT FOR JUVENILESFOR JUVENILES
The The numbernumber of of juvenilesjuveniles in in FinnishFinnish prisonsprisons 19751975-- 20072007
11793 86 79
52 60 6071
5937 36 46 44
30 32 33 23 21 20 10 11 10 7 9 8 9 9 13 7 8 6 6 50
50
100
150
200
250
300
350
400
1975
1977
1979
1981
1983
1985
1987
1989
1991
1993
1995
1997
1999
2001
2003
2005
2007
15-17 years
18-20 years
26
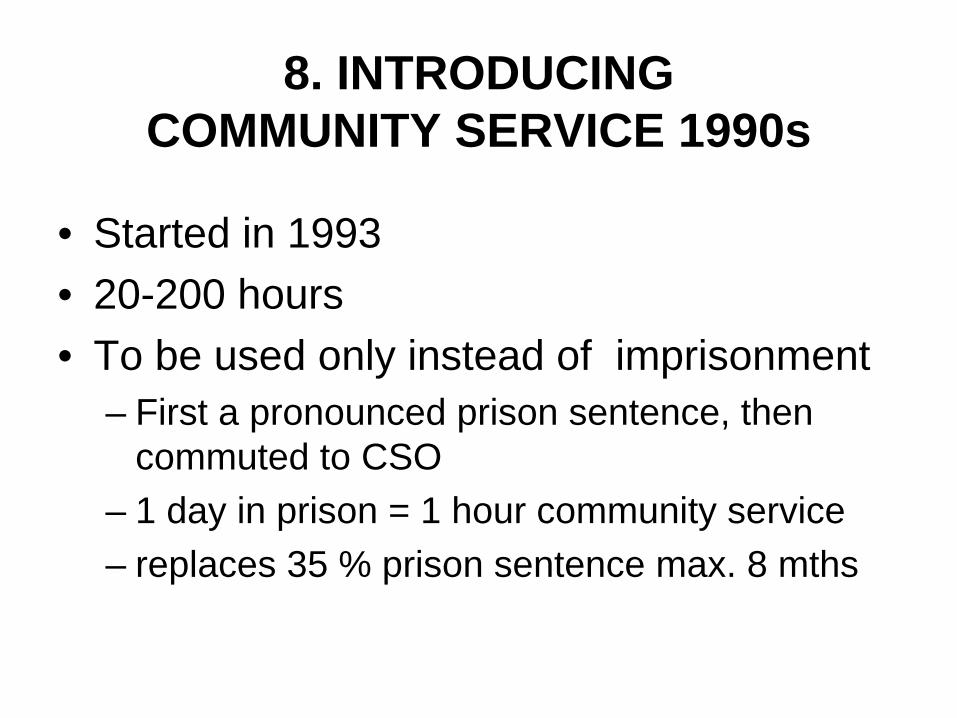
8. INTRODUCING COMMUNITY SERVICE 1990s
• Started in 1993• 20-200 hours• To be used only instead of imprisonment
– First a pronounced prison sentence, then commuted to CSO
– 1 day in prison = 1 hour community service– replaces 35 % prison sentence max. 8 mths

Introducing community service in Finland 1993-2010 (court statistics)
0
2000
4000
6000
8000
10000
12000
14000
1990
1991
1992
1993
1994
1995
1996
1997
1998
1999
2000
2001
2002
2003
2004
2005
2006
2007
2008
2009
2010
PrisonCommunity service

CommunityCommunity serviceservice, , conditionalconditional imprisonmentimprisonment and and prisonprison 19901990--2010 2010 -- FinlandFinland
29

Effects and experiences• Lower reoffending rate in comparable
groups– Around 10 %-points diffference
• But note also the value of ”non- reconviction” benefits– Maintaining work– Maintaining family relations– Gaining vocational skills etc
• Important and valuable as such• Long-term relevance also for future offending

9. EXTENDING THE USE OF PAROLE AND EARLY RELEASE 1960-2006
REDUCING THE MINIMUM TIME BEFORE PAROLE• 1966: 6 months -> 4 months 40 % -> 60 %• 1975: 4 months -> 3 months 60 % -> 75 %• 1989: 3 months -> 14 days 75 % -> 99 %
NORMAL TIME TO BE SERVED• 1/2 FIRST OFFENDERS• 2/3 RECIDIVISTS• YOUNG OFFENDERS (1/3 or ½)
NEW EXTENSION 2006• prior 6 months of normal release (elect.monitoring)

KEY-POINT: REVOCATION RULES
• As a rule only for a new offense leading to at least 3 months prison term
• Still discretion how much revoked (in practixe max 1/3)
• Recall for ”mere reach of conditions”– At most 14 days– 10-20 cases/year
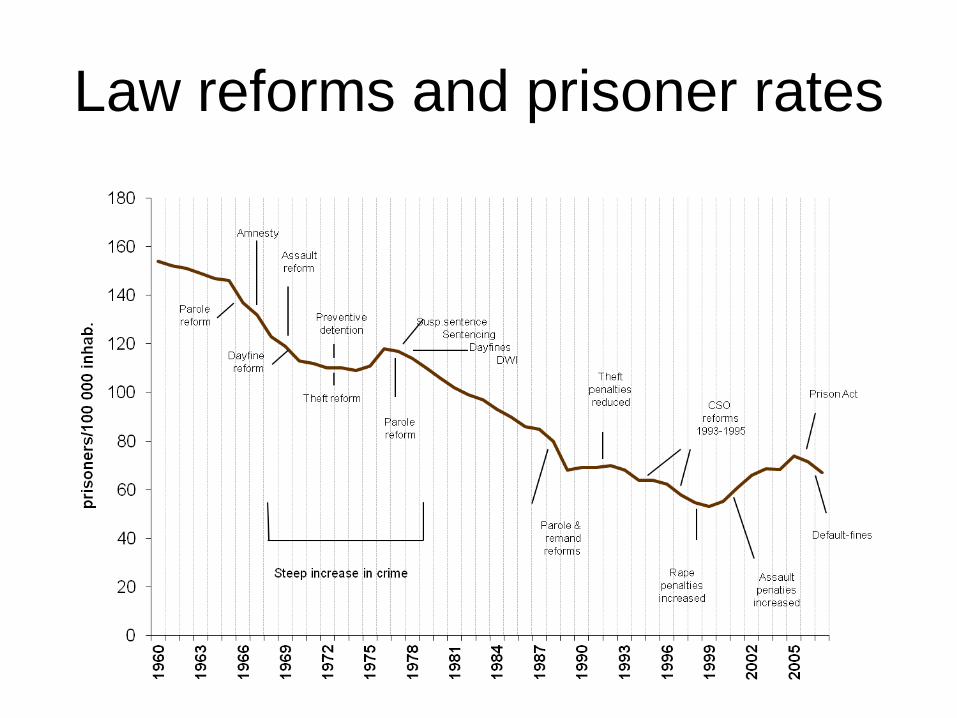
Law reforms and prisoner rates
Increasing prison population rates 1998-2005
• More drug trafficers• More foreigners• Increased penalties for aggravated assault• More fine-defaulters
New downward trend 2005-2012

Crime and Imprisonment
Comparing four Nordic countries

0
2 000
4 000
6 000
8 000
10 000
12 000
14 000
1950
1955
1960
1965
1970
1975
1980
1985
1990
1995
2000
2005
DENFIN NORSWE
Crime
0
20
40
60
80
100
120
140
160
180
200
1950
1955
1960
1965
1970
1975
1980
1985
1990
1995
2000
2005
DENFIN NORSWE
Prisoners
PRISON RATES AND CRIME RATESPRISON RATES AND CRIME RATES FourFour
ScandinavianScandinavian
CountriesCountries
19501950--20052005
40
Comparing Scotland and Finland I
Imprisonment rates and crime

Imprisonment rates: Scotland and Finland 1960-2010

Total reported crime 1960-2010

0
2 000
4 000
6 000
8 000
10 000
12 000
1950
1955
1960
1965
1970
1975
1980
1985
1990
1995
2000
2005
FIN
SCOT
Crime
0
20
40
60
80
100
120
140
160
180
200
1950
1955
1960
1965
1970
1975
1980
1985
1990
1995
2000
2005
FIN
SCOT
Prisoners
PRISON RATES AND CRIME RATESPRISON RATES AND CRIME RATES Finland and Scotland 1950Finland and Scotland 1950--20062006
Comparing Scotland and Finland IIPrison profile
ICPS

Prison profiles 2012: Scotland and Finland

Prison profiles 2012: Average number of prisoners in prison

Comparing Scotland and Finland III
Sentencing practicesEuropean Sourcebook 2010

Comparing sentencing statistics (courts) http://www.scotland.gov.uk/Publications/2008/06/02124526/2
PopSCO 5 222 000PopFIN 5 375 000
Scotland 2006/7
%(mean)
Finland 2010
%(mean)
Convictions 138 80 13 % 63 244
Fines by court(by prosecutor)
85 000 61 % (211 £) 36 120(
57 % (445 €)
Custody 18 200 13 % (7 months)
6 271 10 %(10 mths)
Community Sanctions 17 400 12 % 18 752
- probation/conditional 9 200 7 % 15 098 23 %
- CSO 5 800 4 % 2 676 4 %
Total prison years 10 617 5173

Number of prison sentences (/pop) for different offenses (2006)
2723
126,4
88
45
18
5,8
0102030405060708090
100
Theft Assault Drugs Robbery
FinlandScotland

Summing up the steps1. Research: Theoretical framework to back up
and direct the program2. Political: Reaching a consensus that overuse
was a problem that should be dealt with3. Screening the situation: How and for whom
prison was (over)used4. Planning the reforms5. Implementing the reforms: co-operation with
different actors6. Evaluation, follow up and monitoring