Embed Size (px)
Citation preview

American Institute of Aeronautics and Astronautics
1
Reducing Uncertainty of a Fuel Cell UAV through Variable Fidelity Optimization
Blake A. Moffitt*, Thomas H. Bradley†, Dimitri Mavris‡ and David E. Parekh§ Georgia Institute of Technology, Atlanta, Georgia, 30332-0150
As a result of their high specific energy, high efficiency, improved environmental performance, and rapid refuelability, polymer electrolyte membrane (PEM) fuel cells are increasingly being considered as primary powerplants for unmanned aerial vehicles (UAV’s). The combination of a highly constrained design space and a large amount of performance uncertainty complicates the design of fuel cell aircraft. This paper documents a method that improves the design of a fuel cell powered long-endurance (~24 hr) low-altitude UAV by using multidisciplinary design optimization techniques to address the highly constrained design space, and systems sensitivity analysis (SSA) to estimate the performance uncertainly. The multidisciplinary analysis of the aircraft is decomposed into contributing analyses (CA’s) that are structured so as to simplify experimental validation and to improve the fidelity of the SSA. The contributing analyses are coupled into a design system matrix that is iteratively solved using Newton’s method to calculate aircraft performance metrics as a function of input design variables. An optimizer searches the design space to find the values of the design variables that maximize the endurance of the aircraft subject to several performance constraints. SSA is used to estimate the percentage of the overall uncertainty in the performance metrics based on the uncertainty of the contributing analyses and the uncertainty of the design input variables. Based on the SSA, CA’s with significant contribution to the total per formance uncertainty are selected and laboratory experiments are then conducted to obtain data used to increase the fidelity of these CA’s through calibration or regression. The optimization and uncertainty propagation is then repeated to obtain an improved design. In this paper, several iterations of the SSA/Experimental Validation procedure were performed until a design was selected that was based on high fidelity CA’s modeling all components of the fuel cell propulsion system. The predicted performance of the aircraft in terms of endurance and climb rate is reported with the predicted uncertainty after each iteration in the design.
I. Introduction ESIGN of advanced technology systems are most often highly constrained and exhibit large design uncertainty. Many emerging technologies can outperform conventional technologies in some performance criteria, but
underperform in others. Emerging technologies often require input from multidisciplinary specialists and models. Validated, parametric models of emerging technologies suitable for conceptual and preliminary design are often not available. Experimental data are often protected or very expensive to procure. During the conceptual and preliminary design stages, these characteristics significantly compromise the designer’s ability to make informed and constructive design decisions. Fuel cell systems for aircraft propulsion are an exemplar of these design problems. Fuel cells can outperform battery technologies by the metric of electrical specific energy (Wh/kg), but underperform by the metric of electrical *Graduate Student, The Daniel Guggenheim School of Aerospace Engineering, 270 Ferst Drive N.W. Atlanta, Georgia 30332-0150, AIAA Student Member. †Graduate Student, The George W. Woodruff School of Mechanical Engineering, 801 Ferst Drive N.W. Atlanta, Georgia 30332-0405, AIAA Student Member. ‡Boeing Professor of Advanced Aerospace Systems Analysis, The Daniel Guggenheim School of Aerospace Engineering, 270 Ferst Drive N.W. Atlanta, Georgia 30332-0150, Associate Fellow of AIAA. §Adjunct Professor, The George W. Woodruff School of Mechanical Engineering, 801 Ferst Drive N.W. Atlanta, Georgia 30332-0405, Associate Fellow of AIAA.
D

American Institute of Aeronautics and Astronautics
2
specific power (W/kg). This characteristic leads to fuel cell aircraft that are performance constrained in terms of climb rates, payload capability, takeoff distance and propulsion limited bank angle. Development of even simple models of fuel cell systems requires specialists in electrochemistry, heat transfer, mechatronics, controls, etc. High fidelity parametric models of fuel cells, hydrogen tanks, and balance of plant components that are suitable for conceptual design are simply not available. Fuel cell performance data for validation are most often collected under controlled laboratory operating conditions that vary greatly from what can be expected for systems more applicable to aircraft. These design problems have limited the success and applicability of the few fuel cell powered aircraft that have been proposed and constructed. This paper proposes a methodology for the systematic reduction of design uncertainty during the conceptual and preliminary design process. This method proposes a new means and justification for decomposition of a multidisciplinary design problem into contributing analyses (CA’s). In this effort the decomposition of the design problem is structured so that the contributing analyses mimic the data input and output of model validation experiments. If necessary, experimental data can then be used to estimate the uncertainty of the contributing analysis and can also be used for calibration to improve the fidelity of the contributing analysis. It is also suggested that the multidisciplinary analysis be decomposed to a degree where all outputs of an individual contributing analysis are independent. This reduces the impact of higher order interactions that are not captured in the underlying assumptions of system sensitivity analysis (SSA) and allows for a better estimation of uncertainty. SSA is used to quantify the uncertainty results from uncertainties of the underlying contributing analyses as well as uncertainties in the design variables. Improved fidelity models and validation data is used to incrementally reduce the design uncertainty until an acceptable design point is reached. The impact of uncertainty on the design is traced through the steps of a fuel cell aircraft example design problem. The aircraft performance at the final design point is validated using hardware in the loop testing.
II. Technical Approach
A. Problem Definition The problem that is addressed in this study is the canonical multidisciplinary design and optimization (MDO) problem shown in Figure 1. The design point is specified by a number of design variables that are inputs to a multidisciplinary analysis (MDA) which is capable of analyzing the complex system at the system level. The MDA is decomposed into disciplinary CA’s that are linked together in the form of a design system matrix (DSM). The CA’s can be thought of as “black boxes” that perform a given analysis while the DSM structures how information flows between each of the CA’s. The DSM effectively forms a system of coupled compatibility equations that assure that all values of the CA variables are compatible. The compatibility equations may be solved by various methods but are typically well suited for iterative schemes such as Newton’s method. The performance of the aircraft design is improved by embedding the DSM inside of an optimization routine, which varies input design variables to minimize a cost function (OEC).
Figure 1. Canonical multidisciplinary design and optimization problem structure

American Institute of Aeronautics and Astronautics
3
In general, there are two main sources of uncertainty that lead to uncertainty in the calculation of performance metrics: uncertainty present in the design variables and uncertainty due to the CA’s. The design variables contribute to overall uncertainty because they represent design characteristics that cannot be determined to infinite accuracy. For instance, aircraft wing area is a design variable that is subject to variability due to manufacturing tolerances. The CA’s contain two primary sources of uncertainty. First, CA’s typically involve simplifications and assumptions that result in imperfect models of the design performance. In general, the CA’s are parameterized low fidelity approximations that must compromise accuracy for computational efficiency. For instance, the fuel cell polarization model may not incorporate enough variables to model the fuel cell under all operating conditions. The discrepancies between the model and the actual system performance can be represented as uncertainty in the output of the CA. The second source of uncertainty results from that fact that computer models are deterministic and often cannot accurately capture stochastic variation in the performance of the component. For instance, the performance of fuel cell systems includes a statistical performance variability due to pressure, temperature and humidity changes along the flow fields of the stack [1]. In some cases, numerical noise can also be a source adding to the uncertainty but for most cases, numerical noise is several orders of magnitude smaller than other uncertainty sources. The internal state feedforwards and feedbacks in the DSM have the effect of either nonlinearly increasing or decreasing the uncertainty in the converged design performance.
B. Uncertainty Propagation using System Sensitivity Analysis The propagation of uncertainty through the multidisciplinary analysis is the subject of numerous studies in the context of design for robustness [2-9]. In the simplest case, uncertainty can be propagated through a multidisciplinary analysis using Monte Carlo techniques. Using Monte Carlo, the design variables and CA’s can be assigned an uncertainty component from specified uncertainty distributions. By repeating this process many times, the statistical distribution of the design point can be approximated. The primary disadvantages of Monte Carlo are its high computational cost and the lack of transparency in determining how the total performance uncertainty is related to the uncertainties of the design variable inputs and CA uncertainties. Multidisciplinary analyses for real world problems are nearly always large scale and computationally constrained. Monte Carlo analysis can add orders of magnitude to the computational cost of reaching an error bounded solution. A more practical approach for uncertainty propagation in systems design is via system sensitivity analysis (SSA). The general formulation for the propagation of uncertainty using SSA is summarized in separate works by Gu et al. [2] and McDonald [4]. Gu defines propagated uncertainty as a simple finite deviation ∆y where y is a state variable vector output of the analysis. Gu also defines the bias errors of the CA’s and the precision errors of the input variables as like deviations from their corresponding actual values. McDonald uses a similar formulation to generate an estimate for indeterminate error which is defined as a standard deviation of error. In this paper, McDonald’s formulation for indeterminate error is used to define the propagated uncertainty of the solution. However, the notation is more closely related to the presentation by Gu. As described by Gu, a CA number 1 is represented by the following notation:
( )nyyyxTy ,,,, 2111 K= , (1)
where y is the vector output of the CA, T represent a simulation tool vector, and x is a vector of the design variables. Defining the superscript “true” to represent an exact output such as obtained with a controlled experiment, Eq (1) can be related to an standard deviation term σT1 describing the uncertainty of T with exact (certain) inputs.
( ) 12111 ,,,, TyyyxTT σ±= ntrue
K (2)
Typically, controlled experiments with tight tolerances on the variation of the inputs would allow a designer to estimate σT for a given CA. In multidisciplinary analysis, T is dependent on various inputs y that are calculated by other CA’s. Since these CA’s often also contain their own uncertainty in calculating y, the actual output ytrue will vary from the calculated value of y with propagated uncertainty σy according to Eq (3).
111 yyy σ±=true (3)

American Institute of Aeronautics and Astronautics
4
Calculating the propagated uncertainty is accomplished using SSA. Sobieszczanski-Sobieski defines a global sensitivity equation, Eq (4), that is the basis of SSA [6-9].
[ ][ ] [ ]
∂∂
∂∂∂∂
=
∂∂
−∂∂
−
∂∂
−
∂∂
−
∂∂
−∂∂
−
≡=
−
−
x
T
xTxT
x
y
xyxy
Iy
T
y
Ty
T
IyT
yT
yT
I
LSVGSVLSM
nn
nn
nn
n
n
n
d
d
d
dd
d
MM
K
OM
M
L
2
1
2
1
11
1
21
2
1
2
11
(4)
The Local Sensitivity Matrix (LSM ) shown in Eq. (4) is a matrix of partial derivatives of each CA with respect to all other CA’s in the multidisciplinary analysis. The Local Sensitivity Vector (LSV) contains the partial derivatives of all of the CA’s with respect to the design variables. SSA approximates the Global Sensitivity Vector (GSV) which contains the total derivatives of the CA’s with respect to the design variables, according to Eq. (4). Using SSA, McDonald shows that the total propagated uncertainty can be estimated by Eq. (5)
( ) ( )
+
≈
−
2
22
21
2
2
22
21
21
2
22
21
mnn x
x
x
σ
σσ
σ
σσ
σ
σσ
MMMLSV
T
T
T
LSM
y
y
y
, (5)
where the square of the inverse of the LSM is performed on a term-by-term basis and σx represents the uncertainty in the input variable x. Note that for Eqs (4) and (5), n is the number of CA’s and m is the number of input design variables. Equation (5) essentially states that the total propagated variance is a pythagorean sum of all of the components of variance. By using individual terms of the LSM , the contributions to total propagated variance can be individually calculated. However, it is typically easier for people to understand uncertainty in terms of standard deviation rather than variance. McDonald suggests Eq. (6) as a valuable way to determine these contributions of uncertainty. Note that in Eq. (6), σ can represent either a propagated contribution of uncertainty due a specific CA or the propagated uncertainty due to uncertainty of the inputs.
jmn
ii
mn
ii
j σσ
σσ
∑
∑+
=
+
==
1
1
2
(6)
C. Design System Matrix Decomposition for Validation In order to calculate the uncertainties of the CA’s, we must have some estimate. Typically the estimate comes from controlled experimental validation. However, to make a proper estimate that is useful for SSA, information must flow in terms of inputs and outputs through the CA just as it does in the controlled experiment. By decomposing the problem so that the CA’s input and output structure is similar to the input and output structure of controlled experiments makes replacing the CA with a regression or calibrated model based on experiment much simpler. Although this may seem straightforward, many CA formulations are actually based on computational efficiency and may not have the same structure of information flow as experiments used to estimate uncertainty.

American Institute of Aeronautics and Astronautics
5
In the problem as presented in Figure 1, the design system matrix is decomposed into a few high-level CA’s. Tools are available to further decompose the DSM to minimize feedback and reduce the computational cost of converging the DSM to a design point [10]. The problem is that when the uncertainty associated with a CA must be measured and tracked, the DSM must be decomposed so that information can be passed and uncertainty can be propagated using the same inputs and outputs as the experiment. The structure of the problem as presented in Figure 1 does not intrinsically allow for the replacement of the CA with a tool with lower uncertainty or experimental data with lower uncertainty. As an example of a CA where uncertainty is present in the system, let us consider a multidisciplinary model of a propeller driven aircraft. This very simple model contains two CAs: Propeller Performance CA and Aircraft Performance CA. The Propeller Performance CA contains one equation (7) that describes the relationship between freestream velocity (V), thrust (T), and propeller rotational speed (ω).
( ) ( ) 42
2
,d
TVCC TT
πωρ
ω == (7)
This relationship can be structured in two different ways, depending on the inputs and outputs desired: ),( VTT ω= (8)
or ),( VTωω = . (9)
The Aircraft Performance CA contains the single equation given in Eq. (10).
))(( VDTdt
dVm −= (10)
Assuming that we use the Aircraft Performance CA to calculate conditions for steady level flight, Eq. (10) can be simplified as:
DwCSVVDT 2
2
1)( ρ== (11)
which can be arranged so that )(TVV = .
For a single input, single output system, the DSM can be constructed in two different ways, shown in Figure 2 (a) and (b). In Figure 2 (a), the DSM is constructed so that the input to the Aircraft Performance CA is T and the output is ω. Because this allows the DSM to be structured without feedback of CA output variables, the solution of the design problem can proceed in a computationally efficient manner without iteration. The problem is that if the Propeller Performance CA is known to have some uncertainty associated with its mathematical models, then that uncertainty is difficult to represent in the DSM as shown in Figure 2 (a). A schematic of the information flow in a prototypical validation experiment is shown in Figure 2 (c). In this experiment, a propeller is placed into a wind tunnel and the performance of the propeller is measured. Deterministic values of ω and V are the inputs to the validation experiment and a statistical distribution of T is the output. In order for the uncertainty that is associated with the experimental validation data to be incorporated into the Propeller Performance CA, the Propeller Performance CA must have the same inputs and outputs as the validation experiment. This leads to the DSM that is shown in Figure 2 (b). In this case the DSM must incorporate feedbacks, compromising its computational efficiency. The alternative, of course is to design a much more unconventional and costly validation experiment where the propeller thrust (T) and freestream velocity (V) are held constant and the propeller rotational speed (ω) is measured for its statistical distribution.

American Institute of Aeronautics and Astronautics
6
Figure 2. Comparison of DSM structures for computational efficiency and for experimental validation
For design problems where CA uncertainty is of interest, the DSM must be constructed to allow uncertainty data to be represented in the same way that it is gathered. For design problems where higher fidelity CA’s are available, the low fidelity CA’s must be structured to emulate the data and uncertainty flow of the higher fidelity analyses. This hierarchy is based on the assumption that higher fidelity analyses, including experiments, are generally more costly and less structurally flexible.
D. Degree of Decomposition When using SSA, the degree to which the design problem is decomposed has significance. In many multidisciplinary designs, the analysis is decomposed into CA’s by discipline and many CA’s will return a vector of outputs that are not independently calculated. For example, a typical Propeller Performance CA might have the propeller geometry, rotational speed, and airspeed as inputs and might calculate the generated thrust and power as outputs. In this case, the Propeller Performance CA would likely first calculate the thrust and then simply calculate the available power as the thrust multiplied by the airspeed. In this case, the LSM will not capture the effect that available power is a function of available thrust since they are both outputs of the same CA, and thus no proper partial derivative will be calculated. However, the LSV will change since available power is still a function of the input variables to available thrust and the resulting GSV will be correct. Despite this, when Eq. (5) is calculated, the estimated propagated uncertainty will change since the formulation of Eq. (5) will allow the uncertainty in available power to only be due to the propagated uncertainty in the inputs to the propeller CA and will not capture any uncertainty that may exist in the Propeller Performance CA’s ability to model available thrust. In this case, the better formulation is to decompose the propeller CA into two separate routines. The first could calculate available thrust, and the second CA could calculate available power as a function of available thrust. In this case, the SSA could correctly propagate any uncertainty in the thrust calculation into the available power.
E. Summary In this section we have presented a method for propagating uncertainty through a multidisciplinary analysis.
This method enables the assessment of the sources of uncertainty in a design calculation and allows for the systematic replacement of high uncertainty CA’s with lower uncertainty models or experimentally validated datasets. Decomposition of the DSM into its CA’s must be guided by the requirements to:
• make the CA’s as fundamental as is possible so as to improve the accuracy of the SSA-based uncertainty propagation routines
• reduce signal feedback and improve DSM hierarchy so as to improve the computational efficiency of the design calculation
• invoke compatibility constraints so as to improve the computational efficiency of the design calculation • structure CA’s so that they can be replaced by models or experimental data with associated uncertainty
information.

American Institute of Aeronautics and Astronautics
7
III. Test Case: Design of a Fuel Cell UAV
A. Test Case Description The design of a fuel cell powered UAV will be used as a test case to illustrate the efficacy of the proposed
methodology. The design is limited in scope to aircraft that are small scale (<25kg GTOW), and use a conventional monoplane configuration, polymer electrolyte membrane fuel cells, compressed hydrogen storage, and propeller propulsion. This scope allowed previous research performed on fuel cell UAVs at the Georgia Institute of Technology to be used in the design for better estimating the uncertainty of the CA’s and design variables for the initial iterations of the proposed design method. Many of the CA’s and much of the design algorithm is based on previous fuel cell UAV design work available in references [11] and [12]. An overview of the design process along with a discussion on some of the key CA’s will be presented in this paper, however, many of the details available in the references will not be repeated.
The basic aircraft is a low straight wing monoplane with a wing planform and tail design based on the Georgia Tech fuel cell demonstrator aircraft successfully flown in 2006 [13][14]. Since detailed data including flight test results were available for this aircraft, it allowed for calibrated CA’s dealing with aerodynamics, structures, and weight calculations to be used. The primary difference in the design is in the propulsion system. The propulsion system modeled in this analysis is based on the H-100, H-200, and H-300 convectively cooled PEM fuel cell stacks that were recently commercialized by Horizon Fuel Cells [24] in contrast to the liquid cooled fuel stack used in the Georgia Tech demonstrator aircraft.
The design algorithm is made up of parametric mathematical models of the performance, weight, and geometry of the primary aircraft sub-systems including: hydrogen storage, fuel cell, fuel cell balance of plant, electric motor, propeller, fuselage, and aerodynamics. Models of the structure of the primary stressed components including tail boom, wing spar and hydrogen tank are used to scale structure weight with loading. The performance of the aircraft including calculation of the maximum climb rate is assessed at cruise during each design iteration. The design variables are based mainly on the propulsion system and are given in Table 1. The only non-propulsion based design variable is the wing area which is used to geometrically scale the same wing planform as used in the Georgia Tech demonstrator UAV.
Table 1. Design Variables
Design Variable Description Lower Bound
Upper Bound
Units
Hydrogen Tank Length-to-Diameter Ratio
1 4 m
Hydrogen Tank Radius 0 N/A m
Hydrogen Tank Pressure 0 N/A MPa
Motor Series Number 2 15 -
Number of Motor Winds 1.5 3
Motor Gear Ratio 1 10
Propeller Diameter 0 N/A m
Propeller Pitch 0 N/A m
Planform Wing Area 0 N/A m2 The design objective of this test case is a fuel cell powered UAV of small scale that exhibits >24 hour endurance
in steady level flight. Since the fuel cells considered limit the maximum available fuel cell power to around 300W, the size of the aircraft is naturally limited. As a result, the objective function in the optimization process is based entirely on maximizing the endurance of the aircraft.
The design is subject to a number of performance and physical constraints. Most of these constraints are forced to be satisfied in the CA’s, however a few apply to the overall design and were thus part of the optimization scheme (see Eqs. (13) through (15)). In addition, the side constraints applying to the design variables (see Table 1) also constrain the design space. The overall optimization problem is summarized in Eqs. (12) through (15).
Minimize: ( )R
EnduranceCruisexOEC
κ −= (12)

American Institute of Aeronautics and Astronautics
8
Subject to: Climb Rate, 75≥cV (m/min) (13)
Propeller Mach Number, 85.0≤tipM (14)
Reynolds Number 000,200Re≥ (15)
B. Contributing Analyses The design algorithm is decomposed into 45 CA’s. Between the 45 CA’s, 108 variable values are calculated and
many of these variables are shared by multiple routines. In addition, 28 input values are also used by the CA’s although only 9 of these 28 are actually design variables. Because of space limitations, not all of the CA’s and their sources of uncertainty will be described in detail. Instead, some CA’s will be described so as to communicate the level of detail present in the conceptual design.
1. Hydrogen Tank Mass and Dimensions Contributing Analysis For this study, hydrogen is stored on board the aircraft as compressed hydrogen gas within a composite-
overwrapped, aluminum-lined cylinder. The hydrogen storage system model provides a low-fidelity, conceptual design of the hydrogen tank using empirical data and simple mechanics of materials methods. Considerations such as fatigue life, shape optimization, winding schemes, etc., are not considered.
The hydrogen tank is of cylindrical geometry with hemispherical end caps. The tank is subjected only to loading due to the uniform pressure difference between the internal hydrogen pressure and the external atmospheric pressure. The aluminum tank liner is assumed to be of constant thickness (tliner) and does not contribute to the strength of the tank, but does contribute to its weight. In general, composite hydrogen tanks require metallic or polymeric liners to reduce the hydrogen leak rate [15]. The thickness of the composite overwrap is specified to resist the hoop stress and the axial stress due to the pressure loads. The total composite thickness is equal to:
( ) ( )
−+−=maxcompmaxcomp
total 2ττatmatm PPrPPr
FOSt , (16)
The composite thickness is assumed to be constant over the surface of the tank. The total tank mass is calculated using the formula:
2regcompositelinertank )()1( Hmount mmmmfm +++⋅+= (17)
A summary of the design variables, CA outputs and relevant constants are provided in Table 2, Table 3 and Table 4. The uncertainty listed in Table 2 represents the uncertainty that is present in the design variables. The uncertainty listed in Table 2 represents the uncertainty that is present in the CA outputs due to both modeling errors and product variability. The uncertainties in the CA outputs are primarily due to error in the model, variability in the dimensions of the tanks as manufactured is approximately 0.6% and variability in tank mass is 2.1%. Figure 3 shows the comparison between the predicted CA outputs and the actual hydrogen tank characteristics as provided by a commercial composite overwrapped cylinder manufacturer [21].
Table 2. Design variables input to the Hydrogen Tank Mass and Dimensions CA
Design Variable Range of Values Uncertainty
Hydrogen Tank Internal Radius > 0 cm 0% Hydrogen Tank Length to Diameter
Ratio 1.0 - 4.0 0%
Hydrogen Storage Pressure 0 - 70MPa 0%

American Institute of Aeronautics and Astronautics
9
Table 3. Outputs from the Hydrogen Tank Mass and Dimensions CA
CA Output Variable Uncertainty
Hydrogen Tank Mass 16.9% Hydrogen Tank Wet Volume 6.6% Hydrogen Tank Length 7.1% Hydrogen Tank Diameter 1.8%
Table 4. Constants used for the Hydrogen Tank Mass and Dimensions CA
Design Parameters Value Notes
Composite Overwrap Maximum Stress (τmaxcomp) 1.9GPa Kevlar-49/epoxy at 55%
translation [16][17] Liner Density (ρliner) 2700kg/m3 Aluminum 6061 [18] Regulator Mass (mreg) 0.35kg [13] Composite Overwrap Density (ρcomp) 1530kg/m3 [16] Liner Thickness (tliner) 0.762mm Aluminum 6061 [17][19] Factor of Safety to Yield (FOS) 4.0 Tank Mounting/Bosses/Tubing Mass Fraction (fmount) 50%
Figure 3. Actual by predicted plots for the hydrogen tank mass and dimensions contributing analysis
2. Propeller Coefficient Contributing Analysis The fuel cell UAV is propelled by an electric motor driven propeller of fixed pitch. Goldstein’s vortex theory of
screw propellers using the Betz condition provides a parametric model of the propeller performance as a function of the propeller design variables: propeller pitch (p) and propeller diameter (d). This propeller model assumes that the propeller is stiff, of a uniform airfoil shape, low Mach number, and two-bladed.
The vortex theory of screw propellers is based on a lifting line approximation of the surface of the propeller. This implies that the propeller is approximated by a lifting surface about which there is bound circulation. The circulation is associated with vorticity bound to the propeller and free vorticity that is continuously shed from the propeller in the form of a helical sheet. Propeller performance coefficients can be calculated by iteratively solving for the angle of the induced flow on each propeller section according to the methods detailed in [22].
The outputs of the propeller coefficient CA are the dimensionless thrust (CT) and power coefficients (CP):
( ) 42
2 d
TCT
πωρ
= (18)
( ) 53
2 d
TCP
πωρ
ω= (19)

American Institute of Aeronautics and Astronautics
10
Table 5, Table 6 and Table 7 show the design variable inputs, CA inputs and outputs from the propeller coefficient CA. The uncertainty associated with the outputs of the CA is calculated based on comparisons between the calculated performance and actual wind-tunnel performance of three propellers. Aleatory uncertainty is assumed to be 0% because, for instance. the effect of manufacturing variability in terms of the values of the CA output variables is negligible [23]. An actual versus predicted comparison for propeller coefficient CA is shown in Figure 4. The errors in the CA are modeled as an epistemic uncertainty.
Table 5. Design variables input to the Propeller Coefficient CA
Design Variable Range of Values Uncertainty
Number of Propeller Blades > 1 0%
Table 6. Inputs to the Propeller Coefficient CA from other analyses
CA Input Variable Uncertainty
Pitch to Diameter Ratio (Kc) Inherited Advance Ratio (J) Inherited
Table 7. Outputs from the Propeller Coefficient CA
CA Output Variable Uncertainty
Thrust Coefficient (CT) 9.3% Power Coefficient (CP) 10.4%
Figure 4. Actual by predicted plots for the Propeller Coefficient CA
3. Hydrogen Flow Rate Contributing Analysis The flow rate of hydrogen that is consumed by the fuel cell is calculated using the electrochemical equivalence
between the hydrogen flow rate and the fuel cell current. The inputs to the Hydrogen Flow Rate CA are the design
variables number of fuel cells in the stack (cellsn ) and hydrogen utilization (utilη ) and the CA input fuel cell current
(I). By Faraday’s Law, the hydrogen flow rate:
util
cells
H
HH F
InMWV
ηρ 22
2
2=& (7)
Table 8, Table 9 and Table 10 show the design variables, CA inputs, and contributing analysis outputs from the hydrogen flow rate contributing analysis. Uncertainty in the hydrogen flow rate output from the CA is calculated from comparison to fuel cell hardware. The uncertainty in the CA is due to both aleatory and epistemic uncertainty. The aleatory uncertainty in the experimentally measured moment to moment hydrogen flow rate is 1.4% and the epistemic error in the model is 5.3%. The total uncertainty is calculated as the Pythagorean sum of the component errors. It is notable that the Hydrogen Flow Rate CA under-predicts the hydrogen flow rate, perhaps because it does not include effects such as leaks, and hydrogen crossover.

American Institute of Aeronautics and Astronautics
11
Table 8. Design variables input to the Hydrogen Flow Rate CA
Design Variable Range of Values Uncertainty
Number of Fuel Cells > 1 0%
Hydrogen Utilization 0 < utilη < 1 0%
Table 9. Inputs to the Hydrogen Flow Rate CAfrom other analyses
CA Input Variable Uncertainty
Fuel Cell Current Inherited
Table 10. Outputs from the Hydrogen Flow Rate CA
CA Output Variable Uncertainty
Hydrogen Flow Rate 5.5%
Figure 5. Actual by predicted plots for the Hydrogen Flow Rate CA
C. Design System Matrix (DSM) All 45 CAs for the fuel cell airplane design problem are connected into the DSM shown in Figure 6. The
problem contains 108 CA variables and 28 design variables. The DSM is primarily upper triagonal, with only a few feedback signals. For solution purposes, the feedback loops are eliminated by defining compatibility constraints and introducing guess design variables. A converged solution of the DSM for a given design variable input vector x is then found using Newton’s method.

American Institute of Aeronautics and Astronautics
12
12
34
65
78
9
1817
1615
1413
1211
10
1920
2122
2324
2526
2728
2930
3132
3334
3536
3938
37
44
4140
4243
45
CA Number CA Name 1 Fuel Cell Mass and Dimensions2 H2 Tank Mass and Dimensions3 Redlich Kwong Equation of State4 Hydrogen Mass5 Hydrogen Tank Mass6 Propeller Mass Relation7 FC System Mass8 Fuselage Mass and Dimensions9 Wing and Tail Mass10 Aircraft Mass11 Propeller Interference 12 Fuselage Drag 13 Wing and Tail Lift Drag14 Airplane Lift Drag15 Steady Level Flight16 Propeller Non-Dimentionalization at Climb17 Propeller Coefficients at Climb18 Propeller Torque at Climb19 Motor Speed at Climb20 FC Polarization at Climb21 Aux Current at Climb22 Stack Current at Climb23 BOP Power at Climb24 Power Summations at Climb25 Efficiency Calculations at Climb26 Propeller Non-Dimentionalization27 Propeller Coefficients28 Propeller Speed29 Propeller Torque30 Motor Current 31 FC Polarization32 Aux Current33 Stack Current34 BOP Power35 Power Summations36 Efficiency Calculations 37 Climb Rate38 Propeller Tip Mach No39 Reynolds Number 40 Hydrogen Flow Rate41 Cruise Endurance42 Hydrogen Flow Rate at Climb43 Cruise Range44 Cruise Endurance at Climb45 Optimization Cost Function
Figure 6. Design System Matrix for the example fuel cell design problem
IV. Design Process As occurs in many conceptual designs, there are large sources of uncertainty in the design analysis. The design
of the fuel cell UAV is initially dominated by uncertainty in the design point. For this study, the goal of the design process is to choose CA’s for validation that can reduce the uncertainty of the design point at low cost, while still achieving design objectives.
At each point in the design process, the design of the fuel cell powered aircraft is deterministically optimized for endurance within the design constraints. The uncertainty analysis is then performed and the sources of uncertainty in the design are analyzed. Based on the results of the uncertainty analysis, a component of the analysis is chosen for the design, purchased, tested and an experimentally validated model is constructed. Although the accuracy of the design is improved, the scalability of the CA is often lost. The design of the fuel cell powered aircraft is then again deterministically optimized for endurance within the design constraints with the new CA integrated into the DSM. The process is repeated in order to design an experimentally validated powertrain for a long-endurance fuel cell airplane.
A. Conceptual Design In the first step of conceptual design, three sizes (100W, 200W and 300W) of portable fuel cells were screened
for effectiveness. The fuel cell models represent the specified performance of commercially available portable fuel cell stacks [24]. For each stack, the design of the fuel cell powered aircraft is deterministically optimized for endurance within the design constraints. The results showed that the 300W fuel cell stack is capable of greater endurance than the other fuel cell stacks, while still meeting the performance constraints. This result was expected as the 300W system showed the best overall specific power of the three fuel cells.
The 300 W fuel cell stack was chosen, its manufacturer specified performance was modeled as a CA and the design process continued. A SSA was performed at the deterministically optimum design point for the 300 W fuel cell stack. The results are shown in Figure 7 and Table 11. The contributing analyses (CA’s) and design variables (DV’s) that contribute the first 90% of the design metric uncertainty are listed. The remaining 10% of design metric uncertainty from all other CA’s and DV’s is grouped under Remaining Sources. As might be expected of a

American Institute of Aeronautics and Astronautics
13
conceptual design, the total uncertainty associated with the design metrics is very high. The design cruise endurance of the aircraft at conceptual design is 20.7±8.6 hrs and the design climb rate is 74.9±21.9 m/min. The two largest sources of uncertainty in both the cruise endurance and the climb rate are the motor CA (Motor Current CA) and the fuel cell CA’s (BOP Power CA, FC Polarization CA).
A decision was made based on these results to purchase and test the 300W fuel cell stack in order to move towards detail design and reduce the design uncertainty.
Table 11. Data summary for initial optimization
Design Variable Value Performance Metric Value CA/Design Variable
Uncertainty
Hydrogen Tank Radius
0.073m Cruise Endurance 20.67hr Motor Current CA at Cruise
26%
Hydrogen Tank Length to Diameter Ratio
3.02 Maximum Climb Rate
74.87m/min Balance of Plant Power CA
81%
Hydrogen Tank Pressure
35.92MPa Cruise Fuel Cell Power
141W Fuel Cell Polarization CA
11%
Motor Voltage Constant
52.31rpm/V Maximum Fuel Cell Power
342W Hydrogen Tank Mass CA
17%
Propeller Diameter 0.66m Wing Loading 12.4kg/m2 Propeller Coeff. CP CA
9%
Propeller Pitch 0.64m Thrust to Weight Ratio
0.13 Propeller Coeff. CT CA
10%
Wing Area 0.99m2 Motor Io DV 48%
Figure 7. Uncertainty results for conceptual design for (a) aircraft cruise endurance design metric and (b) maximum climb rate design metric
B. Design with Experimentally Validated Fuel Cell Model Experimental laboratory testing of the 300 W fuel cell stack allowed for a significant reduction in the uncertainty
from the fuel cell related CA’s. Uncertainty in the calculation of fuel cell voltage at cruise went from ±18% to ±1.8%. Uncertainty in the calculation of fuel cell balance of plant power went from ±81% to ±1%. Figure 8 shows the initial fuel cell polarization model as well as the higher-fidelity model constructed from the test data.
With the new fuel cell data, the design of the fuel cell powered aircraft was deterministically optimized for endurance within the design constraints. The design cruise endurance of the aircraft at this point is 15.8±4.9 hrs and the design climb rate is 73.1±15.6 m/min (see Table 12).

American Institute of Aeronautics and Astronautics
14
A SSA was performed at the optimum design point for the fuel cell stack with experimental data. The results are shown in Figure 9. The reduction in uncertainty that comes with the validated fuel cell model reduces the uncertainty in the design metrics at the optimal design point. The reduction in error from the new fuel cell model reduces the performance of the aircraft from a deterministic value of 20.7 hrs to 15.8 hrs. The deterministic climb rate of the aircraft is virtually unchanged because it is treated as a constraint by the optimizer.
Figure 8. Initial fuel cell model (left) and calibrated fuel cell model (right)
Table 12. Results for optimization with high fidelity fuel cell model
Design Variable Value Performance Metric Value CA/Design Variable
Uncertainty
Hydrogen Tank Radius
0.060m Cruise Endurance 15.76hr Motor Current CA at Cruise
26%
Hydrogen Tank Length to Diameter Ratio
2.81 Maximum Climb Rate
73.09m/min Balance of Plant Power CA
1%
Hydrogen Tank Pressure
39.76MPa Cruise Fuel Cell Power
95W Fuel Cell Polarization CA
2%
Motor Voltage Constant
76.53rpm/V Maximum Fuel Cell Power
276W Hydrogen Tank Mass CA
17%
Propeller Diameter 0.58m Wing Loading 8.2kg/m2 Propeller Coeff. CP CA
9%
Propeller Pitch 0.37m Thrust to Weight Ratio
0.15 Propeller Coeff. CT CA
10%
Wing Area 1.28m2 Motor Io DV 48%

American Institute of Aeronautics and Astronautics
15
Figure 9. Uncertainty results for design with an experimentally validated fuel cell model for (a) aircraft cruise endurance design metric and (b) maximum climb rate design metric
C. Design with Experimentally Validated Electric Motor Model Based on these results, an electric motor was chosen that has the same characteristics as the optimal motor for
this design point. The electric motor was chosen from the catalogue of a small brushless motor manufacturer [25]. The motor was tested over its range using a laboratory electric motor dynamometer. The results were fit using a 3 hidden node, multilayer perceptron neural network. The root mean squared error between the neural network meta-model and 126 experimental tests was 2.5%. This represented a significant reduction in the error associated with the scalable electric motor model, especially at low torque (see Figure 10).
With the new electric motor model, the design of the fuel cell powered aircraft was deterministically optimized for endurance within the design constraints. The design cruise endurance of the aircraft at this point improved to 20.7±2.7 hrs and the design climb rate is 74.8±23.7 m/min (see Table 13)
A SSA was performed at the optimum design point and the results are shown in Figure 11. Most notably, the uncertainty regarding the cruise endurance has been reduced by the introduction of the high fidelity electric motor model. The primary sources of uncertainty in the design model at this design point are the propeller model (Propeller Coeff. CA’s) and the hydrogen tank CA’s (H2 Tank Dimension CA and H2 Tank Mass CA). The decision was made to finalize the hydrogen tank so as to finalize the conceptual design.
Figure 10. Original electric motor model (right) and neural network model (left)
Table 13. Results for optimization with high fidelity fuel cell and motor models

American Institute of Aeronautics and Astronautics
16
Design Variable Value Performance Metric Value CA/Design Variable
Uncertainty
Hydrogen Tank Radius
0.078m Cruise Endurance 20.73hr Motor Current CA at Cruise
3%
Hydrogen Tank Length to Diameter Ratio
3.75 Maximum Climb Rate
74.83m/min Balance of Plant Power CA
1%
Hydrogen Tank Pressure
22.7MPa Cruise Fuel Cell Power
135W Fuel Cell Polarization CA
2%
Motor Voltage Constant
77.61rpm/V Maximum Fuel Cell Power
276W Hydrogen Tank Mass CA
17%
Propeller Diameter 0.59m Wing Loading 13.0kg/m2 Propeller Coeff. CP CA
9%
Propeller Pitch 0.53m Thrust to Weight Ratio
0.13 Propeller Coeff. CT CA
10%
Wing Area 0.94m2 Motor Io DV 0%
Figure 11. Uncertainty results for design with an experimentally validated electric motor model for (a) aircraft cruise endurance design metric and (b) maximum climb rate design metric
D. Final Conceptual Design Point A hydrogen tank (Carleton Technologies PN6109) was chosen from its manufacturer’s specifications so as to be
as close in size, capacity and weight to the optimal tank as chosen by the optimizer. The remaining uncertainty in the hydrogen tank dimensions (0.6%) and weight (2.1%) are due to manufacturing variability. With the new hydrogen tank model, the design of the fuel cell powered aircraft was deterministically optimized for endurance within the design constraints. The design cruise endurance of the aircraft at this point improved to 22.5±2.1 hrs and the design climb rate is 72.6±15.3 m/min (see Table 14).
Validation of this final point in the conceptual design was performed using a benchtop hardware in the loop simulator. The physical, assembled fuel cell UAV powertrain including the fuel cell, balance of plant, and electric motor are tested at the cruise condition derived from the conceptual design exercise. This experiment assumes that the rest of the aircraft performs at its deterministically optimized condition. The cruise endurance of the fuel cell UAV as bench tested is 23.2±1.2 hrs, including a standard deviation of experimental uncertainty. The bench test show that the fuel cell UAV design as implemented is within the experimental uncertainty of the 24 hour cruise endurance design goal.
American Institute of Aeronautics and Astronautics
17
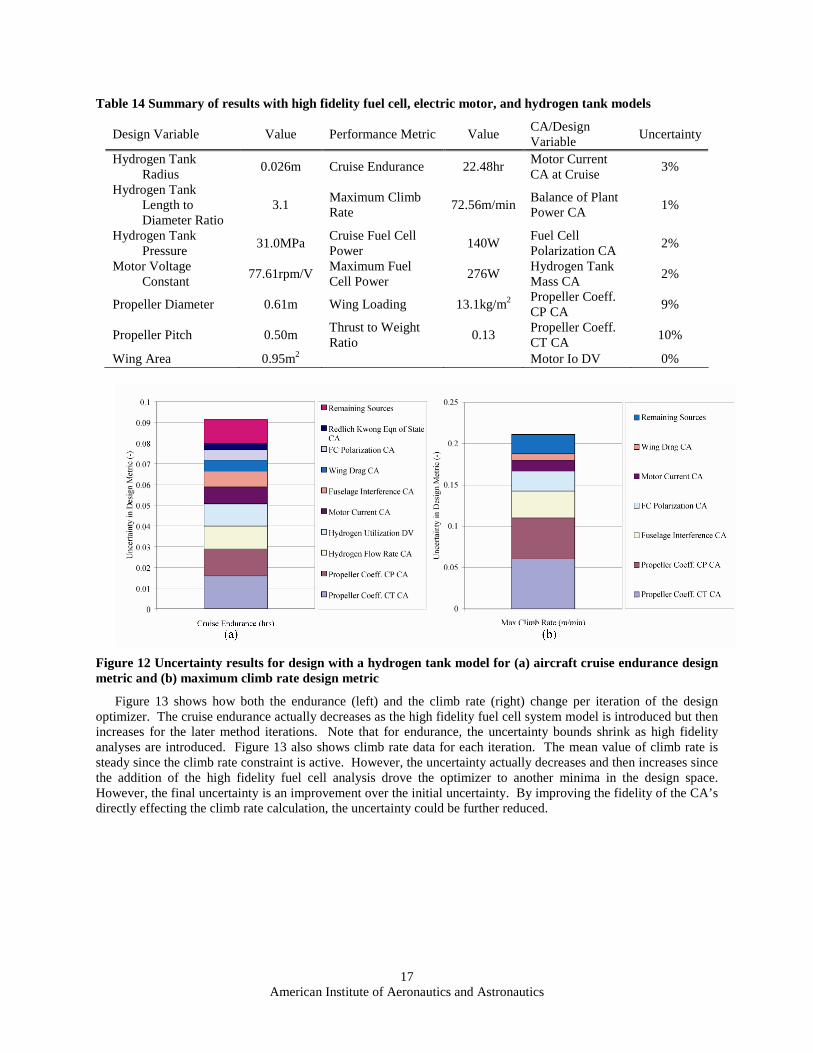
Table 14 Summary of results with high fidelity fuel cell, electric motor, and hydrogen tank models
Design Variable Value Performance Metric Value CA/Design Variable
Uncertainty
Hydrogen Tank Radius
0.026m Cruise Endurance 22.48hr Motor Current CA at Cruise
3%
Hydrogen Tank Length to Diameter Ratio
3.1 Maximum Climb Rate
72.56m/min Balance of Plant Power CA
1%
Hydrogen Tank Pressure
31.0MPa Cruise Fuel Cell Power
140W Fuel Cell Polarization CA
2%
Motor Voltage Constant
77.61rpm/V Maximum Fuel Cell Power
276W Hydrogen Tank Mass CA
2%
Propeller Diameter 0.61m Wing Loading 13.1kg/m2 Propeller Coeff. CP CA
9%
Propeller Pitch 0.50m Thrust to Weight Ratio
0.13 Propeller Coeff. CT CA
10%
Wing Area 0.95m2 Motor Io DV 0%
Figure 12 Uncertainty results for design with a hydrogen tank model for (a) aircraft cruise endurance design metric and (b) maximum climb rate design metric
Figure 13 shows how both the endurance (left) and the climb rate (right) change per iteration of the design optimizer. The cruise endurance actually decreases as the high fidelity fuel cell system model is introduced but then increases for the later method iterations. Note that for endurance, the uncertainty bounds shrink as high fidelity analyses are introduced. Figure 13 also shows climb rate data for each iteration. The mean value of climb rate is steady since the climb rate constraint is active. However, the uncertainty actually decreases and then increases since the addition of the high fidelity fuel cell analysis drove the optimizer to another minima in the design space. However, the final uncertainty is an improvement over the initial uncertainty. By improving the fidelity of the CA’s directly effecting the climb rate calculation, the uncertainty could be further reduced.

American Institute of Aeronautics and Astronautics
18
Figure 13. Summary of endurance and climb rate values for each iteration
V. Conclusions This paper has presented a method for structuring MDO problems so as to allow for accurate characterization of design uncertainty and to allow for sequential validation of component contributing analyses. Implementing these MDO techniques with SSA improved the design of a fuel cell UAV by allowing the designers to select areas in which to improve fidelity of the analysis through experimental validation. Implementing the MDO process with SSA repeatedly allowed a new, lower uncertainty optimum to be derived based on the higher fidelity design tools. Based on this optimum, new validation data sets were gathered and the fidelity of the design tool was sequentially improved. The main disadvantage with this approach was that many of the experiments could not be used to make the high fidelity model scalable. Thus, with each introduction of a high fidelity model, a certain degree of design freedom is sacrificed to achieve a more certain design result. However, since success can only be measured if the aircraft meets its own performance constraints, in many cases sacrificing design freedom to reduce the design uncertainty is beneficial. For the design example of a fuel cell UAV, a large scale design problem was solved to illustrate the characteristics of the coupled MDO/SSA technique with validated component models. Through successive design decisions, the uncertainty associated with the design of the aircraft was reduced by experimentally validating the component CA’s. The experimentally validated performance of the fuel cell powerplant and powertrain in the final conceptual design stage is within experimental uncertainty of the design goal of a 24 hour cruise endurance.
Acknowledgments This research was funded in part by the NASA University Research Engineering Technology Institute grant to
the Georgia Institute of Technology. The authors would like to thank the many research engineers at the Georgia Tech Research Institute and the Aerospace Systems Design Laboratory that provided valuable expertise and guidance over the course of the project. The authors would also like to thank Joshua Nelson and L. Scott Miller of the Wichita State University Department of Aerospace Engineering for performing propeller testing and data reduction.
References [1] Schilter, A.L, McKay, D.A., Stefanopoulou, A.G. “Parameterization of fuel cell stack voltage: Issues on sensitivity, cell-to-
cell variation, and transient response.” The 4th International Conference on Fuel Cell Science, Engineering and Technology, June 19-21, 2006, Irvine, CA.
[2] Gu, X, Renaud, J.E., Batill, S.M. “An Investigation of Multidisciplinary Design Subject to Uncertainty,” AIAA 98-4747, 1998.
[3] Oberkampf, W.L, Deland, S.M, Rutherford, B.M., Diegert, K.V., Alvin, K.F. “Estimation of Total Uncertainty in Modeling and Simulation,” Sandia Report SAND200-0824, 2000.
[4] McDonald, R., Error Propagation in Metamodeling for a Fidelity Tradeoff Capability in Complex Systems Design, PhD Thesis, Georgia Institute of Technology, Atlanta, Georgia, 2006.

American Institute of Aeronautics and Astronautics
19
[5] Hajela, P., Bloebaum "Application of Global Sensitivity Equation in Multidisciplinary Aircraft Synthesis,” Journal of Aircraft, Vol. 27(12) Dec 1990.
[6] Sobieszczanski-Sobieski "Sensitivity Analysis and Multidisciplinary Optimization for Aircraft Design: Recent Advances and Results,” Journal of Aircraft Vol. 27(12) Dec 1990.
[7] Sobieszczanski-Sobieski "A System Approach to Aircraft Optimization,” NASA TM-104074, March 1991. [8] Sobieszczanski-Sobieski "Sensitivity of Complex, Internally Coupled Systems.” AIAA Journal Vol. 28(1) Jan 1990. [9] Sobieszczanski-Sobieski "On the Sensitivity of Complex, Internally Coupled Systems,” AIAA 88-2378 April 1988. [10] Rogers, J.L. “De-Maid – A Design Manager’s Aid for Intelligent Decomposition, Users Guide,” NASA TM 101575, 1989. [11] T.H. Bradley, B.A. Moffitt, D. Parekh, D. Mavris, “Validated Modeling and Synthesis of Medium-Scale PEM Fuel Cell
Aircraft,” in 4th International ASME Conference on Fuel Cell Science, Engineering and Technology, Irvine, California, June 18-21 2006.
[12] B.A. Moffitt, T.H. Bradley, D.E. Parekh, D.N. Mavris, “Design Space Exploration of Small-Scale PEM Fuel Cell Unmanned Aerial Vehicle,” in 6th AIAA Aviation Technology, Integration and Operations Conference, Wichita, Kansas, , September 25-27, 2006, AIAA 2006-7701.
[13] Bradley, T. H., Moffitt, B., Thomas, R. W., Mavris, D. and Parekh, D. E., “Test Results for a Fuel Cell-Powered Demonstration Aircraft,” in Society of Automotive Engineers Power System Conference, November 7-9, 2006, New Orleans. 2006-01-3092, Nov 2006.
[14] Bradley, T. H., Moffitt, B., Thomas, R., Parekh, D. E. and Mavris, D., “Flight Test Results for a Fuel Cell-Powered Demonstration Aircraft,” AIAA 2007-0032, Jan 2007.
[15] Tam, W. H. and Griffen, P. S. “Design and Manufacture of a Composite Overwrapped Pressurant Tank Assembly,” AIAA 2002-4349, 2002.
[16] Colozza, A. J. “Hydrogen Storage for Aircraft Applications Overview,” NASA/CR—2002-211867, 2002. [17] Lark, R. F. “Recent Advances in Lightweight, Filament-Wound Composite Pressure Vessel Technology,” in Energy
Technology Conference, Houston, TX, September 18-23, 1977. [18] Shigley, J., Mischke, C. and Budynas, R. Mechanical Engineering Design. 7th Edition, McGraw-Hill, New York. [19] Kulkarni, S. V., Zweben, C. H. Composites in Pressure Vessels and Piping. American Society of Mechanical Engineers,
New York, 1977. [20] Harris, J., Grande, R. and Higgins, M., “Ultralight Propellant Tank for NASA Space Technology 5,” AIAA 2003-4608,
2003. [21] Grande, R., Composite Pressure Vessel Product List, Carleton Technologies Inc., 2007. [22] Phillips, W. F., Mechanics of Flight, John Wiley and Sons, Inc., Hoboken, New Jersey, 2004. [23] M. Merchant, L.S. Miller, “Propeller Performance Measurement for Low Reynolds Number UAV Applications,” in 44th
AIAA Aerospace Sciences Meeting and Exhibit, Reno, Nevada, January 9-12, 2006, AIAA 2006-1127, Jan 2006. [24] Horizon Fuel Cell Technologies, H-Series Specification Sheet, http://www.horizonfuelcell.com/file/H-Series.pdf, accessed
9/1/07. [25] Neu Motors, 1910 Specification Sheet, http://www.neumotors.com, accessed 9/1/07.


![Predicting State Uncertainty for GNSS-based UAV Path ...web.stanford.edu/~gracegao/publications/conference...of [2] present rapidly-exploring random belief trees (RRBT), which implements](https://img.pdfslide.net/doc/110x75/60ead01b0f91d96a0e78c02c/predicting-state-uncertainty-for-gnss-based-uav-path-web-gracegaopublicationsconference.jpg)