Embed Size (px)
Citation preview
Title Reduction Behavior of FeO Compact IncludingMolten Slag
Author(s)Nakamoto, Masashi; Ono-Nakazato, Hideki;Kawabata, Hirotoshi; Usui, Tateo; Tanaka,Toshihiro
Citation ISIJ International. 44(12) P.2100-P.2104
Issue Date 2004
Text Version publisher
URL http://hdl.handle.net/11094/26415
DOI 10.2355/isijinternational.44.2100
rights © 2004 ISIJ

1. Introduction
The innovation of ironmaking process is required forsolving energy and environment problems all over theworld, such as the reduction of CO2 emission and the de-crease of quality of iron ores, etc. In Japan, the project onthe innovation of ironmaking process by blast furnace forthe purpose of halving energy consumption and minimizingenvironmental influence has been promoted by Ministry ofEducation, Culture, Sports, Science, and Technology.1)
In this project, the studies of lowering the melting tem-perature of slag have been conducted by some re-searchers.2–8) It is recognized commonly that the concentra-tion of FeO in iron ore and sinter influences the melting be-havior of slag. Hasegawa and Iwase2) indicate that the betterunderstanding of the reduction of iron ore is important inthe “softening and melting zone” of blast furnaces. Hino etal.3) report that the dripping behavior of the primary melt inthe cohesive zone of blast furnace is affected by FeO con-tent. On the other hand, Naito9) indicates that the reducibili-ty of iron ore at high temperature, especially from 1 273 Kto the temperature at the top of the cohesive zone, is signifi-cant for blast furnace process. The reduction behaviorchanges greatly in this temperature range because a moltenslag closes the pores in iron ore. Therefore, many research-es10–14) on the reducibility of iron ore and sinter have beencarried out at the temperature which molten slag exists.However, the effect of the pore blockage on the reducibilityis not so clear since most of reduction experiments havebeen conducted using the sinter or pellet, which have het-erogeneous structures and phases, and the pore blockageswere accompanied by phase changes when the slag in thesinter or pellet melted.
We investigated the effect of pore blockage on the reduc-tion behavior of the FeO compact containing the molten
FeO–SiO2 slag, which coexists with solid FeO.15) In thissystem, the phase changes don’t occur because the moltenFeO–SiO2 slag and solid FeO coexist in equilibrium state.We found the reduction rate of the FeO compact was de-creased by the prevention of the diffusion of reducing gasdue to the pore blockage by the penetration of the moltenslag. But we should also examine the effect of other slagcomponents on the reducibility because the sinter and ironore containing various oxides are used in a conventionalblast furnace.
In the present study, we investigated the effect of poreblockage on the reduction behavior of the FeO compactcontaining molten slag in FeO–SiO2–CaO system. Twotypes of slag, FeO–SiO2 slag (FS) and FeO–SiO2–CaO slag(FSC), which coexist with solid FeO in equilibrium state,were used (see Fig. 1).16) Penetration experiment was con-ducted in order to examine the state of pore blockage,which affects the reduction behavior. Then, the reducibilityof the FeO compact containing the slag was evaluatedthrough the difference of the physical properties of moltenslag.
2. Experimental
2.1. Reduction Experiment
2.1.1. Slag Preparation
The slag was prepared from the reagent grade CaCO3,Fe, Fe2O3 and SiO2. CaCO3 powder was calcined for 5 h at1 273 K to make CaO. The mixed powder, which corre-sponds to a given composition of molten slag shown inTable 1, was melted in an Fe crucible for 1 h under argonatmosphere (400 cc/min (s.t.p.)). The molten slag coexistswith solid FeO at 1 500 K, as shown in Fig. 1.16) These ox-ides are equilibrated with metallic iron. Then, the moltenslag in the Fe crucible was quenched in iced water, and the
ISIJ International, Vol. 44 (2004), No. 12, pp. 2100–2104
© 2004 ISIJ 2100
Reduction Behavior of FeO Compact Including Molten Slag
Masashi NAKAMOTO, Hideki ONO-NAKAZATO,1) Hirotoshi KAWABATA,1) Tateo USUI1)
and Toshihiro TANAKA1)
Graduate Student, Osaka University, 2-1 Yamadaoka, Suita, Osaka 565-0871 Japan.1) Graduate School of Engineering, Osaka University, 2-1 Yamadaoka, Suita, Osaka 565-0871 Japan.
(Received on May 6, 2004; accepted in final form on October 8, 2004)
FeO compact including molten slag was reduced with H2 at 1 500 K, and the effect of the slag penetrationin the reducibility was investigated. Two kinds of molten slag, which coexist with solid FeO, inFeO–SiO2–CaO systems were used and the influence of the physical properties of molten slag, especiallyviscosity, on the reducibility was investigated. The penetrations of the molten slag with a low viscosity tothe grain boundaries produce the spaces, which are useful as the pass of the reduction gas, in the inter-spaces between the grains. Then, the reduction rate of the FeO compact containing molten slag with a lowviscosity is higher than that of the FeO compact containing molten slag with a high viscosity.
KEY WORDS: ironmaking; iron oxide; reducibility; molten slag; penetration; viscosity.

slag was crushed and sieved to 0.3–1 mm.
2.1.2 Sample Preparation
Schematic illustration of procedure for sample prepara-tion is shown in Fig. 2. The Fe2O3 powder, heated at1 273 K for 3 h, was sieved to under 45 mm. The Fe2O3 com-pact added with the slag grains produced as mentionedabove was prepared by mixing weighed quantities of them,as shown in Table 2, and by pressing the mixture at100 MPa for 3 min in a cylindrical mould (see Fig. 2 (a)).The compact is a cylinder of about 15 mm in diameter and7 mm in height. The sample was reduced to FeO at 1 273 Kin fixed 60%H2–40%CO2 gas mixture (see Fig. 2 (b)). Thephases of the sample cooled under argon flushing(400 cc/min (s.t.p.)) were analyzed by an X-ray diffraction(XRD). Figure 3 shows the XRD pattern for the samplewithout slag. As expected, it is confirmed that all of theXRD peaks correspond to FeO. Although the XRD peaks ofFe are also found, the intensity of these peaks is weak. Thetypical cross section of the sample observed by a laser-mi-croscope is shown in Fig. 4. White part is FeO, and it ispredicted black part is pore. The interspaces among grains
and grain boundaries cannot be identified in Fig. 4. It is dif-ficult to consider that the interspaces among grains andgrain boundaries disappear in the sintering by taking ac-
ISIJ International, Vol. 44 (2004), No. 12
2101 © 2004 ISIJ
Table 1. Chemical composition of slag. Table 2. Composition of samples, Fe2O3 and slag grain (FS orFSC), and the estimated FeO: molten slag (FS orFSC) at 1 500 K.
Fig. 1. Phase diagrams for FeO–SiO2–CaO system. (a) Given by Muan and Osborn16) and (b) at 1 500 K.
Fig. 2. Schematic illustration of procedure for sample prepara-tion.
Fig. 3. X-ray diffraction pattern for the sample without slag.
Fig. 4. Typical cross section of the sample.

count of the temperature and the heating time in samplepreparation. Accordingly, it is considered that these partswere closed at the polishing due to the softness of sample.The sample in Fig. 2(b) was heated up to 1500 K at a heat-ing rate of 10 K/min and was kept under the same conditionwith an equilibration time of 30 min (see Fig. 2(c)).Assuming that Fe2O3 transforms FeO under this condition,the amount of molten slag is estimated as 0, 0.6, 1.5, 2.6,5.4 mass% as tabulated in Table 2. Then, the sample wascooled under argon flushing (400 cc/min (s.t.p.)). The XRDpattern and the cross-sectional view of the sample withoutslag are the same as those of the sample in Fig. 2(b). On theother hand, slag can be observed in the case of the samplecontaining slag, as shown in Fig. 5. It is found that this slagexists in the interspaces among grains and grain boundariesbecause the size of the region surrounded by this slag issimilar to Fe2O3 grain size (�45 mm) used for the produc-tion of compact.
2.1.3. Procedure
The experimental setup used for reduction experiment isillustrated in Fig. 6. After the sample was heated up to1 500 K at a heating rate of 10 K/min in N2 flow (400 cc/min(s.t.p.)), the sample was kept for an equilibration time of30 min. The reduction was started by introducing hydrogen(1 000 cc/min (s.t.p.)). In order to assess the kinetics of re-duction reaction, thermogravimetric analysis was per-formed using a thermobalance. The sensitivity of the bal-
ance was in the order of 2 mg.
2.2. Penetration Experiment
Schematic illustration of penetration experiment isshown in Fig. 7. Slag FS or FSC tablet of 0.04 g was placedon the Fe2O3 compact of 4 g (see Fig. 7(a)). Both of the slagand the compact were prepared as same as the methodshown in Sec. 2.1.1. The sample was reduced to FeO at1 273 K in 60%H2–40%CO2 gas mixture (see Fig. 7(b)). Itwas heated up to 1 500 K at a heating rate of 10 K/min andwas kept in 60%H2–40%CO2 gas mixture for 30 min (seeFig. 7(c)). Here, the slag tablet melted, and the molten slagpenetrated to the bulk of the FeO compact. The cross sec-tions of the compact were observed by a laser-microscope.
3. Results and Discussion
3.1. Reduction Experiment
Figures 8 and 9 show the reduction curves obtained inthe reduction experiments with samples containing slag FS
ISIJ International, Vol. 44 (2004), No. 12
© 2004 ISIJ 2102
Fig. 5. Cross section of the sample containing slag.
Fig. 6. Schematic cross section of experimental apparatus.
Fig. 7. Schematic illustration of penetration experiment.
Fig. 8. Reduction behavior of FeO compact with molten slag FS.100% H2, flow rate: 1 000 cc/min (s.t.p.), temperature:1 500 K.
Fig. 9. Reduction behavior of FeO compact with molten slagFSC. 100% H2, flow rate: 1 000 cc/min (s.t.p.), tempera-ture: 1 500 K.

and FSC, respectively. The reduction rate of both samplesdecreases as the amount of slag increases. These decreasesof the reduction rate are explained from the pore blockagedue to the penetration phenomena of molten slag.15) The re-duction behaviors of two samples are different, and the re-duction rate of the sample with slag FSC is lower than thatof the sample with slag FS. This difference of the reductionbehaviors is considered to be attributable to the state of thepenetration, i.e. pore blockage, of molten slag since the twotypes of molten slag coexist with solid FeO, and don’t reactwith other phases. However, it is difficult to examine thestate of penetration of the sample used for the reduction ex-periment because of the random distribution of slag grainsin the sample. Then, the penetration experiments were car-ried out.
3.2. Penetration Experiment
The cross-sectional views of the samples, to which slagFS and FSC penetrate, are shown in Figs. 10 and 11, re-
spectively. The slag exists in the interspaces among thegrains and in the grain boundary in both samples. However,there is no FSC slag in the bottom part of sample.Moreover, the area of slag FSC exists in the interspacesamong the grains is larger than that of slag FS. On the con-trary, the area of the slag FSC exists in the grain boundaryis less than that of slag FS. These are considered to be dueto the difference of penetration behavior between slag FSand slag FSC.
The equation of penetration is expressed as follows17):
.........................(1)
where l is the penetration length of the liquid, Kr�/(2k2), ris the average pore radius, k is a constant introduced to ac-count for the tortuosity of the capillary pores, gLV is the sur-face tension of the liquid, q is the contact angle between theliquid and solid, hL is the viscosity of the liquid and t is thetime of penetration. Since Kr is the coefficient which is re-lated to the structure of FeO compact and all compacts areproduced by the same method, Kr is constant and the pene-tration behavior is dependent on the physical properties ofmolten slag, such as the contact angle between molten slagand FeO, the surface tension and viscosity of the moltenslag.
The contact angle between molten slag FS and FeO isconsidered to be similar to that between molten slag FSCand FeO because the wettability of the two types of moltenslag, which coexist with solid FeO, to solid FeO is verygood. The surface tension18,19) and viscosity20) forFeO–SiO2–CaO system are shown in Figs. 12 and 13, re-spectively. The composition dependence of viscosity ismuch larger than that of surface tension. Therefore, thepenetration behavior of molten slag is mainly dependent onthe viscosity.
However, to our knowledge, there are no data of the vis-cosity under the present experimental composition and tem-perature. Then, we estimated the viscosity of molten slagby using our viscosity model.5) The calculated results of theviscosity for FeO–SiO2–CaO system are shown in Fig. 14.Since the viscosity of molten slag FSC is about four timesas high as that of molten slag FS, the penetration rate ofslag FSC is much slower than that of slag FS. As shown in
d l
dt
K( )2
� r LV
L
cosγ θη
ISIJ International, Vol. 44 (2004), No. 12
2103 © 2004 ISIJ
Fig. 10. Microscopic observation of the sample, to which moltenslag FS penetrates, in penetration experiment. (a)Schematic representation of sample, (b) image at the toppart, (c) image at the middle part, (d) image at the bot-tom part.
Fig. 11. Microscopic observation of the sample, to which moltenslag FSC penetrates, in penetration experiment. (a)Schematic representation of sample, (b) image at the toppart, (c) image at the middle part, (d) image at the bot-tom part.
Fig. 12. Surface tension gL (mN/m) for FeO–SiO2–CaO systemat 1 673 K. Solid line: Kozakevitch,18) broken line:Kawai et al.,19) dotted line: liquidus at 1 673 K.
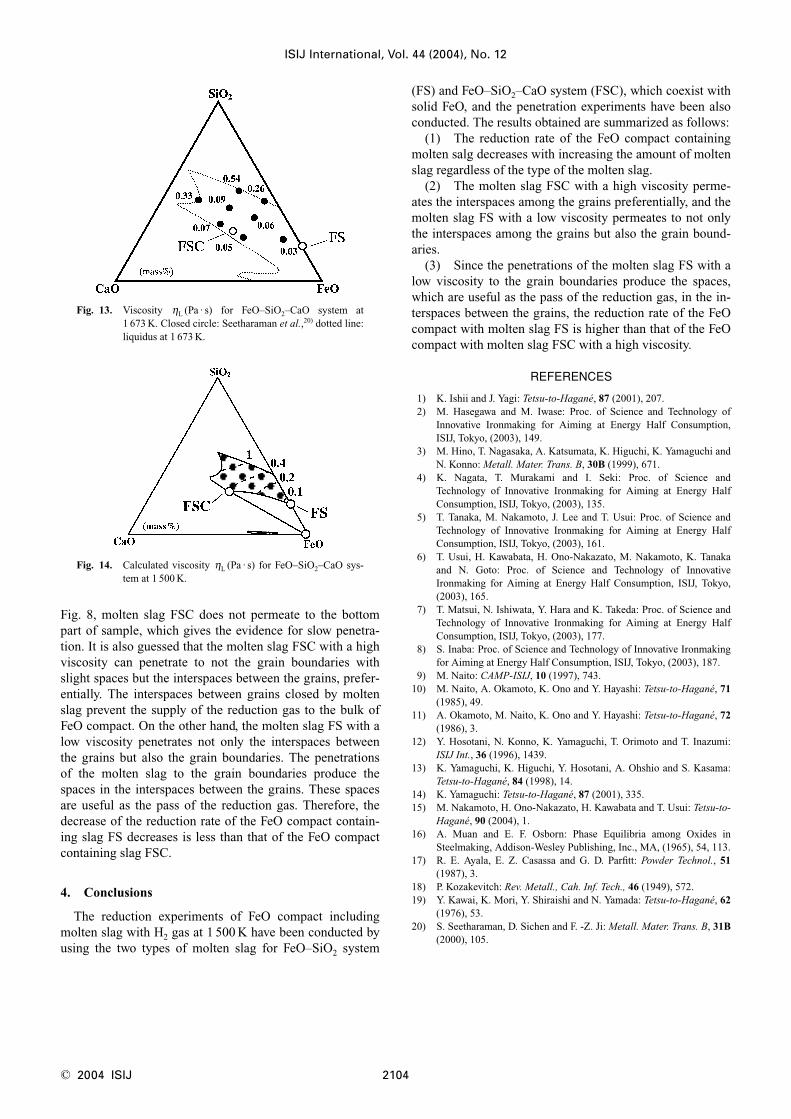
Fig. 8, molten slag FSC does not permeate to the bottompart of sample, which gives the evidence for slow penetra-tion. It is also guessed that the molten slag FSC with a highviscosity can penetrate to not the grain boundaries withslight spaces but the interspaces between the grains, prefer-entially. The interspaces between grains closed by moltenslag prevent the supply of the reduction gas to the bulk ofFeO compact. On the other hand, the molten slag FS with alow viscosity penetrates not only the interspaces betweenthe grains but also the grain boundaries. The penetrationsof the molten slag to the grain boundaries produce thespaces in the interspaces between the grains. These spacesare useful as the pass of the reduction gas. Therefore, thedecrease of the reduction rate of the FeO compact contain-ing slag FS decreases is less than that of the FeO compactcontaining slag FSC.
4. Conclusions
The reduction experiments of FeO compact includingmolten slag with H2 gas at 1 500 K have been conducted byusing the two types of molten slag for FeO–SiO2 system
(FS) and FeO–SiO2–CaO system (FSC), which coexist withsolid FeO, and the penetration experiments have been alsoconducted. The results obtained are summarized as follows:
(1) The reduction rate of the FeO compact containingmolten salg decreases with increasing the amount of moltenslag regardless of the type of the molten slag.
(2) The molten slag FSC with a high viscosity perme-ates the interspaces among the grains preferentially, and themolten slag FS with a low viscosity permeates to not onlythe interspaces among the grains but also the grain bound-aries.
(3) Since the penetrations of the molten slag FS with alow viscosity to the grain boundaries produce the spaces,which are useful as the pass of the reduction gas, in the in-terspaces between the grains, the reduction rate of the FeOcompact with molten slag FS is higher than that of the FeOcompact with molten slag FSC with a high viscosity.
REFERENCES
1) K. Ishii and J. Yagi: Tetsu-to-Hagané, 87 (2001), 207.2) M. Hasegawa and M. Iwase: Proc. of Science and Technology of
Innovative Ironmaking for Aiming at Energy Half Consumption,ISIJ, Tokyo, (2003), 149.
3) M. Hino, T. Nagasaka, A. Katsumata, K. Higuchi, K. Yamaguchi andN. Konno: Metall. Mater. Trans. B, 30B (1999), 671.
4) K. Nagata, T. Murakami and I. Seki: Proc. of Science andTechnology of Innovative Ironmaking for Aiming at Energy HalfConsumption, ISIJ, Tokyo, (2003), 135.
5) T. Tanaka, M. Nakamoto, J. Lee and T. Usui: Proc. of Science andTechnology of Innovative Ironmaking for Aiming at Energy HalfConsumption, ISIJ, Tokyo, (2003), 161.
6) T. Usui, H. Kawabata, H. Ono-Nakazato, M. Nakamoto, K. Tanakaand N. Goto: Proc. of Science and Technology of InnovativeIronmaking for Aiming at Energy Half Consumption, ISIJ, Tokyo,(2003), 165.
7) T. Matsui, N. Ishiwata, Y. Hara and K. Takeda: Proc. of Science andTechnology of Innovative Ironmaking for Aiming at Energy HalfConsumption, ISIJ, Tokyo, (2003), 177.
8) S. Inaba: Proc. of Science and Technology of Innovative Ironmakingfor Aiming at Energy Half Consumption, ISIJ, Tokyo, (2003), 187.
9) M. Naito: CAMP-ISIJ, 10 (1997), 743.10) M. Naito, A. Okamoto, K. Ono and Y. Hayashi: Tetsu-to-Hagané, 71
(1985), 49.11) A. Okamoto, M. Naito, K. Ono and Y. Hayashi: Tetsu-to-Hagané, 72
(1986), 3.12) Y. Hosotani, N. Konno, K. Yamaguchi, T. Orimoto and T. Inazumi:
ISIJ Int., 36 (1996), 1439.13) K. Yamaguchi, K. Higuchi, Y. Hosotani, A. Ohshio and S. Kasama:
Tetsu-to-Hagané, 84 (1998), 14.14) K. Yamaguchi: Tetsu-to-Hagané, 87 (2001), 335.15) M. Nakamoto, H. Ono-Nakazato, H. Kawabata and T. Usui: Tetsu-to-
Hagané, 90 (2004), 1.16) A. Muan and E. F. Osborn: Phase Equilibria among Oxides in
Steelmaking, Addison-Wesley Publishing, Inc., MA, (1965), 54, 113.17) R. E. Ayala, E. Z. Casassa and G. D. Parfitt: Powder Technol., 51
(1987), 3.18) P. Kozakevitch: Rev. Metall., Cah. Inf. Tech., 46 (1949), 572.19) Y. Kawai, K. Mori, Y. Shiraishi and N. Yamada: Tetsu-to-Hagané, 62
(1976), 53.20) S. Seetharaman, D. Sichen and F. -Z. Ji: Metall. Mater. Trans. B, 31B
(2000), 105.
ISIJ International, Vol. 44 (2004), No. 12
© 2004 ISIJ 2104
Fig. 13. Viscosity hL (Pa · s) for FeO–SiO2–CaO system at1 673 K. Closed circle: Seetharaman et al.,20) dotted line:liquidus at 1 673 K.
Fig. 14. Calculated viscosity hL (Pa · s) for FeO–SiO2–CaO sys-tem at 1 500 K.