Embed Size (px)
Citation preview

Reduction of Green Sand Emissions by a Minimum of 25% - A Case Study
22nd EH&S Conference
August 2010
Nashville Tennessee

Vision of the Future

Discussion Points
� Seacoal reduction and/or elimination
– Improved economics
– Reduced emission characteristics

Core/Mold Make Organic
2
%
Melting Organic
4
% Melting Metallic
3%
PCS Metallic
1%
PCS Organic
90
% PCS - 90%
Melting Metallics 3%
PCS Metallic 1%
Core/Mold Making Organics 2%
Melting Organic 4%
CERP Data

600 F Heat Zone: Sodium Bentonite and
Fireclay unaffected Calcium Bentonite
partially calcined, carbons remain.
Mold Metal Interface: All bonding materials altered.
Clays Calcined, Carbons converted to Ash.
1200 F Heat Zone: Sodium Bentonite and
Fireclay partially calcined Calcium Bentonite
Calcined, Carbons converted to “Fixed
Carbons” (coking materials).
Molding sand
properties and
materials not
altered in the
remaining
prepared sand.

Cross Section of an Iron Mold


Sources of Emissions
Casting
Molding sand
Core
Emissions from core
binders and additives
Emissions from organic
moulding sand additives

Test Apparatus at University of Freiburg

Smoke Comparison
Preblend with
Processed Carbon

Smoke Elimination in Foundry

CERP Test Results
Analyte Name
Reference
(5% Seacoal
Mix)
Average
No Seacoal
(with
Processed
Carbon)
Average
Percent
Change from
Test
Reference
Emission Indicators
TGOC as Propane 3.3541 0.7720 -77
HC as Hexane 0.4015 0.1335 -67
Sum of Target Organic
Analytes 0.4271 0.0767 -82
Sum of Target Organic
HAPs 0.3390 0.0642 -81
Sum of Target POMs 0.0197 0.0014 -93

Foundry LOI Data
LOI (1800°F)
0
1
2
3
4
5
6
7
8
1/4
/20
05
1/1
8/2
00
5
2/1
/20
05
2/1
5/2
00
5
3/1
/20
05
3/1
5/2
00
5
3/2
9/2
00
5
4/1
2/2
00
5
4/2
6/2
00
5
5/1
0/2
00
5
5/2
4/2
00
5
6/7
/20
05
6/2
1/2
00
5
7/5
/20
05
7/1
9/2
00
5
8/2
/20
05
8/1
6/2
00
5
8/3
0/2
00
5
9/1
3/2
00
5
9/2
7/2
00
5
10
/11
/20
05
10
/25
/20
05
11
/8/2
00
5
11
/22
/20
05
12
/6/2
00
5
12
/20
/20
05
1/3
/20
06
1/1
7/2
00
6
1/3
1/2
00
6
2/1
4/2
00
6
2/2
8/2
00
6
3/1
4/2
00
6
3/2
8/2
00
6
4/1
1/2
00
6
4/2
5/2
00
6
5/9
/20
06
5/2
3/2
00
6
6/6
/20
06
Date
% LOI
LOI
Linear (LOI)

Foundry Test Data
LOI (I3 Line): Daily Sand Tests
1.0
2.0
3.0
11/2/2009
11/5/2009
11/10/2009
11/16/2009
11/20/2009
11/30/2009
12/4/2009
12/9/2009
12/14/2009
12/18/2009
1/4/2010
1/7/2010
1/11/2010
1/15/2010
1/20/2010
1/26/2010
1/31/2010
2/4/2010
2/17/2010
2/20/2010
2/23/2010
2/25/2010
3/1/2010
3/4/2010
3/9/2010
3/12/2010
3/18/2010
3/29/2010
4/5/2010
4/8/2010
4/14/2010
1800 F LOI

Introduction of Seacoal Elimination
6.831.0525.74206.5525.20-Average 2007
5.740.5222.95206.5725.04191.702007
7.921.5828.52206.5325.35189.322007
3.400.5215.43128.6520.92-Average 2008
3.140.5214.13116.1520.93191.132008
3.660.5216.73141.1520.91191.292008
[dm3/kg][g]
XyleneEthylobenzeneTolueneBenzene
Emission of gases [mg/kg green sand]
Volume of gasesWeight of
sampleSample

Reduction in Gas Volume in the Mold
0
0,1
0,2
0,3
0,4
0,5
0,6
0,7
0,8
0,9
1
0 10 20 30 40 50 60 70
Time, s
Gas evolution rate (cm
3/gs)
CO-H1
CO-H2

Coking Characteristic of Seacoal
SOURCE: Hill and Griffith Company

Expansion Defect
S R
1
2
3
R = Rat Tail
S = Scab SOURCE: AFS International Atlas of Casting Defects
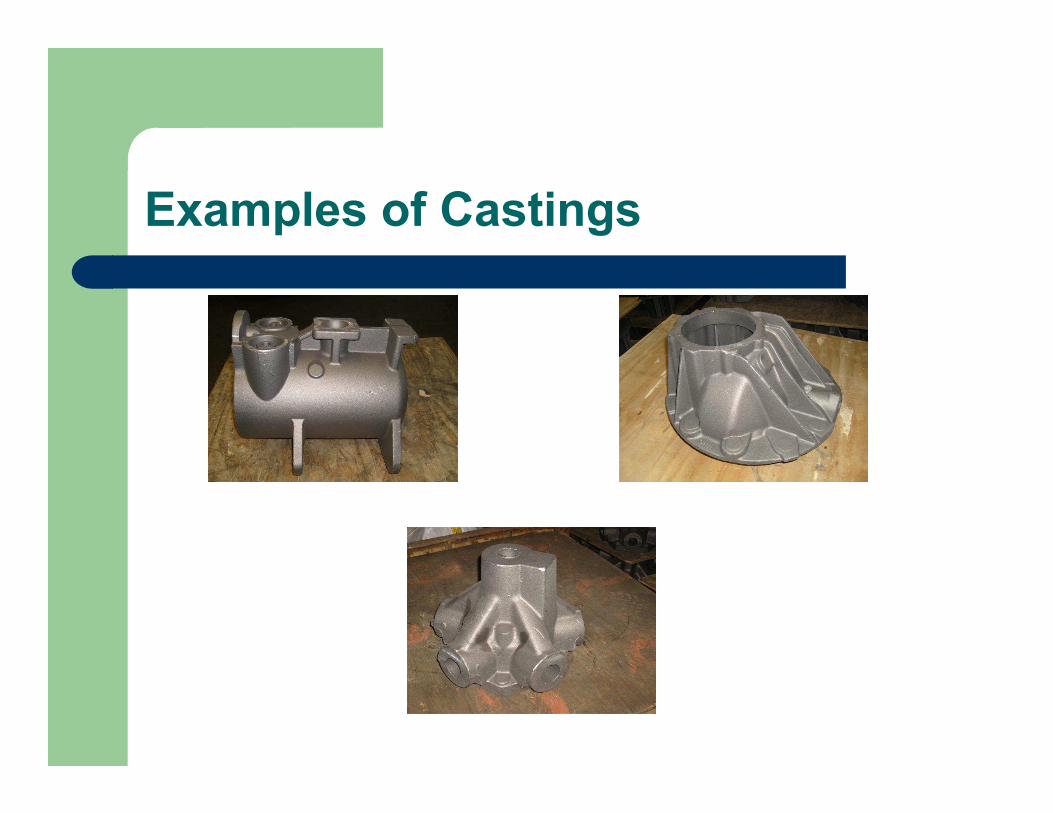
Examples of Castings

Summary
� Reducing and/or eliminating seacoal will reduce
the material cost in green sand. (Economic
Advantage)
� Seacoal reduction or elimination will reduce the
emission characteristics of green sand.
(Environmental Advantage)
� Foundries can make good castings with seacoal
reduction or elimination techniques.

Questions and Answers