Embed Size (px)
Citation preview
Redwoods Community College District Eureka, California
FINANCIAL STATEMENTS AND SUPPLEMENTARY INFORMATION WITH INDEPENDENT AUDITORS’ REPORTS
June 30, 2016
Redwoods Community College District TABLE OF CONTENTS June 30, 2016
Page Number
Independent Auditors’ Report 1
FINANCIAL SECTION
Required Supplementary Information Management’s Discussion and Analysis 5
Basic Financial Statements
Statement of Net Position 14
Statement of Revenues, Expenses, and Changes in Net Position 16
Statement of Cash Flows 17
Notes to the Financial Statements 19
Required Supplementary Information
Schedule of District’s Proportionate Share of the Net Pension Liability – California State Teachers’ Retirement System 48
Schedule of District Contributions ‐ California State Teachers’ Retirement System 49
Schedule of District’s Proportionate Share of the Net Pension Liability – California Public Employees’ Retirement System 50
Schedule of District Contributions – California Public Employees’ Retirement System 51
Schedule of Funding Progress for Other Postemployment Benefits 52
Note to the Required Supplementary Information 53
OTHER SUPPLEMENTARY INFORMATION SECTION
Organization Structure 55
Schedule of Workload Measures for State General Apportionment 56
Schedule of Expenditures of Federal Awards 57
Schedule of Expenditures of State Awards 58
Redwoods Community College District TABLE OF CONTENTS June 30, 2016
Page Number
Reconciliation of Annual Financial and Budget Report (Form CCFS‐311) With Audited Financial Statements 59
Reconciliation of 50% Law Calculation 61
Reconciliation of Education Protection Account Expenditures 63
Combining Balance Sheet – District Funds Included in the Reporting Entity 64
Combining Statement of Revenues, Expenditures/Expenses, and Changes in Fund Equity – District Funds Included in the Reporting Entity 68
Reconciliation of Fund Equity to Net Position 72
Reconciliation of Change in Fund Equity to Change in Net Position 73
Notes to the Supplementary Information 74
OTHER REPORTS SECTION
Independent Auditors’ Report on Internal Control Over Financial Reporting and on Compliance and Other Matters Based on an Audit of Financial Statements Performed in Accordance With Government Auditing Standards 77
Independent Auditors’ Report on Compliance For Each Major Federal Program and on Internal Control Over Compliance Required by the Uniform Guidance 79
Independent Auditors’ Report on State Compliance 82
FINDINGS AND QUESTIONED COSTS SECTION
Schedule of Findings and Questioned Costs 86
Corrective Action Plan 91
Summary Schedule of Prior Audit Findings 92
Page 1
INDEPENDENT AUDITORS’ REPORT
To the Board of Trustees Redwoods Community College District Eureka, California
Report on the Financial Statements
We have audited the accompanying financial statements of the business‐type activities and the discretely presented component unit of Redwoods Community College District (the District), as of and for the year ended June 30, 2016; and the related notes to the financial statements, which collectively comprise the District’s basic financial statements as listed in the table of contents.
Management’s Responsibility for the Financial Statements
Management is responsible for the preparation and fair presentation of these financial statements in accordance with accounting principles generally accepted in the United States of America; this includes the design, implementation, and maintenance of internal control relevant to the preparation and fair presentation of financial statements that are free from material misstatement, whether due to fraud or error.
Auditors’ Responsibility
Our responsibility is to express opinions on these financial statements based on our audit. We conducted our audit in accordance with auditing standards generally accepted in the United States of America and the standards applicable to financial audits contained in Government Auditing Standards, issued by the Comptroller General of the United States. Those standards require that we plan and perform the audit to obtain reasonable assurance about whether the financial statements are free of material misstatement.
An audit involves performing procedures to obtain audit evidence about the amounts and disclosures in the financial statements. The procedures selected depend on the auditors’ judgment, including the assessment of the risks of material misstatement of the financial statements, whether due to fraud or error. In making those risk assessments, the auditor considers internal control relevant to the District’s preparation and fair presentation of the financial statements in order to design audit procedures that are appropriate in the circumstances, but not for the purpose of expressing an opinion on the effectiveness of the District’s internal control. Accordingly, we express no such opinion. An audit also includes evaluating the appropriateness of accounting policies used and the reasonableness of significant accounting estimates made by management, as well as evaluating the overall presentation of the financial statements.
We believe that the audit evidence we have obtained is sufficient and appropriate to provide a basis for our audit opinions.
Page 2
INDEPENDENT AUDITORS’ REPORT (Continued)
Opinions
In our opinion, the financial statements referred to above present fairly, in all material respects, the respective financial position of the business‐type activities and the discretely presented component unit of the District as of June 30, 2016, and the respective changes in financial position and cash flows thereof for the year then ended in accordance with accounting principles generally accepted in the United States of America.
Other Matters
Required Supplementary Information Accounting principles generally accepted in the United States of America require that the management’s discussion and analysis on pages 5 through 13 and the required supplementary information on pages 48 to 52 be presented to supplement the basic financial statements. Such information, although not a part of the basic financial statements, is required by the Governmental Accounting Standards Board who considers it to be an essential part of financial reporting for placing the basic financial statements in an appropriate operational, economic, or historical context. We have applied certain limited procedures to the required supplementary information in accordance with auditing standards generally accepted in the United States of America, which consisted of inquiries of management about the methods of preparing the information and comparing the information for consistency with management’s responses to our inquiries, the basic financial statements, and other knowledge we obtained during our audit of the basic financial statements. We do not express an opinion or provide any assurance on the information because the limited procedures do not provide us with sufficient evidence to express an opinion or provide any assurance.
Other Information Our audit was conducted for the purpose of forming opinions on the financial statements that collectively comprise the District’s basic financial statements. The accompanying supplementary information on pages 56 to 73 and the schedule of expenditures of federal awards, as required by Title 2 U.S. Code of Federal Regulations (CRF) Part 200, Uniform Administrative Requirements, Cost Principles and Audit Requirements for Federal Awards, are presented for purposes of additional analysis and are not a required part of the basic financial statements.
Such information is the responsibility of management and was derived from, and relates directly to, the underlying accounting and other records used to prepare the basic financial statements. Such information has been subjected to the auditing procedures applied in the audit of the financial statements and certain additional procedures, including comparing and reconciling such information directly to the underlying accounting and other records used to prepare the financial statements, or to the financial statements themselves, and other additional procedures in accordance with auditing standards generally accepted in the United States of America. In our opinion, the information on pages 56 to 73 and the schedule of expenditures of federal awards are fairly stated, in all material respects, in relation to the financial statements as a whole.
Page 3
INDEPENDENT AUDITORS’ REPORT (Continued)
The organization structure has not been subjected to the auditing procedures applied in the audit of the basic financial statements and, accordingly, we do not express an opinion or provide any assurance on it.
Other Reporting Required by Government Auditing Standards
In accordance with Government Auditing Standards, we have also issued our report dated April 4, 2017, on our consideration of the District’s internal control over financial reporting and on our tests of its compliance with certain provisions of laws, regulations, contracts, grant agreements, and other matters. The purpose of that report is to describe the scope of our testing of internal control over financial reporting and compliance, and the results of that testing, and not to provide an opinion on internal control over financial reporting or on compliance. That report is an integral part of an audit performed in accordance with Government Auditing Standards in considering the District’s internal control over financial reporting and compliance.
April 4, 2017 Redding, California

FINANCIAL SECTION
Redwoods Community College District MANAGEMENT’S DISCUSSION AND ANALYSIS
Page 5
INTRODUCTION
As required by generally accepted accounting principles, the annual report consists of three basic financial statements that provide information on Redwoods Community College District (the District) as a whole: the statement of net position; the statement of revenues, expenses, and changes in net position; and the statement of cash flows. The information provided in the management’s discussion and analysis is based on the District’s basic financial statements and includes all funds except the College of the Redwoods Foundation. Each statement will be discussed separately. Under the business‐type activities model of financial reporting, a single entity‐wide statement is required to report financial activity for all funds of the District.
During fiscal years 2015‐16 and 2014‐15, the unrestricted net position or fund balance for the general fund exceeded the California Community Colleges Chancellor’s Office (Chancellor’s Office) minimum prudent unrestricted fund balance guideline of 5%. By June 30, 2016, the ending fund balance increased to 6.4%.
ATTENDANCE HIGHLIGHTS
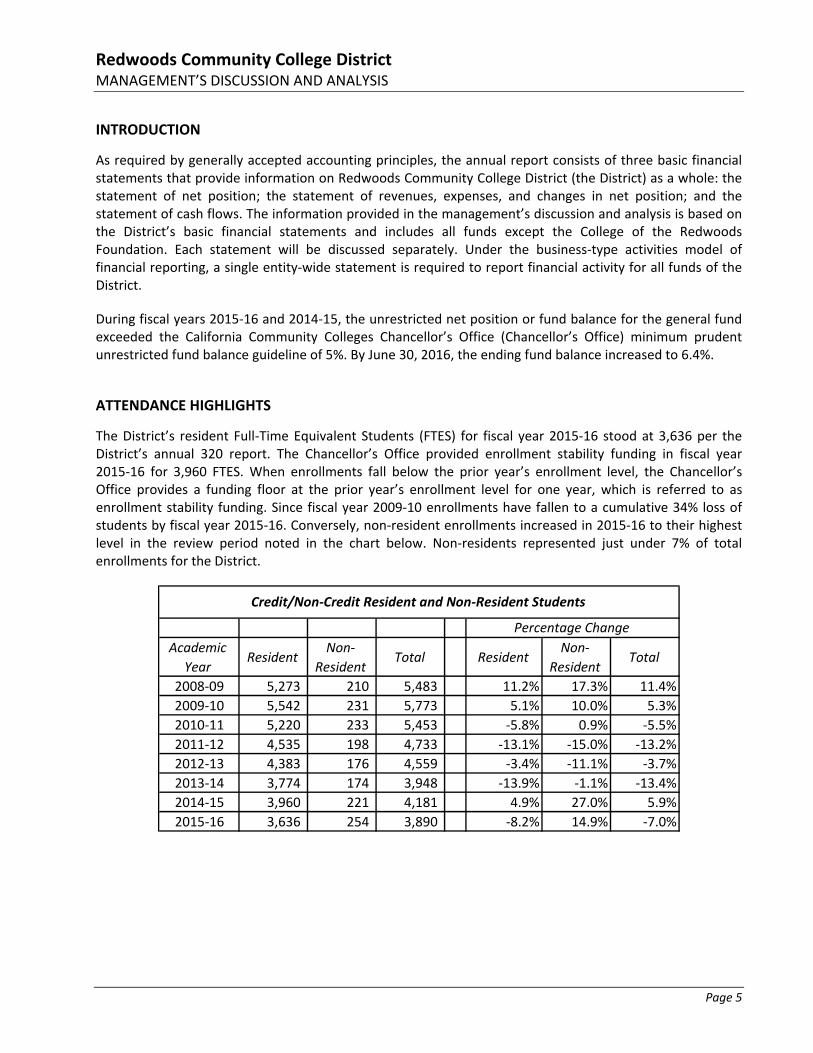
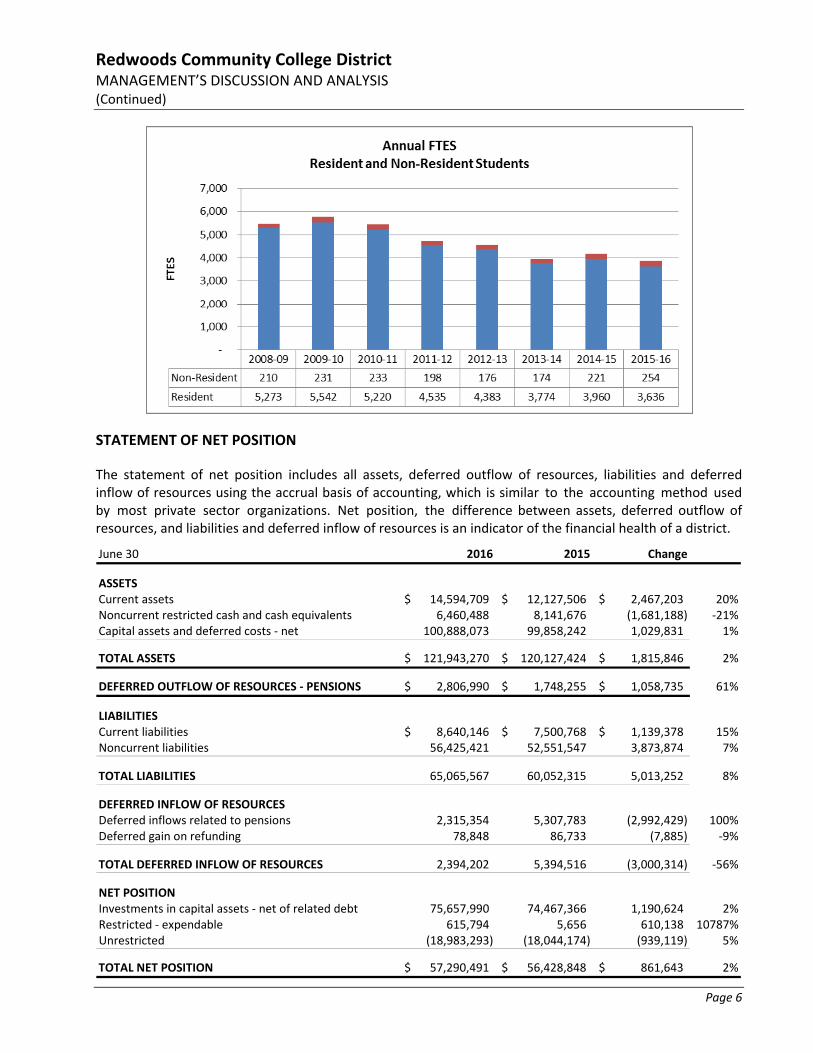
The District’s resident Full‐Time Equivalent Students (FTES) for fiscal year 2015‐16 stood at 3,636 per the District’s annual 320 report. The Chancellor’s Office provided enrollment stability funding in fiscal year 2015‐16 for 3,960 FTES. When enrollments fall below the prior year’s enrollment level, the Chancellor’s Office provides a funding floor at the prior year’s enrollment level for one year, which is referred to as enrollment stability funding. Since fiscal year 2009‐10 enrollments have fallen to a cumulative 34% loss of students by fiscal year 2015‐16. Conversely, non‐resident enrollments increased in 2015‐16 to their highest level in the review period noted in the chart below. Non‐residents represented just under 7% of total enrollments for the District.
Academic
YearResident
Non‐
ResidentTotal Resident
Non‐
ResidentTotal
2008‐09 5,273 210 5,483 11.2% 17.3% 11.4%
2009‐10 5,542 231 5,773 5.1% 10.0% 5.3%
2010‐11 5,220 233 5,453 ‐5.8% 0.9% ‐5.5%
2011‐12 4,535 198 4,733 ‐13.1% ‐15.0% ‐13.2%
2012‐13 4,383 176 4,559 ‐3.4% ‐11.1% ‐3.7%
2013‐14 3,774 174 3,948 ‐13.9% ‐1.1% ‐13.4%
2014‐15 3,960 221 4,181 4.9% 27.0% 5.9%
2015‐16 3,636 254 3,890 ‐8.2% 14.9% ‐7.0%
Credit/Non‐Credit Resident and Non‐Resident Students
Percentage Change
Redwoods Community College District MANAGEMENT’S DISCUSSION AND ANALYSIS (Continued)
Page 6
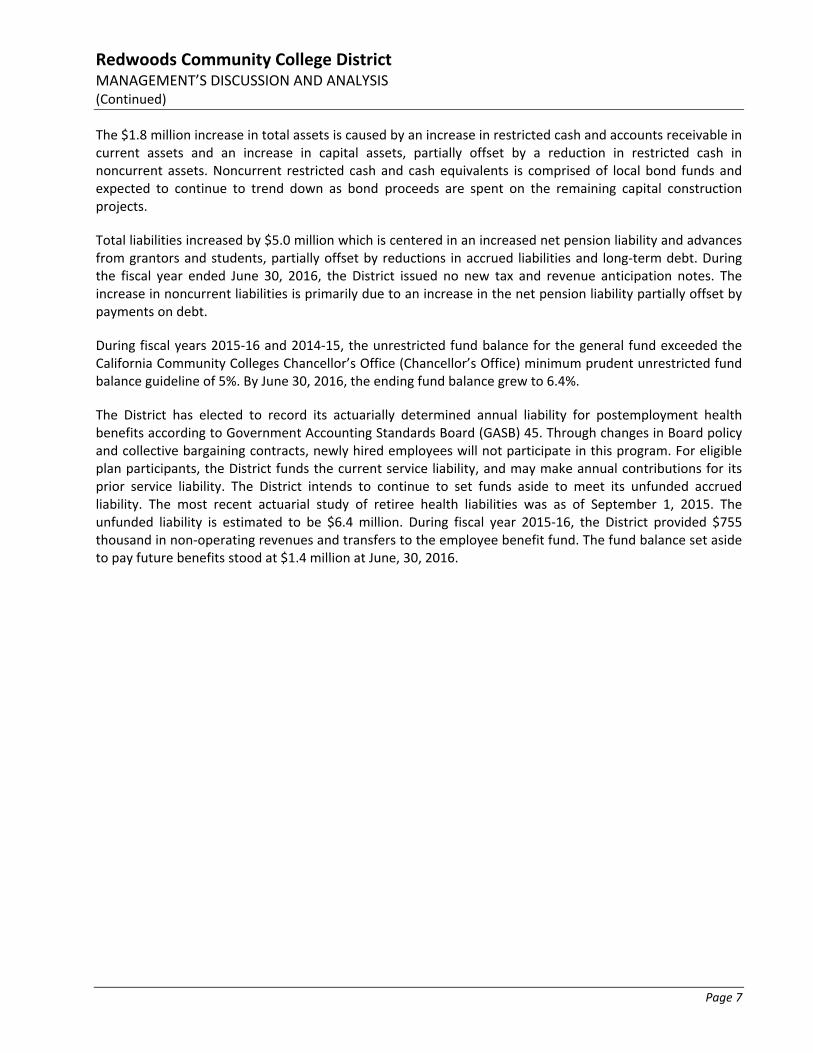
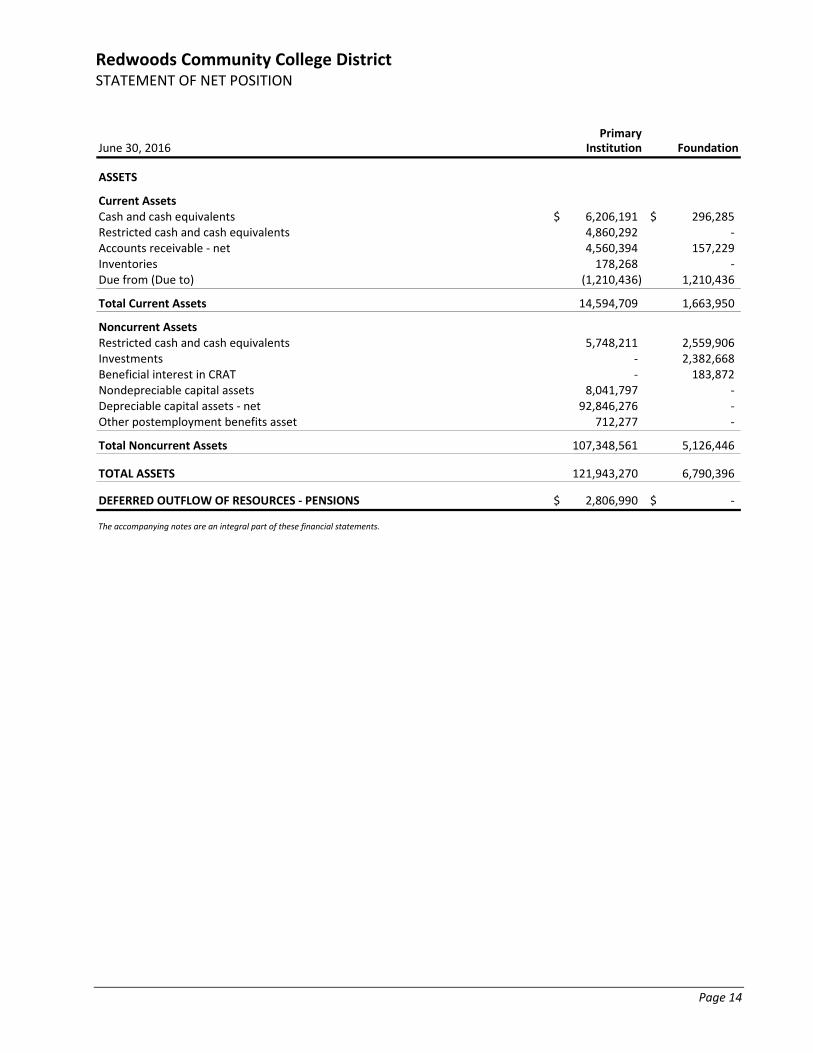
STATEMENT OF NET POSITION
The statement of net position includes all assets, deferred outflow of resources, liabilities and deferred inflow of resources using the accrual basis of accounting, which is similar to the accounting method used by most private sector organizations. Net position, the difference between assets, deferred outflow of resources, and liabilities and deferred inflow of resources is an indicator of the financial health of a district.
June 30 2016 2015 Change
ASSETSCurrent assets 14,594,709$ 12,127,506$ 2,467,203$ 20%Noncurrent restricted cash and cash equivalents 6,460,488 8,141,676 (1,681,188) ‐21%Capital assets and deferred costs ‐ net 100,888,073 99,858,242 1,029,831 1%
TOTAL ASSETS 121,943,270$ 120,127,424$ 1,815,846$ 2%
DEFERRED OUTFLOW OF RESOURCES ‐ PENSIONS 2,806,990$ 1,748,255$ 1,058,735$ 61%
LIABILITIESCurrent liabilities 8,640,146$ 7,500,768$ 1,139,378$ 15%Noncurrent liabilities 56,425,421 52,551,547 3,873,874 7%
TOTAL LIABILITIES 65,065,567 60,052,315 5,013,252 8%
DEFERRED INFLOW OF RESOURCESDeferred inflows related to pensions 2,315,354 5,307,783 (2,992,429) 100%Deferred gain on refunding 78,848 86,733 (7,885) ‐9%
TOTAL DEFERRED INFLOW OF RESOURCES 2,394,202 5,394,516 (3,000,314) ‐56%
NET POSITIONInvestments in capital assets ‐ net of related debt 75,657,990 74,467,366 1,190,624 2%Restricted ‐ expendable 615,794 5,656 610,138 10787%Unrestricted (18,983,293) (18,044,174) (939,119) 5%
TOTAL NET POSITION 57,290,491$ 56,428,848$ 861,643$ 2%
Redwoods Community College District MANAGEMENT’S DISCUSSION AND ANALYSIS (Continued)
Page 7
The $1.8 million increase in total assets is caused by an increase in restricted cash and accounts receivable in current assets and an increase in capital assets, partially offset by a reduction in restricted cash in noncurrent assets. Noncurrent restricted cash and cash equivalents is comprised of local bond funds and expected to continue to trend down as bond proceeds are spent on the remaining capital construction projects.
Total liabilities increased by $5.0 million which is centered in an increased net pension liability and advances from grantors and students, partially offset by reductions in accrued liabilities and long‐term debt. During the fiscal year ended June 30, 2016, the District issued no new tax and revenue anticipation notes. The increase in noncurrent liabilities is primarily due to an increase in the net pension liability partially offset by payments on debt.
During fiscal years 2015‐16 and 2014‐15, the unrestricted fund balance for the general fund exceeded the California Community Colleges Chancellor’s Office (Chancellor’s Office) minimum prudent unrestricted fund balance guideline of 5%. By June 30, 2016, the ending fund balance grew to 6.4%.
The District has elected to record its actuarially determined annual liability for postemployment health benefits according to Government Accounting Standards Board (GASB) 45. Through changes in Board policy and collective bargaining contracts, newly hired employees will not participate in this program. For eligible plan participants, the District funds the current service liability, and may make annual contributions for its prior service liability. The District intends to continue to set funds aside to meet its unfunded accrued liability. The most recent actuarial study of retiree health liabilities was as of September 1, 2015. The unfunded liability is estimated to be $6.4 million. During fiscal year 2015‐16, the District provided $755 thousand in non‐operating revenues and transfers to the employee benefit fund. The fund balance set aside to pay future benefits stood at $1.4 million at June, 30, 2016.
Redwoods Community College District MANAGEMENT’S DISCUSSION AND ANALYSIS (Continued)
Page 8
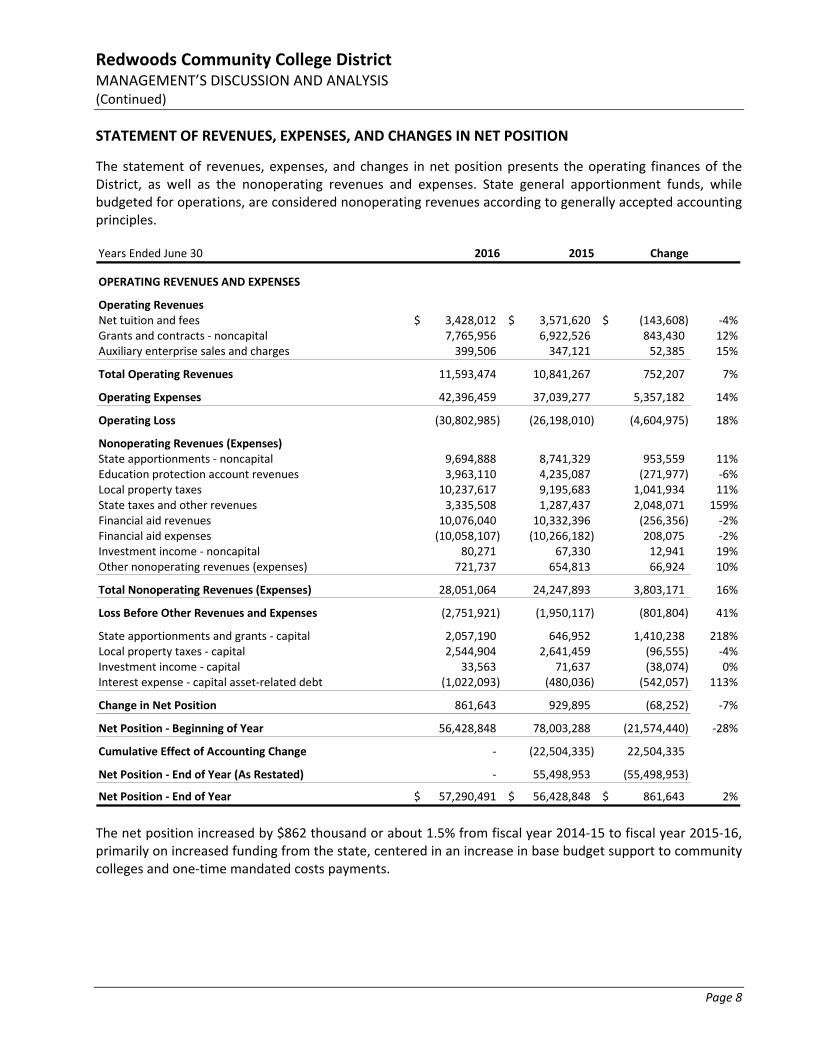
STATEMENT OF REVENUES, EXPENSES, AND CHANGES IN NET POSITION
The statement of revenues, expenses, and changes in net position presents the operating finances of the District, as well as the nonoperating revenues and expenses. State general apportionment funds, while budgeted for operations, are considered nonoperating revenues according to generally accepted accounting principles.
Years Ended June 30 2016 2015 Change
OPERATING REVENUES AND EXPENSES
Operating RevenuesNet tuition and fees 3,428,012$ 3,571,620$ (143,608)$ ‐4%Grants and contracts ‐ noncapital 7,765,956 6,922,526 843,430 12%Auxiliary enterprise sales and charges 399,506 347,121 52,385 15%
Total Operating Revenues 11,593,474 10,841,267 752,207 7%
Operating Expenses 42,396,459 37,039,277 5,357,182 14%
Operating Loss (30,802,985) (26,198,010) (4,604,975) 18%
Nonoperating Revenues (Expenses)State apportionments ‐ noncapital 9,694,888 8,741,329 953,559 11%Education protection account revenues 3,963,110 4,235,087 (271,977) ‐6%Local property taxes 10,237,617 9,195,683 1,041,934 11%State taxes and other revenues 3,335,508 1,287,437 2,048,071 159%Financial aid revenues 10,076,040 10,332,396 (256,356) ‐2%Financial aid expenses (10,058,107) (10,266,182) 208,075 ‐2%Investment income ‐ noncapital 80,271 67,330 12,941 19%Other nonoperating revenues (expenses) 721,737 654,813 66,924 10%
Total Nonoperating Revenues (Expenses) 28,051,064 24,247,893 3,803,171 16%
Loss Before Other Revenues and Expenses (2,751,921) (1,950,117) (801,804) 41%
State apportionments and grants ‐ capital 2,057,190 646,952 1,410,238 218%Local property taxes ‐ capital 2,544,904 2,641,459 (96,555) ‐4%Investment income ‐ capital 33,563 71,637 (38,074) 0%Interest expense ‐ capital asset‐related debt (1,022,093) (480,036) (542,057) 113%
Change in Net Position 861,643 929,895 (68,252) ‐7%
Net Position ‐ Beginning of Year 56,428,848 78,003,288 (21,574,440) ‐28%
Cumulative Effect of Accounting Change ‐ (22,504,335) 22,504,335
Net Position ‐ End of Year (As Restated) ‐ 55,498,953 (55,498,953)
Net Position ‐ End of Year 57,290,491$ 56,428,848$ 861,643$ 2%
The net position increased by $862 thousand or about 1.5% from fiscal year 2014‐15 to fiscal year 2015‐16, primarily on increased funding from the state, centered in an increase in base budget support to community colleges and one‐time mandated costs payments.
Redwoods Community College District MANAGEMENT’S DISCUSSION AND ANALYSIS (Continued)
Page 9
The state’s SB361 funding formula allocates apportionment funding to 72 community college districts. For fiscal year 2015‐16 the District’s total apportionment was $25.3 million, up from $23.5 million the prior year. The District received enrollment stability apportionment funding for 3,960 full‐time equivalent students (FTES) in fiscal year 2015‐16, so student enrollments did not contribute to the increased Apportionment funding. The increased funding is attributable to increased state support for community colleges, centered in a base budget increase and one‐time mandated costs funding.
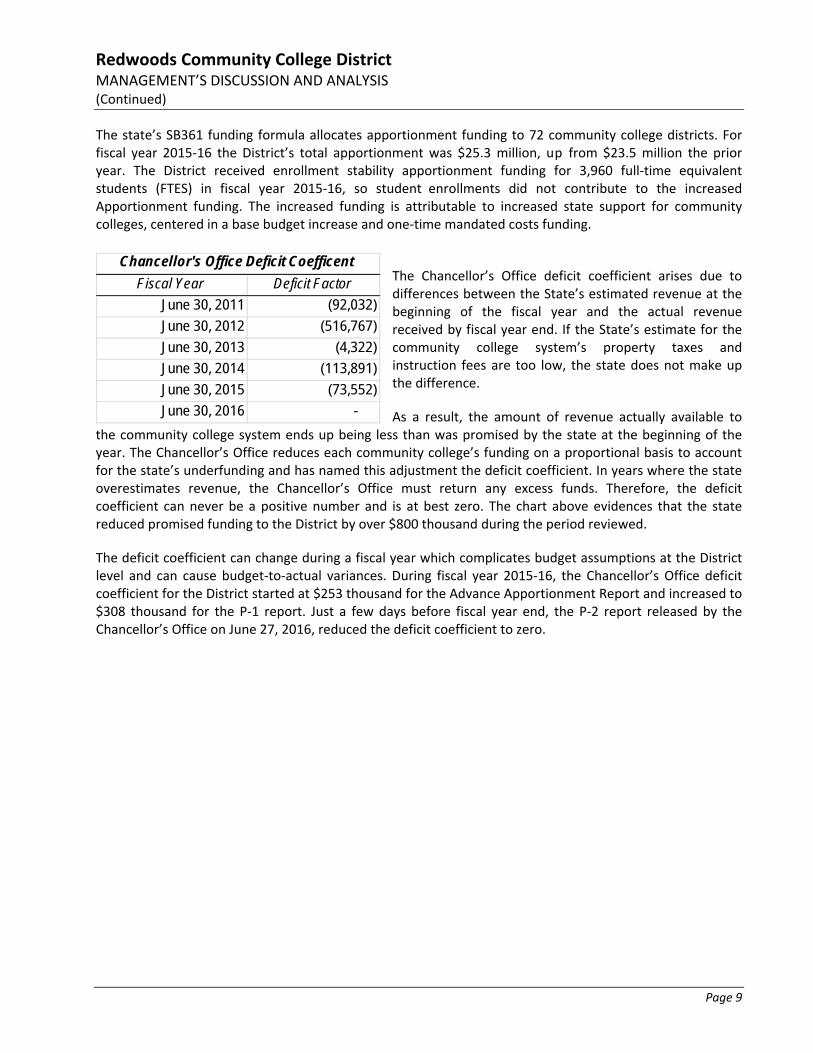
The Chancellor’s Office deficit coefficient arises due to differences between the State’s estimated revenue at the beginning of the fiscal year and the actual revenue received by fiscal year end. If the State’s estimate for the community college system’s property taxes and instruction fees are too low, the state does not make up the difference.
As a result, the amount of revenue actually available to the community college system ends up being less than was promised by the state at the beginning of the year. The Chancellor’s Office reduces each community college’s funding on a proportional basis to account for the state’s underfunding and has named this adjustment the deficit coefficient. In years where the state overestimates revenue, the Chancellor’s Office must return any excess funds. Therefore, the deficit coefficient can never be a positive number and is at best zero. The chart above evidences that the state reduced promised funding to the District by over $800 thousand during the period reviewed.
The deficit coefficient can change during a fiscal year which complicates budget assumptions at the District level and can cause budget‐to‐actual variances. During fiscal year 2015‐16, the Chancellor’s Office deficit coefficient for the District started at $253 thousand for the Advance Apportionment Report and increased to $308 thousand for the P‐1 report. Just a few days before fiscal year end, the P‐2 report released by the Chancellor’s Office on June 27, 2016, reduced the deficit coefficient to zero.
Fiscal Year Deficit Factor
June 30, 2011 (92,032)
June 30, 2012 (516,767)
June 30, 2013 (4,322)
June 30, 2014 (113,891)
June 30, 2015 (73,552)
June 30, 2016 -
Chancellor's Office Deficit Coefficent
Redwoods Community College District MANAGEMENT’S DISCUSSION AND ANALYSIS (Continued)
Page 10
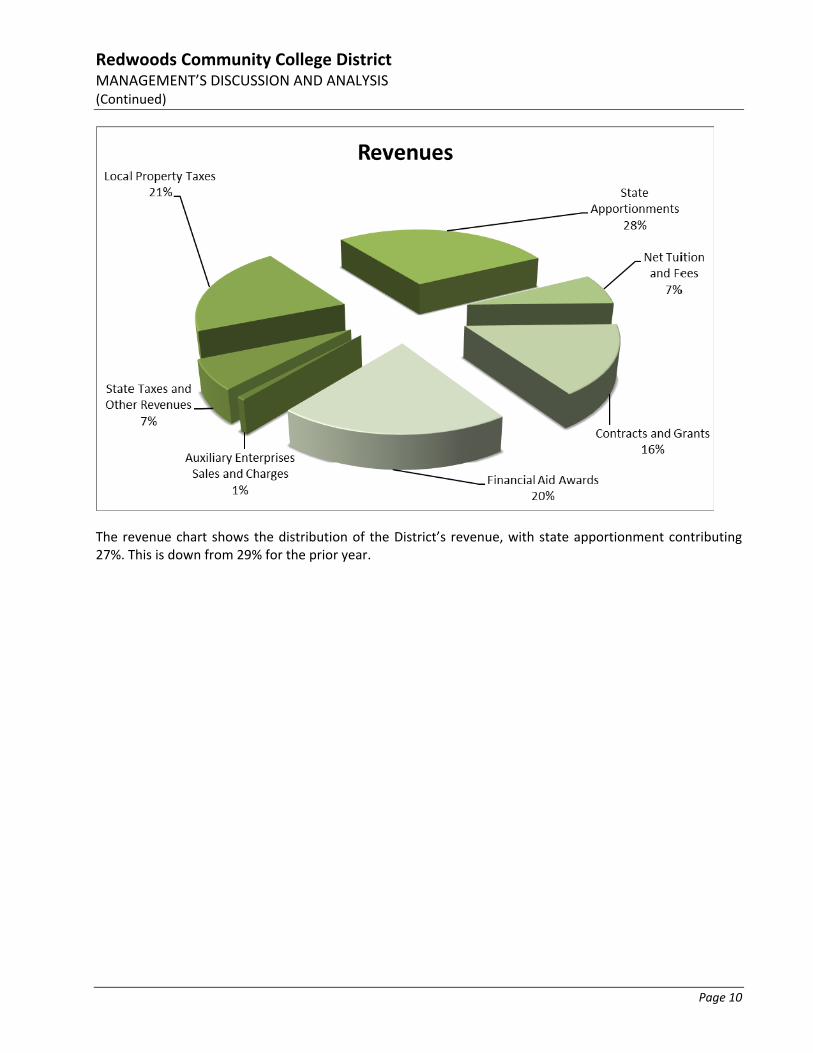
The revenue chart shows the distribution of the District’s revenue, with state apportionment contributing 27%. This is down from 29% for the prior year.
Redwoods Community College District MANAGEMENT’S DISCUSSION AND ANALYSIS (Continued)
Page 11
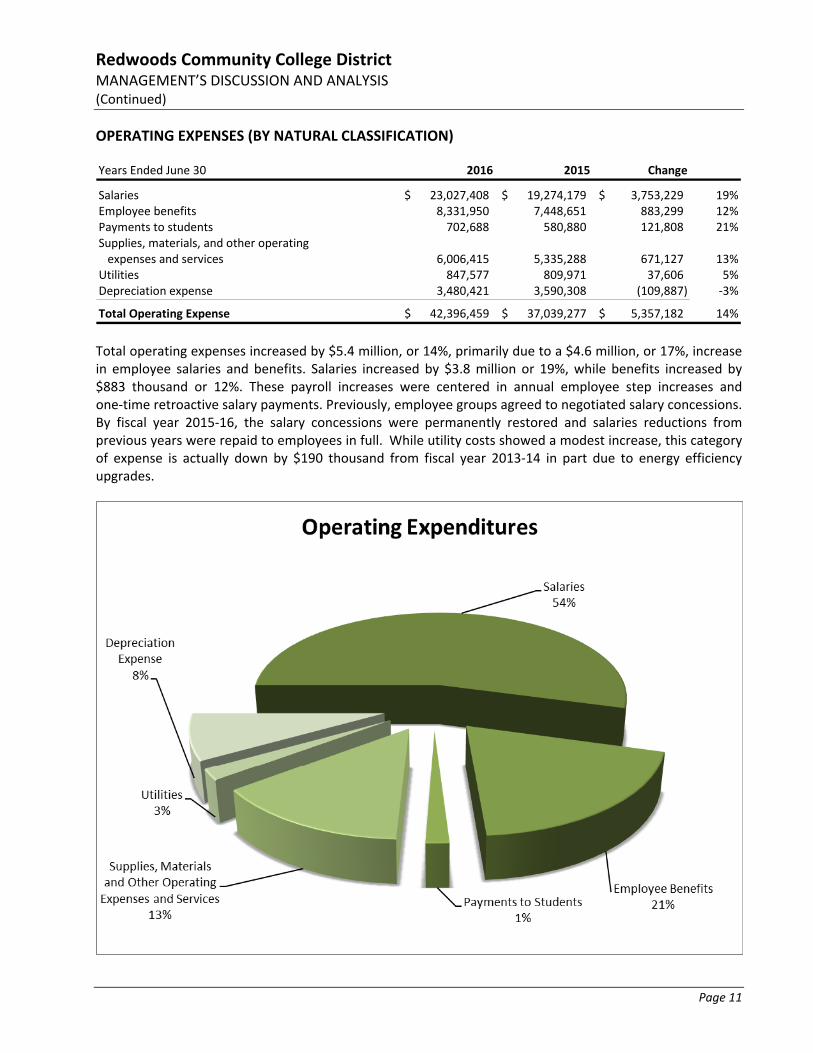
OPERATING EXPENSES (BY NATURAL CLASSIFICATION)
Years Ended June 30 2016 2015 Change
Salaries 23,027,408$ 19,274,179$ 3,753,229$ 19%Employee benefits 8,331,950 7,448,651 883,299 12%Payments to students 702,688 580,880 121,808 21%Supplies, materials, and other operating expenses and services 6,006,415 5,335,288 671,127 13%
Utilities 847,577 809,971 37,606 5%Depreciation expense 3,480,421 3,590,308 (109,887) ‐3%
Total Operating Expense 42,396,459$ 37,039,277$ 5,357,182$ 14%
Total operating expenses increased by $5.4 million, or 14%, primarily due to a $4.6 million, or 17%, increase in employee salaries and benefits. Salaries increased by $3.8 million or 19%, while benefits increased by $883 thousand or 12%. These payroll increases were centered in annual employee step increases and one‐time retroactive salary payments. Previously, employee groups agreed to negotiated salary concessions. By fiscal year 2015‐16, the salary concessions were permanently restored and salaries reductions from previous years were repaid to employees in full. While utility costs showed a modest increase, this category of expense is actually down by $190 thousand from fiscal year 2013‐14 in part due to energy efficiency upgrades.
Redwoods Community College District MANAGEMENT’S DISCUSSION AND ANALYSIS (Continued)
Page 12
STATEMENT OF CASH FLOWS
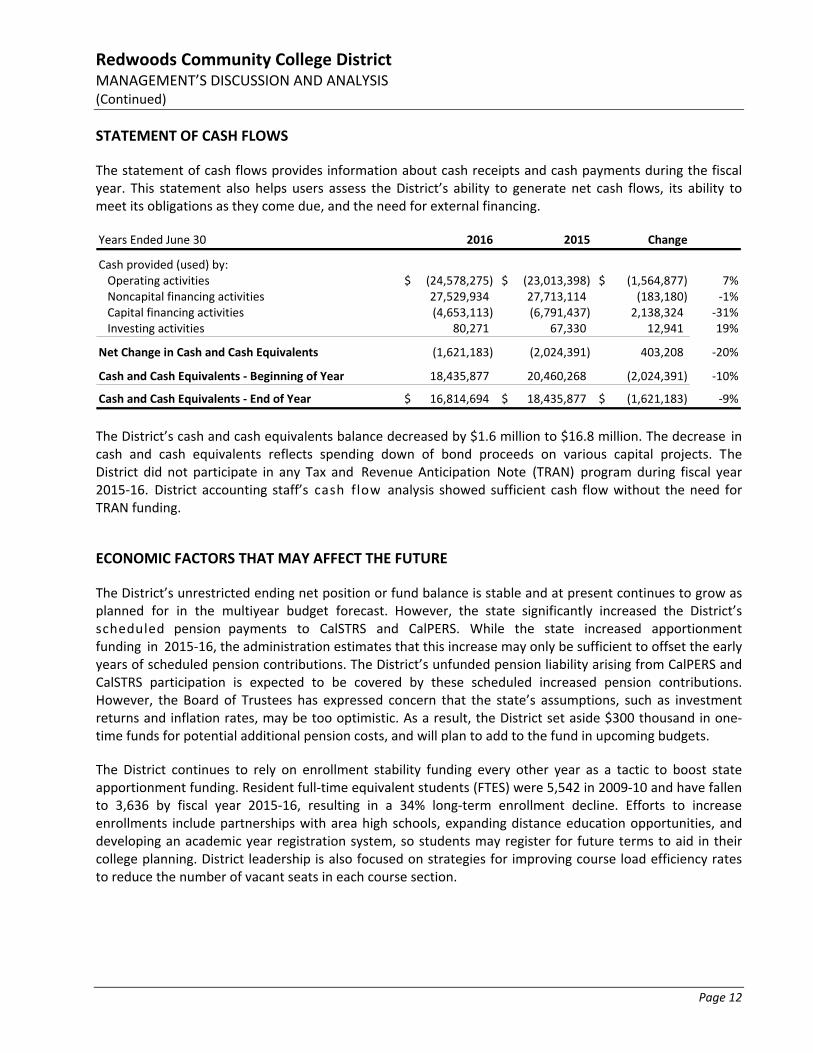
The statement of cash flows provides information about cash receipts and cash payments during the fiscal year. This statement also helps users assess the District’s ability to generate net cash flows, its ability to meet its obligations as they come due, and the need for external financing.
Years Ended June 30 2016 2015 Change
Cash provided (used) by:Operating activities (24,578,275)$ (23,013,398)$ (1,564,877)$ 7%Noncapital financing activities 27,529,934 27,713,114 (183,180) ‐1%Capital financing activities (4,653,113) (6,791,437) 2,138,324 ‐31%Investing activities 80,271 67,330 12,941 19%
Net Change in Cash and Cash Equivalents (1,621,183) (2,024,391) 403,208 ‐20%
Cash and Cash Equivalents ‐ Beginning of Year 18,435,877 20,460,268 (2,024,391) ‐10%
Cash and Cash Equivalents ‐ End of Year 16,814,694$ 18,435,877$ (1,621,183)$ ‐9%
The District’s cash and cash equivalents balance decreased by $1.6 million to $16.8 million. The decrease in cash and cash equivalents reflects spending down of bond proceeds on various capital projects. The District did not participate in any Tax and Revenue Anticipation Note (TRAN) program during fiscal year 2015‐16. District accounting staff’s cash flow analysis showed sufficient cash flow without the need for TRAN funding.
ECONOMIC FACTORS THAT MAY AFFECT THE FUTURE
The District’s unrestricted ending net position or fund balance is stable and at present continues to grow as planned for in the multiyear budget forecast. However, the state significantly increased the District’s scheduled pension payments to CalSTRS and CalPERS. While the state increased apportionment funding in 2015‐16, the administration estimates that this increase may only be sufficient to offset the early years of scheduled pension contributions. The District’s unfunded pension liability arising from CalPERS and CalSTRS participation is expected to be covered by these scheduled increased pension contributions. However, the Board of Trustees has expressed concern that the state’s assumptions, such as investment returns and inflation rates, may be too optimistic. As a result, the District set aside $300 thousand in one‐time funds for potential additional pension costs, and will plan to add to the fund in upcoming budgets.
The District continues to rely on enrollment stability funding every other year as a tactic to boost state apportionment funding. Resident full‐time equivalent students (FTES) were 5,542 in 2009‐10 and have fallen to 3,636 by fiscal year 2015‐16, resulting in a 34% long‐term enrollment decline. Efforts to increase enrollments include partnerships with area high schools, expanding distance education opportunities, and developing an academic year registration system, so students may register for future terms to aid in their college planning. District leadership is also focused on strategies for improving course load efficiency rates to reduce the number of vacant seats in each course section.
Redwoods Community College District MANAGEMENT’S DISCUSSION AND ANALYSIS (Continued)
Page 13
Nonresident enrollments increased in fiscal year 2015‐16 to their highest level since 2008‐09. Fiscal year 2015‐16 was the second straight year of strong non‐resident growth. Nonresident enrollments have grown almost 46% since fiscal year 2013‐14. Non‐residents represent just under 7% of total enrollments for the District. However, nonresidents represent an area of success relative to student growth and could be an important positive economic factor to the District’s long term fiscal stability.
The District has implemented multiple business reorganizations to reduce its employee ranks and reduce expenditures. Meanwhile, District employees have not received a salary COLA in over three years. Maintaining competitive salaries is necessary to attract and retain talented employees, so the District needs to “mark to market” on its salary schedules periodically. However, any upward movement in this category could negatively impact the multiyear financial forecast.
As a result, the District’s economic condition is driven primarily by the level of state support provided to the California community colleges system, by the District’s enrollment results, and by District leadership’s ability to control costs. A fundamental goal for the District is to manage costs, so that expenditure growth does not outpace revenue growth. Voter approval of proposition 55 should provide some stabilization in state apportionment funding for California’s community colleges. The state of California has been experiencing a multiyear economic expansion, but Governor Brown has cautioned that a recession would adversely impact the state’s financial condition.
The District’s finances will continue to be positioned for the probability of austerity budgets in the future. The District is continuing long‐term capital investments with the Utility Infrastructure Replacement and Seismic Strengthening Project already in the architect planning phase during fiscal year 2015‐16. Also, District leadership is pursuing state capital outlay funds to replace the Physical Education Complex, the Fieldhouse, and the Creative Arts building. As a result, the District i s positioned to capitalize on opportunities in the future should the long‐term decline in enrollments eventually be reversed.
Redwoods Community College District STATEMENT OF NET POSITION
Page 14
PrimaryJune 30, 2016 Institution Foundation
ASSETS
Current AssetsCash and cash equivalents 6,206,191$ 296,285$ Restricted cash and cash equivalents 4,860,292 ‐ Accounts receivable ‐ net 4,560,394 157,229Inventories 178,268 ‐ Due from (Due to) (1,210,436) 1,210,436
Total Current Assets 14,594,709 1,663,950
Noncurrent AssetsRestricted cash and cash equivalents 5,748,211 2,559,906 Investments ‐ 2,382,668Beneficial interest in CRAT ‐ 183,872Nondepreciable capital assets 8,041,797 ‐ Depreciable capital assets ‐ net 92,846,276 ‐ Other postemployment benefits asset 712,277 ‐
Total Noncurrent Assets 107,348,561 5,126,446
TOTAL ASSETS 121,943,270 6,790,396
DEFERRED OUTFLOW OF RESOURCES ‐ PENSIONS 2,806,990$ ‐$
The accompanying notes are an integral part of these financial statements.
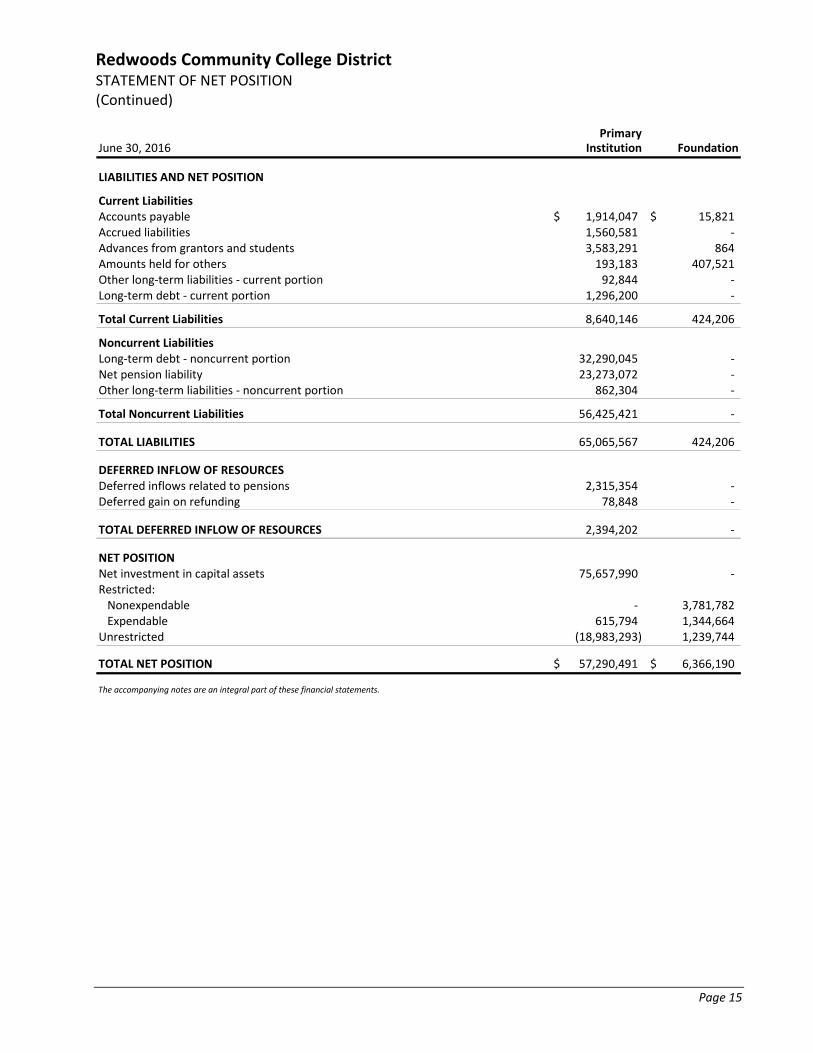
Redwoods Community College District STATEMENT OF NET POSITION (Continued)
Page 15
PrimaryJune 30, 2016 Institution Foundation
LIABILITIES AND NET POSITION
Current LiabilitiesAccounts payable 1,914,047$ 15,821$ Accrued liabilities 1,560,581 ‐ Advances from grantors and students 3,583,291 864Amounts held for others 193,183 407,521Other long‐term liabilities ‐ current portion 92,844 ‐ Long‐term debt ‐ current portion 1,296,200 ‐
Total Current Liabilities 8,640,146 424,206
Noncurrent LiabilitiesLong‐term debt ‐ noncurrent portion 32,290,045 ‐ Net pension liability 23,273,072 ‐ Other long‐term liabilities ‐ noncurrent portion 862,304 ‐
Total Noncurrent Liabilities 56,425,421 ‐
TOTAL LIABILITIES 65,065,567 424,206
DEFERRED INFLOW OF RESOURCESDeferred inflows related to pensions 2,315,354 ‐ Deferred gain on refunding 78,848 ‐
TOTAL DEFERRED INFLOW OF RESOURCES 2,394,202 ‐
NET POSITIONNet investment in capital assets 75,657,990 ‐ Restricted:Nonexpendable ‐ 3,781,782 Expendable 615,794 1,344,664
Unrestricted (18,983,293) 1,239,744
TOTAL NET POSITION 57,290,491$ 6,366,190$
The accompanying notes are an integral part of these financial statements.
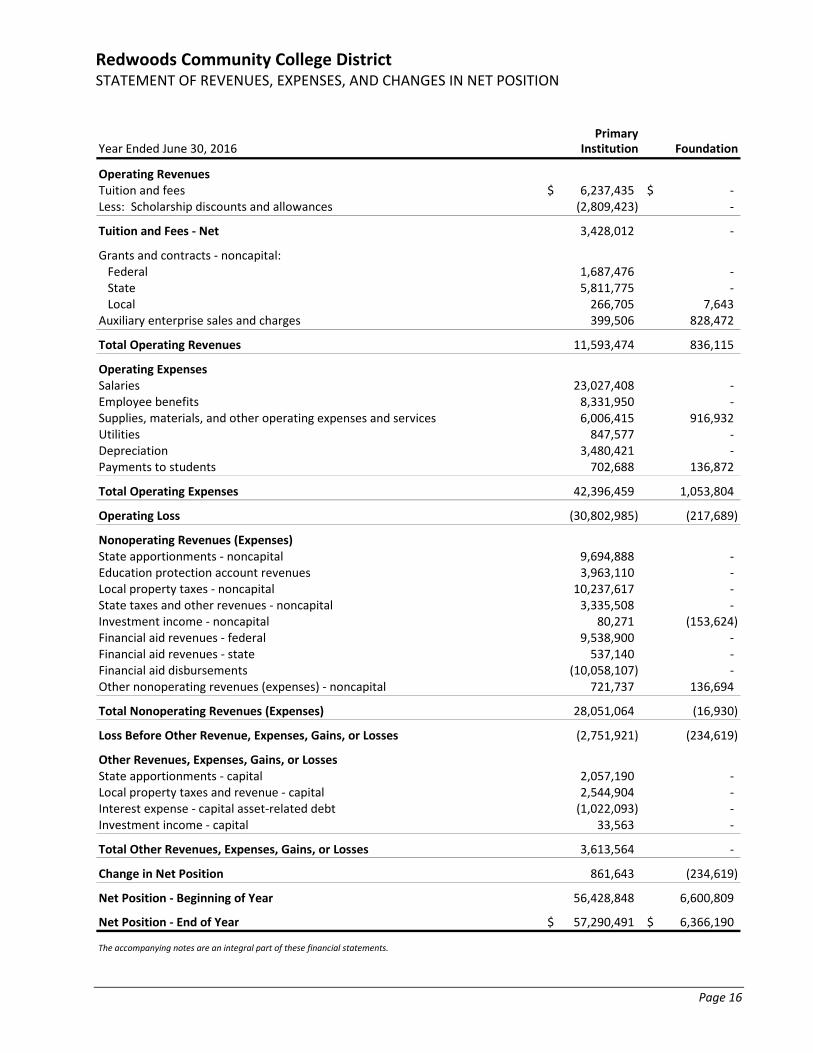
Redwoods Community College District STATEMENT OF REVENUES, EXPENSES, AND CHANGES IN NET POSITION
Page 16
PrimaryYear Ended June 30, 2016 Institution Foundation
Operating RevenuesTuition and fees 6,237,435$ ‐$ Less: Scholarship discounts and allowances (2,809,423) ‐
Tuition and Fees ‐ Net 3,428,012 ‐
Grants and contracts ‐ noncapital:Federal 1,687,476 ‐ State 5,811,775 ‐ Local 266,705 7,643
Auxiliary enterprise sales and charges 399,506 828,472
Total Operating Revenues 11,593,474 836,115
Operating ExpensesSalaries 23,027,408 ‐ Employee benefits 8,331,950 ‐ Supplies, materials, and other operating expenses and services 6,006,415 916,932Utilities 847,577 ‐ Depreciation 3,480,421 ‐ Payments to students 702,688 136,872
Total Operating Expenses 42,396,459 1,053,804
Operating Loss (30,802,985) (217,689)
Nonoperating Revenues (Expenses)State apportionments ‐ noncapital 9,694,888 ‐ Education protection account revenues 3,963,110 ‐ Local property taxes ‐ noncapital 10,237,617 ‐ State taxes and other revenues ‐ noncapital 3,335,508 ‐ Investment income ‐ noncapital 80,271 (153,624) Financial aid revenues ‐ federal 9,538,900 ‐ Financial aid revenues ‐ state 537,140 ‐ Financial aid disbursements (10,058,107) ‐ Other nonoperating revenues (expenses) ‐ noncapital 721,737 136,694
Total Nonoperating Revenues (Expenses) 28,051,064 (16,930)
Loss Before Other Revenue, Expenses, Gains, or Losses (2,751,921) (234,619)
Other Revenues, Expenses, Gains, or LossesState apportionments ‐ capital 2,057,190 ‐ Local property taxes and revenue ‐ capital 2,544,904 ‐ Interest expense ‐ capital asset‐related debt (1,022,093) ‐ Investment income ‐ capital 33,563 ‐
Total Other Revenues, Expenses, Gains, or Losses 3,613,564 ‐
Change in Net Position 861,643 (234,619)
Net Position ‐ Beginning of Year 56,428,848 6,600,809
Net Position ‐ End of Year 57,290,491$ 6,366,190$
The accompanying notes are an integral part of these financial statements.
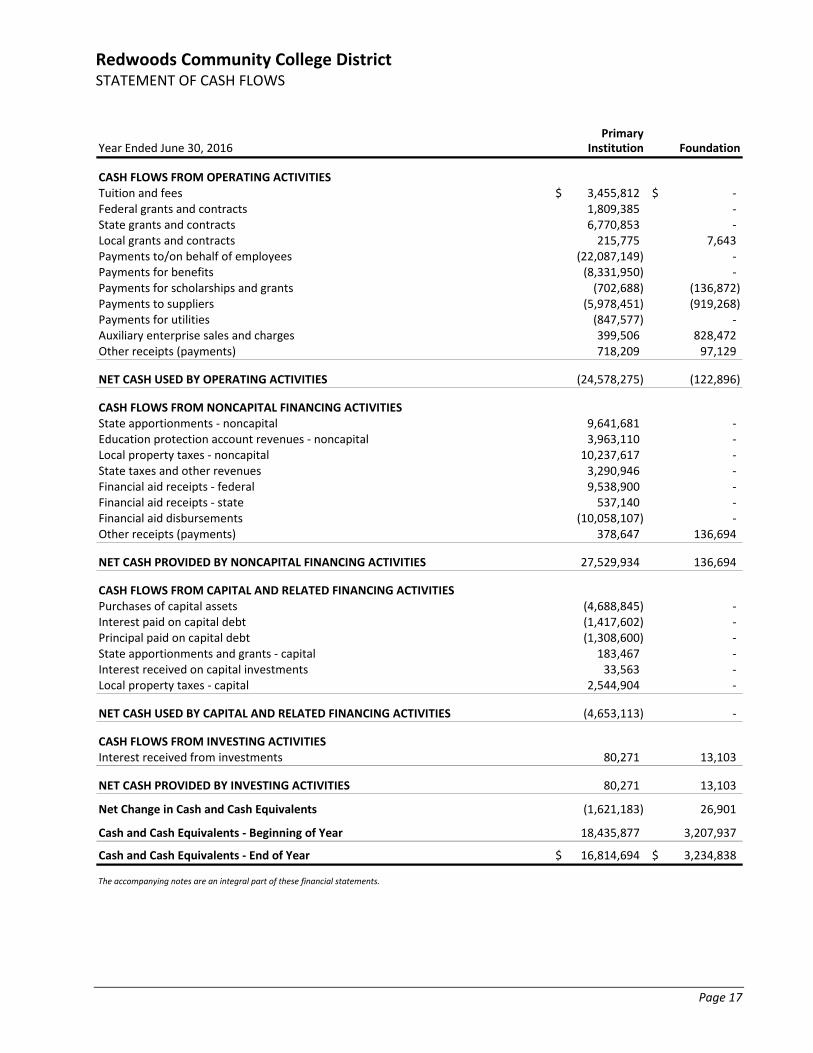
Redwoods Community College District STATEMENT OF CASH FLOWS
Page 17
PrimaryYear Ended June 30, 2016 Institution Foundation
CASH FLOWS FROM OPERATING ACTIVITIESTuition and fees 3,455,812$ ‐$ Federal grants and contracts 1,809,385 ‐ State grants and contracts 6,770,853 ‐ Local grants and contracts 215,775 7,643 Payments to/on behalf of employees (22,087,149) ‐ Payments for benefits (8,331,950) ‐ Payments for scholarships and grants (702,688) (136,872) Payments to suppliers (5,978,451) (919,268) Payments for utilities (847,577) ‐ Auxiliary enterprise sales and charges 399,506 828,472 Other receipts (payments) 718,209 97,129
NET CASH USED BY OPERATING ACTIVITIES (24,578,275) (122,896)
CASH FLOWS FROM NONCAPITAL FINANCING ACTIVITIESState apportionments ‐ noncapital 9,641,681 ‐ Education protection account revenues ‐ noncapital 3,963,110 ‐ Local property taxes ‐ noncapital 10,237,617 ‐ State taxes and other revenues 3,290,946 ‐ Financial aid receipts ‐ federal 9,538,900 ‐ Financial aid receipts ‐ state 537,140 ‐ Financial aid disbursements (10,058,107) ‐ Other receipts (payments) 378,647 136,694
NET CASH PROVIDED BY NONCAPITAL FINANCING ACTIVITIES 27,529,934 136,694
CASH FLOWS FROM CAPITAL AND RELATED FINANCING ACTIVITIESPurchases of capital assets (4,688,845) ‐ Interest paid on capital debt (1,417,602) ‐ Principal paid on capital debt (1,308,600) ‐ State apportionments and grants ‐ capital 183,467 ‐ Interest received on capital investments 33,563 ‐ Local property taxes ‐ capital 2,544,904 ‐
NET CASH USED BY CAPITAL AND RELATED FINANCING ACTIVITIES (4,653,113) ‐
CASH FLOWS FROM INVESTING ACTIVITIESInterest received from investments 80,271 13,103
NET CASH PROVIDED BY INVESTING ACTIVITIES 80,271 13,103
Net Change in Cash and Cash Equivalents (1,621,183) 26,901
Cash and Cash Equivalents ‐ Beginning of Year 18,435,877 3,207,937
Cash and Cash Equivalents ‐ End of Year 16,814,694$ 3,234,838$
The accompanying notes are an integral part of these financial statements.
Redwoods Community College District STATEMENT OF CASH FLOWS (Continued)
Page 18
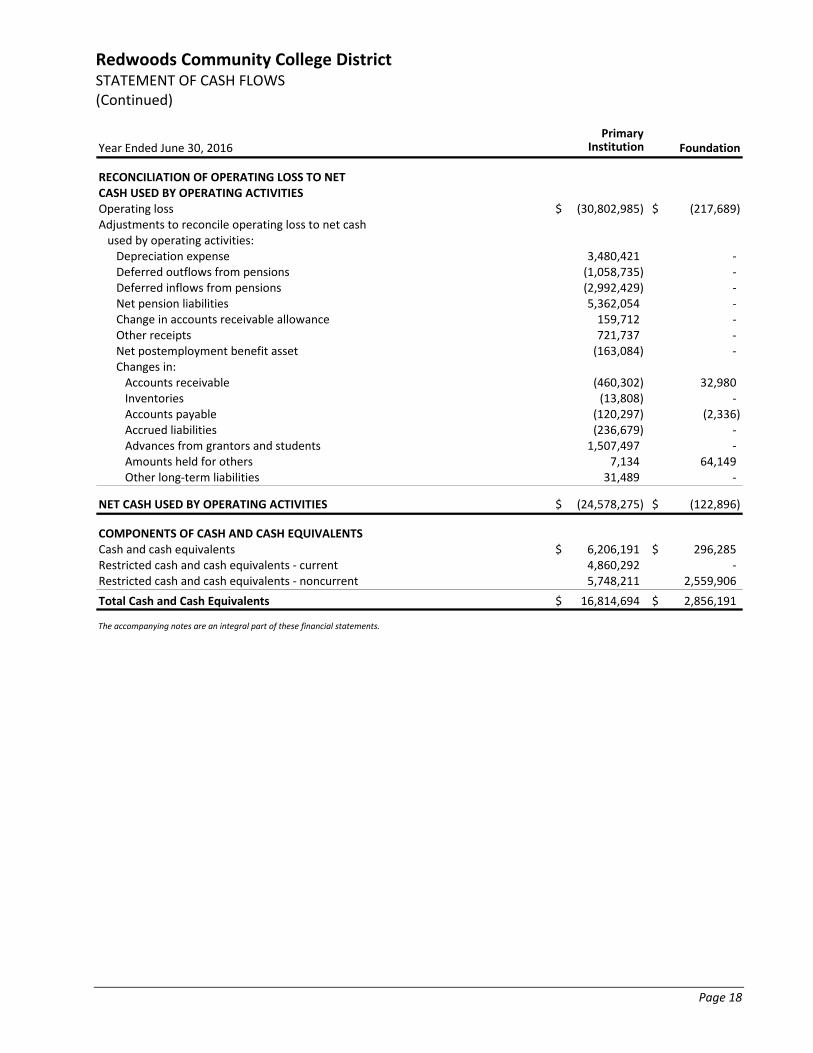
PrimaryYear Ended June 30, 2016 Institution Foundation
RECONCILIATION OF OPERATING LOSS TO NETCASH USED BY OPERATING ACTIVITIESOperating loss (30,802,985)$ (217,689)$ Adjustments to reconcile operating loss to net cashused by operating activities:Depreciation expense 3,480,421 ‐ Deferred outflows from pensions (1,058,735) ‐ Deferred inflows from pensions (2,992,429) ‐ Net pension liabilities 5,362,054 ‐ Change in accounts receivable allowance 159,712 ‐ Other receipts 721,737 ‐ Net postemployment benefit asset (163,084) ‐ Changes in:Accounts receivable (460,302) 32,980 Inventories (13,808) ‐ Accounts payable (120,297) (2,336) Accrued liabilities (236,679) ‐ Advances from grantors and students 1,507,497 ‐ Amounts held for others 7,134 64,149 Other long‐term liabilities 31,489 ‐
NET CASH USED BY OPERATING ACTIVITIES (24,578,275)$ (122,896)$
COMPONENTS OF CASH AND CASH EQUIVALENTSCash and cash equivalents 6,206,191$ 296,285$ Restricted cash and cash equivalents ‐ current 4,860,292 ‐ Restricted cash and cash equivalents ‐ noncurrent 5,748,211 2,559,906
Total Cash and Cash Equivalents 16,814,694$ 2,856,191$
The accompanying notes are an integral part of these financial statements.
Redwoods Community College District NOTES TO THE FINANCIAL STATEMENTS
Page 19
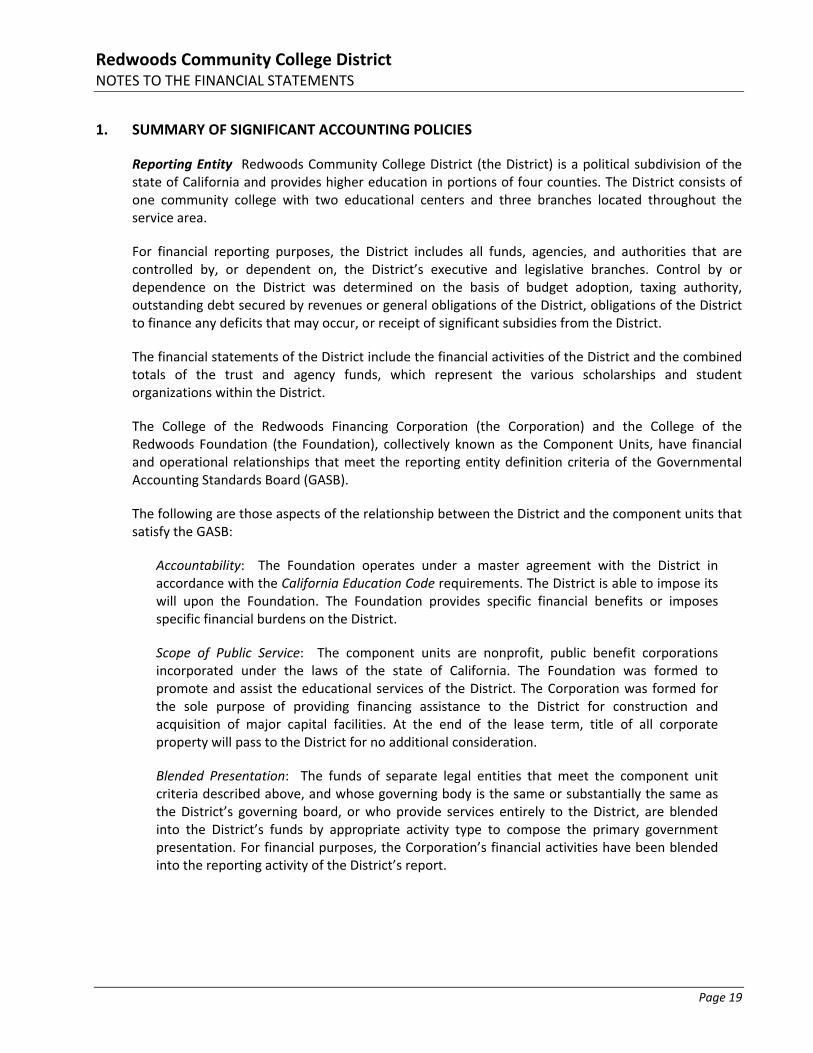
1. SUMMARY OF SIGNIFICANT ACCOUNTING POLICIES
Reporting Entity Redwoods Community College District (the District) is a political subdivision of the state of California and provides higher education in portions of four counties. The District consists of one community college with two educational centers and three branches located throughout the service area.
For financial reporting purposes, the District includes all funds, agencies, and authorities that are controlled by, or dependent on, the District’s executive and legislative branches. Control by or dependence on the District was determined on the basis of budget adoption, taxing authority, outstanding debt secured by revenues or general obligations of the District, obligations of the District to finance any deficits that may occur, or receipt of significant subsidies from the District.
The financial statements of the District include the financial activities of the District and the combined totals of the trust and agency funds, which represent the various scholarships and student organizations within the District.
The College of the Redwoods Financing Corporation (the Corporation) and the College of the Redwoods Foundation (the Foundation), collectively known as the Component Units, have financial and operational relationships that meet the reporting entity definition criteria of the Governmental Accounting Standards Board (GASB).
The following are those aspects of the relationship between the District and the component units that satisfy the GASB:
Accountability: The Foundation operates under a master agreement with the District in accordance with the California Education Code requirements. The District is able to impose its will upon the Foundation. The Foundation provides specific financial benefits or imposes specific financial burdens on the District.
Scope of Public Service: The component units are nonprofit, public benefit corporations incorporated under the laws of the state of California. The Foundation was formed to promote and assist the educational services of the District. The Corporation was formed for the sole purpose of providing financing assistance to the District for construction and acquisition of major capital facilities. At the end of the lease term, title of all corporate property will pass to the District for no additional consideration.
Blended Presentation: The funds of separate legal entities that meet the component unit criteria described above, and whose governing body is the same or substantially the same as the District’s governing board, or who provide services entirely to the District, are blended into the District’s funds by appropriate activity type to compose the primary government presentation. For financial purposes, the Corporation’s financial activities have been blended into the reporting activity of the District’s report.
Redwoods Community College District NOTES TO THE FINANCIAL STATEMENTS (Continued)
Page 20
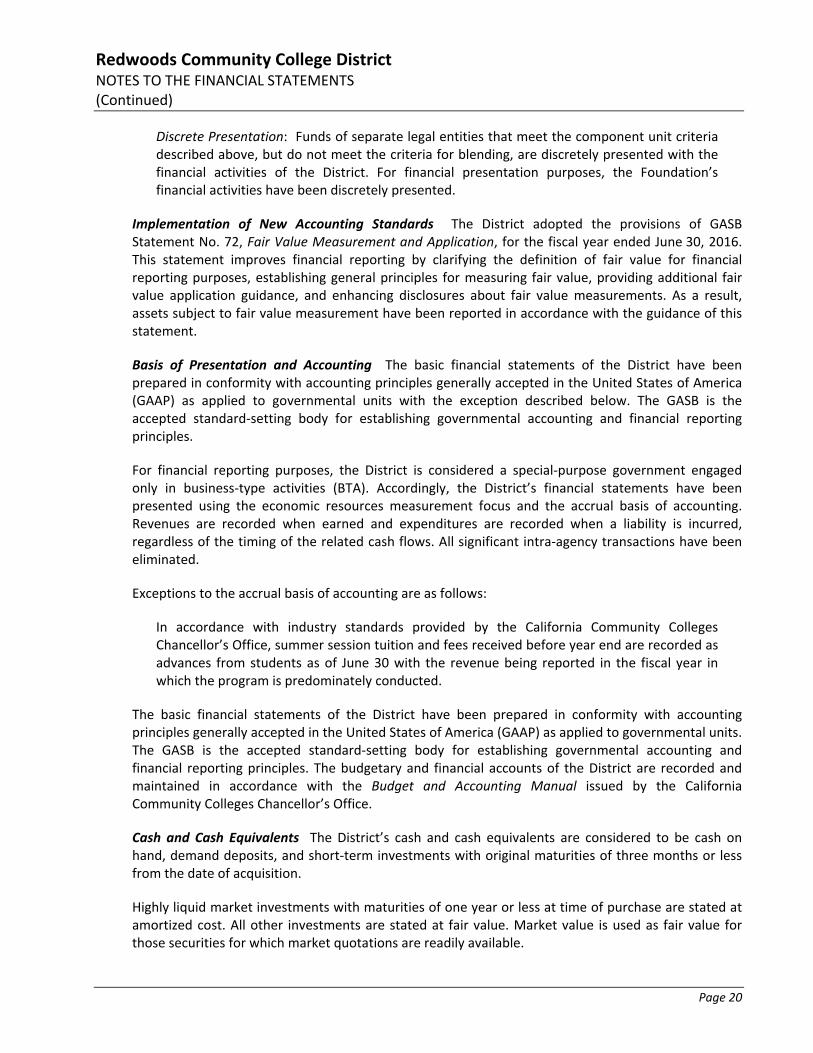
Discrete Presentation: Funds of separate legal entities that meet the component unit criteria described above, but do not meet the criteria for blending, are discretely presented with the financial activities of the District. For financial presentation purposes, the Foundation’s financial activities have been discretely presented.
Implementation of New Accounting Standards The District adopted the provisions of GASB Statement No. 72, Fair Value Measurement and Application, for the fiscal year ended June 30, 2016. This statement improves financial reporting by clarifying the definition of fair value for financial reporting purposes, establishing general principles for measuring fair value, providing additional fair value application guidance, and enhancing disclosures about fair value measurements. As a result, assets subject to fair value measurement have been reported in accordance with the guidance of this statement.
Basis of Presentation and Accounting The basic financial statements of the District have been prepared in conformity with accounting principles generally accepted in the United States of America (GAAP) as applied to governmental units with the exception described below. The GASB is the accepted standard‐setting body for establishing governmental accounting and financial reporting principles.
For financial reporting purposes, the District is considered a special‐purpose government engaged only in business‐type activities (BTA). Accordingly, the District’s financial statements have been presented using the economic resources measurement focus and the accrual basis of accounting. Revenues are recorded when earned and expenditures are recorded when a liability is incurred, regardless of the timing of the related cash flows. All significant intra‐agency transactions have been eliminated.
Exceptions to the accrual basis of accounting are as follows:
In accordance with industry standards provided by the California Community Colleges Chancellor’s Office, summer session tuition and fees received before year end are recorded as advances from students as of June 30 with the revenue being reported in the fiscal year in which the program is predominately conducted.
The basic financial statements of the District have been prepared in conformity with accounting principles generally accepted in the United States of America (GAAP) as applied to governmental units. The GASB is the accepted standard‐setting body for establishing governmental accounting and financial reporting principles. The budgetary and financial accounts of the District are recorded and maintained in accordance with the Budget and Accounting Manual issued by the California Community Colleges Chancellor’s Office.
Cash and Cash Equivalents The District’s cash and cash equivalents are considered to be cash on hand, demand deposits, and short‐term investments with original maturities of three months or less from the date of acquisition.
Highly liquid market investments with maturities of one year or less at time of purchase are stated at amortized cost. All other investments are stated at fair value. Market value is used as fair value for those securities for which market quotations are readily available.
Redwoods Community College District NOTES TO THE FINANCIAL STATEMENTS (Continued)
Page 21
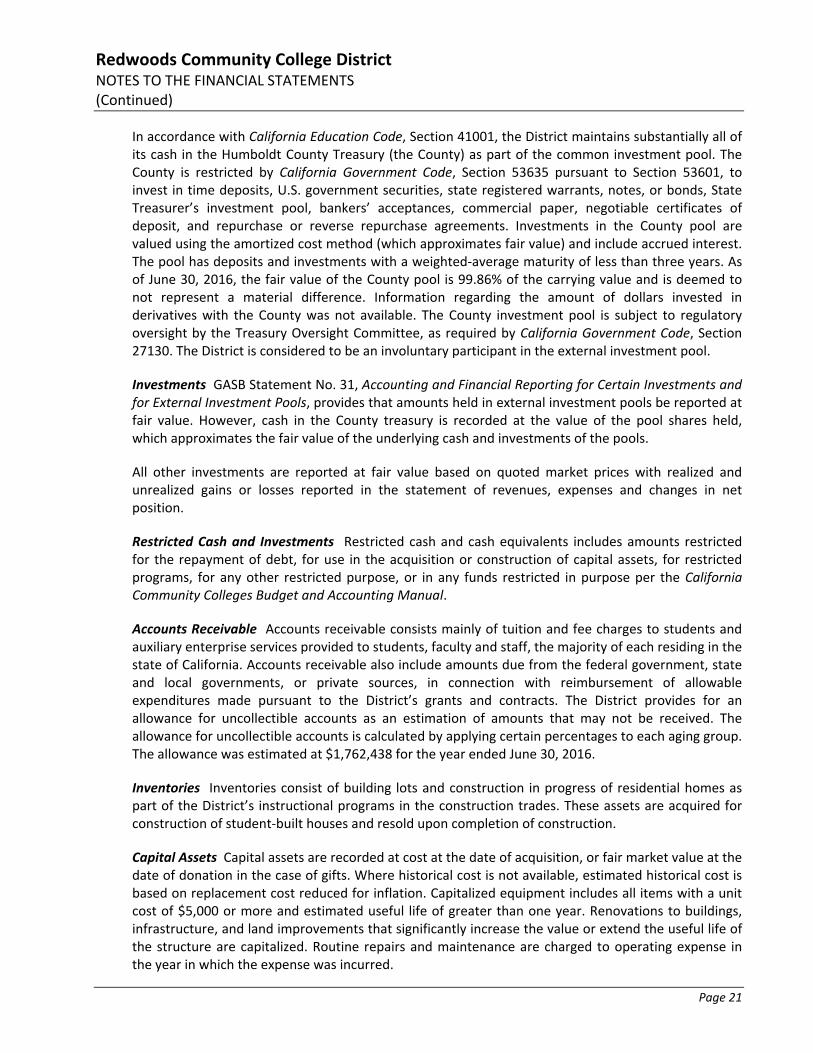
In accordance with California Education Code, Section 41001, the District maintains substantially all of its cash in the Humboldt County Treasury (the County) as part of the common investment pool. The County is restricted by California Government Code, Section 53635 pursuant to Section 53601, to invest in time deposits, U.S. government securities, state registered warrants, notes, or bonds, State Treasurer’s investment pool, bankers’ acceptances, commercial paper, negotiable certificates of deposit, and repurchase or reverse repurchase agreements. Investments in the County pool are valued using the amortized cost method (which approximates fair value) and include accrued interest. The pool has deposits and investments with a weighted‐average maturity of less than three years. As of June 30, 2016, the fair value of the County pool is 99.86% of the carrying value and is deemed to not represent a material difference. Information regarding the amount of dollars invested in derivatives with the County was not available. The County investment pool is subject to regulatory oversight by the Treasury Oversight Committee, as required by California Government Code, Section 27130. The District is considered to be an involuntary participant in the external investment pool.
Investments GASB Statement No. 31, Accounting and Financial Reporting for Certain Investments and for External Investment Pools, provides that amounts held in external investment pools be reported at fair value. However, cash in the County treasury is recorded at the value of the pool shares held, which approximates the fair value of the underlying cash and investments of the pools.
All other investments are reported at fair value based on quoted market prices with realized and unrealized gains or losses reported in the statement of revenues, expenses and changes in net position.
Restricted Cash and Investments Restricted cash and cash equivalents includes amounts restricted for the repayment of debt, for use in the acquisition or construction of capital assets, for restricted programs, for any other restricted purpose, or in any funds restricted in purpose per the California Community Colleges Budget and Accounting Manual.
Accounts Receivable Accounts receivable consists mainly of tuition and fee charges to students and auxiliary enterprise services provided to students, faculty and staff, the majority of each residing in the state of California. Accounts receivable also include amounts due from the federal government, state and local governments, or private sources, in connection with reimbursement of allowable expenditures made pursuant to the District’s grants and contracts. The District provides for an allowance for uncollectible accounts as an estimation of amounts that may not be received. The allowance for uncollectible accounts is calculated by applying certain percentages to each aging group. The allowance was estimated at $1,762,438 for the year ended June 30, 2016.
Inventories Inventories consist of building lots and construction in progress of residential homes as part of the District’s instructional programs in the construction trades. These assets are acquired for construction of student‐built houses and resold upon completion of construction.
Capital Assets Capital assets are recorded at cost at the date of acquisition, or fair market value at the date of donation in the case of gifts. Where historical cost is not available, estimated historical cost is based on replacement cost reduced for inflation. Capitalized equipment includes all items with a unit cost of $5,000 or more and estimated useful life of greater than one year. Renovations to buildings, infrastructure, and land improvements that significantly increase the value or extend the useful life of the structure are capitalized. Routine repairs and maintenance are charged to operating expense in the year in which the expense was incurred.
Redwoods Community College District NOTES TO THE FINANCIAL STATEMENTS (Continued)
Page 22
Depreciation of capitalized assets is computed using the straight‐line method over the estimated useful lives of the assets, generally 50 years for buildings and improvements, 10 years for site improvements, 3 to 8 years for equipment and vehicles, and 5 years for library books and film.
Advances From Grantors and Students Advances from grantors and students include amounts received for tuition and fees and certain auxiliary activities prior to the end of the fiscal year that relate to the subsequent accounting period. Advances of revenues also include amounts received from grant and contract sponsors that have not yet been earned.
Amounts Held for Others Amounts held for others represents funds held by the District for the associated students fund.
Compensated Absences Accumulated and vested unpaid employee vacation benefits and compensatory time are recognized as liabilities of the District as the benefits are earned.
Accumulated sick leave benefits are not recognized as liabilities of the District. The District’s policy is to record sick leave as an operating expense in the period taken since such benefits do not vest nor is payment probable; however, unused sick leave is added to the creditable service period for calculation of retirement benefits when the employee retires.
Long‐Term Liabilities Bond premiums and discounts are deferred and amortized over the life of the bonds using the effective interest method, or the straight‐line method if it does not materially differ from the effective interest method. Bonds payable are reported net of the applicable bond premium or discount. Bond issuance costs are expensed in the year incurred. Amortization of bond premium and discount costs was $167,341 for the year ended June 30, 2016.
Pension For purposes of measuring the net pension liability, deferred outflows of resources/deferred inflows of resources related to pensions, and pension expense, information about the fiduciary net position of the State Teachers’ Retirement Plan (STRP) and California Public Employees’ Retirement System (CalPERS) and additions to/deductions from STRP’s and CalPERS’s fiduciary net position have been determined on the same basis as they are reported by California State Teachers’ Retirement System (CalSTRS) and CalPERS. For this purpose, benefit payments (including refunds of employee contributions) are recognized when due and payable with the benefit terms. Investments are reported at fair value.
Fair Value Measurements The District categorizes its fair value measurements within the fair value hierarchy established by generally accepted accounting principles. The hierarchy is based on the valuation inputs used to measure the fair value of the asset. Level 1 inputs are quoted prices in active markets for identical assets; level 2 inputs are significant other observable inputs; and level 3 inputs are significant unobservable inputs.
Deferred Outflows/Inflows of Resources In addition to assets, the statement of net position includes a separate section for deferred outflows of resources. This separate financial statement element, deferred outflows of resources, represents a consumption of net position that applies to a future period, which will only be recognized as an outflow of resources (expense/expenditures) in the future. District pension contributions, subsequent to the measurement date, are reported as deferred outflows of resources in the government‐wide statement of net position. District contributions, subsequent to the measurement date, will be amortized during the next fiscal year.
Redwoods Community College District NOTES TO THE FINANCIAL STATEMENTS (Continued)
Page 23
In addition to liabilities, the statement of net position includes a separate section for deferred inflows of resources. This separate financial statement element, deferred inflows of resources, represents an acquisition of net position that applies to a future period and would only be recognized as an inflow of resources (revenue) at that time.
Changes in proportion and differences between District contributions and proportionate share of pension contributions, the District’s proportionate share of the net difference between projected and actual earnings on pension plan investments, changes in assumptions, and the differences between the District’s expected and actual experiences are reported as deferred inflows of resources or deferred outflows of resources in the government‐wide statement of net position. These amounts are amortized over the estimated service lives of the pension plan participants.
A deferred gain on refunding results from the difference in the carrying value of refunded debt and its reacquisition price. This amount is deferred and amortized over the shortened life of the refunded or refunding debt.
Net Position The District’s net position is classified as follows:
Net Investment in Capital Assets: This represents the District’s total investment in capital assets, net of outstanding debt obligations related to those capital assets. To the extent debt has been incurred but not yet expended for capital assets, such amounts are not included as a component net investment in capital assets.
Restricted Net Position ‐ Nonexpendable: Consists of endowment and similar type funds in which donors or other outside sources have stipulated, as a condition of the gift instrument, that the principal is to be maintained inviolate and in perpetuity, and invested for the purpose of producing present and future income, which may be expended or added to principal depending on donor stipulations.
Restricted Net Position ‐ Expendable: Restricted expendable net position represents resources which are legally or contractually obligated to be spent in accordance with restrictions imposed by external third parties.
Unrestricted Net Position: Unrestricted net position represents resources derived from student tuition and fees, state apportionments, and sales and services of educational departments and auxiliary enterprises. These resources are used for transactions relating to the educational and general operations of the District, and may be used at the discretion of the governing board to meet current expenses for any purpose.
When an expense is incurred that can be paid using either restricted or unrestricted resources, the District’s policy is to first apply the expense toward restricted resources, and then toward unrestricted resources.
Classification of Revenues The District has classified its revenues as either operating or non‐operating. Certain significant revenue streams relied upon for operations are recorded as non‐operating revenues, including state appropriations, local property taxes, and investment income.
Redwoods Community College District NOTES TO THE FINANCIAL STATEMENTS (Continued)
Page 24
Revenues are classified according to the following criteria:
Operating Revenues: Operating revenues include activities that have the characteristics of exchange transactions, such as: (1) student tuition and fees, net of scholarship discounts and allowances; (2) sales and services of auxiliary enterprises; (3) most federal, state, and local grants and contracts, and federal appropriations; and (4) interest on institutional student loans.
Nonoperating Revenues: Nonoperating revenues include activities that have the characteristics of nonexchange transactions, such as gifts and contributions, and other revenue sources described in GASB Statement No. 34, Basic Financial Statements – and Management’s Discussion and Analysis – for State and Local Government, such as state appropriations, financial aid, and investment income.
Scholarship Discounts and Allowances Student tuition and fee revenue are reported net of scholarship discounts and allowances in the statement of revenues, expenses, and changes in net position. Scholarship discounts and allowances represent the difference between stated charges for goods and services provided by the District and the amount that is paid by students and/or third parties making payments on the students’ behalf.
State Apportionments Certain current‐year apportionments from the state are based on various financial and statistical information of the previous year as well as state budgets and other factors outside the District’s control. In February, subsequent to the year end, the state performs a recalculation based on actual financial and statistical information for the year just completed. The District’s policy is to estimate the recalculation correction to apportionment, if any, based on factors it can reasonably determine such as local property tax revenue received and changes in full‐time equivalent students. Any additional corrections determined by the state are recorded in the year computed by the state.
Estimates The preparation of financial statements in conformity with accounting principles generally accepted in the United States of America requires management to make estimates and assumptions that affect the amounts reported in the basic financial statements and accompanying notes. Actual results may differ from those estimates.
Property Taxes Secured property taxes attach as an enforceable lien on property as of January 1. Taxes are payable in two installments on November 1 and February 1 and become delinquent if paid after December 10 and April 10. Unsecured property taxes are payable in one installment on or before August 31. The respective counties bill and collect the taxes for the District.
Budget and Budgetary Accounting By state law, the District’s governing board must approve a tentative budget no later than July 1, and adopt a final budget no later than September 15 of each year. A hearing must be conducted for public comments prior to adoption. The District’s governing board satisfied these requirements.
The budget is revised during the year to incorporate categorical funds that are awarded during the year and miscellaneous changes to the spending plans. The District’s governing board approves revisions to the budget.
Redwoods Community College District NOTES TO THE FINANCIAL STATEMENTS (Continued)
Page 25
On‐Behalf Payments GASB Statement 24, Accounting and Financial Reporting for Certain Grants and Other Financial Assistance, requires that direct on‐behalf payments for fringe benefits, and salaries made by an entity to a third‐party recipient for the employees of another legally separate entity, be recognized as revenue and expenditures by the employer government. The state of California makes direct on‐behalf payments for retirement benefits to CalSTRS and CalPERS on behalf of all community college districts in California. The amount reported in the basic financial statements as of June 30, 2016, was $80,709.
2. CASH, CASH EQUIVALENTS, AND INVESTMENTS
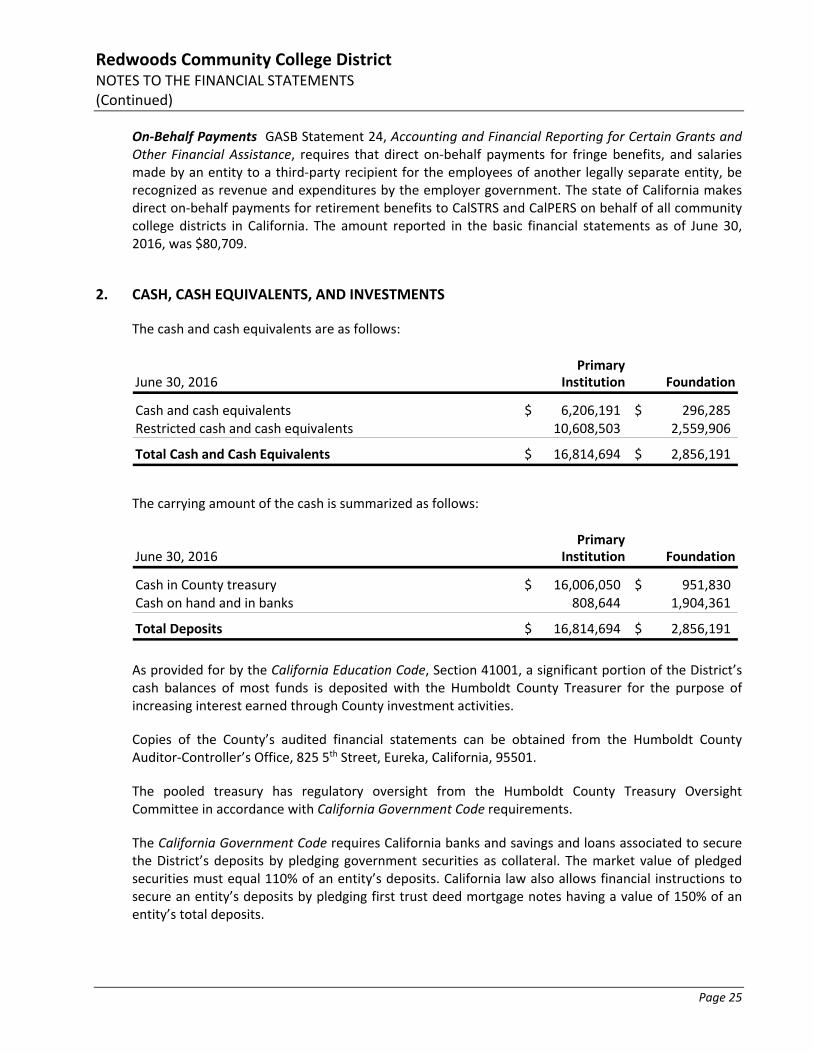
The cash and cash equivalents are as follows:
PrimaryJune 30, 2016 Institution Foundation
Cash and cash equivalents 6,206,191$ 296,285$ Restricted cash and cash equivalents 10,608,503 2,559,906
Total Cash and Cash Equivalents 16,814,694$ 2,856,191$
The carrying amount of the cash is summarized as follows:
PrimaryJune 30, 2016 Institution Foundation
Cash in County treasury 16,006,050$ 951,830$ Cash on hand and in banks 808,644 1,904,361
Total Deposits 16,814,694$ 2,856,191$
As provided for by the California Education Code, Section 41001, a significant portion of the District’s cash balances of most funds is deposited with the Humboldt County Treasurer for the purpose of increasing interest earned through County investment activities.
Copies of the County’s audited financial statements can be obtained from the Humboldt County Auditor‐Controller’s Office, 825 5th Street, Eureka, California, 95501.
The pooled treasury has regulatory oversight from the Humboldt County Treasury Oversight Committee in accordance with California Government Code requirements.
The California Government Code requires California banks and savings and loans associated to secure the District’s deposits by pledging government securities as collateral. The market value of pledged securities must equal 110% of an entity’s deposits. California law also allows financial instructions to secure an entity’s deposits by pledging first trust deed mortgage notes having a value of 150% of an entity’s total deposits.
Redwoods Community College District NOTES TO THE FINANCIAL STATEMENTS (Continued)
Page 26
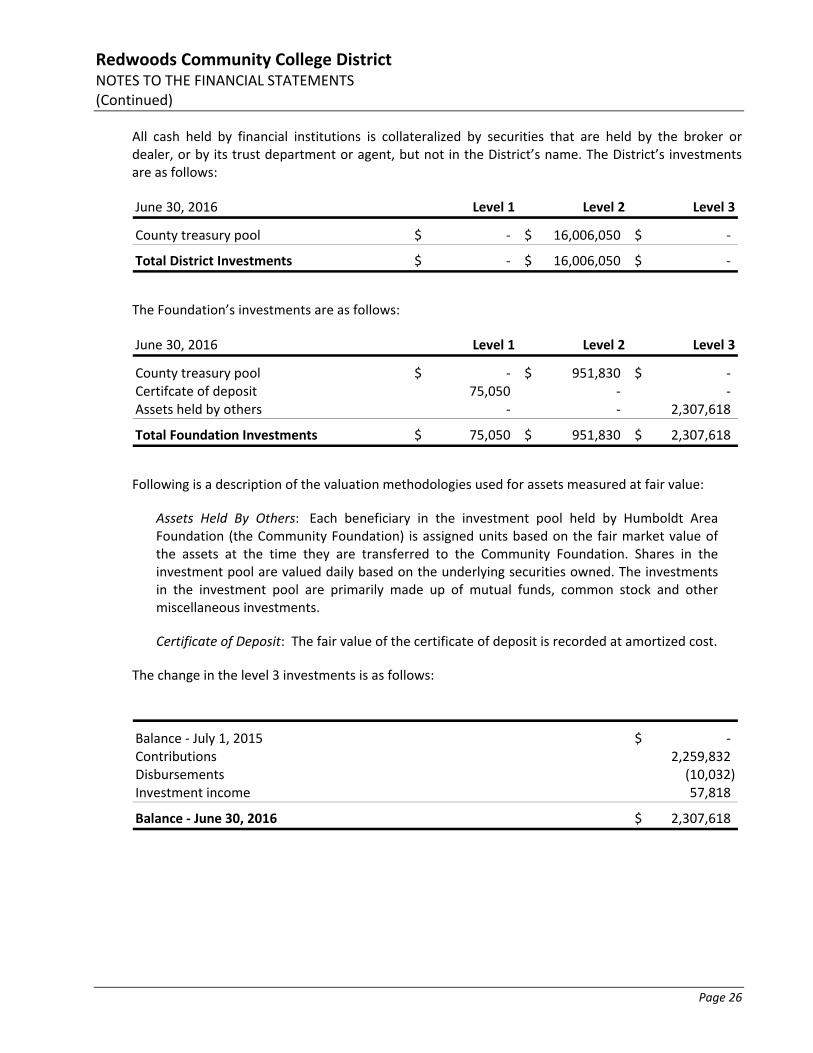
All cash held by financial institutions is collateralized by securities that are held by the broker or dealer, or by its trust department or agent, but not in the District’s name. The District’s investments are as follows:
June 30, 2016 Level 1 Level 2 Level 3
County treasury pool ‐$ 16,006,050$ ‐$
Total District Investments ‐$ 16,006,050$ ‐$
The Foundation’s investments are as follows:
June 30, 2016 Level 1 Level 2 Level 3
County treasury pool ‐$ 951,830$ ‐$ Certifcate of deposit 75,050 ‐ ‐ Assets held by others ‐ ‐ 2,307,618
Total Foundation Investments 75,050$ 951,830$ 2,307,618$
Following is a description of the valuation methodologies used for assets measured at fair value:
Assets Held By Others: Each beneficiary in the investment pool held by Humboldt Area Foundation (the Community Foundation) is assigned units based on the fair market value of the assets at the time they are transferred to the Community Foundation. Shares in the investment pool are valued daily based on the underlying securities owned. The investments in the investment pool are primarily made up of mutual funds, common stock and other miscellaneous investments.
Certificate of Deposit: The fair value of the certificate of deposit is recorded at amortized cost.
The change in the level 3 investments is as follows:
Balance ‐ July 1, 2015 ‐$ Contributions 2,259,832 Disbursements (10,032) Investment income 57,818
Balance ‐ June 30, 2016 2,307,618$
Redwoods Community College District NOTES TO THE FINANCIAL STATEMENTS (Continued)
Page 27
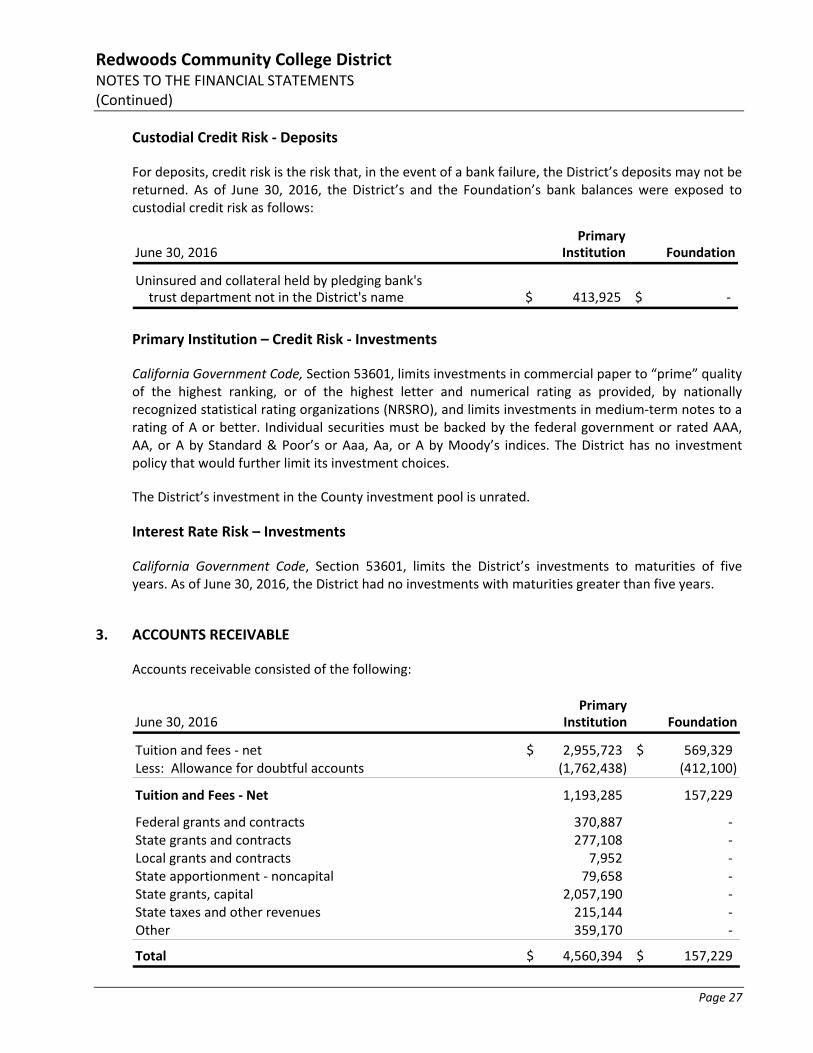
Custodial Credit Risk ‐ Deposits
For deposits, credit risk is the risk that, in the event of a bank failure, the District’s deposits may not be returned. As of June 30, 2016, the District’s and the Foundation’s bank balances were exposed to custodial credit risk as follows:
PrimaryJune 30, 2016 Institution Foundation
Uninsured and collateral held by pledging bank's trust department not in the District's name 413,925$ ‐$
Primary Institution – Credit Risk ‐ Investments
California Government Code, Section 53601, limits investments in commercial paper to “prime” quality of the highest ranking, or of the highest letter and numerical rating as provided, by nationally recognized statistical rating organizations (NRSRO), and limits investments in medium‐term notes to a rating of A or better. Individual securities must be backed by the federal government or rated AAA, AA, or A by Standard & Poor’s or Aaa, Aa, or A by Moody’s indices. The District has no investment policy that would further limit its investment choices.
The District’s investment in the County investment pool is unrated.
Interest Rate Risk – Investments
California Government Code, Section 53601, limits the District’s investments to maturities of five years. As of June 30, 2016, the District had no investments with maturities greater than five years.
3. ACCOUNTS RECEIVABLE
Accounts receivable consisted of the following:
PrimaryJune 30, 2016 Institution Foundation
Tuition and fees ‐ net 2,955,723$ 569,329$ Less: Allowance for doubtful accounts (1,762,438) (412,100)
Tuition and Fees ‐ Net 1,193,285 157,229
Federal grants and contracts 370,887 ‐ State grants and contracts 277,108 ‐ Local grants and contracts 7,952 ‐ State apportionment ‐ noncapital 79,658 ‐ State grants, capital 2,057,190 ‐ State taxes and other revenues 215,144 ‐ Other 359,170 ‐
Total 4,560,394$ 157,229$
Redwoods Community College District NOTES TO THE FINANCIAL STATEMENTS (Continued)
Page 28
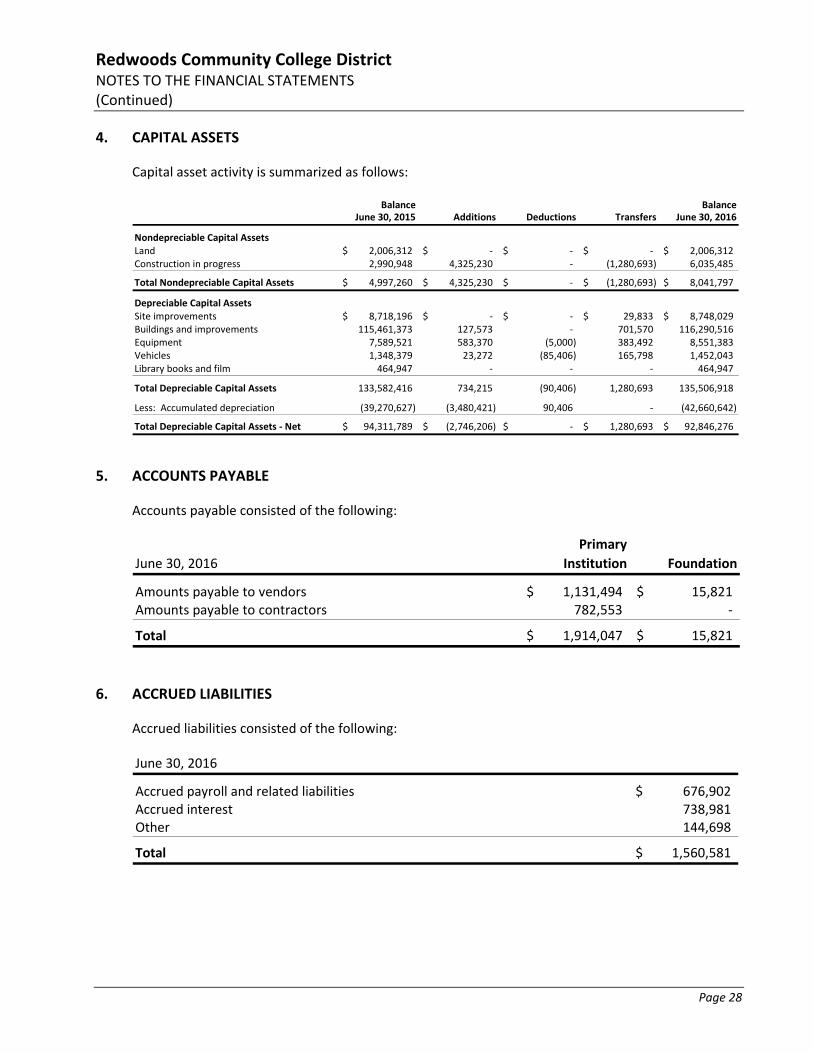
4. CAPITAL ASSETS
Capital asset activity is summarized as follows:
Balance BalanceJune 30, 2015 Additions Deductions Transfers June 30, 2016
Nondepreciable Capital AssetsLand 2,006,312$ ‐$ ‐$ ‐$ 2,006,312$ Construction in progress 2,990,948 4,325,230 ‐ (1,280,693) 6,035,485
Total Nondepreciable Capital Assets 4,997,260$ 4,325,230$ ‐$ (1,280,693)$ 8,041,797$
Depreciable Capital AssetsSite improvements 8,718,196$ ‐$ ‐$ 29,833$ 8,748,029$ Buildings and improvements 115,461,373 127,573 ‐ 701,570 116,290,516 Equipment 7,589,521 583,370 (5,000) 383,492 8,551,383 Vehicles 1,348,379 23,272 (85,406) 165,798 1,452,043 Library books and film 464,947 ‐ ‐ ‐ 464,947
Total Depreciable Capital Assets 133,582,416 734,215 (90,406) 1,280,693 135,506,918
Less: Accumulated depreciation (39,270,627) (3,480,421) 90,406 ‐ (42,660,642)
Total Depreciable Capital Assets ‐ Net 94,311,789$ (2,746,206)$ ‐$ 1,280,693$ 92,846,276$
5. ACCOUNTS PAYABLE
Accounts payable consisted of the following:
Primary
June 30, 2016 Institution Foundation
Amounts payable to vendors 1,131,494$ 15,821$ Amounts payable to contractors 782,553 ‐
Total 1,914,047$ 15,821$
6. ACCRUED LIABILITIES
Accrued liabilities consisted of the following:
June 30, 2016
Accrued payroll and related liabilities 676,902$ Accrued interest 738,981 Other 144,698
Total 1,560,581$
Redwoods Community College District NOTES TO THE FINANCIAL STATEMENTS (Continued)
Page 29
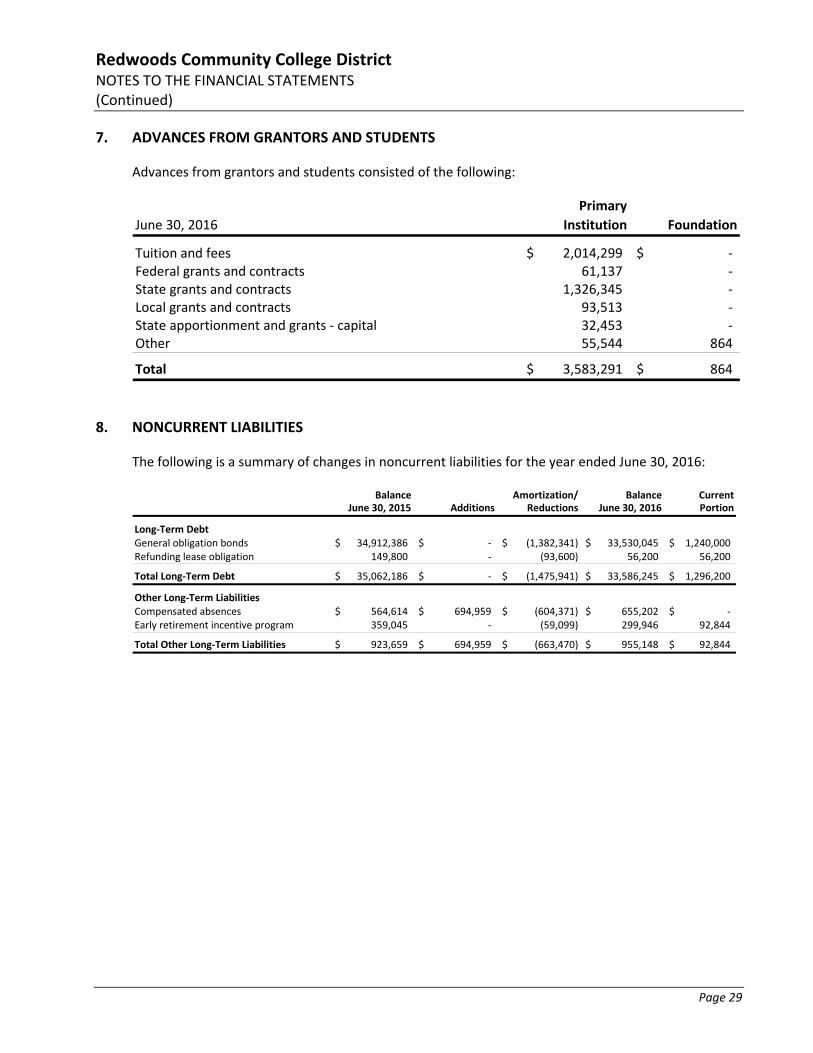
7. ADVANCES FROM GRANTORS AND STUDENTS
Advances from grantors and students consisted of the following:
Primary
June 30, 2016 Institution Foundation
Tuition and fees 2,014,299$ ‐$ Federal grants and contracts 61,137 ‐ State grants and contracts 1,326,345 ‐ Local grants and contracts 93,513 ‐ State apportionment and grants ‐ capital 32,453 ‐ Other 55,544 864
Total 3,583,291$ 864$
8. NONCURRENT LIABILITIES
The following is a summary of changes in noncurrent liabilities for the year ended June 30, 2016:
Balance Amortization/ Balance CurrentJune 30, 2015 Additions Reductions June 30, 2016 Portion
Long‐Term DebtGeneral obligation bonds 34,912,386$ ‐$ (1,382,341)$ 33,530,045$ 1,240,000$ Refunding lease obligation 149,800 ‐ (93,600) 56,200 56,200
Total Long‐Term Debt 35,062,186$ ‐$ (1,475,941)$ 33,586,245$ 1,296,200$
Other Long‐Term LiabilitiesCompensated absences 564,614$ 694,959$ (604,371)$ 655,202$ ‐$ Early retirement incentive program 359,045 ‐ (59,099) 299,946 92,844
Total Other Long‐Term Liabilities 923,659$ 694,959$ (663,470)$ 955,148$ 92,844$
Redwoods Community College District NOTES TO THE FINANCIAL STATEMENTS (Continued)
Page 30
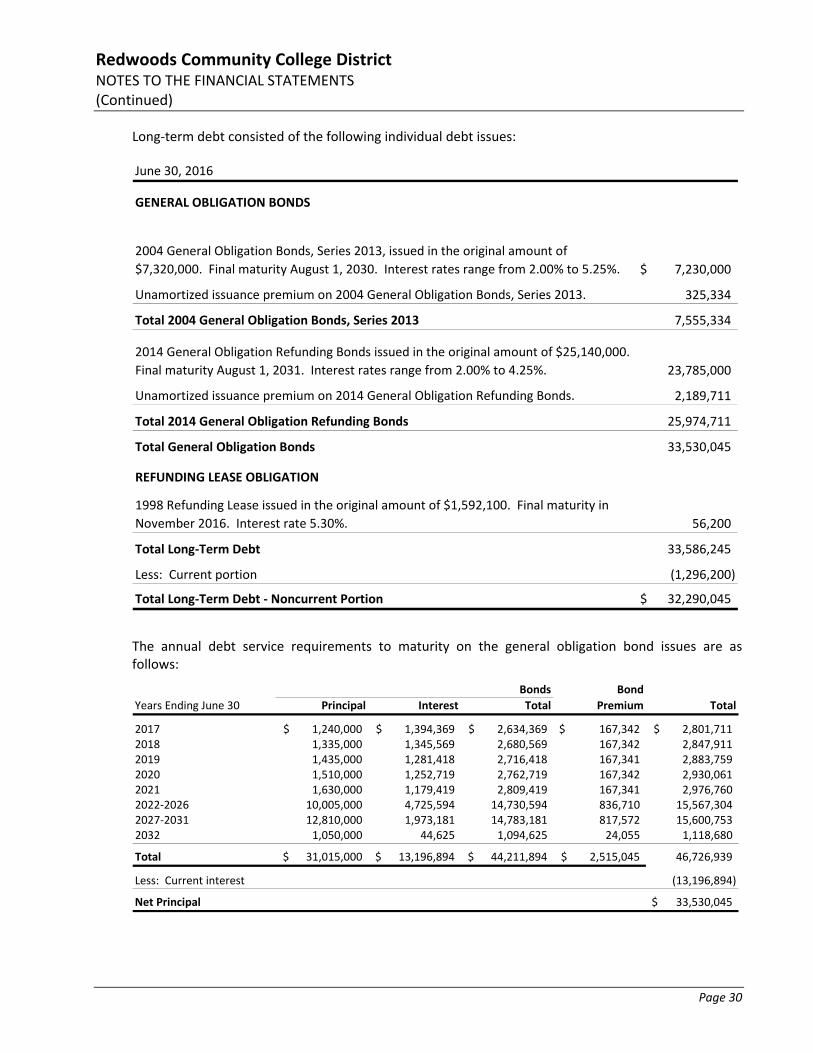
Long‐term debt consisted of the following individual debt issues:
June 30, 2016
GENERAL OBLIGATION BONDS
2004 General Obligation Bonds, Series 2013, issued in the original amount of
$7,320,000. Final maturity August 1, 2030. Interest rates range from 2.00% to 5.25%. 7,230,000$
Unamortized issuance premium on 2004 General Obligation Bonds, Series 2013. 325,334
Total 2004 General Obligation Bonds, Series 2013 7,555,334
2014 General Obligation Refunding Bonds issued in the original amount of $25,140,000.
Final maturity August 1, 2031. Interest rates range from 2.00% to 4.25%. 23,785,000
Unamortized issuance premium on 2014 General Obligation Refunding Bonds. 2,189,711
Total 2014 General Obligation Refunding Bonds 25,974,711
Total General Obligation Bonds 33,530,045
REFUNDING LEASE OBLIGATION
1998 Refunding Lease issued in the original amount of $1,592,100. Final maturity in
November 2016. Interest rate 5.30%. 56,200
Total Long‐Term Debt 33,586,245
Less: Current portion (1,296,200)
Total Long‐Term Debt ‐ Noncurrent Portion 32,290,045$
The annual debt service requirements to maturity on the general obligation bond issues are as follows:
Bonds Bond
Years Ending June 30 Principal Interest Total Premium Total
2017 1,240,000$ 1,394,369$ 2,634,369$ 167,342$ 2,801,711$ 2018 1,335,000 1,345,569 2,680,569 167,342 2,847,911 2019 1,435,000 1,281,418 2,716,418 167,341 2,883,759 2020 1,510,000 1,252,719 2,762,719 167,342 2,930,061 2021 1,630,000 1,179,419 2,809,419 167,341 2,976,760 2022‐2026 10,005,000 4,725,594 14,730,594 836,710 15,567,304 2027‐2031 12,810,000 1,973,181 14,783,181 817,572 15,600,753 2032 1,050,000 44,625 1,094,625 24,055 1,118,680
Total 31,015,000$ 13,196,894$ 44,211,894$ 2,515,045$ 46,726,939
Less: Current interest (13,196,894)
Net Principal 33,530,045$
Redwoods Community College District NOTES TO THE FINANCIAL STATEMENTS (Continued)
Page 31
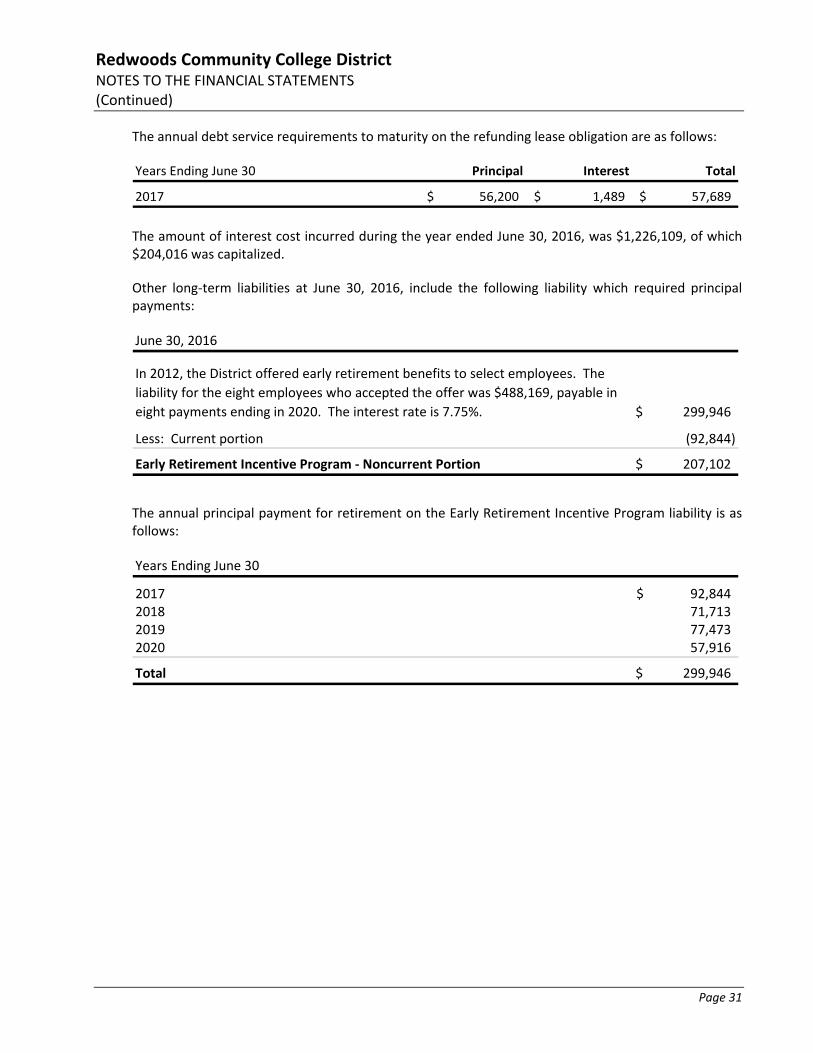
The annual debt service requirements to maturity on the refunding lease obligation are as follows:
Years Ending June 30 Principal Interest Total
2017 56,200$ 1,489$ 57,689$
The amount of interest cost incurred during the year ended June 30, 2016, was $1,226,109, of which $204,016 was capitalized.
Other long‐term liabilities at June 30, 2016, include the following liability which required principal payments:
June 30, 2016
In 2012, the District offered early retirement benefits to select employees. The
liability for the eight employees who accepted the offer was $488,169, payable in
eight payments ending in 2020. The interest rate is 7.75%. 299,946$
Less: Current portion (92,844)
Early Retirement Incentive Program ‐ Noncurrent Portion 207,102$
The annual principal payment for retirement on the Early Retirement Incentive Program liability is as follows:
Years Ending June 30
2017 92,844$ 2018 71,713 2019 77,473 2020 57,916
Total 299,946$
Redwoods Community College District NOTES TO THE FINANCIAL STATEMENTS (Continued)
Page 32
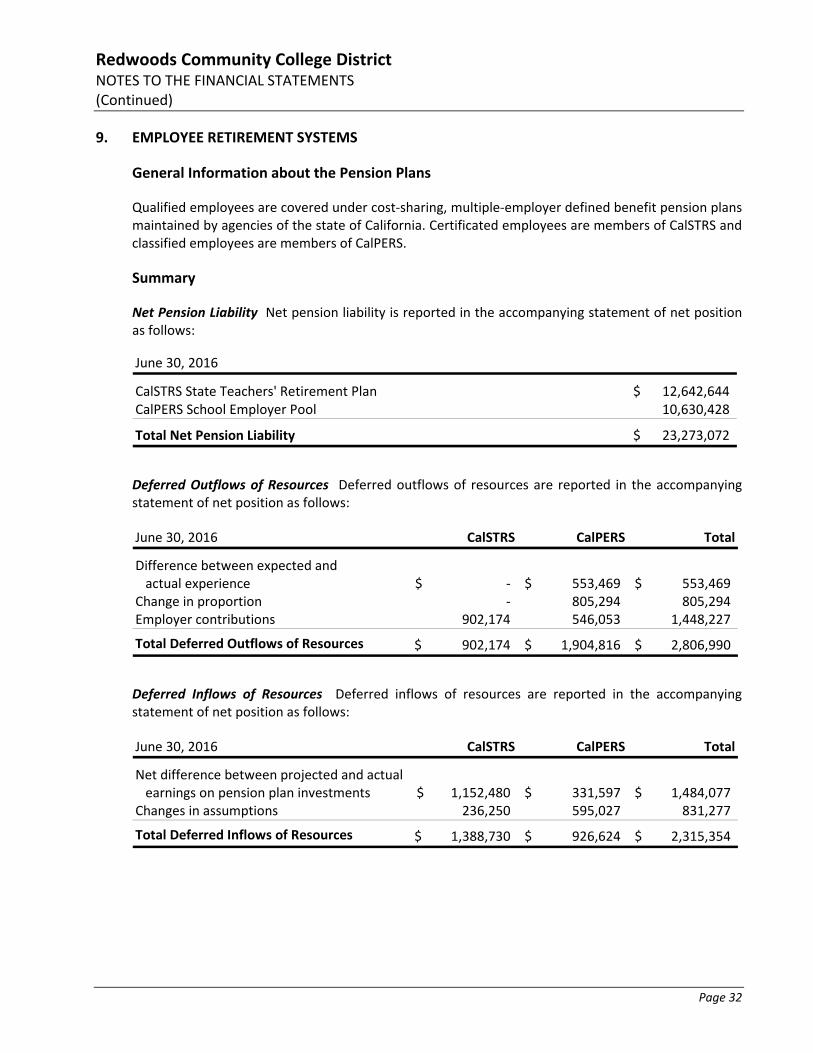
9. EMPLOYEE RETIREMENT SYSTEMS
General Information about the Pension Plans
Qualified employees are covered under cost‐sharing, multiple‐employer defined benefit pension plansmaintained by agencies of the state of California. Certificated employees are members of CalSTRS andclassified employees are members of CalPERS.
Summary
Net Pension Liability Net pension liability is reported in the accompanying statement of net positionas follows:
June 30, 2016
CalSTRS State Teachers' Retirement Plan 12,642,644$ CalPERS School Employer Pool 10,630,428
Total Net Pension Liability 23,273,072$
Deferred Outflows of Resources Deferred outflows of resources are reported in the accompanying statement of net position as follows:
June 30, 2016 CalSTRS CalPERS Total
Difference between expected and actual experience ‐$ 553,469$ 553,469$
Change in proportion ‐ 805,294 805,294 Employer contributions 902,174 546,053 1,448,227
Total Deferred Outflows of Resources 902,174$ 1,904,816$ 2,806,990$
Deferred Inflows of Resources Deferred inflows of resources are reported in the accompanying statement of net position as follows:
June 30, 2016 CalSTRS CalPERS Total
Net difference between projected and actual earnings on pension plan investments 1,152,480$ 331,597$ 1,484,077$
Changes in assumptions 236,250 595,027 831,277
Total Deferred Inflows of Resources 1,388,730$ 926,624$ 2,315,354$
Redwoods Community College District NOTES TO THE FINANCIAL STATEMENTS (Continued)
Page 33
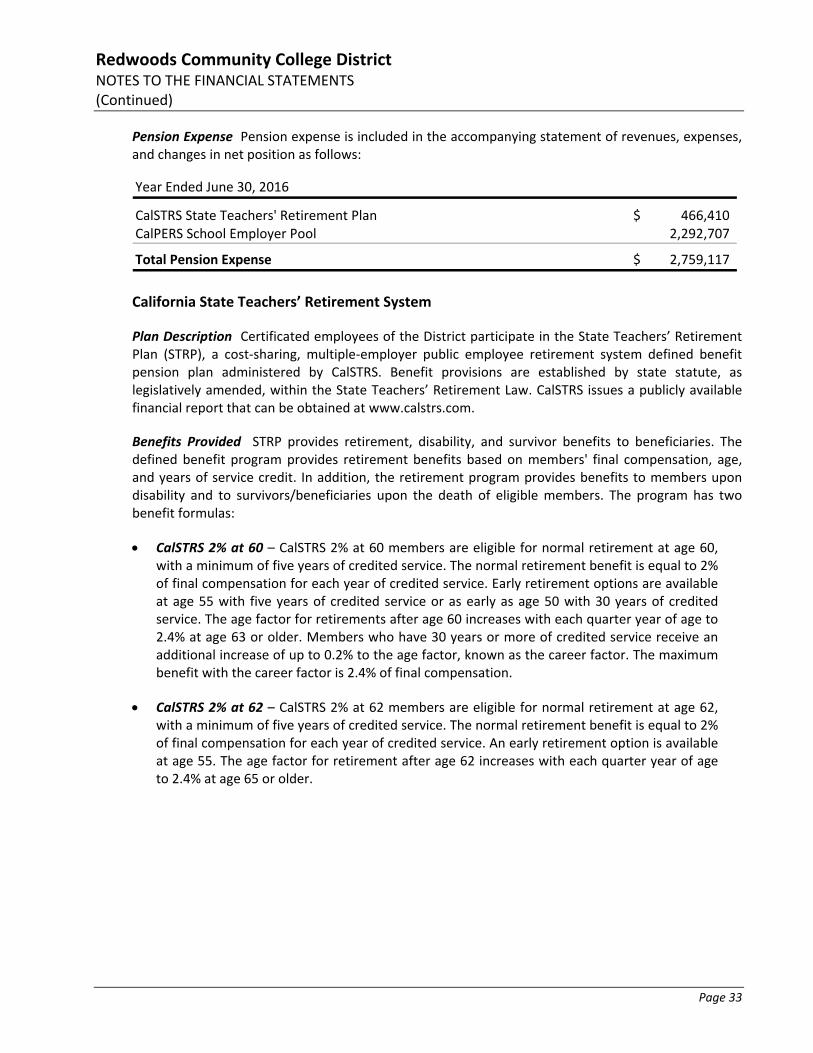
Pension Expense Pension expense is included in the accompanying statement of revenues, expenses, and changes in net position as follows:
Year Ended June 30, 2016
CalSTRS State Teachers' Retirement Plan 466,410$ CalPERS School Employer Pool 2,292,707
Total Pension Expense 2,759,117$
California State Teachers’ Retirement System
Plan Description Certificated employees of the District participate in the State Teachers’ Retirement Plan (STRP), a cost‐sharing, multiple‐employer public employee retirement system defined benefit pension plan administered by CalSTRS. Benefit provisions are established by state statute, as legislatively amended, within the State Teachers’ Retirement Law. CalSTRS issues a publicly available financial report that can be obtained at www.calstrs.com.
Benefits Provided STRP provides retirement, disability, and survivor benefits to beneficiaries. The defined benefit program provides retirement benefits based on members' final compensation, age, and years of service credit. In addition, the retirement program provides benefits to members upon disability and to survivors/beneficiaries upon the death of eligible members. The program has two benefit formulas:
CalSTRS 2% at 60 – CalSTRS 2% at 60 members are eligible for normal retirement at age 60, with a minimum of five years of credited service. The normal retirement benefit is equal to 2% of final compensation for each year of credited service. Early retirement options are available at age 55 with five years of credited service or as early as age 50 with 30 years of credited service. The age factor for retirements after age 60 increases with each quarter year of age to 2.4% at age 63 or older. Members who have 30 years or more of credited service receive an additional increase of up to 0.2% to the age factor, known as the career factor. The maximum benefit with the career factor is 2.4% of final compensation.
CalSTRS 2% at 62 – CalSTRS 2% at 62 members are eligible for normal retirement at age 62, with a minimum of five years of credited service. The normal retirement benefit is equal to 2% of final compensation for each year of credited service. An early retirement option is available at age 55. The age factor for retirement after age 62 increases with each quarter year of age to 2.4% at age 65 or older.
Redwoods Community College District NOTES TO THE FINANCIAL STATEMENTS (Continued)
Page 34
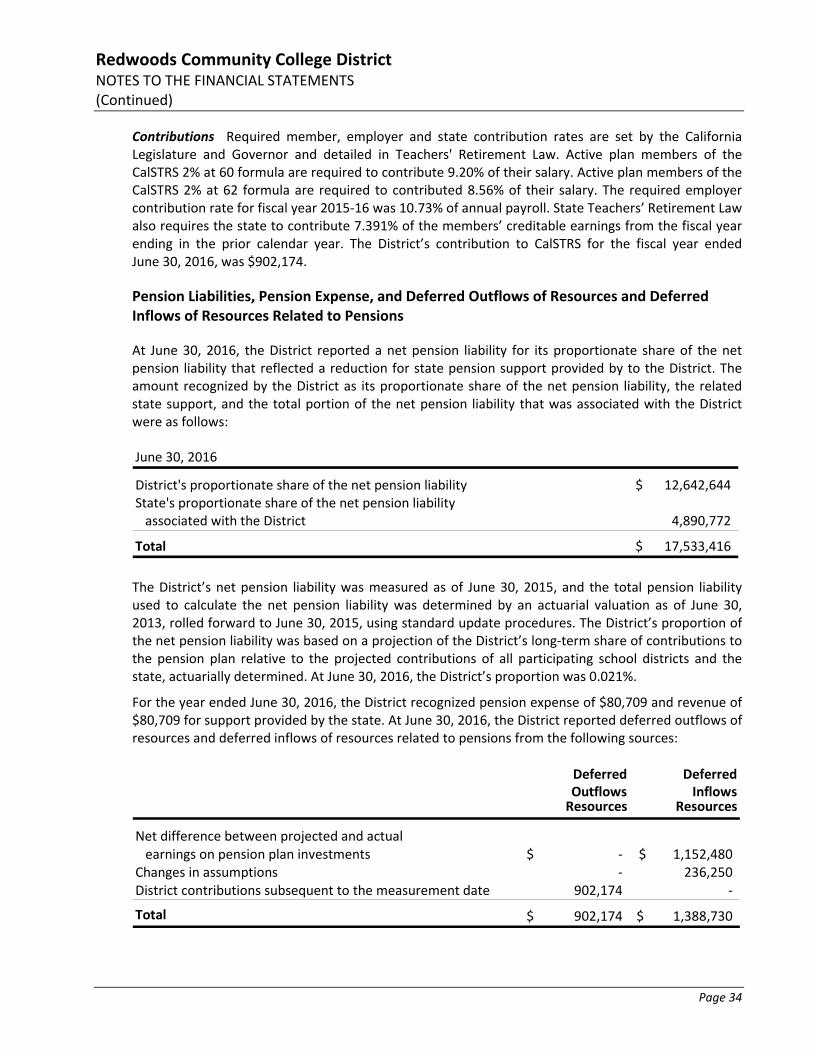
Contributions Required member, employer and state contribution rates are set by the California Legislature and Governor and detailed in Teachers' Retirement Law. Active plan members of the CalSTRS 2% at 60 formula are required to contribute 9.20% of their salary. Active plan members of the CalSTRS 2% at 62 formula are required to contributed 8.56% of their salary. The required employer contribution rate for fiscal year 2015‐16 was 10.73% of annual payroll. State Teachers’ Retirement Law also requires the state to contribute 7.391% of the members’ creditable earnings from the fiscal year ending in the prior calendar year. The District’s contribution to CalSTRS for the fiscal year ended June 30, 2016, was $902,174.
Pension Liabilities, Pension Expense, and Deferred Outflows of Resources and Deferred Inflows of Resources Related to Pensions
At June 30, 2016, the District reported a net pension liability for its proportionate share of the net pension liability that reflected a reduction for state pension support provided by to the District. The amount recognized by the District as its proportionate share of the net pension liability, the related state support, and the total portion of the net pension liability that was associated with the District were as follows:
June 30, 2016
District's proportionate share of the net pension liability 12,642,644$ State's proportionate share of the net pension liabilityassociated with the District 4,890,772
Total 17,533,416$
The District’s net pension liability was measured as of June 30, 2015, and the total pension liability used to calculate the net pension liability was determined by an actuarial valuation as of June 30, 2013, rolled forward to June 30, 2015, using standard update procedures. The District’s proportion of the net pension liability was based on a projection of the District’s long‐term share of contributions to the pension plan relative to the projected contributions of all participating school districts and the state, actuarially determined. At June 30, 2016, the District’s proportion was 0.021%.
For the year ended June 30, 2016, the District recognized pension expense of $80,709 and revenue of $80,709 for support provided by the state. At June 30, 2016, the District reported deferred outflows of resources and deferred inflows of resources related to pensions from the following sources:
Deferred DeferredOutflows InflowsResources Resources
Net difference between projected and actual earnings on pension plan investments ‐$ 1,152,480$
Changes in assumptions ‐ 236,250 District contributions subsequent to the measurement date 902,174 ‐
Total 902,174$ 1,388,730$
Redwoods Community College District NOTES TO THE FINANCIAL STATEMENTS (Continued)
Page 35
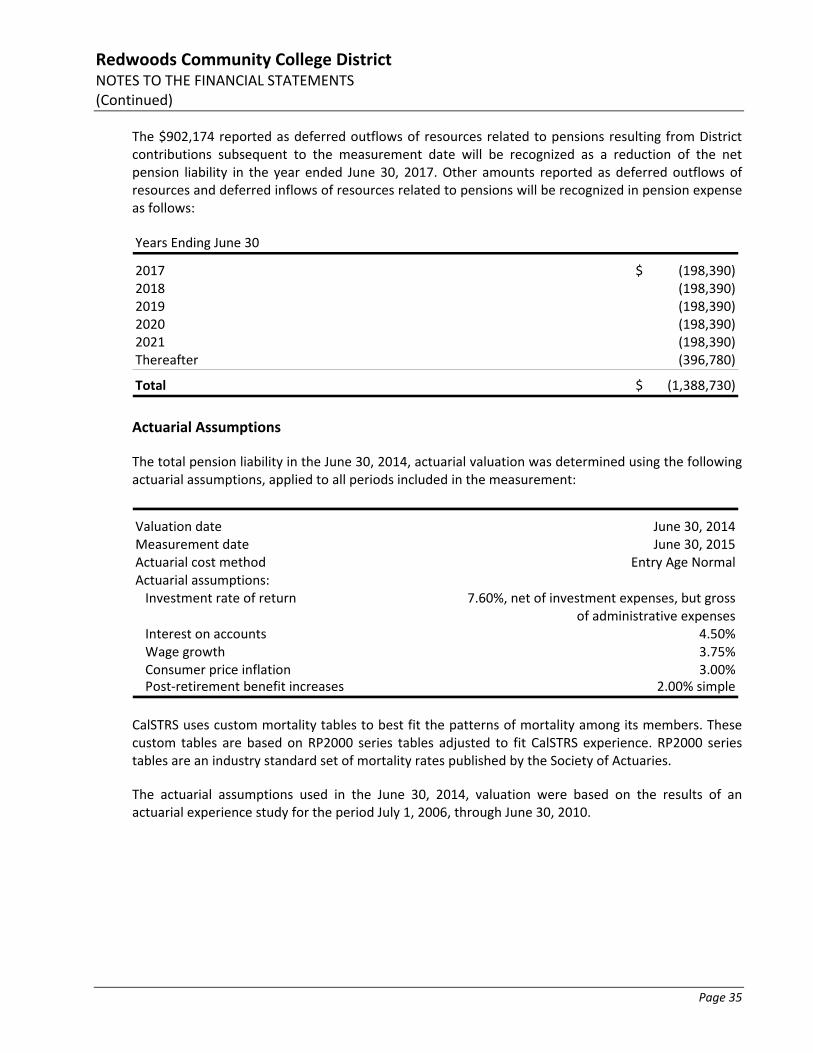
The $902,174 reported as deferred outflows of resources related to pensions resulting from District contributions subsequent to the measurement date will be recognized as a reduction of the net pension liability in the year ended June 30, 2017. Other amounts reported as deferred outflows of resources and deferred inflows of resources related to pensions will be recognized in pension expense as follows:
Years Ending June 30
2017 (198,390)$ 2018 (198,390) 2019 (198,390) 2020 (198,390) 2021 (198,390) Thereafter (396,780)
Total (1,388,730)$
Actuarial Assumptions
The total pension liability in the June 30, 2014, actuarial valuation was determined using the following actuarial assumptions, applied to all periods included in the measurement:
Valuation date June 30, 2014Measurement date June 30, 2015Actuarial cost method Entry Age NormalActuarial assumptions:Investment rate of return 7.60%, net of investment expenses, but gross
of administrative expensesInterest on accounts 4.50%Wage growth 3.75%Consumer price inflation 3.00%Post‐retirement benefit increases 2.00% simple
CalSTRS uses custom mortality tables to best fit the patterns of mortality among its members. These custom tables are based on RP2000 series tables adjusted to fit CalSTRS experience. RP2000 series tables are an industry standard set of mortality rates published by the Society of Actuaries.
The actuarial assumptions used in the June 30, 2014, valuation were based on the results of an actuarial experience study for the period July 1, 2006, through June 30, 2010.
Redwoods Community College District NOTES TO THE FINANCIAL STATEMENTS (Continued)
Page 36
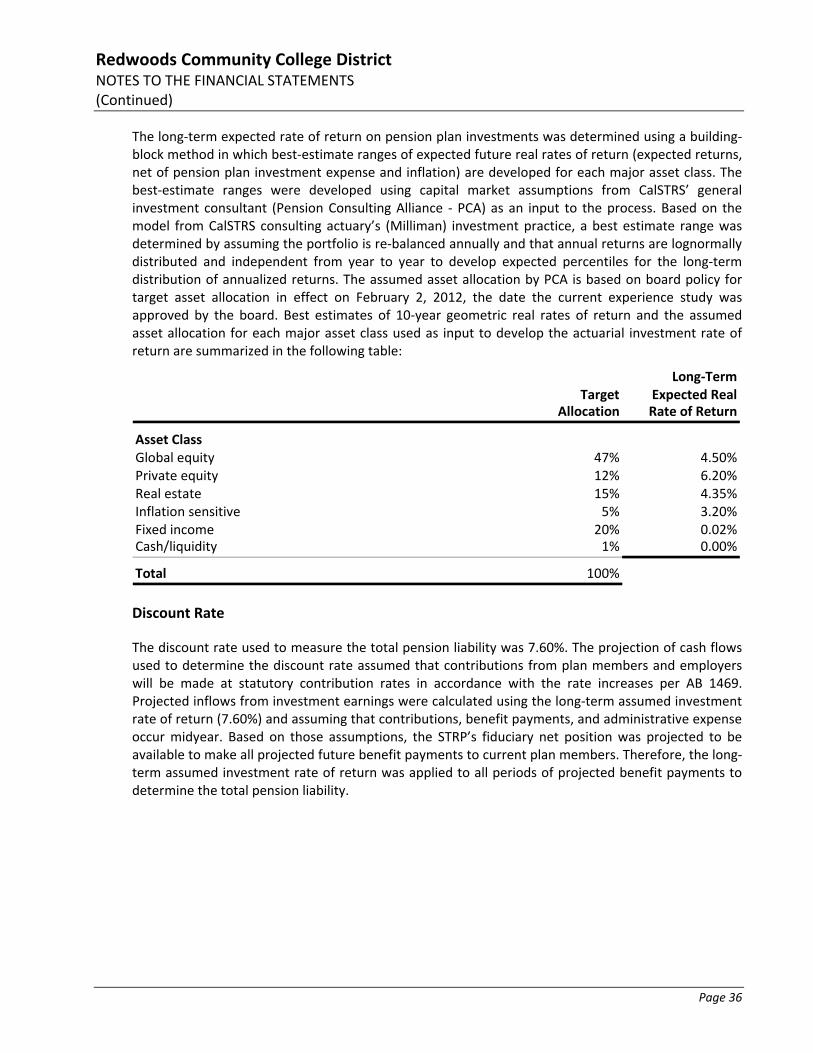
The long‐term expected rate of return on pension plan investments was determined using a building‐block method in which best‐estimate ranges of expected future real rates of return (expected returns, net of pension plan investment expense and inflation) are developed for each major asset class. The best‐estimate ranges were developed using capital market assumptions from CalSTRS’ general investment consultant (Pension Consulting Alliance ‐ PCA) as an input to the process. Based on the model from CalSTRS consulting actuary’s (Milliman) investment practice, a best estimate range was determined by assuming the portfolio is re‐balanced annually and that annual returns are lognormally distributed and independent from year to year to develop expected percentiles for the long‐term distribution of annualized returns. The assumed asset allocation by PCA is based on board policy for target asset allocation in effect on February 2, 2012, the date the current experience study was approved by the board. Best estimates of 10‐year geometric real rates of return and the assumed asset allocation for each major asset class used as input to develop the actuarial investment rate of return are summarized in the following table:
Long‐TermTarget Expected Real
Allocation Rate of Return
Asset ClassGlobal equity 47% 4.50%Private equity 12% 6.20%Real estate 15% 4.35%Inflation sensitive 5% 3.20%Fixed income 20% 0.02%Cash/liquidity 1% 0.00%
Total 100%
Discount Rate
The discount rate used to measure the total pension liability was 7.60%. The projection of cash flows used to determine the discount rate assumed that contributions from plan members and employers will be made at statutory contribution rates in accordance with the rate increases per AB 1469. Projected inflows from investment earnings were calculated using the long‐term assumed investment rate of return (7.60%) and assuming that contributions, benefit payments, and administrative expense occur midyear. Based on those assumptions, the STRP’s fiduciary net position was projected to be available to make all projected future benefit payments to current plan members. Therefore, the long‐term assumed investment rate of return was applied to all periods of projected benefit payments to determine the total pension liability.
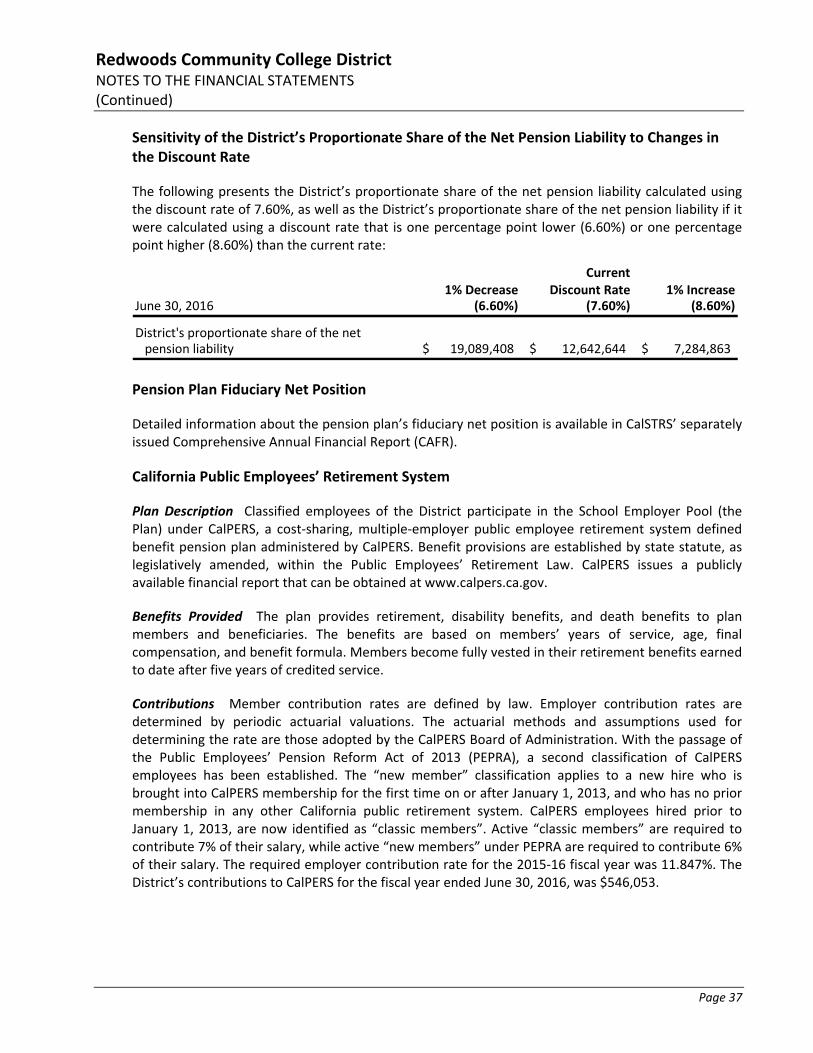
Redwoods Community College District NOTES TO THE FINANCIAL STATEMENTS (Continued)
Page 37
Sensitivity of the District’s Proportionate Share of the Net Pension Liability to Changes in the Discount Rate
The following presents the District’s proportionate share of the net pension liability calculated using the discount rate of 7.60%, as well as the District’s proportionate share of the net pension liability if it were calculated using a discount rate that is one percentage point lower (6.60%) or one percentage point higher (8.60%) than the current rate:
Current1% Decrease Discount Rate 1% Increase
June 30, 2016 (6.60%) (7.60%) (8.60%)
District's proportionate share of the netpension liability 19,089,408$ 12,642,644$ 7,284,863$
Pension Plan Fiduciary Net Position
Detailed information about the pension plan’s fiduciary net position is available in CalSTRS’ separately issued Comprehensive Annual Financial Report (CAFR).
California Public Employees’ Retirement System
Plan Description Classified employees of the District participate in the School Employer Pool (the Plan) under CalPERS, a cost‐sharing, multiple‐employer public employee retirement system defined benefit pension plan administered by CalPERS. Benefit provisions are established by state statute, as legislatively amended, within the Public Employees’ Retirement Law. CalPERS issues a publicly available financial report that can be obtained at www.calpers.ca.gov.
Benefits Provided The plan provides retirement, disability benefits, and death benefits to plan members and beneficiaries. The benefits are based on members’ years of service, age, final compensation, and benefit formula. Members become fully vested in their retirement benefits earned to date after five years of credited service.
Contributions Member contribution rates are defined by law. Employer contribution rates are determined by periodic actuarial valuations. The actuarial methods and assumptions used for determining the rate are those adopted by the CalPERS Board of Administration. With the passage of the Public Employees’ Pension Reform Act of 2013 (PEPRA), a second classification of CalPERS employees has been established. The “new member” classification applies to a new hire who is brought into CalPERS membership for the first time on or after January 1, 2013, and who has no prior membership in any other California public retirement system. CalPERS employees hired prior to January 1, 2013, are now identified as “classic members”. Active “classic members” are required to contribute 7% of their salary, while active “new members” under PEPRA are required to contribute 6% of their salary. The required employer contribution rate for the 2015‐16 fiscal year was 11.847%. The District’s contributions to CalPERS for the fiscal year ended June 30, 2016, was $546,053.
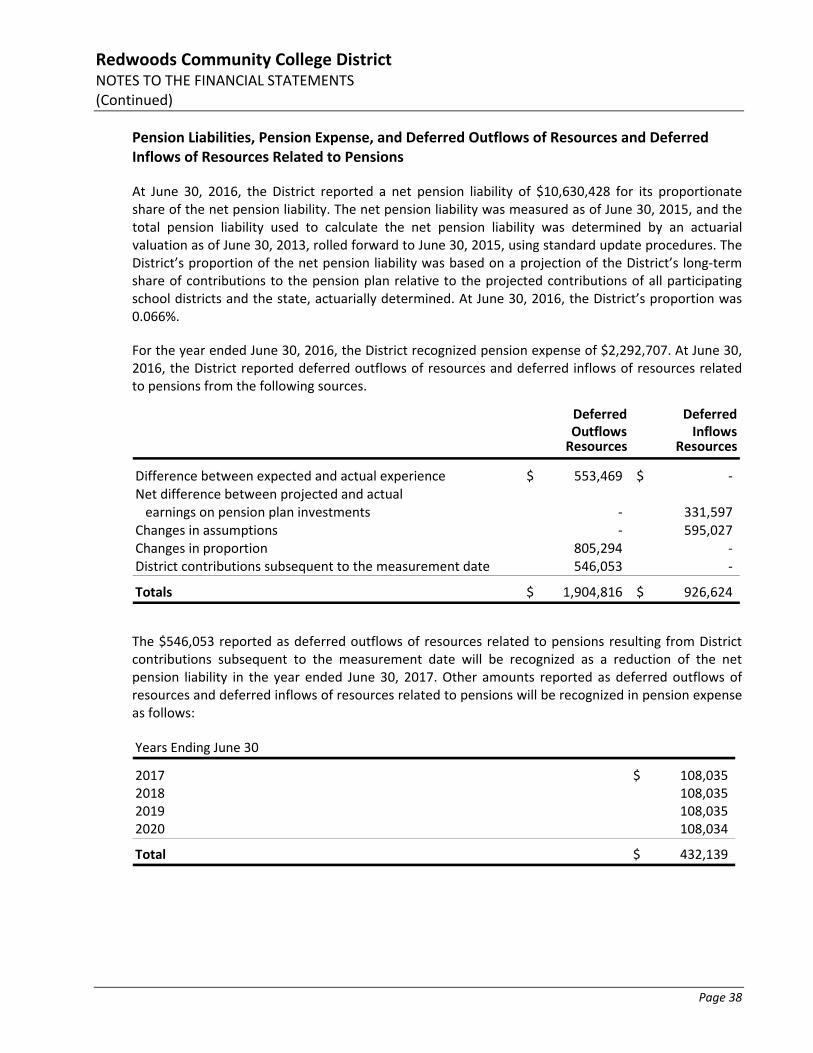
Redwoods Community College District NOTES TO THE FINANCIAL STATEMENTS (Continued)
Page 38
Pension Liabilities, Pension Expense, and Deferred Outflows of Resources and Deferred Inflows of Resources Related to Pensions
At June 30, 2016, the District reported a net pension liability of $10,630,428 for its proportionate share of the net pension liability. The net pension liability was measured as of June 30, 2015, and the total pension liability used to calculate the net pension liability was determined by an actuarial valuation as of June 30, 2013, rolled forward to June 30, 2015, using standard update procedures. The District’s proportion of the net pension liability was based on a projection of the District’s long‐term share of contributions to the pension plan relative to the projected contributions of all participating school districts and the state, actuarially determined. At June 30, 2016, the District’s proportion was 0.066%.
For the year ended June 30, 2016, the District recognized pension expense of $2,292,707. At June 30, 2016, the District reported deferred outflows of resources and deferred inflows of resources related to pensions from the following sources.
Deferred DeferredOutflows InflowsResources Resources
Difference between expected and actual experience 553,469$ ‐$ Net difference between projected and actual earnings on pension plan investments ‐ 331,597
Changes in assumptions ‐ 595,027 Changes in proportion 805,294 ‐ District contributions subsequent to the measurement date 546,053 ‐
Totals 1,904,816$ 926,624$
The $546,053 reported as deferred outflows of resources related to pensions resulting from District contributions subsequent to the measurement date will be recognized as a reduction of the net pension liability in the year ended June 30, 2017. Other amounts reported as deferred outflows of resources and deferred inflows of resources related to pensions will be recognized in pension expense as follows:
Years Ending June 30
2017 108,035$ 2018 108,035 2019 108,035 2020 108,034
Total 432,139$
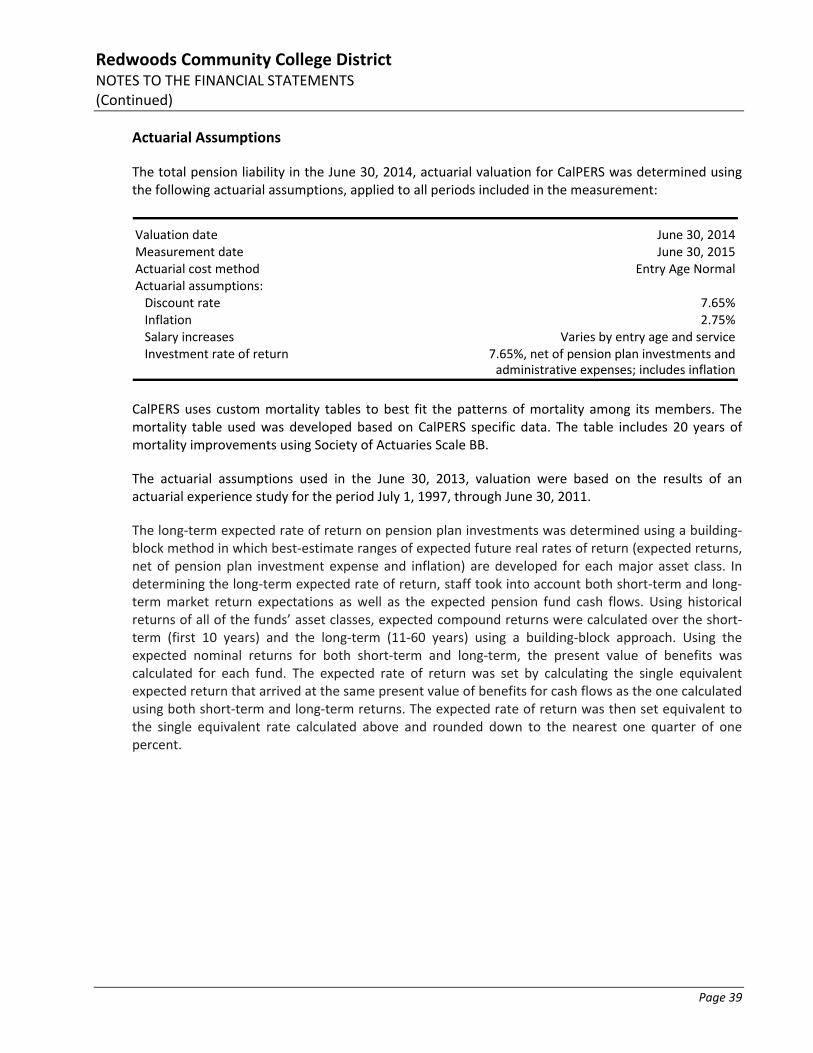
Redwoods Community College District NOTES TO THE FINANCIAL STATEMENTS (Continued)
Page 39
Actuarial Assumptions
The total pension liability in the June 30, 2014, actuarial valuation for CalPERS was determined using the following actuarial assumptions, applied to all periods included in the measurement:
Valuation date June 30, 2014Measurement date June 30, 2015Actuarial cost method Entry Age NormalActuarial assumptions:Discount rate 7.65%Inflation 2.75%Salary increases Varies by entry age and serviceInvestment rate of return 7.65%, net of pension plan investments and
administrative expenses; includes inflation
CalPERS uses custom mortality tables to best fit the patterns of mortality among its members. The mortality table used was developed based on CalPERS specific data. The table includes 20 years of mortality improvements using Society of Actuaries Scale BB.
The actuarial assumptions used in the June 30, 2013, valuation were based on the results of an actuarial experience study for the period July 1, 1997, through June 30, 2011.
The long‐term expected rate of return on pension plan investments was determined using a building‐block method in which best‐estimate ranges of expected future real rates of return (expected returns, net of pension plan investment expense and inflation) are developed for each major asset class. In determining the long‐term expected rate of return, staff took into account both short‐term and long‐term market return expectations as well as the expected pension fund cash flows. Using historical returns of all of the funds’ asset classes, expected compound returns were calculated over the short‐term (first 10 years) and the long‐term (11‐60 years) using a building‐block approach. Using the expected nominal returns for both short‐term and long‐term, the present value of benefits was calculated for each fund. The expected rate of return was set by calculating the single equivalent expected return that arrived at the same present value of benefits for cash flows as the one calculated using both short‐term and long‐term returns. The expected rate of return was then set equivalent to the single equivalent rate calculated above and rounded down to the nearest one quarter of one percent.
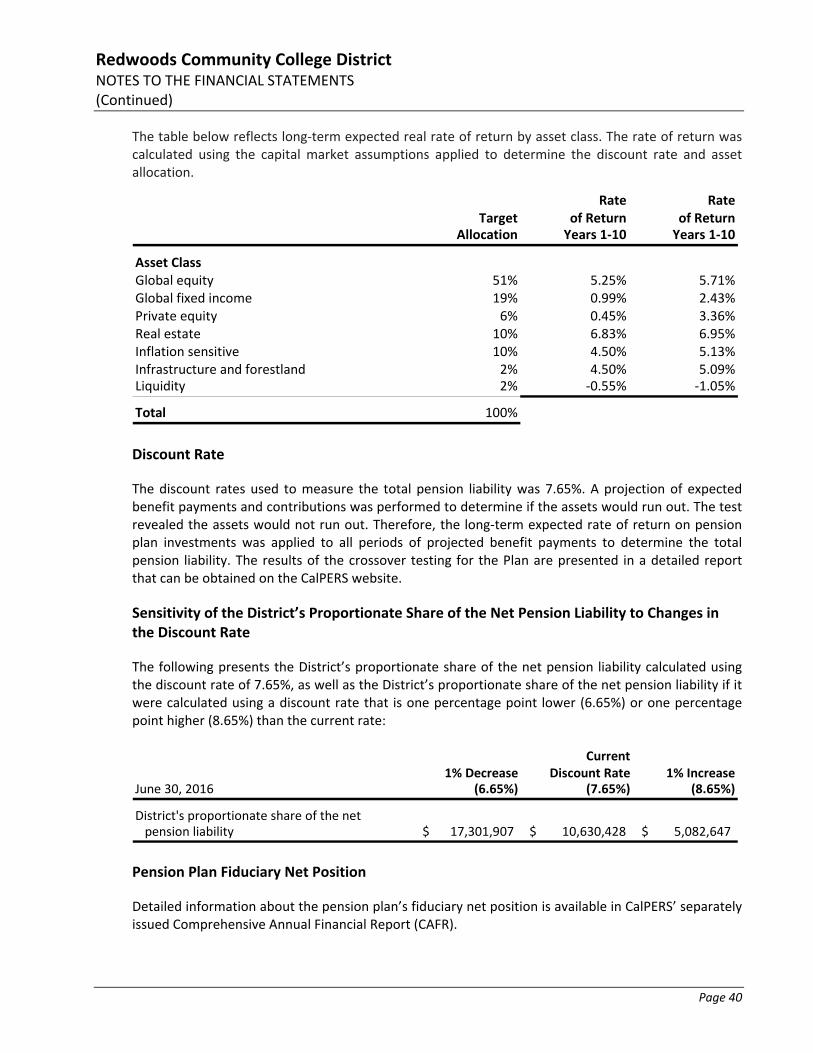
Redwoods Community College District NOTES TO THE FINANCIAL STATEMENTS (Continued)
Page 40
The table below reflects long‐term expected real rate of return by asset class. The rate of return was calculated using the capital market assumptions applied to determine the discount rate and asset allocation.
Rate RateTarget of Return of Return
Allocation Years 1‐10 Years 1‐10
Asset ClassGlobal equity 51% 5.25% 5.71%Global fixed income 19% 0.99% 2.43%Private equity 6% 0.45% 3.36%Real estate 10% 6.83% 6.95%Inflation sensitive 10% 4.50% 5.13%Infrastructure and forestland 2% 4.50% 5.09%Liquidity 2% ‐0.55% ‐1.05%
Total 100%
Discount Rate
The discount rates used to measure the total pension liability was 7.65%. A projection of expected benefit payments and contributions was performed to determine if the assets would run out. The test revealed the assets would not run out. Therefore, the long‐term expected rate of return on pension plan investments was applied to all periods of projected benefit payments to determine the total pension liability. The results of the crossover testing for the Plan are presented in a detailed report that can be obtained on the CalPERS website.
Sensitivity of the District’s Proportionate Share of the Net Pension Liability to Changes in the Discount Rate
The following presents the District’s proportionate share of the net pension liability calculated using the discount rate of 7.65%, as well as the District’s proportionate share of the net pension liability if it were calculated using a discount rate that is one percentage point lower (6.65%) or one percentage point higher (8.65%) than the current rate:
Current1% Decrease Discount Rate 1% Increase
June 30, 2016 (6.65%) (7.65%) (8.65%)
District's proportionate share of the netpension liability 17,301,907$ 10,630,428$ 5,082,647$
Pension Plan Fiduciary Net Position
Detailed information about the pension plan’s fiduciary net position is available in CalPERS’ separately issued Comprehensive Annual Financial Report (CAFR).
Redwoods Community College District NOTES TO THE FINANCIAL STATEMENTS (Continued)
Page 41
10. STATE AND FEDERAL ALLOWANCES, AWARDS, AND GRANTS
The District has received state and federal funds for specific purposes that are subject to review andaudit by the grantor agencies. Although such audits could generate expenditure disallowance underterms of the grants, management believes that any required reimbursements will not be material.
11. JOINT POWERS AUTHORITIES
The District participates in property, liability, and workers’ compensation insurance programsorganized through the Northern California Community Colleges Self‐Insurance Authority (NCCCSIA),the Statewide Association of Community Colleges (SWACC), and the Protected Insurance Program forSchools (PIPS). These JPAs are created to provide self‐insurance programs to California communitycolleges.
The District participates in a health insurance benefits program organized by the North Coast SchoolsMedical Insurance Group (NCSMIG), which is a JPA, created to provide self‐insurance programs forschool districts.
The District is a participant in the Schools Excess Liability Fund (SELF). SELF is a JPA created to provideservices and other items necessary and appropriate for the establishment, operation, andmaintenance of a self‐funded excess liability fund for public educational agencies, which are partiesthereto. Should excess liability claims exceed amounts funded to SELF by all participants, the Districtmay be required to provide additional funding.
The JPAs are independently accountable for their fiscal matters, and as such, are not component unitsof the District for financial reporting purposes.
Each District member pays a premium commensurate with the level of coverage requested and sharessurpluses and deficits proportionate to their participation in the JPA. For the last three years, settledclaims have not exceeded insurance coverage, nor has there been any reduction in insurancecoverage.
The District participates in the School Project for Utility Rate Reduction (SPURR), a joint powersauthority of K‐14 districts that aggregates purchasing power of participants in order to reduce naturalgas expenditures.
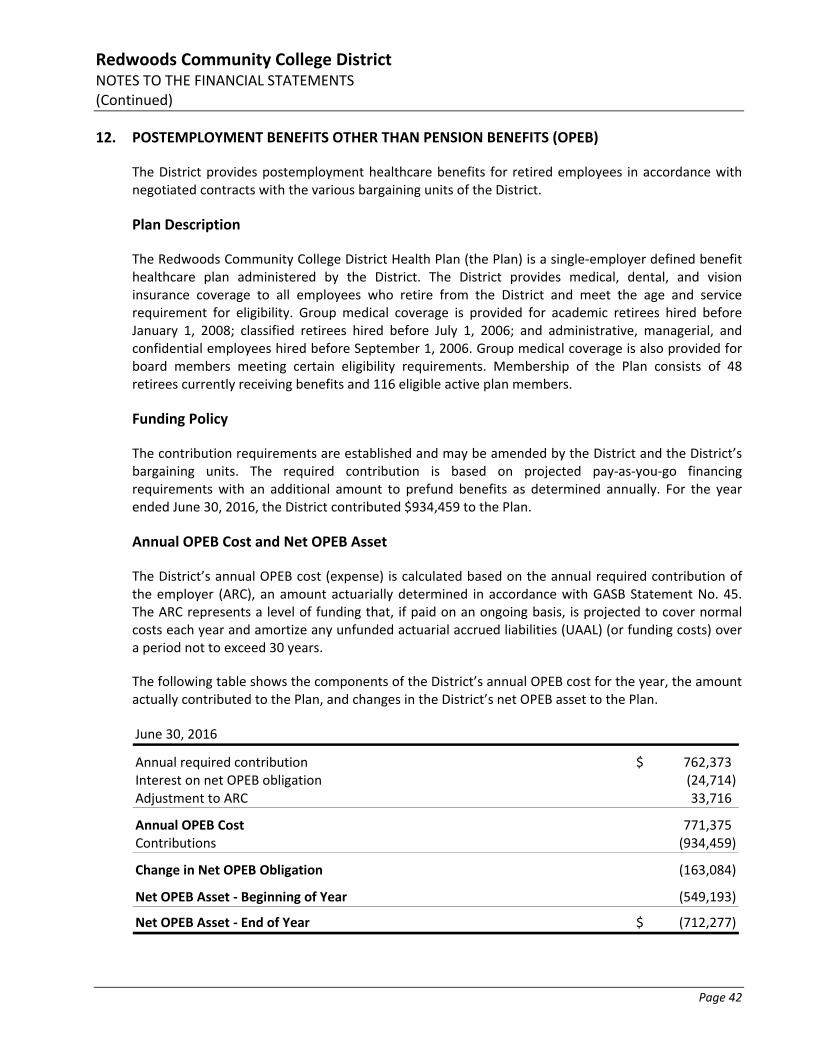
Redwoods Community College District NOTES TO THE FINANCIAL STATEMENTS (Continued)
Page 42
12. POSTEMPLOYMENT BENEFITS OTHER THAN PENSION BENEFITS (OPEB)
The District provides postemployment healthcare benefits for retired employees in accordance with negotiated contracts with the various bargaining units of the District.
Plan Description
The Redwoods Community College District Health Plan (the Plan) is a single‐employer defined benefit healthcare plan administered by the District. The District provides medical, dental, and vision insurance coverage to all employees who retire from the District and meet the age and service requirement for eligibility. Group medical coverage is provided for academic retirees hired before January 1, 2008; classified retirees hired before July 1, 2006; and administrative, managerial, and confidential employees hired before September 1, 2006. Group medical coverage is also provided for board members meeting certain eligibility requirements. Membership of the Plan consists of 48 retirees currently receiving benefits and 116 eligible active plan members.
Funding Policy
The contribution requirements are established and may be amended by the District and the District’s bargaining units. The required contribution is based on projected pay‐as‐you‐go financing requirements with an additional amount to prefund benefits as determined annually. For the year ended June 30, 2016, the District contributed $934,459 to the Plan.
Annual OPEB Cost and Net OPEB Asset
The District’s annual OPEB cost (expense) is calculated based on the annual required contribution of the employer (ARC), an amount actuarially determined in accordance with GASB Statement No. 45. The ARC represents a level of funding that, if paid on an ongoing basis, is projected to cover normal costs each year and amortize any unfunded actuarial accrued liabilities (UAAL) (or funding costs) over a period not to exceed 30 years.
The following table shows the components of the District’s annual OPEB cost for the year, the amount actually contributed to the Plan, and changes in the District’s net OPEB asset to the Plan.
June 30, 2016
Annual required contribution 762,373$ Interest on net OPEB obligation (24,714) Adjustment to ARC 33,716
Annual OPEB Cost 771,375 Contributions (934,459)
Change in Net OPEB Obligation (163,084)
Net OPEB Asset ‐ Beginning of Year (549,193)
Net OPEB Asset ‐ End of Year (712,277)$
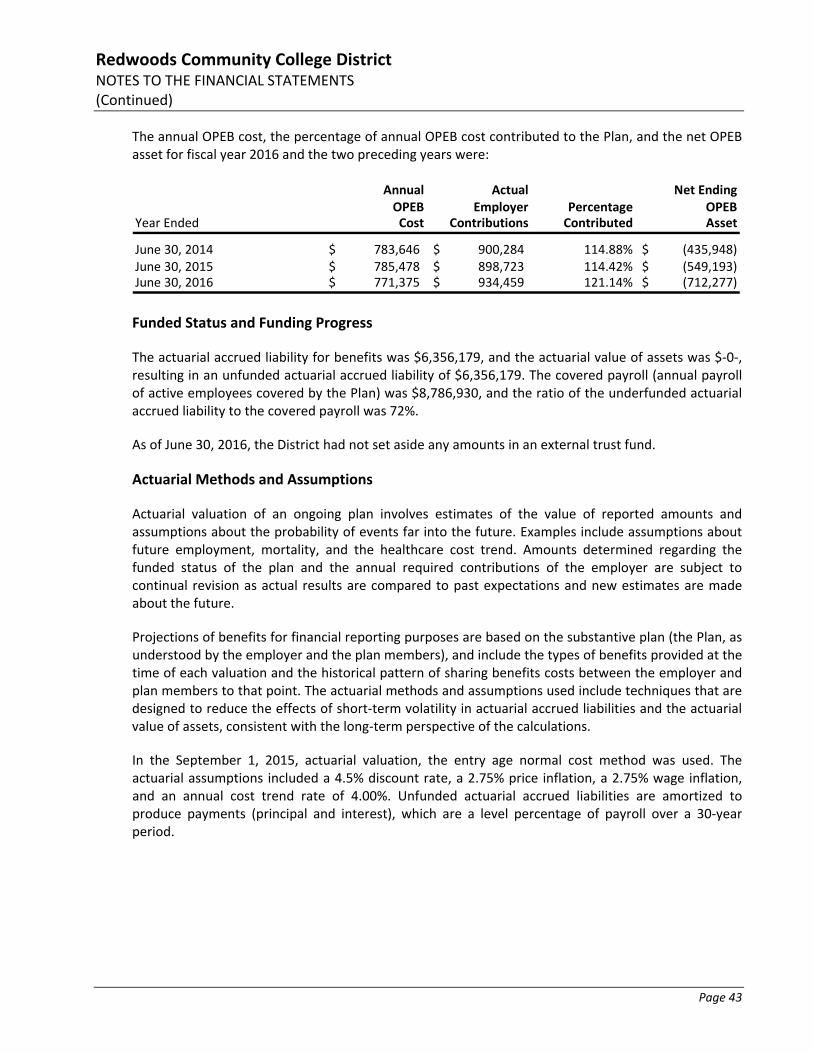
Redwoods Community College District NOTES TO THE FINANCIAL STATEMENTS (Continued)
Page 43
The annual OPEB cost, the percentage of annual OPEB cost contributed to the Plan, and the net OPEB asset for fiscal year 2016 and the two preceding years were:
Annual Actual Net EndingOPEB Employer Percentage OPEB
Year Ended Cost Contributions Contributed Asset
June 30, 2014 783,646$ 900,284$ 114.88% (435,948)$ June 30, 2015 785,478$ 898,723$ 114.42% (549,193)$ June 30, 2016 771,375$ 934,459$ 121.14% (712,277)$
Funded Status and Funding Progress
The actuarial accrued liability for benefits was $6,356,179, and the actuarial value of assets was $‐0‐, resulting in an unfunded actuarial accrued liability of $6,356,179. The covered payroll (annual payroll of active employees covered by the Plan) was $8,786,930, and the ratio of the underfunded actuarial accrued liability to the covered payroll was 72%.
As of June 30, 2016, the District had not set aside any amounts in an external trust fund.
Actuarial Methods and Assumptions
Actuarial valuation of an ongoing plan involves estimates of the value of reported amounts and assumptions about the probability of events far into the future. Examples include assumptions about future employment, mortality, and the healthcare cost trend. Amounts determined regarding the funded status of the plan and the annual required contributions of the employer are subject to continual revision as actual results are compared to past expectations and new estimates are made about the future.
Projections of benefits for financial reporting purposes are based on the substantive plan (the Plan, as understood by the employer and the plan members), and include the types of benefits provided at the time of each valuation and the historical pattern of sharing benefits costs between the employer and plan members to that point. The actuarial methods and assumptions used include techniques that are designed to reduce the effects of short‐term volatility in actuarial accrued liabilities and the actuarial value of assets, consistent with the long‐term perspective of the calculations.
In the September 1, 2015, actuarial valuation, the entry age normal cost method was used. The actuarial assumptions included a 4.5% discount rate, a 2.75% price inflation, a 2.75% wage inflation, and an annual cost trend rate of 4.00%. Unfunded actuarial accrued liabilities are amortized to produce payments (principal and interest), which are a level percentage of payroll over a 30‐year period.
Redwoods Community College District NOTES TO THE FINANCIAL STATEMENTS (Continued)
Page 44
13. COMMITMENTS AND CONTINGENCIES
The District entered into various operating leases for land, buildings, and equipment. All leasescontain termination clauses providing for cancellation upon written notice to lessors. It is expectedthat in the normal course of business most of these leases will be replaced by similar leases.
The District periodically enters into construction commitments which are funded through state grantsand/or Measure Q Bond funding. At June 30, 2016, the District had unfinished contracts in the amountof $1,370,522.
The California Division of the State Architect has informed the District that since some of the District’sbuildings are located near active earthquake faults, the best mitigation is avoidance of those areas.The District is constructing comparable new building space on adjacent sites and is consideringpotential nonstudent uses of the existing affected buildings, if possible. At June 30, 2016, the District’saffected assets have a net book value of $247,068 and have been reported without adjustment.
Community college districts receive state funding based on the number of eligible studentenrollments. In a year where a district’s enrollments fall below the prior year’s enrollment level, theState Chancellor’s Office provides enrollment “stability” funding based on the prior year’s higherenrollment level for one year. The District received enrollment stability funding during fiscal years2011‐2012, 2012‐2013, and 2013‐2014 because enrollment dropped each year below the previousyear’s enrollment level. During fiscal year 2014‐2015, the District’s enrollments increased over theprior year, so no enrollment stability funding was provided. Fiscal year 2015‐2016 enrollmentsdropped below the prior year, so the District received enrollment stability funding.
14. SUBSEQUENT EVENT
On May 7, 2015, the District received approval from the Accrediting Commission for Community andJunior Colleges (ACCJC) for a substantive change proposal relative to the proposed transfer of territoryagreement between the District and the Mendocino‐Lake Community College District. Effective July 1,2017, the District plans to permanently transfer the portion of the District’s territory in MendocinoCounty to the Mendocino‐Lake Community College District.
Redwoods Community College District NOTES TO THE FINANCIAL STATEMENTS (Continued)
Page 45
15. IMPACT OF RECENTLY ISSUED ACCOUNTING STANDARDS
In June 2015, GASB issued Statement No. 73, Accounting and Financial Reporting for Pensions and Related Assets That Are Not Within the Scope of GASB Statement 68, and Amendments to Certain Provisions of GASB Statements 67 and 68. This statement will improve financial reporting by establishing a single framework for the presentation of information about pensions, which will enhance the comparability of pension‐related information reported by employers and nonemployer contributing entities. This statement establishes requirements for defined benefit pensions that are not within the scope of GASB Statement No. 68, Accounting and Financial Reporting for Pensions, as well as for the assets accumulated for purposes of providing for those pensions. In addition, it establishes requirements for defined contribution pensions that are not within the scope of GASB Statement No. 68. It also amends certain provisions of GASB Statement No. 67, Financial Reporting for Pension Plans, and GASB Statement No. 68 for pension plans and pensions that are within their respective scopes. The District’s management has not yet determined the impact that implementation of these standards, which was required on July 1, 2016, will have on the District’s financial statements, if any.
In June 2015, GASB issued Statement No. 74, Financial Reporting for Postemployment Benefits Other Than Pension Plans (OPEB). This statement will improve the usefulness of information about OPEB included in the general purpose external financial reports of state and local governmental OPEB plans for making decisions and assessing accountability. The scope of this statement includes OPEB plans administered through trusts that meet certain criteria. It also includes requirements to address financial reporting for assets accumulated for purposes of providing defined OPEB through OPEB plans that are not administered through trusts that meet specified criteria. The District’s management has not yet determined the impact that implementation of these standards, which is required on July 1, 2017, will have on the District’s financial statements, if any.
In June 2015, GASB issued Statement No. 75, Accounting and Financial Reporting for Postemployment Benefits Other Than Pensions. This statement will improve accounting and financial reporting by state and local governments for postemployment benefits other than pensions. It also improves information provided by state and local governmental employers about financial support for OPEB that is provided by other entities. GASB Statement No. 75 replaces the requirements of Statements No. 45, Accounting and Financial Reporting by Employers for Postemployment Benefits Other Than Pensions, as amended, and No. 57, OPEB Measurements by Agent Employers and Agent Multiple‐Employer Plans, for OPEB. This statement establishes standards for recognizing and measuring liabilities, deferred outflows of resources, deferred inflows of resources, and expense/expenditures. For defined benefit OPEB, this statement identifies the methods and assumptions that are required to be used to project benefit payments, discount projected benefit payments to their actuarial present value, and attribute that present value to periods of employee service. Note disclosure and required supplementary information requirements about defined benefit OPEB also are addressed. The District’s management has not yet determined the impact that implementation of these standards, which is required on July 1, 2017, will have on the District’s financial statements, if any.
Redwoods Community College District NOTES TO THE FINANCIAL STATEMENTS (Continued)
Page 46
In January 2016, GASB issued Statement No. 80, Blending Requirements for Certain Component Units—An Amendment of GASB Statement No. 14. This statement amends the blending requirements for the financial statement presentation of component units of all state and local governments. The additional criterion requires blending of a component unit incorporated as a not‐for‐profit corporation in which the primary government is the sole corporate member. The District’s management has not yet determined the impact that implementation of these standards, which was required on July 1, 2016, will have on the District’s financial statements, if any.
In March 2016, GASB issued Statement No. 82, Pension Issues—An Amendment of GASB Statements No. 67, No. 68, and No. 73. This statement addresses certain issues that have been raised with respect to Statements No. 67, Financial Reporting for Pension Plans, No. 68, Accounting and Financial Reporting for Pensions, and No. 73, Accounting and Financial Reporting for Pensions and Related Assets That Are Not Within the Scope of GASB Statement 68, and Amendments to Certain Provisions of GASB Statements 67 and 68. Specifically, it addresses issues regarding: (1) the presentation of payroll‐related measures in required supplementary information, (2) the selection of assumptions and the treatment of deviations from the guidance in an Actuarial Standard of Practice for financial reporting purposes, and (3) the classification of payments made by employers to satisfy employee (plan member) contribution requirements. The District’s management has not yet determined the impact that implementation of these standards, which was required on July 1, 2016, will have on the District’s financial statements, if any.
16. BENEFICIAL INTEREST IN CHARITABLE REMAINDER ANNUITY TRUST – FOUNDATION
The Foundation was named a remainder beneficiary of a charitable remainder annuity trust, which was created in June 1997. The income beneficiary is to receive, first from income, and to the extent that income is insufficient, from principal, a total annuity each year equal to 7% of the net fair market value of the trust assets on the first day of the trust. Upon the death of the income beneficiary, 33% of the remaining principal is to be distributed to the Foundation.
A noncurrent asset for the charitable remainder trust has been recognized at the present value of the expected future cash flow discounted at a rate of 4.0% at June 30, 2016. Changes in the value of the trust have been reported in the statement of activities as decreases in temporarily restricted net assets.
REQUIRED SUPPLEMENTARY INFORMATION
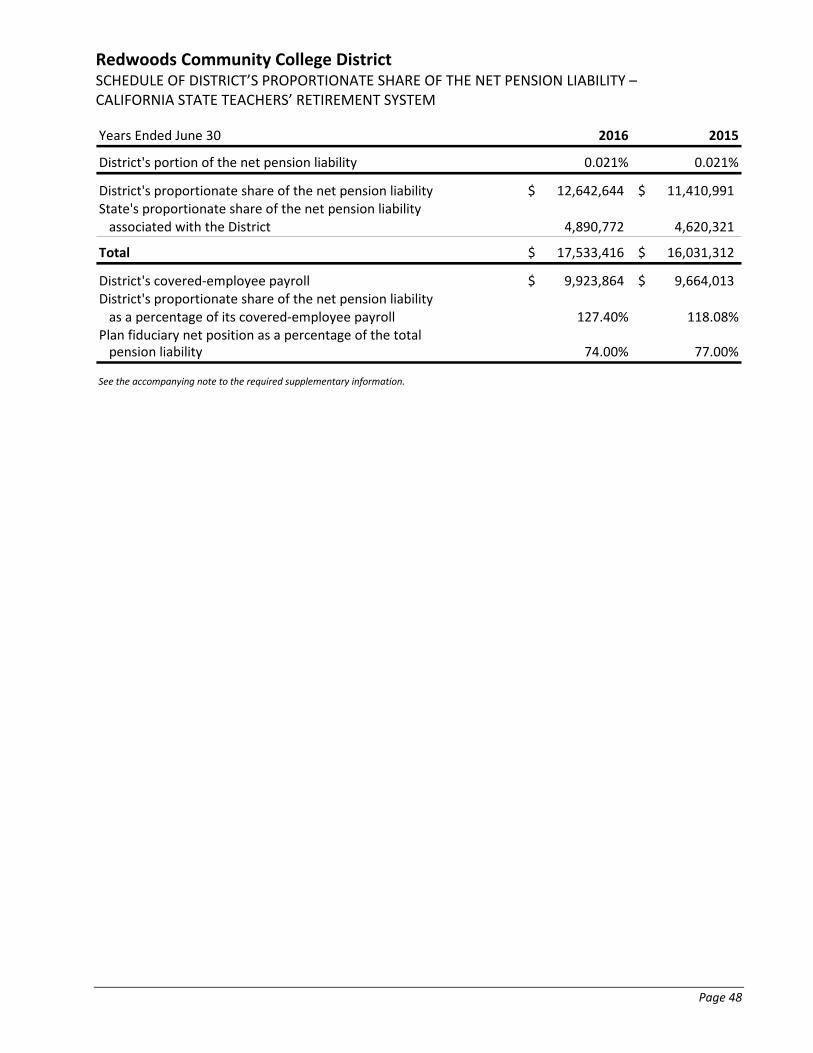
Redwoods Community College District SCHEDULE OF DISTRICT’S PROPORTIONATE SHARE OF THE NET PENSION LIABILITY – CALIFORNIA STATE TEACHERS’ RETIREMENT SYSTEM
Page 48
Years Ended June 30 2016 2015
District's portion of the net pension liability 0.021% 0.021%
District's proportionate share of the net pension liability 12,642,644$ 11,410,991$ State's proportionate share of the net pension liability associated with the District 4,890,772 4,620,321
Total 17,533,416$ 16,031,312$
District's covered‐employee payroll 9,923,864$ 9,664,013$ District's proportionate share of the net pension liability as a percentage of its covered‐employee payroll 127.40% 118.08%
Plan fiduciary net position as a percentage of the total pension liability 74.00% 77.00%
See the accompanying note to the required supplementary information.
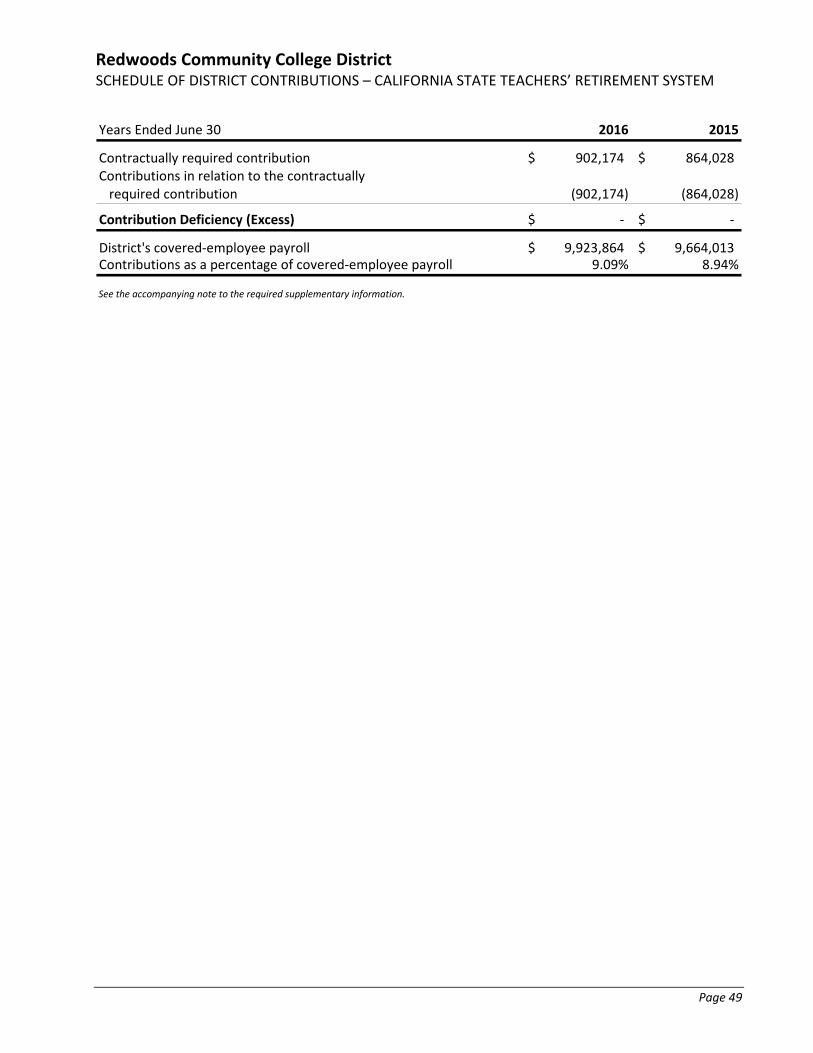
Redwoods Community College District SCHEDULE OF DISTRICT CONTRIBUTIONS – CALIFORNIA STATE TEACHERS’ RETIREMENT SYSTEM
Page 49
Years Ended June 30 2016 2015
Contractually required contribution 902,174$ 864,028$ Contributions in relation to the contractuallyrequired contribution (902,174) (864,028)
Contribution Deficiency (Excess) ‐$ ‐$
District's covered‐employee payroll 9,923,864$ 9,664,013$ Contributions as a percentage of covered‐employee payroll 9.09% 8.94%
See the accompanying note to the required supplementary information.
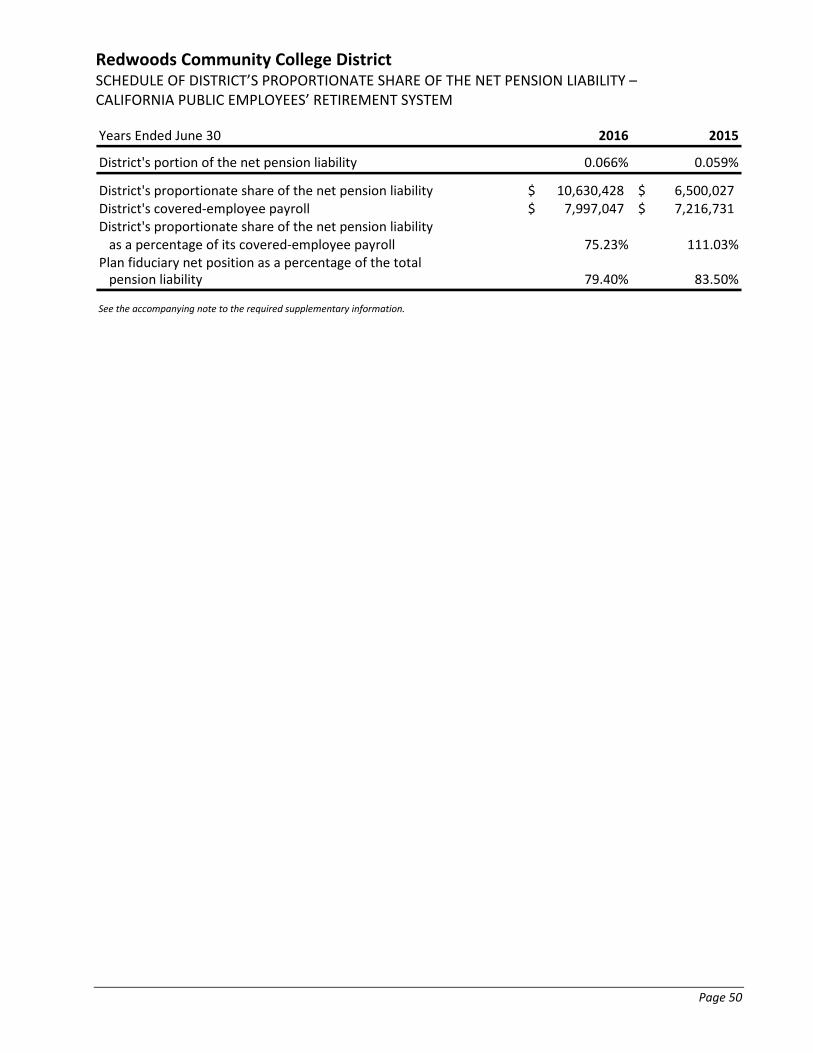
Redwoods Community College District SCHEDULE OF DISTRICT’S PROPORTIONATE SHARE OF THE NET PENSION LIABILITY – CALIFORNIA PUBLIC EMPLOYEES’ RETIREMENT SYSTEM
Page 50
Years Ended June 30 2016 2015
District's portion of the net pension liability 0.066% 0.059%
District's proportionate share of the net pension liability 10,630,428$ 6,500,027$ District's covered‐employee payroll 7,997,047$ 7,216,731$ District's proportionate share of the net pension liabilityas a percentage of its covered‐employee payroll 75.23% 111.03%
Plan fiduciary net position as a percentage of the total pension liability 79.40% 83.50%
See the accompanying note to the required supplementary information.
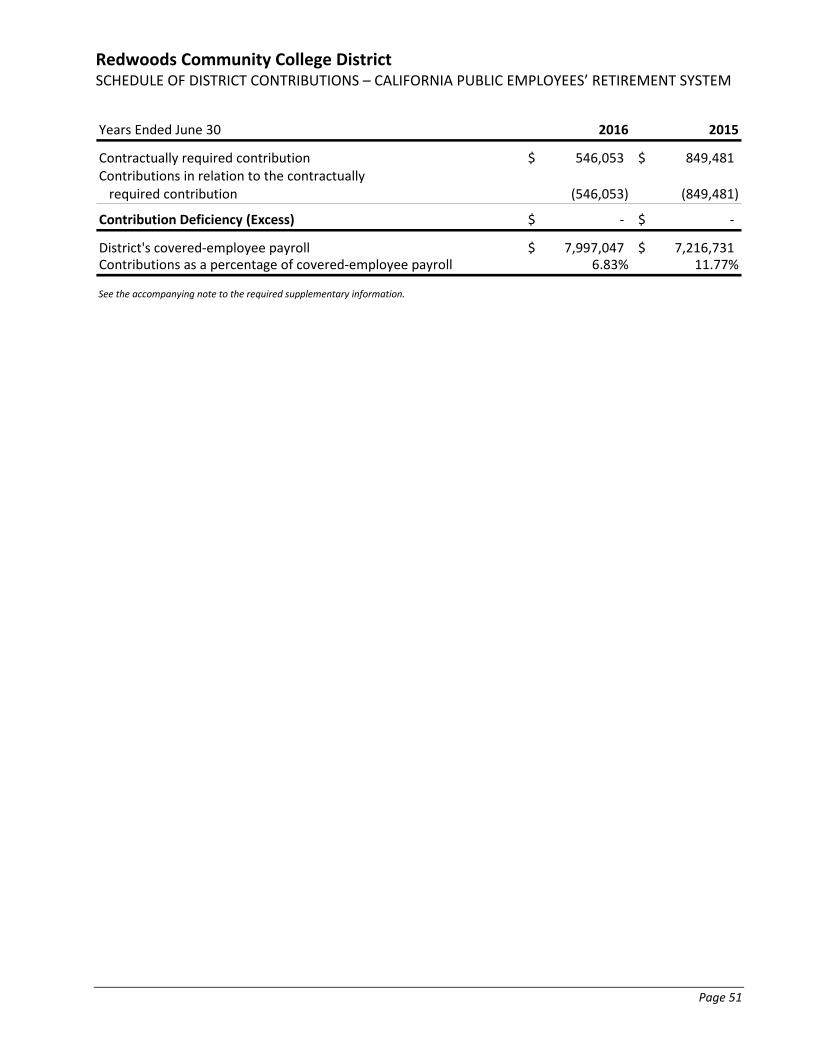
Redwoods Community College District SCHEDULE OF DISTRICT CONTRIBUTIONS – CALIFORNIA PUBLIC EMPLOYEES’ RETIREMENT SYSTEM
Page 51
Years Ended June 30 2016 2015
Contractually required contribution 546,053$ 849,481$ Contributions in relation to the contractuallyrequired contribution (546,053) (849,481)
Contribution Deficiency (Excess) ‐$ ‐$
District's covered‐employee payroll 7,997,047$ 7,216,731$ Contributions as a percentage of covered‐employee payroll 6.83% 11.77%
See the accompanying note to the required supplementary information.
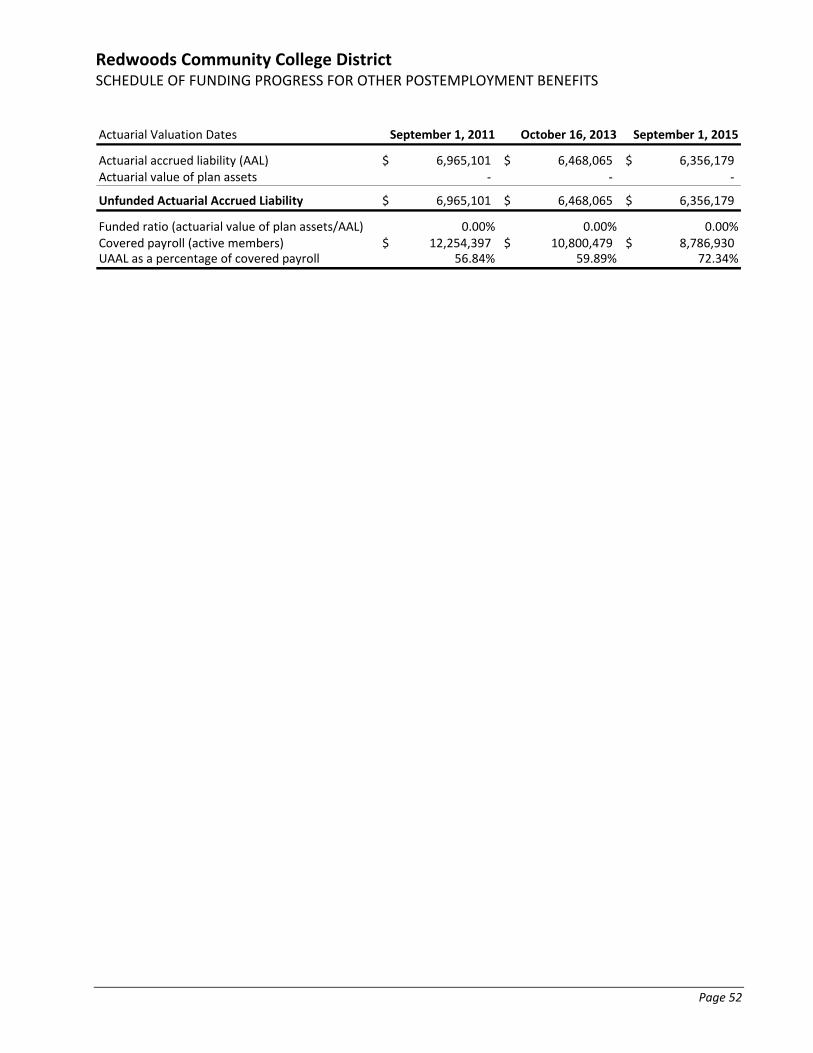
Redwoods Community College District SCHEDULE OF FUNDING PROGRESS FOR OTHER POSTEMPLOYMENT BENEFITS
Page 52
Actuarial Valuation Dates September 1, 2011 October 16, 2013 September 1, 2015
Actuarial accrued liability (AAL) 6,965,101$ 6,468,065$ 6,356,179$ Actuarial value of plan assets ‐ ‐ ‐
Unfunded Actuarial Accrued Liability 6,965,101$ 6,468,065$ 6,356,179$
Funded ratio (actuarial value of plan assets/AAL) 0.00% 0.00% 0.00%Covered payroll (active members) 12,254,397$ 10,800,479$ 8,786,930$ UAAL as a percentage of covered payroll 56.84% 59.89% 72.34%
Redwoods Community College District NOTE TO THE REQUIRED SUPPLEMENTARY INFORMATION
Page 53
CHANGES OF BENEFIT TERMS
California State Teachers’ Retirement System
There were no significant changes of benefit terms from the June 30, 2013, actuarial variation.
California Public Employees’ Retirement System
Public agencies can make changes to their plan provisions, and such changes occur on an ongoing basis. A summary of the plan provisions that were used for a specific plan can be found in the plan’s annual valuation report.
CHANGES OF ASSUMPTIONS
California State Teachers’ Retirement System
There were no changes in major assumptions from the June 30, 2013, actuarial valuation.
California Public Employees’ Retirement System
No changes have occurred to the actuarial assumptions since the CalPERS Board adopted new actuarial assumptions in February 2014. The most significant change to the actuarial assumptions that the Board adopted was the inclusion of future mortality improvement. The actuarial assumptions adopted by the Board are designed to ensure greater sustainability and soundness of the defined benefit pension plans, and they will be better at predicting future experiences resulting in more secure retirement benefits in the decades to come. The current experience study was based on demographic CalPERS data for years 1997 to 2011. The study focused on recent patterns of termination, death, disability, retirement and salary increases. These new assumptions were reflected in the total pension liabilities as of June 30, 2013.
GASB Statement No. 68, Accounting and Financial Reporting for Pensions, paragraph 68, states that the long‐term expected rate of return should be determined net of pension plan investment expense but without reduction for the pension plan administrative expense. The discount rate was changed from 7.50% (net of administrative expense in 2014) to 7.65% as of the June 30, 2015, measurement date to correct the adjustment which previously reduced the discount rate for administrative expense.
OTHER SUPPLEMENTARY INFORMATION SECTION
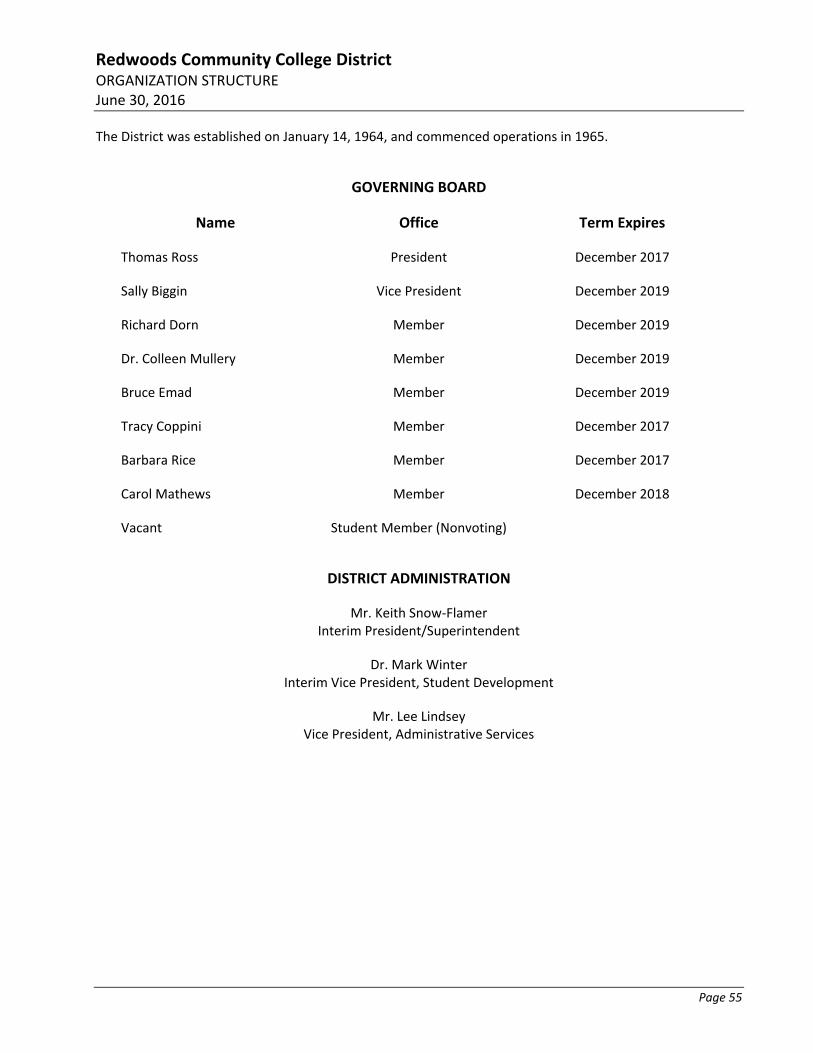
Redwoods Community College District ORGANIZATION STRUCTURE June 30, 2016
Page 55
The District was established on January 14, 1964, and commenced operations in 1965.
GOVERNING BOARD
Name Office Term Expires
Thomas Ross President December 2017
Sally Biggin Vice President December 2019
Richard Dorn Member December 2019
Dr. Colleen Mullery Member December 2019
Bruce Emad Member December 2019
Tracy Coppini Member December 2017
Barbara Rice Member December 2017
Carol Mathews Member December 2018
Vacant Student Member (Nonvoting)
DISTRICT ADMINISTRATION
Mr. Keith Snow‐Flamer Interim President/Superintendent
Dr. Mark Winter Interim Vice President, Student Development
Mr. Lee Lindsey Vice President, Administrative Services
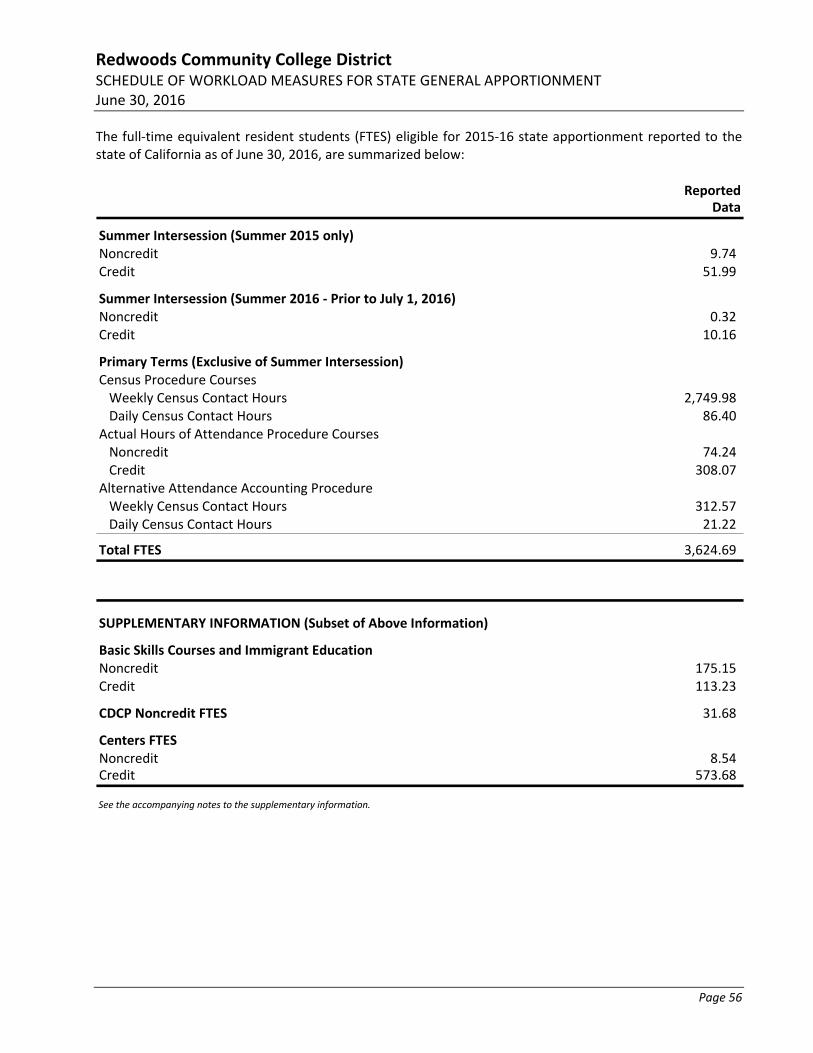
Redwoods Community College District SCHEDULE OF WORKLOAD MEASURES FOR STATE GENERAL APPORTIONMENT June 30, 2016
Page 56
The full‐time equivalent resident students (FTES) eligible for 2015‐16 state apportionment reported to the state of California as of June 30, 2016, are summarized below:
ReportedData
Summer Intersession (Summer 2015 only)Noncredit 9.74 Credit 51.99
Summer Intersession (Summer 2016 ‐ Prior to July 1, 2016)Noncredit 0.32 Credit 10.16
Primary Terms (Exclusive of Summer Intersession)Census Procedure CoursesWeekly Census Contact Hours 2,749.98 Daily Census Contact Hours 86.40
Actual Hours of Attendance Procedure CoursesNoncredit 74.24 Credit 308.07
Alternative Attendance Accounting ProcedureWeekly Census Contact Hours 312.57 Daily Census Contact Hours 21.22
Total FTES 3,624.69
SUPPLEMENTARY INFORMATION (Subset of Above Information)
Basic Skills Courses and Immigrant EducationNoncredit 175.15 Credit 113.23
CDCP Noncredit FTES 31.68
Centers FTESNoncredit 8.54 Credit 573.68
See the accompanying notes to the supplementary information.
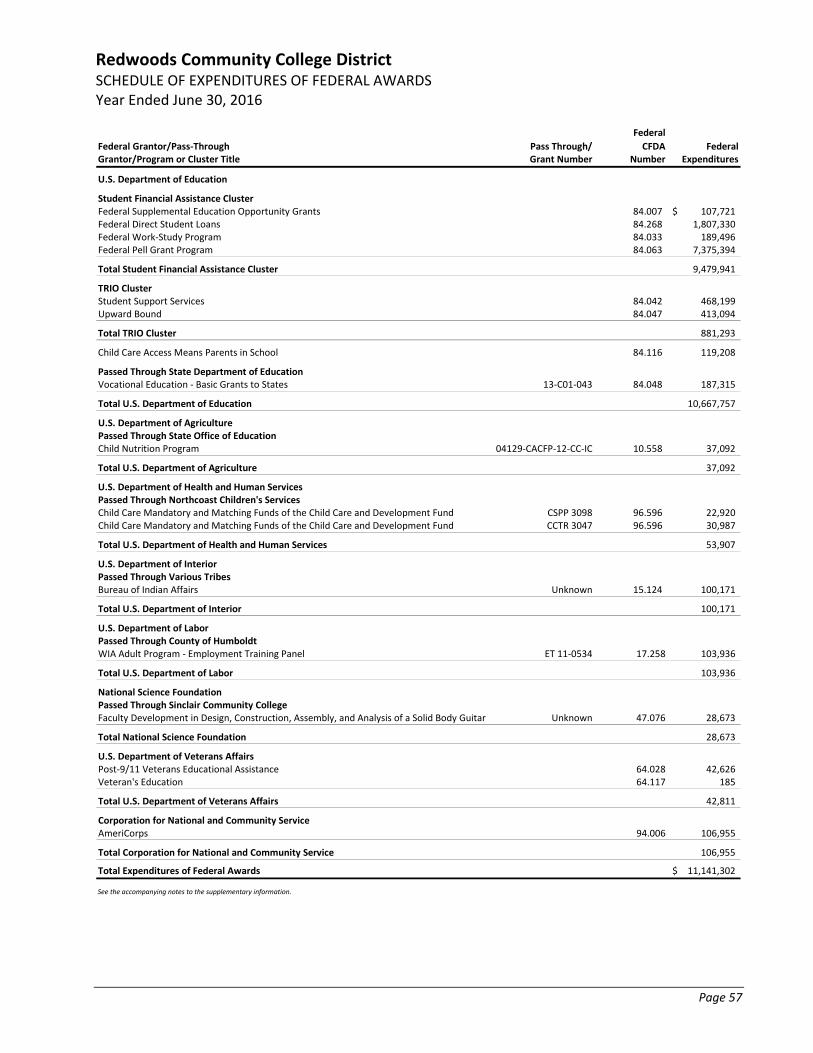
Redwoods Community College District SCHEDULE OF EXPENDITURES OF FEDERAL AWARDS Year Ended June 30, 2016
Page 57
Federal
Federal Grantor/Pass‐Through Pass Through/ CFDA FederalGrantor/Program or Cluster Title Grant Number Number Expenditures
U.S. Department of Education
Student Financial Assistance ClusterFederal Supplemental Education Opportunity Grants 84.007 107,721$ Federal Direct Student Loans 84.268 1,807,330 Federal Work‐Study Program 84.033 189,496 Federal Pell Grant Program 84.063 7,375,394
Total Student Financial Assistance Cluster 9,479,941
TRIO ClusterStudent Support Services 84.042 468,199 Upward Bound 84.047 413,094
Total TRIO Cluster 881,293
Child Care Access Means Parents in School 84.116 119,208
Passed Through State Department of EducationVocational Education ‐ Basic Grants to States 13‐C01‐043 84.048 187,315
Total U.S. Department of Education 10,667,757
U.S. Department of AgriculturePassed Through State Office of EducationChild Nutrition Program 04129‐CACFP‐12‐CC‐IC 10.558 37,092
Total U.S. Department of Agriculture 37,092
U.S. Department of Health and Human ServicesPassed Through Northcoast Children's ServicesChild Care Mandatory and Matching Funds of the Child Care and Development Fund CSPP 3098 96.596 22,920 Child Care Mandatory and Matching Funds of the Child Care and Development Fund CCTR 3047 96.596 30,987
Total U.S. Department of Health and Human Services 53,907
U.S. Department of InteriorPassed Through Various TribesBureau of Indian Affairs Unknown 15.124 100,171
Total U.S. Department of Interior 100,171
U.S. Department of LaborPassed Through County of HumboldtWIA Adult Program ‐ Employment Training Panel ET 11‐0534 17.258 103,936
Total U.S. Department of Labor 103,936
National Science FoundationPassed Through Sinclair Community CollegeFaculty Development in Design, Construction, Assembly, and Analysis of a Solid Body Guitar Unknown 47.076 28,673
Total National Science Foundation 28,673
U.S. Department of Veterans AffairsPost‐9/11 Veterans Educational Assistance 64.028 42,626 Veteran's Education 64.117 185
Total U.S. Department of Veterans Affairs 42,811
Corporation for National and Community ServiceAmeriCorps 94.006 106,955
Total Corporation for National and Community Service 106,955
Total Expenditures of Federal Awards 11,141,302$
See the accompanying notes to the supplementary information.
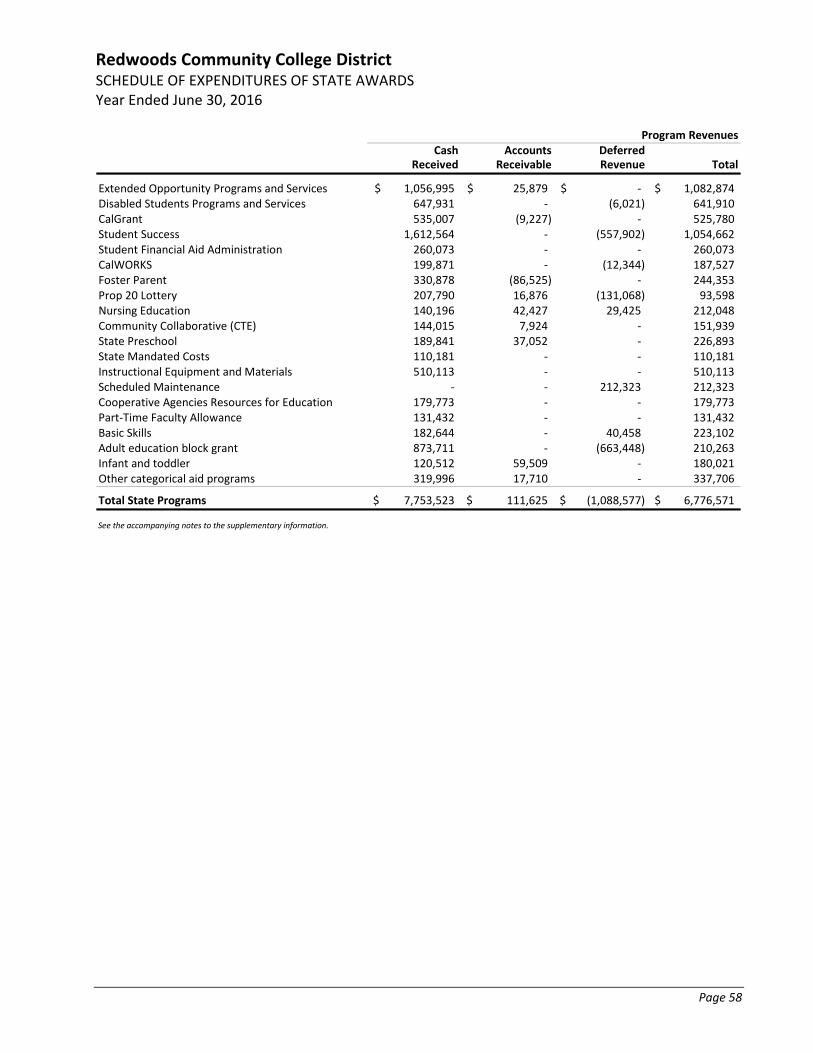
Redwoods Community College District SCHEDULE OF EXPENDITURES OF STATE AWARDS Year Ended June 30, 2016
Page 58
Program RevenuesCash Accounts Deferred
Received Receivable Revenue Total
Extended Opportunity Programs and Services 1,056,995$ 25,879$ ‐$ 1,082,874$ Disabled Students Programs and Services 647,931 ‐ (6,021) 641,910 CalGrant 535,007 (9,227) ‐ 525,780 Student Success 1,612,564 ‐ (557,902) 1,054,662 Student Financial Aid Administration 260,073 ‐ ‐ 260,073 CalWORKS 199,871 ‐ (12,344) 187,527 Foster Parent 330,878 (86,525) ‐ 244,353 Prop 20 Lottery 207,790 16,876 (131,068) 93,598 Nursing Education 140,196 42,427 29,425 212,048 Community Collaborative (CTE) 144,015 7,924 ‐ 151,939 State Preschool 189,841 37,052 ‐ 226,893 State Mandated Costs 110,181 ‐ ‐ 110,181 Instructional Equipment and Materials 510,113 ‐ ‐ 510,113 Scheduled Maintenance ‐ ‐ 212,323 212,323 Cooperative Agencies Resources for Education 179,773 ‐ ‐ 179,773 Part‐Time Faculty Allowance 131,432 ‐ ‐ 131,432 Basic Skills 182,644 ‐ 40,458 223,102 Adult education block grant 873,711 ‐ (663,448) 210,263 Infant and toddler 120,512 59,509 ‐ 180,021 Other categorical aid programs 319,996 17,710 ‐ 337,706
Total State Programs 7,753,523$ 111,625$ (1,088,577)$ 6,776,571$
See the accompanying notes to the supplementary information.
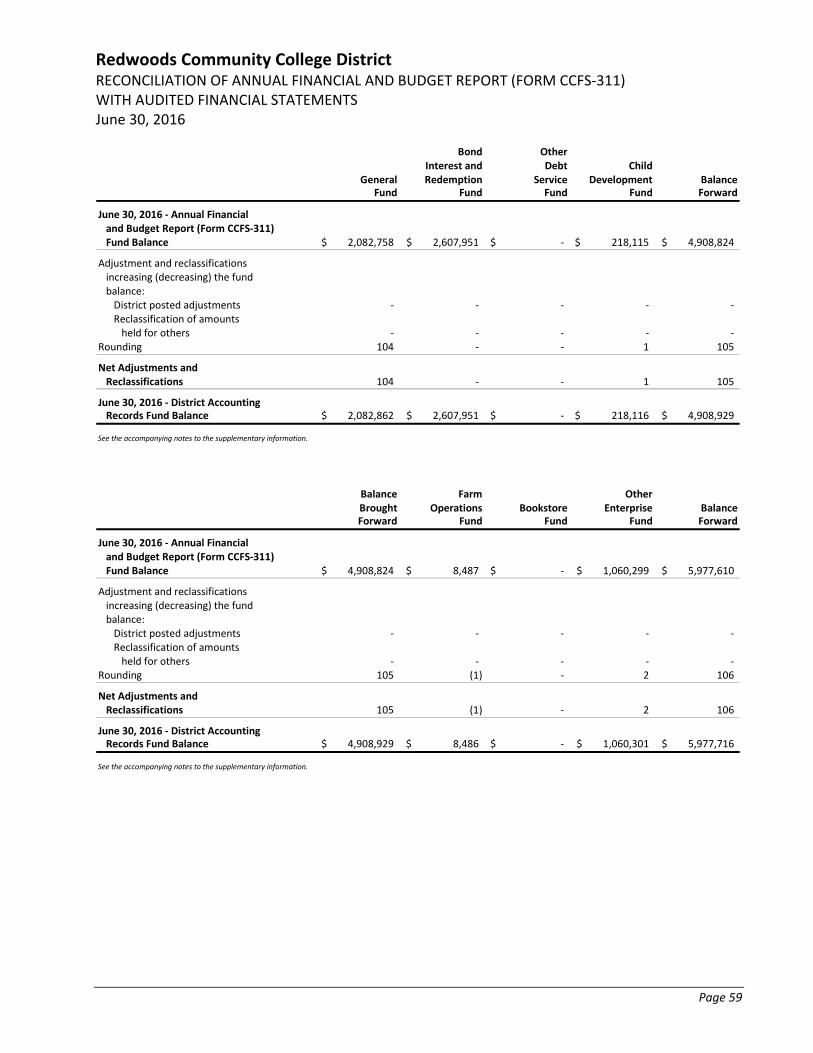
Redwoods Community College District RECONCILIATION OF ANNUAL FINANCIAL AND BUDGET REPORT (FORM CCFS‐311) WITH AUDITED FINANCIAL STATEMENTS June 30, 2016
Page 59
Bond OtherInterest and Debt Child
General Redemption Service Development BalanceFund Fund Fund Fund Forward
June 30, 2016 ‐ Annual Financial and Budget Report (Form CCFS‐311)Fund Balance 2,082,758$ 2,607,951$ ‐$ 218,115$ 4,908,824$
Adjustment and reclassificationsincreasing (decreasing) the fundbalance:District posted adjustments ‐ ‐ ‐ ‐ ‐ Reclassification of amountsheld for others ‐ ‐ ‐ ‐ ‐
Rounding 104 ‐ ‐ 1 105
Net Adjustments andReclassifications 104 ‐ ‐ 1 105
June 30, 2016 ‐ District AccountingRecords Fund Balance 2,082,862$ 2,607,951$ ‐$ 218,116$ 4,908,929$
See the accompanying notes to the supplementary information.
Balance Farm OtherBrought Operations Bookstore Enterprise BalanceForward Fund Fund Fund Forward
June 30, 2016 ‐ Annual Financial and Budget Report (Form CCFS‐311)Fund Balance 4,908,824$ 8,487$ ‐$ 1,060,299$ 5,977,610$
Adjustment and reclassificationsincreasing (decreasing) the fundbalance:District posted adjustments ‐ ‐ ‐ ‐ ‐ Reclassification of amountsheld for others ‐ ‐ ‐ ‐ ‐
Rounding 105 (1) ‐ 2 106
Net Adjustments andReclassifications 105 (1) ‐ 2 106
June 30, 2016 ‐ District AccountingRecords Fund Balance 4,908,929$ 8,486$ ‐$ 1,060,301$ 5,977,716$
See the accompanying notes to the supplementary information.
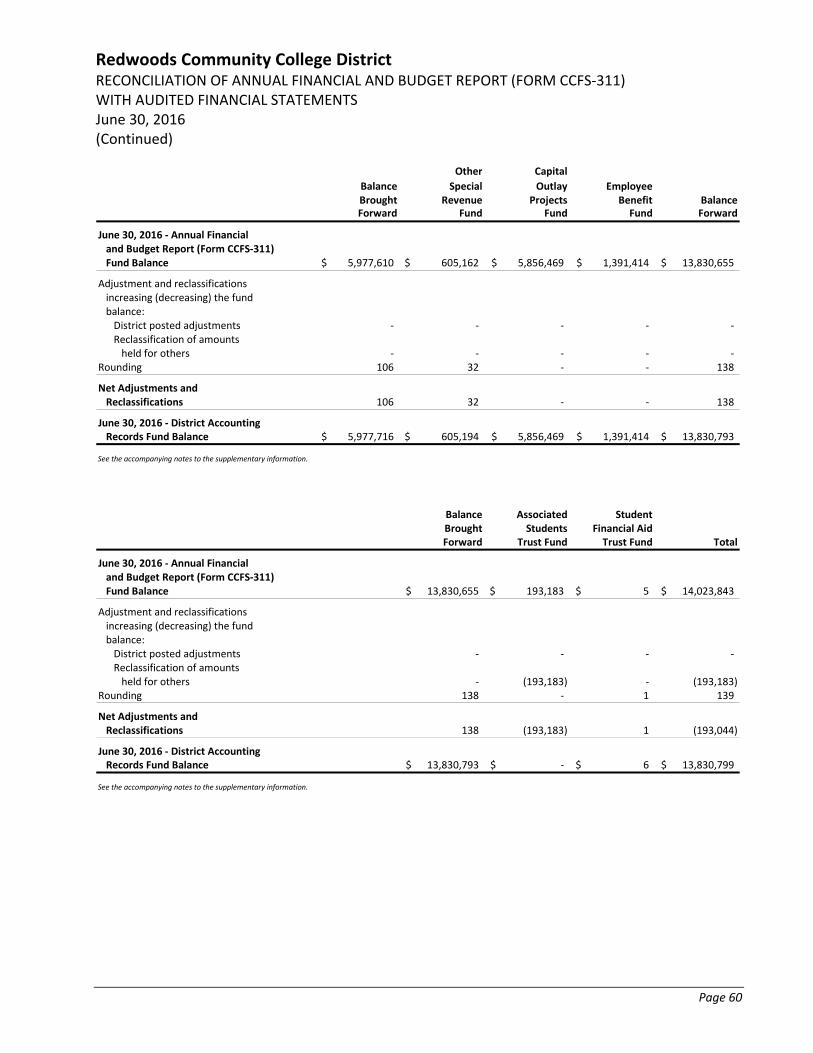
Redwoods Community College District RECONCILIATION OF ANNUAL FINANCIAL AND BUDGET REPORT (FORM CCFS‐311) WITH AUDITED FINANCIAL STATEMENTS June 30, 2016 (Continued)
Page 60
Other Capital
Balance Special Outlay EmployeeBrought Revenue Projects Benefit BalanceForward Fund Fund Fund Forward
June 30, 2016 ‐ Annual Financial and Budget Report (Form CCFS‐311)Fund Balance 5,977,610$ 605,162$ 5,856,469$ 1,391,414$ 13,830,655$
Adjustment and reclassificationsincreasing (decreasing) the fundbalance:District posted adjustments ‐ ‐ ‐ ‐ ‐ Reclassification of amountsheld for others ‐ ‐ ‐ ‐ ‐
Rounding 106 32 ‐ ‐ 138
Net Adjustments andReclassifications 106 32 ‐ ‐ 138
June 30, 2016 ‐ District AccountingRecords Fund Balance 5,977,716$ 605,194$ 5,856,469$ 1,391,414$ 13,830,793$
See the accompanying notes to the supplementary information.
Balance Associated StudentBrought Students Financial AidForward Trust Fund Trust Fund Total
June 30, 2016 ‐ Annual Financial and Budget Report (Form CCFS‐311)Fund Balance 13,830,655$ 193,183$ 5$ 14,023,843$
Adjustment and reclassificationsincreasing (decreasing) the fundbalance:District posted adjustments ‐ ‐ ‐ ‐ Reclassification of amountsheld for others ‐ (193,183) ‐ (193,183)
Rounding 138 ‐ 1 139
Net Adjustments andReclassifications 138 (193,183) 1 (193,044)
June 30, 2016 ‐ District AccountingRecords Fund Balance 13,830,793$ ‐$ 6$ 13,830,799$
See the accompanying notes to the supplementary information.
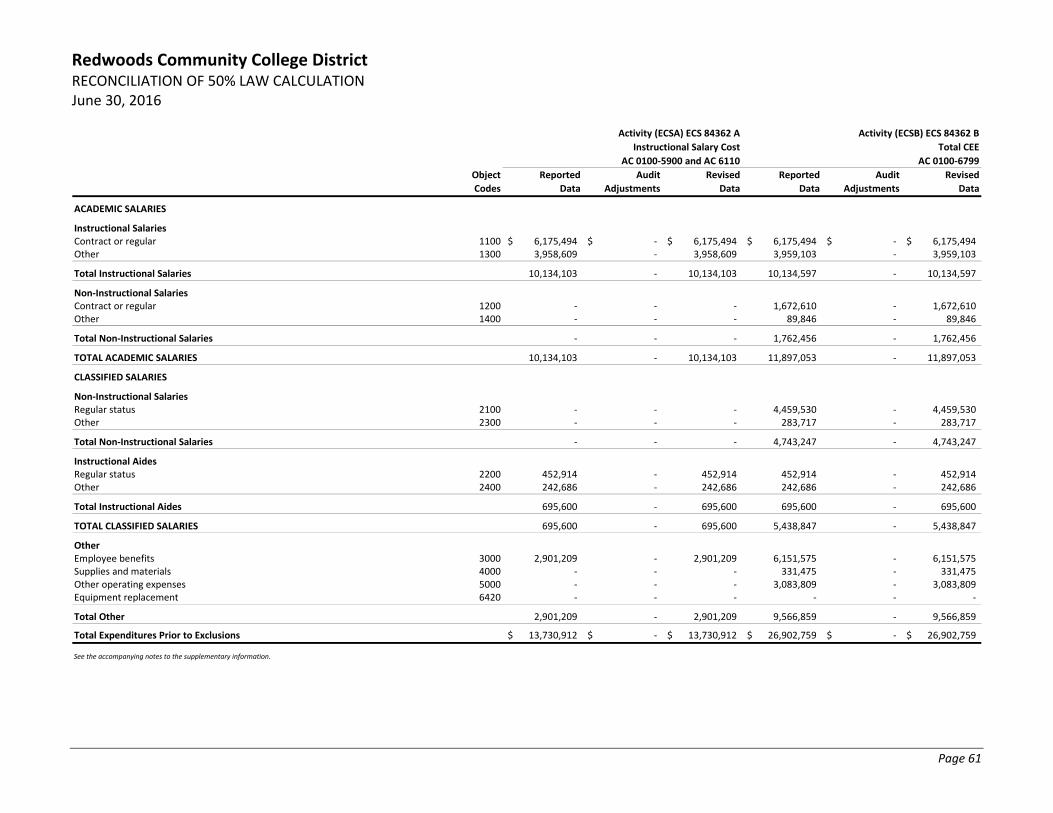
Redwoods Community College District RECONCILIATION OF 50% LAW CALCULATION June 30, 2016
Page 61
Activity (ECSA) ECS 84362 A Activity (ECSB) ECS 84362 B
Instructional Salary Cost Total CEE
AC 0100‐5900 and AC 6110 AC 0100‐6799
Object Reported Audit Revised Reported Audit Revised
Codes Data Adjustments Data Data Adjustments Data
ACADEMIC SALARIES
Instructional SalariesContract or regular 1100 6,175,494$ ‐$ 6,175,494$ 6,175,494$ ‐$ 6,175,494$ Other 1300 3,958,609 ‐ 3,958,609 3,959,103 ‐ 3,959,103
Total Instructional Salaries 10,134,103 ‐ 10,134,103 10,134,597 ‐ 10,134,597
Non‐Instructional SalariesContract or regular 1200 ‐ ‐ ‐ 1,672,610 ‐ 1,672,610 Other 1400 ‐ ‐ ‐ 89,846 ‐ 89,846
Total Non‐Instructional Salaries ‐ ‐ ‐ 1,762,456 ‐ 1,762,456
TOTAL ACADEMIC SALARIES 10,134,103 ‐ 10,134,103 11,897,053 ‐ 11,897,053
CLASSIFIED SALARIES
Non‐Instructional SalariesRegular status 2100 ‐ ‐ ‐ 4,459,530 ‐ 4,459,530 Other 2300 ‐ ‐ ‐ 283,717 ‐ 283,717
Total Non‐Instructional Salaries ‐ ‐ ‐ 4,743,247 ‐ 4,743,247
Instructional AidesRegular status 2200 452,914 ‐ 452,914 452,914 ‐ 452,914 Other 2400 242,686 ‐ 242,686 242,686 ‐ 242,686
Total Instructional Aides 695,600 ‐ 695,600 695,600 ‐ 695,600
TOTAL CLASSIFIED SALARIES 695,600 ‐ 695,600 5,438,847 ‐ 5,438,847
Other Employee benefits 3000 2,901,209 ‐ 2,901,209 6,151,575 ‐ 6,151,575 Supplies and materials 4000 ‐ ‐ ‐ 331,475 ‐ 331,475 Other operating expenses 5000 ‐ ‐ ‐ 3,083,809 ‐ 3,083,809 Equipment replacement 6420 ‐ ‐ ‐ ‐ ‐ ‐
Total Other 2,901,209 ‐ 2,901,209 9,566,859 ‐ 9,566,859
Total Expenditures Prior to Exclusions 13,730,912$ ‐$ 13,730,912$ 26,902,759$ ‐$ 26,902,759$
See the accompanying notes to the supplementary information.
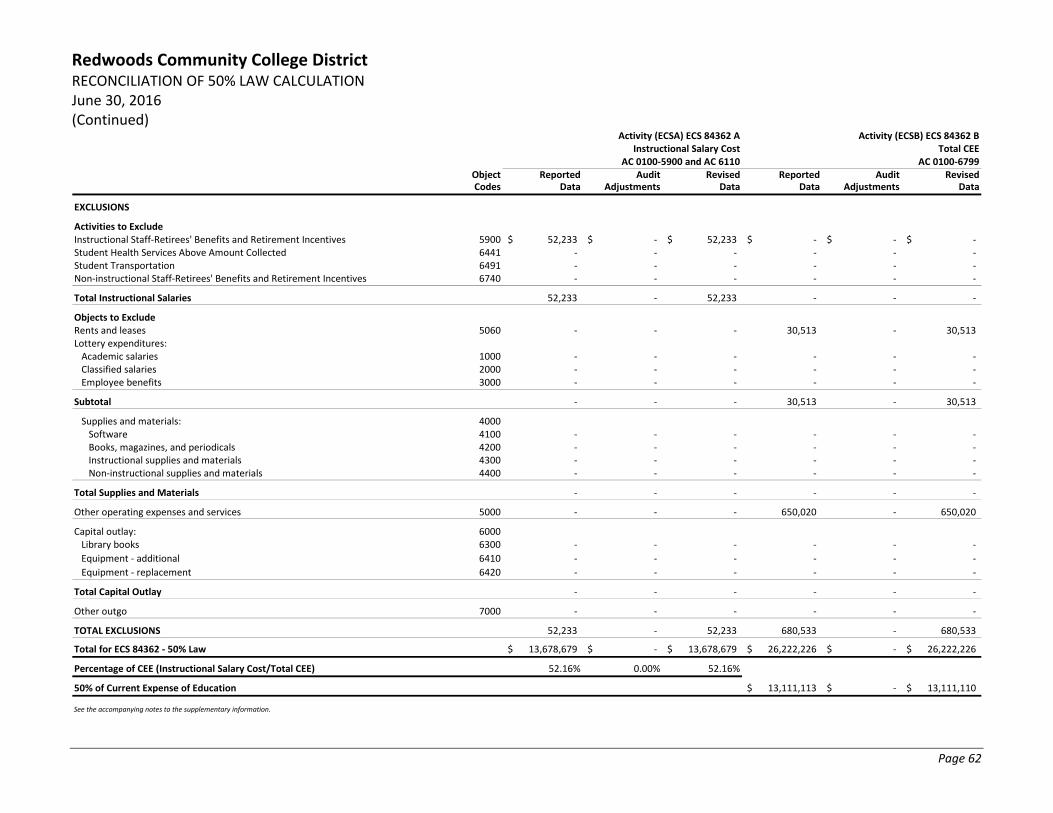
Redwoods Community College District RECONCILIATION OF 50% LAW CALCULATION June 30, 2016 (Continued)
Page 62
Activity (ECSA) ECS 84362 A Activity (ECSB) ECS 84362 BInstructional Salary Cost Total CEE
AC 0100‐5900 and AC 6110 AC 0100‐6799Object Reported Audit Revised Reported Audit RevisedCodes Data Adjustments Data Data Adjustments Data
EXCLUSIONS
Activities to ExcludeInstructional Staff‐Retirees' Benefits and Retirement Incentives 5900 52,233$ ‐$ 52,233$ ‐$ ‐$ ‐$ Student Health Services Above Amount Collected 6441 ‐ ‐ ‐ ‐ ‐ ‐ Student Transportation 6491 ‐ ‐ ‐ ‐ ‐ ‐ Non‐instructional Staff‐Retirees' Benefits and Retirement Incentives 6740 ‐ ‐ ‐ ‐ ‐ ‐
Total Instructional Salaries 52,233 ‐ 52,233 ‐ ‐ ‐
Objects to ExcludeRents and leases 5060 ‐ ‐ ‐ 30,513 ‐ 30,513 Lottery expenditures:Academic salaries 1000 ‐ ‐ ‐ ‐ ‐ ‐ Classified salaries 2000 ‐ ‐ ‐ ‐ ‐ ‐ Employee benefits 3000 ‐ ‐ ‐ ‐ ‐ ‐
Subtotal ‐ ‐ ‐ 30,513 ‐ 30,513
Supplies and materials: 4000Software 4100 ‐ ‐ ‐ ‐ ‐ ‐ Books, magazines, and periodicals 4200 ‐ ‐ ‐ ‐ ‐ ‐ Instructional supplies and materials 4300 ‐ ‐ ‐ ‐ ‐ ‐ Non‐instructional supplies and materials 4400 ‐ ‐ ‐ ‐ ‐ ‐
Total Supplies and Materials ‐ ‐ ‐ ‐ ‐ ‐
Other operating expenses and services 5000 ‐ ‐ ‐ 650,020 ‐ 650,020
Capital outlay: 6000Library books 6300 ‐ ‐ ‐ ‐ ‐ ‐
Equipment ‐ additional 6410 ‐ ‐ ‐ ‐ ‐ ‐
Equipment ‐ replacement 6420 ‐ ‐ ‐ ‐ ‐ ‐
Total Capital Outlay ‐ ‐ ‐ ‐ ‐ ‐
Other outgo 7000 ‐ ‐ ‐ ‐ ‐ ‐
TOTAL EXCLUSIONS 52,233 ‐ 52,233 680,533 ‐ 680,533
Total for ECS 84362 ‐ 50% Law 13,678,679$ ‐$ 13,678,679$ 26,222,226$ ‐$ 26,222,226$
Percentage of CEE (Instructional Salary Cost/Total CEE) 52.16% 0.00% 52.16%
50% of Current Expense of Education 13,111,113$ ‐$ 13,111,110$
See the accompanying notes to the supplementary information.
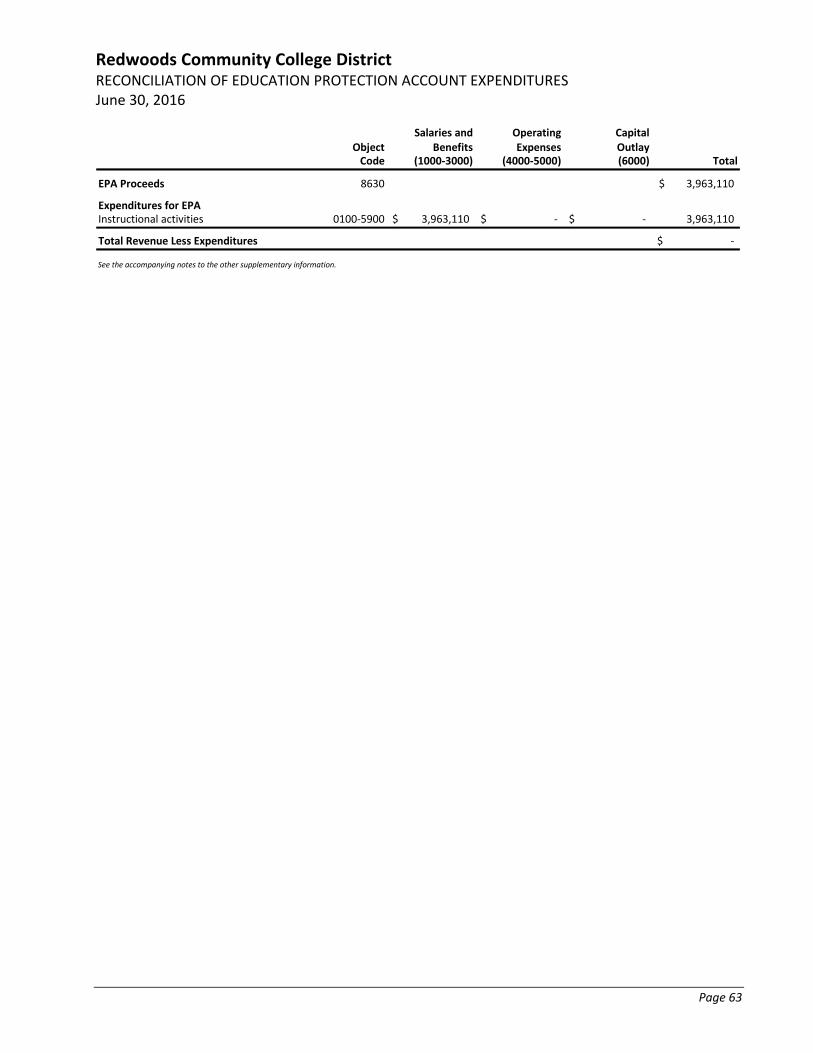
Redwoods Community College District RECONCILIATION OF EDUCATION PROTECTION ACCOUNT EXPENDITURES June 30, 2016
Page 63
Salaries and Operating CapitalObject Benefits Expenses OutlayCode (1000‐3000) (4000‐5000) (6000) Total
EPA Proceeds 8630 3,963,110$
Expenditures for EPAInstructional activities 0100‐5900 3,963,110$ ‐$ ‐$ 3,963,110
Total Revenue Less Expenditures ‐$
See the accompanying notes to the other supplementary information.
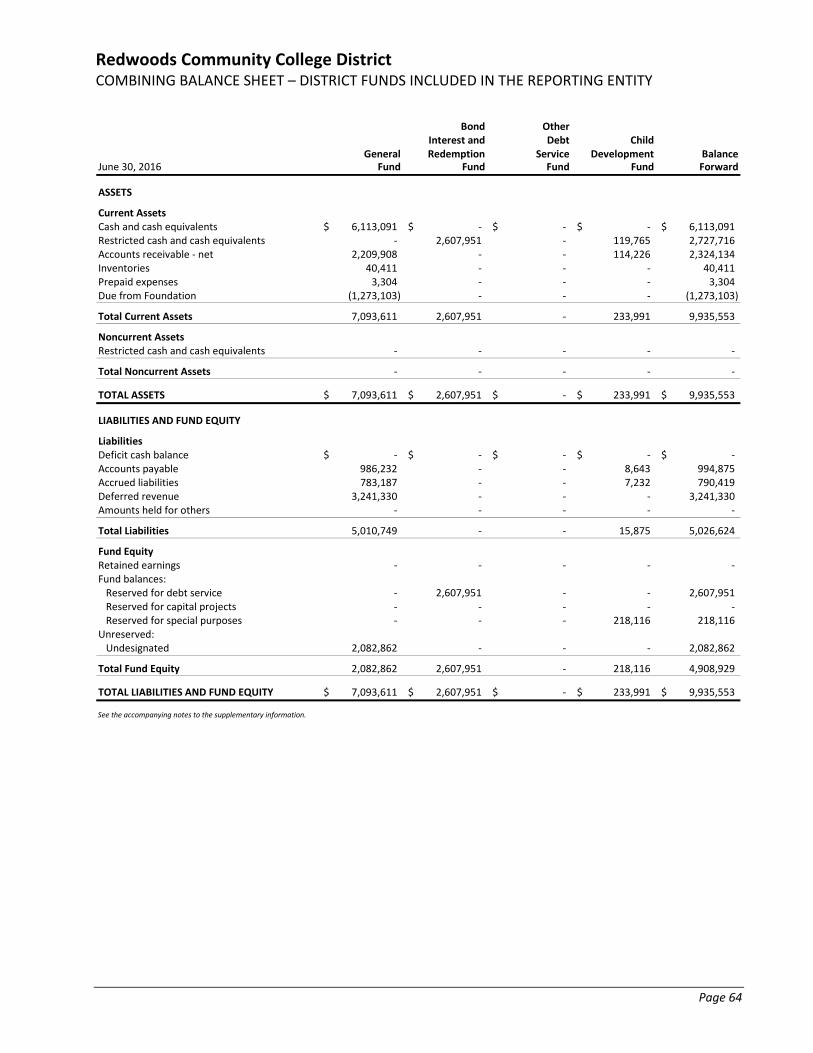
Redwoods Community College District COMBINING BALANCE SHEET – DISTRICT FUNDS INCLUDED IN THE REPORTING ENTITY
Page 64
Bond OtherInterest and Debt Child
General Redemption Service Development BalanceJune 30, 2016 Fund Fund Fund Fund Forward
ASSETS
Current AssetsCash and cash equivalents 6,113,091$ ‐$ ‐$ ‐$ 6,113,091$ Restricted cash and cash equivalents ‐ 2,607,951 ‐ 119,765 2,727,716 Accounts receivable ‐ net 2,209,908 ‐ ‐ 114,226 2,324,134 Inventories 40,411 ‐ ‐ ‐ 40,411 Prepaid expenses 3,304 ‐ ‐ ‐ 3,304 Due from Foundation (1,273,103) ‐ ‐ ‐ (1,273,103)
Total Current Assets 7,093,611 2,607,951 ‐ 233,991 9,935,553
Noncurrent AssetsRestricted cash and cash equivalents ‐ ‐ ‐ ‐ ‐
Total Noncurrent Assets ‐ ‐ ‐ ‐ ‐
TOTAL ASSETS 7,093,611$ 2,607,951$ ‐$ 233,991$ 9,935,553$
LIABILITIES AND FUND EQUITY
LiabilitiesDeficit cash balance ‐$ ‐$ ‐$ ‐$ ‐$ Accounts payable 986,232 ‐ ‐ 8,643 994,875 Accrued liabilities 783,187 ‐ ‐ 7,232 790,419 Deferred revenue 3,241,330 ‐ ‐ ‐ 3,241,330 Amounts held for others ‐ ‐ ‐ ‐ ‐
Total Liabilities 5,010,749 ‐ ‐ 15,875 5,026,624
Fund EquityRetained earnings ‐ ‐ ‐ ‐ ‐ Fund balances:Reserved for debt service ‐ 2,607,951 ‐ ‐ 2,607,951 Reserved for capital projects ‐ ‐ ‐ ‐ ‐ Reserved for special purposes ‐ ‐ ‐ 218,116 218,116
Unreserved:Undesignated 2,082,862 ‐ ‐ ‐ 2,082,862
Total Fund Equity 2,082,862 2,607,951 ‐ 218,116 4,908,929
TOTAL LIABILITIES AND FUND EQUITY 7,093,611$ 2,607,951$ ‐$ 233,991$ 9,935,553$
See the accompanying notes to the supplementary information.
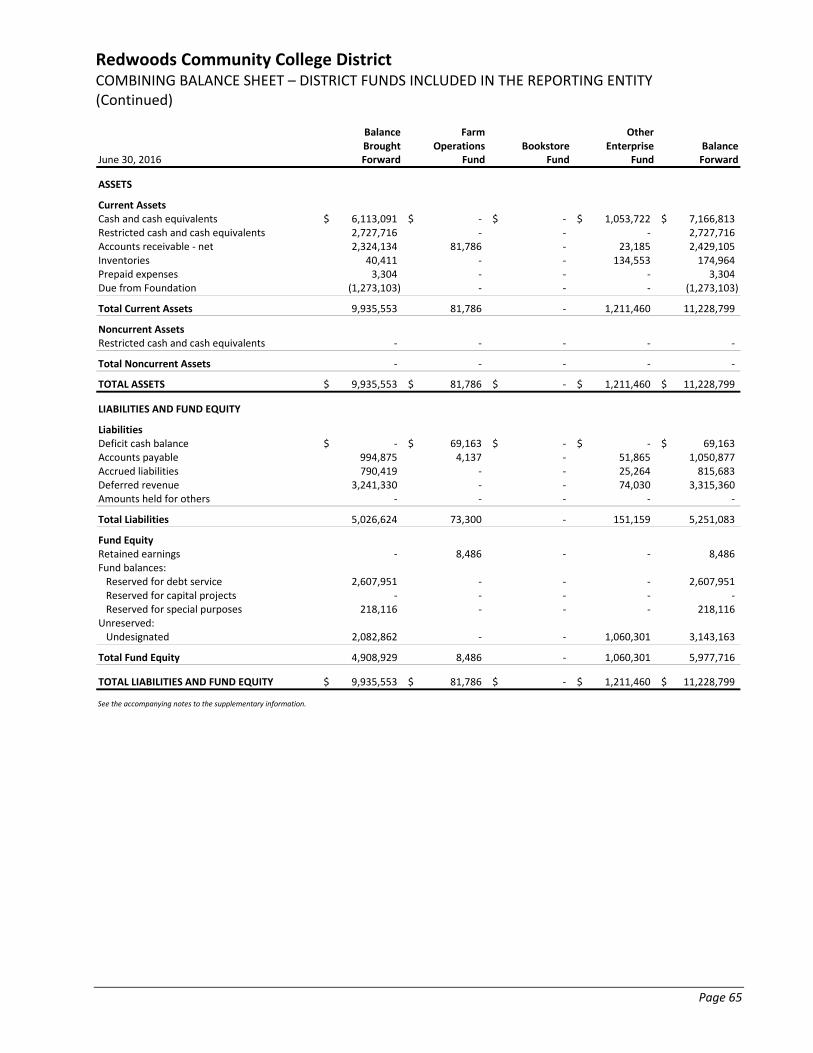
Redwoods Community College District COMBINING BALANCE SHEET – DISTRICT FUNDS INCLUDED IN THE REPORTING ENTITY (Continued)
Page 65
Balance Farm OtherBrought Operations Bookstore Enterprise Balance
June 30, 2016 Forward Fund Fund Fund Forward
ASSETS
Current AssetsCash and cash equivalents 6,113,091$ ‐$ ‐$ 1,053,722$ 7,166,813$ Restricted cash and cash equivalents 2,727,716 ‐ ‐ ‐ 2,727,716 Accounts receivable ‐ net 2,324,134 81,786 ‐ 23,185 2,429,105 Inventories 40,411 ‐ ‐ 134,553 174,964 Prepaid expenses 3,304 ‐ ‐ ‐ 3,304 Due from Foundation (1,273,103) ‐ ‐ ‐ (1,273,103)
Total Current Assets 9,935,553 81,786 ‐ 1,211,460 11,228,799
Noncurrent AssetsRestricted cash and cash equivalents ‐ ‐ ‐ ‐ ‐
Total Noncurrent Assets ‐ ‐ ‐ ‐ ‐
TOTAL ASSETS 9,935,553$ 81,786$ ‐$ 1,211,460$ 11,228,799$
LIABILITIES AND FUND EQUITY
LiabilitiesDeficit cash balance ‐$ 69,163$ ‐$ ‐$ 69,163$ Accounts payable 994,875 4,137 ‐ 51,865 1,050,877 Accrued liabilities 790,419 ‐ ‐ 25,264 815,683 Deferred revenue 3,241,330 ‐ ‐ 74,030 3,315,360 Amounts held for others ‐ ‐ ‐ ‐ ‐
Total Liabilities 5,026,624 73,300 ‐ 151,159 5,251,083
Fund EquityRetained earnings ‐ 8,486 ‐ ‐ 8,486 Fund balances:Reserved for debt service 2,607,951 ‐ ‐ ‐ 2,607,951 Reserved for capital projects ‐ ‐ ‐ ‐ ‐ Reserved for special purposes 218,116 ‐ ‐ ‐ 218,116
Unreserved:Undesignated 2,082,862 ‐ ‐ 1,060,301 3,143,163
Total Fund Equity 4,908,929 8,486 ‐ 1,060,301 5,977,716
TOTAL LIABILITIES AND FUND EQUITY 9,935,553$ 81,786$ ‐$ 1,211,460$ 11,228,799$
See the accompanying notes to the supplementary information.
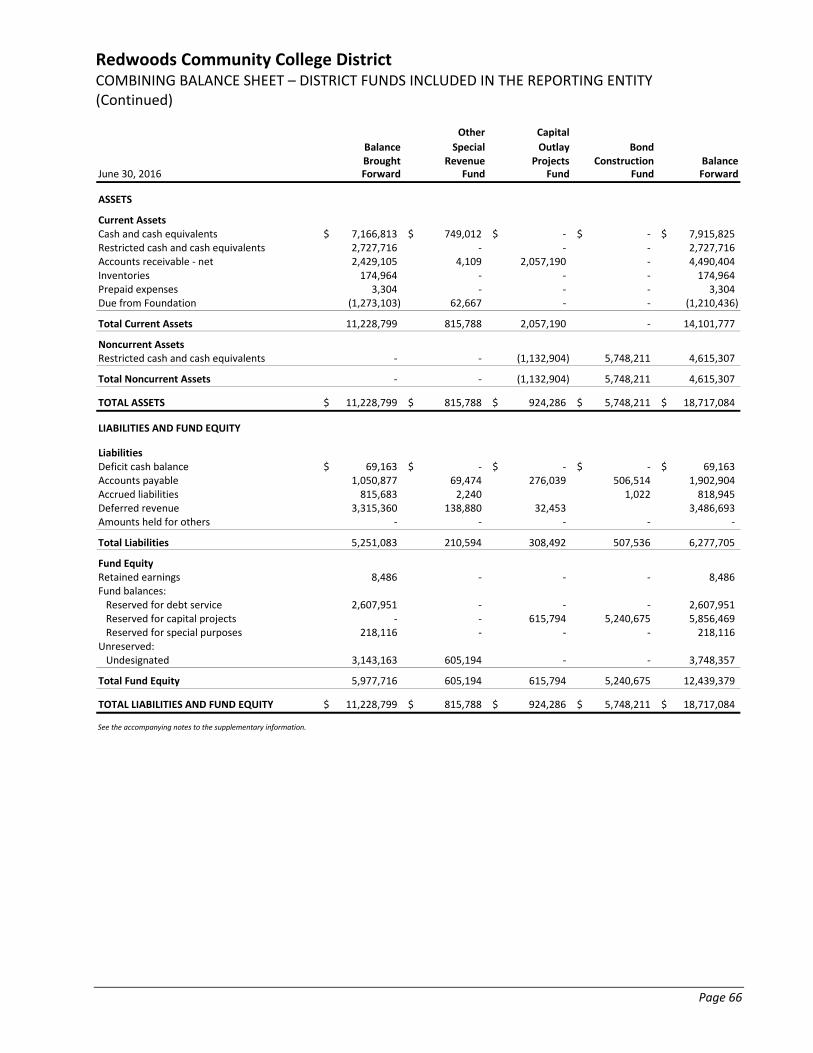
Redwoods Community College District COMBINING BALANCE SHEET – DISTRICT FUNDS INCLUDED IN THE REPORTING ENTITY (Continued)
Page 66
Other Capital
Balance Special Outlay BondBrought Revenue Projects Construction Balance
June 30, 2016 Forward Fund Fund Fund Forward
ASSETS
Current AssetsCash and cash equivalents 7,166,813$ 749,012$ ‐$ ‐$ 7,915,825$ Restricted cash and cash equivalents 2,727,716 ‐ ‐ ‐ 2,727,716 Accounts receivable ‐ net 2,429,105 4,109 2,057,190 ‐ 4,490,404 Inventories 174,964 ‐ ‐ ‐ 174,964 Prepaid expenses 3,304 ‐ ‐ ‐ 3,304 Due from Foundation (1,273,103) 62,667 ‐ ‐ (1,210,436)
Total Current Assets 11,228,799 815,788 2,057,190 ‐ 14,101,777
Noncurrent AssetsRestricted cash and cash equivalents ‐ ‐ (1,132,904) 5,748,211 4,615,307
Total Noncurrent Assets ‐ ‐ (1,132,904) 5,748,211 4,615,307
TOTAL ASSETS 11,228,799$ 815,788$ 924,286$ 5,748,211$ 18,717,084$
LIABILITIES AND FUND EQUITY
LiabilitiesDeficit cash balance 69,163$ ‐$ ‐$ ‐$ 69,163$ Accounts payable 1,050,877 69,474 276,039 506,514 1,902,904 Accrued liabilities 815,683 2,240 1,022 818,945 Deferred revenue 3,315,360 138,880 32,453 3,486,693 Amounts held for others ‐ ‐ ‐ ‐ ‐
Total Liabilities 5,251,083 210,594 308,492 507,536 6,277,705
Fund EquityRetained earnings 8,486 ‐ ‐ ‐ 8,486 Fund balances:Reserved for debt service 2,607,951 ‐ ‐ ‐ 2,607,951 Reserved for capital projects ‐ ‐ 615,794 5,240,675 5,856,469 Reserved for special purposes 218,116 ‐ ‐ ‐ 218,116
Unreserved:Undesignated 3,143,163 605,194 ‐ ‐ 3,748,357
Total Fund Equity 5,977,716 605,194 615,794 5,240,675 12,439,379
TOTAL LIABILITIES AND FUND EQUITY 11,228,799$ 815,788$ 924,286$ 5,748,211$ 18,717,084$
See the accompanying notes to the supplementary information.
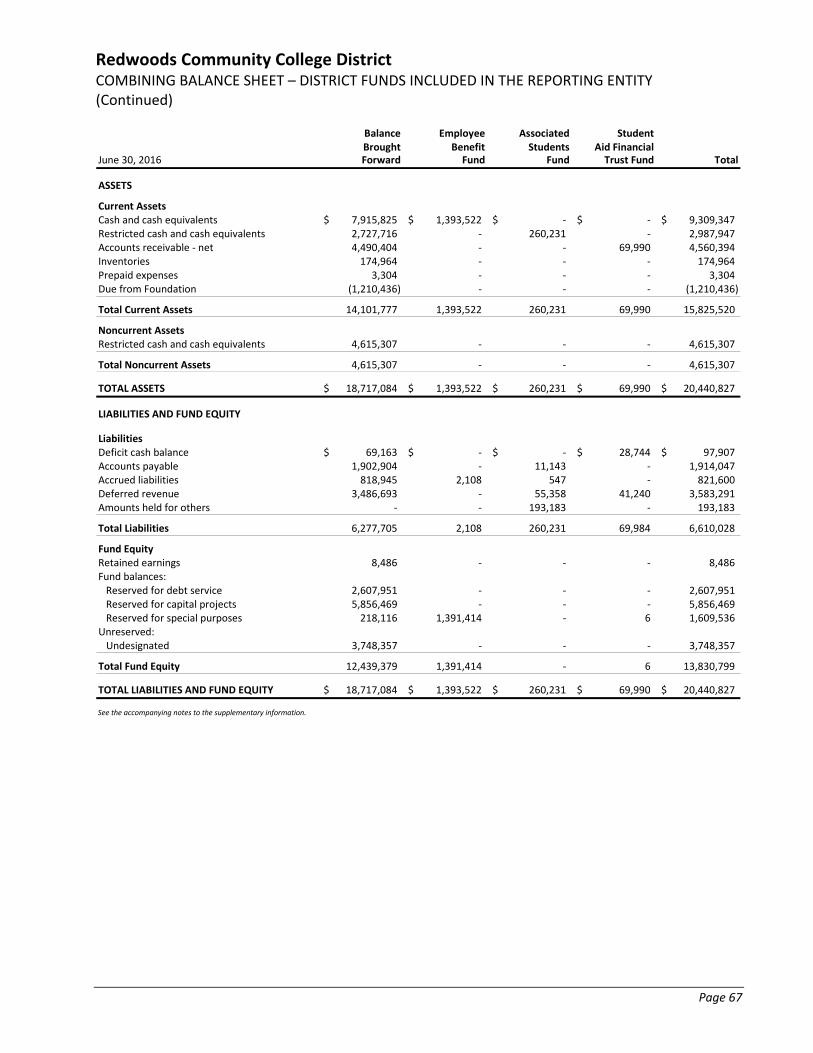
Redwoods Community College District COMBINING BALANCE SHEET – DISTRICT FUNDS INCLUDED IN THE REPORTING ENTITY (Continued)
Page 67
Balance Employee Associated StudentBrought Benefit Students Aid Financial
June 30, 2016 Forward Fund Fund Trust Fund Total
ASSETS
Current AssetsCash and cash equivalents 7,915,825$ 1,393,522$ ‐$ ‐$ 9,309,347$ Restricted cash and cash equivalents 2,727,716 ‐ 260,231 ‐ 2,987,947 Accounts receivable ‐ net 4,490,404 ‐ ‐ 69,990 4,560,394 Inventories 174,964 ‐ ‐ ‐ 174,964 Prepaid expenses 3,304 ‐ ‐ ‐ 3,304 Due from Foundation (1,210,436) ‐ ‐ ‐ (1,210,436)
Total Current Assets 14,101,777 1,393,522 260,231 69,990 15,825,520
Noncurrent AssetsRestricted cash and cash equivalents 4,615,307 ‐ ‐ ‐ 4,615,307
Total Noncurrent Assets 4,615,307 ‐ ‐ ‐ 4,615,307
TOTAL ASSETS 18,717,084$ 1,393,522$ 260,231$ 69,990$ 20,440,827$
LIABILITIES AND FUND EQUITY
LiabilitiesDeficit cash balance 69,163$ ‐$ ‐$ 28,744$ 97,907$ Accounts payable 1,902,904 ‐ 11,143 ‐ 1,914,047 Accrued liabilities 818,945 2,108 547 ‐ 821,600 Deferred revenue 3,486,693 ‐ 55,358 41,240 3,583,291 Amounts held for others ‐ ‐ 193,183 ‐ 193,183
Total Liabilities 6,277,705 2,108 260,231 69,984 6,610,028
Fund EquityRetained earnings 8,486 ‐ ‐ ‐ 8,486 Fund balances:Reserved for debt service 2,607,951 ‐ ‐ ‐ 2,607,951 Reserved for capital projects 5,856,469 ‐ ‐ ‐ 5,856,469 Reserved for special purposes 218,116 1,391,414 ‐ 6 1,609,536
Unreserved:Undesignated 3,748,357 ‐ ‐ ‐ 3,748,357
Total Fund Equity 12,439,379 1,391,414 ‐ 6 13,830,799
TOTAL LIABILITIES AND FUND EQUITY 18,717,084$ 1,393,522$ 260,231$ 69,990$ 20,440,827$
See the accompanying notes to the supplementary information.
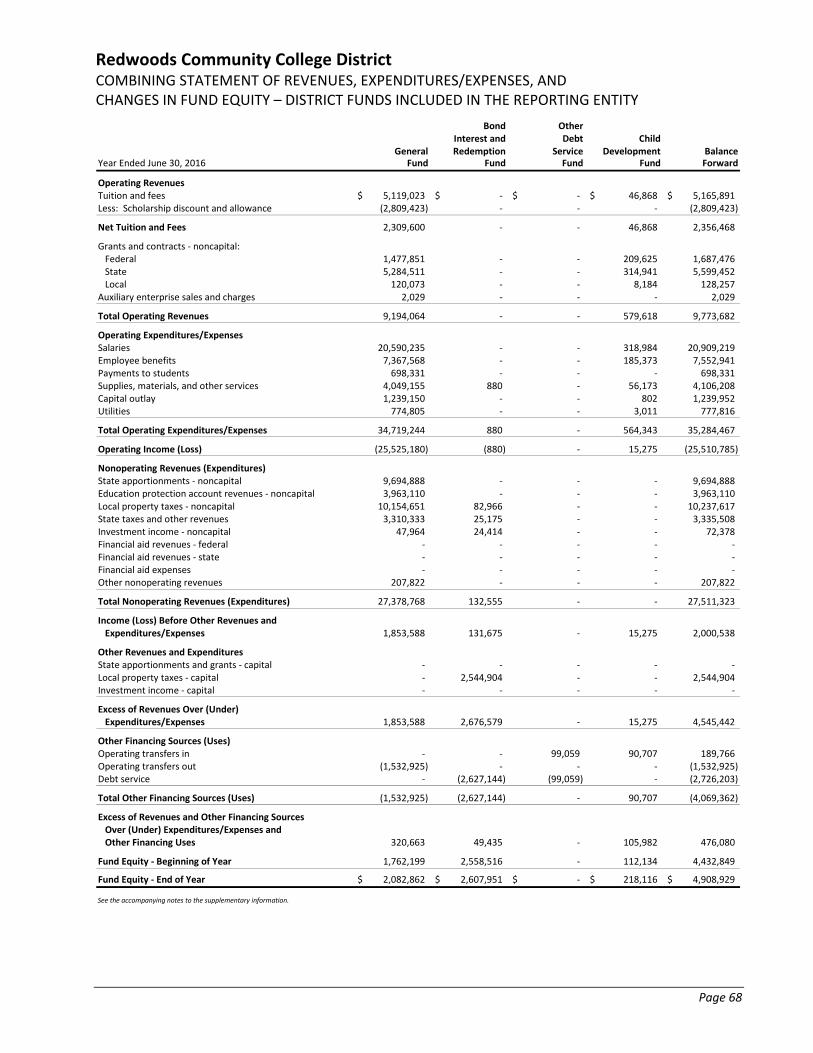
Redwoods Community College District COMBINING STATEMENT OF REVENUES, EXPENDITURES/EXPENSES, AND CHANGES IN FUND EQUITY – DISTRICT FUNDS INCLUDED IN THE REPORTING ENTITY
Page 68
Bond OtherInterest and Debt Child
General Redemption Service Development BalanceYear Ended June 30, 2016 Fund Fund Fund Fund Forward
Operating RevenuesTuition and fees 5,119,023$ ‐$ ‐$ 46,868$ 5,165,891$ Less: Scholarship discount and allowance (2,809,423) ‐ ‐ ‐ (2,809,423)
Net Tuition and Fees 2,309,600 ‐ ‐ 46,868 2,356,468
Grants and contracts ‐ noncapital:Federal 1,477,851 ‐ ‐ 209,625 1,687,476 State 5,284,511 ‐ ‐ 314,941 5,599,452 Local 120,073 ‐ ‐ 8,184 128,257
Auxiliary enterprise sales and charges 2,029 ‐ ‐ ‐ 2,029
Total Operating Revenues 9,194,064 ‐ ‐ 579,618 9,773,682
Operating Expenditures/ExpensesSalaries 20,590,235 ‐ ‐ 318,984 20,909,219 Employee benefits 7,367,568 ‐ ‐ 185,373 7,552,941 Payments to students 698,331 ‐ ‐ ‐ 698,331 Supplies, materials, and other services 4,049,155 880 ‐ 56,173 4,106,208 Capital outlay 1,239,150 ‐ ‐ 802 1,239,952 Utilities 774,805 ‐ ‐ 3,011 777,816
Total Operating Expenditures/Expenses 34,719,244 880 ‐ 564,343 35,284,467
Operating Income (Loss) (25,525,180) (880) ‐ 15,275 (25,510,785)
Nonoperating Revenues (Expenditures)State apportionments ‐ noncapital 9,694,888 ‐ ‐ ‐ 9,694,888 Education protection account revenues ‐ noncapital 3,963,110 ‐ ‐ ‐ 3,963,110 Local property taxes ‐ noncapital 10,154,651 82,966 ‐ ‐ 10,237,617 State taxes and other revenues 3,310,333 25,175 ‐ ‐ 3,335,508 Investment income ‐ noncapital 47,964 24,414 ‐ ‐ 72,378 Financial aid revenues ‐ federal ‐ ‐ ‐ ‐ ‐ Financial aid revenues ‐ state ‐ ‐ ‐ ‐ ‐ Financial aid expenses ‐ ‐ ‐ ‐ ‐ Other nonoperating revenues 207,822 ‐ ‐ ‐ 207,822
Total Nonoperating Revenues (Expenditures) 27,378,768 132,555 ‐ ‐ 27,511,323
Income (Loss) Before Other Revenues and Expenditures/Expenses 1,853,588 131,675 ‐ 15,275 2,000,538
Other Revenues and ExpendituresState apportionments and grants ‐ capital ‐ ‐ ‐ ‐ ‐ Local property taxes ‐ capital ‐ 2,544,904 ‐ ‐ 2,544,904 Investment income ‐ capital ‐ ‐ ‐ ‐ ‐
Excess of Revenues Over (Under) Expenditures/Expenses 1,853,588 2,676,579 ‐ 15,275 4,545,442
Other Financing Sources (Uses)Operating transfers in ‐ ‐ 99,059 90,707 189,766 Operating transfers out (1,532,925) ‐ ‐ ‐ (1,532,925) Debt service ‐ (2,627,144) (99,059) ‐ (2,726,203)
Total Other Financing Sources (Uses) (1,532,925) (2,627,144) ‐ 90,707 (4,069,362)
Excess of Revenues and Other Financing SourcesOver (Under) Expenditures/Expenses andOther Financing Uses 320,663 49,435 ‐ 105,982 476,080
Fund Equity ‐ Beginning of Year 1,762,199 2,558,516 ‐ 112,134 4,432,849
Fund Equity ‐ End of Year 2,082,862$ 2,607,951$ ‐$ 218,116$ 4,908,929$
See the accompanying notes to the supplementary information.
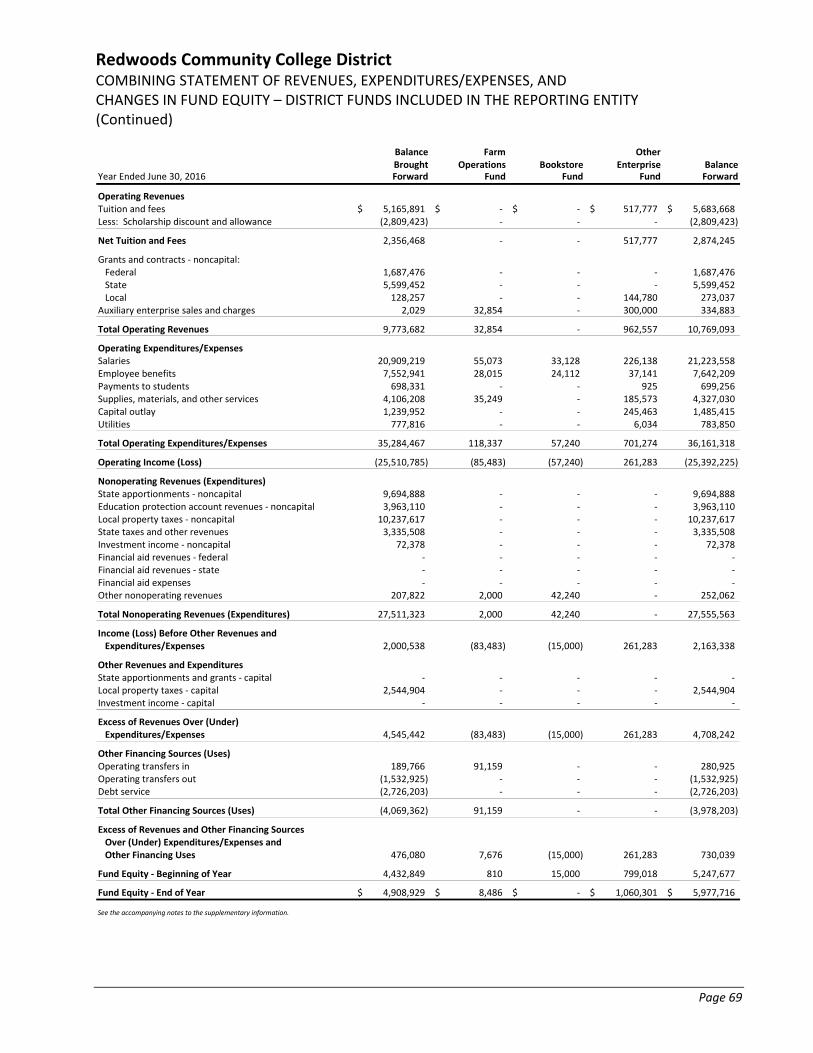
Redwoods Community College District COMBINING STATEMENT OF REVENUES, EXPENDITURES/EXPENSES, AND CHANGES IN FUND EQUITY – DISTRICT FUNDS INCLUDED IN THE REPORTING ENTITY (Continued)
Page 69
Balance Farm OtherBrought Operations Bookstore Enterprise Balance
Year Ended June 30, 2016 Forward Fund Fund Fund Forward
Operating RevenuesTuition and fees 5,165,891$ ‐$ ‐$ 517,777$ 5,683,668$ Less: Scholarship discount and allowance (2,809,423) ‐ ‐ ‐ (2,809,423)
Net Tuition and Fees 2,356,468 ‐ ‐ 517,777 2,874,245
Grants and contracts ‐ noncapital:Federal 1,687,476 ‐ ‐ ‐ 1,687,476 State 5,599,452 ‐ ‐ ‐ 5,599,452 Local 128,257 ‐ ‐ 144,780 273,037
Auxiliary enterprise sales and charges 2,029 32,854 ‐ 300,000 334,883
Total Operating Revenues 9,773,682 32,854 ‐ 962,557 10,769,093
Operating Expenditures/ExpensesSalaries 20,909,219 55,073 33,128 226,138 21,223,558 Employee benefits 7,552,941 28,015 24,112 37,141 7,642,209 Payments to students 698,331 ‐ ‐ 925 699,256 Supplies, materials, and other services 4,106,208 35,249 ‐ 185,573 4,327,030 Capital outlay 1,239,952 ‐ ‐ 245,463 1,485,415 Utilities 777,816 ‐ ‐ 6,034 783,850
Total Operating Expenditures/Expenses 35,284,467 118,337 57,240 701,274 36,161,318
Operating Income (Loss) (25,510,785) (85,483) (57,240) 261,283 (25,392,225)
Nonoperating Revenues (Expenditures)State apportionments ‐ noncapital 9,694,888 ‐ ‐ ‐ 9,694,888 Education protection account revenues ‐ noncapital 3,963,110 ‐ ‐ ‐ 3,963,110 Local property taxes ‐ noncapital 10,237,617 ‐ ‐ ‐ 10,237,617 State taxes and other revenues 3,335,508 ‐ ‐ ‐ 3,335,508 Investment income ‐ noncapital 72,378 ‐ ‐ ‐ 72,378 Financial aid revenues ‐ federal ‐ ‐ ‐ ‐ ‐ Financial aid revenues ‐ state ‐ ‐ ‐ ‐ ‐ Financial aid expenses ‐ ‐ ‐ ‐ ‐ Other nonoperating revenues 207,822 2,000 42,240 ‐ 252,062
Total Nonoperating Revenues (Expenditures) 27,511,323 2,000 42,240 ‐ 27,555,563
Income (Loss) Before Other Revenues and Expenditures/Expenses 2,000,538 (83,483) (15,000) 261,283 2,163,338
Other Revenues and ExpendituresState apportionments and grants ‐ capital ‐ ‐ ‐ ‐ ‐ Local property taxes ‐ capital 2,544,904 ‐ ‐ ‐ 2,544,904 Investment income ‐ capital ‐ ‐ ‐ ‐ ‐
Excess of Revenues Over (Under) Expenditures/Expenses 4,545,442 (83,483) (15,000) 261,283 4,708,242
Other Financing Sources (Uses)Operating transfers in 189,766 91,159 ‐ ‐ 280,925 Operating transfers out (1,532,925) ‐ ‐ ‐ (1,532,925) Debt service (2,726,203) ‐ ‐ ‐ (2,726,203)
Total Other Financing Sources (Uses) (4,069,362) 91,159 ‐ ‐ (3,978,203)
Excess of Revenues and Other Financing SourcesOver (Under) Expenditures/Expenses andOther Financing Uses 476,080 7,676 (15,000) 261,283 730,039
Fund Equity ‐ Beginning of Year 4,432,849 810 15,000 799,018 5,247,677
Fund Equity ‐ End of Year 4,908,929$ 8,486$ ‐$ 1,060,301$ 5,977,716$
See the accompanying notes to the supplementary information.
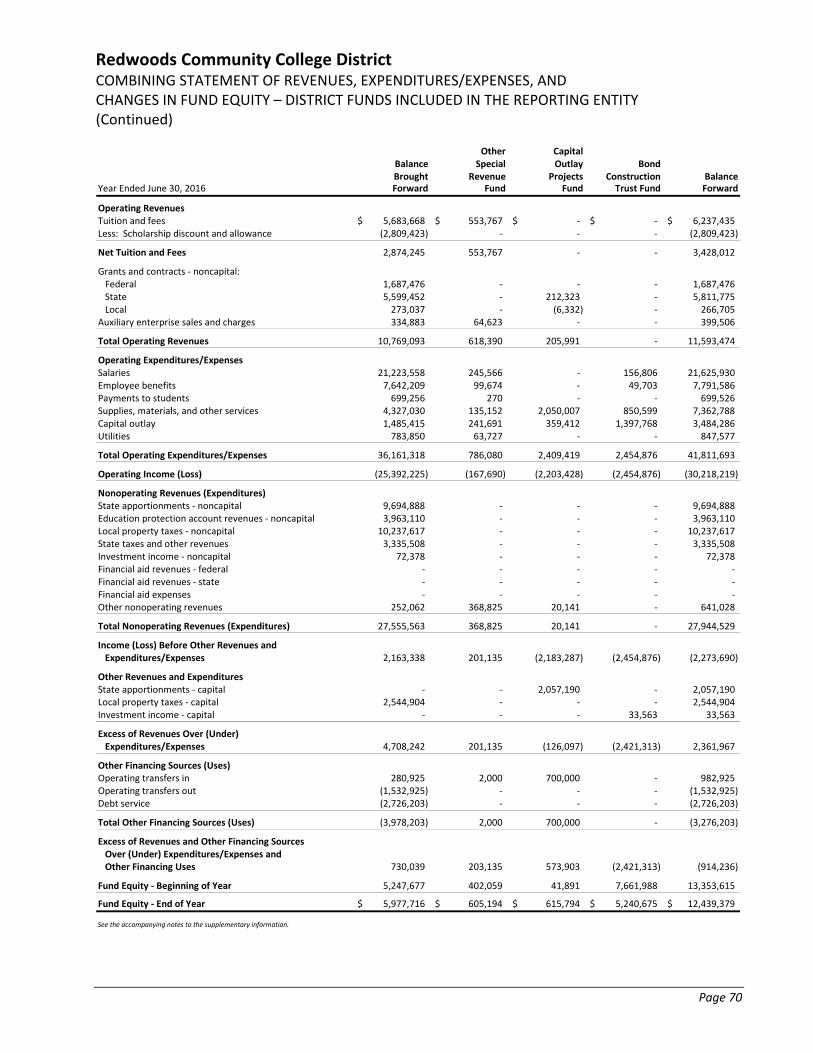
Redwoods Community College District COMBINING STATEMENT OF REVENUES, EXPENDITURES/EXPENSES, AND CHANGES IN FUND EQUITY – DISTRICT FUNDS INCLUDED IN THE REPORTING ENTITY (Continued)
Page 70
Other CapitalBalance Special Outlay BondBrought Revenue Projects Construction Balance
Year Ended June 30, 2016 Forward Fund Fund Trust Fund Forward
Operating RevenuesTuition and fees 5,683,668$ 553,767$ ‐$ ‐$ 6,237,435$ Less: Scholarship discount and allowance (2,809,423) ‐ ‐ ‐ (2,809,423)
Net Tuition and Fees 2,874,245 553,767 ‐ ‐ 3,428,012
Grants and contracts ‐ noncapital:Federal 1,687,476 ‐ ‐ ‐ 1,687,476 State 5,599,452 ‐ 212,323 ‐ 5,811,775 Local 273,037 ‐ (6,332) ‐ 266,705
Auxiliary enterprise sales and charges 334,883 64,623 ‐ ‐ 399,506
Total Operating Revenues 10,769,093 618,390 205,991 ‐ 11,593,474
Operating Expenditures/ExpensesSalaries 21,223,558 245,566 ‐ 156,806 21,625,930 Employee benefits 7,642,209 99,674 ‐ 49,703 7,791,586 Payments to students 699,256 270 ‐ ‐ 699,526 Supplies, materials, and other services 4,327,030 135,152 2,050,007 850,599 7,362,788 Capital outlay 1,485,415 241,691 359,412 1,397,768 3,484,286 Utilities 783,850 63,727 ‐ ‐ 847,577
Total Operating Expenditures/Expenses 36,161,318 786,080 2,409,419 2,454,876 41,811,693
Operating Income (Loss) (25,392,225) (167,690) (2,203,428) (2,454,876) (30,218,219)
Nonoperating Revenues (Expenditures)State apportionments ‐ noncapital 9,694,888 ‐ ‐ ‐ 9,694,888 Education protection account revenues ‐ noncapital 3,963,110 ‐ ‐ ‐ 3,963,110 Local property taxes ‐ noncapital 10,237,617 ‐ ‐ ‐ 10,237,617 State taxes and other revenues 3,335,508 ‐ ‐ ‐ 3,335,508 Investment income ‐ noncapital 72,378 ‐ ‐ ‐ 72,378 Financial aid revenues ‐ federal ‐ ‐ ‐ ‐ ‐ Financial aid revenues ‐ state ‐ ‐ ‐ ‐ ‐ Financial aid expenses ‐ ‐ ‐ ‐ ‐ Other nonoperating revenues 252,062 368,825 20,141 ‐ 641,028
Total Nonoperating Revenues (Expenditures) 27,555,563 368,825 20,141 ‐ 27,944,529
Income (Loss) Before Other Revenues and Expenditures/Expenses 2,163,338 201,135 (2,183,287) (2,454,876) (2,273,690)
Other Revenues and ExpendituresState apportionments ‐ capital ‐ ‐ 2,057,190 ‐ 2,057,190 Local property taxes ‐ capital 2,544,904 ‐ ‐ ‐ 2,544,904 Investment income ‐ capital ‐ ‐ ‐ 33,563 33,563
Excess of Revenues Over (Under) Expenditures/Expenses 4,708,242 201,135 (126,097) (2,421,313) 2,361,967
Other Financing Sources (Uses)Operating transfers in 280,925 2,000 700,000 ‐ 982,925 Operating transfers out (1,532,925) ‐ ‐ ‐ (1,532,925) Debt service (2,726,203) ‐ ‐ ‐ (2,726,203)
Total Other Financing Sources (Uses) (3,978,203) 2,000 700,000 ‐ (3,276,203)
Excess of Revenues and Other Financing SourcesOver (Under) Expenditures/Expenses andOther Financing Uses 730,039 203,135 573,903 (2,421,313) (914,236)
Fund Equity ‐ Beginning of Year 5,247,677 402,059 41,891 7,661,988 13,353,615
Fund Equity ‐ End of Year 5,977,716$ 605,194$ 615,794$ 5,240,675$ 12,439,379$
See the accompanying notes to the supplementary information.
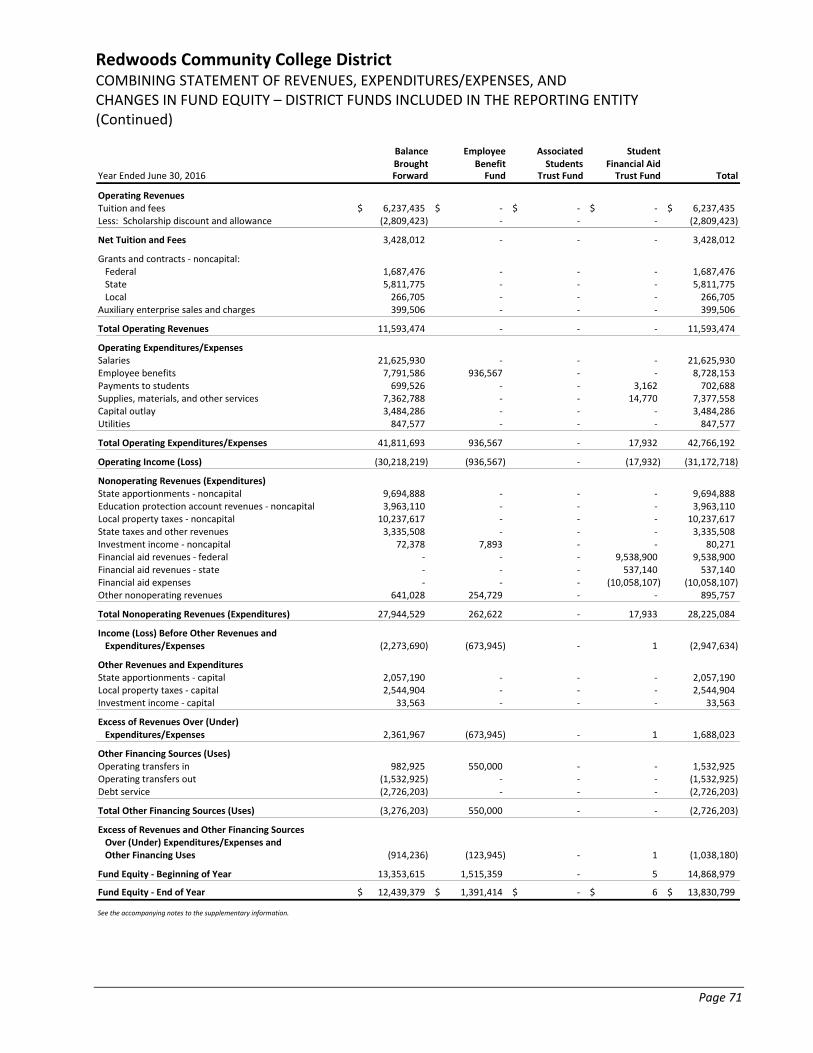
Redwoods Community College District COMBINING STATEMENT OF REVENUES, EXPENDITURES/EXPENSES, AND CHANGES IN FUND EQUITY – DISTRICT FUNDS INCLUDED IN THE REPORTING ENTITY (Continued)
Page 71
Balance Employee Associated StudentBrought Benefit Students Financial Aid
Year Ended June 30, 2016 Forward Fund Trust Fund Trust Fund Total
Operating RevenuesTuition and fees 6,237,435$ ‐$ ‐$ ‐$ 6,237,435$ Less: Scholarship discount and allowance (2,809,423) ‐ ‐ ‐ (2,809,423)
Net Tuition and Fees 3,428,012 ‐ ‐ ‐ 3,428,012
Grants and contracts ‐ noncapital:Federal 1,687,476 ‐ ‐ ‐ 1,687,476 State 5,811,775 ‐ ‐ ‐ 5,811,775 Local 266,705 ‐ ‐ ‐ 266,705
Auxiliary enterprise sales and charges 399,506 ‐ ‐ ‐ 399,506
Total Operating Revenues 11,593,474 ‐ ‐ ‐ 11,593,474
Operating Expenditures/ExpensesSalaries 21,625,930 ‐ ‐ ‐ 21,625,930 Employee benefits 7,791,586 936,567 ‐ ‐ 8,728,153 Payments to students 699,526 ‐ ‐ 3,162 702,688 Supplies, materials, and other services 7,362,788 ‐ ‐ 14,770 7,377,558 Capital outlay 3,484,286 ‐ ‐ ‐ 3,484,286 Utilities 847,577 ‐ ‐ ‐ 847,577
Total Operating Expenditures/Expenses 41,811,693 936,567 ‐ 17,932 42,766,192
Operating Income (Loss) (30,218,219) (936,567) ‐ (17,932) (31,172,718)
Nonoperating Revenues (Expenditures)State apportionments ‐ noncapital 9,694,888 ‐ ‐ ‐ 9,694,888 Education protection account revenues ‐ noncapital 3,963,110 ‐ ‐ ‐ 3,963,110 Local property taxes ‐ noncapital 10,237,617 ‐ ‐ ‐ 10,237,617 State taxes and other revenues 3,335,508 ‐ ‐ ‐ 3,335,508 Investment income ‐ noncapital 72,378 7,893 ‐ ‐ 80,271 Financial aid revenues ‐ federal ‐ ‐ ‐ 9,538,900 9,538,900 Financial aid revenues ‐ state ‐ ‐ ‐ 537,140 537,140 Financial aid expenses ‐ ‐ ‐ (10,058,107) (10,058,107) Other nonoperating revenues 641,028 254,729 ‐ ‐ 895,757
Total Nonoperating Revenues (Expenditures) 27,944,529 262,622 ‐ 17,933 28,225,084
Income (Loss) Before Other Revenues and Expenditures/Expenses (2,273,690) (673,945) ‐ 1 (2,947,634)
Other Revenues and ExpendituresState apportionments ‐ capital 2,057,190 ‐ ‐ ‐ 2,057,190 Local property taxes ‐ capital 2,544,904 ‐ ‐ ‐ 2,544,904 Investment income ‐ capital 33,563 ‐ ‐ ‐ 33,563
Excess of Revenues Over (Under) Expenditures/Expenses 2,361,967 (673,945) ‐ 1 1,688,023
Other Financing Sources (Uses)Operating transfers in 982,925 550,000 ‐ ‐ 1,532,925 Operating transfers out (1,532,925) ‐ ‐ ‐ (1,532,925) Debt service (2,726,203) ‐ ‐ ‐ (2,726,203)
Total Other Financing Sources (Uses) (3,276,203) 550,000 ‐ ‐ (2,726,203)
Excess of Revenues and Other Financing SourcesOver (Under) Expenditures/Expenses andOther Financing Uses (914,236) (123,945) ‐ 1 (1,038,180)
Fund Equity ‐ Beginning of Year 13,353,615 1,515,359 ‐ 5 14,868,979
Fund Equity ‐ End of Year 12,439,379$ 1,391,414$ ‐$ 6$ 13,830,799$
See the accompanying notes to the supplementary information.
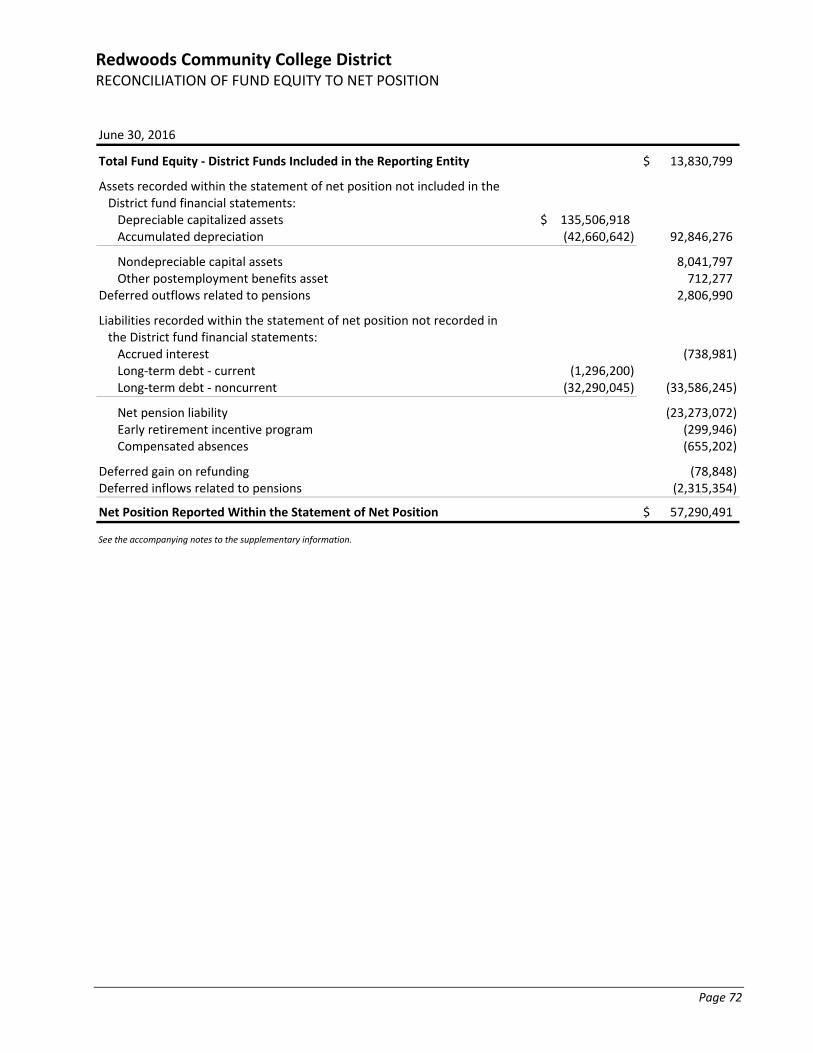
Redwoods Community College District RECONCILIATION OF FUND EQUITY TO NET POSITION
Page 72
June 30, 2016
Total Fund Equity ‐ District Funds Included in the Reporting Entity 13,830,799$
Assets recorded within the statement of net position not included in the District fund financial statements:Depreciable capitalized assets 135,506,918$ Accumulated depreciation (42,660,642) 92,846,276
Nondepreciable capital assets 8,041,797 Other postemployment benefits asset 712,277
Deferred outflows related to pensions 2,806,990
Liabilities recorded within the statement of net position not recorded in the District fund financial statements:Accrued interest (738,981) Long‐term debt ‐ current (1,296,200) Long‐term debt ‐ noncurrent (32,290,045) (33,586,245)
Net pension liability (23,273,072) Early retirement incentive program (299,946) Compensated absences (655,202)
Deferred gain on refunding (78,848) Deferred inflows related to pensions (2,315,354)
Net Position Reported Within the Statement of Net Position 57,290,491$
See the accompanying notes to the supplementary information.
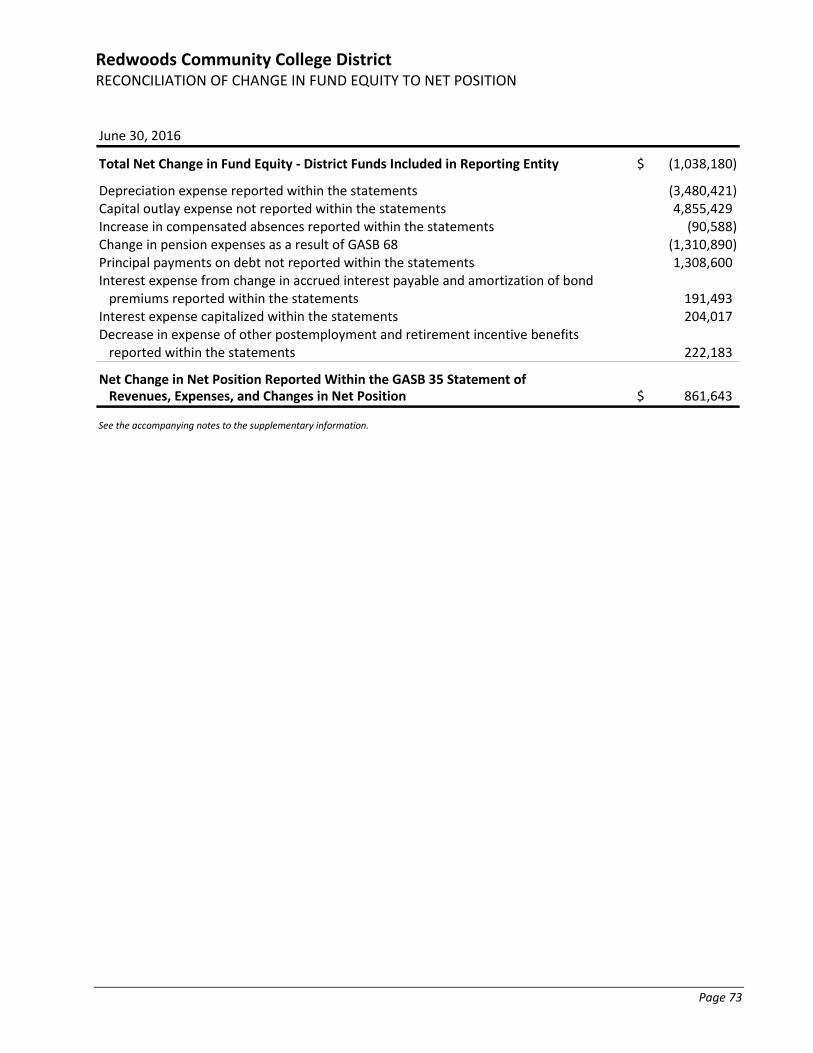
Redwoods Community College District RECONCILIATION OF CHANGE IN FUND EQUITY TO NET POSITION
Page 73
June 30, 2016
Total Net Change in Fund Equity ‐ District Funds Included in Reporting Entity (1,038,180)$
Depreciation expense reported within the statements (3,480,421) Capital outlay expense not reported within the statements 4,855,429 Increase in compensated absences reported within the statements (90,588) Change in pension expenses as a result of GASB 68 (1,310,890) Principal payments on debt not reported within the statements 1,308,600 Interest expense from change in accrued interest payable and amortization of bond premiums reported within the statements 191,493
Interest expense capitalized within the statements 204,017 Decrease in expense of other postemployment and retirement incentive benefits reported within the statements 222,183
Net Change in Net Position Reported Within the GASB 35 Statement of Revenues, Expenses, and Changes in Net Position 861,643$
See the accompanying notes to the supplementary information.
Redwoods Community College District NOTES TO THE SUPPLEMENTARY INFORMATION
Page 74
1. PURPOSE OF SCHEDULES
Schedule of Workload Measures for State General Apportionment
The Schedule of Workload Measures for State General Apportionment Annualized Attendance as ofJune 30, 2016, represents the basis of apportionment of the District’s annual source of funding.
Schedule of Expenditures of Federal Awards
This schedule includes the federal award activity of the District under programs of the federalgovernment for the year ended June 30, 2016. The information in this schedule is presented inaccordance with the requirements of Title 2 U.S. Code of Federal Regulations Part 200, UniformAdministrative Requirements, Cost Principles, and Audit Requirements for Federal Awards (theUniform Guidance).
Expenditures reported on this schedule are reported on the modified basis of accounting. Suchexpenditures are recognized following the cost principles contained in the Uniform Guidance, whereincertain types of expenditures are not allowable or are limited as to reimbursement.
The District has not elected to use the 10% de minimis indirect cost rate allowed under the UniformGuidance.
Schedule of Expenditures of State Awards
This schedule includes the state activity of the District under categorical programs of the state ofCalifornia for the year ended June 30, 2016. The information in this schedule is presented inaccordance with the requirements of the California Community Colleges Contracted District AuditManual 2015‐16.
Expenses reported on this schedule are reported on the accrual basis of accounting.
Reconciliation of Annual Financial and Budget Report (Form CCFS‐311) With DistrictAccounting Records
This schedule provides the information necessary to reconcile the fund balance of all funds reportedon the Form CCFS‐311 to the District accounting records.
Reconciliation of 50% Law Calculation
This schedule provides the information necessary to reconcile the 50% law calculation as reported onthe Form CCFS‐311 to the audited financial statements.
Reconciliation of Education Protection Account Expenditures
This schedule provides the information necessary to reconcile the Education Protection AccountExpenditures reported on the Form CCFS‐311 to the audited financial statements.
Redwoods Community College District NOTES TO THE SUPPLEMENTARY INFORMATION (Continued)
Page 75
Reconciliation of Fund Equity to Net Position and Reconciliation of Change in Fund Equity to Change in Net Position
These schedules provide the information necessary to reconcile the supplemental combining financial schedules to the audited financial statements.
2. COMBINING FINANCIAL STATEMENTS’ SUMMARY OF SIGNIFICANT ACCOUNTING POLICIES
Basis of Accounting The accompanying combining balance sheet – District funds included in thereporting entity, combining statement of revenues, expenditures/expenses, and changes in fundequity – District funds Included in the reporting entity are presented on the modified accrual basis ofaccounting with the exception of the Farm Operations Fund and Employee Benefits Trust Fund, whichare presented on the accrual basis of accounting consistent with the presentation in the entity‐widefinancial statements.
Under the modified accrual basis of accounting, revenues are recognized when susceptible to accrual(i.e., when they are “measurable” and “available”). “Measurable” means the amount of thetransaction can be determined, and “available” means collectible within the current period or soonthereafter to pay liabilities of the current period. The District considers property taxes available if theyare collected within 60 days after year end. A one‐year availability period is used for revenuerecognition for all other governmental fund revenues. Expenditures are recorded when the relatedfund liability is incurred. Principal and interest on general long‐term debt are recorded as fundliabilities when due or when amounts have been accumulated in the debt service fund for paymentsto be made early in the following year.
Property taxes, franchise taxes, licenses, interest revenue, and charges for services are susceptible toaccrual. Other receipts become measurable and available when cash is received by the District and arerecognized as revenue at that time.
The District reports advance of revenue on its combining balance sheet. Advance of revenues arisewhen potential revenue does not meet both the “measurable” and “available” criteria for recognitionin the current period. Advance of revenues also arise when resources are received by the Districtbefore it has a legal claim to them, as when grant monies are received prior to the incurrence ofqualifying expenditures. In subsequent periods, when both revenue recognition criteria are met, orwhen the District has legal claim to the resources, the liability for advance of revenue is removed andrevenue is recognized.
3. LOAN PROGRAM
The District is responsible only for the performance of certain administrative duties with respect tothe Federal Direct Loan Program. Accordingly, the value of these outstanding loans is not reflected inthe District’s financial statements. It is not practical to determine the balance of loans outstanding tostudents of the District under this program as of June 30, 2016.

OTHER REPORTS SECTION
Page 77
INDEPENDENT AUDITORS’ REPORT ON INTERNAL CONTROL OVER FINANCIAL REPORTING AND ON COMPLIANCE AND OTHER MATTERS BASED ON AN AUDIT OF FINANCIAL STATEMENTS PERFORMED IN ACCORDANCE WITH GOVERNMENT AUDITING STANDARDS
To the Board of Trustees Redwoods Community College District Eureka, California
We have audited, in accordance with auditing standards generally accepted in the United States of America and the standards applicable to financial audits contained in Government Auditing Standards issued by the Comptroller General of the United States, the financial statements of the business‐type activities of Redwoods Community College District (the District) as of and for the year ended June 30, 2016; and the related notes to the financial statements, which collectively comprise the District’s basic financial statements; and have issued our report thereon dated April 4, 2017.
Internal Control Over Financial Reporting
In planning and performing our audit of the financial statements, we considered the District’s internal control over financial reporting (internal control) to determine the audit procedures that are appropriate in the circumstances for the purpose of expressing our opinion on the financial statements, but not for the purpose of expressing an opinion on the effectiveness of the District’s internal control. Accordingly, we do not express an opinion on the effectiveness of the District’s internal control.
A deficiency in internal control exists when the design or operation of a control does not allow management or employees in the normal course of performing their assigned functions, to prevent, or detect and correct misstatements on a timely basis. A material weakness is a deficiency, or a combination of deficiencies, in internal control, such that there is a reasonable possibility that a material misstatement of the District’s financial statements will not be prevented, or detected and corrected on a timely basis. A significant deficiency is a deficiency, or a combination of deficiencies, in internal control that is less severe than a material weakness, yet important enough to merit attention by those charged with governance.
Our consideration of internal control over financial reporting was for the limited purpose described in the first paragraph of this section and was not designed to identify all deficiencies in internal control over financial reporting that might be material weaknesses or significant deficiencies. Given these limitations, during our audit we did not identify any deficiencies in internal control over financial reporting that we consider to be material weaknesses. However, material weaknesses may exist that have not been identified.
Page 78
INDEPENDENT AUDITORS’ REPORT ON INTERNAL CONTROL OVER FINANCIAL REPORTING AND ON COMPLIANCE AND OTHER MATTERS BASED ON AN AUDIT OF FINANCIAL STATEMENTS PERFORMED IN ACCORDANCE WITH GOVERNMENT AUDITING STANDARDS (Continued)
Compliance and Other Matters
As part of obtaining reasonable assurance about whether the District’s financial statements are free of material misstatement, we performed tests of its compliance with certain provisions of laws, regulations, contracts, and grant agreements, noncompliance with which could have a direct and material effect on the determination of financial statement amounts. However, providing an opinion on compliance with those provisions was not an objective of our audit; and, accordingly, we do not express such an opinion. The results of our tests disclosed no instances of noncompliance or other matters that are required to be reported under Government Auditing Standards.
Purpose of This Report
The purpose of this report is solely to describe the scope of our testing of internal control and compliance and the results of that testing, and not to provide an opinion on the effectiveness of the District’s internal control or on compliance. This report is an integral part of an audit performed in accordance with Government Auditing Standards in considering the District’s internal control and compliance. Accordingly, this communication is not suitable for any other purpose.
April 4, 2017 Redding, California
Page 79
INDEPENDENT AUDITORS’ REPORT ON COMPLIANCE FOR EACH MAJOR FEDERAL PROGRAM AND ON INTERNAL CONTROL OVER COMPLIANCE REQUIRED BY THE UNIFORM GUIDANCE
To the Board of Trustees Redwoods Community College District Eureka, California
Report on Compliance for Each Major Federal Program
We have audited Redwoods Community College District (the District) compliance with the types of compliance requirements described in the U.S. Office of Management and Budget (OMB) Compliance Supplement that could have a direct and material effect on each of the District’s major federal programs for the year ended June 30, 2016. The District’s major federal programs are identified in the summary of auditors’ results section of the accompanying schedule of findings and questioned costs.
Management’s Responsibility
Management is responsible for compliance with the requirements of federal statutes, regulations, and the terms and conditions of its federal awards applicable to its federal programs.
Auditors’ Responsibility
Our responsibility is to express an opinion on compliance for each of the District’s major federal programs based on our audit of the types of compliance requirements referred to above. We conducted our audit of compliance in accordance with auditing standards generally accepted in the United States of America; the standards applicable to financial audits contained in Government Auditing Standards, issued by the Comptroller General of the United States; and the audit requirements of Title 2 U.S. Code of Federal Regulations (CFR) Part 200, Uniform Administrative Requirements, Cost Principles, and Audit Requirements for Federal Awards (the Uniform Guidance). Those standards and the Uniform Guidance require that we plan and perform the audit to obtain reasonable assurance about whether noncompliance with the types of compliance requirements referred to above that could have a direct and material effect on a major federal program occurred. An audit includes examining, on a test basis, evidence about the District’s compliance with those requirements and performing such other procedures as we considered necessary in the circumstances.
We believe that our audit provides a reasonable basis for our opinion on compliance for each major federal program. However, our audit does not provide a legal determination of the District’s compliance.
Page 80
INDEPENDENT AUDITORS’ REPORT ON COMPLIANCE FOR EACH MAJOR FEDERAL PROGRAM AND ON INTERNAL CONTROL OVER COMPLIANCE REQUIRED BY THE UNIFORM GUIDANCE (Continued)
Opinion on Each Major Federal Program
In our opinion, the District complied, in all material respects, with the types of compliance requirements referred to above that could have a direct and material effect on each of its major federal programs for the year ended June 30, 2016.
Report on Internal Control Over Compliance
Management of the District is responsible for establishing and maintaining effective internal control over compliance with the types of compliance requirements referred to above. In planning and performing our audit of compliance, we considered the District’s internal control over compliance with the types of requirements that could have a direct and material effect on each major federal program as a basis for designing auditing procedures that are appropriate in the circumstances for the purpose of expressing an opinion on compliance for each major federal program and to test and report on internal control over compliance in accordance with the Uniform Guidance, but not for the purpose of expressing an opinion on the effectiveness of internal control over compliance. Accordingly, we do not express an opinion on the effectiveness of the District’s internal control over compliance.
A deficiency in internal control over compliance exists when the design or operation of a control over compliance does not allow management or employees, in the normal course of performing their assigned functions to prevent, or detect, and correct noncompliance with a type of compliance requirement of a federal program on a timely basis. A material weakness in internal control over compliance is a deficiency, or combination of deficiencies in internal control over compliance, such that there is a reasonable possibility that material noncompliance with a type of compliance requirement of a federal program will not be prevented, or detected and corrected, on a timely basis. A significant deficiency in internal control over compliance is a deficiency, or a combination of deficiencies, in internal control over compliance with a type of compliance requirement of a federal program that is less severe than a material weakness in internal control over compliance, yet important enough to merit attention by those charged with governance.
Our consideration of internal control over compliance was for the limited purpose described in the first paragraph of this section and was not designed to identify all deficiencies in internal control over compliance that might be material weaknesses or significant deficiencies. We did not identify any deficiencies in internal control over compliance that we consider to be material weaknesses. However, material weaknesses may exist that have not been identified.
Page 81
INDEPENDENT AUDITORS’ REPORT ON COMPLIANCE FOR EACH MAJOR FEDERAL PROGRAM AND ON INTERNAL CONTROL OVER COMPLIANCE REQUIRED BY THE UNIFORM GUIDANCE (Continued)
Purpose of This Report
The purpose of this report on internal control over compliance is solely to describe the scope of our testing of internal control over compliance, and the results of that testing, based on the requirements of the Uniform Guidance. Accordingly, this report is not suitable for any other purpose.
April 4, 2017 Redding, California
Page 82
INDEPENDENT AUDITORS’ REPORT ON STATE COMPLIANCE
To the Board of Trustees Redwoods Community College District Eureka, California
Compliance
We have audited the Redwoods Community College District’s (the District) compliance with the types of state compliance requirements described in the California Community Colleges Contracted District Audit Manual 2015‐16, published by the California Community Colleges Chancellor’s Office, for the year ended June 30, 2016. The applicable state compliance requirements are identified in the table below.
Management’s Responsibility
Compliance with the requirements referred to above is the responsibility of the District’s management.
Auditors’ Responsibility
Our responsibility is to express an opinion on the District’s compliance with the state laws and regulations based on our audit.
We conducted our audit in accordance with auditing standards generally accepted in the United States of America; the standards applicable to financial audits contained in Government Auditing Standards, issued by the Comptroller General of the United States; and California Community Colleges Contracted District Audit Manual 2015‐16, published by the California Community Colleges Chancellor’s Office. Those standards and the California Community Colleges Contracted District Audit Manual 2015‐16, require that we plan and perform the audit to obtain reasonable assurance about whether noncompliance with the compliance requirements referred to above that could have a material effect on compliance with the state laws and regulations described in the schedule below occurred. An audit includes examining, on a test basis, evidence supporting the District’s compliance with those requirements and performing such other procedures as we considered necessary in the circumstances. We believe our audit provides a reasonable basis for our opinion. Our audit does not provide legal determination of the District’s compliance with those requirements.
Page 83
INDEPENDENT AUDITORS’ REPORT ON STATE COMPLIANCE (Continued)
SALARIES OF CLASSROOM INSTRUCTORS: 50 PERCENT LAW
APPORTIONMENT FOR INSTRUCTIONAL SERVICE AGREEMENTS/CONTRACTS
STATE GENERAL APPORTIONMENT FUNDING SYSTEM
RESIDENCY DETERMINATION FOR CREDIT COURSES
STUDENTS ACTIVELY ENROLLED
CONCURRENT ENROLLMENT OF K‐12 STUDENTS IN COMMUNITY COLLEGE CREDIT COURSES
STUDENT SUCCESS AND SUPPORT PROGRAM (SSSP)
SCHEDULED MAINTENANCE PROGRAM
GANN LIMIT CALCULATION
OPEN ENROLLMENT
STUDENT FEES ‐ HEALTH FEES AND USE OF HEALTH FEE FUNDS
PROPOSITION 39 CLEAN ENERGY
INTERSESSION EXTENSION PROGRAM
DISABLED STUDENT PROGRAMS AND SERVICES (DSPS)
TO BE ARRANGED HOURS (TBA)
PROPOSITION 1D STATE BOND FUNDED PROJECTS
PROPOSITION 30 EDUCATION PROTECTION ACCOUNT FUNDS
Basis for Qualified Opinion on State General Apportionment Funding Systems and Dual Enrollment
As described in the accompanying schedule of findings and questioned costs, the District did not comply with the requirements for the state of general apportionment funding system and dual enrollment as described in items 2016‐001 through 2016‐003. Compliance with such requirements is necessary, in our opinion, for the District to comply with the requirements applicable to state general apportionment funding system and dual enrollment.
The District’s responses to the noncompliance findings identified in our audit are described in the schedule of findings and questioned costs. The District’s responses were not subject to the auditing procedures applied in the audit of compliance and, accordingly, we express no opinion on them.
Page 84
INDEPENDENT AUDITORS’ REPORT ON STATE COMPLIANCE (Continued)
Qualified Opinion on State General Apportionment Funding System and Dual Enrollment
In our opinion, except for the noncompliance described in the basis for qualified opinion paragraph, the District complied, in all material respects, with the state compliance requirements applicable to state general apportionment funding system and dual enrollment.
Unmodified Opinion on Each of the Other State Programs
In our opinion, the District complied, in all material respects, with the other state compliance requirements referred to above that are applicable to the District for the year ended June 30, 2016.
April 4, 2017 Redding, California

FINDINGS AND QUESTIONED COSTS SECTION
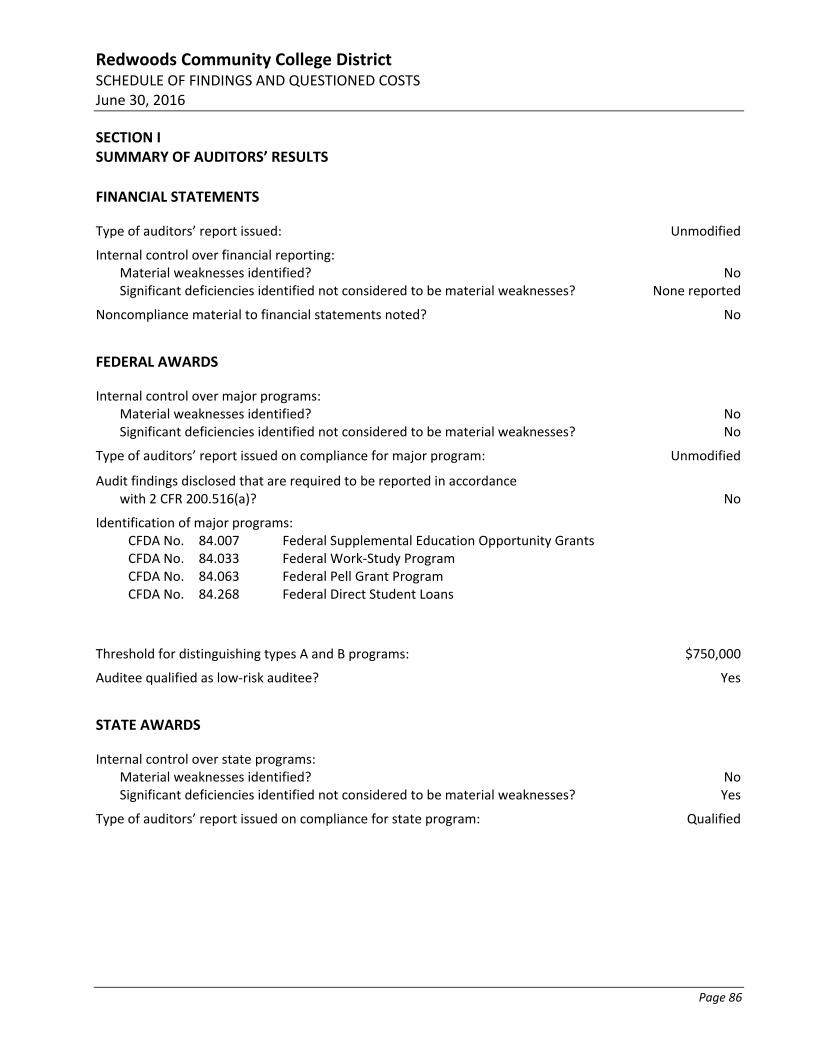
Redwoods Community College District SCHEDULE OF FINDINGS AND QUESTIONED COSTS June 30, 2016
Page 86
SECTION I SUMMARY OF AUDITORS’ RESULTS
FINANCIAL STATEMENTS
Type of auditors’ report issued: Unmodified
Internal control over financial reporting:Material weaknesses identified? NoSignificant deficiencies identified not considered to be material weaknesses? None reported
Noncompliance material to financial statements noted? No
FEDERAL AWARDS
Internal control over major programs: Material weaknesses identified? NoSignificant deficiencies identified not considered to be material weaknesses? No
Type of auditors’ report issued on compliance for major program: Unmodified
Audit findings disclosed that are required to be reported in accordance with 2 CFR 200.516(a)? No
Identification of major programs: CFDA No. 84.007 Federal Supplemental Education Opportunity Grants CFDA No. 84.033 Federal Work‐Study Program CFDA No. 84.063 Federal Pell Grant Program CFDA No. 84.268 Federal Direct Student Loans
Threshold for distinguishing types A and B programs: $750,000
Auditee qualified as low‐risk auditee? Yes
STATE AWARDS
Internal control over state programs: Material weaknesses identified? NoSignificant deficiencies identified not considered to be material weaknesses? Yes
Type of auditors’ report issued on compliance for state program: Qualified
Redwoods Community College District SCHEDULE OF FINDINGS AND QUESTIONED COSTS June 30, 2016 (Continued)
Page 87
SECTION II FINDINGS FINANCIAL STATEMENT AUDIT
None.
SECTION III FINDINGS FEDERAL AWARDS AUDIT
None.
Redwoods Community College District SCHEDULE OF FINDINGS AND QUESTIONED COSTS June 30, 2016 (Continued)
Page 88
SECTION IV FINDINGS STATE AWARDS AUDIT
STATE COMPLIANCE (State General Apportionment Funding System) 2016‐001
Significant Deficiency
Condition During our testing of state general apportionment funding system, we noted that the supporting documentation from the Annual 320 Section Summary Report does not agree to the information included in the Annual 320 that was filed. The differences for each attendance category is summarized below. The total net difference in full‐time equivalent students (FTES) is an over‐reporting in the annual 320 of 14.47.
Summer 2015 – Alternative – State Residents – Over reported by 2.73 FTES
Weekly Census – State Residents – Over reported by 6.41 FTES
Weekly Census – Nonresidents – Over reported by 4.71 FTES
Actual Hours – Noncredit – State Residents – Under reported by 3.01
Actual Hours – Noncredit – Nonresidents – Under reported by 3.48
Alternative – Daily – State Residents – Over reported by 7.11
Criteria The totals per the Annual 320 Section Summary Report should agree exactly to the amounts reported in the Annual 320.
Cause The District believes that the errors were caused by turnover in the attendance and reporting office.
Effect FTES were over reported in the Annual 320 by 14.47. No extrapolation is necessary as the differences are a result of incorrect reporting.
Recommendation We recommend that the District review its data gathering processes for the filing of the Annual 320 and ensure that the Annual 320 Section Summary report data agrees to what is filed in the Annual 320.
Response Business Office staff will provide an additional review of 320 reports prior to final submission to ensure that data is accurate and will train District staff on 320 reporting.
Redwoods Community College District SCHEDULE OF FINDINGS AND QUESTIONED COSTS June 30, 2016 (Continued)
Page 89
STATE COMPLIANCE (State General Apportionment Funding System) 2016‐002
Significant Deficiency
Condition During our testing of state general apportionment funding system, we noted that for one of our 40 course selections, the District reported three students who were not eligible to be claimed for apportionment. The students were a “No show” for the course section but were erroneously still claimed for apportionment.
Criteria Students can only be claimed in FTES that have attended the course section.
Cause The District believes that the errors were caused by the fact that the students were dropped in the system subsequent to the census date but before the census rosters were printed for the instructors to certify the attendance data. The data in the system showed the students as dropping after the census date instead of correctly dropping them prior to the census date since they were “No shows”.
Effect FTES were over reported in the Annual 320 by 0.25 for this error. We were unable to isolate this error to a specific census type so we extrapolated this error to the entire population of course sections and calculated an extrapolated error of 13.29 FTES.
Recommendation We recommend that the District review its census data gathering procedures to ensure that “No shows” are appropriately removed from the census rosters.
Response Business Office staff will work with District staff on procedures for updating enrollment records for no‐shows prior to producing enrollment reports.
Redwoods Community College District SCHEDULE OF FINDINGS AND QUESTIONED COSTS June 30, 2016 (Continued)
Page 90
STATE COMPLIANCE (Dual enrollment) 2016‐003
Significant Deficiency
Condition During our testing of concurrent enrollment, we noted that the District implemented partnership agreements with local high schools in accordance with AB 288 Dual Enrollment (AB 288). We noted that the District did meet some of the requirements in AB 288 (the District obtained instructor agreements for the high school instructors teaching the courses and the District board‐approved the agreements prior to the start of classes). However, we noted that not all of the high school boards approved the agreements prior to the commencement of classes. We also noted that the agreements did not contain all of the required language from AB 288.
Criteria The requirements of AB 288 are not yet included in the Contracted District Audit Manual, however, the requirements are included in the AB 288 summaries and in communication from the Chancellor’s office released to Districts.
Cause “At the request of the chancellor's office and before the new guidelines were published, the District quickly acted to implement the dual enrollment program. When the revised guidelines were published months after the original chancellor's office request, the dual enrollment agreements didn't meet all of the newly adopted guidelines.”
Effect The District claimed a total of 12.02 FTES for the course sections offered under the partnership agreements in accordance with AB 288.
Recommendation We recommend that the District revise the partnership agreements to be in accordance with AB 288.
Response The College will implement procedures to follow up with high school districts to ensure that MOUs are sunshined with the high school district board as an information item, then approved as an action item at a subsequent meeting. The College is also updating its procedures to ensure that future dual enrollment classes comply with the requirements of AB288.
Redwoods Community College District CORRECTIVE ACTION PLAN June 30, 2016
Page 91
Not applicable: there are no current‐year findings related to federal awards.
Redwoods Community College District SUMMARY SCHEDULE OF PRIOR AUDIT FINDINGS June 30, 2016
Page 92
None.