Embed Size (px)
Citation preview
Journal of Healthcare Engineering · Vol. 1 · No. 1 · 2010 Page 45–65 45
Reengineering the Cardiac Catheterization Lab Processes: A Lean Approach
Venkatesh A. Raghavan1, Vikram Venkatadri1, Varun Kesavakumaran1,Shengyong Wang2,*, Mohammad Khasawneh1, and Krishnaswami Srihari1
1P.O. Box 6000, Department of Systems Science and Industrial Engineering, StateUniversity of New York, Binghamton, Binghamton, New York, 13902-6000, USA
2ASEC 101, Department of Mechanical Engineering, The University of Akron, Akron, OH, 44325-3903, USA
ABSTRACTThis paper presents a cross-functional effort in a US community hospital for an overall processimprovement in its Cardiac Catheterization Lab (CCL). One of the key system performancemetrics identified was the patient turnaround time. The objective of this study was to identify thesources of delays in the system that lead to prolonged patient turnaround time using a structuredlean approach. A set of qualitative recommendations were proposed and implemented.Quantification of some of these recommendations and certain additional ‘what-if’ scenarios wereevaluated using Discrete Event Simulation (DES). The simulation results showed that significantreduction in patient turnaround time could be achieved if the proposed recommendations wereimplemented. This study demonstrated the benefits of adopting the lean philosophy in thecontinuous process improvement journey in the healthcare delivery arena.
Keywords: Reengineering, lean techniques, cardiac catheterization lab, patient turnaround time
1. INTRODUCTIONCardiac Catheterization is an important procedure involving insertion of a long, thin,flexible tube (catheter) into a blood vessel in the groin (upper thigh) or arm of thepatient. The catheter is then threaded all the way to the heart to perform diagnosis or toprovide treatment [1]. The heart and blood vessels are monitored using special dyesinjected through the catheter for X-ray imaging. Thus, narrowing or blockages of thecoronary arteries can be identified and treated [1]. Electro Physiology (EP), a slightlydifferent cardiology subspecialty, is the study of electric flow through the heart. Aproblem along this electric pathway, known as arrhythmia, needs to be treated ifserious. Certain heart tissues could result in ‘short-circuiting’ the desired electric flow,causing arrhythmia in patients [2].
Advances in the treatment of coronary artery disease have substantially increased theaverage life expectancy in developed nations over the past few decades. Percutaneouscoronary intervention provides a less invasive alternative for coronary artery bypass
*Corresponding Author: Shengyong Wang, [email protected]
grafting for the treatment of acute myocardial infarction and unstable angina. Whilesome cases in the Cardiac Catheterization Lab (CCL) are elective and thus scheduled inadvance, the flow of the day is always subject to interruption by emergencies, inparticular ST-elevation myocardial infarctions. A properly planned process is neededfor the CCL on any particular day to be capable of not only treating emergency patientsin a timely manner, but also treating all patients through a cost effective process.
In this study, a CCL in a community hospital, where two types of procedures,Cardiac Catheterization (CC) and Electro Physiology are performed, was studied forcontinuous process improvement. Both CC and EP labs interact with a 13-bed CardiacAmbulatory Care Unit (CACU) that prepares outpatients before medical procedures.For inpatients, the interaction is with the inpatient wards. Each day, a ‘Doctor of theDay’, an interventional cardiologist, takes care of the procedures for that day. Thelimited number of resources (e.g., nurses, beds) at the CACU coupled with its shareduse with the radiology department patients poses a challenge to the CCL system inturning patients around in a timely manner.
This research focuses on adopting a systematic approach of continuous processimprovement in the CCL and identifying areas which would help reduce the keyperformance measure of patient turnaround time. A lean approach was adopted toachieve this research objective. Parameters such as patient wait time at the CACU,patient transfer time and inter-procedural delays were studied. ‘Lean’ is an approachthat aims at “getting the right things to the right place at the right time in the rightquantity to achieve perfect workflow while minimizing waste and being flexible andable to change” [3]. It involves identifying and eliminating non-value added steps in aprocess for improving the efficiency of the process at decreased costs [4]. The leanapproach has been used in this work since the system under study consisted of severalprocesses where identification and elimination of non-value added activities arepossible.
The remainder of the paper is organized as follows: Section 2 reviews the relatedliterature and discusses the uniqueness of this research. Section 3 presents themethodology implemented for continuous process improvement. The system isdelineated using process mapping and the data collection process is explained. InSection 4, after analyzing the sources of delays in the system using Cause and EffectDiagram and Value Stream Maps, the findings and recommendations for reducing thedelays and decreasing the overall patient turnaround time are summarized. Finally,Section 5 discusses the limitations, future work and concludes this paper with finalremarks.
2. LITERATURE REVIEWHealthcare delivery costs continue to rise due to increased demand for patient services.Various hospital departments, such as the emergency department (ED), radiologydepartment, CCL, and pharmacy represent a small sample of such departments facinghigh patient demand. On the other hand, there exist tremendous opportunities for costreduction and quality improvement in the operation of these departments. This section
46 Reengineering the Cardiac Catheterization Lab Processes: A Lean Approach
reviews some of the lean techniques and other process improvement approaches thathave been adopted in the healthcare sector.
In practicing Business Process Reengineering (BPR), changes can be brought aboutto a system only after the existing processes are fully understood [5]. To this end, processmapping and work flow diagramming can be applied to achieve a better understandingof the work process and the entire system. To illustrate the benefits provided by some ofthese methods, process mapping in particular has been used as a tool at a medical centre,to identify value streams and differentiate those patients who were potential inpatientsfrom those who would be discharged soon after their ED visits [6]. Streaming of patientson this basis into two queues reduced patient wait times where the percentage of patientswaiting for a minimum of 8 hours prior to admission dropped from 21% to 19.6%.Flowcharts and spaghetti diagrams, representing other methods of process mappings, canalso help identify core processes based on Patient Value Add (PVA) or Business ValueAdd (BVA), and concentrate more on reducing wastes in these core processes [4].
The method of 5S is an important lean technique, which represents a very simple andeffective way of keeping organizations efficient. It involves the steps of Sort, Set inorder, Shine, Standardize, and Sustain, all achieving the goals indicated in the meaningof these words, which, for example, have afforded reduction in infections at the surgicalsite at the VA Pittsburgh Health System [4].
Operations Research (OR) techniques such as queuing theory have also been used tosolve waiting time problems [7]. Usual methods followed in considering a queueinclude First In, First Out (FIFO), Last In, First Out (LIFO), or on a priority-basis [8].Simulation is a common approach and is increasingly applied to healthcare [9]. Onestudy applied simulation to patient admission scheduling and resulted in a reduction inpatient wait time when sharing a common resource, such as X-ray room, ComputedTomography (CT) scan area and Intensive Care Unit [10].
Replacing radiology film imaging with digitized archiving system at CT scan area ofa healthcare provider, thereby requiring changes to system workflow, helped inmaximizing throughput using simulation as a tool [11], where throughput in this contextis defined as the number of patients serviced in a given period of time. A lean six-sigmaapproach was taken in a radiology department to improve the CT scan process as wellas to increase the service capacity [12]. Improving the quality of CT scan servicethrough simulation by introducing additional CT equipment was the motive behindanother study [13].
Continuous feedback can help in close monitoring and constant improvement of asystem. Monitoring a healthcare system from the perspectives of growth, business,patients, and finance are important to keep the system at its best [8]. This essentiallyforms a part of both the ‘Improve’ and ‘Control’ phases in the Define, Measure,Analyze, Improve, and Control (DMAIC) model. Lack of coordination and informationsharing can lead to extended patient wait times [14]. Data collection based on patientdemand by the hour, day and month, and meeting this demand by proper staffing canhelp in improving patient flow [15], and reducing the cost of lost opportunity bypatients walking away due to overcrowded hospital departments.
Journal of Healthcare Engineering · Vol. 1 · No. 1 · 2010 47
The CCL holds a significant position in generating revenue for a healthcare facility.An extensive review of process improvement research in CCLs is conducted to clearlydemonstrate the significance and uniqueness of the research presented in this paper. Astudy of the CCL revealed long waiting times and delayed start of the first procedurefor each day [16]. Lean flow chart methods and value stream maps were developed toidentify causes for delays and to improve the process. Frequent occurrence of overtimehours for the CCL is common in today’s hospitals, which was observed in a hospitalwhere overtime issues were attributed to the variability in the number of electivepatients (non-urgent cases) attended to each day [17]. Data analysis and queuing theorywere applied to alleviate the issue by using separate rooms for elective and non-electivecases, depending on the day of the week. A web-based cardiac catheterization qualityimprovement toolkit called ACC-CathKIT, developed by the American College ofCardiology (ACC) and the Society for Cardiovascular Angiography and Interventions(SCAI), stresses the importance of Continuous Quality Improvement (CQI) and hashelped hospitals provide increased cardiac care to patients and realize cost benefits [18].The CQI program was used to take effect in reducing the outcome variations in theperformance of Percutaneous Coronary Intervention (PCI) [19]. A study applied six-sigma method to improve the starting time of the first case every day by restricting thescope from the time a patient entered the hospital until the patient entered the CCL [20].
Despite all these attempts, healthcare issues and undesirable outcomes are stillprevalent. The current work focuses on implementing process improvementmethodologies in a CCL. The combination of lean techniques and discrete eventsimulations to improve the CCL processes makes this research unique and significant.The present research went beyond the approach of [20] to further identify and addressareas of improvement during the non-medical processes within the procedure rooms,such as table preparation for the next procedure and staffing of registered nurses insidethe CCL during the procedure. Process maps and value stream maps were developed forboth the whole system as well as isolated sub-systems. The system under study consistedof both inpatient and outpatient procedures. Different process maps were developed foreach of these procedures, in addition to a process map for the entire system.
3. METHODOLOGYThe research methodology employed in this work to identify improvement areas and tomake implementation recommendations for the overall CCL system involved twophases. Phase I included the five stages of the six-sigma approach consisting of theDMAIC methodology to identify potential areas of improvement and to suggestrecommendations aiming at an overall process improvement, shown as follows:
1. Define: Study and understand the existing CCL system (Section 3.1.1).2. Measure: Develop process maps (Section 3.1.2) and conduct time studies and
collect all relevant system related data (Section 3.1.4). 3. Analyze: Analyze the collected data by statistical tests (Section 3.1.6). 4. Improve: Use Industrial and Systems Engineering tools such as cause-effect
diagram and value stream maps to identify potential causes of delay in the existing
48 Reengineering the Cardiac Catheterization Lab Processes: A Lean Approach
system (Section 4.1) and make recommendations for continuous processimprovements (Section 4.2).
5. Control: Ensure that the recommendations are implemented and followedmethodically. This was achieved by discussing with subject matter experts afterthe recommendations had been implemented one after another.
Phase II dealt with result quantification using discrete event simulation, whichincluded the following steps: 1) Development and validation of a baseline discreteevent simulation model which reflects the existing CCL system, 2) Testing of alternatescenarios and measurement of performance outcomes, and 3) Suggesting the best andmost feasible solution.
3.1 System descriptionThe CCL system under study, which is in the Wilson Memorial Regional MedicalCenter, Johnson City, New York, operates from 6:00 AM until 3:30 PM on allweekdays, with the procedure for the first patient scheduled to start at 7:30 AM. TheCCL physicians are capable of performing procedures for three categories of patients:inpatients, outpatients, and emergency patients. The CCL functions on an on-call basisduring other times of the day and on weekends, handling only emergency cases.
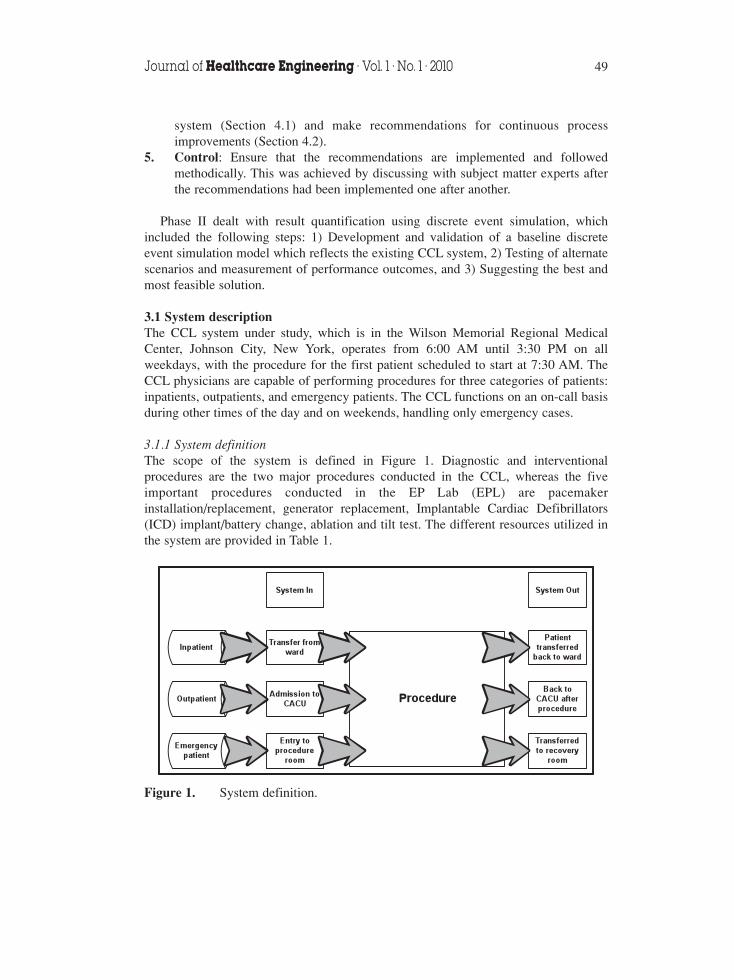
3.1.1 System definitionThe scope of the system is defined in Figure 1. Diagnostic and interventionalprocedures are the two major procedures conducted in the CCL, whereas the fiveimportant procedures conducted in the EP Lab (EPL) are pacemakerinstallation/replacement, generator replacement, Implantable Cardiac Defibrillators(ICD) implant/battery change, ablation and tilt test. The different resources utilized inthe system are provided in Table 1.
Journal of Healthcare Engineering · Vol. 1 · No. 1 · 2010 49
Figure 1. System definition.
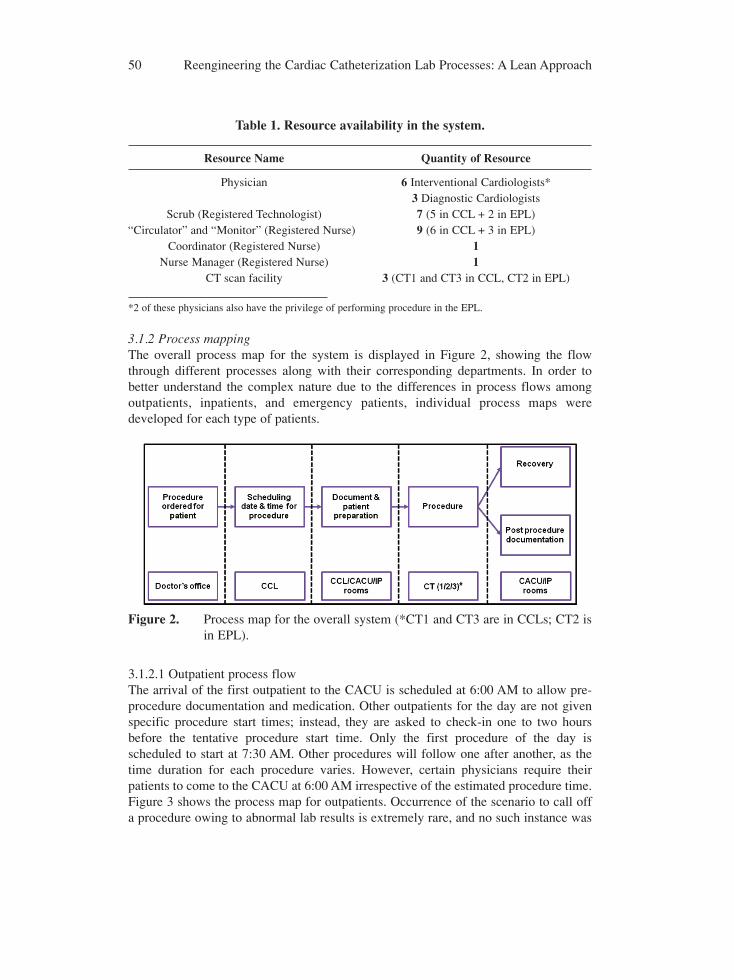
Table 1. Resource availability in the system.
Resource Name Quantity of Resource
Physician 6 Interventional Cardiologists*3 Diagnostic Cardiologists
Scrub (Registered Technologist) 7 (5 in CCL + 2 in EPL)“Circulator” and “Monitor” (Registered Nurse) 9 (6 in CCL + 3 in EPL)
Coordinator (Registered Nurse) 1Nurse Manager (Registered Nurse) 1
CT scan facility 3 (CT1 and CT3 in CCL, CT2 in EPL)
*2 of these physicians also have the privilege of performing procedure in the EPL.
3.1.2 Process mappingThe overall process map for the system is displayed in Figure 2, showing the flowthrough different processes along with their corresponding departments. In order tobetter understand the complex nature due to the differences in process flows amongoutpatients, inpatients, and emergency patients, individual process maps weredeveloped for each type of patients.
3.1.2.1 Outpatient process flowThe arrival of the first outpatient to the CACU is scheduled at 6:00 AM to allow pre-procedure documentation and medication. Other outpatients for the day are not givenspecific procedure start times; instead, they are asked to check-in one to two hoursbefore the tentative procedure start time. Only the first procedure of the day isscheduled to start at 7:30 AM. Other procedures will follow one after another, as thetime duration for each procedure varies. However, certain physicians require theirpatients to come to the CACU at 6:00 AM irrespective of the estimated procedure time.Figure 3 shows the process map for outpatients. Occurrence of the scenario to call offa procedure owing to abnormal lab results is extremely rare, and no such instance was
50 Reengineering the Cardiac Catheterization Lab Processes: A Lean Approach
Figure 2. Process map for the overall system (*CT1 and CT3 are in CCLs; CT2 isin EPL).
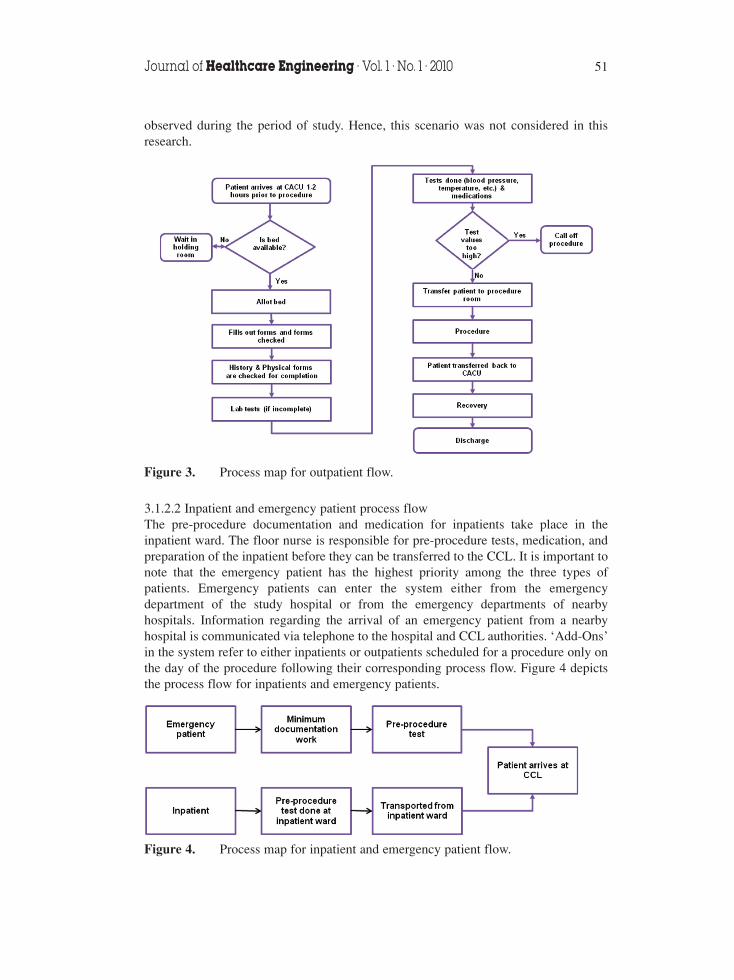
observed during the period of study. Hence, this scenario was not considered in thisresearch.
3.1.2.2 Inpatient and emergency patient process flowThe pre-procedure documentation and medication for inpatients take place in theinpatient ward. The floor nurse is responsible for pre-procedure tests, medication, andpreparation of the inpatient before they can be transferred to the CCL. It is important tonote that the emergency patient has the highest priority among the three types ofpatients. Emergency patients can enter the system either from the emergencydepartment of the study hospital or from the emergency departments of nearbyhospitals. Information regarding the arrival of an emergency patient from a nearbyhospital is communicated via telephone to the hospital and CCL authorities. ‘Add-Ons’in the system refer to either inpatients or outpatients scheduled for a procedure only onthe day of the procedure following their corresponding process flow. Figure 4 depictsthe process flow for inpatients and emergency patients.
Journal of Healthcare Engineering · Vol. 1 · No. 1 · 2010 51
Figure 3. Process map for outpatient flow.
Figure 4. Process map for inpatient and emergency patient flow.
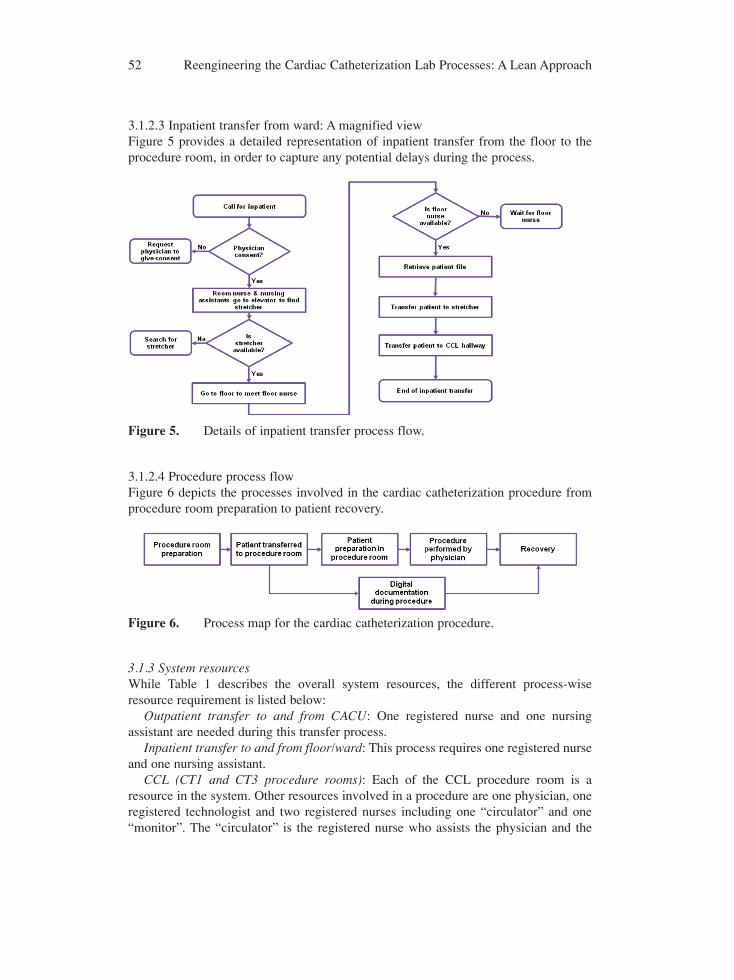
3.1.2.3 Inpatient transfer from ward: A magnified viewFigure 5 provides a detailed representation of inpatient transfer from the floor to theprocedure room, in order to capture any potential delays during the process.
3.1.2.4 Procedure process flowFigure 6 depicts the processes involved in the cardiac catheterization procedure fromprocedure room preparation to patient recovery.
3.1.3 System resourcesWhile Table 1 describes the overall system resources, the different process-wiseresource requirement is listed below:
Outpatient transfer to and from CACU: One registered nurse and one nursingassistant are needed during this transfer process.
Inpatient transfer to and from floor/ward: This process requires one registered nurseand one nursing assistant.
CCL (CT1 and CT3 procedure rooms): Each of the CCL procedure room is aresource in the system. Other resources involved in a procedure are one physician, oneregistered technologist and two registered nurses including one “circulator” and one“monitor”. The “circulator” is the registered nurse who assists the physician and the
52 Reengineering the Cardiac Catheterization Lab Processes: A Lean Approach
Figure 5. Details of inpatient transfer process flow.
Figure 6. Process map for the cardiac catheterization procedure.
registered technologists during the procedure. The “monitor” is the registered nurseresponsible for the digital documentation during the procedure.
EPL (CT2 procedure room): The EPL is also a resource of the system. Otherresources involved during a procedure include one physician, one registeredtechnologist and three registered nurses (one nurse, one “circulator”, and one“monitor”).
3.1.4 Data collectionData in six major categories were collected in the time study: patient information, staffinformation, pre-procedure time study, procedure time study, post-procedure time study,and procedure information. A data collection form was created for this purpose and datawere collected for one month. Three months of historical data from the hospital archives,along with data collected through data collection form, were then converted into anelectronic format. Archival data for a total of 403 patients over a three-month periodwere analyzed. Table 2 lists the numbers of inpatients, outpatients, and emergencypatients’ data collected from archives for three months and time-study for one month.
Table 2. Patients’ data collected from archives and time-study.
Inpatient Outpatient Emergency Total
Month 1 45 94 15 154Archives Month 2 35 59 14 108
Month 3 55 65 21 141Time Study 35 38 3 76
3.1.5 Time study versus archival data validationTo validate the data available in the department’s archives, a paired t-test was conductedto test the differences in procedure time data between time study and archives for thesame patient in the same period of time. The result showed that the difference inprocedure time was not statistically significant at a 95% confidence level with a p-valueof 0.316, therefore indicating that data obtained from archival records could be used forfurther analysis.
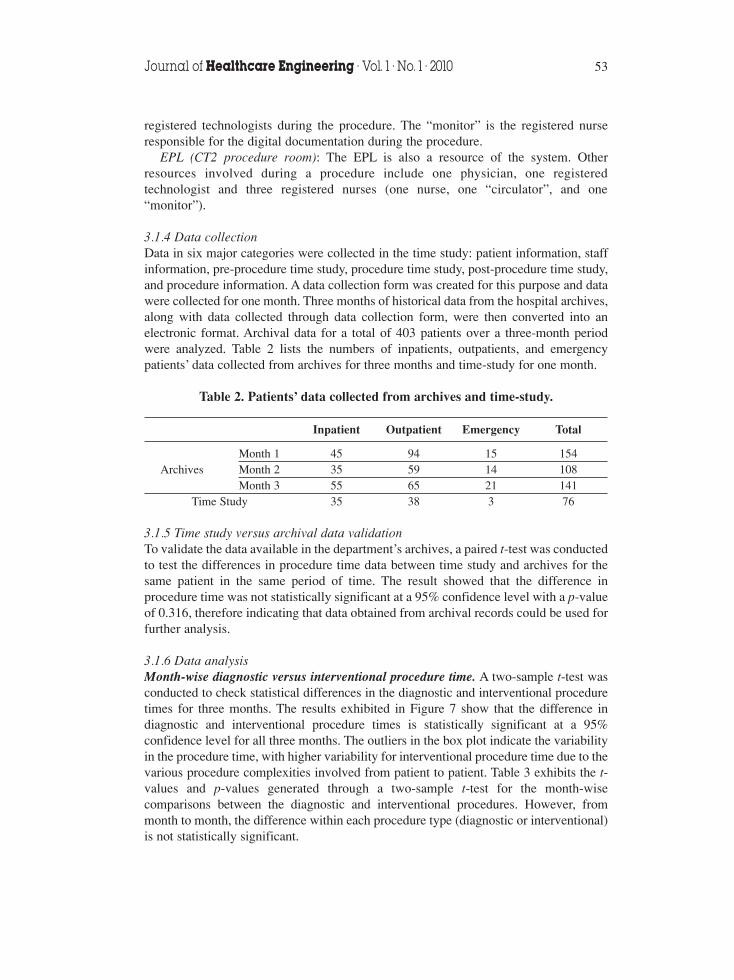
3.1.6 Data analysisMonth-wise diagnostic versus interventional procedure time. A two-sample t-test wasconducted to check statistical differences in the diagnostic and interventional proceduretimes for three months. The results exhibited in Figure 7 show that the difference indiagnostic and interventional procedure times is statistically significant at a 95%confidence level for all three months. The outliers in the box plot indicate the variabilityin the procedure time, with higher variability for interventional procedure time due to thevarious procedure complexities involved from patient to patient. Table 3 exhibits the t-values and p-values generated through a two-sample t-test for the month-wisecomparisons between the diagnostic and interventional procedures. However, frommonth to month, the difference within each procedure type (diagnostic or interventional)is not statistically significant.
Journal of Healthcare Engineering · Vol. 1 · No. 1 · 2010 53
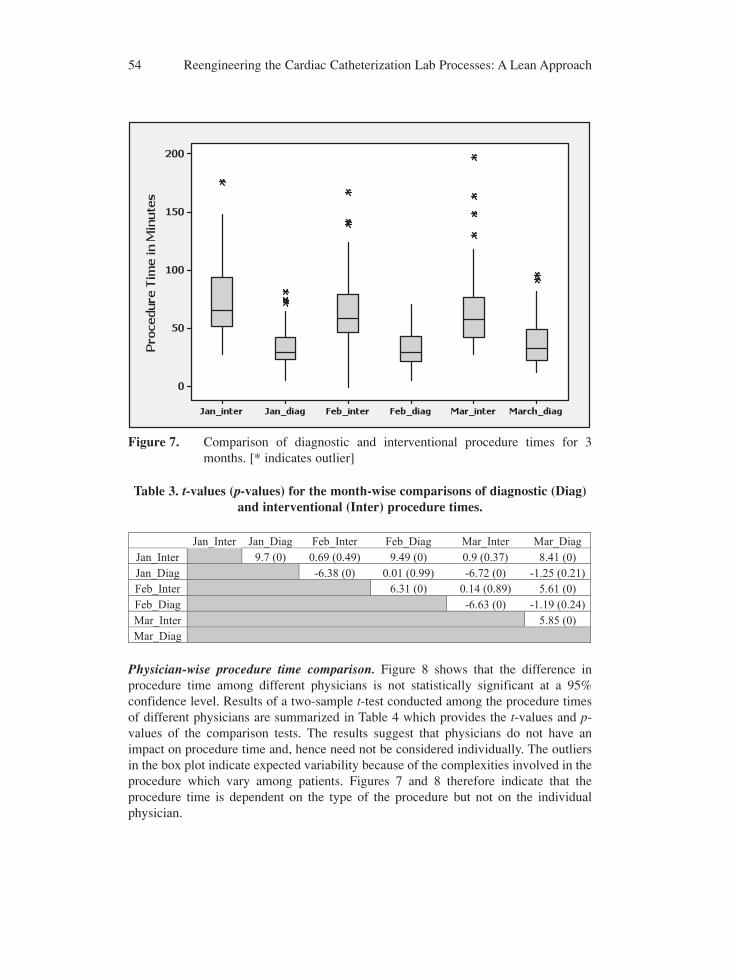
Physician-wise procedure time comparison. Figure 8 shows that the difference inprocedure time among different physicians is not statistically significant at a 95%confidence level. Results of a two-sample t-test conducted among the procedure timesof different physicians are summarized in Table 4 which provides the t-values and p-values of the comparison tests. The results suggest that physicians do not have animpact on procedure time and, hence need not be considered individually. The outliersin the box plot indicate expected variability because of the complexities involved in theprocedure which vary among patients. Figures 7 and 8 therefore indicate that theprocedure time is dependent on the type of the procedure but not on the individualphysician.
54 Reengineering the Cardiac Catheterization Lab Processes: A Lean Approach
Figure 7. Comparison of diagnostic and interventional procedure times for 3months. [* indicates outlier]
Table 3. t-values (p-values) for the month-wise comparisons of diagnostic (Diag)and interventional (Inter) procedure times.
Jan_Inter Jan_Diag Feb_Inter Feb_Diag Mar_Inter Mar_DiagJan_Inter 9.7 (0) 0.69 (0.49) 9.49 (0) 0.9 (0.37) 8.41 (0)Jan_Diag -6.38 (0) 0.01 (0.99) -6.72 (0) -1.25 (0.21)Feb_Inter 6.31 (0) 0.14 (0.89) 5.61 (0)Feb_Diag -6.63 (0) -1.19 (0.24)Mar_Inter 5.85 (0)Mar_Diag
Procedure time data analysis. The data collected show that a large percentage ofinpatients undergo interventional procedures while a large portion of outpatientsundergo diagnostic procedures. There is a significant difference in the procedure timefor emergency patients. Moreover, in the system, the type of procedure and proceduretime at the CCL is unknown until the procedure is performed. However, in the EPL, theprocedure time is related to the type of procedure rather than the patient type. Thisanalysis was useful for identifying proper statistical distributions in creating the discreteevent simulation model for exploring alternative ways to improve the systemperformance.
Journal of Healthcare Engineering · Vol. 1 · No. 1 · 2010 55
Figure 8. Comparison of physician-wise procedure time (CD1, CD2, …, CD6 arethe 6 interventional cardiologists). [* indicates outlier]
Table 4. t-values (p-values) for the physician-wise procedure time comparison.
CD1 CD2 CD3 CD4 CD5 CD6CD1 1.08 (0.283) 2.6 (0.01) 0.74 (0.46) 1.89 (0.06) 1.08 (0.28)CD2 1.32 (0.19) -0.11 (0.91) 0.91 (0.37) 0.18 (0.85)CD3 -1.11 (0.27) -0.15 (0.88) -0.86 (0.40)CD4 0.85 (0.40) 0.25 (0.80)CD5 -0.61 (0.54)CD6
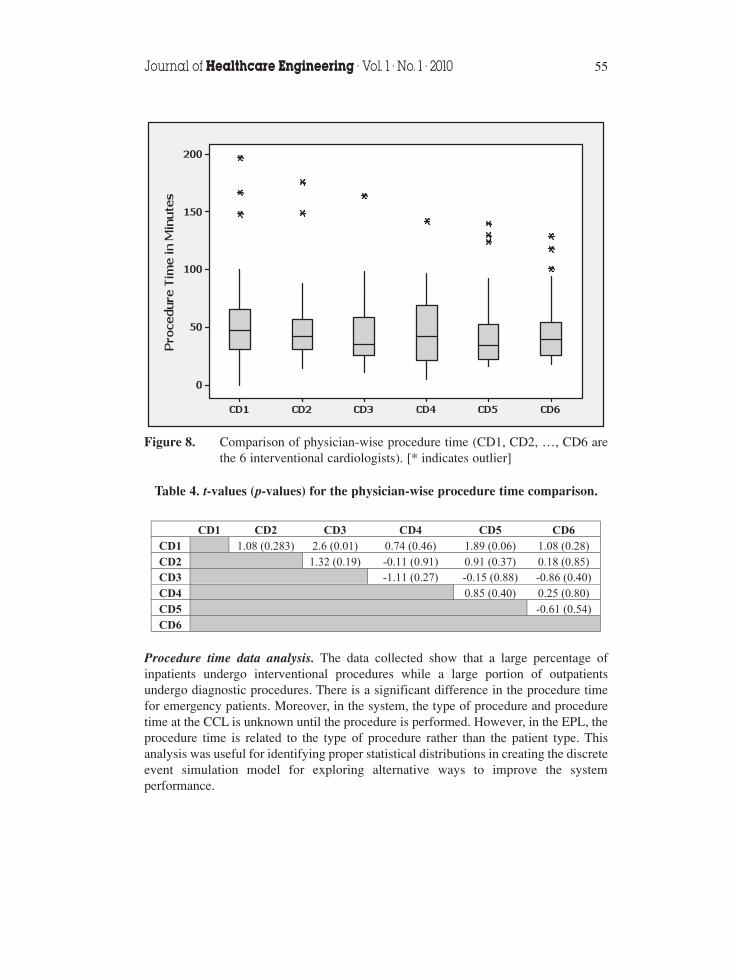
4. RESULTS AND DISCUSSIONS4.1 Identification of sources of delay in the systemCauses for delay in the system were identified using a Cause and Effect (C&E) diagramand Value Stream Maps (VSMs).
4.1.1 Cause and effect diagramFigure 9 shows the C&E diagram with the “causes” highlighted in red indicatingpotential areas for improvement in the process. This diagram was developed taking intoaccount all types of patients and including all possible causes of delays in differentprocesses in the system.
4.1.2. Value stream mapsVSMs were developed for the overall inpatient flow (Figure 10), details of the inpatienttransfer process from the inpatient ward/floor (Figure 11), and the overall outpatientflow (Figure 12). Figure 11 was developed to provide further details observed in Step1 in Figure 10, and includes activities to assist the transfer of an inpatient from the ward.Hence, the total time covered in Figure 11 would be longer than that observed in Step1 in Figure 10. VSMs were not developed for emergency patients because it wasobserved that the overall process in sending such a patient into the procedure roomoccurred in a very short period of time. This short duration from the time a patientarrives at the hospital to the time the angioplasty balloon is inflated in the blocked arteryof the patient is known as the “door-to-balloon” time and should be under 90 minutesaccording to the guidelines [21]. Observations and discussions with the subject-matterexperts indicated that the door-to-balloon time was well within the 90 minute timeframe. Moreover, there was practically no non-value added activity involved in thetreatment of emergency patients, leaving little room for improvement in this process.
56 Reengineering the Cardiac Catheterization Lab Processes: A Lean Approach
Figure 9. Cause and effect diagram for delays in the system.
Journal of Healthcare Engineering · Vol. 1 · No. 1 · 2010 57
Figure 10. Value stream map for inpatient process flow (VA: Value-added activities;NVA: Non-value-added activities; A: average; S: standard deviation; M:median. Data are in minutes).
Figure 11. Value stream map for inpatient transfer from inpatient ward. (VA: Value-added activities; NVA: Non-value-added activities; A: average; S:standard deviation; M: median. Data are in minutes).
Figure 12. Value stream map for outpatient process flow. (VA: Value-addedactivities; NVA: Non-value-added activities; A: average; S: standarddeviation; M: median. Data are in minutes).
Based on the data collected, C&E diagram, and VSMs, the following sources ofdelay in the system were identified:
1. Delayed start of procedurea. First procedure for the day starts at 8:07 AM (on average). b. Late arrival of physician to procedure room.c. Inter-procedure delays.
2. Patient waiting time delaysa. The time outpatients waiting in CACU between the pre-procedure
documentation and being sent into the procedure room averages about 116minutes with a standard deviation of 45 minutes (Figure 12).
b. Patients waiting in the inpatient ward or CACU for the physician’s consent.The consent is mandatory for a procedure to begin.
3. Delays in transferring patients to and from the procedure rooma. Unavailability of stretcher for transferring inpatients.b. Lack of proper communication between the CCL staff and the ward nurse.c. Patient waiting in the hallway in front of the CCL.
4.2 Recommendations for reducing the delaysThe recommendations towards process improvements are broadly classified asqualitative and quantitative. Techniques such as the lean 5S principle and modifiedworkflow diagram were part of the qualitative approach. Discrete event simulation wasapplied as a quantitative approach to quantify the reduction in delays throughout thesystem. The research team worked very closely with cardiologists, nurse manager,registered nurses, technologists, ward nurses, and the special projects director duringthe study. This took place in the form of interviews, discussions, brain-stormingsessions, periodic review meetings and presentations to ensure the success of the studyand the acceptance and implementation of recommendations and/or suggestions.
4.2.1 Qualitative approachOne of the major causes of delays in transferring an inpatient from the floor was theunavailability of stretchers. Dedicated stretchers were not available in the CCL sincethere was not enough parking space. In addition, some medical supplies for the cardiaccatheterization procedures were stocked in the hallway, leading to multiple congestions.The research team studied the existing layout and implemented the lean 5S principle.Figure 13 shows the existing layout of the CCL and Figure 14 shows the modifiedlayout. The following were the series of steps taken to achieve the objective.
1. Sort: As part of sorting, the existing lead apron stand, occupying one third of thehallway width, was replaced with a wall-mountable version. This reduced thecongestion in the hallway. The board displaying the patients and doctors for aparticular day was also moved to a much better position, as shown in Figure 14(modified layout).
2. Set in order: a. In addition to the lead apron stand, the hallway was further congested by the
58 Reengineering the Cardiac Catheterization Lab Processes: A Lean Approach
stocking of medical supplies (e.g., catheters). A study of the rooms thatbelonged to the CCL showed that the present nursing assistant room was notproperly utilized. Also, this room being close to the procedure room wouldbe ideal for storing the medical supplies. Therefore, it was suggested tostock the lab supplies in the present nursing assistant room instead of thehallway to solve the hallway congestion problem and to improve access tosupplies from the procedure room.
b. Re-allocation of rooms for nursing assistants and the nurse manager werealso suggested.
3. Shine: The entire area was cleaned regularly, especially the room where thesupplies were stocked. For the purpose of setting up the procedure room table forthe next procedure in an orderly manner and to further improve the process,available technologists were suggested to be responsible for arranging thesupplies on the table without affecting the hygiene.
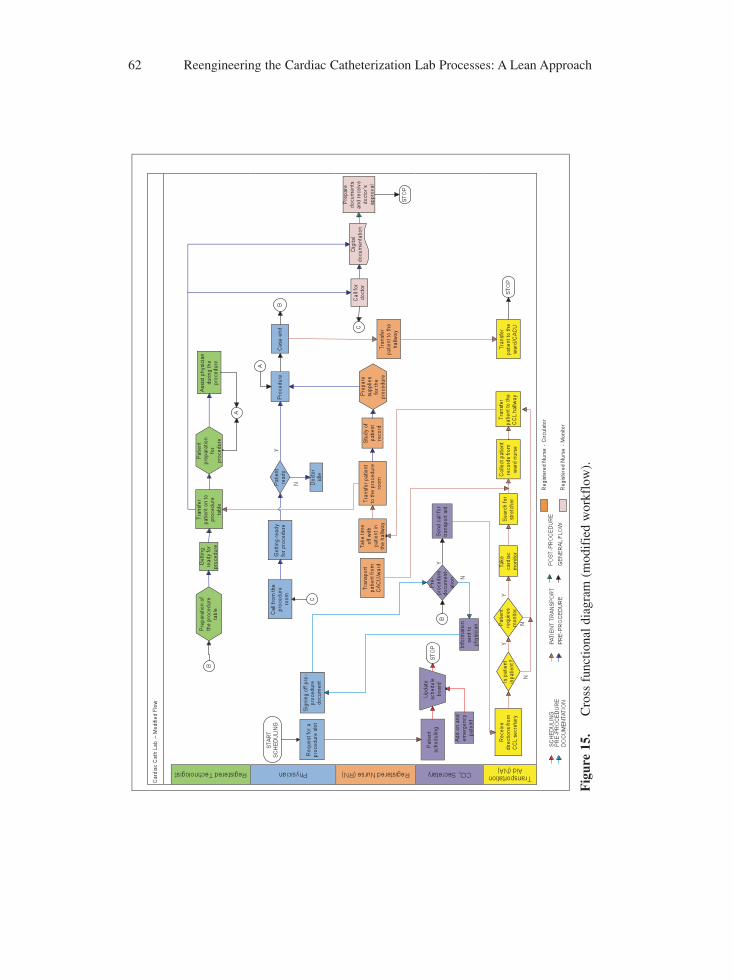
4. Standardize: As a standard process, the supplies are now moved directly into thenew room identified. A standard practice of two technologists preparing procedureroom tables has been implemented. A standard framework, in the form of a CrossFunctional Diagram, detailing the responsibilities of the staff and the flow of theoverall process was also developed and suggested, as will be discussed later inthis section.
5. Sustain: This is the most important part of the 5S principle since all efforts wouldbe in vain if the process improvement recommendations are not sustained. Atpresent, the new process is being sustained. Periodic reviews and measurementsof various parameters would help in gauging the process before and after therecommendations were in effect. For example, currently no item is stocked in thehallway, following the research team’s recommendation that has considerablyreduced the congestion.
Journal of Healthcare Engineering · Vol. 1 · No. 1 · 2010 59
Figure 13. Existing CCL layout.
Implementation of the 5S principle has helped identify a designated parking spacefor ‘permanent stretchers’ at the rear entrance of the CACU. This has also helped clearup the hallway and provide temporary parking space for the stretchers while patientswere undergoing procedure inside the procedure room.
Table 5 summarizes the qualitative recommendations that have been discussed.Other qualitative recommendations include the following:
1. Transferring inpatients back to the floor after the procedure without waiting for‘call-reports’. Call-reports are reports sent to the CCL from the inpatient wardnurse once the procedure on an inpatient is completed. Delays in inpatient transferoccurred as the CCL waited for call-reports from the floor nurse beforetransferring the inpatient back to the ward.
2. Effective and proper rotation of the three categories of registered nurses, namely“circulator”, “monitor”, and “free-nurse”. A “free-nurse” is a registered nursewho does not have any designated task to perform during a procedure. Currently,the “monitor”, the “circulator”, and the “free-nurse” of a procedure take the rolesof the “circulator”, the “free-nurse”, and the “monitor”, respectively, in the nextprocedure. However, a delay is encountered as the “monitor” of a procedure istaking time to complete the post-procedural documentation before being able toassume the role of a “circulator” for the next procedure. This delay can be reducedif the task-rotation cycle is changed so that the “free-nurse” assumes the role ofthe “circulator” in the next procedure. Without any designated task, the “freenurse” can readily begin his/her role as the “circulator” in the next procedurewithout delay. Therefore, it is recommended to change the task-rotation cycle sothat the “monitor”, the “circulator”, and the “free-nurse” of a procedure take theroles of the “free nurse”, the “monitor”, and the “circulator”, respectively, in thenext procedure. Thus, for a particular nurse, the task cycle from procedure to
60 Reengineering the Cardiac Catheterization Lab Processes: A Lean Approach
Figure 14. Modified CCL layout.
procedure is “monitor” → “free nurse” → “circulator” → “monitor”.3. Using inpatient bed instead of a stretcher to transfer patient to procedure room.
In the current system, inpatients are transferred to the procedure room usingstretchers by nursing assistants. This process involves lifting and transferring apatient from the inpatient bed onto the stretcher (in the ward), from the stretcheronto the procedure table (in the procedure room), again back onto the stretcherafter the procedure (in the procedure room), and finally onto the inpatient bed (inthe ward). The use of inpatient beds as stretchers helps reduce the transfer time,mitigate the risks of injuries to the patient as well as the healthcare personnel, andavoid the waste of time on searching for stretchers.
Table 5. Summary of qualitative recommendations.
Qualitative Recommendations
1. Replacing the existing oversize stand with a wall-mountable apron stand.2. Stocking medical supplies in nursing assistant rooms instead of hallways.3. Having additional registered technologists to be responsible for procedure room table
preparation.4. Transferring inpatients to the floor after procedure without waiting for ‘call-reports’.5. Proper rotation of the registered nurses (circulator → monitor → free-nurse).6. Use of patient beds to transfer inpatients from ward to procedure room.
Modified workflow – A Cross Functional Diagram. Based on the comprehensive studyof the system, a Cross Functional Diagram (modified workflow, shown in Figure 15)was suggested which defines and includes the duties and responsibilities of eachfunctional category, such as the Registered Technologist, Physician, Registered CCLNurse, Lab Secretary and Nursing Assistant.
4.2.2 Quantitative approachDiscrete event simulation using Arena 10.0® was adopted in the present quantitativeapproach. The existing CCL system was first carefully modeled to form the baselinesimulation model. Statistical distributions derived from the collected data were theninputted into the model. These include distributions for the inter-arrival times of thethree types of patients, procedure time, preparation time in CACU for outpatients,physician arrival time, and patient transfer time to the CCL for both inpatients andoutpatients. The model was run as a steady-state, non-terminating system for busy daysfor a total of 40 replications. According to subject matter experts, a day is considered“busy” when there are more than five patients per day. The baseline model was thenverified and validated against data collected. The simulation model and the real systemperformance (collected data) were compared in terms of the throughput (number ofpatients), a primary output parameter. The differences between the simulation modelresults and that of the real system were only 0.83% for emergency patients, 0.73% forinpatients, and 1.25% for outpatients. Other parameters, such as procedure time andpatient turnaround time, differed only from 2.04% to 7.78% between the collected data
Journal of Healthcare Engineering · Vol. 1 · No. 1 · 2010 61
62 Reengineering the Cardiac Catheterization Lab Processes: A Lean Approach
Fig
ure
15.
Cro
ss f
unct
iona
l dia
gram
(m
odif
ied
wor
kflo
w).
and the model results with the model results on the larger side, suggesting that thebaseline simulation model created was a very good representation of the real system.
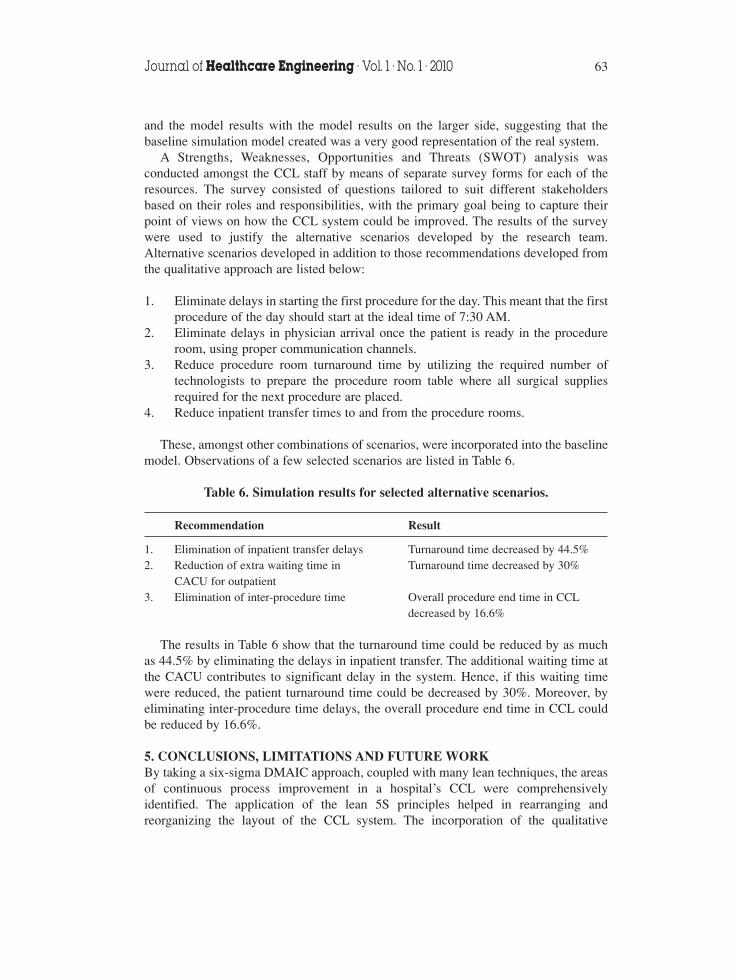
A Strengths, Weaknesses, Opportunities and Threats (SWOT) analysis wasconducted amongst the CCL staff by means of separate survey forms for each of theresources. The survey consisted of questions tailored to suit different stakeholdersbased on their roles and responsibilities, with the primary goal being to capture theirpoint of views on how the CCL system could be improved. The results of the surveywere used to justify the alternative scenarios developed by the research team.Alternative scenarios developed in addition to those recommendations developed fromthe qualitative approach are listed below:
1. Eliminate delays in starting the first procedure for the day. This meant that the firstprocedure of the day should start at the ideal time of 7:30 AM.
2. Eliminate delays in physician arrival once the patient is ready in the procedureroom, using proper communication channels.
3. Reduce procedure room turnaround time by utilizing the required number oftechnologists to prepare the procedure room table where all surgical suppliesrequired for the next procedure are placed.
4. Reduce inpatient transfer times to and from the procedure rooms.
These, amongst other combinations of scenarios, were incorporated into the baselinemodel. Observations of a few selected scenarios are listed in Table 6.
Table 6. Simulation results for selected alternative scenarios.
Recommendation Result
1. Elimination of inpatient transfer delays Turnaround time decreased by 44.5%2. Reduction of extra waiting time in Turnaround time decreased by 30%
CACU for outpatient3. Elimination of inter-procedure time Overall procedure end time in CCL
decreased by 16.6%
The results in Table 6 show that the turnaround time could be reduced by as muchas 44.5% by eliminating the delays in inpatient transfer. The additional waiting time atthe CACU contributes to significant delay in the system. Hence, if this waiting timewere reduced, the patient turnaround time could be decreased by 30%. Moreover, byeliminating inter-procedure time delays, the overall procedure end time in CCL couldbe reduced by 16.6%.
5. CONCLUSIONS, LIMITATIONS AND FUTURE WORKBy taking a six-sigma DMAIC approach, coupled with many lean techniques, the areasof continuous process improvement in a hospital’s CCL were comprehensivelyidentified. The application of the lean 5S principles helped in rearranging andreorganizing the layout of the CCL system. The incorporation of the qualitative
Journal of Healthcare Engineering · Vol. 1 · No. 1 · 2010 63
recommendations brought in a new approach to CCL function and a new dimension toCCL staff’s view of the system. The modified workflow diagram helped in setting theroles and responsibilities within the existing flexible framework. Quantifiable resultsusing modeling and simulation have helped convince the management to adopt the leanphilosophy in the journey of continuous process improvement.
A plan was proposed to the process owner of the CCL to ensure successfulimplementation of the recommendations. The plan included integration of therecommendations followed by collection of data over the subsequent quarter. All datarelated to this research would be collected during that quarter for the same set of metricsdeveloped during the study. The pre- and post-implementation metrics would becompared for statistical significance. Furthermore, the results will also be comparedwith the output from the simulation model.
This work demonstrated that systematic use of industrial and systems engineeringtechniques, such as C&E diagrams and VSMs, can help identify and eliminate non-value added activities in the system. Furthermore, a Cross Functional Diagram can helpidentify not only the flow within the system, but also the designated functions of everycategory of personnel. This can further be an effective tool helping the managementmake decision on training, retraining, and (re)allocating staff.
One of the primary limitations of this research is that the time study was onlyconducted for one month and that only three months of archival data were studied.Future research should involve long-term data to allow capture of variability in patientarrival and treatment over a longer time period. Moreover, analyzing the hospitalsystem from a System of Systems (SOS) perspective could be incorporated into thestudy. For example, the CACU prepares patients for both CCL and the radiologydepartment. Study on the way patients of either CCL or radiology department affectsthe preparation times of patients of the other departments can provide insights intowhether separate units need to be installed for patient preparation.
ACKNOWLEDGEMENTSThe authors would like to thank the CCL staff at Wilson Memorial Regional MedicalCenter, NY, for their cooperation and support in conducting this research. The authorswould also like to thank Dr. Sreekanth Ramakrishnan, Advisory Engineering at IBM,and Moh’d El-Sharo, a doctoral student at Binghamton University, NY, for theirguidance and support during the course of this research. Finally, the authors would liketo acknowledge the anonymous reviewers for their valuable comments and suggestionson the original submission of this paper.
REFERENCES1. National Heart Lung and Blood Institute, “Cardiac Catheterization”,
http://www.nhlbi.nih.gov/health/dci/Diseases/cath/cath_what.html, 2009, Accessed July 2009.
2. Heart Rhythm Society, “EP Study”, http://www.hrspatients.org/patients/heart_tests/electrophysiology_study.asp, 2009, Accessed July 2009.
3. Donald E. Lighter, Advanced Performance Improvement in Health Care: Principles and Methods,Jones & Bartlett Publishers, Massachusetts, USA, 2009.
4. Chalice, R.W., Stop Rising Healthcare Costs Using Toyota Lean Production Methods, ASQ QualityPress, Milwaukee, Wisconsin, USA, 2005.
64 Reengineering the Cardiac Catheterization Lab Processes: A Lean Approach
5. Kumar, A. and Shim, S.J., Eliminating Emergency Department Wait by BPR Implementation,Industrial Engineering and Engineering Management: IEEE International Conference, 2007, 1679 -1683.
6. King, D.L., Ben-Tovim, D.I. and Bassham, J., Redesigning emergency department patient flows:Application of Lean Thinking to health care, Emergency Medicine Australasia, 2006, 18(4), 391-397.
7. Connelly, L.G. and Bair, A.E., Discrete Event Simulation of Emergency Department Activity: APlatform for System-level Operations Research, Acad Emerg Med., 2004, 11(11), 1177-1185.
8. Eitel, D.R., Rudkin, S.E., Malvehy, M.A., Killeen J.P. and Pines, J.M., Improving Service Quality byUnderstanding Emergency Department Flow: A White Paper and Position Statement Prepared For TheAmerican Academy Of Emergency Medicine, Journal of Emergency Medicine, In Press, CorrectedProof, Available online 2 June 2008.
9. Davies, R. and H. Davies, Modeling patient flows and resource provision in health systems, Omega,1994, 22(2), 123-131.
10. Hutzschenreuteryz, A.K., Bosmanz, P.A.N. and Blonk-Altenax, I., Agent-based Patient AdmissionScheduling in Hospitals, Proceedings of the 7th international joint conference on Autonomous agentsand multiagent systems: industrial track, Estoril, Portugal, 2008, 45-52.
11. Ramakrishnan, S., Nagarkar, K., DeGennaro, M., Courtney, A.K., Emick, F. and Srihari, K., A Studyof the CT Scan Area of a Healthcare Provider, in: Ingalls, R.G., Rossetti, M.D., Smith, J.S. and Peters,B.A., eds., Proceedings of the 2004 Winter Simulation Conference, Washington DC, USA, 2004, 2025-2031.
12. Workman-Germann, J. and Woodward-Hagg, H., Implementing Lean Six Sigma Methodologies in theRadiology Department of a Hospital Healthcare System, http://docs.lib.purdue.edu/cgi/viewcontent.cgi?article=1037&context=rche_rp, RCHE Publications, 2007 (accessed 5 July 2009).
13. Bosire, J., Gandhi, T., Wang, S. and Srihari, K, Comparing Simulation Alternatives Based on QualityExpectations, in: in: Henderson, S.G., Biller, B., Hsieh, M.H., Shortle, J., Tew, J.D. and Barton, R.R.,eds., Proceedings of the 2007 Winter Simulation Conference, 2007, Washington DC, USA, 1579-1585.
14. Abraham, J. and Reddy, M.C., Moving Patients Around: A Field Study of Coordination betweenClinical and Non-Clinical Staff in Hospitals, Proceedings of the ACM 2008 conference on Computersupported cooperative work, 2008, San Diego, USA, 225-228.
15. Jensen, K. and Crane, J., Improving Patient Flow in the Emergency Department, Healthcare FinancialManagement, 2008, 62(11), 104-108.
16. Egolf, B., Nail, G., Donoghue, M., Pexton, C. and Waukesha, Working to Eliminate Bottlenecks:Florida Hospital’s Cardiac Cath Lab Achieves Greater Efficiency and Higher Satisfaction, Cath LabDigest - ISSN: 1073-2667, 15(11), November 2007, 54-56.
17. Siegrist, R., Gutkin, M., Levtzion-Korach, O. and Madden, S., Improving Patient Flow in the CathLab, Healthcare Financial Management, 2009, 63(4), 92-98.
18. Dehmer, G.J., Hirshfeld, J.W., Oetgen, W.J., Mitchell, K., Simon, A.W., Elma, M.E., Kellett, M.A. andBrindis, R.G., CathKIT: Improving Quality in the Cardiac Catheterization Laboratory, J Am CollCardiol, 2004, 43, 893–899.
19. Moscucci, M., Rogers, E.K., Montoye, C., Smith, D.E., Share, D., O’Donnell, M., Maxwell-Eward,A., Meengs, W.L., De Franco, A.C., Patel, K., McNamara, R., McGinnity, J.G., Jani, S.M., Khanal, S.and Eagle, K.A., For the Blue Cross Blue Shield of Michigan Cardiovascular Consortium (BMC2),Association of a Continuous Quality Improvement Initiative with Practice and Outcomes Variations ofContemporary Percutaneous Coronary Interventions, Circulation, 2006, 113, 814–822.
20. Konopka, S., Millar, M., O’Brien, B. and Weissman, M., Reducing Delays in the Cardiac Cath Labwith Six Sigma, Isixsigma Healthcare online, 2006, available at http://healthcare.isixsigma.com,(accessed 3 May 2009).
21. Moscucci, M and Eagle, K.A., Door-to-Balloon Time in Primary Percutaneous Coronary Intervention:Is the 90-Minute Gold Standard an Unreachable Chimera?, Circulation 2006, 113, 1048-1050.
Journal of Healthcare Engineering · Vol. 1 · No. 1 · 2010 65


International Journal of
AerospaceEngineeringHindawi Publishing Corporationhttp://www.hindawi.com Volume 2014
RoboticsJournal of
Hindawi Publishing Corporationhttp://www.hindawi.com Volume 2014
Hindawi Publishing Corporationhttp://www.hindawi.com Volume 2014
Active and Passive Electronic Components
Control Scienceand Engineering
Journal of
Hindawi Publishing Corporationhttp://www.hindawi.com Volume 2014
International Journal of
RotatingMachinery
Hindawi Publishing Corporationhttp://www.hindawi.com Volume 2014
Hindawi Publishing Corporation http://www.hindawi.com
Journal ofEngineeringVolume 2014
Submit your manuscripts athttp://www.hindawi.com
VLSI Design
Hindawi Publishing Corporationhttp://www.hindawi.com Volume 2014
Hindawi Publishing Corporationhttp://www.hindawi.com Volume 2014
Shock and Vibration
Hindawi Publishing Corporationhttp://www.hindawi.com Volume 2014
Civil EngineeringAdvances in
Acoustics and VibrationAdvances in
Hindawi Publishing Corporationhttp://www.hindawi.com Volume 2014
Hindawi Publishing Corporationhttp://www.hindawi.com Volume 2014
Electrical and Computer Engineering
Journal of
Advances inOptoElectronics
Hindawi Publishing Corporation http://www.hindawi.com
Volume 2014
The Scientific World JournalHindawi Publishing Corporation http://www.hindawi.com Volume 2014
SensorsJournal of
Hindawi Publishing Corporationhttp://www.hindawi.com Volume 2014
Modelling & Simulation in EngineeringHindawi Publishing Corporation http://www.hindawi.com Volume 2014
Hindawi Publishing Corporationhttp://www.hindawi.com Volume 2014
Chemical EngineeringInternational Journal of Antennas and
Propagation
International Journal of
Hindawi Publishing Corporationhttp://www.hindawi.com Volume 2014
Hindawi Publishing Corporationhttp://www.hindawi.com Volume 2014
Navigation and Observation
International Journal of
Hindawi Publishing Corporationhttp://www.hindawi.com Volume 2014
DistributedSensor Networks
International Journal of