Embed Size (px)
Citation preview

February 28, 2014
Stantec File: 111440070
Conservation File: 5577.00
Attention: Peter Crocker, District Supervisor
Manitoba Conservation and Water Stewardship
Environmental Compliance and Enforcement Branch
Box 13, 1129 Queens Avenue
Brandon, MB R7A 1L9
Dear Mr. Crocker,
Reference: Daly Irrigation Project – 2013 Final Monitoring Report – Licence No. 3010
Stantec Consulting Ltd. (Stantec) submits the following 2013 Final Monitoring Report for the Daly
Irrigation Project, on behalf of the Daly Irrigation Development Group (DIDG; the Licencee). This
letter provides a summary and status of monitoring data collected in 2013, as required by
Environment Act Licence No. 3010 (the Licence), issued on July 5, 2012.
The following information is presented:
Upstream and downstream flows, volumes and rates of water pumped, and durations of
pumping as prescribed by Clause 21 of the Licence.
Findings of the Dissolved Oxygen Monitoring Plan as prescribed by Clause 22 of the
Licence.
Photographs of the Little Saskatchewan River riffle bed exposure immediately downstream
of the diversion point of the Development as prescribed by Clause 23 of the Licence.
MEASUREMENT OF UPSTREAM AND DOWNSTREAM FLOW RATES
In accordance with Clause 21 of the Licence flow rates were recorded daily on a continual basis.
For purposes of this report, daily flow rates were recorded at two monitoring sites, upstream and
downstream from the Development diversion point, as described below:
The upstream flow gauging station (ID: 05F018), operated by Water Survey of Canada, is in
operation close to the crossing of Highway 25 over the Little Saskatchewan River, just
downstream of the reservoir outlet.
A stream flow monitoring station was installed downstream of the pump intake on July 20,
2012. This monitoring station consists of two data loggers: one (ID: DIVER M4391) was
installed at the bottom of the river to measure total water pressure and water temperature,

February 28, 2014
Peter Crocker, District Supervisor
Page 2 of 7
Reference: Daly Irrigation Project – 2013 Final Monitoring Report – Licence No. 3010
and the other (ID: DIVER L6518) was installed at the surface, adjacent to the pumping
station to measure atmospheric pressure and air temperature.
Two manual stream flow measurements were collected downstream of the diversion point in 2013,
on May 9 and September 19 in order to calibrate the installed downstream monitoring station. An
additional two measurements were attempted during the year however these were unsuccessful
due to unsafe conditions. The flow rates measured for the two calibration dates are as follows:
May 9 – 25.1 m3/sec
September 19 – 1.62 m3/sec
For purposes of this report, flow rates upstream and downstream of the diversion point were
compared during the irrigation season from July 3 to September 19, 2013. The Water Survey of
Canada website was used to retrieve measured flows at the upstream gauging station (05F018).
Figure 1 shows estimated flow rates (m3/sec) recorded daily at the upstream (black) and
downstream (red) monitoring stations in 2013.
February 28, 2014
Peter Crocker, District Supervisor
Page 3 of 7
Reference: Daly Irrigation Project – 2013 Final Monitoring Report – Licence No. 3010
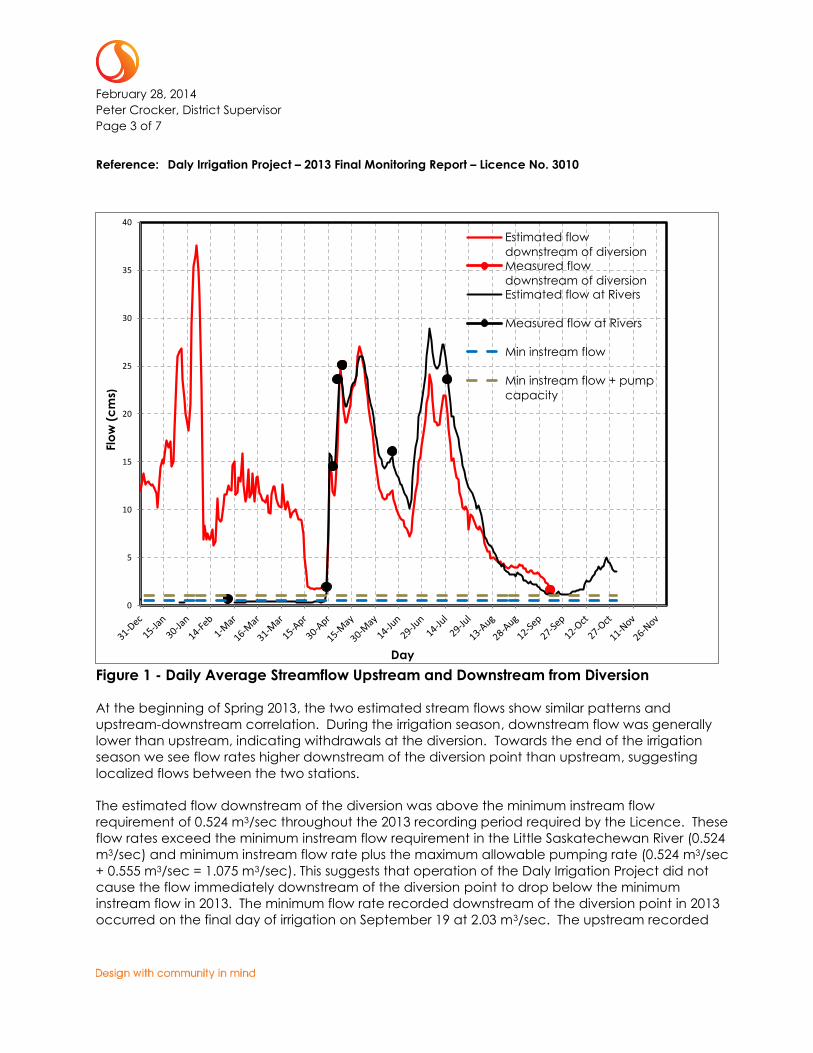
Figure 1 - Daily Average Streamflow Upstream and Downstream from Diversion
At the beginning of Spring 2013, the two estimated stream flows show similar patterns and
upstream-downstream correlation. During the irrigation season, downstream flow was generally
lower than upstream, indicating withdrawals at the diversion. Towards the end of the irrigation
season we see flow rates higher downstream of the diversion point than upstream, suggesting
localized flows between the two stations.
The estimated flow downstream of the diversion was above the minimum instream flow
requirement of 0.524 m3/sec throughout the 2013 recording period required by the Licence. These
flow rates exceed the minimum instream flow requirement in the Little Saskatechewan River (0.524
m3/sec) and minimum instream flow rate plus the maximum allowable pumping rate (0.524 m3/sec
+ 0.555 m3/sec = 1.075 m3/sec). This suggests that operation of the Daly Irrigation Project did not
cause the flow immediately downstream of the diversion point to drop below the minimum
instream flow in 2013. The minimum flow rate recorded downstream of the diversion point in 2013
occurred on the final day of irrigation on September 19 at 2.03 m3/sec. The upstream recorded
0
5
10
15
20
25
30
35
40
Flo
w (
cm
s)
Day
Estimated flow
downstream of diversionMeasured flow
downstream of diversionEstimated flow at Rivers
Measured flow at Rivers
Min instream flow
Min instream flow + pump
capacity
February 28, 2014
Peter Crocker, District Supervisor
Page 4 of 7
Reference: Daly Irrigation Project – 2013 Final Monitoring Report – Licence No. 3010
flow rate shows a similar drop in flow rate near the end of the irrigation season, suggesting that
seasonal conditions contributed to the reduction of these flow rates.
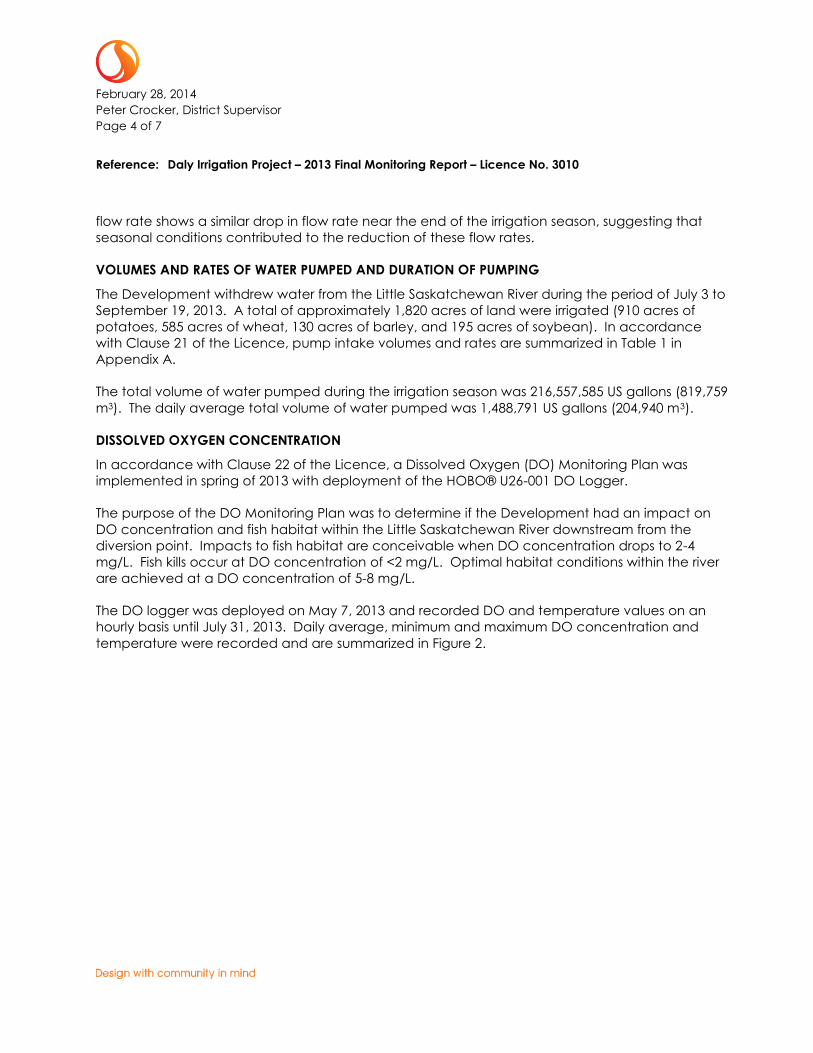
VOLUMES AND RATES OF WATER PUMPED AND DURATION OF PUMPING
The Development withdrew water from the Little Saskatchewan River during the period of July 3 to
September 19, 2013. A total of approximately 1,820 acres of land were irrigated (910 acres of
potatoes, 585 acres of wheat, 130 acres of barley, and 195 acres of soybean). In accordance
with Clause 21 of the Licence, pump intake volumes and rates are summarized in Table 1 in
Appendix A.
The total volume of water pumped during the irrigation season was 216,557,585 US gallons (819,759
m3). The daily average total volume of water pumped was 1,488,791 US gallons (204,940 m3).
DISSOLVED OXYGEN CONCENTRATION
In accordance with Clause 22 of the Licence, a Dissolved Oxygen (DO) Monitoring Plan was
implemented in spring of 2013 with deployment of the HOBO® U26-001 DO Logger.
The purpose of the DO Monitoring Plan was to determine if the Development had an impact on
DO concentration and fish habitat within the Little Saskatchewan River downstream from the
diversion point. Impacts to fish habitat are conceivable when DO concentration drops to 2-4
mg/L. Fish kills occur at DO concentration of <2 mg/L. Optimal habitat conditions within the river
are achieved at a DO concentration of 5-8 mg/L.
The DO logger was deployed on May 7, 2013 and recorded DO and temperature values on an
hourly basis until July 31, 2013. Daily average, minimum and maximum DO concentration and
temperature were recorded and are summarized in Figure 2.

February 28, 2014
Peter Crocker, District Supervisor
Page 5 of 7
Reference: Daly Irrigation Project – 2013 Final Monitoring Report – Licence No. 3010
Figure 2: Dissolved Oxygen Concentration, June 1 – July 30, 2013
Following the beginning of the 2013 irrigation season on July 3, average daily DO concentration
has been between approximately 5-10 mg/L. Daily minimum values fall slightly below 5 during the
latter part of July. Levels have not dropped below the 2 mg/L required for fish survival during
recording dates. The lowest DO concentration reported in Figure 2 was 2.1 mg/L on June 8, prior
to commencement of the irrigation season. The overall daily average DO concentration during
the recording period was 7.9 mg/L.
DO concentration data for the period of July 31, 2013 to September 19, 2013 was not recorded
due to equipment malfunction. Methods to prevent future equipment malfunction are discussed
under Monitoring Activities Planned for 2014.
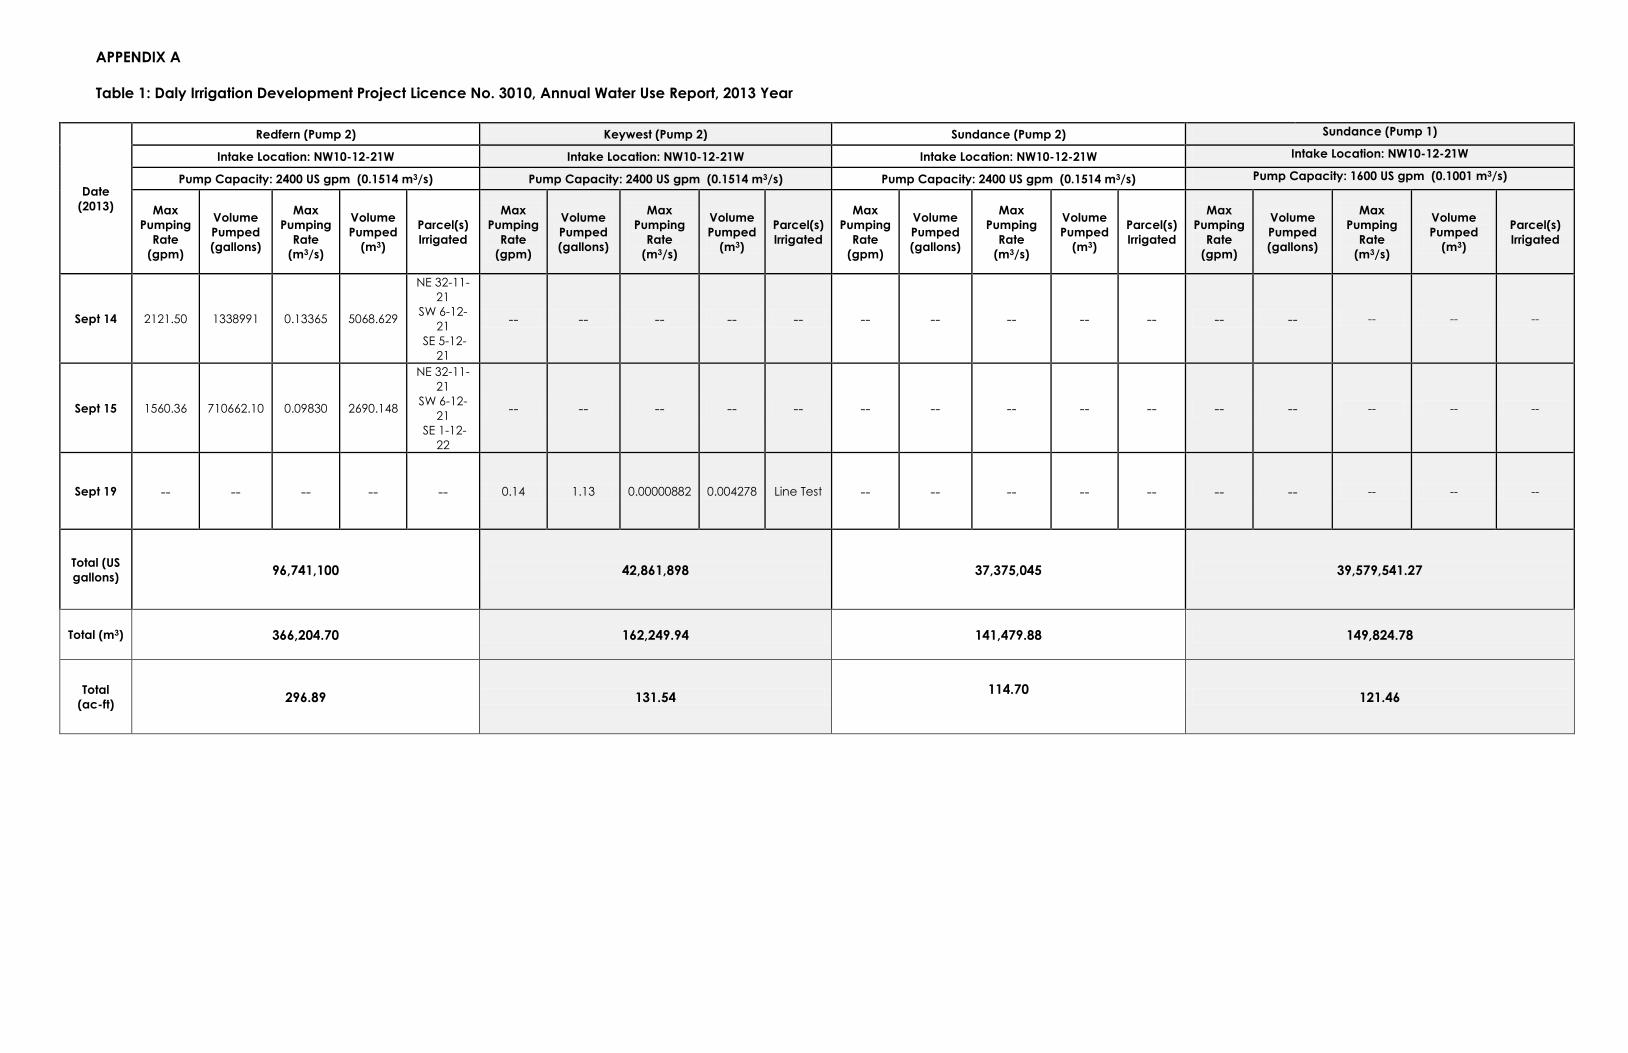
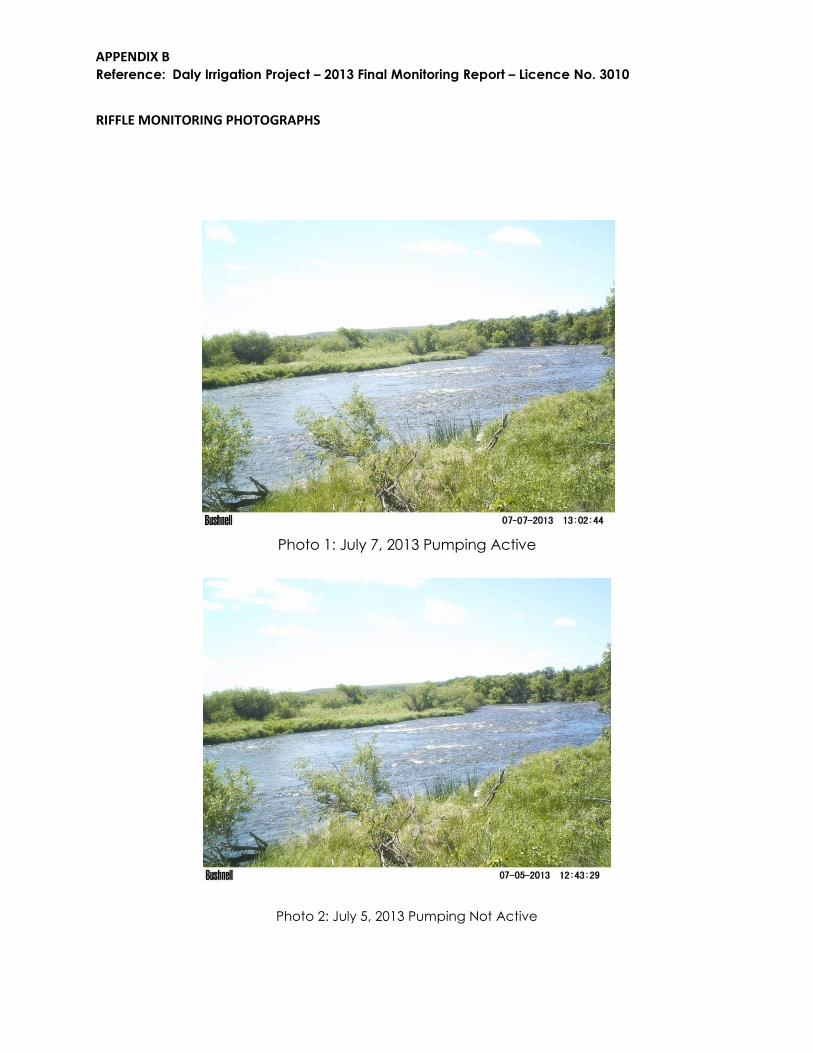
RIFFLE MONITORING
Under Clause 23 of the Licence, the Licencee is required to capture photographs of the riffle bed
exposure in the Little Saskatchewan River downstream from the Development’s diversion point
0.0
5.0
10.0
15.0
20.0
25.0
30.0
0.0
2.0
4.0
6.0
8.0
10.0
12.0
14.0
16.0
18.0
20.0
Tem
pe
ratu
re (°C
)
Dis
solv
ed
Ox
yg
en
Co
nc
en
tra
ion
(m
g/L
)
Recording Period June 1 - July 30, 2013
DO - Average DO - Minimum DO - Maximum
Temp - Average Temp - Minimum Temp - Maximum

February 28, 2014
Peter Crocker, District Supervisor
Page 6 of 7
Reference: Daly Irrigation Project – 2013 Final Monitoring Report – Licence No. 3010
during the irrigation season. A trail camera was used to record daily photographs of the riffle from
May 22, 2013 to October 20, 2013.
Photographs were not recorded between August 13, 2013 and September 19, 2013 due to
equipment malfunction. Methods to prevent future equipment malfunction are discussed under
Monitoring Activities Planned for 2014.
Appendix B includes photographs which show the riffle during active irrigation dates on July 7, July
29, and August 13, 2013. Photographs in Appendix B which show the riffle on non-active irrigation
dates include July 5, July 30, and August 30, 2013. A complete set of photographs taken by the
trail camera are included on CD-ROM (enclosed).
MONITORING ACTIVITIES PLANNED FOR 2014
During the 2013 irrigation season, equipment malfunctions occurred which resulted in incomplete
data sets available for the annual report. To provide complete information in future annual
reports, below are suggested methods to improve data collection from equipment.
Additional equipment checks along with re-calibration should be made to retrieve DO
concentration data consistently and avoid possible malfunctions.
The trail camera which is positioned to record photographs of the riffle during active and non-
active irrigation dates should be inspected periodically. Electronic files should be downloaded
from the camera on a frequent basis to avoid data loss.
STATUS OF DALY IRRIGATION PROJECT CONSTRUCTION
Several irrigation components, including pivots and irrigation lines, which were proposed in the
DIDG Environmental Impact Assessment (Stantec, 2012) were constructed in 2013. Figure 3 in
Appendix C shows an updated Project Footprint of these components. Future construction of
proposed pivots and irrigation lines are being considered for construction by DIDG in 2014 to
provide additional irrigation service to more fields.
Regards,
STANTEC CONSULTING LTD.
Terry Duddridge, B.Env.St. Carmen Anseeuw, M.Env.
Environmental Planner Environmental Planner Phone: 204-944-3790 Phone: 204-942-2505

February 28, 2014
Peter Crocker, District Supervisor
Page 7 of 7
Reference: Daly Irrigation Project – 2013 Final Monitoring Report – Licence No. 3010
Attachment: Appendix A (Water Use)
Appendix B (Riffle Monitoring Photographs)
Appendix C (Updated Project Footprint)
CD ROM Riffle Monitoring Photographs 2013
c. Whetter, David (Stantec); Webb, Bruce (MCWS); Waldner, Ed (DIDG)
dt v:\1114\active\111440070_little_sask_ea\report\1102_final\monitoring_2013\let_didg_monitoring_20130228.docx

APPENDIX A
Table 1: Daly Irrigation Development Project Licence No. 3010, Annual Water Use Report, 2013 Year
Date
(2013)
Redfern (Pump 2) Keywest (Pump 2) Sundance (Pump 2) Sundance (Pump 1)
Intake Location: NW10-12-21W Intake Location: NW10-12-21W Intake Location: NW10-12-21W Intake Location: NW10-12-21W
Pump Capacity: 2400 US gpm (0.1514 m3/s) Pump Capacity: 2400 US gpm (0.1514 m3/s) Pump Capacity: 2400 US gpm (0.1514 m3/s) Pump Capacity: 1600 US gpm (0.1001 m3/s)
Max
Pumping
Rate
(gpm)
Volume
Pumped
(gallons)
Max
Pumping
Rate
(m3/s)
Volume
Pumped
(m3)
Parcel(s)
Irrigated
Max
Pumping
Rate
(gpm)
Volume
Pumped
(gallons)
Max
Pumping
Rate
(m3/s)
Volume
Pumped
(m3)
Parcel(s)
Irrigated
Max
Pumping
Rate
(gpm)
Volume
Pumped
(gallons)
Max
Pumping
Rate
(m3/s)
Volume
Pumped
(m3)
Parcel(s)
Irrigated
Max
Pumping
Rate
(gpm)
Volume
Pumped
(gallons)
Max
Pumping
Rate
(m3/s)
Volume
Pumped
(m3)
Parcel(s)
Irrigated
July 3 -- -- -- -- -- -- -- -- -- -- -- -- -- -- -- 1339.12 749770.75 0.08436456 2838.19
NW 8-12-
21
SW 8-12-21
July 4 0.14 1.13 0.00001 0.004278 Line Test 0.14 1.13 0.00000882 0.004278 Line Test 0.14 1.13 0.00000882 0.004278 Line Test 1335.31 550408.25 0.08412453 2083.52
NW 8-12-
21
SW 8-12-21
July 7 2414.17 1903797 0.15209 7206.65
NE 32-11-
21
SW 6-12-
21
SE 6-12-21
1311.30 1108412 0.0826119 4195.79
NW 22-
12-21
SE 21-12-
21
2498.77 2075284 0.15742251 7855.80
SE 36-11-
22
NW 5-12-
21
NE 5-12-
21
1624.76 1141181 0.10235988 4319.84
NW 8-12-
21
SW 8-12-21
July 8 2249.34 3159910 0.14171 11961.55
NE 32-11-
21
SW 6-12-
21
SE 6-12-21
1350.82 1880871 0.08510166 7119.87
NW 22-
12-21
SE 21-12-
21
2499.75 3503457 0.15748425 13262.02
SE 36-11-
22
NW 5-12-
21
E 1/2 8-
12 21
1445.19 1868723.38 0.09104697 7073.88
NW 8-12-
21
SW 8-12-21
July 9 2394.90 3190299 0.15088 12076.59
NE 32-11-
21
SW 6-12-
21
SE 6-12-21
1394.98 1735539 0.08788374 6569.73
NW 22-
12-21
SE 21-12-
21
2561.77 3500071 0.16139151 13249.20
SE 36-11-
22
NE 5-12-
21
1478.59 1900416.50 0.09315117 7193.86
NW 8-12-
21
SW 8-12-21
July 10 2294.77 3099152 0.14457 11731.56
NE 32-11-
21
SW 6-12-
21
SW 5-12-
21
1388.23 1940667 0.08745849 7346.22
NW 22-
12-21
SE 21-12-
21
2478.09 3128457 0.15611967 11842.49
SE 36-11-
22
NE 5-12-
21
1406.02 1953001.25 0.08857926 7392.91
NW 8-12-
21
SW 8-12-21
July 11 2448.20 3159281 0.15424 11959.17
NE 32-11-
21
SW 6-12-
21
SW 5-12-
21
1362.91 1920506 0.08586333 7269.90
NW 22-
12-21
SE 21-12-
21
2655.01 2245528 0.16726563 8500.24
SE 36-11-
22
NW 5-12-
21
E 1/2 8-
12 21
1359.43 1918753.88 0.08564409 7263.27
NW 8-12-
21
SW 8-12-21

APPENDIX A
Table 1: Daly Irrigation Development Project Licence No. 3010, Annual Water Use Report, 2013 Year
Date
(2013)
Redfern (Pump 2) Keywest (Pump 2) Sundance (Pump 2) Sundance (Pump 1)
Intake Location: NW10-12-21W Intake Location: NW10-12-21W Intake Location: NW10-12-21W Intake Location: NW10-12-21W
Pump Capacity: 2400 US gpm (0.1514 m3/s) Pump Capacity: 2400 US gpm (0.1514 m3/s) Pump Capacity: 2400 US gpm (0.1514 m3/s) Pump Capacity: 1600 US gpm (0.1001 m3/s)
Max
Pumping
Rate
(gpm)
Volume
Pumped
(gallons)
Max
Pumping
Rate
(m3/s)
Volume
Pumped
(m3)
Parcel(s)
Irrigated
Max
Pumping
Rate
(gpm)
Volume
Pumped
(gallons)
Max
Pumping
Rate
(m3/s)
Volume
Pumped
(m3)
Parcel(s)
Irrigated
Max
Pumping
Rate
(gpm)
Volume
Pumped
(gallons)
Max
Pumping
Rate
(m3/s)
Volume
Pumped
(m3)
Parcel(s)
Irrigated
Max
Pumping
Rate
(gpm)
Volume
Pumped
(gallons)
Max
Pumping
Rate
(m3/s)
Volume
Pumped
(m3)
Parcel(s)
Irrigated
July 12 2358.62 3112440 0.14859 11781.86
SE 5-12-21
SE 6-12-21
SW 5-12-
21
1384.57 1745995 0.08722791 6609.31
NW 22-
12-21
SE 21-
12-21
-- -- -- -- -- 1339.54 1898927 0.08439102 7188.22
NW 8-12-
21
SW 8-12-21
July 13 2478.16 2431173 0.15612 9202.99
SE 5-12-21
SE 6-12-21
SW 5-12-
21
1358.27 607314.80 0.08557101 2298.94
NW 22-
12-21
SE 21-12-
21
-- -- -- -- -- 1317.79 1022350.56 0.08302077 3870.02
NW 8-12-
21
SW 8-12-21
July 17 2445.39 1902178 0.15406 7200.53
NE 32-11-
21
SW 6-12-
21
NW 6-12-
21
1343.79 899152.80 0.08465877 3403.66
NW 22-
12-21
SE 21-12-
21
2289.08 657227.60 0.14421204 2487.88
SE 36-11-
22
NW 5-12-
21
NE 5-12-
21
1554.97 1102814.88 0.09796311 4174.61
NW 8-12-
21
SW 8-12-21
July 18 2260.17 2384691 0.14239 9027.03
NE 32-11-
21
SW 6-12-
21
NW 6-12-
21
1358.27 1452384 0.08557101 5497.87
NW 22-
12-21
SE 21-12-
21
-- -- -- -- -- 1447.05 1548306 0.09116415 5860.97
NW 8-12-
21
SW 8-12-21
July 21 0.14 1.13 0.00001 0.004278 Line Test 0.28 3.38 0.00001764 0.012795 Line Test 0.14 1.13 0.00000882 0.004278 Line Test 0.10 0.82 0.0000063 0.0000063 Line Test
July 23 1907.74 692899 0.12019 2622.91
NE 32-11-
21
SW 6-12-
21
SE 1-12-22
-- -- -- -- -- 1913.31 913444.70 0.12053853 3457.76
SE 36-11-
22
E 1/2 8-
12 21
-- -- -- -- --
July 24 2344.83 2737093 0.14772 10361.02
NE 32-11-
21
SW 6-12-
21
SE 1-12-22
1402.57 1263207 0.08836191 4781.76
NW 22-
12-21
SE 21-
12-21
997.23 1398805 0.06282549 5295.05
SE 36-11-
22
E 1/2 8-
12 21
1422.72 1186749.75 0.08963136 4492.33
NW 8-12-
21
SW 8-12-21
July 25 2273.39 3087142 0.14322 11686.10
NE 32-11-
21
SW 6-12-
21
SE 1-12-22
1380.91 1937177 0.08699733 7333.01
NW 22-
12-21
SE 21-
12-21
1578.89 1803410 0.09947007 6826.65
SE 36-11-
22
NW 5-12-
21
1384.99 1947132.38 0.08725437 7370.69
NW 8-12-
21
SW 8-12-21

APPENDIX A
Table 1: Daly Irrigation Development Project Licence No. 3010, Annual Water Use Report, 2013 Year
Date
(2013)
Redfern (Pump 2) Keywest (Pump 2) Sundance (Pump 2) Sundance (Pump 1)
Intake Location: NW10-12-21W Intake Location: NW10-12-21W Intake Location: NW10-12-21W Intake Location: NW10-12-21W
Pump Capacity: 2400 US gpm (0.1514 m3/s) Pump Capacity: 2400 US gpm (0.1514 m3/s) Pump Capacity: 2400 US gpm (0.1514 m3/s) Pump Capacity: 1600 US gpm (0.1001 m3/s)
Max
Pumping
Rate
(gpm)
Volume
Pumped
(gallons)
Max
Pumping
Rate
(m3/s)
Volume
Pumped
(m3)
Parcel(s)
Irrigated
Max
Pumping
Rate
(gpm)
Volume
Pumped
(gallons)
Max
Pumping
Rate
(m3/s)
Volume
Pumped
(m3)
Parcel(s)
Irrigated
Max
Pumping
Rate
(gpm)
Volume
Pumped
(gallons)
Max
Pumping
Rate
(m3/s)
Volume
Pumped
(m3)
Parcel(s)
Irrigated
Max
Pumping
Rate
(gpm)
Volume
Pumped
(gallons)
Max
Pumping
Rate
(m3/s)
Volume
Pumped
(m3)
Parcel(s)
Irrigated
July 26 2499.68 3191540 0.15748 12081.29
NE 32-11-
21
SW 6-12-
21
NW 6-12-
21
1313.13 59556.68 0.08272719 225.45
NW 22-
12-21
SE 21-
12-21
1317.45 1102825 0.08299935 4174.65
SE 36-11-
22
NE 5-12-
21
1369.94 1604465.13 0.08630622 6073.56
NW 8-12-
21
SW 8-12-
21
July 27 2516.41 3153898 0.15853 11938.80
NE 32-11-
21
SW 6-12-
21
NW 6-12-
21
-- -- -- -- -- -- -- -- -- -- -- -- -- --
July 28 2502.91 3141437 0.15768 11891.63
SE 6-12-21
SW 5-12-
21
NW 6-12-
21
-- -- -- -- -- -- -- -- -- -- -- -- -- --
July 29 2213.20 1763502 0.13943 6675.576
SE 6-12-21
SW 5-12-
21
SE 5-12-21
-- -- -- -- -- -- -- -- -- -- -- -- -- --
Aug 1 2534.98 1758988 0.15970 6658.492
NE 32-11-
21
SW 6-12-
21
SE 5-12-21
-- -- -- -- -- 1920.06 795949.40 0.12096378 3013
SE 36-11-
22
E 1/2 8-
12 21
-- -- -- --
Aug 2 2678.57 3191855 0.16875 12082.48
NE 32-11-
21
SW 6-12-
21
SE 5-12-21
-- -- -- -- -- 974.30 152683 0.0613809 577.97
SE 36-11-
22
NE 5-12-
21
-- -- -- --
Aug 3 2251.45 3115337 0.14184 11792.83
NE 32-11-
21
SW 6-12-
21
SE 1-12-22
-- -- -- -- -- -- -- -- -- -- -- -- -- --
Aug 4 2198.57 1139113 0.13851 4312.01
NE 32-11-
21
SW 6-12-
21
SE 1-12-
22
-- -- -- -- -- -- -- -- -- -- -- -- -- --

APPENDIX A
Table 1: Daly Irrigation Development Project Licence No. 3010, Annual Water Use Report, 2013 Year
Date
(2013)
Redfern (Pump 2) Keywest (Pump 2) Sundance (Pump 2) Sundance (Pump 1)
Intake Location: NW10-12-21W Intake Location: NW10-12-21W Intake Location: NW10-12-21W Intake Location: NW10-12-21W
Pump Capacity: 2400 US gpm (0.1514 m3/s) Pump Capacity: 2400 US gpm (0.1514 m3/s) Pump Capacity: 2400 US gpm (0.1514 m3/s) Pump Capacity: 1600 US gpm (0.1001 m3/s)
Max
Pumping
Rate
(gpm)
Volume
Pumped
(gallons)
Max
Pumping
Rate
(m3/s)
Volume
Pumped
(m3)
Parcel(s)
Irrigated
Max
Pumping
Rate
(gpm)
Volume
Pumped
(gallons)
Max
Pumping
Rate
(m3/s)
Volume
Pumped
(m3)
Parcel(s)
Irrigated
Max
Pumping
Rate
(gpm)
Volume
Pumped
(gallons)
Max
Pumping
Rate
(m3/s)
Volume
Pumped
(m3)
Parcel(s)
Irrigated
Max
Pumping
Rate
(gpm)
Volume
Pumped
(gallons)
Max
Pumping
Rate
(m3/s)
Volume
Pumped
(m3)
Parcel(s)
Irrigated
Aug 8 -- -- -- -- -- -- -- -- -- -- 1907.12 842629.50 0.12014856 3189.70
SE 36-11-
22
E 1/2 8-
12 21
-- -- -- --
Aug 9 -- -- -- -- -- -- -- -- -- -- 980.21 135394.70 0.06175323 512.52 SE 36-11-
22 -- -- -- --
Aug 13 2695.16 1924066 0.16980 7283.38
NE 32-11-
21
SW 6-12-
21
SE 1-12-22
1360.38 1151967 0.08570394 4360.67
NW 22-
12-21
SE 21-12-
21
2004.44 884259.90 0.12627972 3347.29
SE 36-11-
22
NW 5-12-
21
1622.80 1032220.25 0.1022364 3907.38
NW 8-12-
21
SW 8-12-21
Aug 14 2464.66 3227074 0.15527 12215.80
NE 32-11-
21
SW 6-12-
21
SE 1-12-22
1343.64 1856473 0.08464932 7027.51
NW 22-
12-21
SE 21-12-
21
1025.07 1427723 0.06457941 5404.52
SE 36-11-
22
NE 5-12-
21
1404.99 1823734.5 0.08851437 6903.58
NW 8-12-
21
SW 8-12-
21
Aug 15 2317.83 3227248 0.14602 12216.46
NE 32-11-
21
SW 6-12-
21
SE 6-12-
21
1273.89 1776135 0.08025507 6723.40
NW 22-
12-21
SE 21-
12-21
1000.74 1401396 0.06304662 5304.86
SE 36-11-
22
NE 5-12-
21
1392.42 1963776.5 0.08772246 7433.70
NW 8-12-
21
SW 8-12-21
Aug 16 2496.30 3217553 0.15727 12179.76
NE 32-11-
21
SW 6-12-
21
SE 6-12-21
1248.15 1751093 0.07863345 6628.61
NW 22-
12-21
SE 21-12-
21
981.06 1387776 0.06180678 5253.30 SE 36-11-
22 1374.07 1958388.5 0.08656641 7413.30
NW 8-12-
21
SW 8-12-21
Aug 17 2428.94 2671721 0.15302 10113.56
NE 32-11-
21
SW 6-12-
21
NW 6-12-
21
1288.66 564684.10 0.08118558 2137.56
NW 22-
12-21
SE 21-12-
21
955.46 426787.10 0.06019398 1615.56 SE 36-11-
22 1363.66 614703.5 0.08591058 2326.90
NW 8-12-
21
SW 8-12-21
Aug 18 1552.35 2168927 0.09780 8210.28
NE 32-11-
21
SW 6-12-
21
NW 6-12-
21
-- -- -- -- -- -- -- -- -- -- -- -- -- -- --

APPENDIX A
Table 1: Daly Irrigation Development Project Licence No. 3010, Annual Water Use Report, 2013 Year
Date
(2013)
Redfern (Pump 2) Keywest (Pump 2) Sundance (Pump 2) Sundance (Pump 1)
Intake Location: NW10-12-21W Intake Location: NW10-12-21W Intake Location: NW10-12-21W Intake Location: NW10-12-21W
Pump Capacity: 2400 US gpm (0.1514 m3/s) Pump Capacity: 2400 US gpm (0.1514 m3/s) Pump Capacity: 2400 US gpm (0.1514 m3/s) Pump Capacity: 1600 US gpm (0.1001 m3/s)
Max
Pumping
Rate
(gpm)
Volume
Pumped
(gallons)
Max
Pumping
Rate
(m3/s)
Volume
Pumped
(m3)
Parcel(s)
Irrigated
Max
Pumping
Rate
(gpm)
Volume
Pumped
(gallons)
Max
Pumping
Rate
(m3/s)
Volume
Pumped
(m3)
Parcel(s)
Irrigated
Max
Pumping
Rate
(gpm)
Volume
Pumped
(gallons)
Max
Pumping
Rate
(m3/s)
Volume
Pumped
(m3)
Parcel(s)
Irrigated
Max
Pumping
Rate
(gpm)
Volume
Pumped
(gallons)
Max
Pumping
Rate
(m3/s)
Volume
Pumped
(m3)
Parcel(s)
Irrigated
Aug 19 1623.65 2167140 0.10229 8203.51
SE 5-12-21
SW 5-12-
21
NW 6-12-
21
1524.08 1110303 0.09601704 4202.95
NW 22-
12-21
SE 21-12-
21
1954.52 834784.80 0.12313476 3160
SE 36-11-
22
NW 5-12-
21
1564.25 980535.25 0.09854775 3711.73
NW 8-12-
21
SW 8-12-21
Aug 20 1536.31 2142711 0.09679 8111.04
SE 5-12-21
SW 5-12-
21
NW 6-12-
21
1481.47 1934970 0.09333261 7324.70
NW 22-
12-21
SE 21-12-
21
1022.54 1432890 0.06442002 5424.08
SE 36-11-
22
NW 5-12-
21
1360.05 1914823.13 0.08568315 7248.39
NW 8-12-
21
SW 8-12-21
Aug 21 1523.80 2093881 0.09600 7926.20
SE 5-12-21
SW 5-12-
21
NW 6-12-
21
1472.33 2067942 0.09275679 7828.01
NW 22-
12-21
SE 21-
12-21
1412.10 964734.80 0.0889623 3651.92
SE 36-11-
22
NE 5-12-
21
1398.29 1931275.88 0.08809227 7310.67
NW 8-12-
21
SW 8-12-21
Aug 22 1985.37 2373191 0.12508 8983.50
NE 32-11-
21
SW 6-12-
21
SE 5-12-21
1437.87 2021148 0.09058581 7650.87
NW 22-
12-21
SE 21-
12-21
999.48 1413419 0.06296724 5350.37 SE 36-11-
22 1368.81 1919311.38 0.08623503 7265.38
NW 8-12-
21
SW 8-12-21
Aug 23 1965.40 2578762 0.12382 9761.67
NE 32-11-
21
SW 6-12-
21
SW 5-12-
21
1513.82 1557872 0.09537066 5897.19
NW 22-
12-21
SE 21-12-
21
963.48 899509.40 0.06069924 3405.01 SE 36-11-
22 1338.20 1300552.63 0.0843066 4923.12
NW 8-12-
21
SW 8-12-
21
Aug 24 1424.79 2000131 0.08976 7571.31
NE 32-11-
21
SW 6-12-
21
SE 6-12-
21
1430.98 1183131 0.09015174 4478.64
NW 22-
12-21
SE 21-12-
21
-- -- -- -- -- 704.56 312685.38 0.04438728 1183.64 NW 8-12-
21
Aug 25 1412.41 1990024 0.08898 7533.06
NE 32-11-
21
SW 6-12-
21
SE 6-12-
21
-- -- -- -- -- -- -- -- -- -- -- -- -- -- --
Aug 26 1711.13 1960261 0.10780 7420.39
NE 32-11-
21
SW 6-12-
21
SE 6-12-21
-- -- -- -- -- -- -- -- -- -- -- -- -- -- --

APPENDIX A
Table 1: Daly Irrigation Development Project Licence No. 3010, Annual Water Use Report, 2013 Year
Date
(2013)
Redfern (Pump 2) Keywest (Pump 2) Sundance (Pump 2) Sundance (Pump 1)
Intake Location: NW10-12-21W Intake Location: NW10-12-21W Intake Location: NW10-12-21W Intake Location: NW10-12-21W
Pump Capacity: 2400 US gpm (0.1514 m3/s) Pump Capacity: 2400 US gpm (0.1514 m3/s) Pump Capacity: 2400 US gpm (0.1514 m3/s) Pump Capacity: 1600 US gpm (0.1001 m3/s)
Max
Pumping
Rate
(gpm)
Volume
Pumped
(gallons)
Max
Pumping
Rate
(m3/s)
Volume
Pumped
(m3)
Parcel(s)
Irrigated
Max
Pumping
Rate
(gpm)
Volume
Pumped
(gallons)
Max
Pumping
Rate
(m3/s)
Volume
Pumped
(m3)
Parcel(s)
Irrigated
Max
Pumping
Rate
(gpm)
Volume
Pumped
(gallons)
Max
Pumping
Rate
(m3/s)
Volume
Pumped
(m3)
Parcel(s)
Irrigated
Max
Pumping
Rate
(gpm)
Volume
Pumped
(gallons)
Max
Pumping
Rate
(m3/s)
Volume
Pumped
(m3)
Parcel(s)
Irrigated
Aug 27 2008.71 2368316 0.12655 8965.05
SW 5-12-
21
SE 5-12-21
1480.20 936180 0.0932526 3543.83
NW 22-
12-21
SE 21-12-
21
2005.28 644643.60 0.12633264 2440.24
SE 36-11-
22
E 1/2 8-
12 21
1356.23 434615.28 0.08544249 1645.20
NW 8-12-
21
SW 8-12-21
Aug 28 2222.20 2972655 0.14000 11252.72
SW 5-12-
21
SE 1-12-22
1521.55 2124174 0.09585765 8040.87
NW 22-
12-21
SE 21-12-
21
1015.09 1422900 0.06395067 5386.26 SE 36-11-
22 720.12 1012028.06 0.04536756 3830.94
NW 8-12-
21
SW 8-12-21
Aug 29 2141.61 1844839 0.13492 6983.473
SW 5-12-
21
SE 1-12-22
1490.19 1340044 0.09388197 5072.62
NW 22-
12-21
SE 21-
12-21
986.54 710987.3 0.06215202 2691.38 SE 36-11-
22 712.91 634269.69 0.04491333 2400.97
NW 8-12-
21
Sept 4 2123.19 1315475 0.13376 4979.61
NE 32-11-
21
SW 6-12-
21
SE 1-12-22
1433.23 1214492 0.09029349 4597.35
NW 22-
12-21
SE 21-12-
21
2007.68 888543.4 0.12648384 3363.50
SE 36-11-
22
NE 5-12-
21
1330.26 595059.81 0.08380638 2252.55
NW 8-12-
21
SW 8-12-21
Sept 5 1572.18 1131745 0.09905 4284.117
NE 32-11-
21
SW 6-12-
21
SE 1-12-22
1378.80 1376450 0.0868644 5210.43
NW 22-
12-21
SE 21-12-
21
937.74 379521.80 0.05907762 1436.65 SE 36-11-
22 754.24 758560 0.04751712 2871.46
NW 8-12-
21
Sept 10 -- -- -- -- -- 0.28 2.25 0.00001764 0.008517 Line Test 0.14 1.13 0.00000882 0.004278 Line Test -- -- -- -- --
Sept 12 -- -- -- -- -- 1366.15 645976.9 0.08606745 2445.29
NW 22-
12-21
SE 21-12-
21
-- -- -- -- -- -- -- -- -- --
Sept 13 -- -- -- -- -- 1361.22 1698073 0.08575686 6427.90
NW 22-
12-21
SE 21-12-
21
-- -- -- -- -- -- -- -- -- --
APPENDIX A
Table 1: Daly Irrigation Development Project Licence No. 3010, Annual Water Use Report, 2013 Year
Date
(2013)
Redfern (Pump 2) Keywest (Pump 2) Sundance (Pump 2) Sundance (Pump 1)
Intake Location: NW10-12-21W Intake Location: NW10-12-21W Intake Location: NW10-12-21W Intake Location: NW10-12-21W
Pump Capacity: 2400 US gpm (0.1514 m3/s) Pump Capacity: 2400 US gpm (0.1514 m3/s) Pump Capacity: 2400 US gpm (0.1514 m3/s) Pump Capacity: 1600 US gpm (0.1001 m3/s)
Max
Pumping
Rate
(gpm)
Volume
Pumped
(gallons)
Max
Pumping
Rate
(m3/s)
Volume
Pumped
(m3)
Parcel(s)
Irrigated
Max
Pumping
Rate
(gpm)
Volume
Pumped
(gallons)
Max
Pumping
Rate
(m3/s)
Volume
Pumped
(m3)
Parcel(s)
Irrigated
Max
Pumping
Rate
(gpm)
Volume
Pumped
(gallons)
Max
Pumping
Rate
(m3/s)
Volume
Pumped
(m3)
Parcel(s)
Irrigated
Max
Pumping
Rate
(gpm)
Volume
Pumped
(gallons)
Max
Pumping
Rate
(m3/s)
Volume
Pumped
(m3)
Parcel(s)
Irrigated
Sept 14 2121.50 1338991 0.13365 5068.629
NE 32-11-
21
SW 6-12-
21
SE 5-12-
21
-- -- -- -- -- -- -- -- -- -- -- -- -- -- --
Sept 15 1560.36 710662.10 0.09830 2690.148
NE 32-11-
21
SW 6-12-
21
SE 1-12-
22
-- -- -- -- -- -- -- -- -- -- -- -- -- -- --
Sept 19 -- -- -- -- -- 0.14 1.13 0.00000882 0.004278 Line Test -- -- -- -- -- -- -- -- -- --
Total (US
gallons) 96,741,100 42,861,898 37,375,045 39,579,541.27
Total (m3) 366,204.70 162,249.94 141,479.88 149,824.78
Total
(ac-ft) 296.89 131.54
114.70
121.46
APPENDIX B Reference: Daly Irrigation Project – 2013 Final Monitoring Report – Licence No. 3010
RIFFLE MONITORING PHOTOGRAPHS
Photo 1: July 7, 2013 Pumping Active
Photo 2: July 5, 2013 Pumping Not Active

APPENDIX B Reference: Daly Irrigation Project – 2013 Final Monitoring Report – Licence No. 3010
RIFFLE MONITORING PHOTOGRAPHS
Photo 3: July 29, 2013 Pumping Active
Photo 4: July 30, 2013 Pumping Not Active

APPENDIX B Reference: Daly Irrigation Project – 2013 Final Monitoring Report – Licence No. 3010
RIFFLE MONITORING PHOTOGRAPHS
Photo 5: August 13, 2013 Pumping Active
Photo 6: August 10, 2013 Pumping Not Active
APPENDIX B Reference: Daly Irrigation Project – 2013 Final Monitoring Report – Licence No. 3010
RIFFLE MONITORING PHOTOGRAPHS
Photo 7: September 19, 2013 Irrigation Season Completed

!(
!(
!(!(
!(
!(
!(
!(
!(
!(
!(
!(
!(
!(
!(
!(
!(
!(
!(
!(
!(
!(
!(
!(
!(
!(
!(
!(
!(!(
!?
LittleSa
skatchewanRiv er
Rr04Rr03
Rr02Rr01
Kw12Kw11
Kw10
Kw09Kw08
Kw07
Kw06
Kw05
Kw04Kw03
Kw02
Kw01
Dr14
Dr13
Dr12
Dr11
Dr10
Dr09
Dr08Dr07
Dr06
Dr05
Dr04Dr03
Dr02Dr01
ProjectFootprint
G:\_GIS_Project_Folder\111440070_Little_Sask\Project_Footprint_20140115.mxd
DATA SOURCE:ORTHOPHOTO IMAGERY ANDSOIL RESOURCE INFORMATIONPROVIDED BY MANITOBALAND INITIATIVE,PROVINCE OF MANITOBA.
LEGEND
FIGUREPROJECT
QA/QC APPROVEDAC
Feb 28, 2014 111440070 4-1
DATE
DRAWNJH JH
COORDINATESYSTEM NAD 1983 UTM Zone 14N0 790395 Metres
0 3,0001,500 Feet
±
RGE 21RGE 22
TWP 12
TWP 11
31 323635
25
06 05
07 08 09
18 17
01
12
13 16
2120 22
!?
!(
Irrigation Line Pipe Diameter15"12"8"Future 8"Deerboine Project
Local Study AreaPhase 1 Pivots/Project FootprintPhase 2 Proposed PivotsPump StationSoil Inspection Points