Embed Size (px)
Citation preview

1
Reference Number: 89243319CFE000015 Coal-Based Power Plants of the Future.
Title of Project: Allam Cycle Zero Emission Coal Power
Concept Area of Interest: Inherently Capture
Report Title: Cost Results Report
Company
8 Rivers Capital, LLC
406 Blackwell Street
Durham, NC 27701
American Tobacco Campus
Crowe Building - Fourth Floor
DUNS Number: 829549307
Business Size: Small Business
Subcontractors
WSP UK Limited
WSP House
70 Chancery Lane, London
WC2A 1AF
DUNS Number: 28-906-0493
Business Size: Large Business
Institute of Gas Technology (GTI)
1700 S Mount Prospect Rd
Des Plaines, IL 60018-1804
DUNS Number – 045060753
Business Size: Other Than Small Business (Not-For-Profit Concern)
Company Point of Contact: Adam Goff. 8 Rivers Capital.
Telephone: +1 919-667-1800
Fax: 919.287.4798
Email: [email protected]
Public Version
This material contains intellectual property of 8 Rivers Capital, LLC and its affiliates.
Date of Submission: February 19th, 2020
Date of Re-submission: April 15th, 2020

2
Contents
COST ESTIMATING METHODOLOGY ................................................................................................... 3
General Cost Estimation Methodology ..................................................................................................... 3
Owners Costs ............................................................................................................................................ 4
Initial and Annual Operating and Maintenance Costs. ............................................................................. 5
Fixed Operating Costs ........................................................................................................................... 5
Variable Operating Costs ...................................................................................................................... 5
Fuel Cost ............................................................................................................................................... 5
Byproduct Revenues ................................................................................................................................. 5
Levelized Cost of Energy (LCOE)............................................................................................................ 7
Specific Equipment Cost Estimation Methodology .................................................................................. 8
Coal Handling ....................................................................................................................................... 8
Gasifier and Syngas Cleanup ................................................................................................................ 8
Air Separation Unit (ASU) ................................................................................................................... 9
Allam-Fetvedt Cycle Power Island ....................................................................................................... 9
Cooling Water System ........................................................................................................................ 10
Waste-Water Treatment and ZLD ....................................................................................................... 11
Miscellaneous / BOP ........................................................................................................................... 11
Electrical Plant .................................................................................................................................... 12
Instrumentation and Control ............................................................................................................... 12
Buildings / Structures and Civil Works .............................................................................................. 12
POTENTIAL COST SAVING AREAS ..................................................................................................... 12
COST ANALYSIS RESULTS ................................................................................................................... 13
Cost Confidence Assessment .................................................................................................................. 13
Reference Plant Owner’s Costs .............................................................................................................. 13
Reference Plant Operating Costs ............................................................................................................ 14
Flexibility Conditions ............................................................................................................................. 16
Cost of Energy and Sensitivity Analysis ................................................................................................. 16
Figure 1: LCOE Sensitivity Analysis.......................................................................................................... 17
Table 1: Guidelines to aid in assigning process contingency allowances to various sections of the plant. .. 3
Table 2: Adjacent Wyoming CO2-EOR Opportunities ................................................................................ 6
Table 5: Cost Confidence Category Matrix ................................................................................................ 13
Table 6: Owner's Costs Table ..................................................................................................................... 14
Table 7: Operating Costs and Output Table ................................................................................................ 14
Table 8: Levelized Cost of Energy Table ................................................................................................... 17

3
COST ESTIMATING METHODOLOGY
General Cost Estimation Methodology
The cost analysis has been compiled to the level of accuracy for a nominal AACE 18R-97i Class
4 Estimate. A Cost Confidence Assessment has been provided later on in the report to
demonstrate the cost is within the expected accuracy range for a AACE 18R-97 Class 4 Estimate.
The cost analysis has been built up with reference to the NETL Cost Estimation Methodology
Reportii and the NETL Baseline for Fossil Energy Plants - Volume 1 Report (NETL Baseline
Report)iii. Using the definitions outlined in the NETL Cost Estimation Methodology Report, the
following levels of capital cost have been included:
- Bare Erected Cost (BEC) - Comprises the cost of process equipment, on-site facilities and
infrastructure that support the plant, delivery of all equipment and material and the direct
labor required for construction and / or installation.
- Engineering, Procurement and Construction Cost (EPCC) - An EPC contracting strategy
will be used, as given the newness of this technology we believe this approach compared
to an EPCM is more likely to yield a bankable project. The cost comprises the BEC plus
the cost of services provided by the EPC contractor. These include engineering and
design costs, contractor permitting and project / construction (direct and indirect)
management costs. If an Engineering, Procurement and Construction Management
(EPCM) contracting strategy is assumed, the NETL Cost Estimation Methodology Report
indicates the EPCC add-on should be 15 – 20% of the BEC, depending on the technology
considered. For this cost analysis, 15% of the BEC has been assumed for all cost lines.
- Total Plant Cost (TPC) - Comprises the EPCC cost plus project and process
contingencies. To determine project contingency, a percentage of the Total Process
Capital, EPC Contractor Services and Process Contingency has been used. The
percentages range from 10% to 30%, with a percentage assigned based on the certainty of
bare erected cost for that line item, as per the recommendation in AACE 16R-90iv.
Process contingency has only been included for process items where there are
uncertainties associated with the development status of the technology. These include the
Heat Exchanger Network and the CO2 Purification unit (off-the shelve technology but
when combined, original design). A percentage (factor) of the BEC for the specific line
item has been assumed based on the guidelines outlined in AACE 16R-90 and EPRIv.
The below provides a summary the allowances outlined in AACE 16R-90 and EPRI:
Table 1: Guidelines to aid in assigning process contingency allowances to various sections of the plant.
- Total Overnight Cost (TOC) - Comprises the TPC plus ‘overnight’ costs, including
owner’s cost. The methodology used to determine the owner’s cost is provided later
within this section.

4
The TOC is an overnight cost, expressed in base-year dollars and as such does not include
escalation during construction or construction financing costs. To determine a cost expressed in
mixed, current-year dollars over the capital expenditure period, the Total As-Spent Cost needs to
be calculated.
- Total As-Spent Cost (TASC) - Comprises the sum of all capital expenditures as they are
incurred during the capital expenditure period for construction, including their escalation.
TASC also includes interest during construction, comprised of interest on debt and a
return on equity (ROE).
The TASC can be calculated from the TOC using specific factors as outlined in Exhibit
3-7 within the NETL Cost Estimation Methodology Report. The specific factor used for
this cost analysis has been chosen based on the assumption of real dollars and a duration
of construction for 5 years. The factor has been verified by ensuring the economic
assumptions (Exhibit 3-1) and the financial structures for investor-owned utilities
(Exhibit 3-2) outlined within the NETL Cost Estimation Methodology Report align with
the specific economics for the project. Amongst others, these include:
o Income Tax Rates of 21% and 6% at federal and state level, respectively;
o An effective tax rate of 25.74%;
o A financing structure of 55% debt and 45% equity
Owners Costs
Owner's Costs were established from the guidance within the NETL Cost Estimation
Methodology Report.
Pre-production costs to include a proportion of operating labor, maintenance materials, non-fuel
consumables, waste disposal and fuel consumables. An additional 2% of TPC added to cover all
other pre-production costs.
Inventory capital costs includes 60-day supply of fuel and 60-day supply of non-fuel
consumables assuming 100% capacity factor and an additional 0.5% of TPC for spare parts.
Other owner’s costs include for initial purchase of catalyst and chemicals, cost for land
($3,000/acre, with estimated 27.073 acres as per Indicative Site Layout produced), financing cost
of 2.7% of TPC and 10% of TPC added to cover all other owner’s costs.
The NETL Performance and Cost Assessment of a natural Gas-Fueled Direct sCO2 Power Plant
reportvi (NETL Direct sCO2 report) utilized a 15% of TPC unit for this “other owner’s costs”
category, stating that: “Significant deviation from this value is possible, because it is very site
and owner specific. AACE 18R-97 indicates the "other owner's cost" of 15% of TPC is only an
estimate based on rule of thumb and so flexibility to adjust based on site and owner specifics.
The lumped ‘Other Owner’s Costs’ includes: Preliminary feasibility studies, including a front-
end engineering design study; Economic development (costs for incentivizing local collaboration
and support; Construction and/or improvement of roads and/or railroad spurs outside of site
boundary; Legal fees; Permitting costs; Owner’s engineering; Owner’s contingency.” Given the

5
chosen siting on an existing coal mine, the lower permitting burden due to the near-zero air
emissions and zero-liquid-discharge nature of the Allam-Fetvedt Cycle, and the higher overall
Total Plant Cost of the coal cycle, the project team has deemed that 15% of TPC is an inaccurate
representation and agreed that taking 10% of TPC provides a more realistic cost.
Initial and Annual Operating and Maintenance Costs.
The O&M costs have been split by fixed operating costs, variable operating costs and fuel costs.
Fixed Operating Costs
The fixed operating cost includes a cost for the annual operating labor for the Allam-Fetvedt
Cycle, ASU and gasification plants. An average base labor of $38.50/hr was assumed cross all
operating staff, with a 30% labor burden and 25% of labor plus burden to cover overheads.
The maintenance labor was calculated as a percentage of the maintenance material in line with
the NETL Baseline Report.
For administrative and support labor, 25% of the annual operating and maintenance labor was
assumed.
For property taxes and insurance, 2% of the TPC was assumed.
Variable Operating Costs
For Maintenance materials, 1.95% of the TPC was assumed, in line with the NETL Baseline
Report.
Non-fuel consumables and waste disposal specific to the Coal Allam Cycle Plantwas determined
from per unit rates and assuming the plant capacity factor when calculating annual cost.
Fuel Cost
The 2018 unit cost of fuel of $12.68/ton was taken from EIA Table 31, Annual Coal Report 2018 vii for the Wyoming average coal price at the mine mouth. Because of the chosen location at the
North Antelope Rochelle Mine, a mine mouth coal price was determined to be more
representative than the delivered coal price used in the Conceptual Design.
Adjusting the 2018 cost of fuel to 2023 cost of fuel ($13.11) and levelizing over 30 year
operational period (Year over year escalation for Wyoming, taken from Exhibit 2-2, Fuel Prices
for NETL Quality Guidelines for Fuel Prices for Selected Feedstocks in NETL Studiesviii),
results in a levelized fuel price of $14.69/ton or $7.12/MWh. Based on the net plant HHV
efficiency, this corresponds to a levelized fuel cost of $0.83/mmbtu.
This is a significantly lower fuel cost compared to $1.72/mmbtu for delivered PRB coal as stated
in the Conceptual Design, and so a sensitivity case is also run for non-mine mouth PRB coal.
Byproduct Revenues
For CO2 transport and storage, it was assumed that 60 total miles pipeline would be built and that
CO2 would be utilized for Enhanced Oil Recovery (EOR). The FE/NETL CO2 Transport Cost
Model from 2018 was utilized with a 10% return on debt and equity, leading to a $3.23/MT cost
of CO2 transport, which was then converted into dollars per MWh.ix

6
The Wyoming Enhanced Oil Recovery Institute provided a list of nearby oil fields that are CO2
miscible and potentially suitable for CO2-EOR. This provides 141.6 million tonnes of total CO2
demand, shown in the below table. The value of CO2 for EOR is assumed to be $15 / MT, which
is both a standard and a conservative value in the industry.
Table 2: Adjacent Wyoming CO2-EOR Opportunities
On top of CO2-EOR sales, an additional $35 / MT of CO2 is added due to the value of the 45Q
tax credit (in the year 2026). This credit is then grossed up to its Pre-Tax value for the levelized
cost analysis using the 21% federal corporate income tax rate. To claim the 45Q tax credit,
construction for the project must start before January 2024. The Project Execution Plan
developed as part of this Pre-FEED indicates construction is scheduled to commence Q1 2023
and so the project will be entitled to claim the 45Q tax credit. Once qualified, the tax credit is
available for 12 years. The revenue has therefore been adjusted to reflect claiming the 45Q tax
credit for only 12 years but levelized over the 30 years of operation. To do this, the net present
value of the total CO2-EOR sales over 30 years and net present value of toal income from 45Q
tax credit over the first 12 years was determined (using a discount rate of 5%). The NPV ratio

7
and the levelized CO2-EOR sales was used to determine the levelized 45Q over the 30 years of
operation.
The prices for sales of Argon and Nitrogen, both byproducts of Air Separation, were calculated
from 8 Rivers in-house data, estimates, and conversations with industrial gas distributors. Prices
in the industrial gas market are very localized and kept quite confidential. Given the remote
location of this facility and its low value, nitrogen is assumed to be too expensive to transport
and thus have no value. Argon is in high demand in Salt Lake City, Denver, and California, all of
which are reachable by rail from the NARM site. Argon routinely sells for over $400/ton, but to
allow for this project to break into the market, a $300/ton argon pick-up price is assumed to
undercut the existing supply. Different sensitivity analyses were run with different Argon prices
to show the impact on the cost of electricity. To include the additional revenue from producing
and selling excess Argon, a cost add-on has been included on top of the equipment cost for the
ASU, along with an efficiency hit. This cost add-on has been provided from the ASU vendor
based on the additional cost to produce the gases at required flowrate.
Levelized Cost of Energy (LCOE)
The Levelized Cost of Energy (LCOE) is determined from summation of the levelized capital
cost, levelized annual O&M cost and levelized annual fuel cost. Alternate LCOE figures have
also been determined, which include and/or exclude CO2 transport & storage (T&S) and revenue
from other byproducts.
The levelized capital cost has been determined as a function of the after-tax weight average cost
of capital, tax depreciation and effective tax rate in line with the equations included within the
NETL Cost Estimation Methodology Report. The following economic assumptions and finance
structure has been assumed:
- Number of operating years: 30
- Number of years of depreciation: 21
- Effective tax rate: 25.74%
- Finance Structure:
o Debt: 55%
o Equity: 45%
- Capital Recovery Factor: 6.305%
The levelized O&M cost assumes the same financial structure as the levelized capital cost but
also considers annual escalation rate over the number of operating years (30 years assumed). For
the purpose of this cost assessment, a 0% annual escalation rate has been assumed, which is
consistent with the NETL Baseline Report.
The levelized fuel cost assumes the same financial structure as the levelized capital cost, with
details outlined of the build-up of the levelized fuel cost detailed previously within this report.
8
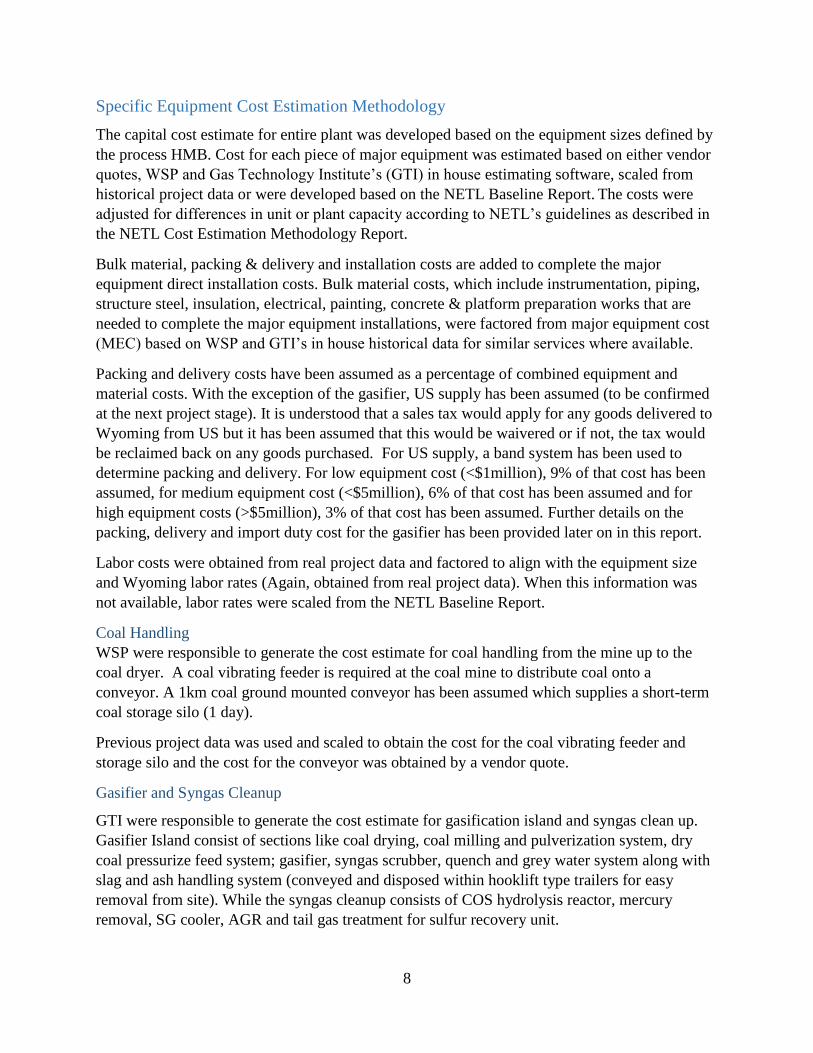
Specific Equipment Cost Estimation Methodology
The capital cost estimate for entire plant was developed based on the equipment sizes defined by
the process HMB. Cost for each piece of major equipment was estimated based on either vendor
quotes, WSP and Gas Technology Institute’s (GTI) in house estimating software, scaled from
historical project data or were developed based on the NETL Baseline Report. The costs were
adjusted for differences in unit or plant capacity according to NETL’s guidelines as described in
the NETL Cost Estimation Methodology Report.
Bulk material, packing & delivery and installation costs are added to complete the major
equipment direct installation costs. Bulk material costs, which include instrumentation, piping,
structure steel, insulation, electrical, painting, concrete & platform preparation works that are
needed to complete the major equipment installations, were factored from major equipment cost
(MEC) based on WSP and GTI’s in house historical data for similar services where available.
Packing and delivery costs have been assumed as a percentage of combined equipment and
material costs. With the exception of the gasifier, US supply has been assumed (to be confirmed
at the next project stage). It is understood that a sales tax would apply for any goods delivered to
Wyoming from US but it has been assumed that this would be waivered or if not, the tax would
be reclaimed back on any goods purchased. For US supply, a band system has been used to
determine packing and delivery. For low equipment cost (<$1million), 9% of that cost has been
assumed, for medium equipment cost (<$5million), 6% of that cost has been assumed and for
high equipment costs (>$5million), 3% of that cost has been assumed. Further details on the
packing, delivery and import duty cost for the gasifier has been provided later on in this report.
Labor costs were obtained from real project data and factored to align with the equipment size
and Wyoming labor rates (Again, obtained from real project data). When this information was
not available, labor rates were scaled from the NETL Baseline Report.
Coal Handling
WSP were responsible to generate the cost estimate for coal handling from the mine up to the
coal dryer. A coal vibrating feeder is required at the coal mine to distribute coal onto a
conveyor. A 1km coal ground mounted conveyor has been assumed which supplies a short-term
coal storage silo (1 day).
Previous project data was used and scaled to obtain the cost for the coal vibrating feeder and
storage silo and the cost for the conveyor was obtained by a vendor quote.
Gasifier and Syngas Cleanup
GTI were responsible to generate the cost estimate for gasification island and syngas clean up.
Gasifier Island consist of sections like coal drying, coal milling and pulverization system, dry
coal pressurize feed system; gasifier, syngas scrubber, quench and grey water system along with
slag and ash handling system (conveyed and disposed within hooklift type trailers for easy
removal from site). While the syngas cleanup consists of COS hydrolysis reactor, mercury
removal, SG cooler, AGR and tail gas treatment for sulfur recovery unit.
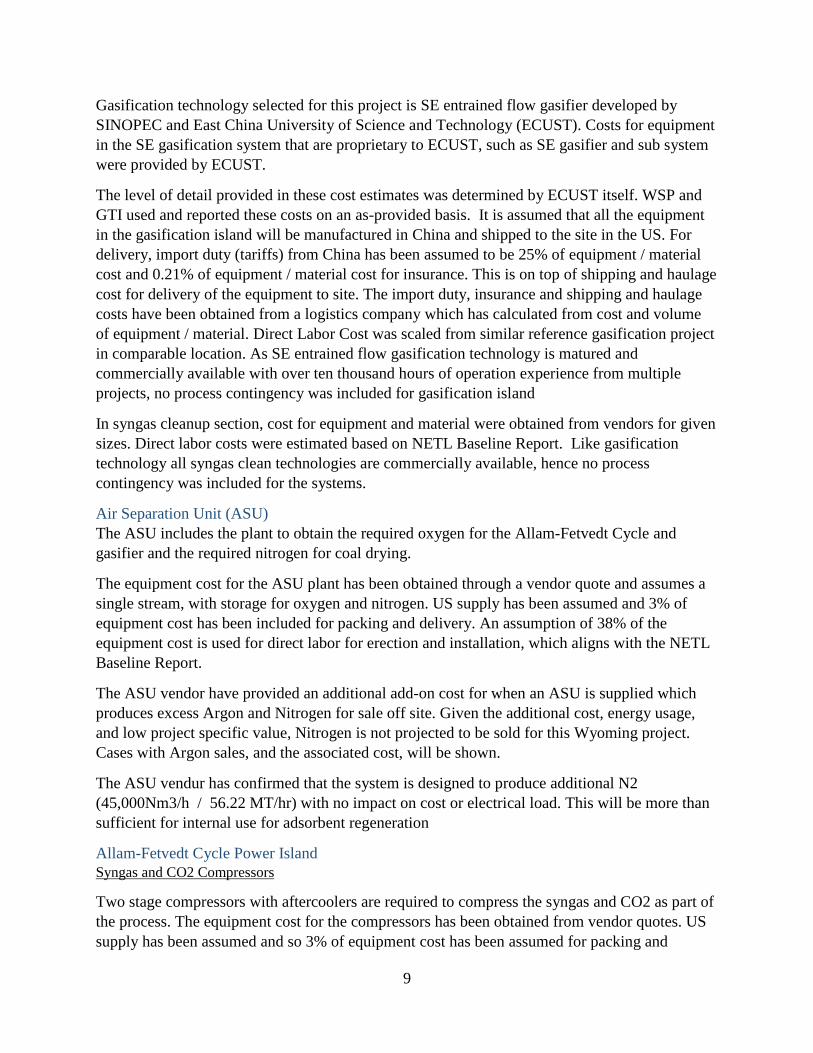
9
Gasification technology selected for this project is SE entrained flow gasifier developed by
SINOPEC and East China University of Science and Technology (ECUST). Costs for equipment
in the SE gasification system that are proprietary to ECUST, such as SE gasifier and sub system
were provided by ECUST.
The level of detail provided in these cost estimates was determined by ECUST itself. WSP and
GTI used and reported these costs on an as-provided basis. It is assumed that all the equipment
in the gasification island will be manufactured in China and shipped to the site in the US. For
delivery, import duty (tariffs) from China has been assumed to be 25% of equipment / material
cost and 0.21% of equipment / material cost for insurance. This is on top of shipping and haulage
cost for delivery of the equipment to site. The import duty, insurance and shipping and haulage
costs have been obtained from a logistics company which has calculated from cost and volume
of equipment / material. Direct Labor Cost was scaled from similar reference gasification project
in comparable location. As SE entrained flow gasification technology is matured and
commercially available with over ten thousand hours of operation experience from multiple
projects, no process contingency was included for gasification island
In syngas cleanup section, cost for equipment and material were obtained from vendors for given
sizes. Direct labor costs were estimated based on NETL Baseline Report. Like gasification
technology all syngas clean technologies are commercially available, hence no process
contingency was included for the systems.
Air Separation Unit (ASU)
The ASU includes the plant to obtain the required oxygen for the Allam-Fetvedt Cycle and
gasifier and the required nitrogen for coal drying.
The equipment cost for the ASU plant has been obtained through a vendor quote and assumes a
single stream, with storage for oxygen and nitrogen. US supply has been assumed and 3% of
equipment cost has been included for packing and delivery. An assumption of 38% of the
equipment cost is used for direct labor for erection and installation, which aligns with the NETL
Baseline Report.
The ASU vendor have provided an additional add-on cost for when an ASU is supplied which
produces excess Argon and Nitrogen for sale off site. Given the additional cost, energy usage,
and low project specific value, Nitrogen is not projected to be sold for this Wyoming project.
Cases with Argon sales, and the associated cost, will be shown.
The ASU vendur has confirmed that the system is designed to produce additional N2
(45,000Nm3/h / 56.22 MT/hr) with no impact on cost or electrical load. This will be more than
sufficient for internal use for adsorbent regeneration
Allam-Fetvedt Cycle Power Island
Syngas and CO2 Compressors
Two stage compressors with aftercoolers are required to compress the syngas and CO2 as part of
the process. The equipment cost for the compressors has been obtained from vendor quotes. US
supply has been assumed and so 3% of equipment cost has been assumed for packing and

10
delivery. 5% of the equipment cost has been assumed for direct labor for interconnection of
pipes, instruments and ancillaries. The syngas compressor cost used for this project is from
vendor quote with ancillaries included. Connecting pipework, fitting and valves for the Allam
Cycle Plant is included as a separate line item. Assumed equipment will be delivered as skid
unit, so minimal labor required for installation and connections hence the assumption of 5% of
equipment cost for direct labor.
Although the same vendor has provided a cost for both compressors, a combined supply discount
has not been explored at this stage.
Syngas Combustor and Turbine
Siemens provided a quote for the syngas combustor and turbine set for this project. US supply
has been assumed and so 3% of equipment cost has been included for packing and delivery.
Further, 5% of the equipment cost has been assumed for direct labor for interconnection works
with the other plant.
Recuperative Heat Exchanger
The recuperative heat exchanger is a multiple high pressure and temperature stream network,
with the arrangement still under discussion with vendors. At this stage, a vendor quote has not
been obtained and so the cost of the heat exchanger unit has been estimated from scaling the
equipment cost from the NET Power Demonstration Plant. At this stage, this is deemed a
sufficient estimate due to the process conditions being comparable for the two projects.
US supply has been assumed and so 3% of equipment cost has been included for packing and
delivery, with 5% of the equipment cost assumed for direct labor for interconnection works.
CO2 Pumps and Oxidant Pump
The equipment cost for the pumps has been obtained from vendor quotes. US supply has been
assumed and so 3% of equipment cost has been included for packing and delivery. An additional
5% of the equipment cost has been assumed for direct labor for installation and interconnection
of pipes, instruments and ancillaries.
Although the same vendor has provided a cost for both pumps, a combined supply discount has
not been explored at this stage.
Additional Equipment
The additional equipment included in the Power Island are the following: Syngas Turbine
Generator, Direct Contact Cooler, Civils / Foundations, and Allam Cycle Connection Pipework,
Fittings, and Valves. Each of these has no process contingency, and a 15% project contingency,
with the exceptions of the Civils / Foundations category which has a 20% project contingency.
Cooling Water System
A hybrid (wet / dry) mechanical draft cooling tower with circulating cooling water pumps is
required to provide the plant cooling.

11
During the winter months, the system uses indirect dry cooling. Circulating water heated through
the plant process is cooled through finned tubes, by passing air over the exterior surface of the
tubes. The wet system is not in use and so water lost through evaporation, drift or blowdown is
minimized.
During the summer months, the system uses dry cooling in series with wet cooling. Similar to
operation in winter months, the circulating water heated through the plant process is cooled
through the finned tubes. It then undergoes further cooling by evaporation of a proportion of the
water through direct contact with the air in a wet fill section. Although the dry cooling section
reduces the amount of evaporation, the system is open and water is still lost and so make-up
water is required.
Based on the extreme winter conditions seen in Wyoming, a no-plume design point of -4°C (dry
bulb temp, with relative humidity of 70%) has been chosen to size the dry part of the cooling
tower. This has been discussed and agreed with vendors to allow the best compromise between
performance and costs.
Three similar vendor quotes have been obtained and the cost used is an average of the three
quotes. 35% of the equipment cost has been assumed for direct labor for erection and installation
which aligns with the NETL Baseline Report. Thermoflow PEACE cost estimating software has
been used to estimate the cost of the circulating water pump based on required flow.
Waste-Water Treatment and ZLD
The exact quality and analysis of the different process waste-water streams is not yet known but
through discussion with a waste water treatment vendor, indicative zero liquid discharge (ZLD)
waste water treatment systems have been formulated.
For the black water from the gasification water scrubber, it is understood the waste is mostly
contaminated with COD (Assumed COD contents have molecular weight > 100). To treat this, a
two stage reverse osmosis (RO), with a final evaporator stage, to allow the distillate from the RO
stages and the evaporator to be recycled within the plant.
The other waste water streams is predominantly made up of the cooling tower blowdown. To
treat this, a softening plant for removal of heavy metals and silica is required, followed by a two
stage RO and a salt crystallization plant to saturate the brine to a slurry. The slurry will be
collected and disposed of off-site and the distillate is recycled back to the plant process.
A vendor quote has been obtained for these waste water treatment systems. The vendor has
indicated 25% cost for direct labor for erection and installation of the water treatment plants.
Miscellaneous / BOP
Cost for miscellaneous plant and BOP have been obtained from a mixture of vendor quotes, from
Thermoflow PEACE cost estimating software or scaled from historical projects. Once the
definition of this plant is more refined at the next stage, vendor quotes can be obtained.
12
Electrical Plant
For the electrical plant, all electrical and distribution equipment has been assumed up to the
busbars within the electrical switchyard i.e. no electrical transmission from the switchyard have
been assumed at this stage.
All electrical plant equipment costs have been obtained from vendor quotes, with the cost for the
electrical switchyard being estimated by WSP electrical team.
Instrumentation and Control
The cost for the site wide DCS has been determined from historical project data and scaled to
align with the control and instrumentation requirements for this project. A quote from a vendor is
being awaited and will feed into the cost estimate when available.
Buildings / Structures and Civil Works
The cost for buildings has been obtained by laying out the equipment within buildings on a site
layout, with consideration given to operation and maintenance requirements. The equipment
footprints and heights have been taken from information provided by vendors.
The site layout produced has also been used to determine the costs for site finishing to include
road network, drainage and landscaping and cost for pipe supports and.
POTENTIAL COST SAVING AREAS GTI contacted different vendors for quotation of sub-systems in gasification and gas clean up
island. While reviewing the quotations and discussion with vendors, GTI have identified a few
potential cost saving areas. These can be evaluated in detail during FEED stage.
1) Tail Gas Treatment for Sulfur Removal:-
In this study we compared 5 technologies for sulfur removal:- 3 stage Claus SRU, LO-CAT®
process, AECOM’s Crystasulf , FLEXSORB and GPUR. The technology selected and cost quoted
currently is for the Merichem’s LO-CAT® process which is a liquid redox technology that
converts H2S to elemental sulfur in an inherently safe aqueous solution. The elemental sulfur if
filtered from the solution as a 60 wt% sulfur “cake” that is safe for transport and can be used as a
fertilizer or disposed of in a landfill. The equipment cost quoted for LO-CAT® process is USD
$12,500,000 with low annual operating cost (under $650,000).
There is another gas/liquid contactor technology called GPUR for sulfur removal; which is suitable
for the proposed system. The equipment cost quoted from the vendor is about USD $6,000,000
(almost $6,500,000 cheaper than the LO-CAT® process), but the annual operating cost is in the
range of USD $3,000,000. Trade study can be done in FEED stage for potential capital cost saving
compared to annual operating cost, if this technology is chosen.
2) Zero Liquid Discharge: As stated above a quote has been obtained for a waste water ZLD
system based on the assumed quality and preliminary flows for the different streams. The total
installed cost comes in at approximately $29 million. USD s range. ZLD requirement is site/project
specific, so if the site chosen does not have requirement of ZLD, it could be eliminated and
replaced with a simple waste-water treatment plant and be a potential cost saving.

13
COST ANALYSIS RESULTS
Cost Confidence Assessment
A Cost Confidence Assessment has been carried out to demonstrate the cost is within the expected
accuracy range for an AACE 18R-97 Class 4 Estimate. The assessment has looked at the main
plant areas as split in the Cost Analysis Results and assigned a cost confidence category (Refer to
the Cost Confidence Matrix). An accuracy is then estimated for each line depending on the
maturity level of the design and the quality of cost obtained. This methodology presents the
accuracies for each of the main plant areas and calculates a total plant cost accuracy of -17.1% to
+28.3%.
Table 3: Cost Confidence Category Matrix
Reference Plant Owner’s Costs
Description $1,000s $/kW
Pre-Production Costs (Assume 100% Capacity
Factor)
6 months - all labor 10,426 36.5
1 month maintenance materials 1,682 5.9
1 Month Non-Fuel Consumables 312 1.1
1 Month Waste Disposal 8 0.0
25% of 1 Months Fuel Cost (at 100% CF) 320 1.1
2% of TPC 17,594 61.6

14
Inventory Capital (Assume 100% Capacity Factor)
60 day supply of fuel 2,526 8.8
60 day supply of non-fuel consumables 616 2.2
0.5% of TPC (Spare Parts) 4,399 15.4
Other Owner's Costs
Initial Cost for Catalyst and Chemicals 1,283 4.5
Land 81 0.3
Finance Cost: 2.7% of TPC 23,752 83.2
Other Owner's Costs 87,972 308.0 TOTAL Owner's Cost 150,973 529
Table 4: Owner's Costs Table
Reference Plant Operating Costs Table 5: Operating Costs and Output Table
Coal Mass Flow 125520 kg/hr Thermal Input (HHV) 714 MW Plant Output (Net) 286 MW Plant Capacity Factor 85 % CO2 Output 216 MT/hr Argon Output 7.14 MT/hr Nitrogen Output 0 MT/hr
O&M Labor - Allam Cycle
Rate
($/hr)
No.
Required
/ Shift
Annual
Cost $
Skilled Operator 62.56 1 465,822
Operator 62.56 3 1,397,465
ASU Operator 62.56 2 931,644
Foreman 62.56 1 465,822
Lab Technician 62.56 1 465,822
3,726,574
O&M Labor - Gasification Plant
Rate
($/hr)
No.
Required
/ Shift
Annual
Cost $
Shift Supervisor 62.56 1 465,822
Board Operators 62.56 3 1,397,465
Field Operators 62.56 3 1,397,465
Lab Technician 62.56 1 465,822
3,726,574

15
Fixed Operating Costs
Initial
Fill Per Day Per Unit Initial Fill Annual Cost
($) ($/MW
h-net)
Annual Operating Labor: 7,453,148 $3.505
Maintenance Labor: 9,229,108 $4.340
Administrative & Support Labor: 4,170,564 $1.961
Property Taxes and Insurance: 17,594,334 $8.274
Fixed Operating Costs Total: 38,447,155 $18.081
Variable Operating Costs
($) ($/MW
h-net)
Maintenance Material: $17,154,476 $8.067
Consumables
Initial
Fill Per Day Per Unit Initial Fill
Water (gal/1000): 172.5 1,684 $1.90 $328 $992,676 $0.47
Makeup and Waste Water
Treatment Chemicals (gal): 0 1000.0 $2.20 $0 $682,550 $0.32
Sulfur-Impregnated Activated
Carbon (ton): 13 0.04 $13,380 $173,940 $147,849 $0.07
COS Hydrolysis Catalyst (ft3): 2389.74 6.55 $338.00 $807,732 $686,572 $0.32
Sulfinol Solution (gal): 18814 12.89 $16.00 $301,024 $63,968 $0.03
Chemicals cost of Merichem (gal) 0 230 $8.59 $0 $612,747
Subtotal: $1,283,024 $3,186,362 $1.50
Waste Disposal
Sulfur-Impregnated Activated
Carbon (ton):
0.0356164
38 $80.00 $0.00 $884.00 $0.00
COS Hydrolysis Catalyst (ft3): 6.5472328
77 $2.50 $0.00 $5,078.20 $0.00
Sulfinol Solution (gal): 12.886301
37 $0.35 $0.00 $1,399.29 $0.00
Crystallizer Solids (ton): 6.7 $38.00 $0.00 $78,989.65 $0.04
Slag (ton): 236.4 $0.00 $0.00 $0.00 $0.00
Subtotal: $0.00 $86,351.14 $0.04
Variable Operating Costs Total: $1,283,024 $20,427,189 $9.61
Fuel Costs
Wyoming subbituminous Coal
(US ton): 0 3,321 12.68 $0.00 $13,063,353 $6.14
Fuel Cost Total: $0.00 $13,063,353 $6.14

16
Flexibility Conditions
The flexibility of Allam Cycle Coal is projected to at least be in-line with NGCC, with the
potential to exceed that performance. Flexible performance targets to match and exceed are:
• The current ramp rate assumes that we are targeting an ability to provide 30 MW - 45
MW of load increase or decrease each minute during warm operation.
• Cold Start Up to reach full load in less than 4 hours assuming that pre-heating systems
have been adequately sized to operate during the ramping period. This is subject to
confirmation in detailed design.
• Turn Down: Zero net load to the grid, enabling low-load operation and rapid dispatch.
• Energy Storage: Approximately 1200 MWH of storage capacity is included as part of the
default ASU design with respect to oxygen buffering. This can be increased with
additional capacity possible with syngas storage or additional O2 tanks for more duration.
• Peaking: Peak from 286 MW up to approximately 325 MW using stored oxygen and
assuming an ASU turndown of 50%.
Minimal O&M impact is expected for the range of these flexibility performance targets. None of
these are projected to require increased maintenance nor to require increased personnel at the
facility. The main impact to cost of this flexibility would be that a decreased capacity factor from
frequent ramping or turn down would increase the levelized cost of energy by spreading the
capital cost and fixed O&M cost across fewer megawatt hours. Due to the high by-product
revenues, initial Allam Cycle Coal plants are expected to run at a high capacity factor, despite
their ability to serve as flexible generators. Further exploration of the cost implications of
flexibility will be done in the Final Report.
Cost of Energy and Sensitivity Analysis
Component Value, $/MWh Percentage
Capital 39.56 53.2%
Fixed 18.08 24.3%
Variable 9.61 12.9%
Fuel 7.12 9.6%
Total (Excluding T&S) 74.36 -
CO2 Transport 2.45
CO2 EOR Revenue - Sales -11.36 -
CO2 EOR Revenue - Pre Tax 45Q for 12 years -19.34 -
Total (Including T&S) 46.11
Argon Revenue -8.27
Nitrogen Revenue 0 -
17
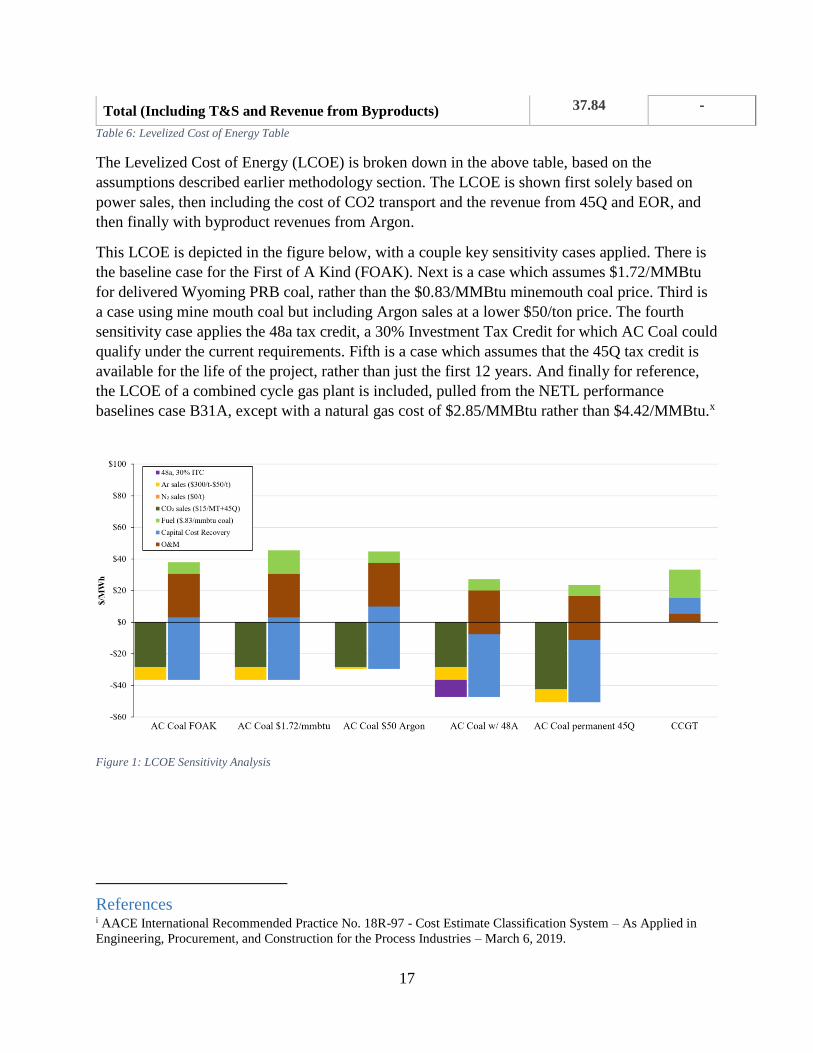
Total (Including T&S and Revenue from Byproducts) 37.84 -
Table 6: Levelized Cost of Energy Table
The Levelized Cost of Energy (LCOE) is broken down in the above table, based on the
assumptions described earlier methodology section. The LCOE is shown first solely based on
power sales, then including the cost of CO2 transport and the revenue from 45Q and EOR, and
then finally with byproduct revenues from Argon.
This LCOE is depicted in the figure below, with a couple key sensitivity cases applied. There is
the baseline case for the First of A Kind (FOAK). Next is a case which assumes $1.72/MMBtu
for delivered Wyoming PRB coal, rather than the $0.83/MMBtu minemouth coal price. Third is
a case using mine mouth coal but including Argon sales at a lower $50/ton price. The fourth
sensitivity case applies the 48a tax credit, a 30% Investment Tax Credit for which AC Coal could
qualify under the current requirements. Fifth is a case which assumes that the 45Q tax credit is
available for the life of the project, rather than just the first 12 years. And finally for reference,
the LCOE of a combined cycle gas plant is included, pulled from the NETL performance
baselines case B31A, except with a natural gas cost of $2.85/MMBtu rather than $4.42/MMBtu.x
Figure 1: LCOE Sensitivity Analysis
References i AACE International Recommended Practice No. 18R-97 - Cost Estimate Classification System – As Applied in
Engineering, Procurement, and Construction for the Process Industries – March 6, 2019.
18
ii NETL Quality Guidelines for Energy System Studies – Cost Estimation Methodology for NETL Assessments of
Power Plant Performance – September 2019. iii NETL Cost and Performance Baseline for Fossil Energy Plants Volume 1: Bituminous Coal and Natural Gas to
Electricity – September 24, 2019. iv AACE International Recommended Practice No. 18R-97 – Conducting the Technical and Economical Evaluations
– As applied for the Process and Utility Industries – April 1, 1991. v Electric Power Research Institute (EPRI), TAGtm - Technical Assessment Guide, Vol.1, Electricity Supply - 1989;
Vol. 2, Electricity End-Use - Part 1, 1987, Parts 2 & 3 vi NETL Performance and Cost Assessment of a natural Gas-Fueled Direct sCO2 Power Plant – March 15, 2019. vii US Energy Information Administration (EIA), Annual Coal Report 2018, October 2019. viii NETL Quality Guidelines for Energy System Studies – Fuel Prices for Selected Feedstocks in NETL Studies –
January 2019. ix https://netl.doe.gov/energy-analysis/details?id=543 x NETL Cost and Performance Baseline for Fossil Energy Plants Volume 1: Bituminous Coal and Natural Gas to
Electricity – September 24, 2019.