Embed Size (px)
Citation preview

RESEARCH Open Access
Reference ranges for cardiac structure andfunction using cardiovascular magneticresonance (CMR) in Caucasians from the UKBiobank population cohortSteffen E. Petersen1*, Nay Aung1, Mihir M. Sanghvi1, Filip Zemrak1, Kenneth Fung1, Jose Miguel Paiva1,Jane M. Francis2, Mohammed Y. Khanji1, Elena Lukaschuk2, Aaron M. Lee1, Valentina Carapella2, Young Jin Kim2,3,Paul Leeson2, Stefan K. Piechnik2 and Stefan Neubauer2
Abstract
Background: Cardiovascular magnetic resonance (CMR) is the gold standard method for the assessment of cardiacstructure and function. Reference ranges permit differentiation between normal and pathological states. To date,this study is the largest to provide CMR specific reference ranges for left ventricular, right ventricular, left atrial andright atrial structure and function derived from truly healthy Caucasian adults aged 45–74.
Methods: Five thousand sixty-five UK Biobank participants underwent CMR using steady-state free precessionimaging at 1.5 Tesla. Manual analysis was performed for all four cardiac chambers. Participants with non-Caucasianethnicity, known cardiovascular disease and other conditions known to affect cardiac chamber size and functionwere excluded. Remaining participants formed the healthy reference cohort; reference ranges were calculated andwere stratified by gender and age (45–54, 55–64, 65–74).
Results: After applying exclusion criteria, 804 (16.2%) participants were available for analysis. Left ventricular (LV)volumes were larger in males compared to females for absolute and indexed values. With advancing age, LVvolumes were mostly smaller in both sexes. LV ejection fraction was significantly greater in females compared tomales (mean ± standard deviation [SD] of 61 ± 5% vs 58 ± 5%) and remained static with age for both genders. Inolder age groups, LV mass was lower in men, but remained virtually unchanged in women. LV mass wassignificantly higher in males compared to females (mean ± SD of 53 ± 9 g/m2 vs 42 ± 7 g/m2). Right ventricular (RV)volumes were significantly larger in males compared to females for absolute and indexed values and were smallerwith advancing age. RV ejection fraction was higher with increasing age in females only. Left atrial (LA) maximalvolume and stroke volume were significantly larger in males compared to females for absolute values but not forindexed values. LA ejection fraction was similar for both sexes. Right atrial (RA) maximal volume was significantlylarger in males for both absolute and indexed values, while RA ejection fraction was significantly higher in females.
Conclusions: We describe age- and sex-specific reference ranges for the left ventricle, right ventricle and atria inthe largest validated normal Caucasian population.
Keywords: Cardiovascular magnetic resonance, Reference values, Ventricular function, Atrial function
* Correspondence: [email protected] Harvey Research Institute, NIHR Cardiovascular Biomedical ResearchUnit at Barts, Queen Mary University of London, Charterhouse Square,London EC1M 6BQ, UKFull list of author information is available at the end of the article
© The Author(s). 2017 Open Access This article is distributed under the terms of the Creative Commons Attribution 4.0International License (http://creativecommons.org/licenses/by/4.0/), which permits unrestricted use, distribution, andreproduction in any medium, provided you give appropriate credit to the original author(s) and the source, provide a link tothe Creative Commons license, and indicate if changes were made. The Creative Commons Public Domain Dedication waiver(http://creativecommons.org/publicdomain/zero/1.0/) applies to the data made available in this article, unless otherwise stated.
Petersen et al. Journal of Cardiovascular Magnetic Resonance (2017) 19:18 DOI 10.1186/s12968-017-0327-9

BackgroundQuantitative assessment of the cardiac chambers isvital for the determination of pathological states incardiovascular disease. Intrinsic to this is knowledgeof reference values for morphological and functionalcardiovascular parameters specific to cardiovascularmagnetic resonance (CMR), the most advanced toolfor imaging the human heart. CMR has rapidlyevolved towards faster and more detailed imagingmethods limiting the generalisability of earlier resultsfrom relatively small studies [1–4]. More recent stud-ies detailing “normal” ranges for CMR are limited byinclusion of individuals with cardiovascular risk fac-tors such as obesity, diabetes and current smokers intheir reference cohort [5, 6].The UK Biobank is amongst the world’s largest
population-based prospective studies, established to in-vestigate the determinants of disease in middle and oldage [7]. In addition to the collection of extensive base-line questionnaire data, biological samples and physicalmeasurements, CMR is utilized to provide cardiovascu-lar imaging-derived phenotypes [8].Based on the UK Biobank participant demographics
and health status in ~5000 consecutive participantsfrom the early phase of CMR [8, 9], we aim to selectvalidated normal healthy Caucasian participants inorder to establish reference values for left ventricular,right ventricular, left atrial and right atrial structureand function.
MethodsStudy populationCMR examinations of 5,065 consecutive UK Biobankparticipants were assessed. Participants with non-Caucasian ethnicity, known cardiovascular disease,hypertension, respiratory disease, diabetes mellitus,hyperlipidaemia, haematological disease, renal disease,rheumatological disease, malignancy, symptoms ofchest pain or dyspnoea, current- or ex-tobaccosmokers, those taking medication for diabetes, hyper-lipidaemia or hypertension and those with BMI≥30 kg/m2 [10] were excluded from the analysis. Inorder to create evenly distributed age-decade groups(45–54, 55–64, 65–74), all participants older than74 years were also excluded from the cohort. (SeeAppendix 1 for the full list of exclusions).
CMR protocolThe full CMR protocol in the UK Biobank has beendescribed in detail elsewhere [9]. In brief, all CMR ex-aminations were performed in Cheadle, United King-dom, on a clinical wide bore 1.5 Tesla scanner(MAGNETOM Aera, Syngo Platform VD13A, Sie-mens Healthcare, Erlangen, Germany).
Assessment of cardiac function was performedbased on combination of several cine series: long axiscines (horizontal long axis – HLA, vertical long axis– VLA, and left ventricular outflow tract –LVOTcines, both sagittal and coronal) and a complete shortaxis stack covering the left ventricle (LV) and rightventricle (RV) were acquired at one slice per breathhold. All acquisitions used balanced steady-state freeprecession (bSSFP) with typical parameters (subject tostandard radiographer changes to planning), as fol-lows: TR/TE = 2.6.1.1 ms, flip angle 80°, Grappa factor2, voxel size 1.8 mm × 1.8 mm × 8 mm (6 mm forlong axis). The actual temporal resolution of 32 mswas interpolated to 50 phases per cardiac cycle(~20 ms). No signal or image filtering was applied be-sides distortion correction.
Image analysisManual analysis of LV, RV, LA and RA were per-formed across two core laboratories based in Londonand Oxford, respectively. Standard operating proce-dures for analysis of each chamber were developedand approved prior to study commencement. CMRscans were analysed using cvi42 post-processing soft-ware (Version 5.1.1, Circle Cardiovascular ImagingInc., Calgary, Canada).In each CMR examination, the end-diastolic phase
was selected as the first phase of the acquisition. Ob-servers selected the end-systolic phase by determiningthe phase in which the LV intra-cavity blood poolwas at its smallest by visual assessment at the mid-ventricular level. LV endocardial and epicardial bor-ders were manually traced in both the end-diastolicand end-systolic phases in the short-axis view. Inboth end-diastole and end-systole, the most basal slicefor the LV was selected when at least 50% of the LVblood pool was surrounded by myocardium. In orderto reduce observer variability, LV papillary muscleswere included as part of LV end-diastolic volume andend-systolic volume, and excluded from LV mass. Asan internal quality control measure, the LV massvalues in both diastole and systole were checked toensure they are almost identical. In cases with signifi-cant discrepancy, the contours were reviewed andcorrected through consensus group approach.For the RV, endocardial borders were manually
traced in end-diastole and end-systole in the shortaxis view. Volumes below the pulmonary valve wereincluded. At the inflow tract, thin-walled structureswithout trabeculations were not included as part ofthe RV. RV end-diastolic and end-systolic phases weredenoted to be the same as those for the LV. LV andRV stroke volumes were checked to ensure they weresimilar.
Petersen et al. Journal of Cardiovascular Magnetic Resonance (2017) 19:18 Page 2 of 19

LA and RA end-diastolic volume, end-systolic vol-ume, stroke volume and ejection fraction were de-rived by manually tracing endocardial LA contours atend-systole (maximal LA area) and end-diastole (min-imal LA area) in the HLA (4-chamber) view. For LA,the same measurements were also derived from theVLA (2-chamber) view and LA volumes were calcu-lated according to the biplane area-length method.Example contours for all four cardiac chambers areprovided in Fig. 1.
Inter-observer and inter-centre quality assuranceaspectsImage analysis was undertaken by a team of eight ob-servers under guidance of three principal investiga-tors. For all cases, analysts filled in progress sheets tomonitor any problems in evaluation of CMR data,with any problematic cases flagged, such as a signifi-cant discrepancy (defined as more than 10% differ-ence). For such flagged cases all contours and imageswere reviewed looking for presence of artefacts orslice location problems, operator error or evidence of
pathology, such as significant shunt or valve regurgi-tation. These cases were discussed in regular inter-centre meetings by teleconferencing with respectivedecisions closed by consensus of at least three teammembers with relevant knowledge. The team includedtwo biomedical engineers, one radiologist, two careerimage analysts and six cardiologists. The qualityassessment outputs were subject to formal ontologicalanalysis [11]. Inter- and intra-observer variability be-tween analysts for atrial and ventricular measure-ments was assessed by analysis of fifty, randomly-selected CMR examinations, repeated after a one-month interval.
Statistical analysisAll data is presented as mean ± standard deviationunless stated otherwise. Continuous variables werevisually assessed for normality using histograms andQ-Q plots. Independent sample Student’s t-test wasused to compare the mean values of CMR parametersbetween men and women. Outliers were defined apriori as CMR measurements more than three
Fig. 1 Examples of ventricular and atrial contours. The above panels are representative of analysis undertaken on each CMR examination. a and bdemonstrate contouring of the left and right ventricle from base to apex at end-diastole and end-systole, respectively. d and e demonstratecontouring of the left and right atrium in the four-chamber view. f and g demonstrate contouring of the left atrium in the two-chamber view
Petersen et al. Journal of Cardiovascular Magnetic Resonance (2017) 19:18 Page 3 of 19

interquartile ranges below the first quartile or abovethe third quartile and removed from analysis. Meanvalues for all cardiac parameters are presented bygender and decade (45–54, 55–64, 65–74). Referenceranges for measured (volume, mass) and derived(ejection fraction) data are defined as the 95% predic-tion interval which is calculated by mean ± t0.975, n-1
(√(n + 1)/n) (standard deviation) [12]. Absolute valueswere indexed to body surface area (BSA) using theDuBois and DuBois formula [13].The normal ranges for the whole cohort (aged 45–
74) were defined as the range where the measuredvalue fell within the 95% prediction interval for thewhole cohort regardless of age decade. The border-line zone was defined as the upper and lower rangeswhere the measured value lay outside the 95% predictioninterval for at least one age group. The abnormal zone wasdefined as the upper and lower ranges where the measuredvalues were outside the 95% prediction interval for any agegroup.
Pearson’s correlation coefficient was used to assessthe impact of age on ventricular and atrial volumesand function. Intra-class correlation coefficients (ICC)were calculated to assess inter- and intra-observervariability, and were visually assessed using Bland-Altman plots [14]. Two-way ICC (2,1) was computedfor inter-observer ICCs, to reflect the fact that a sam-ple of cases and a sample of raters were observed,whilst a one-way ICC (1,1) was computed for intra-observer ICC [15]. A p-value <0.05 was consideredstatistically significant for all tests performed. Statis-tical analysis was performed using R (version 3.3.0)Statistical Software [16].
ResultsA total of 5,065 CMR examinations underwent man-ual image analysis. 90 subjects were excluded as ei-ther the CMR data was of insufficient quality or theCMR identifier did not match the participant identi-fier. Of the remaining 4,975, 804 (16.2%) met the
Fig. 2 Case selection flowchart
Petersen et al. Journal of Cardiovascular Magnetic Resonance (2017) 19:18 Page 4 of 19
inclusion criteria. The breakdown of the number ofparticipants meeting individual exclusion criterion isavailable in Appendix 1. The mean age of the cohortwas 59 ± 7 (range 45–74) years. Upon removing out-liers, a total of 800 participants (368 males, 432females) were included in the ventricular analysisand 795 participants (363 male, 432 female) in theatrial analysis (Fig. 2). Baseline characteristics for allparticipants are provided in Table 1. A summary ofCMR parameters stratified by gender is presented in
Appendix 2, Tables 13 and 14. The association be-tween CMR parameters and age stratified by genderis included in Appendix 2, Tables 14 and 15.CMR left ventricular, right ventricular, left atrial and right
atrial reference ranges are provided in a traffic light formatfor males and females for the whole cohort regardless oftheir age groups for both absolute and indexed values innumerical format (Tables 2, 3, 4 and 5). These tables arealso presented together in a user-friendly poster format forclinical use which is available in Additional file 1. Age-
Table 1 Baseline CharacteristicsAge groups (years)
45-54 55-64 65-74
Number of participants 240 333 231
Age (years) 51 (±2) 59 (±3) 68 (±2)
Male gender (n(%)) 110 (45.8%) 159 (47.7%) 102 (44.2%)
Systolic blood pressure (mmHg) 126 (±14) 133 (±17) 137 (±17)
Diastolic blood pressure (mmHg) 76 (±8) 78 (±9) 77 (±9)
Heart rate (bpm) 67 (±10) 69 (±12) 70 (±11)
Weight (kg) 71 (±13) 71 (±12) 69 (±11)
Height (cm) 171 (±9) 170 (±9) 168 (±9)
Body surface area (m2) 1.82 (±0.20) 1.82 (±0.19) 1.78 (±0.18)
Body mass index (kg/m2) 24.2 (±2.9) 24.4 (±2.7) 24.4 (±2.8)
All continuous values are reported in mean ± standard deviation (SD), while categories are reported as number (percentage)LV left ventricle, RV right ventricle, EDV end-diastolic volume, ESV end-systolic volume, SV stroke volume, EF ejection fraction; indexed, absolute values dividedby body surface area
Table 2 Ventricular reference range for Caucausian men
Abnormal low and high refer to the lower and upper reference limits, respectively. They are defined as measurements which lie outside the 95% predictioninterval at all age groupsaBorderline zone values should be looked up in the age-specific tables. The borderline zone was defined as the upper and lower ranges where the measured valuelay outside the 95% prediction interval for at least one age groupLV left ventricle, RV right ventricle, EDV end-diastolic volume, ESV end-systolic volume, SV stroke volume, EF ejection fraction; indexed, absolute values divided bybody surface area
Petersen et al. Journal of Cardiovascular Magnetic Resonance (2017) 19:18 Page 5 of 19

Table 3 Ventricular reference range for Caucausian women
Abnormal low and high refer to the lower and upper reference limits, respectively. They are defined as measurements which lie outside the 95% predictioninterval at all age groupsaBorderline zone values should be looked up in the age-specific tables. The borderline zone was defined as the upper and lower ranges where the measured valuelay outside the 95% prediction interval for at least one age groupLV left ventricle, RV right ventricle, EDV end-diastolic volume, ESV end-systolic volume, SV stroke volume, EF ejection fraction; indexed, absolute values divided bybody surface area
Table 4 Atrial reference range for Caucausian men
Abnormal low and high refer to the lower and upper reference limits, respectively. They are defined as measurements which lie outside the 95% predictioninterval at all age groupsaBorderline zone values should be looked up in the age-specific tables. The borderline zone was defined as the upper and lower ranges where the measured valuelay outside the 95% prediction interval for at least one age groupLA left atrium, RA right atrium, SV stroke volume, EF ejection fraction, 2Ch two-chamber, 4Ch four-chamber, Biplane derived from four-chamber and two-chamberviews; indexed, absolute values divided by body surface area
Petersen et al. Journal of Cardiovascular Magnetic Resonance (2017) 19:18 Page 6 of 19

specific reference ranges are also provided in ‘look-up’tables for those measured CMR values in the borderline(yellow) zone. (Tables 6, 7, 8, 9)
Left ventricleLV end-diastolic volume and LV end-systolic volume weresignificantly larger in males (LV EDV: absolute = 166 ±32 ml, indexed = 85 ± 15 ml; LV ESV: absolute = 69 ± 16 ml,indexed = 36 ± 8 ml) compared to females (LV EDV: abso-lute = 124 ± 21 ml, indexed = 74 ± 12 ml; LV ESV: abso-lute = 49 ± 11 ml, indexed = 29 ± 6 ml) for both absoluteand indexed values. (Appendix 2, Table 12) In men, LVend-diastolic volumes and stroke volumes were lower witholder age for both absolute and indexed values. (Appendix2, Table 14) In women, LV end-diastolic volume, end-systolic volume and stroke volume were smaller with ad-vancing age for absolute and indexed values. LV ejectionfraction was significantly greater in females (61 ± 5%)compared to males (58 ± 5%). LV ejection fraction demon-strated no correlation with age in neither males nor fe-males. LV mass was significantly higher in males (103 ±21 g) compared to females (70 ± 13 g). Uponnormalization for body surface area, LV mass did notchange significantly with age in either gender. In females,LV mass to end-diastolic volume ratio, a measure of dis-tinct patterns of anatomical adaptations [17], increased
significantly (r = 0.14, p <0.01) with age; this was notdemonstrated in males.
Right ventricleRV end-diastolic volume and RV end-systolic volumewere significantly larger in males (RV EDV: absolute= 182 ± 36 ml, indexed = 93 ± 17 ml; RV ESV: absolute= 85 ± 22 ml, indexed = 43 ± 11 ml) compared tofemales (RV EDV: absolute = 130 ± 24 ml, indexed =77 ± 13 ml; RV ESV: absolute = 55 ± 15 ml, indexed =33 ± 9 ml) for both absolute and indexed values. BothRV end-diastolic volume and end-systolic volumewere lower in older age groups in males and femalesfor absolute and indexed values. RV ejection fractionwas significantly higher in females (58 ± 6%) comparedto males (54 ± 6%). RV ejection fraction demonstrateda weak but significant positive correlation with advan-cing age in females only (r = 0.1, p < 0.05).
Left and right atriaLeft and right atrial reference ranges are presented in Ta-bles 4, 5, 8 and 9. LA maximal volume and stroke volume,as determined by the biplane method, were significantlylarger in males compared to females for absolute values (71 ±19 vs 62 ± 17 ml) but not for BSA-indexed values (36 ± 9 vs37 ± 10 ml). LA ejection fraction was almost identical (60% vs
Table 5 Atrial reference range for Caucausian women
Abnormal low and high refer to the lower and upper reference limits, respectively. They are defined as measurements which lie outside the 95% predictioninterval at all age groupsaBorderline zone values should be looked up in the age-specific tables. The borderline zone was defined as the upper and lower ranges where the measured valuelay outside the 95% prediction interval for at least one age groupLA left atrium, RA right atrium, SV stroke volume, EF ejection fraction, 2Ch two-chamber, 4Ch four-chamber, Biplane derived from four-chamber and two-chamberviews; indexed, absolute values divided by body surface area
Petersen et al. Journal of Cardiovascular Magnetic Resonance (2017) 19:18 Page 7 of 19

61%) in males and females. Upon normalization for BSA,there was no change in left atrial volumes or function with agein men. In women, indexed LA stroke volume was signifi-cantly lower (r = −0.2, p < 0.001) with advancing age.RA maximal volume and stroke volume were significantly
larger in males (RA absolute maximal volume = 93 ± 27 ml,RA absolute stroke volume = 38 ± 14 ml) compared to fe-males (RA absolute maximal volume = 69 ± 17 ml, RA ab-solute stroke volume = 32 ± 10 ml) for absolute values;upon indexing for BSA, this effect was seen for RA max-imal volume only (48 ± 14 vs 41 ± 10 ml). RA ejection frac-tion was significantly higher (46% vs 41%, p < 0.001) infemales compared to males. Upon normalization for BSA,there was no change in right atrial volumes or functionwith age in males or females.
Intra- and inter-observer variabilityIntra and inter-observer variability data is presented inTable 10 and as Bland-Altman plots (representative exam-ples of all observers) in Appendix 3, Figures 3, 4 and 5.
Good to excellent intra- and inter-observer variability wasachieved for LV and RV end-diastolic volume, end-systolicvolume and stroke volume and LA and RA maximal vol-ume and stroke volume.
DiscussionThe present study provides clinically relevant age- andgender-specific CMR reference ranges in a traffic light sys-tem for the left ventricular, right ventricular, left atrial andright atrial chambers derived from a cohort of 804 Cauca-sian adults aged 45–74 strictly free from pathophysio-logical or environmental risk factors affecting cardiacstructure or function at 1.5 Tesla.Whilst determination of reference ranges for CMR has
been performed by several previous studies, this work is novelfor a number or reasons. Firstly, the substantially larger co-hort with strict evidence to ensure participants are free ofbiological or environmental factors known to impact uponcardiac structure or function differentiates this study from itspredecessors. Secondly, reference ranges for CMR parameters
Table 6 Age-specific ventricular reference ranges for Caucausian men
Male left and right atrial reference ranges detailing mean, lower reference limit and upper reference limit by age group. Reference limits are derived by the upperand lower bounds of the 95% prediction interval for each parameter at each age groupLV left ventricle, RV right ventricle, EDV end-diastolic volume, ESV end-systolic volume, SV stroke volume, EF ejection fraction; indexed, absolute values divided bybody surface area
Petersen et al. Journal of Cardiovascular Magnetic Resonance (2017) 19:18 Page 8 of 19
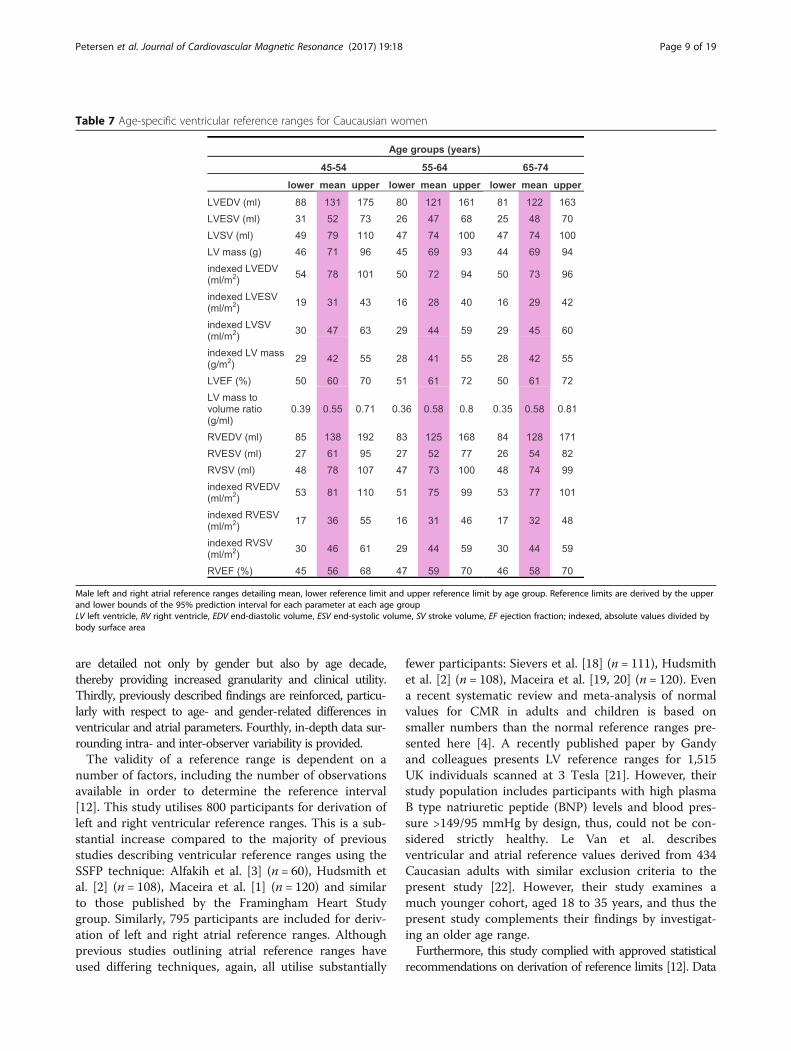
are detailed not only by gender but also by age decade,thereby providing increased granularity and clinical utility.Thirdly, previously described findings are reinforced, particu-larly with respect to age- and gender-related differences inventricular and atrial parameters. Fourthly, in-depth data sur-rounding intra- and inter-observer variability is provided.The validity of a reference range is dependent on a
number of factors, including the number of observationsavailable in order to determine the reference interval[12]. This study utilises 800 participants for derivation ofleft and right ventricular reference ranges. This is a sub-stantial increase compared to the majority of previousstudies describing ventricular reference ranges using theSSFP technique: Alfakih et al. [3] (n = 60), Hudsmith etal. [2] (n = 108), Maceira et al. [1] (n = 120) and similarto those published by the Framingham Heart Studygroup. Similarly, 795 participants are included for deriv-ation of left and right atrial reference ranges. Althoughprevious studies outlining atrial reference ranges haveused differing techniques, again, all utilise substantially
fewer participants: Sievers et al. [18] (n = 111), Hudsmithet al. [2] (n = 108), Maceira et al. [19, 20] (n = 120). Evena recent systematic review and meta-analysis of normalvalues for CMR in adults and children is based onsmaller numbers than the normal reference ranges pre-sented here [4]. A recently published paper by Gandyand colleagues presents LV reference ranges for 1,515UK individuals scanned at 3 Tesla [21]. However, theirstudy population includes participants with high plasmaB type natriuretic peptide (BNP) levels and blood pres-sure >149/95 mmHg by design, thus, could not be con-sidered strictly healthy. Le Van et al. describesventricular and atrial reference values derived from 434Caucasian adults with similar exclusion criteria to thepresent study [22]. However, their study examines amuch younger cohort, aged 18 to 35 years, and thus thepresent study complements their findings by investigat-ing an older age range.Furthermore, this study complied with approved statistical
recommendations on derivation of reference limits [12]. Data
Table 7 Age-specific ventricular reference ranges for Caucausian women
Male left and right atrial reference ranges detailing mean, lower reference limit and upper reference limit by age group. Reference limits are derived by the upperand lower bounds of the 95% prediction interval for each parameter at each age groupLV left ventricle, RV right ventricle, EDV end-diastolic volume, ESV end-systolic volume, SV stroke volume, EF ejection fraction; indexed, absolute values divided bybody surface area
Petersen et al. Journal of Cardiovascular Magnetic Resonance (2017) 19:18 Page 9 of 19

has been partitioned – dividing reference values by age and sex– in order to reduce variation. The distribution of the referencevalues was inspected and assessed for normality and valuesidentified as outliers discarded as per oura priori definition.A total of 5,065 CMR examinations of UK Biobank
participants were analysed for this study. Utilising thislarge population sample permitted a posteriori (retro-spective) selection of the reference sample, the preferredmethod when compiling reference values from healthyindividuals [23]. Indeed, only 16% of the original samplewere included in this study, with rule-out criteria ex-tending beyond known cardiovascular disease to includetraditional cardiovascular risk factors (diabetes mellitus,hypercholesterolaemia, hypertension, current- and ex-tobacco smokers, obesity), cardiovascular symptoms,current or previous cancer, stroke, respiratory, renal orhaematological disease and use of certain pharmaco-logical agents. In doing so, a robust definition of whatconstitutes “health” was created, permitting confidencethat reference ranges for cardiovascular structure and
function in CMR have been derived from an appropri-ately selected cohort. This contrasts to the LV referencevalues published from the Framingham Heart Study Off-spring Cohort where the healthy reference group con-sisted of 47.5% of the total cohort, and exclusion criteriawere a history of hypertension, history of use of antihy-pertensive medication, previous myocardial infarctionand heart failure only. Similarly, in the RV referencevalues study published by the same group, the “healthyreference” cohort included participants with hyperten-sion, diabetes, hypercholesterolaemia and those whowere current tobacco smokers [6].For the left ventricle, our findings that men demon-
strated greater volumes and mass compared to femalesis consistent with both the CMR literature [4] and thatderived from other imaging modalities [24, 25]. Ourdemonstration of decreasing LV end-diastolic and end-systolic volumes with advancing age is also consistentwith previous findings. Values for LV end-diastolic vol-umes are similar to those described by Hudsmith [2],
Table 8 Age-specific atrial reference ranges for Caucausian men
Male left and right atrial reference ranges detailing mean, lower reference limit and upper reference limit by age group. Reference limits are derived by the upperand lower bounds of the 95% prediction interval for each parameter at each age groupLA left atrium, RA right atrium, SV stroke volume, EF ejection fraction, 2Ch two-chamber, 4Ch four-chamber, Biplane derived from four-chamber and two-chamberviews; indexed, absolute values divided by body surface area
Petersen et al. Journal of Cardiovascular Magnetic Resonance (2017) 19:18 Page 10 of 19

Kawel-Boehm [4] and the Framingham Offspring Cohortgroup. LV end-systolic volumes were larger, reflectingthis study’s methodology of including papillary musclesas part of the LV cavity – the technique most commonlyemployed when analysing clinical CMR examinations.Consequently, LV ejection fraction mean values and ref-erence intervals were lower than previously reported.Despite this, the finding of a marginally, but signifi-cantly, lower LV ejection fraction in men compared towomen is consistent with other large cohorts, includingthe Framingham Offspring Cohort, the Dallas HeartStudy cohort [26] and the Multi-Ethnic Study of Athero-sclerosis (MESA) cohort [27], although the latter twostudies utilised the older gradient-recalled echo sequences.Our study demonstrated no change in LV ejection fractionacross age groups, this is consistent with studies acrossimaging modalities [28, 29]. LV mass, upon normalizationfor BSA, did not change significantly across age groups ineither gender. This is consistent with findings from theMESA cohort, but differs from the Framingham Offspring
cohort which demonstrated a significant decrease in BSA-normalised LV mass with age. Autopsy-derived data con-cerning LV mass in individuals free from hypertensionand coronary artery disease and corrected for BSA corrob-orate findings from our study, suggesting no change incardiac mass with ageing [30].For the right ventricle, our findings that males exhib-
ited greater absolute and indexed volumes than femalesand that volumes were lower with advancing age in bothgenders are consistent with previously published litera-ture. We demonstrated a larger RV ejection fraction inwomen compared to men, this is corroborated by Alfa-kih [3] using both SSFP and gradient-recalled echo se-quences and by Foppa and Arora in the FraminghamOffspring cohort [6].For the atrial chambers, no consensus exists regarding
the measurement of atrial volumes [4]. In this study, theLA was contoured in the 4-chamber and 2-chamberviews and volumes calculated according to the biplanearea-length method. Only Hudsmith presented LA
Table 9 Age-specific atrial reference ranges for Caucausian women
Male left and right atrial reference ranges detailing mean, lower reference limit and upper reference limit by age group. Reference limits are derived by the upperand lower bounds of the 95% prediction interval for each parameter at each age groupLA left atrium, RA right atrium, SV stroke volume, EF ejection fraction, 2Ch two-chamber, 4Ch four-chamber, Biplane derived from four-chamber and two-chamberviews; indexed, absolute values divided by body surface area
Petersen et al. Journal of Cardiovascular Magnetic Resonance (2017) 19:18 Page 11 of 19

reference ranges utilising a similar method with valuesfor LA ejection fraction being almost identical to thosedescribed in this study. For the RA, the most recentwork regarding reference ranges has been produced byMaceira et al. [20] using three-dimensional modellingwhich has not been undertaken in this study. Despitedifferent methodology, general findings regarding abso-lute values being greater in males compared to femalesand no significant effect of age on RA volumes werereplicated in our larger study.
Clinical utilityCMR measurements only provide meaningful infor-mation when compared to relevant reference values.However, comparison may be misleading if the CMRexamination being considered does not adequatelymatch the reference sample, particularly with regardsto age and gender. It is known that cardiovasculardisease predominantly affects individuals in middle-and old-age, and it is individuals in these age groupswho most commonly undergo CMR examinations.Furthermore, atrial and ventricular structure andfunction do not remain static over time and undergochanges with age, even in those without evidence of
cardiovascular disease. It is in this context that thisstudy presents absolute and BSA-indexed CMR refer-ence values for men and women at three differentage groups: 45–54, 55–64 and 65–74.
Intra- and inter-observer variabilityFor LV and RV end-diastolic volume, end-systolicvolume and stroke volume and LA and RA maximalvolume and stroke volume, excellent inter- andintra-observer variability was achieved. It is notable,but perhaps not unsurprising, that ICC for derivedparameters (i.e. ejection fraction) fell in comparisonto those values for directly measured parameters. Thisis consistent with previous studies examining variabil-ity in CMR analysis, such as Margossian et al. [31]and Teo et al. [32], which reported very high inter-observer ICC’s for measured parameters which fellmarkedly when assessing the ejection fraction.
Study limitationsThe reference intervals described were derived from apopulation of 45–74 year olds of Caucasian ethnicity andtherefore may not be generalisable to other ethnic and agegroups. As the UK Biobank Imaging project accumulatesCMR imaging in up to 100,000 individuals in coming years,analysis of ethnicity effects will become feasible in duecourse. We included overweight participants with a BMIbetween 25 and 30 kg/m2 in our reference range analysis,even though previous CMR publications, including ourown, have shown that obesity affects cardiac structure andfunction even in an otherwise healthy population [33, 34].Our rationale for this inclusion was two-fold: firstly, wealigned our inclusion criteria related to BMI with the “Rec-ommendations for Cardiac Chamber Quantification byEchocardiography in Adults: An Update from the AmericanSociety of Echocardiography and the European Associationof Cardiovascular Imaging” [10]; secondly, given that 2013data from the UK demonstrates that only 32.9% of men and42.8% of women had a BMI less than 25 kg/m2, arguablyour reference ranges represent the “new” normal range andare thus more applicable to the general population [35].CMR examinations were not performed repeatedly
on the same individuals over time, therefore theassociations described between age and CMRparameters are not longitudinal, but rather cross-sectional.
ConclusionsThis study provides normal reference ranges for all fourcardiac chambers derived from the largest healthy co-hort of Caucasian adults and will provide utility in theanalysis of CMR examinations in both clinical andresearch settings.
Table 10 Inter- and intra-observer variability
Inter-observerICC*
Intra-observerICC rangea
Ventricle
LVEDV 0.97 0.98-1.00
LVESV 0.88 0.95-0.97
LVSV 0.92 0.91-0.98
LVEF 0.71 0.80-0.92
LV mass 0.92 0.97-0.97
LV mass to volume ratio 0.92 0.79-0.97
RVEDV 0.92 0.98-0.99
RVESV 0.77 0.90-0.97
RVSV 0.89 0.93-0.98
RVEF 0.64 0.78-0.95
Atrium
Maximal LA volume 0.96 0.97-0.98
LASV 0.90 0.90-0.96
LAEF 0.64 0.75-0.93
Maximal RA volume 0.96 0.97-0.99
RASV 0.86 0.92-0.94
RAEF 0.75 0.84-0.88
ICC Intra-class correlation coefficient, LV left ventricle, RV right ventricle, EDVend-diastolic volume, ESV end-systolic volume, SV stroke volume, EF ejectionfraction, LA left atrium, RA right atrium*p-value < 0.001aRange of all observers, p-value < 0.001
Petersen et al. Journal of Cardiovascular Magnetic Resonance (2017) 19:18 Page 12 of 19

Appendix 1
Table 11 Exclusion criteria
Number (%)
Age
> 74 years 119 (2%)
Medical conditions
Hypertension 1382 (28%)
High cholesterol 787 (16%)
Asthma 628 (13%)
Hypothyroidism/myxoedema 322 (6%)
Diabetes 204 (4%)
Essential hypertension 130 (3%)
Angina 127 (3%)
Heart attack/myocardial infarction 104 (2%)
Deep venous thrombosis (DVT) 87 (2%)
Type 2 diabetes 83 (2%)
Atrial fibrillation 65 (1%)
Rheumatoid arthritis 58 (1%)
Stroke 58 (1%)
Emphysema/chronic bronchitis 56 (1%)
Hyperthyroidism/thyrotoxicosis 44 (1%)
Heart valve problem/heart murmur 42 (1%)
Transient ischaemic attack (TIA) 39 (1%)
Chronic obstructive airways disease/COPD 39 (1%)
Pulmonary embolism +/− DVT 38 (1%)
Iron deficiency anaemia 33 (1%)
Ulcerative colitis 31 (1%)
Heart arrhythmia 31 (1%)
Heart/cardiac problem 31 (1%)
Sleep apnoea 28 (1%)
Polymyalgia rheumatica 28 (1%)
Miscarriage 22 (0%)
Irregular heart beat 21 (0%)
Gestational hypertension/pre-eclampsia 20 (0%)
Doctor diagnosed bronchiectasis_Yes 18 (0%)
Anaemia 18 (0%)
Ankylosing spondylitis 18 (0%)
Rheumatic fever 16 (0%)
Sarcoidosis 15 (0%)
Peripheral vascular disease 14 (0%)
Bronchiectasis 14 (0%)
Diabetic eye disease 14 (0%)
Crohns disease 13 (0%)
Pernicious anaemia 11 (0%)
Gestational diabetes only_Yes 9 (0%)
Clotting disorder/excessive bleeding 9 (0%)
Table 11 Exclusion criteria (Continued)
SVT / supraventricular tachycardia 9 (0%)
Other respiratory problems 8 (0%)
Sjogren’s syndrome/sicca syndrome 8 (0%)
Systemic lupus erythematosis/SLE 8 (0%)
Renal/kidney failure 8 (0%)
Low platelets/platelet disorder 7 (0%)
Type 1 diabetes 7 (0%)
Grave’s disease 6 (0%)
Heart failure/pulmonary edema 6 (0%)
Gestational diabetes 5 (0%)
Hereditary/genetic haematological disorder 5 (0%)
Cardiomyopathy 5 (0%)
Hyperparathyroidism 5 (0%)
Nephritis 5 (0%)
Haemochromatosis 5 (0%)
Connective tissue disorder 4 (0%)
Renal failure not requiring dialysis 4 (0%)
Polycythaemia vera 4 (0%)
Neutropenia/lymphopenia 4 (0%)
Anorexia/bulimia/other eating disorder 4 (0%)
Surgery/amputation of toe or leg_Do not know 4 (0%)
Lymphoedema 4 (0%)
Aortic stenosis 4 (0%)
Retinal artery/vein occlusion 4 (0%)
Inflammatory bowel disease 3 (0%)
Adrenocortical insufficiency/Addison’s disease 3 (0%)
Hyperprolactinaemia 3 (0%)
Surgery/amputation of toe or leg_Yes, toes 3 (0%)
Atrial flutter 3 (0%)
Mitral regurgitation/incompetence 3 (0%)
Pericarditis 3 (0%)
Hypertrophic cardiomyopathy (HCM / HOCM) 3 (0%)
Emphysema 3 (0%)
Kidney nephropathy 3 (0%)
Myocarditis 2 (0%)
Liver failure/cirrhosis 2 (0%)
Diabetic neuropathy/ulcers 2 (0%)
Leg claudication/intermittent claudication 2 (0%)
Mitral valve disease 2 (0%)
Mitral valve prolapse 2 (0%)
Monoclonal gammopathy/not myeloma 2 (0%)
Glomerulnephritis 1 (0%)
Haemophilia 1 (0%)
Vasculitis 1 (0%)
Wegners granulmatosis 1 (0%)
Sickle cell disease 1 (0%)
Petersen et al. Journal of Cardiovascular Magnetic Resonance (2017) 19:18 Page 13 of 19

Appendix 2
Table 11 Exclusion criteria (Continued)
Microscopic polyarteritis 1 (0%)
Myositis/myopathy 1 (0%)
Pericardial problem 1 (0%)
Pleural plaques (not known asbestosis) 1 (0%)
Hyperaldosteronism/Conn’s syndrome 1 (0%)
Polymyositis 1 (0%)
Hypopituitarism 1 (0%)
Interstitial lung disease 1 (0%)
Alcoholic liver disease/alcoholic cirrhosis 1 (0%)
Antiphospholipid syndrome 1 (0%)
Aortic aneurysm 1 (0%)
Aortic regurgitation/incompetence 1 (0%)
Aplastic anaemia 1 (0%)
Diabetes insipidus 1 (0%)
Fibrosing alveolitis/unspecified alveolitis 1 (0%)
Giant cell/temporal arteritis 1 (0%)
Iga nephropathy 1 (0%)
Myeloproliferative disorder 1 (0%)
Pericardial effusion 1 (0%)
Pleural effusion 1 (0%)
Respiratory failure 1 (0%)
Sick sinus syndrome 1 (0%)
Wolff parkinson white/WPW syndrome 1 (0%)
Surgery/amputation of toe or leg_Yes, leg above the knee 1 (0%)
Surgery/amputation of toe or leg_Yes, leg below the knee 1 (0%)
Medications
Cholesterol lowering medication 784 (16%)
Blood pressure medication 705 (14%)
Hormone replacement therapy 331 (7%)
Insulin 15 (0%)
Symptoms
Chest pain due to walking ceases when standingstill_Yes
264 (5%)
Chest pain or discomfort when walking uphillor hurrying_Yes
229 (5%)
Chest pain or discomfort when walking uphillor hurrying_Unable to walk up hills or to hurry
20 (0%)
Chest pain due to walking ceases when standingstill_Do not know
17 (0%)
Chest pain or discomfort when walking uphillor hurrying_Prefer not to answer
2 (0%)
Shortness of breath walking on level ground_Yes 386 (8%)
Shortness of breath walking on level ground_Do not know 76 (2%)
Shortness of breath walking on level ground_Prefer notto answer
5 (0%)
Smoking history
Ex-smoker 1896 (38%)
Current smoker 355 (7%)
Table 11 Exclusion criteria (Continued)
High body mass index
BMI ≥ 30 1158 (23%)
Ethnicity
Other ethnic group 30 (1%)
Indian 29 (1%)
Pakistani 19 (0%)
Caribbean 19 (0%)
Chinese 17 (0%)
Prefer not to answer 17 (0%)
African 16 (0%)
Any other mixed background 15 (0%)
Any other Asian background 12 (0%)
White and Black Caribbean 8 (0%)
White and Asian 7 (0%)
White and Black African 5 (0%)
Bangladeshi 2 (0%)
Do not know 2 (0%)
Any other Black background 1 (0%)
Asian or Asian British 1 (0%)
N.B. Criteria listed are not mutually exclusive
Table 12 Ventricular parameters stratified by gender
All Males Females
Number 800 368 432
LVEDV (ml) 143 ± 34 166 ± 32 124 ± 21
LVESV (ml) 58 ± 17 69 ± 16 49 ± 11
LVSV (ml) 85 ± 20 96 ± 20 75 ± 14
LV mass (g) 85 ± 24 103 ± 21 70 ± 13
indexed LVEDV (ml/m2) 79 ± 14 85 ± 15 74 ± 12
indexed LVESV (ml/m2) 32 ± 8 36 ± 8 29 ± 6
indexed LVSV (ml/m2) 47 ± 9 49 ± 10 45 ± 8
indexed LV mass (g/m2) 47 ± 10 53 ± 9 42 ± 7
LVEF (%) 60 ± 6 58 ± 5 61 ± 5
LV mass to volume ratio (g/ml) 0.60 ± 0.11 0.63 ± 0.11 0.57 ± 0.11
RVEDV (ml) 154 ± 40 182 ± 36 130 ± 24
RVESV (ml) 69 ± 24 85 ± 22 55 ± 15
RVSV (ml) 85 ± 20 97 ± 20 75 ± 14
indexed RVEDV (ml/m2) 85 ± 17 93 ± 17 77 ± 13
indexed RVESV (ml/m2) 38 ± 11 43 ± 11 33 ± 9
indexed RVSV (ml/m2) 47 ± 9 50 ± 9 45 ± 8
RVEF (%) 56 ± 6 54 ± 6 58 ± 6
The data are presented in mean ± SD. The independent sample t-test’s p-valuewas <0.0001 for all parametersLV, left ventricle; RV, right ventricle; EDV, end-diastolic volume; ESV, end-systolicvolume; SV, stroke volume; EF, ejection fraction; indexed, absolute values dividedby body surface area
Petersen et al. Journal of Cardiovascular Magnetic Resonance (2017) 19:18 Page 14 of 19

Table 13 Atrial parameters stratified by gender
All Males Females
Number 795 363 432
Maximal LA volume (2Ch) (ml)* 61 ± 20 66 ± 20 57 ± 18
Maximal LA volume (4Ch) (ml)* 74 ± 22 78 ± 23 70 ± 21
Maximal LA volume (Biplane) (ml)* 66 ± 19 71 ± 19 62 ± 17
LA SV (Biplane) (ml)* 40 ± 11 42 ± 11 37 ± 10
indexed Maximal LA volume (2Ch) (ml) 34 ± 10 34 ± 10 34 ± 10
indexed Maximal LA volume (4Ch) (ml) 41 ± 12 40 ± 12 42 ± 12
indexed Maximal LA volume (Biplane) (ml) 37 ± 10 36 ± 9 37 ± 10
indexed LA SV (Biplane) (ml) 22 ± 6 22 ± 6 22 ± 6
LA EF (Biplane) (%) 60 ± 7 60 ± 7 61 ± 7
Maximal RA volume (4Ch) (ml)* 80 ± 25 93 ± 27 69 ± 17
RA SV (4Ch) (ml)* 35 ± 13 38 ± 14 32 ± 10
indexed Maximal RA volume (4Ch) (ml)* 44 ± 12 48 ± 14 41 ± 10
indexed RA SV (4Ch) (ml) 19 ± 7 20 ± 7 19 ± 6
RA EF (4Ch) (%)* 44 ± 10 41 ± 9 46 ± 9
The data are presented in mean ± SD. *p-value < 0.0001LA, left atrium; RA, right atrium; SV, stroke volume; EF, ejection fraction; 2Ch, two-chamber; 4Ch, four-chamber; Biplane, derived from four-chamber and two-chamber views; indexed, absolute values divided by body surface area
Table 14 Correlation table for ventricular parameters with age
Males Females
ra Level of significance ra Level of
Significance
LVEDV −0.19 **** −0.19 ****
LVESV −0.14 ** −0.16 **
LVSV −0.18 **** −0.16 **
LV mass −0.13 * −0.04
indexed LVEDV −0.13 * −0.15 **
indexed LVESV −0.09 −0.13 *
indexed LVSV −0.12 * −0.12 *
indexed LV mass −0.07 0.01
LVEF −0.02 0.03
LV mass to volume ratio 0.06 0.14 **
RVEDV −0.21 **** −0.18 ****
RVESV −0.18 **** −0.18 ****
RVSV −0.19 **** −0.12 *
indexed RVEDV −0.16 ** −0.15 **
indexed RVESV −0.14 ** −0.16 **
indexed RVSV −0.13 * −0.08
RVEF 0.06 0.11 *
**** p < 0.001; *** p < 0.001; ** p < 0.01; * p < 0.05aPearson correlation coefficientLV, left ventricle; RV, right ventricle; EDV, end-diastolic volume; ESV, end-systolic volume; SV, stroke volume; EF, ejection fraction; indexed, absolute values dividedby body surface area
Petersen et al. Journal of Cardiovascular Magnetic Resonance (2017) 19:18 Page 15 of 19

Appendix 3
Table 15 Correlation table for atrial parameters with age
Males Females
ra Level of significance ra Level of significance
Maximal LA volume (2Ch) −0.11 * −0.11 *
Maximal LA volume (4Ch) −0.1 −0.14 **
Maximal LA volume (Biplane) −0.11 * −0.14 **
LA SV (Biplane) −0.12 * −0.23 ****
indexed Maximal LA volume (2Ch) −0.07 −0.08
indexed Maximal LA volume (4Ch) −0.05 −0.11 *
indexed Maximal LA volume (Biplane) −0.06 −0.11 *
indexed LA SV (Biplane) −0.07 −0.2 ****
LA EF (Biplane) −0.01 −0.15 **
Maximal RA volume (4Ch) 0.01 0
RA SV (4Ch) 0 −0.06
indexed Maximal RA volume (4Ch) 0.06 0.04
indexed RA SV (4Ch) 0.04 −0.03
RA EF (4Ch) 0.01 −0.11 *
**** p < 0.001; *** p < 0.001; ** p < 0 .01; * p < 0.05aPearson correlation coefficientLA, left atrium; RA, right atrium; SV, stroke volume; EF, ejection fraction; 2Ch, two-chamber; 4Ch, four-chamber; Biplane, derived from four-chamber and two-chamberviews; indexed, absolute values divided by body surface area
Fig. 3 Exemplar Bland-Altman plots for inter- and intra-observer variability of left ventricular parameters
Petersen et al. Journal of Cardiovascular Magnetic Resonance (2017) 19:18 Page 16 of 19

Fig. 4 Exemplar Bland-Altman plots for inter- and intra-observer variability of right ventricular parameters
Fig. 5 Exemplar Bland-Altman plots for inter- and intra-observer variability of atrial parameters
Petersen et al. Journal of Cardiovascular Magnetic Resonance (2017) 19:18 Page 17 of 19

Appendix 4UK Biobank dataUK Biobank data in a codified tabular format, receivedthrough our access application, was used to select thehealthy cohort. Data was translated, using the datadictionary provided as part of the application and thecoding tables available through the UK Biobank website,into a self-contained table which we used to perform theanalysis. The data derived from the analysis of CMRstudies were tested for gross errors such as non-physiological values (e.g., end-systolic volume larger thanend-diastolic volume) and were removed from the finaldataset.
Additional file
Additional file 1: Supplementary materials. (PDF 475 kb)
Abbreviations[b]SSFP: [Balanced] steady state free precession; BMI: Body mass index;BSA: Body surface area; CMR: Cardiovascular magnetic resonance;HLA: Horizontal long axis; ICC: Intra-class correlation coefficient; LA: Left atrium;LV: Left ventricle; LVOT: Left ventricular outflow tract; MESA: Multi-Ethnic Studyof Atherosclerosis; RA: Right atrium; RV: Right ventricle; SD: Standard deviation;TE: Echo time; TR: Repetition time; VLA: Vertical long axis
AcknowledgementsNot applicable.
FundingSEP was directly funded by the National Institute for Health ResearchCardiovascular Biomedical Research Unit at Barts. SN and SKP are supportedby the Oxford NIHR Biomedical Research Centre and the Oxford British HeartFoundation Centre of Research Excellence. SEP, SN and SKP acknowledgethe British Heart Foundation (BHF) for funding the manual analysis to createa cardiovascular magnetic resonance imaging reference standard for the UKBiobank imaging resource in 5000 CMR scans (PG/14/89/31194).
Availability of data and materialsThis research has been conducted using the UK Biobank resource (seeAppendix 4). The raw data, the derived data, the analysis and results will beclearly annotated and returned to UK Biobank, which will then incorporate thereturned data into the central repository. UK Biobank will make the dataavailable to all bona fide researchers for all types of health-related research thatis in the public interest, without preferential or exclusive access for any person.All researchers will be subject to the same application process and approval cri-teria as specified by UK Biobank. Please see UK Biobank website for the detailedaccess procedure (http://www.ukbiobank.ac.uk/register-apply/).
Authors’ contributionsThe study was conceived and designed by SEP, SP and SN. EL, JMJP, NA,MMS, KF, VC, YJK performed the image analysis. VC, NA and AL performedthe final data analysis. MMS, NA and SEP drafted the manuscript, all authorscommented on the manuscript and approved the final version of themanuscript.
Competing interestsSEP provides consultancy to Circle Cardiovascular Imaging Inc, Calgary,Canada. The other authors declare that they have no competing interests.
Consent for publicationAll participants in this study gave written consent to participate and topublish as part of the UK Biobank recruitment process.
Ethics approval and consent to participateUK Biobank’s project has been approved by National Research Ethics ServiceNorth West (11/NW/0382).
Author details1William Harvey Research Institute, NIHR Cardiovascular Biomedical ResearchUnit at Barts, Queen Mary University of London, Charterhouse Square,London EC1M 6BQ, UK. 2Division of Cardiovascular Medicine, RadcliffeDepartment of Medicine, University of Oxford, Level 6, West Wing, JohnRadcliffe Hospital, Headington, Oxford OX3 9DU, UK. 3Department ofRadiology, Severance Hospital, Yonsei University College of Medicine, 50-1Yonsei-ro, Seodaemun-gu, Seoul 03722, South Korea.
Received: 8 October 2016 Accepted: 14 January 2017
References1. Maceira AM, Prasad SK, Khan M, Pennell DJ. Normalized left ventricular
systolic and diastolic function by steady state free precession cardiovascularmagnetic resonance. J Cardiovasc Magn Reson. 2006;8:417–26.
2. Hudsmith L, Petersen S, Francis J, Robson M, Neubauer S. Normal human left andright ventricular and left atrial dimensions using steady state free precessionmagnetic resonance imaging. J Cardiovasc Magn Reson. 2005;7:775–82.
3. Alfakih K, Plein S, Thiele H, Jones T, Ridgway JP, Sivananthan MU. Normalhuman left and right ventricular dimensions for MRI as assessed by turbogradient echo and steady-state free precession imaging sequences. J MagnReson Imaging. 2003;17:323–9.
4. Kawel-Boehm N, Maceira A, Valsangiacomo-Buechel ER, Vogel-Claussen J,Turkbey EB, Williams R, et al. Normal values for cardiovascular magneticresonance in adults and children. J Cardiovasc Magn Reson BioMed Central.2015;17:29.
5. Yeon SB, Salton CJ, Gona P, Chuang ML, Blease SJ, Han Y, et al. Impact ofage, sex, and indexation method on MR left ventricular reference values inthe Framingham Heart Study offspring cohort. J Magn Reson Imaging NIHPublic Access. 2015;41:1038–45.
6. Foppa M, Arora G, Gona P, Ashrafi A, Salton CJ, Yeon SB, et al. Rightventricular volumes and systolic function by cardiac magnetic resonanceand the impact of sex, age, and obesity in a longitudinally followed cohortfree of pulmonary and cardiovascular disease. Circ Cardiovasc ImagingLippincott Williams & Wilkins. 2016;9:e003810.
7. Sudlow C, Gallacher J, Allen N, Beral V, Burton P, Danesh J, et al. UK Biobank:an open access resource for identifying the causes of a wide range ofcomplex diseases of middle and old age. PLoS Med Public Library ofScience. 2015;12:e1001779.
8. Petersen SE, Matthews PM, Bamberg F, Bluemke DA, Francis JM, FriedrichMG, et al. Imaging in population science: cardiovascular magneticresonance in 100,000 participants of UK Biobank - rationale, challenges andapproaches. J Cardiovasc Magn Reson. 2013;15:46.
9. Petersen SE, Matthews PM, Francis JM, Robson MD, Zemrak F, Boubertakh R,et al. UK Biobank’s cardiovascular magnetic resonance protocol. JCardiovasc Magn Reson BioMed Central Ltd. 2016;18:8.
10. Lang RM, Badano LP, Mor-Avi V, Afilalo J, Armstrong A, Ernande L, et al.Recommendations for cardiac chamber quantification by echocardiographyin adults: an update from the American Society of Echocardiography andthe European Association of Cardiovascular Imaging. J Am SocEchocardiogr. 2015;28:1–39.e14.
11. Carapella V, Jimenez-Ruiz E, Lukaschuk E, Aung N, Fung K, Paiva J, et al.Towards the semantic enrichment of free-text annotation of image qualityassessment for UK Biobank cardiac Cine MRI scans. Lect Notes Comput Sci.2016;238–48. 1.
12. Solberg HE. The theory of reference values Part 5. Statistical treatment ofcollected reference values. Determination of reference limits. J Clin ChemClin Biochem Zeitschrift für Klin Chemie und Klin Biochem. 1983;21:749–60.
13. Du Bois D, Du Bois EF. A formula to estimate the approximate surface areaif height and weight be known. Arch Intern Med. 1916;17:863–71.
14. Bland JM, Altman DG. Statistical methods for assessing agreement between twomethods of clinical measurement. Lancet (London, England). 1986;1:307–10.
15. Hallgren KA. Computing inter-rater reliability for observational data: anoverview and tutorial. Tutor Quant Methods Psychol NIH Public Access.2012;8:23–34.
Petersen et al. Journal of Cardiovascular Magnetic Resonance (2017) 19:18 Page 18 of 19

16. R Core Team. R: A Language and Environment for Statistical Computing.Vienna; 2016.
17. Dweck MR, Joshi S, Murigu T, Gulati A, Alpendurada F, Jabbour A, et al. Leftventricular remodeling and hypertrophy in patients with aortic stenosis: insightsfrom cardiovascular magnetic resonance. J Cardiovasc Magn Reson. 2012;14:50.
18. Sievers B, Kirchberg S, Franken U, Bakan A, Addo M, John-Puthenveettil B, et al.Determination of normal gender-specific left atrial dimensions by cardiovascularmagnetic resonance imaging. J Cardiovasc Magn Reson. 2005;7:677–83.
19. Maceira AM, Cosín-Sales J, Roughton M, Prasad SK, Pennell DJ. Referenceleft atrial dimensions and volumes by steady state free precessioncardiovascular magnetic resonance. J Cardiovasc Magn Reson. 2010;12:65.
20. Maceira AM, Cosín-Sales J, Roughton M, Prasad SK, Pennell DJ, Sanfilippo A,et al. Reference right atrial dimensions and volume estimation by steadystate free precession cardiovascular magnetic resonance. J Cardiovasc MagnReson BioMed Central. 2013;15:29.
21. Gandy SJ, Lambert M, Belch J, Cavin I, Crowe E, Littleford R, et al. 3T MRIinvestigation of cardiac left ventricular structure and function in a UKpopulation: The tayside screening for the prevention of cardiac events(TASCFORCE) study. J Magn Reson Imaging. 2016;44:1186–96.
22. Le Ven F, Bibeau K, De Larochellière É, Tizón-Marcos H, Deneault-Bissonnette S, Pibarot P, et al. Cardiac morphology and function referencevalues derived froma large subset of healthy young Caucasian adults bymagnetic resonance imaging. Eur Heart J Cardiovasc Imaging. 2016;17:981–90.
23. Helge Erik Solberg DS. IFCC recommendation: the theory of referencevalues. Part 4. Control ofanalytical variation in the production, transfer andapplication of reference values. J Automat Chem Hindawi PublishingCorporation. 1991;13:231.
24. Lieb W, Xanthakis V, Sullivan LM, Aragam J, Pencina MJ, Larson MG, et al.Longitudinal tracking of left ventricular mass over the adult life course: clinicalcorrelates of short- and long-term change in the framingham offspring study.Circulation American Heart Association Journals. 2009;119:3085–92.
25. Fuchs A, Mejdahl MR, Kühl JT, Stisen ZR, Nilsson EJP, Køber LV, et al. Normalvalues of left ventricular mass and cardiac chamber volumes assessed by320-detector computed tomography angiography in the CopenhagenGeneral Population Study. Eur Hear J Cardiovasc Imaging Oxford UniversityPress. 2016;322:1561–6.
26. Chung AK, Das SR, Leonard D, Peshock RM, Kazi F, Abdullah SM, et al.Women have higher left ventricular ejection fractions than menindependent of differences in left ventricular volume: the Dallas HeartStudy. Circulation American Heart Association Journals. 2006;113:1597–604.
27. Natori S, Lai S, Finn JP, Gomes AS, Hundley WG, Jerosch-Herold M, et al.Cardiovascular Function in Multi-Ethnic Study of Atherosclerosis: NormalValues by Age, Sex, and Ethnicity. Am J Roentgenol. American RoentgenRay Society; 2012.
28. Strait JB, Lakatta EG. Aging-associated cardiovascular changes and theirrelationship to heart failure. Heart Fail Clin NIH Public Access. 2012;8:143–64.
29. Schulman SP, Lakatta EG, Fleg JL, Lakatta L, Becker LC, Gerstenblith G.Age-related decline in left ventricular filling at rest and exercise. Am JPhysiol. 1992;263:H1932–8.
30. Kitzman DW, Scholz DG, Hagen PT, Ilstrup DM, Edwards WD. Age-relatedchanges in normal human hearts during the first 10 decades of life. Part II(maturity): a quantitative anatomic study of 765 specimens from subjects 20to 99 years old. Mayo Clin Proc. 1988;63:137–46.
31. Margossian R, Schwartz ML, Prakash A, Wruck L, Hurwitz LM, Marcus E, et al.Comparison of echocardiographic and cardiac magnetic resonance imagingmeasurements of functional single ventricular volumes, mass, and ejectionfraction (From the Pediatric Heart Network Multicenter Fontan Cross-Sectional Study). Am J Cardiol. 2010;104:419–28.
32. Teo KSL, Carbone A, Piantadosi C, Chew DP, Hammett CJK, Brown MA, et al.Cardiac MRI assessment of left and right ventricular parameters in healthyAustralian normal volunteers. Hear Lung Circ. 2008;17:313–7.
33. Rider OJ, Francis JM, Ali MK, Byrne J, Clarke K, Neubauer S, et al.Determinants of left ventricular mass in obesity; a cardiovascular magneticresonance study. J Cardiovasc Magn Reson BioMed Central. 2009;11:9.
34. Rider OJ, Petersen SE, Francis JM, Ali MK, Hudsmith LE, Robinson MR, et al.Ventricular hypertrophy and cavity dilatation in relation to body mass indexin women with uncomplicated obesity. Heart BMJ Publishing Group Ltdand British Cardiovascular Society. 2011;97:203–8.
35. Health and Social Care Information Centre. Statistics on Obesity, PhysicalActivity and Diet. 2016.
• We accept pre-submission inquiries
• Our selector tool helps you to find the most relevant journal
• We provide round the clock customer support
• Convenient online submission
• Thorough peer review
• Inclusion in PubMed and all major indexing services
• Maximum visibility for your research
Submit your manuscript atwww.biomedcentral.com/submit
Submit your next manuscript to BioMed Central and we will help you at every step:
Petersen et al. Journal of Cardiovascular Magnetic Resonance (2017) 19:18 Page 19 of 19


![no Cardiac Physiology Pump Function[1] Preload Afterload](https://img.pdfslide.net/doc/110x75/577d246e1a28ab4e1e9c78a0/no-cardiac-physiology-pump-function1-preload-afterload.jpg)