Embed Size (px)
Citation preview
Digital Commons @ George Fox UniversityFaculty Publications - Department of Health andHuman Performance Department of Health and Human Performance
4-7-2017
Reference Standards for Body Fat Measure UsingGE Dual Energy X-Ray Absorptiometry inCaucasian AdultsMary T. ImbodenGeorge Fox University, [email protected]
Whitney A. WelchUniversity of Wisconsin - Milwaukee
Ann M. SwartzUniversity of Wisconsin - Milwaukee
Alexander H. K. MontoyeBall State University
Holmes W. FinchBall State University
See next page for additional authors
Follow this and additional works at: https://digitalcommons.georgefox.edu/hhp_fac
Part of the Medicine and Health Sciences Commons
This Article is brought to you for free and open access by the Department of Health and Human Performance at Digital Commons @ George FoxUniversity. It has been accepted for inclusion in Faculty Publications - Department of Health and Human Performance by an authorized administratorof Digital Commons @ George Fox University. For more information, please contact [email protected].
Recommended CitationImboden, Mary T.; Welch, Whitney A.; Swartz, Ann M.; Montoye, Alexander H. K.; Finch, Holmes W.; Harber, Matthew P.; andKaminsky, Leonard A., "Reference Standards for Body Fat Measure Using GE Dual Energy X-Ray Absorptiometry in CaucasianAdults" (2017). Faculty Publications - Department of Health and Human Performance. 8.https://digitalcommons.georgefox.edu/hhp_fac/8

AuthorsMary T. Imboden, Whitney A. Welch, Ann M. Swartz, Alexander H. K. Montoye, Holmes W. Finch, MatthewP. Harber, and Leonard A. Kaminsky
This article is available at Digital Commons @ George Fox University: https://digitalcommons.georgefox.edu/hhp_fac/8

RESEARCH ARTICLE
Reference standards for body fat measures
using GE dual energy x-ray absorptiometry in
Caucasian adults
Mary T. Imboden1*, Whitney A. Welch2, Ann M. Swartz2, Alexander H. K. Montoye1,
Holmes W. Finch1, Matthew P. Harber1, Leonard A. Kaminsky1
1 Ball State University, Muncie, Indiana, United States of America, 2 University of Wisconsin-Milwaukee,
Milwaukee, Wisconsin, United States of America
Abstract
Background
Dual energy x-ray absorptiometry (DXA) is an established technique for the measurement of
body composition. Reference values for these variables, particularly those related to fat
mass, are necessary for interpretation and accurate classification of those at risk for obesity-
related health complications and in need of lifestyle modifications (diet, physical activity,
etc.). Currently, there are no reference values available for GE-Healthcare DXA systems and
it is known that whole-body and regional fat mass measures differ by DXA manufacturer.
Objective
To develop reference values by age and sex for DXA-derived fat mass measurements with
GE-Healthcare systems.
Methods
A de-identified sample of 3,327 participants (2,076 women, 1,251 men) was obtained from
Ball State University’s Clinical Exercise Physiology Laboratory and University of Wisconsin-
Milwaukee’s Physical Activity & Health Research Laboratory. All scans were completed
using a GE Lunar Prodigy or iDXA and data reported included percent body fat (%BF), fat
mass index (FMI), and ratios of android-to-gynoid (A/G), trunk/limb, and trunk/leg fat mea-
surements. Percentiles were calculated and a factorial ANOVA was used to determine dif-
ferences in the mean values for each variable between age and sex.
Results
Normative reference values for fat mass variables from DXA measurements obtained from
GE-Healthcare DXA systems are presented as percentiles for both women and men in 10-
year age groups. Women had higher (p<0.01) mean %BF and FMI than men, whereas men
had higher (p<0.01) mean ratios of A/G, trunk/limb, and trunk/leg fat measurements than
women.
PLOS ONE | https://doi.org/10.1371/journal.pone.0175110 April 7, 2017 1 / 12
a1111111111
a1111111111
a1111111111
a1111111111
a1111111111
OPENACCESS
Citation: Imboden MT, Welch WA, Swartz AM,
Montoye AHK, Finch HW, Harber MP, et al. (2017)
Reference standards for body fat measures using
GE dual energy x-ray absorptiometry in Caucasian
adults. PLoS ONE 12(4): e0175110. https://doi.org/
10.1371/journal.pone.0175110
Editor: Jacobus P. van Wouwe, TNO,
NETHERLANDS
Received: June 27, 2016
Accepted: March 21, 2017
Published: April 7, 2017
Copyright: © 2017 Imboden et al. This is an open
access article distributed under the terms of the
Creative Commons Attribution License, which
permits unrestricted use, distribution, and
reproduction in any medium, provided the original
author and source are credited.
Data Availability Statement: Data can be
accessed on Figshare: https://figshare.com/s/
d192d2abf57c8841cd29.
Funding: The authors received no specific funding
for this work.
Competing interests: The authors have declared
that no competing interests exist.

Conclusion
These reference values provide clinicians and researchers with a resource for interpretation
of DXA-derived fat mass measurements specific to use with GE-Healthcare DXA systems.
Introduction
Given that obesity (overabundance of fat mass) raises the risk of early mortality and chronic
diseases [1–3], high quality body composition measures provided by dual energy x-ray absorp-
tiometry (DXA) have become valued in the clinical and research settings [4]. DXA is a three-
compartment method that is considered as a reference technique for measuring body compo-
sition (bone, lean, and fat mass), due to its high precision and accuracy compared with other
body composition assessments [5,6]. One advantage of DXA is its ability to measure both total
and regional body composition through high resolution, high quality imaging [7].
Despite being considered an ideal option for body composition measurement, the interpre-
tation of DXA results is limited by a lack of universally recognized standards for key measures
of fat mass variables known to influence health (i.e. % body fat (%BF), android-to-gynoid ratio
(A/G ratio), etc.). Recently, Kelly et al. used data from the National Health and Nutrition Ex-
amination Survey (NHANES) to develop reference ranges for these measures specific to DXA
measurements obtained with the Hologic QDR 4500A fan beam densitometer [4]. Hologic is one
of the two major DXA manufacturers, the other being GE Healthcare (Madison, WI; Lunar Prod-
igy and iDXA models) [5,6,8], which have been validated against criterion 4-compartment models
[9,10]. Although both manufacturers use fan beam DXA technology, GE-Healthcare uses nar-
row-angle, whereas Hologic uses wide-angle fan beam instrumentation. Additionally, body com-
position results can vary between the devices due to possible differences in calibration standards
and specific algorithms used to calculate the body composition measures that are proprietary to
the manufacturer [5]. Shepherd et al. compared whole-body body composition results derived
using the GE-Healthcare Lunar and Hologic DXA systems, finding significant absolute differ-
ences between the two systems in %BF, bone mineral content, and bone mineral density of 1.4%,
176.8g, and 0.013 g/cm2, respectively[5]. Others have reported similar differences in body compo-
sition variables between these two DXA manufacturers [11–14]. Due to this inter-model variation
between DXA manufacturers, the reference values presented by Kelly et al. [4] are only directly
compatible with Hologic densitometers and cannot be universally accepted for all DXA models
[15].
Researchers have developed cross-calibrated equations between the Hologic and GE-
Healthcare models [5]. Fan et al. used these cross-calibrated equations to convert whole-body
and regional bone and soft tissue measurements from the NHANES 1999–2004 dataset to ref-
erence values for the GE-Healthcare models [16]. Although this study provided an initial set of
reference values for body composition measures, including %BF, trunk % fat, legs % fat, and
A/G ratio for GE-Healthcare DXAs, researchers reported marginal error associated with the
cross-calibrated equations [5]. Therefore, it is important to develop body composition refer-
ence values obtained directly from whole-body scans using the GE-Healthcare models. These
standards are needed to appropriately determine values for body composition measurements
that are associated with an increased risk for chronic diseases.
Other DXA-derived measures of fat mass are useful in evaluating health-risks associated
with body composition. Fat mass index (FMI) is a measure of total fat mass divided by height
squared, which aids in the interpretation of body composition as it is not confounded by lean
Body fat reference standards using GE DXA
PLOS ONE | https://doi.org/10.1371/journal.pone.0175110 April 7, 2017 2 / 12
tissue as is the case for body mass index (BMI) [4]. Additionally, regional fat mass distribution
is an important risk marker for metabolic and cardiovascular health complications [17,18].
When utilizing regional fat mass measurements obtained from DXA, three ratios including
the A/G, trunk/limb and trunk/leg have been shown to be good markers of lipodystrophy and
correlate with insulin resistance and dyslipidemia [19,20]. Although Kelly et al. developed ref-
erence values for FMI, and the A/G, trunk/limb, and trunk/leg ratios, these values are only
strictly applicable to the Hologic system [4].
As GE-Healthcare is one of the two major DXA manufacturers [5] widely used by research-
ers and clinicians, reference values are needed to guide interpretation of body composition
results obtained with this instrument. The purpose of this study was to develop reference val-
ues for fat mass variables including %BF, FMI, and fat mass ratios of A/G, trunk/limb, and
trunk/leg using the GE-Healthcare models.
Methods
A sample of 3,327 participants, (2,076 women, 1,251 men; 95% of which were Caucasian) was
obtained from Ball State University’s Clinical Exercise Physiology Laboratory (2,218 scans)
and University of Wisconsin-Milwaukee’s Physical Activity & Health Research Laboratory
(1,109 scans). Participants were either self-referred, residents of the surrounding communities,
or research subjects or participants in a variety of health-related programs at one of the two
laboratories at Ball State University or University of Wisconsin-Milwaukee. All participants
were�20 and<80 years old (mean age 45.8 ± 18.3 years (Table 1)) and for individuals with
repeat scans only the results from the first scan were used in the analysis. Participants were
excluded if their width exceeded the scanner field or their body weight exceeded the limits of
the scanner bed (350 lbs for Prodigy or 450 lbs for iDXA). The study was declared exempt by
the Ball State University and University of Wisconsin-Milwaukee IRB as all subject data was
de-identified. Additionally, prior to all DEXA scans participants signed an informed consent
agreeing that their data from the scan could be used for research purposes.
A whole-body DXA scan was performed on all participants. The GE-Healthcare Lunar
Prodigy was used at the Clinical Exercise Physiology Laboratory at Ball State University from
2003 to 2010 and the GE-Healthcare iDXA was used from 2010 to October 2015. All scans per-
formed at the Physical Activity & Health Research Laboratory at the University of Wisconsin-
Milwaukee used the GE-Healthcare Lunar Prodigy from 2005 to October 2015. Both the GE
Lunar Prodigy and GE-Healthcare iDXA use the encore software platform that has been
updated as GE-Healthcare releases new versions. These two GE-Healthcare DXA models are
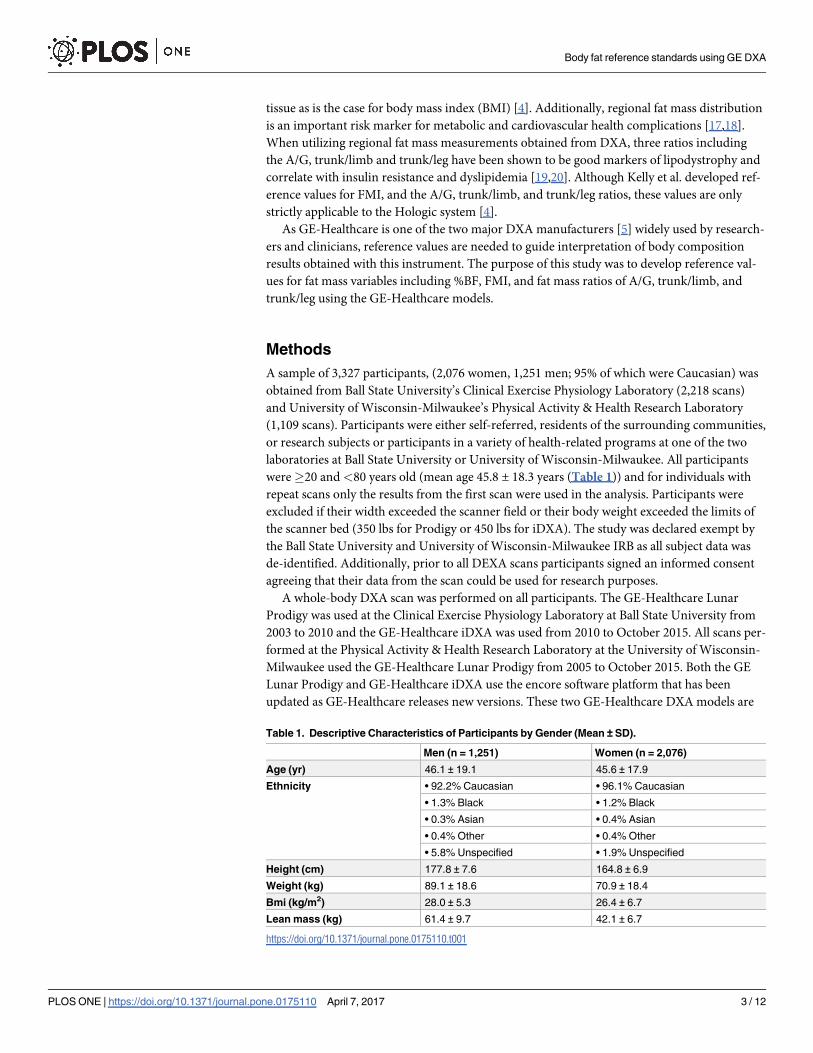
Table 1. Descriptive Characteristics of Participants by Gender (Mean ± SD).
Men (n = 1,251) Women (n = 2,076)
Age (yr) 46.1 ± 19.1 45.6 ± 17.9
Ethnicity • 92.2% Caucasian • 96.1% Caucasian
• 1.3% Black • 1.2% Black
• 0.3% Asian • 0.4% Asian
• 0.4% Other • 0.4% Other
• 5.8% Unspecified • 1.9% Unspecified
Height (cm) 177.8 ± 7.6 164.8 ± 6.9
Weight (kg) 89.1 ± 18.6 70.9 ± 18.4
Bmi (kg/m2) 28.0 ± 5.3 26.4 ± 6.7
Lean mass (kg) 61.4 ± 9.7 42.1 ± 6.7
https://doi.org/10.1371/journal.pone.0175110.t001
Body fat reference standards using GE DXA
PLOS ONE | https://doi.org/10.1371/journal.pone.0175110 April 7, 2017 3 / 12

both narrow fan-beam densitometers that have high agreement between systems (R2 for fat
mass = 0.95–0.99), thus are suitable for intra-subject comparisons for %BF [21].
Procedure
DXA scans were administered by trained research technicians using standardized procedures
recommended by GE-Healthcare. All technicians were trained over a period of 1 to 3 months
at each laboratory. Prior to each testing session, the GE-Healthcare DXA systems at both labo-
ratories passed the manufacturer recommended quality assurance procedure. Participants
were asked to remove all metal, including jewelry and items in their pocket, as well as shoes.
Height was measured using a wall-mounted stadiometer and mass was measured with a cali-
brated scale. The technician then positioned the participant correctly within the scanner field
on the DXA table. The final review of all scans was completed by one supervisor at each
laboratory.
Variables of interest from the scan that were used in this analysis included %BF, total fat
mass, trunk fat mass, leg fat mass, arm fat mass, android fat mass, and gynoid fat mass. The
GE-Healthcare systems define the trunk region as including the neck, chest, abdominal and
pelvic areas. Its upper perimeter is the inferior edge of the chin and the lower boundary inter-
sects the middle of the femoral necks without touching the brim of the pelvis. The leg region is
defined as the point of separation from the pelvic region at an angle perpendicular to the femo-
ral neck. The android region is defined as the area between the ribs and the pelvis that is totally
enclosed by the trunk region. The upper boundary is 20% of the distance between the iliac
crest and the neck and the lower boundary is at the top of the pelvis. The gynoid region
includes the hips and upper thighs and overlaps both the leg and trunk regions[22].
Statistical analysis
All statistical analyses were performed using SPSS (version 22.0), with descriptive measures
reported as means ± standard deviation. Sex- and age-specific body composition measure-
ments were analyzed, with participants classified into age groups by decade (20–29, 30–39, 40–
49, 50–59, 60–69, and 70–79 years). Data for both sexes were checked for normality using Kol-
mogorov-Smirnov test and found to be equally distributed. FMI (fat mass (kg) � height (m⁻2)),
A/G Ratio (android fat mass/ gynoid fat mass), trunk/leg ratio (total trunk % fat / total leg %
fat), and trunk/limb ratio (total trunk fat mass/ [total leg + total arm fat mass]) were calculated
from scan measurements. Percentiles were calculated for each outcome variable specific to sex
and age groups. A factorial ANOVA was used to determine potential differences in mean %BF
values, FMI, A/G ratio, trunk/leg ratio, trunk/limb ratio, between sex- and age-specific groups.
An alpha level was set at 0.05 to determine statistical significance. Finally, reference curves
were created using LMS regression (S1–S10 Figs)[23]. These curves were fit to the 3rd, 50th,
and 97th percentiles superimposed upon the raw data values. The median values from the
NHANES cohort were also added to these curves for comparison.
Results
Mean (± SD) and percentiles of %BF from the GE-Healthcare models by age for both women
and men are displayed in Table 2. Women had a greater mean %BF than men in all age groups
(women: 38.6 ± 9.9%, men: 28.3 ± 9.4%; p<0.01). The %BF was higher per decade with increas-
ing age up to the 50–59 year age group (p<0.01) in both sexes. Thereafter no differences in %BF
were observed in later age groups compared to 50–59 year age group in men. However, in
women %BF was lower (P<0.05) in the 70–79 year age group compared to the 60–69 year age
group.
Body fat reference standards using GE DXA
PLOS ONE | https://doi.org/10.1371/journal.pone.0175110 April 7, 2017 4 / 12

FMI means (±SD) and percentiles by age group for both women and men are presented in
Table 3. Mean FMI was higher in women than men at all age groups (women: 10.6± 4.8
kg�m⁻2, men: 7.9 ±3.6 kg�m⁻2; p< 0.05). Additionally, in both sexes FMI increased with age up
Table 2. Sex-specific percentiles of body fat percent (%) measured with DXA.
Women
Age (yr) n X ± SD 90th 80th 70th 60th 50th 40th 30th 20th 10th
20–29 562 31.4± 8.5 22.1 24.5 26.4 28.1 29.9 32.1 35.4 38.3 43.2
30–39 196 36.6± 11.0D 21.4 26.8 29.3 33.4 36.8 40.6 43.6 46.8 50.7
40–49 258 39.2± 9.7C 24.5 31.4 34.3 37.4 40.0 42.6 44.5 48.2 51.0
50–59 437 41.7± 8.7B 30.3 34.4 38.0 40.5 42.7 45.0 47.0 49.3 51.8
60–69 440 42.4± 7.7B 32.5 35.5 38.6 40.8 42.4 44.9 47.0 49.1 52.2
70–79 183 40.4± 7.9A 30.5 35.5 37.9 39.6 41.2 43.5 45.8 48.2 50.1
Men
Age (yr) n X ± SD 90th 80th 70th 60th 50th 40th 30th 20th 10th
20–29 384 21.1±8.3 11.0 14.0 16.5 18.5 20.2 22.7 25.6 28.7 31.8
30–39 104 26.3±10.6D 11.2 17.2 19.2 23.3 26.4 30.2 33.7 36.6 39.9
40–49 145 29.1±8.6C 15.8 22.2 25.8 28.4 30.1 31.5 33.9 36.9 41.0
50–59 214 30.9±7.9B 20.0 24.1 26.8 29.4 31.4 33.7 35.7 37.9 40.8
60–69 236 31.0±7.8 B 21.0 25.1 27.3 29.4 31.6 33.5 34.7 37.2 40.7
70–79 168 31.1±6.6 B 23.0 25.7 28.0 29.4 32.4 34.0 35.7 37.4 39.6
A Significantly different than 20–29, 30–39, 40–49, 50–59, 60–69; p<0.01.B Significantly different than 20–29, 30–39, 40–49; p<0.01.C Significantly different than 20–29, 30–39; p<0.01.D Significantly different than 20–29; p<0.01.
https://doi.org/10.1371/journal.pone.0175110.t002
Table 3. Sex-specific percentiles of Fat Mass Index (kg�m⁻2) measured with DXA.
Women
Age(yr) n X ± SD 90th 80th 70th 60th 50th 40th 30th 20th 10th
20–29 562 7.6± 3.6 4.3 5.0 5.6 6.0 6.6 7.3 8.2 9.5 11.9
30–39 196 10.0±5.2D 4.4 5.4 6.4 7.5 8.9 10.2 11.9 14.3 18.0
40–49 258 11.0±5.1C 4.9 7.0 7.8 8.6 9.7 11.3 12.8 15.4 19.2
50–59 437 12.0±4.9 B 6.4 7.6 9.1 10.1 11.3 12.8 14.4 16.3 18.7
60–69 440 12.1±4.5 B 6.8 8.0 9.4 10.3 11.2 12.9 14.3 15.6 18.1
70–79 183 10.8±3.8A 6.4 8.0 8.8 9.6 10.5 11.6 12.8 14.4 16.3
Men
Age(yr) n X ± SD 90th 80th 70th 60th 50th 40th 30th 20th 10th
20–29 384 5.6±3.0 2.3 3.2 3.8 4.4 5.0 6.0 7.1 8.6 10.7
30–39 104 7.3±3.9D 2.7 4.0 4.9 5.8 6.8 8.3 10.1 11.0 12.4
40–49 145 8.3±3.7C 3.6 5.2 6.4 7.3 8.0 8.7 10.5 12.0 14.6
50–59 214 8.9±3.4 B 4.7 5.9 6.7 7.8 8.7 9.4 10.3 11.7 13.4
60–69 236 8.9±3.4B 4.8 6.2 7.0 7.6 8.5 9.2 10.2 11.6 13.6
70–79 168 8.4±2.9A 5.1 5.8 6.6 7.0 7.9 8.6 9.6 10.7 11.7
A Significantly different than 20–29, 30–39, 40–49, 50–59, 60–69; p<0.05.B Significantly different than 20–29, 30–39, 40–49; p<0.05.C Significantly different than 20–29, 30–39; p<0.05.D Significantly different than 20–29; p<0.05.
https://doi.org/10.1371/journal.pone.0175110.t003
Body fat reference standards using GE DXA
PLOS ONE | https://doi.org/10.1371/journal.pone.0175110 April 7, 2017 5 / 12
until 50–59 year age-group, where it then plateaued before decreasing in the 70–79 year age
(p<0.05).
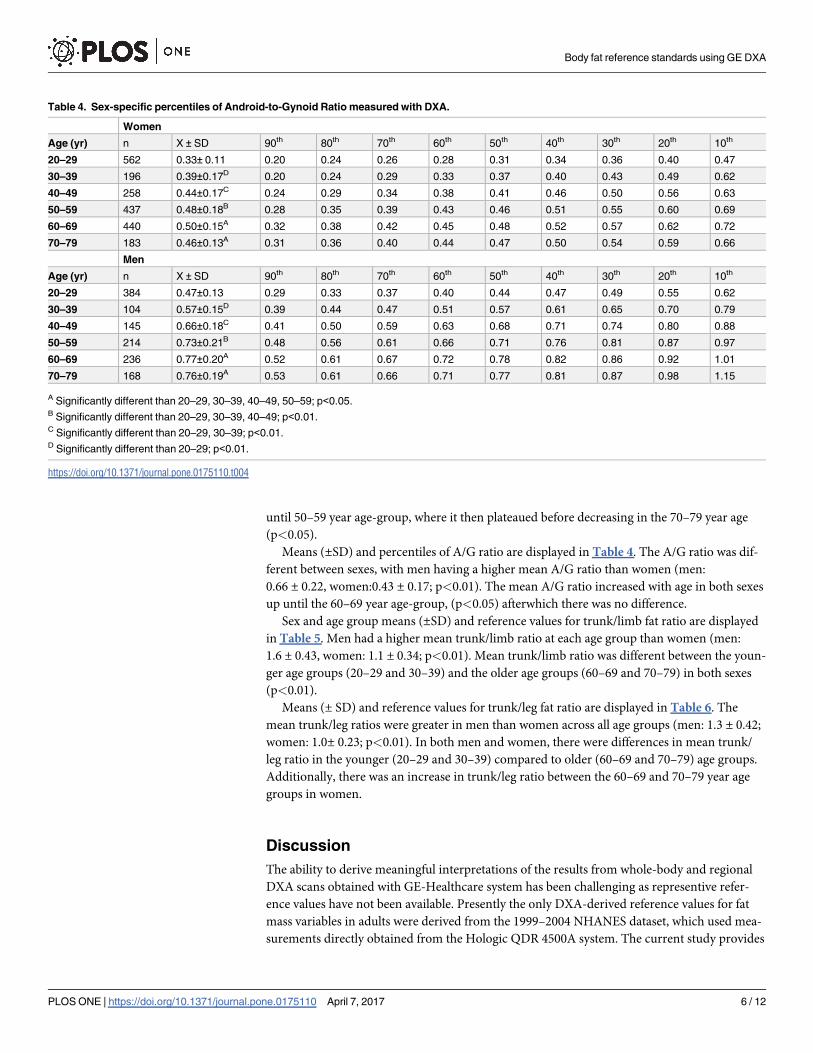
Means (±SD) and percentiles of A/G ratio are displayed in Table 4. The A/G ratio was dif-
ferent between sexes, with men having a higher mean A/G ratio than women (men:
0.66 ± 0.22, women:0.43 ± 0.17; p<0.01). The mean A/G ratio increased with age in both sexes
up until the 60–69 year age-group, (p<0.05) afterwhich there was no difference.
Sex and age group means (±SD) and reference values for trunk/limb fat ratio are displayed
in Table 5. Men had a higher mean trunk/limb ratio at each age group than women (men:
1.6 ± 0.43, women: 1.1 ± 0.34; p<0.01). Mean trunk/limb ratio was different between the youn-
ger age groups (20–29 and 30–39) and the older age groups (60–69 and 70–79) in both sexes
(p<0.01).
Means (± SD) and reference values for trunk/leg fat ratio are displayed in Table 6. The
mean trunk/leg ratios were greater in men than women across all age groups (men: 1.3 ± 0.42;
women: 1.0± 0.23; p<0.01). In both men and women, there were differences in mean trunk/
leg ratio in the younger (20–29 and 30–39) compared to older (60–69 and 70–79) age groups.
Additionally, there was an increase in trunk/leg ratio between the 60–69 and 70–79 year age
groups in women.
Discussion
The ability to derive meaningful interpretations of the results from whole-body and regional
DXA scans obtained with GE-Healthcare system has been challenging as representive refer-
ence values have not been available. Presently the only DXA-derived reference values for fat
mass variables in adults were derived from the 1999–2004 NHANES dataset, which used mea-
surements directly obtained from the Hologic QDR 4500A system. The current study provides
Table 4. Sex-specific percentiles of Android-to-Gynoid Ratio measured with DXA.
Women
Age (yr) n X ± SD 90th 80th 70th 60th 50th 40th 30th 20th 10th
20–29 562 0.33± 0.11 0.20 0.24 0.26 0.28 0.31 0.34 0.36 0.40 0.47
30–39 196 0.39±0.17D 0.20 0.24 0.29 0.33 0.37 0.40 0.43 0.49 0.62
40–49 258 0.44±0.17C 0.24 0.29 0.34 0.38 0.41 0.46 0.50 0.56 0.63
50–59 437 0.48±0.18B 0.28 0.35 0.39 0.43 0.46 0.51 0.55 0.60 0.69
60–69 440 0.50±0.15A 0.32 0.38 0.42 0.45 0.48 0.52 0.57 0.62 0.72
70–79 183 0.46±0.13A 0.31 0.36 0.40 0.44 0.47 0.50 0.54 0.59 0.66
Men
Age (yr) n X ± SD 90th 80th 70th 60th 50th 40th 30th 20th 10th
20–29 384 0.47±0.13 0.29 0.33 0.37 0.40 0.44 0.47 0.49 0.55 0.62
30–39 104 0.57±0.15D 0.39 0.44 0.47 0.51 0.57 0.61 0.65 0.70 0.79
40–49 145 0.66±0.18C 0.41 0.50 0.59 0.63 0.68 0.71 0.74 0.80 0.88
50–59 214 0.73±0.21B 0.48 0.56 0.61 0.66 0.71 0.76 0.81 0.87 0.97
60–69 236 0.77±0.20A 0.52 0.61 0.67 0.72 0.78 0.82 0.86 0.92 1.01
70–79 168 0.76±0.19A 0.53 0.61 0.66 0.71 0.77 0.81 0.87 0.98 1.15
A Significantly different than 20–29, 30–39, 40–49, 50–59; p<0.05.B Significantly different than 20–29, 30–39, 40–49; p<0.01.C Significantly different than 20–29, 30–39; p<0.01.D Significantly different than 20–29; p<0.01.
https://doi.org/10.1371/journal.pone.0175110.t004
Body fat reference standards using GE DXA
PLOS ONE | https://doi.org/10.1371/journal.pone.0175110 April 7, 2017 6 / 12

the first set of reference values generated directly from measurements of %BF, FMI, trunk/
limb and trunk/leg ratio obtained using the GE-Healthcare DXA systems.
Table 5. Sex-specific percentiles of Trunk-to-Limb Ratio measured with DXA.
Women
Age (yr) n X ± SD 90th 80th 70th 60th 50th 40th 30th 20th 10th
20–29 562 0.96±0.25 0.71 0.79 0.85 0.88 0.92 0.97 1.03 1.10 1.21
30–39 196 1.06±0.34C 0.72 0.80 0.86 0.92 1.01 1.06 1.15 1.23 1.48
40–49 258 1.12±0.39C 0.76 0.86 0.93 0.97 1.03 1.12 1.20 1.31 1.48
50–59 437 1.18±0.39B 0.79 0.89 0.99 1.05 1.13 1.21 1.30 1.42 1.62
60–69 440 1.15±0.29C 0.82 0.92 0.98 1.04 1.12 1.19 1.28 1.36 1.55
70–79 183 1.12±0.26C 0.80 0.89 0.99 1.06 1.12 1.16 1.22 1.30 1.44
Men
Age (yr) n X ± SD 90th 80th 70th 60th 50th 40th 30th 20th 10th
20–29 384 1.24±0.29 0.85 1.00 1.11 1.18 1.23 1.30 1.36 1.46 1.60
30–39 104 1.46±0.28C 1.11 1.26 1.33 1.39 1.46 1.54 1.62 1.68 1.80
40–49 145 1.65±0.37B 1.18 1.35 1.46 1.58 1.63 1.73 1.82 1.96 2.17
50–59 214 1.71±0.38 1.24 1.40 1.51 1.59 1.67 1.76 1.85 2.01 2.13
60–69 236 1.78±0.44A 1.27 1.40 1.51 1.64 1.75 1.85 1.94 2.09 2.25
70–79 168 1.75±0.41A 1.23 1.32 1.48 1.60 1.70 1.77 1.94 2.07 2.24
A Significantly different than 20–29, 30–39, 40–49; p<0.05.B Significantly different than 20–29, 30–39, p<0.05.C Significantly different than 20–29; p<0.05.
https://doi.org/10.1371/journal.pone.0175110.t005
Table 6. Sex-specific percentiles of Trunk-to-Leg Ratio measured with DXA.
Women
Age (yr) n X ± SD 90th 80th 70th 60th 50th 40th 30th 20th 10th
20–29 562 0.90±0.15 0.72 0.77 0.81 0.85 0.89 0.93 0.97 1.02 1.10
30–39 196 0.93±0.18 0.69 0.76 0.84 0.87 0.93 0.97 1.00 1.06 1.15
40–49 258 0.96±0.18D 0.75 0.81 0.87 0.91 0.96 0.99 1.03 1.08 1.17
50–59 437 0.99±0.18C 0.77 0.86 0.91 0.95 0.99 1.03 1.07 1.12 1.19
60–69 440 0.99±0.16C 0.80 0.87 0.91 0.95 0.98 1.02 1.06 1.10 1.19
70–79 183 1.36±0.22A 1.13 1.20 1.26 1.31 1.35 1.39 1.44 1.49 1.63
Men
Age (yr) n X ± SD 90th 80th 70th 60th 50th 40th 30th 20th 10th
20–29 384 1.15±0.23 0.86 0.95 1.03 1.09 1.14 1.18 1.26 1.33 1.43
30–39 104 1.27±0.22D 1.02 1.14 1.17 1.20 1.25 1.32 1.37 1.44 1.58
40–49 145 1.36±0.53C 1.05 1.18 1.23 1.33 1.44 1.50 1.54 1.59 1.66
50–59 214 1.39±0.23C 1.11 1.18 1.28 1.33 1.38 1.44 1.49 1.55 1.65
60–69 236 1.43±0.27B 1.10 1.19 1.27 1.35 1.43 1.48 1.55 1.62 1.75
70–79 168 1.34±0.27E 1.05 1.15 1.22 1.26 1.31 1.38 1.45 1.52 1.67
A Significantly different than 20–29, 30–39, 40–49, 50–59, 60–69; p<0.05.B Significantly different than 20–29, 30–39, 40–49; p<0.05.C Significantly different than 20–29, 30–39; p<0.05.D Significantly different than 20–29; p<0.05.E Significantly different than 20–29, 30–39, 60–69.
https://doi.org/10.1371/journal.pone.0175110.t006
Body fat reference standards using GE DXA
PLOS ONE | https://doi.org/10.1371/journal.pone.0175110 April 7, 2017 7 / 12
The most commonly reported body composition variable is total %BF. The sex-specific
data from this study cohort with DXA measures concurs with known literature showing
median values for %BF in women are higher than seen in men [4, 24–26]. The current results
showed a progressive increase (~ 2% per decade) in median %BF from the 20–29 year age
group through the 50–59 year age group in both men and women, which was similar to the
age group increase in %BF reported by Kelly et al. in Caucasian men and women [4]. The larg-
est increase, ~5% per decade, was between the 20–29 to 30–39 year age group. The change in
median value was <1% per decade for the 60–69 and 70–79 year age groups.
Comparison of the sex and age specific median values between this cohort measured with
GE-Healthcare DXA and the NHANES cohort measured with Hologic DXA, in general
showed similar values. However, for the youngest age group (20–29 years) the NHANES data
reported medians of 24.0, 20.8, and 25.1% for whites, blacks, and Mexican-American men
respectively compared to the 20.2% in the current study. This was similar in data for women
with the NHANES cohort having medians of 35.5, 36.9, and 38.0% for whites, blacks, and
Mexican-Americans respectively, compared to the 29.9% in the current study. Comparisons of
sex-specific median values between the two cohorts for the other ages groups were generally
around 1%, which is similar to the absolute difference reported by Shepherd et al of 1.4% [5].
The exception was for the 70–79 year old age group in women where the current study had a
median value of 39.6% compared to the NHANES values of 43.0, 42.9, and 43.4% for whites,
blacks, and Mexican-American women respectively. Thus, although there was general congru-
ency of DXA values between the two manufacturers, there are distinct differences which sug-
gest the need for brand-specific normative ranges for these measurements.
We also compared the reference values from this cohort to those developed by Fan et al.
from a previously validated cross-calibrated equation [16] to convert measurements from the
Hologic for use with the GE-Healthcare models. The median %BF at each age group were
lower in women in the current study (relative differences of 1.3 to 8.2%) compared to the val-
ues from Fan et al. In men, differences in median %BF between the current study and Fan
et al. ranged from -4.3 to 0.5%. Thus, it appears the use of the GE reference values derived
from the cross-calibrated equation may overestimate %BF in women and underestimate %BF
in men. This finding emphasizes the important of the reference values developed from direct
measures with the GE-Healthcare models for accurate classification, rather than use of cross-
calibrated equations.
DXA is capable of separating body mass into fat and fat-free components, thereby permit-
ting the evaluation of fat mass without the confounding influence of other tissue constituents.
FMI evaluates only the fat mass component of body mass without the interference from other
body components, such as excess muscle, and is useful as a measure of abnormally low or high
fat mass. Data from our study sample reveal that median FMI increases with age up until the
50–59 year age group in both men and women. The reference ranges derived from NHANES
showed similar findings in women (increasing until approximately 65 years of age); but in
men the median FMI continued to increase up until 80 years of age [4]. However, for the
youngest age group (20–29 years) the NHANES data reported medians of 6.2, 5.2, and 6.4
kg�m⁻2, for whites, blacks, and Mexican-American men respectively compared to 5.0 kg�m⁻2 in
the current study. This was similar in data for women with the NHANES cohort having medi-
ans of 8.7, 10.4, and 10.2 kg�m⁻2, for whites, blacks, and Mexican-Americans respectively, com-
pared to the 6.6 kg�m⁻2 in the current study. Differences in age and sex-specific medians
between the white population in NHANES and the current cohort ranged between -1.4 to 3.0
kg�m⁻2. Using the FMI classification ranges developed in the Kelly et al. study, the prevalence
rates for overweight and obesity in the current study were 31.6% (FMI> 6 kg�m⁻2) and 31.7%
(FMI>9 kg�m⁻2) for men. In women, the prevalence rates were 26.8% (FMI > 9 kg�m⁻2) for
Body fat reference standards using GE DXA
PLOS ONE | https://doi.org/10.1371/journal.pone.0175110 April 7, 2017 8 / 12
overweight and 26.4% (FMI>13 kg�m⁻2) for obesity. When compared to overweight and obe-
sity prevalence rates estimated using BMI, in men the prevalence rate for overweight was
higher (40.6%) (BMI� 25 kg�m⁻2), but was lower for obesity (26.3%) (BMI�30 kg�m⁻2). In
women the prevalence rates determined from BMI were slightly lower for both overweight
(26.7%) and obesity (25.0%). These results indicate that BMI may overestimate adiposity in
men with more lean mass and underestimate adiposity in those with excess fat mass, compared
to FMI which provides a better indication of adiposity. Thus FMI as obtained from DXA mea-
surements may provide clinicians and researchers with a useful tool to accurately identify
those that are overweight/obese compared to BMI which commonly misclassifies individuals
with excess lean mass.
Fat distribution is an important factor in risk classification. Abdominal fat mass, as reflected
in the android and trunk fat mass measurements, is strongly associated with risk factors for
cardiovascular disease and metabolic syndrome. In the current study, men had greater A/G,
trunk/limb, and trunk/leg fat ratios than women at each decade. This is a result of men carry-
ing higher amounts of android fat mass on average compared to women [27]. The trend of
each ratio increasing with age in the current study was similar to findings by Kelly et al. How-
ever, the median trunk/limb and trunk/leg ratios, for both sexes across all age groups, were
higher in the current study than that observed previously (trunk/limb differences men: 0.24 to
0.45, women: 0.12 to 0.18); (trunk/leg differences men: 0.21 to 0.38, women: 0.08 to 0.45) [4].
This is likely attributable to differences in the measurement technology of the two different
DXA manufacturers. Shepherd et al. found differences between DXA manufacturers (Hologic
and GE-Healthcare models) in sub-regional trunk %BF and leg %BF, with measurements
from the GE-Healthcare models being higher in trunk %BF but lower in leg % BF compared to
Hologic systems (38.5% vs. 33.4% and 32.3% vs. 33.1%, respectively). The higher trunk % BF
and lower leg % BF measured by the GE-Healthcare models would cause the trunk/leg ratio to
be elevated compared to Hologic measurements. Additionally, in the current study there was a
disjointed increase seen for the trunk/leg ratio in men between ages 40 to 50 and in women
between 60 to 70 years. Although there is no clear definitive explanation for this increase, in
women it may be likely due to sex-specific hormonal changes with aging that lead to higher
amounts of visceral fat accumulation [28, 29]. This should be explored in other cohorts to
determine if similar changes occur in both men and women.
This study is not without limitations. It is important to note that no formal statistical com-
parisons were performed between the two cohorts; thus these comparisons of median values
are based solely on observation. We should note that the current study’s population was simi-
lar to the NHANES cohort in distribution of age, sex distribution (approximately 53% vs. 62%
women, in NHANES and current study, respectively), and mean BMI for both sexes (men 28.0
kg�m⁻2vs. 27.9 kg�m⁻2; women 27.3 kg�m⁻2vs. 28.2 kg�m⁻2, respectively), which were consid-
ered overweight for both sexes. Therefore similarly to the NHANES dataset, these data reflect
the increasing prevalence of overweight and obesity of the population. The NHANES cohort
had more ethnic distribution (49% white, 19% black, 23% Mexican-American, and 9% other)
compared to the current study which was 95% white. As ethnic variation in body composition
has been documented in the literature [30, 31], these reference ranges may not be an accurate
representation for all ethnic groups. This study focused solely on fat mass variables, even
though the importance of lean mass on health and well-being is well documented. Thus, man-
ufacturer-specific reference values for lean mass variables and indices is also warranted and
will be reported in a separate report. This study had several strengths including using pooled
data from two laboratories and a subject group with a wide-range of characteristics including
age, BMI, and physical activity levels.
Body fat reference standards using GE DXA
PLOS ONE | https://doi.org/10.1371/journal.pone.0175110 April 7, 2017 9 / 12
Conclusion
The value of body composition measurements as a tool to understand health and disease is
growing in importance. DXA scans provide a high-quality measure of a wide-range of body
composition measures, however, the interpretation of DXA data has been limited by lack of
reference values. The results from this study provide reference values for %BF, FMI, fat mass
ratios of A/G, trunk/limb, and trunk/leg using the GE-Healthcare models. These reference val-
ues will provide GE-Healthcare DXA system users with the ability to derive meaningful inter-
pretation of results from whole-body and regional DXA scans. As a result, the proposed
reference values will also help effectively identify those who are at an increased risk for chronic
diseases associated with increased adiposity.
Supporting information
S1 Fig. Percent body fat (%) vs. age in women. Lines indicate 3rd (black), 50th (red), and 97th
(green) percentiles.
(PDF)
S2 Fig. Percent body fat (%) vs. age in men. Lines indicate 3rd (black), 50th (red), and 97th
(green) percentiles.
(PDF)
S3 Fig. Fat mass index (kg�m⁻2) vs. age in women. Lines indicate 3rd (black), 50th (red), and
97th (green) percentiles.
(PDF)
S4 Fig. Fat mass index (kg�m⁻2) vs. age in men. Lines indicate 3rd (black), 50th (red), and 97th
(green) percentiles.
(PDF)
S5 Fig. Android-to-Gynoid ratio vs. age in women. Lines indicate 3rd (black), 50th (red), and
97th (green) percentiles.
(PDF)
S6 Fig. Android-to-Gynoid ratio vs. age in men. Lines indicate 3rd (black), 50th (red), and
97th (green) percentiles.
(PDF)
S7 Fig. Trunk-to-Limb ratio vs. age in women. Lines indicate 3rd (black), 50th (red), and 97th
(green) percentiles.
(PDF)
S8 Fig. Trunk-to-Limb ratio vs. age in men. Lines indicate 3rd (black), 50th (red), and 97th
(green) percentiles.
(PDF)
S9 Fig. Trunk-to-Leg ratio vs. age in women. Lines indicate 3rd (black), 50th (red), and 97th
(green) percentiles.
(PDF)
S10 Fig. Trunk-to-Leg ratio vs. age in men. Lines indicate 3rd (black), 50th (red), and 97th
(green) percentiles.
(PDF)
Body fat reference standards using GE DXA
PLOS ONE | https://doi.org/10.1371/journal.pone.0175110 April 7, 2017 10 / 12

Author Contributions
Conceptualization: MTI WAW AMS AHKM MPH LAK.
Data curation: MTI WAW HWF.
Formal analysis: MTI HWF.
Investigation: MTI WAW AMS AHKM MPH LAK.
Methodology: MTI WAW AMS MPH LAK.
Project administration: AMS MPH LAK.
Resources: AMS LAK.
Supervision: AMS MPH LAK.
Visualization: MTI WAW AMS AHKM MPH LAK.
Writing – original draft: MTI.
Writing – review & editing: MTI WAW AMS AHKM MPH LAK.
References1. Khaodhiar L, McCowen KC, Blackburn GL. Obesity and its comorbid conditions. Clinical Cornerstone.
1999; 2(3):17–31. PMID: 10696282
2. Paffenbarger RS Jr., Hyde RT, Hsieh CC, Wing AL. Physical activity, other life-style patterns, cardiovas-
cular disease and longevity. Acta Medica (Scandinavica) Suppl. 1986; 711:85–91.
3. Healy GN, Wijndaele K, Dunstan DW, Shaw JE, Salmon J, Zimmet PZ, et al. Objectively measured sed-
entary time, physical activity, and metabolic risk: the Australian Diabetes, Obesity and Lifestyle Study
(AusDiab). Diabetes Care. 2008; 31(2):369–71. https://doi.org/10.2337/dc07-1795 PMID: 18000181
4. Kelly TL, Wilson KE, Heymsfield SB. Dual energy X-Ray absorptiometry body composition reference
values from NHANES. PloS one. 2009; 4(9):e7038. https://doi.org/10.1371/journal.pone.0007038
PMID: 19753111
5. Shepherd JA, Fan B, Lu Y, Wu XP, Wacker WK, Ergun DL, et al. A multinational study to develop uni-
versal standardization of whole-body bone density and composition using GE Healthcare Lunar and
Hologic DXA systems. J Bone Miner Res. 2012; 27(10):2208–16. https://doi.org/10.1002/jbmr.1654
PMID: 22623101
6. Kamel EG, McNeill G, Han TS, Smith FW, Avenell A, Davidson L, et al. Measurement of abdominal fat
by magnetic resonance imaging, dual-energy X-ray absorptiometry and anthropometry in non-obese
men and women. Int J Obes Relat Metab Disord. 1999; 23(7):686–92. PMID: 10454101
7. Lorente Ramos RM, Azpeitia Arman J, Arevalo Galeano N, Munoz Hernandez A, Garcia Gomez JM,
Gredilla Molinero J. Dual energy X-ray absorptimetry: fundamentals, methodology, and clinical applica-
tions. Radiologia. 2012; 54(5):410–23. https://doi.org/10.1016/j.rx.2011.09.023 PMID: 22285678
8. Schutz Y, Kyle UU, Pichard C. Fat-free mass index and fat mass index percentiles in Caucasians aged
18–98 y. Int J Obes Relat Metab Disord. 2002; 26(7):953–60. https://doi.org/10.1038/sj.ijo.0802037
PMID: 12080449
9. Wells JC, Haroun D, Williams JE, Wilson C, Darch T, Viner RM, et al. Evaluation of DXA against the
four-component model of body composition in obese children and adolescents aged 5–21 years. Int J
Obes (Lond). 2010; 34(4):649–55.
10. Van Der Ploeg GE, Withers RT, Laforgia J. Percent body fat via DEXA: comparison with a four-compart-
ment model. J Appl Physiol. 2003; 94(2):499–506. https://doi.org/10.1152/japplphysiol.00436.2002
PMID: 12531910
11. Genton L, Karsegard VL, Zawadynski S, Kyle UG, Pichard C, Golay A, et al. Comparison of body weight
and composition measured by two different dual energy X-ray absorptiometry devices and three acqui-
sition modes in obese women. Clin Nutr. 2006; 25(3):428–37. https://doi.org/10.1016/j.clnu.2005.11.
002 PMID: 16375994
Body fat reference standards using GE DXA
PLOS ONE | https://doi.org/10.1371/journal.pone.0175110 April 7, 2017 11 / 12
12. Gillette-Guyonnet S, Andrieu S, Nourhashemi F, Cantet C, Grandjean H, Vellas B. Comparison of bone
mineral density and body composition measurements in women obtained from two DXA instruments.
Mech Ageing Dev. 2003; 124(3):317–21. PMID: 12663129
13. Malouf J, DiGregorio S, Del Rio L, Torres F, Marin AM, Farrerons J, et al. Fat tissue measurements by
dual-energy x-ray absorptiometry: cross-calibration of 3 different fan-beam instruments. JCD: ICSD.
2013; 16(2):212–22.
14. Tothill P, Hannan WJ. Comparisons between Hologic QDR 1000W, QDR 4500A, and Lunar Expert
dual-energy X-ray absorptiometry scanners used for measuring total body bone and soft tissue. Ann
NY Acad Sci. 2000; 904:63–71. PMID: 10865711
15. Plank LD. Dual-energy X-ray absorptiometry and body composition. Curr Opin in Clin Nutr and Metab
Care. 2005; 8(3):305–9.
16. Fan B, Shepherd JA, Levine MA, Steinberg D, Wacker W, Barden HS, et al. National Health and Nutri-
tion Examination Survey whole-body dual-energy X-ray absorptiometry reference data for GE Lunar
systems. JCD. 2014; 17(3):344–77.
17. Glickman SG, Marn CS, Supiano MA, Dengel DR. Validity and reliability of dual-energy X-ray absorpti-
ometry for the assessment of abdominal adiposity. J Appl Physiol. 2004; 97(2):509–14. https://doi.org/
10.1152/japplphysiol.01234.2003 PMID: 15075304
18. Wiklund P, Toss F, Weinehall L, Hallmans G, Franks PW, Nordstrom A, et al. Abdominal and gynoid fat
mass are associated with cardiovascular risk factors in men and women. J Clin EndocrinolMetab. 2008;
93(11):4360–6.
19. Aasen G, Fagertun H, Halse J. Body composition analysis by dual X-ray absorptiometry: in vivo and in
vitro comparison of three different fan-beam instruments. Scand J Clin Lab Invest. 2006; 66(8):659–66.
https://doi.org/10.1080/00365510600898214 PMID: 17101558
20. Min KB, Min JY. Android and gynoid fat percentages and serum lipid levels in United States adults. Clin
Endocrinol. 2015; 82(3):377–87.
21. Kirschner MM, Ozemek C. Hargens T.A., Kaminsky L.A. Comparison of body composition measures
between the Lunar Prodigy and iDXA. Med Sci Sports Exerc. 2011; 43(5): 317–18.
22. Stults-Kolehmainen MA, Stanforth PR, Bartholomew JB, Lu T, Abolt CJ, Sinha R. DXA estimates of fat
in abdominal, trunk and hip regions varies by ethnicity in men. Nutrition & Diabetes. 2013; 3:e64.
23. Pan H, Cole TJ. A comparison of goodness of fit tests for age-related reference ranges. Stat Med. 2004;
23(11):1749–65. https://doi.org/10.1002/sim.1692 PMID: 15160406
24. Kirchengast S, Marosi A. Gender differences in body composition, physical activity, eating behavior and
body image among normal weight adolescents—an evolutionary approach. Collegium Antropol. 2008;
32(4):1079–86.
25. Geer EB, Shen W. Gender differences in insulin resistance, body composition, and energy balance.
Gender medicine. 2009; 6 Suppl 1:60–75.
26. Flegal KM, Shepherd JA, Looker AC, Graubard BI, Borrud LG, Ogden CL, et al. Comparisons of per-
centage body fat, body mass index, waist circumference, and waist-stature ratio in adults. Am J Clin
Nutr. 2009; 89(2):500–8. https://doi.org/10.3945/ajcn.2008.26847 PMID: 19116329
27. Pescatello LS. ACSM’s guidelines for exercise testing and prescription. 9 ed. Baltimore, MD: Lippin-
cott Williams and Wilkins; 2014; 62–73.
28. Gambacciani M, Ciaponi M, Cappagli B, Piaggesi L, De Simone L, Orlandi R, et al. Body weight, body
fat distribution, and hormonal replacement therapy in early postmenopausal women. J Clin Endocrinol
Metab. 1997; 82(2):414–7. https://doi.org/10.1210/jcem.82.2.3735 PMID: 9024228
29. Lovejoy JC, Champagne CM, de Jonge L, Xie H, Smith SR. Increased visceral fat and decreased
energy expenditure during the menopausal transition. Int J Obes. 2008; 32(6):949–58.
30. Wagner DR, Heyward VH. Measures of body composition in blacks and whites: a comparative review.
Am J Clin Nutr. 2000; 71(6):1392–402. PMID: 10837277
31. Hong S, Oh HJ, Choi H, Kim JG, Lim SK, Kim EK, et al. Characteristics of body fat, body fat percentage
and other body composition for Koreans from KNHANES IV. J Korean Med Sci. 2011; 26(12):1599–
605. https://doi.org/10.3346/jkms.2011.26.12.1599 PMID: 22147997
Body fat reference standards using GE DXA
PLOS ONE | https://doi.org/10.1371/journal.pone.0175110 April 7, 2017 12 / 12