Embed Size (px)
Citation preview

Refining Topographic Line Maps
for Use with Ground Based Night Vision Systems
A thesis
submitted in fulfilment of
the requirement for
the Degree of Master of Applied Science (Research)
by
David James Sapparth,
Bachelor of Science (UNSW)
Queensland University of Technology
Faculty of Built Environment and Engineering
School of Design and Built Environment
December 2002


Page
i
Keywords
Night Vision Goggles, NVG, Topographic Line Map, TLM, military operations,
cartography, visual perception, contrast, and map design.

Page ii
Abstract
This study aims to refine the current cartographic standards and specifications used
by the Australian Defence Force to produce the 1:50 000 scale Topographic Line
Map (TLM) so that TLMs can be read with both normal chromatic vision and with
achromatic NVG vision.
The proliferation and integration of Night Vision Goggles (NVG) into the Australian
Army has increased the operating capacity of forces at night. The Australian Army
has incorporated NVG into standard operating procedures and training to the effect
that Australian military personnel do not operate, at night, without NVG. The
increased use of NVG in the Australian Army has required existing systems to be
modified or redesigned to be effective within the limitations of NVG.
The inability to read TLMs effectively with NVG is an identified problem within the
Australian Army. This research has investigated the problems associated with using
NVG and the information, which cannot be read on TLMs with NVG. This
information was compared to a survey of features on a TLM that are critical for
successful military operations. The combined information determined which
features on a TLM were to be refined to enable effective reading with NVG.
The scope of this research limited refinements to current or previous cartographic
standards and specifications used by the Australian Army to produce TLMs.
Refinements were limited to symbology, size, and colour and three critical
information features of contours, watercourses and vegetation. The problems of
cartographic design for a dual vision system (chromatic/achromatic) were
investigated and it was determined that the common factor of value contrast exhibits
the greatest effect on the refinement process.
Prototype TLMs were produced and tested with normal and NVG vision to
determine the best cartographic portrayal of the critical information features, without
compromising the Figure/ground relationship, balance and cognitive meanings of the
TLM. A final product was produced from the prototype experiment results providing
a TLM for use with both normal and NVG vision. The refined TLM has changed

Page
iii
contours from brown to black without changes to symbology or size and
watercourses from 0.1mm width to 0.2mm width without changing colour or
symbology. Vegetation was retained at the current standard and specification.

Page iv
Table of Contents
KEYWORDS ..........................................................................................................................................I ABSTRACT ..........................................................................................................................................II TABLE OF CONTENTS ........................................................................................................................ IV TABLES / FIGURES ............................................................................................................................ VII ABBREVIATIONS ............................................................................................................................... IX GLOSSARY ......................................................................................................................................... X STATEMENT OF ORIGINAL AUTHORSHIP .......................................................................................... XII ACKNOWLEDGEMENTS.................................................................................................................... XIII
CHAPTER 1. INTRODUCTION ....................................................................................................2
1. INTRODUCTION ..........................................................................................................................2 2. BACKGROUND ...........................................................................................................................3
2.1 NVG, the Military and TLMs...........................................................................................3 2.2 NVG Research and Cartography ....................................................................................4 2.3 Importance of Research ..................................................................................................5
3. RESEARCH APPROACH...............................................................................................................6 3.1 Aims of Research.............................................................................................................6 3.2 Scope of Research ...........................................................................................................6 3.3 Methodology....................................................................................................................7
4. OUTLINE OF THE THESIS ............................................................................................................8
CHAPTER 2. CHARACTERISTICS OF RESEARCH ELEMENTS.......................................10
1. NIGHT VISION GOGGLES .........................................................................................................10 1.1 Components...................................................................................................................10 1.2 Characteristics ..............................................................................................................12
2. LIMITATIONS ...........................................................................................................................13 2.1 Visual Acuity .................................................................................................................13 2.2 Scotopic/Monochromatic Vision ...................................................................................14 2.3 Spectral Sensitivity ........................................................................................................14 2.4 Stereopsis and Depth Perception ..................................................................................15 2.5 Reduced Field Of View..................................................................................................15
3. AUSTRALIAN ARMY NVG.......................................................................................................16 3.1 Technical Specifications................................................................................................19 3.2 Method of Operation .....................................................................................................21
4. THE TOPOGRAPHIC LINE MAP (TLM) .....................................................................................24 4.1 The 1:50 000 Scale TLM ...............................................................................................24 4.2 TLM Production Process ..............................................................................................27
5. SUMMARY ...............................................................................................................................31

Page
v
CHAPTER 3. DETERMINING THE VARIABLES ...................................................................33
1. SURVEYING THE ISSUES ...........................................................................................................34 1.1 Surveying All Users .......................................................................................................35 1.2 Surveying the Commanders...........................................................................................43 1.3 TLM Information Priority .............................................................................................47 1.4 Discussion of Survey Results .........................................................................................60
2. TLM SYMBOLOGY AND TONES ...............................................................................................62 2.1 Substantiating the Fundamental Variables and TLM Grid Information .......................62 2.2 Tone Assessment............................................................................................................70
3. SUMMARY ...............................................................................................................................77
CHAPTER 4. CARTOGRAPHIC SOLUTIONS FOR VARIABLES .......................................79
1. TLM DESIGN ...........................................................................................................................79 2. REFINING THE TLM.................................................................................................................86 3. PROTOTYPE SPECIFICATIONS AND CONSTRUCTION .................................................................93
3.1 Standards and Specifications ........................................................................................93 3.2 Prototype Production ....................................................................................................98
4. SUMMARY .............................................................................................................................102
CHAPTER 5. TESTING THE REFINEMENTS.......................................................................104
1. PROTOTYPE TESTING .............................................................................................................104 1.1 Aim and Methodology .................................................................................................104 1.2 Results .........................................................................................................................105
2. DISCUSSION OF RESULTS .......................................................................................................111 3. FINAL PRODUCT ....................................................................................................................114 4. SUMMARY .............................................................................................................................115
CHAPTER 6. CONCLUSIONS AND RECOMMENDATIONS..............................................117
1. SUMMARY .............................................................................................................................117 2. CONCLUSIONS .......................................................................................................................120 3. RECOMMENDATIONS FOR FURTHER RESEARCH.....................................................................121 BIBLIOGRAPHY................................................................................................................................122
APPENDIX A: CABOOLTURE 1971.............................................................................................125
APPENDIX B: MOUNT TAMBORINE 1988 ................................................................................126
APPENDIX C: WIDE BAY TRAINING AREA SPECIAL 1999. ................................................127
APPENDIX D: SURVEY - OPERATING WITH NVG ................................................................128
APPENDIX E: SURVEY QUESTIONS FOR PL COMD/PL SGT/ SECT COMD/SECT 2IC.134

Page vi
APPENDIX F: MAP INFORMATION PRIORITY......................................................................138
APPENDIX G: PROTOTYPE 1......................................................................................................143
APPENDIX H: PROTOTYPE 2......................................................................................................144
APPENDIX I: PROTOTYPE 3 .......................................................................................................145
APPENDIX J: PROTOTYPE 4.......................................................................................................146
APPENDIX K: TLM PROTOTYPE EXPERIMENT...................................................................147
APPENDIX L: FINAL TLM, MOUNT TAMBORINE ................................................................156

Page
vii
Tables / Figures
FIGURE 2.1 NVG INTENSIFYING PROCESS .............................................................................................11 FIGURE 2.2 ITL MINI N/SEAS NVG .....................................................................................................16 FIGURE 2.3 MINI N/SEAS COMPONENTS ...............................................................................................17 FIGURE 2.4 MINI N/SEAS WITH HEAD HARNESS....................................................................................18 FIGURE 2.5 AUSTRALIAN SOLDIER WEARING MINI N/SEAS..................................................................18 FIGURE 2.6 EXTENDED RANGE LENS .....................................................................................................20 FIGURE 2.7 VIEW THROUGH NVG COMPASS .........................................................................................21 FIGURE 2.8 STIPPLE DESCRIPTORS .........................................................................................................28 FIGURE 3.1 EASE OF READING TLM INFORMATION WITH NVG .............................................................39 FIGURE 3.2 CULTURAL INFORMATION 1.................................................................................................49 FIGURE 3.3 CULTURAL INFORMATION ...................................................................................................50 FIGURE 3.4 HYDROGRAPHY INFORMATION 1 .........................................................................................52 FIGURE 3.5 HYDROGRAPHY INFORMATION 2 .........................................................................................53 FIGURE 3.6 HYPSOGRAPHY INFORMATION.............................................................................................55 FIGURE 3.7 VEGETATION INFORMATION ................................................................................................56 FIGURE 3.8 TLM INFORMATION / MARGINAL INFORMATION.................................................................58 FIGURE 3.9 CRITICAL INFORMATION......................................................................................................59 FIGURE 3.10 TONE TEST WHITE ............................................................................................................71 FIGURE 3.11 TONE TEST 25% GREY ......................................................................................................72 FIGURE 3.12 TONE TEST 50% GREY ......................................................................................................73 FIGURE 3.13 TONE TEST 75% GREY ......................................................................................................74 FIGURE 3.14 TONE TEST BLACK ............................................................................................................75 FIGURE 4.1 BASIC FORMULA FOR CONTRAST ........................................................................................83 FIGURE 4.2 SIMULTANEOUS CONTRAST .................................................................................................85
TABLE 2.1 MINI N/SEAS TECHNICAL SPECIFICATIONS .........................................................................19 TABLE 2.2 COLOURS AND STIPPLES USED FOR PRINTING 1:50 000 TLM................................................30 TABLE 3.1 RELATIONSHIP BETWEEN INFORMATION UNREADABLE WITH NVG AND INFORMATION
CRITICAL TO MILITARY OPERATIONS ............................................................................................61 TABLE 3.2 CRITICAL INFORMATION READABILITY ................................................................................65 TABLE 4.1 SYMBOLOGY FOR TLM REFINEMENT ...................................................................................88 TABLE 4.2 SYMBOL COMBINATIONS FOR TLM PROTOTYPES ................................................................89 TABLE 4.3 PROTOTYPE ONE...................................................................................................................94 TABLE 4.4 PROTOTYPE TWO ..................................................................................................................95 TABLE 4.5 PROTOTYPE THREE ...............................................................................................................96 TABLE 4.6 PROTOTYPE FOUR .................................................................................................................97 TABLE 5.1 READABILITY OF CRITICAL FEATURES ON PROTOTYPES.....................................................110 TABLE 5.2 RATING OF CRITICAL FEATURES ON PROTOTYPES ..............................................................111

Page viii
TABLE 3.3 BEST CARTOGRAPHIC PORTRAYAL FOR BOTH TYPES OF VISION........................................111

Page
ix
Abbreviations
ABC Automatic Brightness Control
AHD Australian Height Datum
AGD 66 Australian Geodetic Datum 1966
BSP Bright Source Protection
BUA Built Up Areas
CIE International Commission on Illumination
DIGO Defence Intelligence and Geospatial Organisation
ESRI Earth Sciences Research Institute
FOV Field Of Vision
GIB Geospatial Intelligence Branch
GIS Geographic Information System
GPS Global Positioning System
IR Infra Red
JOG Joint Operation Graphic
MCP Micro Channel Plate
NVD Night Vision Device
NVG Night Vision Goggle
NVG ER Night Vision Goggle Extended Range
SOP Standard Operating Procedures or Standing Operating Procedures
SYMBAS SYMBolisation All Series
TLM Topographic Line Map

Page x
Glossary
Achromatic An object that is free from colour, being made only of white or black.
Automap An automated digital system of map compilation used by the Australian
Army for production of mapping.
Automatic Brightness Control An electronic feature of NVG that automatically
reduces voltage to the MCP to keep the image intensifier’s brightness within optical
limits.
Automatic Shut Off Device An automatic system within NVG, which turns the
NVG off during periods of extreme bright conditions to avoid damage to the NVG.
Bright Source Protection An electronic feedback circuit that automatically shuts
down the NVG when a bright flash enters the scene.
Chromatic An object that has colour.
Compilation The production of a new or revised map or chart from existing maps,
aerial photographs, surveys or other source data.
Dioptre Unit of refractive power when this is expressed as reciprocal of focal length
in metres.
Field of View The diameter of the imaged area when viewed through NVG.
Hydrography Features both natural and human made of which water is the main
constituent, either permanently or intermittently.
Hypsography Features, which deal with the height of an object or relief.
Lithography Process of printing so that the treated area of the printing plate can be
inked but the remaining area rejects ink.

Page
xi
Micro Channel Plate A metal coated glass disc that multiplies the electrons
produced by the photocathode within NVG.
Monochromatic Of a single colour or tones of a single colour.
Pantone Matching System A commercially recognised set of defined colours used
in the printing industry.
Photocathode A plate that converts photons into electrons through the process of
photoemission.
Photoemission The conversion of photons into electrons.
Repromat Material, generally in the form of positive or negative copies on film of
each colour plate, from which a map may be reprinted without redrafting.
Scintillation A faint, random sparkling effect throughout the NVG image.
Characteristic of MCP and more pronounced in low light conditions.
Stereopsis The perception of depth based on the slightly different view given by each
eye.
Stipple A photographically or mechanically prepared transparent plastic sheet
depicting map symbolisation over the whole area.
SYMBolisation All Series (SYMBAS) Australian Army Survey Corps Publication
defining, describing and listing all standards and specifications for production of
maps from 1:25 000 to 1:250 000 scale.

Page xii
Statement of Original Authorship
The work contained in this thesis has not been previously submitted for a degree or
diploma at any higher education institution. To the best of my knowledge and belief,
the thesis contains no material previously published or written by another person
except where due reference is made.
Signed:______________________________________ Date:_____________

Page
xiii
Acknowledgements
I would like to thank Doctor John Hayes for his guidance throughout the year and his
persistence in helping me understand how academia works. I would like to thank the
Australian Army for giving me the chance to undertake this study and allowing Units
to participate and provide input to the study. Thanks especially to Major Bill
Thomson, Officer Commanding 1st Topographical Survey Squadron and the
members of the 1st Topographical Survey Squadron, specifically Warrant Officers
Steve Hill and Ian Read, Sergeant Brian Paul and Corporal Nick Vanderswan for all
their help over the course of this research.
Special thanks to Josh Andrews for his input, assistance and guidance through the
technical minefields of this research and keeping me in touch with reality.
Finally a big thanks to Lisa who put up with all the crazy discussions, late nights, lost
weekends and for her ability to feign interest in something she knew little about, but
best of all for sticking by me.

Page xiv

Page 1
Chapter 1
Introduction

Page 2
Chapter 1. Introduction
1. Introduction
During the twentieth century warfare and the art of combat changed. Ground forces
were accorded the ability to operate effectively at night. The battlefield changed
from a dual system of night and day, where ground forces mainly operated during the
day and rested at night, to a twenty-four hour system.
The development of Night Vision Goggles (NVG) in the 1960’s provided the basis
for turning warfare into a twenty-four hour battlefield, without the need for pauses by
ground forces at night. This level of operability allowed soldiers to operate
effectively but at the same time increased training requirements, increased fatigue,
and increased the possibility of system fault. Whilst soldiers were better able to
operate at night, other systems used by soldiers to carry out their tasks were not
modified to suit the new environment.
The Topographic Line TLM (TLM) has always been used by military forces for
control and movement and is the main source of geographic information for the
soldier operating on the battlefield. TLMs are designed for use with normal colour
vision during daylight conditions. Since the inception of NVG, little research or
change to TLMs has been undertaken for them to be used effectively with NVG.
This research aims to investigate the operating parameters between Australian Army
ground forces, NVG and TLMs in order to make the TLM more functional when
used with NVG.

Chapter 1: Introduction Page 3
2. Background
2.1 NVG, the Military and TLMs
Since their inception in the 1960’s, night vision devices have been utilised by the
military to increase efficiency and increase work rates during reduced light
conditions and at night. The initial NVG were cumbersome and provided poor visual
acuity. Increases in technology and vision systems allowed NVG to develop through
three generations (I, II and III), each generation reducing system size and improving
visual acuity. NVG were initially developed for weapon scopes and allowed weapon
operators to deliver accurate firepower on the battlefield at night. As acuity
improved and size reduced, NVG were extended to other areas of military operations
such as surveillance, aircraft operations and general use for all soldiers.
The Australian Army first used NVG during the Vietnam conflict.1 After Vietnam,
NVG were continued in use by the Australian Army, primarily by Special Forces,
Infantry and Aviation assets. In the late 1990’s, with the development of NVG
Generation III, the system was introduced for use with all Army units. The
introduction to all units improved the ability to operate effectively at night, increased
efficiency at night and reduced casualties on the battlefield. Whilst NVG has
increased operating tempos and accorded the Australian soldier a technological edge,
NVG has not been combined effectively with other Army systems.
The Topographic Line Map (TLM) is the basis for all geographical information for
the soldier operating in the field. TLMs have been fundamental to warfare
throughout history. Without TLMs military forces cannot conduct operations,
boundaries cannot be described or visualised and munitions and artillery cannot be
delivered effectively. The 1:50 000 TLM, first introduced in the late 1950’s2, is the
standard TLM by which the majority of Australian Army units conduct training and
operations. The standards and specifications by which the TLM is produced, were
developed for normal daytime vision. The standards and specifications do not take
1 Rowe (1987). Vietnam, The Australian Experience. Sydney, Time-Life Books
2 Coulthard-Clark (2000). Australia's Military Map Makers. Melbourne, Oxford University Press. 145

Page 4 Chapter 1: Introduction
into account the organic limitations of NVG, making the two systems (NVG / TLM)
incompatible.
The Australian Army has identified a problem of incompatibility between the two
systems (NVG / TLM) through operational experience, post operation reports, NVG
training and navigation training.3 The need for research into this area has increased
since the introduction of NVG to all ground forces within the Australian Army and
the increasing amount of operations in which the Australian Army is involved.
2.2 NVG Research and Cartography
NVG research has concentrated on two main areas: technological development of
NVG and the limitations of NVG. The technological development of NVG is not
relevant to this research and will not be further discussed. Of relevance to this
research are studies undertaken into the limitations of NVG.
Research into NVG limitations has focused on four specific areas. These are visual
acuity, depth perception, spectral performance and system focus. Relevant to this
research are visual acuity and spectral performance studies. Studies of visual acuity
with NVG have investigated the degradation of visual image when using NVG.
Tests have been undertaken with eye charts, lettering systems and symbology to
determine visual thresholds that are generally less than normal unaided vision. The
spectral sensitivity of NVG is much higher than normal vision and focused towards
the near infrared of the light spectrum. The difference in sensitivity changes the way
in which objects are seen and may affect the ability to accurately comprehend
information.
3 The general problems associated with reading TLMs with NVG is well known within the Australian Army. Specific reference to reading TLMs with NVG can be found in some post operation and exercise reports, the detailing of which here, would limit the distribution of this research.

Chapter 1: Introduction Page 5
The majority of NVG research undertaken is focused on NVG limitations that affect
aircraft and helicopter operations. Only a small minority focus on the limitations of
ground based NVG systems. No previous NVG research has incorporated a TLM
into a study.
During the course of this study, no previous research on the relationship between
NVG and TLMs or cartography was discovered. The lack of prior research does not
allow this study to draw on previous experience or past conclusions. There is no
reference frame for this study to build upon, except those gathered anecdotally by the
author.
2.3 Importance of Research
This research is important for the following reasons:
• To solve a problem, identified by the Australian Army.
• To improve efficiency of military operations and reduce reliance on other, more
cumbersome or tactically inefficient, methods for reading TLMs at night.
• To improve the survivability chances of a soldier on the battlefield. If soldiers
are able to accurately read a TLM with NVG, they will be able to make better
decisions and reduce risk.
• No studies have been previously undertaken on the direct relationship between
NVG and TLMs. This research will identify areas for future research and
improvement of NVG and TLM relationships.
• The findings of this research may be applied to any NVG and TLM relationship
regardless of individual characteristics of either the NVG system or TLM
standards and specifications.

Page 6 Chapter 1: Introduction
3. Research Approach
3.1 Aims of Research
The aims of this research are to refine Australian Army TLM standards and
specifications and to produce a TLM that can be read and used effectively with both
normal vision and NVG.
Other secondary aims of this research are:
• Identification of problems associated with using Australian Army NVG.
• Identification of cartographic theory and design techniques, that are applicable to
NVG use.
• Identification of TLM information and features that are critical to the successful
conduct of military operations.
• Identification of future research areas on NVG and TLM relationships.
3.2 Scope of Research
In order to meet the research aim, and avoid duplication, limitations placed on this
research are:
• The TLM must be able to be used both with normal vision and NVG vision.
• Any refinements made to the current standard for 1:50 000 TLMs will be
derived, where possible, from previous and current cartographic standards and
specifications as used by the Australian Army. The use of previous and current
standards and specifications to facilitate change within the TLM, will reduce any
qualitative or perception issues arising during the research.
Chapter 1: Introduction Page 7
• Refinements to the TLM will be undertaken for use with passive NVG only.
Infra red light and active night imaging systems and applications will not be
addressed.
• The research is centred on ground based NVG as is currently used by the
Australian Army. It makes no attempt to test, research or investigate NVG
systems used by Australian Army Pilots or Aircrew.
3.3 Methodology
To achieve the aim of this research, the methodology will involve use of qualitative
and quantitative techniques. To identify initial problems with NVG and TLMs,
surveys will be undertaken of experienced NVG users within the Australian Army.
Surveys will focus the research and identify key components for further
investigation. In conjunction with the surveys, a qualitative assessment of TLM
information priorities will be conducted. This will further refine the research and
identify those information features on a TLM that are critical to the effective conduct
of military operations. Experiments will be conducted to determine readability of
critical information features with NVG.
After the surveys and experiments are complete and the data analysed, cartographic
design techniques will be investigated to determine the best method of resolving
identified problems with the TLM. The principles of TLM design, colour use,
contrast, symbology and size will all be investigated with regard to data previously
gained in this study, NVG and the current TLM standards and specifications.
Solutions will be proposed to rectify faults within the NVG / TLM system with the
aim of developing prototype TLMs.
To test hypothesis developed throughout the research, prototype TLMs will be
produced. The prototypes will be tested for their usability, clarity and acuity under
both normal and NVG viewing conditions. The results of testing will be analysed
and discussed with respect to the primary aim of this research.

Page 8 Chapter 1: Introduction
4. Outline of the Thesis
This thesis consists of six chapters.
• Chapter One introduces the context of the research. It outlines NVG and TLMs
and discusses links between NVG and cartography. The research aims, scope
and methodology are detailed.
• Chapter Two details the characteristics of the research elements. It discusses and
describes in detail NVG and its limitations; the NVG used by the Australian
Army and the methods by which it is used. The TLM, its standards and
specifications and production methods are also discussed.
• Chapter Three determines the variables involved with NVG and TLM. It details
and discusses surveys undertaken during the research to identify problems
between the systems. Experiments undertaken with NVG to determine TLM
readability and tone identification are also discussed.
• Chapter Four discusses and presents cartographic options for correction of faults
within the NVG / TLM system. Cartographic theory is reviewed to determine
critical factors for TLM refinement. Standards and specifications are detailed for
the prototype TLMs.
• Chapter Five presents and discusses the results of the experiments conducted on
the prototype TLMs.
• Chapter Six summarises research contributions and findings and draws
conclusions from the research. Recommendations are made for further research.

Page 9
Chapter 2
Characteristics of Research Elements

Page 10
Chapter 2. Characteristics of Research Elements
In this research, there are two major elements: NVG and TLMs. This chapter
describes NVG, their limitations and the current model used by the Australian Army.
It then describes how the Australian Army uses NVG. Finally, the chapter will
describe the TLM and TLM production process used by the Australian Army.
1. Night Vision Goggles
1.1 Components
NVG are image intensification devices that work by taking a small amount of
photons, converting them into electrons, multiplying them, then converting the
electrons into photons to form a picture the human eye can recognise.
The amount of photons entering the device is dependent on illuminant levels from
environmental surrounds. The photons are collected and focused onto a
photocathode surface where photoemission occurs and photons are converted to
electrons. The electrons are multiplied by passing through a Micro Channel Plate
(MCP). A MCP is a metal coated glass disc that multiplies electrons produced by the
photocathode. Once multiplied the electrons are projected onto a phosphor
luminescent screen. The luminescent screen releases photons allowing an amplified
image to be detected by the human eye. There are four main components of a NVG.
These are displayed in Figure 2.1, with the light intensification process.
• Lens. The collection and focusing of available photons is achieved by an
objective lens. The lens differs in size depending on the type of NVG and the
visual distance the NVG is intended to perform at.
• Photocathode. The purpose of the photocathode is to convert photons into
electrons through photoemission.

Chapter2: Characteristics of Research Elements Page 11
• Microchannel Plate (MCP). The purpose of the MCP is to multiply electrons.
The MCP is made of millions of hollow glass tubes and is electrified, so that as
an electron collides with the MCP more electrons are generated, increasing the
amount of electrons available in the system.
• Phosphor Screen. The phosphor screen converts electrons into photons and
provides an image for viewing by the human eye.
Figure 2.1 NVG Intensifying Process
Photons
Electrons
Focusing
Lens
Photocathode MCP Phosphor
Screen

Page 12 Chapter 2: Characteristics of Research Elements
1.2 Characteristics
NVG are primarily characterised by their generation, which relates to their
technological chronology and performance.
• Generation I tubes. Developed around the 1960’s with low intensifying
properties, high distortion rates and a short tube life.
• Generation II tubes. Were the first NVG to utilise MCPs. This improved image
quality and increased tube life. The MCP allowed NVG to be reduced in size,
allowing development of goggles and hand-held systems.
• Generation III tubes. Generation III NVG were developed in the late 1970’s and
are characterised by two increases in technology. Firstly, introduction of a
gallium arsenide photocathode increased performance, allowing detection of
objects at greater distances and allowing NVG to work at very low illumination
levels. Secondly, the construction of an ion-barrier film on the MCP increased
the overall tube life. Generation III tubes are also characterised by automatic
brightness control which provides for a steady state of scene brightness under
varying light conditions, including conditions normally too bright for previous
generation NVG.4
NVG are also characterised by their intended use; binoculars, scopes and camera
tubes and whether they are a monocular, binocular or biocular. NVG have improved
operations at night, but have generic limitations that must be taken into
consideration.
4 Australian Army (2000). User Handbook - Individual Night Fighting Equipment. Puckapunyal, Combined Arms Doctrine and Development Section, Army Combat Arms Training Centre. 11

Chapter 2: Characteristics of Research Elements Page 13
2. Limitations
2.1 Visual Acuity
The quality of an image formed by NVG, visual acuity, is relational to the amount of
available ambient illumination.5 If too much light is present, for example a street
light, the image presented will flare or ‘whiteout’. If enough light is not available,
for example a darkened room, the image will be unreadable by the human eye.
Visual acuity is mostly determined by ambient illumination, however the system
components of NVG can affect visual acuity. The factors that predominately affect
visual acuity are the MCP and system focus.
The MCP affects visual acuity in two ways. Firstly, the spacing of elements within
the MCP affects visual acuity. The smaller the distance between elements, the better
visual acuity is. Secondly, the MCP affects visual acuity through scintillation.
Scintillation is a faint, random sparkling effect throughout the visual image produced
which affects visual acuity and image definition. It is a normal characteristic of all
MCP and is more pronounced under low light conditions. Under optimal ambient
illumination conditions and taking MCP element spacing and scintillation into
account, Generation III MCP allows for visual acuity of about 20/40.6
The direct relationship between ambient illumination and image quality has an effect
on the ability to read TLMs and limits design parameters for TLM production. As
image quality is reduced, definition, readability and perception are lost, posing
difficulties to design a single TLM for all conditions.
5 Kotulak and Rash C (1992). Visual Acuity with Second and Third Generation Night Vision Goggles Obtained from a New Method of Night Sky Simulation Across a Wide Range of Target. Fort Rucker, Alabama, United States Army Aeromedical Research Laboratory;Rabin (1994). Vernier Acuity Through Night Vision Goggles. Fort Rucker, Alabama, United States Army Aeromedical Research Laboratory;Wiley (1989). Visual Acuity and Stereopsis with Night Vision Goggles. Fort Rucker, Alabama, United States Army Aeromedical Research Laboratory
6 Rabin (1996). Image Contrast and Visual Acuity Through Night Vision Goggles. Fort Rucker, Alabama, United States Army Aeromedical Research Laboratory: 3

Page 14 Chapter 2: Characteristics of Research Elements
2.2 Scotopic/Monochromatic Vision
NVG are designed for use at night, when scotopic vision is greatest. Scotopic vision
uses the rods in the human eye, which do not differentiate colours. The rods provide
a monochromatic view which is accentuated by the green phosphor lens within NVG.
The green monochromatic view seen through NVG greatly impacts on the ability to
read TLM products. TLM products are designed for use during daytime when colour
discrimination is greatest. NVG reduces colour discrimination to contrast and colour
value. This will be discussed further in Chapter 4.
2.3 Spectral Sensitivity
The human eye has a normal spectral response of approximately 380 to 780 nm,
designed for optimum daytime use. Scotopic vision is approximately 380-620 nm.
Generation III NVG have a spectral response of approximately 625 to 930 nm. The
higher spectral response allows NVG to make best use of ambient light from the
night sky, which approximately peaks at 700 to 900 nm7, in the infrared region of the
spectrum. Spectral responses cannot be used alone to judge vision as when we look
at an object we are seeing the reflected light not pure light. Spectral reflectivity
differs with scotopic and photopic vision and within different regions of the
spectrum. This results in some objects having a different appearance and at times
colour value, with NVG compared to unaided vision.
7 Gamma Scientific (1999). Measuring Spectral Performance of Night Vision Devices. San Diego, Gamma Scientific: 2

Chapter 2: Characteristics of Research Elements Page 15
2.4 Stereopsis and Depth Perception
Stereopsis is the perception of depth based on the slightly different view given by
each eye. With NVG the stereopsis threshold is about four times greater than with
normal viewing.8 Numerous studies have been undertaken on the effect of NVG on
stereopsis and depth perception.9 The studies have shown that depth perception
varies greatly with NVG type and mostly affects operators of moving vehicles. Most
studies were undertaken in a laboratory environment using Snellen Charts, computer
displays or discrimination of objects at different distances. These studies, whilst not
accounting for the real time representation of flying an aircraft or driving a vehicle,
have proved that NVG effects distance judgement. Most participants within the
studies underestimated distances and had difficulty with discriminating object
sizes.10 Anecdotal evidence has also related depth perception and the use of NVG as
a factor in some rotary wing aircraft accidents.11
2.5 Reduced Field Of View
As an optical instrument, NVG reduces the observer’s Field Of View (FOV). NVG
reduces the FOV to approximately 40 degrees and thereby limits the ability of an
observer to integrate and compare different areas of the visual scene.12 When using
8 Zalevski, et al (2001). Size Estimation with Night Vision Goggles. Melbourne, Defence Science and Technology Organisation: 6
9 Kotulak and Rash C (1992) Visual Acuity with Second and Third Generation Night Vision Goggles Obtained from a New Method of Night Sky Simulation Across a Wide Range of Target;Niall, et al (1999). "Distance estimation with night vision goggles: A little feedback goes a long way." Human Factors 41(3);Rabin (1994). Optical Defocus: Differential Effects on Size and Contrast Letter Recognition Thresholds. Fort Rucker, Alabama, United States Army Aeromedical Research Laboratory
10 Crowley (1991). Human factors of night vision devices: Anecdotes from the field concerning visual illusions and other effects. Fort Rucker, AL, US Army Aeromedical Research Laboratory;DeLucia (1999). "Critique of "distance estimation with night vision goggles: A little feedback goes a long way"." Human Factors 41(3).
11 Crowley Human factors of night vision devices: Anecdotes from the field concerning visual illusions and other effects;Essock, Sinai, McCarley, Krebs and DeFord (1999). "Perceptual ability with real-world nighttime scenes: Image-intensified, infrared and fused colour imagery." Human Factors 41(3);Hatley (2001). "NVGs: Don't fly at night without them." Flying Safety 57(9);Niall (1999). "The art of descrying distance." Human Factors 41(3);
12 Zalevski, et al (2001) Size Estimation with Night Vision Goggles: 6

Page 16 Chapter 2: Characteristics of Research Elements
NVG, more scanning of the visual scene is required than with normal viewing,
possibly leading to disorientation.13 The effect of the reduced FOV on TLM viewing
and comprehension will be further investigated in Chapters 3 and 4.
3. Australian Army NVG
The Australian Army has used image intensification devices since the early 1960’s.
The focus of this research and the model used throughout testing is the current NVG
used by Australian Defence Force ground forces. In 1999 the Australian Defence
Force acquired the International Technologies (Lasers) Limited Mini N/SEAS single-
eye acquisition sight, for use with all ground based forces in the Australian Army and
selected elements of the Australian Air Force and Navy. The MINI N/SEAS is a
night vision monocular system in a single eye configuration, pictured at Figure 2.2.
A diagram showing main components of the NVG is at Figure 2.3; technical
specifications are at Table 2-1.
Figure 2.2 ITL Mini N/SEAS NVG14
13 Wells and M. Venturio (1990). "Performance and head movements using a helmet mounted display with different sized fields of view." Optical Engineering 29: 876
14 International Lasers Technology Ltd (2002). www.itlasers.com. 2002

Chapter 2: Characteristics of Research Elements Page 17
Figure 2.3 Mini N/SEAS Components15
One eye is equipped with the NVG while the other remains free and retains normal
vision.16 The Australian system is equipped with a Generation III tube and can be
used as a hand held scope, mounted on a head harness or attached to weapons with
the aid of a mount. The usual configuration for military personnel is to use the NVG
mounted on a head harness, as seen in Figures 2.4 and 2.5. The head harness allows
the operator to rotate the NVG, by means of a swivel mount, away from the viewing
eye to clear the field of view.
15 Australian Army (2000) User Handbook - Individual Night Fighting Equipment. 1-5
16 Unknown (2002). Janes Electro-Optical Devices, Janes. 337

Page 18 Chapter 2: Characteristics of Research Elements
Figure 2.4 Mini N/SEAS with head harness17
Figure 2.5 Australian Soldier wearing Mini N/SEAS18
17 Australian Army (1999). Training Information Bulletin 79 - Project NINOX - Night Fighting Equipment. 2.
18 Australian Army (2002). www.army.gov.au.

Chapter 2: Characteristics of Research Elements Page 19
3.1 Technical Specifications
Table 2.1 Mini N/SEAS Technical Specifications19
19 Australian Army (2000) User Handbook - Individual Night Fighting Equipment. 11-2

Page 20 Chapter 2: Characteristics of Research Elements
The Mini N/SEAS includes the following characteristics:20
• Automatic Brightness Control (ABC). Power is increased to the NVG when
light levels are low to maintain constant scene brightness.
• Bright Source Protection (BSP). A sensor built into the NVG detects bright
light sources, such as daylight, and automatically shuts the system off for
protection and to avoid damage.
• Infra Red (IR) Light. The NVG is equipped with an IR light that provides
additional close range illumination when ambient light is insufficient.
• Automatic Shut Off Device. When used on the head harness, the NVG shuts
down when rotated away from the viewing eye.
The Mini N/SEAS can be fitted with the following attachments:21
• Extended Range Lens. Provides the user with 3x magnification but reduces the
FOV to 13.30. It is attached to the front of the NVG and used mainly for
surveillance and target acquisition.
Figure 2.6 Extended Range Lens22
20 Ibid. 3-4
21 Ibid. 5
22 Australian Army (2002) www.army.gov.au

Chapter 2: Characteristics of Research Elements Page 21
• Compass. The NVG can be fitted with a compass to the front of the system to
assist navigation. When looking through the NVG a small graduated compass
dial is displayed in the scene. When used whilst wearing the NVG with the head
harness an error of + 150 may occur.
Figure 2.7 View through NVG Compass23
3.2 Method of Operation
NVG has increased soldiers’ ability to operate on the battlefield at night and hence
increased the operational tempo of warfare. NVG accords soldiers a greater ability
for movement at night, for easier detection, recognition and suppression of targets
and for greater control of personnel and units on the battlefield. The NVG, whilst
enhancing operations at night, has required changes to operating procedures,
generally because of system limitations.
23 Australian Army (2000) User Handbook - Individual Night Fighting Equipment. 2.6

Page 22 Chapter 2: Characteristics of Research Elements
The NVG is primarily used mounted to the head harness on the non-master eye of the
soldier. This is to allow the soldier free movement with their hands and to allow
their master eye free to sight their weapon.24 Each member of an infantry section25
wears NVG when conducting night operations. By each member wearing NVG, the
section's ability to communicate and work on visual cues is increased. Soldiers are
trained to operate the NVG with both eyes open. Whilst difficult to master and
requiring extensive training it allows soldiers to limit the effects of a reduced FOV
and other limitations inherent to NVG. It also allows scotopic vision to be retained
in one eye should the NVG system fail. When ambient illumination is greatest and
terrain is non-restrictive, NVG is used as secondary visual aid and kept on the head
harness but rotated away from the viewing eye. This is undertaken to reduce fatigue.
The weight of the NVG when worn on the head harness (557g) causes soldiers to
experience fatigue more quickly than usual. Rest periods are more frequently
required to minimise fatigue. Neck strengthening exercises are conducted to combat
fatigue and to reduce the tendency of the soldier wearing NVG to lean forward with
the added weight.26 All soldiers undertake an extensive initial training course on
NVG. Once qualified, continuity training is undertaken through exercises and
activities planned by units within the Army. Specialist training may also be
undertaken to concentrate on unit specific tasks, surveillance or navigation using
NVG.
24 It is common practice that all soldiers are taught to shoot with their master eye to improve efficiency and accuracy. Weapons are fitted with an NVG Night Weapon Sight, similar to the Mini N/SEAS and a Night Aiming Device that emits an infrared laser, which is calibrated to the weapon aim point.
25 An infantry section is the smallest fighting unit of the Australian Army. It comprises nine soldiers and is commanded by a corporal. Three sections make a platoon, three platoons make a company, and five companies (4 general, 1 support) comprise a battalion.
26 Australian Army (1999) Training Information Bulletin 79 - Project NINOX - Night Fighting Equipment. 6.1-6.5

Chapter 2: Characteristics of Research Elements Page 23
NVG has increased the ability to navigate at night. The ability of a soldier to view
and select objects at greater distance negates the need to continually halt and check
bearings. The NVG compass allows soldiers to quickly find and maintain their
bearing whilst patrolling. It is intended only to assist navigation not to be the
principal means of navigation. 27
When reading TLMs or other printed material, soldiers are trained to compensate for
focus range, which begins at 25cm for the Mini N/SEAS NVG. To ensure the best
visual acuity and focus, soldiers are taught to place their extended hand between the
NVG and the TLM. The thumb should touch the end of the NVG and the little finger
should touch the TLM. This gives the soldier a quick approximation of 25cm and
allows them to accurately focus on the TLM. Though this method works reasonably
well for the majority of personnel, those already with inherent eye conditions may
have difficulty focusing the NVG for TLM reading. To assist reading of close
objects, the IR light can be used. Army doctrine recommends using the IR sparingly
to avoid detection by an enemy with IR capabilities.28
The primary navigation tool of the soldier remains the prismatic compass and TLM.
Increasingly soldiers use GPS to assist navigation, increase their accuracy and track
patrol routes. Whilst different technological advances aid navigation, the reliance of
the soldier on TLMs as the foundation for navigation remains unchanged.
27 Ibid. 3.5
28 Ibid. 3.

Page 24 Chapter 2: Characteristics of Research Elements
4. The Topographic Line Map (TLM)
TLMs have been fundamental to warfare throughout history. Without TLMs military
forces cannot conduct operations, boundaries cannot be described or visualised and
munitions cannot be delivered effectively. All TLMs used by the Australian Army
are produced to standards and specifications developed in consultation with
Australian agencies and international agencies. The TLM is produced as a standard
product at large and medium scales of 1:25 000, 1:50 000 and 1:100 000. In the
Australian Army, the most commonly used TLM for conducting tactical operations is
the 1:50 000 scale TLM.
4.1 The 1:50 000 Scale TLM
The Australian Army first produced the 1:50 000 scale TLM in the 1950’s. The
change from the imperial one mile to one inch scale to the metric 1:50 000 was
adopted by Australia to comply with standardisation agreements reached following
the creation of the South-East Asia Treaty Organisation (SEATO).29 The new 1:50
000 TLM contained the same cartographic presentation as used in previous TLMs.
The standards and specifications were detailed in the “Manual of TLM
Specifications” produced by the Royal Australian Survey Corps in 1960.30 An
example of a TLM produced with these specifications is Caboolture, printed 1971,
which is included at Appendix A. In the late 1970’s, the introduction of digital TLM
production methods through ‘Automap’ required revision of cartographic standards
and specifications. A new document titled “Symbolisation – All Series” or
“SYMBAS” was produced in 197831 to detail new digital standards for cartographic
portrayal of most geographic features. SYMBAS Edition 2 was produced in 198432,
detailing cartographic changes to align with new ‘Automap 2’ software which
29 Coulthard-Clark (2000) Australia's Military Map Makers. 145
30 Australian Army (1960). Manual of Map Specifications Large and Medium Scale Series, Royal Australian Survey Corps
31 Royal Australian Survey Corps (1984). Symbolization - All Series (SYMBAS) Ed 2, Royal Australian Survey Corps
32 Ibid.

Chapter 2: Characteristics of Research Elements Page 25
enhanced the digital TLM production process. SYMBAS Edition 2 detailed the
cartographic standards by which most of the current 1:50 000 TLMs have been
produced. An example is MT Tamborine, printed 1988, included at Appendix B.
Since its inception, SYMBAS Edition 2 has undergone minor revision but remains
the foundation on which Australian Army TLMs are produced. Changes were made
to vegetation portrayal in the late 1990’s, however few TLMs have been produced
using the new vegetation specifications. An example of the current 1:50 000 TLM
standards and specifications is included at Appendix C, on the TLM Wide Bay
Training Area Special, printed 1999.
Throughout its history, the 1:50 000 TLM has undergone some changes, most
notably concerning vegetation portrayal, horizontal datum and cultural portrayal.
These changes have been to reflect new international and national standards and to
incorporate new digital TLM making technologies into the TLM production process.
The fundamental principles of cartographic design and theory have not differed with
each new 1:50 000 edition. Vegetation has remained green in colour, roads have
remained red/brown, hydrography features remained blue and contours have
remained brown. These colours are standard throughout cartography and are
maintained to ensure the best cognitive appraisal by users of TLMs. To ensure the
best results for this research a SYMBAS Edition 2 TLM was chosen to best reflect
the cartographic diversity of TLMs and represent the most frequently used TLM.

Page 26 Chapter 2: Characteristics of Research Elements
As stated previously, the majority of Australian 1:50 000 TLMs have been produced
under the SYMBAS Edition 2 specifications. For this reason, the TLM chosen for
research was 95423 Mt Tamborine Ed 2 1:50 000 scale, printed 1998. This TLM
best reflects the type of TLM used by the Australian Army even though it does not
reflect the current standards. It provides a diverse amount of cartographic features
such as:
• Representation of all types of vegetation: rain forest, dense, medium, scattered,
orchard and pine.
• Representation of most cultural features, including Built Up Areas (BUA).
• Diverse representation of hydrography features.
• Good representation of relief, including cliffs and conglomerated contours.
• The TLM is one of the most detailed and information laden TLMs printed. This
will allow any refinements to be tested in a ‘worst case’ scenario.
Other TLMs used within the research in order to test the scoped specifications are:
• 94431 Caboolture Ed 1 1:50 000 scale (initial 1:50 000 specifications), printed
1971, included as Appendix A.
• AUSPEC 0205 Wide Bay Training Area Special Ed 5 1:50 000 scale (current
SYMBAS specifications), printed 1999, included as Appendix C.
Cartographic portrayal of the 1:50 000 TLM has changed minimally since inception.
The standards and specifications have changed to remain abreast with digital
cartographic techniques and to comply with national and international agreements.
What has significantly changed is the method of TLM production, knowledge of
which is important to this research.

Chapter 2: Characteristics of Research Elements Page 27
4.2 TLM Production Process
The TLM production process involves three general stages: acquisition, compilation
and printing. This research deals predominantly with compilation and printing.
Compilation is constrained by technology and standards and specifications. Initial
compilation of TLMs was undertaken through hand based or ‘scribing’ methods that
were time consuming and labour intensive. In the late 1960’s, scribing was
superceded by the digital methods of Automap 1 and Automap 2 where data was
registered digitally in simple CAD programs. The primary focus of compilation,
with scribing and Automap, was to produce a hardcopy TLM. The simple methods of
compilation meant cartographic features were produced independently of each other,
not spatially referenced or topologically correct and difficult to use within a
Geographic Information System (GIS). This was reflective of general trends in
cartography at the time, as GIS was in its infancy and most digital programs were
digital mapping tools rather than spatial data management tools.
Current digital compilation methods treat the hardcopy TLM as a secondary product
and compile the topographic information predominantly for use within a GIS. This
new method of compilation uses technology that can produce standard TLMs and
specific or special purpose TLMs if required. Throughout this research, modern
compilation methods were used and are detailed in Chapter 4.
Printing of TLMs has changed minimally when compared to the changes of TLM
compilation, since the inception of the 1:50 000 TLM. TLMs have been and
continue to be made through the process of lithography. Standard TLMs are printed
using a colour process printing technique where a plate is made for each feature of
the TLM. Each plate is a different colour. The 1:50 000 TLM is a five colour TLM
requiring production of five lithographic plates for printing. Each printing plate
corresponds to a specific colour and specific cartographic features as detailed in
SYMBAS Edition 2. The five colours are derived from the Pantone Matching
System that is a commercially recognised set of printing industry standards. The
Pantone Matching System contains over 500 standard colours that are produced by

Page 28 Chapter 2: Characteristics of Research Elements
blending eight basic colours plus black and transparent white.33 The five standard
colours used on a 1:50 000 TLM are Process Black, Process Blue, Brown 152,
Red/Brown 202 and Green 367.34 To induce tones within the colours, a dot stipple is
introduced to reduce the density of colour on the TLM. Stipples are primarily used
to indicate differences in vegetation types, hydrographic types and some cultural
features such as roads. Table 2.2 details each cartographic feature and the different
stipple types used on the base TLM for this research, Mt Tamborine 1:50 000 scale.
For stipples, three descriptors are used and explained in Figure 2.12. Further
discussion of colours and stipples and the effect on this research is described in
Chapter 4.
Figure 2.8 Stipple Descriptors
TLM compilation and printing have changed since the inception of the 1:50 000
TLM mostly due to technology advances but also to adhere to new international and
national standards and agreements. This research, whilst using current TLM
compilation and printing techniques, is focused on the standards and specifications
used to display features that are fundamental to all TLM production.
33 Robinson, et al (1995). Elements of Cartography. New York, John Wiley & Sons, INC. 581
34 Royal Australian Survey Corps (1984) Symbolization - All Series (SYMBAS) Ed 2. 5.2-5.3
D48 10% 750
Dots per centimeter or Specific stipple design
Dot/ink percentage i.e. 10% = 10% ink & 90% clear
Dot angle relative to base of TLM and angle moving anti-clockwise

Chapter 2: Characteristics of Research Elements Page 29

Page 30 Chapter 2: Characteristics of Research Elements
Table 2.2 Colours and Stipples used for printing 1:50 000 TLM35
35 Ibid.

Chapter 2: Characteristics of Research Elements Page 31
5. Summary
This chapter has detailed the two major elements of this research: NVG and the
TLM. Characteristics of NVG and limitations of NVG such as visual acuity,
scotopic vision, reduced field of view and depth perception were detailed and have
been researched extensively since NVG were invented. Operating methods of the
Australian Army, with NVG, were explained and the limitations impacting on this
research were detailed. A description and examples of the different 1:50 000 TLM
were given and the colours, stipples and processes used to make TLMs were detailed.
Of importance to this research is:
• NVG have organic limitations, which has an effect on this research.
• The primary tool for navigation and spatial understanding within the Australian
Army is the TLM.
• TLM standards and specifications have changed, since their inception, to reflect
changes in compilation and printing techniques.
• The average 1:50 000 TLM used by the Australian Army is derived from
SYMBAS Edition 2 specifications, the same specifications and standards used to
produce Mt Tamborine.
• The current standards and specifications for producing 1:50 000 TLMs differ
only from SYMBAS Edition 2 in vegetation portrayal. The standards and
specifications are shown on the Wide Bay Training Area Special TLM.

Page 32
Chapter 3
Determining the Variables

Page 33
Chapter 3. Determining the Variables
The previous chapter detailed the two major elements within this research: the NVG
and TLM. Within this research, investigation into human interaction with NVG and
TLM was identified as also required. The initial step was to determine the NVG
limitations that impact on soldiers and their ability to operate effectively. The
resultant information was built upon to determine problems with reading TLMs with
NVG. Required information was gained through the conduct of surveys and NVG
experiments.
Three surveys were undertaken to identify and reduce the variables within the scope
of this research and to determine:
• The general problems with NVG, as understood by soldiers.
• NVG limitations that impact on the soldier.
• The problems that exist between NVG and TLMs.
• Current methods of reading TLMs for navigation at night.
• Information that can and can’t be read on TLMs with NVG.
• An operational priority for TLM information.
A further two experiments, based on the results from the surveys, were undertaken.
One experiment involved participants using NVG to view TLMs whilst indicating
their ability to read cartographic features. The second experiment involved
participants viewing grey scales to ascertain the importance of contrast within the
research.
This chapter details and discusses the results of the five tests and provides a
summary of pertinent factors to this research.

Page 34 Chapter 3: Determining the Variables
1. Surveying the Issues
Three surveys were conducted on personnel within the Australian Army, to
accurately determine problems, current practices and understanding of NVG. The
surveys were:
• All Users.
• Commanders.
• TLM Information Priority.
Users were identified from groups within the Army who have a high level of NVG
knowledge and extensive experience both in training and operational contexts. It
was determined through discussions with senior military personnel that high level
users primarily resided in the Infantry, Armour and Artillery Corps. The use of
military personnel, experienced in NVG use, assisted in reducing the risk of
abnormal or skewed results. The experienced users could also assist the study by
providing relevant feedback and appropriate levels of input.
All surveys were conducted at Gallipoli Barracks, Enoggera Queensland over a
period of four weeks. The surveys were conducted under supervision, in a classroom
environment and within an allotted timeframe. The surveys required both
quantitative and qualitative responses through writing answers, circling graduated
responses or circling defined answers. The survey questionnaire forms are contained
as Appendixes D, E and F.
Chapter 3: Determining the Variables Page 35
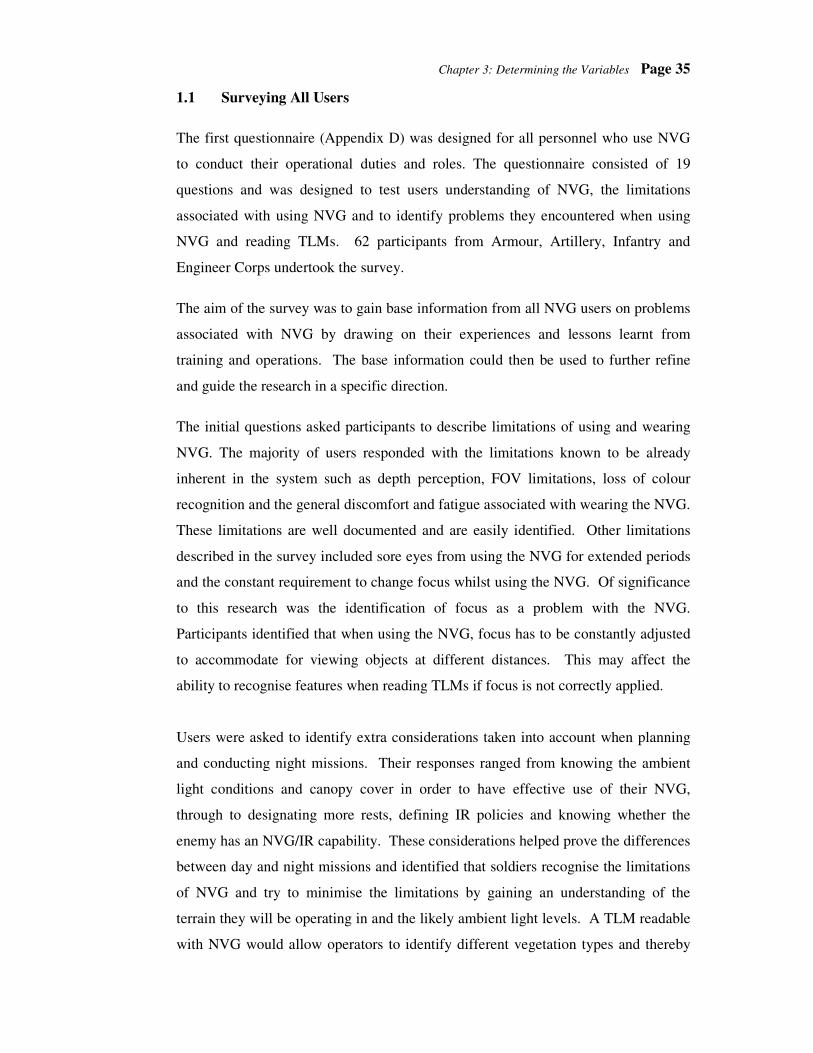
1.1 Surveying All Users
The first questionnaire (Appendix D) was designed for all personnel who use NVG
to conduct their operational duties and roles. The questionnaire consisted of 19
questions and was designed to test users understanding of NVG, the limitations
associated with using NVG and to identify problems they encountered when using
NVG and reading TLMs. 62 participants from Armour, Artillery, Infantry and
Engineer Corps undertook the survey.
The aim of the survey was to gain base information from all NVG users on problems
associated with NVG by drawing on their experiences and lessons learnt from
training and operations. The base information could then be used to further refine
and guide the research in a specific direction.
The initial questions asked participants to describe limitations of using and wearing
NVG. The majority of users responded with the limitations known to be already
inherent in the system such as depth perception, FOV limitations, loss of colour
recognition and the general discomfort and fatigue associated with wearing the NVG.
These limitations are well documented and are easily identified. Other limitations
described in the survey included sore eyes from using the NVG for extended periods
and the constant requirement to change focus whilst using the NVG. Of significance
to this research was the identification of focus as a problem with the NVG.
Participants identified that when using the NVG, focus has to be constantly adjusted
to accommodate for viewing objects at different distances. This may affect the
ability to recognise features when reading TLMs if focus is not correctly applied.
Users were asked to identify extra considerations taken into account when planning
and conducting night missions. Their responses ranged from knowing the ambient
light conditions and canopy cover in order to have effective use of their NVG,
through to designating more rests, defining IR policies and knowing whether the
enemy has an NVG/IR capability. These considerations helped prove the differences
between day and night missions and identified that soldiers recognise the limitations
of NVG and try to minimise the limitations by gaining an understanding of the
terrain they will be operating in and the likely ambient light levels. A TLM readable
with NVG would allow operators to identify different vegetation types and thereby

Page 36 Chapter 3: Determining the Variables
avoid areas where light conditions, such as rain forest, are not suitable for NVG.
The next question of the survey asked users to identify how they currently read
TLMs at night. All respondents replied that they read TLMs with a filtered torch,
usually red. These responses prove that soldiers do not undertake reading TLMs
with NVG. If soldiers can use NVG to read TLMs at night, it will increase their
efficiency and possibly their survival rates. They would not have to stop, turn off
their NVG, allow their eyes to adjust, ensure they have adequate cover, turn on their
red filtered torch, allow their eyes to adjust again and then determine the required
information from the TLM. The responses have identified that a problem exists with
reading TLMs with NVG.
Question 5 asked soldiers to determine how much of their planning for night
missions is undertaken with white light, other light or NVG. No respondent stated
they conduct planning with NVG. The majority, approximately 70% conduct
planning under white light with the remainder, 30%, under red filtered light. The
responses again show that NVG is not used as the principle source of illumination
when other choices are available. This helps to reinforce the aim of this research that
any refinements to the TLM must ensure its usability with normal and NVG
conditions.
Questions 6 asked respondents if any changes were made to their Standard Operating
Procedures (SOPs) to be able to read TLMs and navigate successfully at night. Most
respondents replied that they navigated mainly with bearings and paces, took longer
halts for navigation checks and conducted more frequent navigation checks. These
answers imply that NVG is not used for navigation or TLM reading at night. The
longer halts and more frequent checking is related to use of red filtered torches, as
previously discussed, and the inherent general difficulties of navigating at night.
Bearing and paces, whilst comparatively accurate, requires little appreciation of
surrounding terrain NVG can provide an appreciation of the surrounding terrain and
assist navigation, yet soldiers responded that they do not use it. The responses do not
clearly state whether the reliance on bearing and paces is a result of the limitations
with NVG or the users’ inability to integrate NVG into navigation. As this survey
was conducted with experienced personnel it is extrapolated that limitations with
NVG inhibit its use for navigation at night.

Chapter 3: Determining the Variables Page 37
Respondents replied in Question 7 that compensating for the limitations of NVG
during night missions is difficult. Most stated that they try to use NVG during good
ambient light conditions to reduce the effects of poor visual acuity. A minority of
respondents also stated that they try to have personnel without NVG to increase their
overall effectiveness. These responses detail that the limitations of NVG cannot be
greatly altered and must be worked with to ensure effective operations.
Questions 8 - 15 asked respondents on their general knowledge of reading TLMs
with NVG.
Question 8 and 9 asked simple questions whether colours could be seen at night with
NVG. Nearly all respondents stated that colours could not be seen and that only
various tones of green were distinguishable. The lack of colour definition whilst
using NVG will play a major role in the development of cartographic solutions to the
overall problem. Further tests on colours and tones are described and analysed later
within this chapter. The minority of respondents who stated that colours could be
seen were perhaps relying on their cognitive appreciation of colours and their
knowledge of objects and colours under normal daylight conditions. Though their
responses can be discounted, the cognitive aspects of reading and understanding
TLMs cannot be discounted. Further discussion on the cognitive aspect of TLMs is
undertaken in Chapter 4.
Question 10 asked personnel whether dark or light tones stand out best with NVG.
The survey displayed a graduated grey scale and asked respondents to circle the
easiest tone to read with NVG. Most respondents stated dark tones stood out well
against the white background of the survey paper. If the background had been black,
the easiest tones to read would be those near the white end of the scale. The subject
of tones and contrast and their further investigation is undertaken later in this
chapter.

Page 38 Chapter 3: Determining the Variables
Question 11 asked personnel to identify what information on a TLM is most critical
for successful conduct of missions. Five major information types were identified as
critical. These were:
• Contours.
• Vegetation.
• Watercourses and river courses (hydrology).
• Roads and tracks, including bridges.
• The ability to read grids and give grid references.
These identified types are important to this research as the scope of research is
defined as ‘refining TLMs’ not designing TLMs. Identification of critical
information requirements for the conduct of military operations will limit the number
of variables requiring investigation or possible change, thereby limiting changes to
the standards and specifications already developed for production of TLMs. Further
investigation and discussion on TLM information priorities is contained later in this
chapter.

Chapter 3: Determining the Variables Page 39
Figure 3.1 Ease of reading TLM information with NVG
Figure 3.1 displays graphically the results of Question 12 that sought responses on
the ease or difficulty of reading information on a TLM with NVG. The ease of
readability is indicated with a score from 1-10 with 1 being the hardest to read and
10 being the easiest to read. The score for each feature is the average of responses
from each of the 62 survey participants. Of note is the difficulty with which
participants rated the readability of contours, creeks/rivers and vegetation. This
directly relates to the previous question where contours, creeks/rivers and vegetation
were critical information sources on a TLM. The identification of these three
variables helps to reduce the number of TLM refinements required to achieve the aim
of this research.
0
1
2
3
4
5
6
7
8
9
10
Con
tour
s
Text
Grid
Ref
Roa
ds
Cre
eks/
Riv
ers
Veg
etat
ion
Poi
nt F
eatu
res
Line
Fea
ture
s
Feature
Rea
dabi
lity

Page 40 Chapter 3: Determining the Variables
To validate the responses from Question 12 and to ensure participants were
providing accurate responses, Question 13 and 14 were similar to Question 12.
Participants were asked to list what information is unreadable, Question 13, and what
information is easily readable, Question 14, on a 1:50 000 TLM with NVG. The
majority of responses again listed contours, creeks/rivers and vegetation as
unreadable on a TLM and text, grids and cultural information as easily readable.
This validates previous responses and directs the research to investigate the reasons
behind why certain features are easily read and some are unreadable.
Question 15 asked participants how they added information to their TLMs at night.
The basis of this question was to determine if a certain type or colour of marker is
preferred and direct the research towards a specific colour. About half of the
participants stated they used a black pen to mark TLMs, as it was the easiest to read.
Other responses varied from brown pen to pencil, whilst approximately a quarter of
all respondents stated they do not mark their TLMs for operational reasons and to
maintain security. Of note to this research is the fact that approximately 80% of
respondents who stated they used a black pen used red filtered light to illuminate
their TLM whilst marking. No participant responded that they used NVG to see the
TLM whilst marking. This emphasised the wasted efficiency of using red filtered
torches and does not provide any evidence for best colour use with NVG.
Questions 16 - 19 investigated navigation with NVG to determine factors that may
influence the research.
Question 16 asked participants to approximate how far they can see under good
ambient light conditions with NVG. Good ambient light conditions were not
explained in the survey but many respondents, after completing the survey stated
they imagined good ambient light as that light which is provided by a full moon.
Responses varied greatly from 150m to 600m with the average being 310m. Many
respondents also stated that different terrain has an effect on the range of vision
provided by NVG and hence the ability to use NVG to enhance night navigation.
Soldiers, to gain a greater understanding of their surrounding terrain and hence
comprehend their TLM easier, could use the range and improved acuity which NVG
offers. If a TLM can be developed to be fully readable with NVG, soldiers may also
utilise the range of NVG to assist their TLM comprehension and terrain appreciation,

Chapter 3: Determining the Variables Page 41
thereby improving overall efficiency.
Questions 17 and 18 posed queries about the effect of reduced FOV on a soldier’s
ability to read TLMs and navigate. Two major responses were provided. The first
concerned the requirement to focus NVG for close use (with a TLM) and then
refocus the NVG when viewing in the distance. The second being that disorientation
sometimes occurs when trying to read TLMs, as the reduced FOV does not allow a
user to fully assimilate the entire TLM area and scanning is constantly required.
NVG focus is a constant problem for soldiers as it restricts their ability to accurately
assimilate visual information quickly. It also poses efficiency problems as adjusting
the NVG to the required focal length can be difficult and focus may not be accurately
achieved. This could lead to TLM discrimination and reading problems, which in
turn may affect the ability to complete a mission effectively and safely. As
mentioned in the previous chapter, a rough guide for focusing the NVG to best read
TLMs is by using the outstretched hand. Though this method works reasonably well
for the majority of personnel, those already with inherent eye conditions may have
difficulty focusing the NVG for TLM reading. Incorrect focus by participants may
affect the outcomes of this research. To negate this effect, experienced users were
utilised for testing and a simple TLM reading test undertaken to ensure correct focus
has been applied.
The effect of reduced field of view was described in paragraph 2.2.5 and has been
well researched concerning visual scanning of scenes. By not being able to
comprehend the entire TLM scene, soldiers are at a disadvantage when using NVG.
The requirement to continually scan a TLM for information can lead to disorientation
and increase the possibility of making navigation or mission errors. Whilst it is
accepted that the reduced FOV has an impact on TLM reading, it is not the intention
of this research to develop a TLM which can counter the effects. The scope of this
research is to refine the standard TLM for use with NVG. Any changes to the TLM
to counter the effects of reduced field of view may require significant and major
changes to nearly all standards and specifications currently used.

Page 42 Chapter 3: Determining the Variables
The final question of the survey, Question 19, asked participants if there were any
other issues concerning NVG, TLMs and navigation that had been overlooked.
There were few responses to this question and most concerned the development of an
automatic focus for NVG, which is well outside the scope of this research.
In summary, the survey of all users proved useful in identifying the following
characteristics and providing guidance to the research:
• Soldiers recognise, understand and work within most limitations of NVG.
• Currently TLMs are read inefficiently with a red filtered torch at night.
• NVG is seldom the principle source of illumination for reading TLMs.
• NVG is not utilised well for navigation.
• Colours cannot be identified with NVG, only tones of green.
• There are five critical types of TLM information required for conducting
missions: contours, vegetation, roads watercourses and river courses
(hydrology), roads and tracks (including bridges) and the ability to read grids
and give grid references.
• There are three types of information that are unreadable; contours, vegetation
and creeks/rivers.
• There are three types of information that are easily readable, text, grids and
cultural information.
• Focus affects the ability to recognise visual cues and comprehend TLMs, if not
correctly applied.

Chapter 3: Determining the Variables Page 43
1.2 Surveying the Commanders
To build further on information provided in the survey of all users, a survey was
undertaken of commanders. Commanders were deemed as soldiers who had attained
the rank of corporal or greater and were responsible for leading units on the
battlefield.36 They possess high levels of expertise and have a good understanding of
training, military tactics, operational planning and conducting operations. The
survey (Appendix E) comprised fourteen questions and was structured to identify
possible avenues for TLM refinement and to gain a greater understanding of military
operations with NVG. It was also used to ascertain if any of the special NVG
attachments (NVG ER or NVG compass) would influence this research. 31
personnel participated in this survey which was conducted immediately after the
survey of all users.
The first four questions asked participants to describe how much NVG and TLM
reading / navigation training was undertaken. Respondents replied that training on
both NVG and TLM reading/navigation was mostly undertaken during field
exercises conducted by their unit. These exercises were generally held about four
times per year. Some respondents stated that some training was undertaken whilst in
barracks, but only rarely, due to the amount of alternate tasking and the requirement
to maintain equipment. Theory training was conducted a few times each year and
some training was undertaken as a concurrent activity during range days or as part of
a military skills competition. Generally training on NVG and TLM reading /
navigation was conducted at least four to five times a year and was an integral part of
field exercises. The responses indicate that NVG is incorporated into normal training
regimes and soldiers are familiar and experienced in the use of NVG and TLM
reading / navigation. Therefore, inexperience and operator errors should have
minimal impact during further tests and not impact on providing accurate results.
36 A corporal commands a section, the smallest fighting element, within the Australian Army.

Page 44 Chapter 3: Determining the Variables
Question 5 asked participants to approximate how much training they conduct at
night. The majority response was that nearly all training at night was conducted
during field exercises and little night training was conducted when in barracks. This
response helped to reinforce the fact that Army units conduct night training and this
would reduce any possible errors during further experiments.
The response to Question 6 was unanimous. Since the introduction of NVG into the
Australian Army, night mission training is never conducted without the assistance of
NVG. This response indicates that NVG has become an integral operating system
for Army elements and is relied upon during night activities. Of relevance to this
research is the fact that TLMs have always been an integral system of Army units
and that NVG is now an integral system. Effective operation between the two
systems will see an increase in efficiency.
Generally, commanders have the responsibility of navigating and TLM reading
during their missions and exercises. Question 7 asked participants if they marked
their TLMs in any special way for use during the night. The basis behind this
question was to ascertain if there were any common factors or specific graphic
variables that commanders relied upon. This information could then be used to
further guide the research. Just over half of respondents stated they did not mark
their TLMs for operational and security reasons. Those that stated they did mark
their TLMs used black pens or black TLM marking pens and avoided red colours.
Red was avoided because the primary method of TLM reading / navigation at night
is by using a red filtered torch. The responses substantiate previous answers given in
the survey of all users. It also re-emphasises the non-use of NVG for reading TLMs.
Questions 9, 10 and 11 concerned the use of the NVG ER and compass attachment
for navigation purposes. All respondents stated they did not use the NVG ER for
navigation and that only a few had used it for surveillance or reconnaissance. No
respondent stated they used the NVG compass for navigation. The primary reason
being that the compass has too great an error for accurate navigation. The responses
allow this study to discount any impact that the NVG ER and compass may have on
navigation and TLM reading and the refinement of TLMs for use with NVG.

Chapter 3: Determining the Variables Page 45
Question 12 investigated the possibilities of any other navigation or TLM reading
equipment that is used by commanders that may impact on this research. The
majority response was that commanders use red filtered torches to help them read
TLMs and navigate at night. Red filtered torches have been addressed in previous
questions. Important to this research is that commanders to navigate or read TLMs
use no other equipment.
Question 13 sought to determine how commanders operate at night with their
navigation equipment and NVG and if there were any factors that could influence
this research. Respondents stated they generally used NVG whilst moving. When
stopped, they used red filtered light to read TLMs. Most respondents used GPS to
check their location intermittently, when stopped. These responses again show that
presently commanders do not use NVG to read TLMs. The relationship between
NVG and GPS was not fully detailed by respondents within this question. Whilst
GPS use is increasing throughout the Army, it is assessed that its use has little impact
on TLM / NVG interaction and will not be discussed further in this research.
The final question of the commanders’ survey, Question 14, asked if there were any
other problems or issues not previously mentioned. No respondents provided
information that was of benefit to this research.

Page 46 Chapter 3: Determining the Variables
The survey of commanders produced little information towards this research that was
not previously detailed in the survey of all users. Most responses substantiated
already known facts and some response helped eliminate factors from the research.
The most significant points to be carried forward from this survey were:
• Soldiers and units conduct regular training and are competent in using NVG,
TLM reading and in navigation.
• NVG is an integral system operating system for soldiers and heavily relied upon
to conduct night missions.
• Commanders do not use the NVG ER or NVG compass for navigation. They can
be discounted from this research.
• Apart from the NVG and the TLM, there are no other equipment factors which
impact on this research.
• The relationship between NVG and GPS has no identified impact on this
research.

Chapter 3: Determining the Variables Page 47
1.3 TLM Information Priority
The two surveys conducted provided information on the operating characteristics of
NVG and how soldiers and commanders use NVG to read TLMs and navigate. The
survey of all users also provided a basis on which TLM features were rated against
their operational necessity.
To build on the initial surveys, an additional survey was undertaken of all personnel
who participated in the survey of all users. The aim of the survey was to identify
information critical to military operations, so that this information could be tested for
its readability with NVG. In total, 66 personnel participated in the survey, shown at
Appendix F. The survey listed all cartographic elements on a TLM and asked
respondents to weight each element against the following criteria:
• Critical. You cannot complete your mission if this information is not available.
• Important. You may complete your mission with limitations or difficulties if this
information is not available.
• Not Important. Inclusion of this information is not required to complete your
mission.
• Irrelevant. You have never needed this information to complete your mission.
The criteria were developed to replicate criteria used by the Australian Army to
categorise information sources. This was to ensure that participants were familiar
with the criteria and negate any problems that may arise from developing and
learning new criteria. The survey was also broken into five distinct information
areas – cultural, hydrography, hypsography / physiography, vegetation and marginal
information / TLM information – to facilitate ease of analysis.
Of primary concern to this study were responses that deemed a cartographic feature
to be critical. These responses were used to narrow the number of cartographic
refinements required on a TLM.

Page 48 Chapter 3: Determining the Variables
Figure 3.2 and Figure 3.3 show the results of how participants rated cultural
information on a standard TLM. Figure 3.2, Cultural Information 1, lists road and
road related features. Figure 3.3, Cultural Information 2, lists railway and general
cultural features. The most significant outcomes to be derived from both Figures are
that the majority rated no feature as critical. The highest critical ratings were foot
track, vehicle track and mine, which all rated at 45.5%. Roads and foot tracks are
important for movement, navigation and lines of communication within a military
context and it is understandable that some elements of the Army see them as critical
for movement i.e. Armoured and Engineer Corps.
It is assessed that “mine” rated highly as participants confused the general meaning
of mine and the military meaning. On a TLM, a mine represents either an open cut
or underground engineering business designed to remove valuable minerals from the
earth. In the military, the term mine refers to an explosive device usually placed in
the ground to harm or destroy personnel or vehicles. This assessment was supported
when the participants were questioned after completing the survey, many stating they
had used the military definition of mine to answer the question.
Overall, cultural information was rated as important, but not critical to military
operations and of minimal impact to the future of this research.

0 %
1 0 %
2 0 %
3 0 %
4 0 %
5 0 %
6 0 %
7 0 %
8 0 %
9 0 %
1 0 0 %
Causeway
Culvert
Cutting
D ivided H
ighway
Embankm
entFoot b
ridge
Foot tra
ck
Gate
National r
oute m
arker
Metro
politan ro
ute m
arker
Road brid
ge
Stock
grid
Sealed ro
ad two o
r more
lanes
Unseale
d road tw
o or m
ore la
nes
Unseale
d road o
ne lane
Underpass
Vehicle tr
ack
C a r t o g r a p h ic V a r ia b le s
C r it ic a lIm p o r ta n tN o t Im p o r ta n tI r r e le v a n t
Figure 3.2 Cultural Information 1
Chapter 3: D
etermining the V
ariables Page 49

0 %
1 0 %
2 0 %
3 0 %
4 0 %
5 0 %
6 0 %
7 0 %
8 0 %
9 0 %
1 0 0 %
Light
railw
ay
Multipl
e tra
ck ra
ilway
Railway
bridg
eRail
way tu
nnel
Railway
unde
rpas
s
Single
track
railw
ay
Siding
Station
Admini
strati
ve bo
unda
ry
Built U
p Are
a (BUA)
Buildin
g
Church
Drive i
n the
atre
Fence
Mine
Power
tran
smiss
ion lin
e
Quarry
/Pit
Recre
ation
rese
rve RuinW
indpu
mp
Yard
C a rto g ra p h ic V a ria b le s
C rit ica lIm p ortan tN ot Im p ortan tIrre levan t
Figure 3.3 Cultural Information
Page 50 Chapter 3: D
etermining the V
ariables

Chapter 3: Determining the Variables Page 51
Figures 3.4 and 3.5 detail the weighting of hydrography information. Figure 3.4,
Hydrography Information 1, listed all features associated with oceans and coastlines.
Figure 3.5, Hydrography Information 2, listed features associated to inland
watercourses and constructed water amenities. The majority of features were rated
as important with four features rated as critical.
On Figure 3.4 coastline is rated as critical by an average of 54.5% of respondents.
On Figure 3.5 intermittent watercourse, mainly dry watercourse and perennial
watercourse were all listed as critical information requirements, each with an average
of 81.8% of responses. The majority rating of the four features as “critical”
identifies them as critical to military operations and will be tested further in this
research. The rating of watercourses as critical was initially identified at Question 11
during the survey of all users.
Of note is that hydrography such as lakes, dams and waterholes were rated only as
“important”, although they are generally accepted as key military information37. The
reason identified for the important rating, and not critical, is that the survey
participants came from tactical units who are generally concerned with small
geographical areas on the battlefield. Their approach to the survey would be mainly
from an experience base, not a theoretical or military planning base. By conducting
the survey with soldiers, the results have differed slightly from training manuals and
accepted texts that are generally not written by soldiers. The results thereby reflect
the ‘majority users’ perspective of TLM information.
37 American, British, Canadian, Australian and Armies Standarisation Programme (1993). Terrain Analysis - QSTAG 1038. Washington, ABCA Program;Australian Defence Force Academy (1988). Geographic Information in the Defence of Australia. Geographic Information in the Defence of Australia, Canberra;Bateman and Riley (1987). The Geography of Defence. Kent, Croom Helm Ltd;Conolly (2001). "GIS in Defence." GIS User 45;Metzger (1992). "Terrain Analysis for Desert Storm." Engineer 22(February 1992).

0 .0 %
1 0 .0 %
2 0 .0 %
3 0 .0 %
4 0 .0 %
5 0 .0 %
6 0 .0 %
7 0 .0 %
8 0 .0 %
9 0 .0 %
1 0 0 .0 %
Beach
Coastl
ineExp
osed
wre
ck
Harbo
urInt
ertid
al fla
t
Inter
tidal
ledge
or re
efNav
igatio
n Ligh
t
Pier/W
harf/
Jetty
/Qua
yRoc
k bar
e or a
wash
Saline
coas
tal fla
tSub
merge
d ree
fSub
merge
d roc
kSub
merge
d wre
ck
Aqued
uct
C a r to g ra p h ic V a r ia b le s
C rit ic a lIm p o rta n tN o t Im p o rta n tI rre le va n t
Figure 3.4 Hydrography Information 1
Page 52 Chapter 3: D
etermining the V
ariables

0%
10%
20%
30%
40%
50%
60%
70%
80%
90%
Area s
ubjec
t to in
unda
tion
Chann
el
Dam Ford
Inter
mittent
lake
Inter
mittent
waterco
urse
Mainly
dry l
ake
Mainly
dry w
aterco
urse
Peren
nial la
ke
Peren
nial w
aterco
urse
Swamp
Tank o
r small
dam
Wate
rcour
se w
ith flo
od lim
its
Wate
rhole
C artographic V ariab les
C ritica lIm portan tN ot Im portan tIrre levant
Figure 3.5 Hydrography Information 2
Chapter 3: D
etermining the V
ariables Page 53
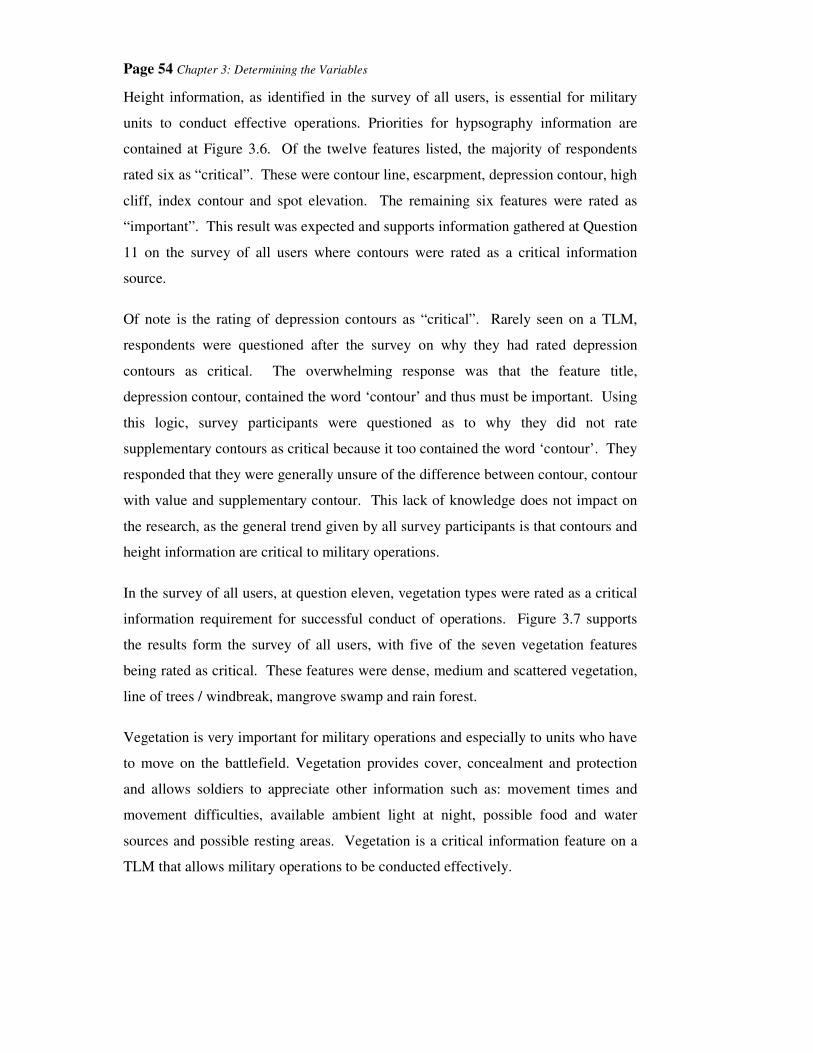
Page 54 Chapter 3: Determining the Variables
Height information, as identified in the survey of all users, is essential for military
units to conduct effective operations. Priorities for hypsography information are
contained at Figure 3.6. Of the twelve features listed, the majority of respondents
rated six as “critical”. These were contour line, escarpment, depression contour, high
cliff, index contour and spot elevation. The remaining six features were rated as
“important”. This result was expected and supports information gathered at Question
11 on the survey of all users where contours were rated as a critical information
source.
Of note is the rating of depression contours as “critical”. Rarely seen on a TLM,
respondents were questioned after the survey on why they had rated depression
contours as critical. The overwhelming response was that the feature title,
depression contour, contained the word ‘contour’ and thus must be important. Using
this logic, survey participants were questioned as to why they did not rate
supplementary contours as critical because it too contained the word ‘contour’. They
responded that they were generally unsure of the difference between contour, contour
with value and supplementary contour. This lack of knowledge does not impact on
the research, as the general trend given by all survey participants is that contours and
height information are critical to military operations.
In the survey of all users, at question eleven, vegetation types were rated as a critical
information requirement for successful conduct of operations. Figure 3.7 supports
the results form the survey of all users, with five of the seven vegetation features
being rated as critical. These features were dense, medium and scattered vegetation,
line of trees / windbreak, mangrove swamp and rain forest.
Vegetation is very important for military operations and especially to units who have
to move on the battlefield. Vegetation provides cover, concealment and protection
and allows soldiers to appreciate other information such as: movement times and
movement difficulties, available ambient light at night, possible food and water
sources and possible resting areas. Vegetation is a critical information feature on a
TLM that allows military operations to be conducted effectively.

0 %
1 0 %
2 0 %
3 0 %
4 0 %
5 0 %
6 0 %
7 0 %
8 0 %
9 0 %
1 0 0 %
Contou
r line
Escar
pmen
tDep
ress
ion co
ntour
Distor
ted su
rface
High cl
iff
Horizo
ntal c
ontro
l poin
t
Index
conto
ur
Leve
e
Sand
Sand r
idge
Spot e
levati
on
Supple
mentar
y con
tour
C a rto g ra p h ic V a r ia b le s
C rit ic a lIm p o rta n tN o t Im p o rta n tIr re le va n t
Figure 3.6 Hypsography Information
Chapter 3: D
etermining the V
ariables Page 55

0%
10%
20%
30%
40%
50%
60%
70%
80%
90%
100%
Dense
Line o
f tree
s/wind
brea
k
Mangr
ove s
wamp
Medium
Orchar
d/vine
yard
Pine
Rain fo
rest
Scatte
red
C artog rap h ic V ariab les
C rit ica lIm p ortan tN ot Im p ortan tIrre levan t
Figure 3.7 Vegetation Information
Chapter 3: D
etermining the V
ariables Page 56

Chapter 3: Determining the Variables Page 57
The final information prioritised by survey participants’ concerned general TLM
information and marginal information. The results are displayed at Figure 3.8 and
support the results from the survey of all users. Four information features were rated
as “critical”: index to adjoining TLMs, grid lines, grid numbers inside the TLM
neatline and magnetic variance. The rating of these features as “critical” displays
their necessity for military operations and the emphasis with which soldiers rely on
them. Without grids or grid numbers locations could not be established effectively
and control of elements would be very difficult. Adjoining maps are necessary for
movement and magnetic variation is required for navigation.
Figure 3.9 combines all critically weighted information features into one graph. The
identification of twenty cartographic features can be sorted into four distinct groups:
contours, watercourses, vegetation and TLM grid information. The critical features
are the basis for further testing as they have been identified in both the survey of all
users and the TLM information priority survey.

0%
1 0%
2 0%
3 0%
4 0%
5 0%
6 0%
7 0%
8 0%
9 0%
1 0 0%
Index
to ad
joinin
g map
s
Grid lin
es
Grid nu
mbers
outsi
de m
ap
Grid nu
mbers
inside
map
Latitu
de / L
ongit
ude
Magne
tic va
rianc
e
Map na
me Mea
n rain
fall
Mean T
empe
ratur
ePro
ducti
on In
formati
on
Scale
BarW
aterco
urse
guide
C a rto gra ph ic V a r ia b les
C rit ica lIm p ortan tN ot Im p ortan tIrre levan t
Figure 3.8 TLM Information / Marginal Information
Chapter 3: D
etermining the V
ariables Page 58

C ritic a l In fo rm a tio n F e a tu re s > 5 0 %
0 %
1 0 %
2 0 %
3 0 %
4 0 %
5 0 %
6 0 %
7 0 %
8 0 %
9 0 %
1 0 0 %
Coastl
ine
Inter
mittent
waterco
urse
Mainly
dry w
aterco
urse
Perenn
ial w
aterco
urse
Contou
r line
Escarp
ment
Depre
ssion
conto
ur
High cl
iffInd
ex co
ntour
Spot e
levati
on
Dense
Line o
f tree
s/wind
brea
kMan
grov
e swam
p
Medium
Rain fo
rest
Scatte
redInd
ex to
adjoi
ning m
aps
Grid lin
es
Grid nu
mbers
inside
map
Magne
tic va
rianc
e
Figure 3.9 Critical Information
Chapter 3: D
etermining the V
ariables Page 59

Page 60 Chapter 3: Determining the Variables
1.4 Discussion of Survey Results
The three surveys were designed to identify and reduce the variables within the scope
of this research to determine the following:
• General problems with NVG, as understood by soldiers,
• NVG limitations impacting on the soldier,
• problems existing with the use of NVG for TLM reading / navigation,
• current methods of reading TLMs at night,
• knowledge of readable and non-readable information on TLMs with NVG, and
• operational priority for TLM information.
The surveys achieved their aims and provided good input into the research and a
basis for further experimentation. The use of personnel experienced in NVG and
military operations reduced skewed results and insignificant outcomes.
The key findings, from the three surveys, applicable to this research, were:
• NVG has become an integral part of a soldier’s operating system and is relied
upon heavily during night training, operations and activities. Though NVG has
become an integral system, it is not used to read TLMs at night.
• NVG is not used to read TLMs as certain critical cartographic features cannot be
read when viewing a standard TLM with NVG. Instead, red filtered light is
used, creating inefficient operations and reliance on a third system.

Chapter 3: Determining the Variables Page 61
• Information which cannot be read on TLMs with NVG, can be grouped as:
contours, watercourses / rivers and vegetation.
• TLM information, which is critical to the effective conduct of military
operations, can be simplified into four distinct groups: contours, watercourses,
vegetation and TLM grid information.
The link between information, which cannot be read, and information that is critical
to military operations, is the foundation of this research. Table 3-1 simplifies the
similarities between the survey responses.
Information which cannot
be read on TLMs with NVG
Information which is critical to
military operations
Contours Contours
Watercourses Watercourses
Vegetation Vegetation
TLM Grid Information
Table 3.1 Relationship between information unreadable with NVG and
information critical to military operations

Page 62 Chapter 3: Determining the Variables
2. TLM Symbology and Tones
Two separate experiments were developed incorporating the use of NVG and TLMs,
to test results of the surveys and to further investigate the readability of critical
information,. The first experiment was designed to have participants’ rate how well
they could identify the fundamental variables, using NVG, on three different TLM
editions. The second experiment was designed to test the relationship between grey
scales and different tones. The following paragraphs describe and discuss these
experiments.
2.1 Substantiating the Fundamental Variables and TLM Grid Information
The scope of this research is limited to refining TLMs. Refinements must stem from
previous or current TLM specifications and standards used by the Australian Army.
Detailed identification of possible refinements required testing of each fundamental
variable and TLM grid information. These features were stated as unreadable38 and
critical to military operations during the surveys.
The aim of the experiment was to determine accurately which features, from Table
3-1 could be read on three different TLMs. Each TLM has different standards and
specifications for cartographic portrayal and represented a chronological iteration of
the 1:50 000 TLM produced by the Australian Army. The TLMs used were:
• TLM A - 94431 Caboolture Ed 1 (Appendix A), 1971.
• TLM B – 95423 Mt Tamborine Ed 2 (Appendix B), 1988.
• TLM C - AUSPEC 0205 Wide Bay Training Area Special Ed 5 (Appendix
C), 1999.
38 Refer Table 3-1. TLM grid information was not reported as unreadable, however its ability to be read under NVG requires testing, as it is the only difference between the two lists of Table 3-1.

Chapter 3: Determining the Variables Page 63
It was planned initially to use three TLM editions that depicted the same geographic
area. This strategy was abandoned as extensive searching and checking of records
disclosed that there existed only a limited number of TLMs produced with the new
cartographic standards and specifications, the same as TLM B.
TLM A depicts the cartographic standards used by the Australian Army when the
1:50 000 TLM was first produced. TLM B depicts the cartographic standards used
on the majority of 1:50 000 TLMs produced by the Australian Army. TLM C
depicts the current cartographic standards of all new TLMs printed by the Australian
Army. The major differences between each TLM, concerning the critical information
features, are:
• Each TLM is of a different geographic location.
• Each TLM does not contain all critical information features.
• Vegetation classes and portrayal are different on each TLM.
• TLM A uses a 20 metre contour interval while TLM B & C use a 10 metre
contour interval.
• Cartographic portrayal of watercourses on TLM A is different to TLM B & C.
• There are slight differences between the hues on each TLM, although the same
general colours are used.
The major similarities between each TLM, concerning the critical information
features, are:
• Each TLM is at a scale of 1:50 000.
• Each TLM has the same standards and specifications for portrayal of grid lines /
grid numbers and marginal information.
• On each TLM similar colours are used: vegetation is printed green, contours
brown, grids black and watercourses / rivers blue.

Page 64 Chapter 3: Determining the Variables
The first experiment was undertaken with nineteen personnel who had participated in
the previous three surveys. They were experienced NVG users, fourteen of the
participants having operational experience. The remaining five personnel had NVG
experience only in training and exercise scenarios. The experiment was conducted in
a military weapon training facility that has the ability to replicate night light
ambience. The level of light selected was equivalent to that available during a half
moon. Half moonlight was chosen as the timeframe for the experiment was minimal
and the difference between full moonlight and no moonlight could be extrapolated if
necessary.
Participants used did not undertake acuity tests prior to the experiment.39 Participants
were asked to focus their NVG and then read the two lines of text printed under the
scale bar of TLM C. This was chosen as the best form of ensuring accurate focus
without the assistance of a Snellen chart.40 All participants were able to accurately
read the two lines of text before proceeding with the next phase of the experiment.
The next phase of the experiment involved participants viewing each of the three
TLMs in their own time and completing a simple Table of questions. The Table
asked each participant to place an ‘X’ in the box corresponding to a critical
information feature they could read. This was to be repeated for each TLM in the
experiment. Where a critical information feature was not depicted on a TLM, they
were asked to leave the answer box empty. A copy of the question Table, including
results is displayed at Table 3-1. The percentages relate to the total of participants in
the experiment who could read the critical features. Where a box is coloured grey, it
denotes that the critical information feature was not portrayed on the TLM.
39Niall, et al (1999) "Distance estimation with night vision goggles: A little feedback goes a long way.";Zalevski, et al (2001) Size Estimation with Night Vision Goggles used participants only with 20/20 or 6/6 photopic eyesight. As not all soldiers have 20/20 eyesight it was decided that any error resulting from imperfect vision would be acceptable. It was also thought to better replicate a real world environment.
40 In research conducted by Niall, Reising and Martin (1998). "Night Vision Goggles In Focus: Revised Procedures Improve Visual Acuity by 25%." Human Factors 41(3). Snellen charts were used to determine visual acuity of experiment participants prior to using NVG and then again post using NVG to determine if they had achieved the best focus.

Chapter 3: Determining the Variables Page 65
1.1.1Feature TLM A
Caboolture
1971
TLM B
Mt Tamborine
1988
TLM C
Wide Bay
1999
Coastline 100%
Intermittent watercourse 95% 47% 63%
Mainly dry watercourse
Perennial watercourse 95% 53% 74%
Contour line 95% 5% 0%
Index contour 95% 32% 26%
Escarpment 11%
Depression contour
High cliff 11%
Spot elevation 100% 100% 100%
Dense 89% 74% 89%
Line of trees/windbreak
Mangrove swamp 89%
Medium 89% 32% 84%
Rain forest 79%
Scattered 11% 79%
Index to adjoining TLMs 100% 100% 100%
Grid lines 100% 100% 100%
Grid numbers inside TLM 100% 100% 100%
Magnetic variance 100% 100% 100%
Table 3.2 Critical Information Readability

Page 66 Chapter 3: Determining the Variables
The results of the critical information readability experiment were varied. The first
discussion factor is the inability of the chosen TLMs to depict all critical information
features. Three critical information features were not on any of the TLMs and were
unable to be tested. These were: mainly dry watercourse, depression contour and
line of trees/ windbreak. The lack of portrayal of these information features on the
test TLMs was not considered detrimental to the research.
On the majority of 1:50 000 TLMs, represented by TLM B, mainly dry watercourse
is portrayed as a blue outline with brown dot stippling fill. The blue outline is the
same as intermittent and perennial watercourses and the brown dot stipple is the
same as sand.41 The frequency with which mainly dry watercourse is depicted on
TLMs was considered very low.42 The similarity between mainly dry watercourse
symbology and sand symbology will allow for further testing if required. Depression
contours are similar in symbology to contours and their lack of portrayal is again not
considered to impact upon this research.43 Line of trees / windbreak, whilst not as
rarely depicted as mainly dry watercourse and depression contour, does not have the
same frequency of depiction as the other types of vegetation found on a TLM. In
order to remain within the scope of this research and to ensure that refinements are
applied to the highest frequency features, it was decided that line of trees / windbreak
be omitted from further refinements as it was not a common feature on most TLMs.
41 The dot stipple is DW2 within SYMBAS Edition 2.
42 Senior staff members at the 1st Topographical Survey Squadron were questioned about the use of mainly dry watercourse and its frequency of depiction on TLMs. Most stated that it was only found on some TLMs produced of the arid regions of Australia. After further research it was found that most TLMs of arid regions in Australia have only been produced at 1:100 000 scale and were produced in the early 1960’s. On nine modern 1:50 000 TLMs of arid regions, only 3 ‘mainly dry watercourses’, on two TLMs were found. The two TLMs were unacceptable for use in the research as they depicted fewer fundamental variables than the TLMs chosen.
43 Senior staff members at the 1st Topographical Survey Squadron were questioned about the frequency of depression contour depiction on TLMs. All staff questioned were unable to either state they had either seen or used a depression contour on a 1:50 000 TLM. Further investigation within the 1st Topographical Survey Squadron Mapstore, which contains approximately 2 million TLMs, found no TLMs depicting a depression contour.

Chapter 3: Determining the Variables Page 67
Five critical information features were found on only one TLM in the experiment.
These were coastline and mangrove swamp on TLM C and escarpment, high cliff
and rain forest on TLM B. Coastline and mangrove swamp, as depicted on TLM C,
are the same cartographic standards as depicted on TLM B and hence represent the
average 1:50 000 TLM. Escarpment and high cliff, as depicted on TLM B, are the
same cartographic standards as on TLM C and differ only in colour from TLM A.
Again they represent the average 1:50 000 TLM. Rain forest is a different
cartographic standard on each TLM.44 Scattered vegetation was not depicted on
TLM A as the cartographic specifications and standards allow only medium and
dense vegetation to be shown.
Many of the features tested were seen on each TLM at 100%. These features were
coastline, spot elevations and all features concerning TLM grid information. The
features were rated 100% by experiment participants, and require no change to their
colour, symbology or size so that they can be read with normal vision and NVG.
They require no further investigation within this research.
Proving that TLM grid information can be easily read (100%) reduces the categories
of information that are critical to military operations from four to three. The ability
to read features that are black, as shown in this experiment and as detailed during the
surveys, assists in identifying contrast as a factor in the recognition of TLM features.
NVG vision is monochromatic, thus the recognisable difference between colours is
their tone and value contrast, not their hue as with normal vision. Contrast was
tested further within the second experiment.
The TLM on which watercourses were read best was TLM A, by a combined average
of 95% of all experiment participants.45 TLM B had only a combined average rating
of 50% while TLM C had a combined average of 69%. TLM A uses different
symbology, a dashed line to represent watercourses, but uses the same colour as
TLMs B and C. It is concluded from these results that watercourses are well read by
44 On TLM A, it is solid green, TLM B solid green with blue line stipple overlaid and TLM C has no cartographic standard for rain forest portrayal.
45 The combined average was taken by adding the percentages for intermittent watercourse and perennial watercourse and dividing by two.

Page 68 Chapter 3: Determining the Variables
NVG on TLM A as the symbology of the line is different from the symbology used
for contours, allowing easy differentiation between the two features. Watercourses
also were easier to read on TLM A, as the vegetation specification allows a large
amount of white background within the TLM. The contrast provided between the
blue streams and the white background was significant enough to be above the
minimum contrast threshold of NVG. This identified that contrast and symbology
are cartographic design parameters important to this research.
Many experiment participants stated that watercourses on TLMs B and C were
difficult to read, as they were easily confused with contour lines. The participants
stated that watercourses running perpendicular to contours could be sometimes read,
but difficulty was encountered reading watercourses that ran nearly parallel to
contours. It was also reported that differentiating between contours and watercourses
was difficult where contours were spaced widely apart. Of significant note is that the
same symbology is used to depict watercourses on TLMs B and C. The different
results are due to the background contrasts available within each TLM, provided by
different vegetation stipples. This change of contrast appeared to be the logical
determinant in watercourse readability, as the different types of vegetation stipples
provide different levels of contrast.
Vegetation was best seen on TLM A, combined average 89%, but this only reflected
two vegetation types, dense and medium. Participants also stated they had difficulty
discerning the boundaries between dense and medium, as the stipple used to depict
these vegetation types is very similar. Of the two TLMs that have specifications for
depiction of all vegetation types, TLM C with a combined average of 85% was easier
to read than TLM B with a combined average of 49%. Participants had difficulty
defining scattered vegetation and medium vegetation on TLM B. This was probably
because the tones of scattered and medium are very similar and both are similar to
white. Participants in the experiment were mostly able to read dense and rainforest
on TLM B as their tones are closer to black and contrast well against the surrounding
colours. Some participants had difficulty determining dense vegetation from rain

Chapter 3: Determining the Variables Page 69
forest in areas where the two vegetation types bordered each other. TLM C allowed
for good reading of all depicted vegetation types. The stipple patterns used for
scattered and medium vegetation and the solid fill of the dense vegetation type allow
good contrast definition.
TLM A allowed for the greatest definition of contours. This is due to the contour
interval of 20 metres allowing good definition between individual contours, the
darker colour of contours, as compared to TLMs B and C, and the contrast of the
contours against a mainly white background provided by the vegetation specification.
The intermediate contours on TLM A are portrayed at 0.1mm. On TLM B and C,
intermediate contours are also 0.1mm. Although the contours on TLMs B and C are
the same size as TLM A, they were unreadable. It is considered this is most likely
due to the contrast of contours against their background.
Both TLMs B and C have the same portrayal specifications for contours. On TLM B
only one participant was able to identify intermediate contours, yet six participants
were able to read the index contours. On TLM C, no participants were able to see
intermediate contours, but five participants were able to read some of the index
contours. The reason why some participants could read index contours is possibly a
factor of symbology size. Intermediate contours on TLMs B and C are 0.1mm in
width and index contours are 0.2mm. The change of size provides greater symbol
area, which in turn provides greater contrast against the background. This would
require further investigation, however it is surmised that the reason why intermediate
contours on TLMs B and C cannot be seen is that their size does not allow sufficient
contrast against the TLM background for visual acuity.
The identification of contours as being unreadable was a major factor within this
research that required further investigation and identification of solutions. Why
contours are unreadable is a combination of two linked factors. Firstly, the contrast
between contours and TLM background is not sufficient for NVG to differentiate
contours. Secondly the lineweight, or line size of the contours provides insufficient
contrast, against the background, for contours to be seen. Both of these factors relate
directly to contrast. This problem and other problems with reading the critical
information features were investigated further in Chapter 4.

Page 70 Chapter 3: Determining the Variables
2.2 Tone Assessment
The results gained during readability of critical information features showed that
certain TLM features are more easily read than others. This is a factor of contrast /
tone and symbology. In order to test contrast / tone a second, simple experiment was
constructed to refine a basic hypothesis developed by the author, during this
research: when contrast is at its maximum, the maximum distance possible
separating two tones on a grey scale, the best contrast is achieved for NVG vision
recognition.
This experiment was designed to test the recognition of basic grey scales with NVG.
A grey scale of sixteen tones ranging from pure white through to pure black was
superimposed on five different toned sheets. The sheets used were toned white,
25% grey, 50% grey, 75% grey and black. An example sheet used is displayed at
Figure 3.10 to Figure 3.14 respectively. Nineteen personnel, the same as used in
the previous experiment participated. Each participant was asked to look at the
toned sheets and provide verbal feedback on which tones were easiest read with
NVG. The responses within the experiment did not vary between participants and
are summarised below:
• White background sheet (Figure 3.10) – white tone and those close to white are
difficult to read. The easiest tones to read are black and those closest to black.
• Grey 25% sheet (Figure 3.11) – the semi-medium grey tones (those closest to
white) are hardest to read whilst the black tones and those closest to black are
easiest to read.
• Grey 50% sheet (Figure 3.12) - the medium grey tones are hardest to read whilst
black and white and those tones closest to black and white are the easiest to read.
• Grey 75% sheet (Figure 3.13) - the semi-medium black tones (those closest to
black) are hardest to read whilst the white tones and those closest to white are
easiest to read.
• Black background sheet (Figure 3.14) - black tone and those close to black are
difficult to read. The easiest tones to read are white and those closest to white.

Chapter 3: Determining the Variables Page 71
Figure 3.10 Tone Test White

Page 72 Chapter 3: Determining the Variables
Figure 3.11 Tone Test 25% Grey

Chapter 3: Determining the Variables Page 73
Figure 3.12 Tone Test 50% Grey

Page 74 Chapter 3: Determining the Variables
Figure 3.13 Tone Test 75% Grey

Chapter 3: Determining the Variables Page 75
Figure 3.14 Tone Test Black

Page 76 Chapter 3: Determining the Variables
Though simultaneous and successive contrasts were encountered within this
experiment, the effect did not alter the results. The results prove that, with NVG, the
further two tones are apart on a grey scale the greater contrast they provide. This is
the same for normal unaided vision. It is also supported in cartography by image
enhancement processes used to clarify remotely sensed images and by the simple
rule that the greater the value contrast among symbols the greater the clarity and
legibility.46 On the white background sheet, black is the best tone seen and is the
furthest away from white on scale. The same is true for the reverse, where white has
the greatest contrast on the black background. On the grey 50% background both
white and black have the same contrast as they are equidistant on the scale from the
mid point.
These results have been well documented and researched within both the colour and
cartography communities for both colour and grey contrast using normal vision.
What had not been researched was whether the same held true for vision with NVG.
This second experiment helped the research to narrow the reasons why certain TLM
features are unable to be read effectively with NVG.
46 Dent (1996). Cartography Thematic Map Design. Sydney, Wm. C. Brown Publishers. 296;

Chapter 3: Determining the Variables Page 77
3. Summary
This chapter reported on the surveys and experiments undertaken to determine the
variables fundamental to advancing this research for refining TLMs. The major
findings are:
• NVG is a system integral to soldiers operating effectively at night, yet it is not
used for reading TLMs.
• TLM features that cannot be read effectively with NVG are contours,
watercourses and vegetation.
• TLM features that are critical to military operations are contours, watercourses,
vegetation and TLM grid information.
• Contrast is a major factor why TLM features are unable to be read on a TLM
with NVG.

Page 78
Chapter 4
Cartographic Solutions for Variables

Cartographic Solutions for Variables Page 79
Chapter 4. Cartographic Solutions for Variables
The previous chapter identified critical features that are unreadable on a TLM with
NVG: contours, watercourses and vegetation. To achieve the aims of this research
the critical features need to be read with both NVG and normal vision. The scope of
this research limits any changes to TLMs be taken from previous or current
specifications and standards used by the Australian Army to produce a TLM. This
limits the options for changes to the cartographic portrayal of the critical features.
Investigation was required into which standards and specifications would best fulfil
the aims of the research. This chapter investigates and discusses Australian Army
standards and specifications and cartographic methods. The subject of TLM design
and colour is examined in detail during the first half of this chapter. The second half
discusses the appropriate standards and specifications for the production of a TLM
prototype on which critical features are readable with both NVG and normal vision.
1. TLM Design
In order to make refinements to the TLM, an understanding of cartographic design
principles and their applicability to this research is necessary. Refining the TLM is
problematic, as the TLM has to be used in both chromatic and achromatic conditions.
Generally, cartographic research and design only has to deal with either chromatic or
achromatic conditions. This problem will be addressed through an examination of
the normal cartographic factors considered when designing a TLM and applying
these factors to the research as necessary. There are six factors to consider when
studying the visual variables on a TLM – balance, shape, size and three aspects of
colour (hue, chroma and value).47 Each of these factors is discussed below.
47 Robinson, et al (1995) Elements of Cartography. 476
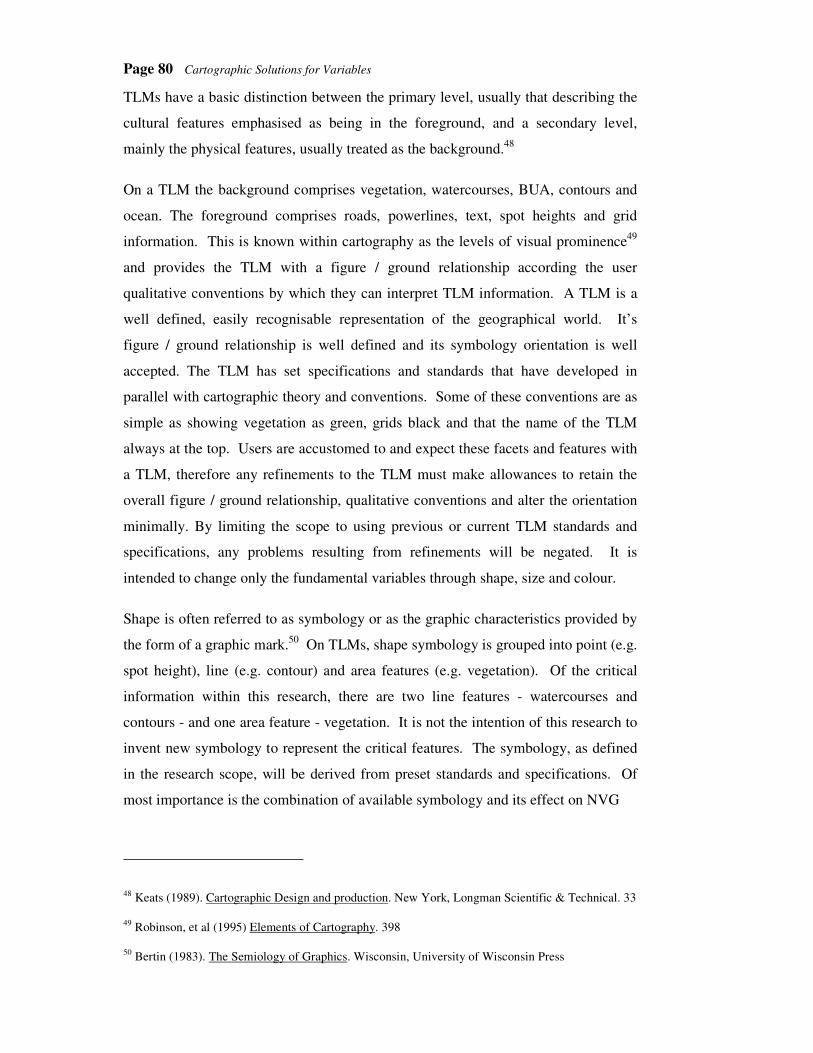
Page 80 Cartographic Solutions for Variables
TLMs have a basic distinction between the primary level, usually that describing the
cultural features emphasised as being in the foreground, and a secondary level,
mainly the physical features, usually treated as the background.48
On a TLM the background comprises vegetation, watercourses, BUA, contours and
ocean. The foreground comprises roads, powerlines, text, spot heights and grid
information. This is known within cartography as the levels of visual prominence49
and provides the TLM with a figure / ground relationship according the user
qualitative conventions by which they can interpret TLM information. A TLM is a
well defined, easily recognisable representation of the geographical world. It’s
figure / ground relationship is well defined and its symbology orientation is well
accepted. The TLM has set specifications and standards that have developed in
parallel with cartographic theory and conventions. Some of these conventions are as
simple as showing vegetation as green, grids black and that the name of the TLM
always at the top. Users are accustomed to and expect these facets and features with
a TLM, therefore any refinements to the TLM must make allowances to retain the
overall figure / ground relationship, qualitative conventions and alter the orientation
minimally. By limiting the scope to using previous or current TLM standards and
specifications, any problems resulting from refinements will be negated. It is
intended to change only the fundamental variables through shape, size and colour.
Shape is often referred to as symbology or as the graphic characteristics provided by
the form of a graphic mark.50 On TLMs, shape symbology is grouped into point (e.g.
spot height), line (e.g. contour) and area features (e.g. vegetation). Of the critical
information within this research, there are two line features - watercourses and
contours - and one area feature - vegetation. It is not the intention of this research to
invent new symbology to represent the critical features. The symbology, as defined
in the research scope, will be derived from preset standards and specifications. Of
most importance is the combination of available symbology and its effect on NVG
48 Keats (1989). Cartographic Design and production. New York, Longman Scientific & Technical. 33
49 Robinson, et al (1995) Elements of Cartography. 398
50 Bertin (1983). The Semiology of Graphics. Wisconsin, University of Wisconsin Press

Cartographic Solutions for Variables Page 81
acuity. By retaining the preset symbology, any effect on balance, orientation and
associated cognitive aspects will be reduced. Combinations of symbology, not new
symbology, with changes to size and colour, will be used to achieve the research aim.
The size chosen for TLM symbology and TLM features is dependent on visual
acuity. It is an easily definable quantitative aspect of TLM design, based on the
acuity of the human eye. For a human eye with 20/20 vision the absolute thresholds
for the recognition of a symmetrical point symbol is slightly less than 0.1mm, whilst
for a line symbol it is 0.06mm.51 A line symbol is able to be smaller as its
perceptible length offers a greater target. On a TLM, the smallest symbols are
0.5mm in diameter e.g. spot heights and symbolised buildings. The smallest line
width used is 0.1mm e.g. contours and grid lines. The critical information features
are easily seen with the naked eye under daylight conditions and previous
experimentation, within this research, has proved that some can also be read with
NVG. NVG acuity is affected by the generation of device used and ambient light
conditions and is generally less than normal vision.52 The previous experiments
conducted during this research proven that TLM grids, grid numbers and spot
elevations could be easily read with NVG. This proves that whilst acuity is different
for NVG and normal vision, the smallest features on a TLM can be read when size is
the only factor considered. Size cannot be considered by itself within TLM design
and refinement, as it affects symbology and colour, which in turn, affects contrast.
It is first necessary to understand the basic principles of colour in order to understand
contrast. Colour theory divides colours into two classes, chromatic and achromatic.
Chromatic colours are those that have colour (or hue) and achromatic colours are
those that are white, grey or black.53 The difference between chromatic and
achromatic is important because a TLM is viewed as chromatic under daylight
conditions and achromatic under NVG conditions. Chromatic colours have three
51 Keats (1989) Cartographic Design and production. 34
52 Kotulak and Rash C (1992) Visual Acuity with Second and Third Generation Night Vision Goggles Obtained from a New Method of Night Sky Simulation Across a Wide Range of Target; Alabama.
53 Dent (1996) Cartography Thematic Map Design. 295

Page 82 Cartographic Solutions for Variables
variables being hue, chroma and value. Achromatic colours are able only to be
described by their value. Value, the only common variable between chromatic and
achromatic, provides for the lightness or darkness of an object or feature54 and is a
major influence through value contrast. Hue refers to the different colours of an
object e.g. blue, red, brown etc. Chroma, also called saturation, refers to the purity
of a colour. Though both hue and chroma are import to this research, they are of
lesser importance than value.
Value and value contrast are a major variable within TLM design and refinement and
it is extremely difficult to measure on a TLM and difficult to use in practice. Value,
providing for the lightness or darkness of a colour, is rarely used by itself in
cartography.55 Cartographers usually stipulate individual colour to use on TLMs,
each which has its own value. The challenge arises when colour combinations are
used on TLMs and the best colours to provide contrast are chosen. This use of
different colours to complement each other and bring legibility and clarity to the
TLM is called value contrast.
Value contrast is important to this research, as it is the basis behind good figure /
ground relationships56 and influences discrimination of TLM features and
symbology.57 In mathematical terms and as defined by the International Commission
on Illumination (CIE), contrast of a target is the measure of the difference in
luminance between the target and its immediate surround or background58 and can be
defined by the basic formula at Figure 4-1.
Another contrast formula is used for enhancement of remotely sensed images. It
enhances contrast in remotely sensed images by rescaling the original reflectance
value range to match the numerical range used in the recording device. This is called
54 Ibid. 296
55 Ibid. 297
56 Robinson, et al (1995) Elements of Cartography. 399
57 Keats (1989) Cartographic Design and production. 22
58 International Commission on Illumination (CIE) (1992). Contrast and Visibility. Vienna, Central Bureau of the CIE. 3

Cartographic Solutions for Variables Page 83
a percentage contrast stretch.59 It is generally used only on achromatic images, but
can be used on chromatic images, by stretching each hue individually.
It is difficult to apply these formulae to a TLM as target and background size vary,
process printing produces individual nuances specific to each print run and the
different light conditions under which TLMs are read are numerous. The variable
parameters of individual eyes and NVG also preclude the formulas from providing a
contrast solution.
Figure 4.1 Basic Formula for Contrast60
The application of a mathematical formula alone will not provide an accurate
solution to this problem. Its application may result in a product that works well for
daylight conditions but not for NVG conditions; in turn affecting figure / ground
relationship and balance of the TLM. Whilst a mathematical formula may work for
targets other than TLMs or for remotely sensed images, both formulae ignore the
psychological variances of human interaction and vision. A TLM has five basic
colours that, through stippling, produce many hues. By changing illumination
sources, many more hues are produced. Fundamentally, the different colours and
contrast perceived on a TLM are a psychological function based on a person’s
perception.61 What one person perceives as blue another may perceive as blue-grey.
When the achromatic factors of NVG are introduced, perception is again altered.
59 Robinson, et al (1995) Elements of Cartography. 211
60 International Commission on Illumination (CIE) (1992) Contrast and Visibility. 3
61 Dent (1996) Cartography Thematic Map Design. 296

Page 84 Cartographic Solutions for Variables
The psychological factors of contrast are affected by two contrast variables. These
variables alter psychological perception of chromatic and achromatic colours and are
termed successive contrast and simultaneous contrast. Successive contrast results
when a colour is viewed in one environment and then in another in quick succession.
The colour will be modified relative to these new surroundings.62 Simultaneous
contrast is when two different colours, each of different value, are placed side by side
and the edge of each colour is affected by the other and a different value is
perceived.63 This is shown at Figure 4.2 where the grey tone object and line are of
equal value within each of the three backgrounds, but are perceived to be darker as
the background becomes darker. This is also called induction. It becomes a problem
in TLM design when several different values of the same colour are juxtaposed on
the TLM.64 Within this research it is a problem with vegetation as the greens used
are all the same colour but have different values based on their stipple specification.
The lack of contrast between each of the vegetation types is a contributing factor as
to why they cannot be read with NVG in an achromatic environment in TLM B.
For contours and streams, simultaneous contrast is not a major contributing factor as
to why they cannot be seen. The thin lineweight of both contours and streams,
0.1mm, allows little simultaneous contrast against the various backgrounds of a
TLM.
62 Ibid. 297
63 Green and Horbach (1998). "Colour-Difficult to Both Choose and Use in Practice." The Cartographic Journal 35(2): 171
64 Dent (1992) Cartography Thematic Map Design. 297

Cartographic Solutions for Variables Page 85
Figure 4.2 Simultaneous Contrast
Contrast, whilst primarily a function of hue, symbology, size and value, can also be
altered by patterns. On achromatic maps, patterns are the main way of differentiating
between area features. This is achieved by line patterns or dot patterns, similar to
stippling but producing different effects. On the Wide Bay Training Area Special
TLM (TLM C), a dot stipple pattern is used to represent scattered and medium
vegetation. Though primarily a stipple, the dots of the stipple are large enough to be
recognised with normal vision and could be construed as a form of dot pattern. It is
posed that this ‘crossover’ of chromatic and achromatic technique is why this type of
vegetation was best seen under NVG during the previous tests.
Cartographic research and principles are best used when designing a new TLM.
This research is not being undertaken to develop a new TLM, but to refine the
existing TLM. The research scope allows the TLM to be altered only by using the
previous or current TLM standards and specifications. The standards and
specifications denote orientation, shape, size and three aspects of colour (hue,
chroma and value). What can be altered is the contrast of the TLM by using the best
contrasting standards and specifications, whether based on symbology, size or
colour. Contrast, as proven by surveys and experiments conducted in this research,
is the primary reason why features on a TLM cannot be read with NVG.

Page 86 Cartographic Solutions for Variables
2. Refining the TLM
The use of the cartographic variables described above were needed to define what
affects the visual acuity of a TLM and what needs to be considered during TLM
design and refinement. Of all of the cartographic variables discussed, contrast has
the greatest affect on this research. To change the contrast of a TLM, the variables
must be defined and discussed in relation to contrast and the previous experiments.
The least difficult variable to change on a TLM is colour. Colours that will be used
in this research are defined in SYMBAS Edition 2, which sets hue, value and chroma
by denoting the Pantone print colours for each cartographic feature (shown in Table
2-2 for 1:50 000 scale TLM). SYMBAS Edition 2 details two other colours for use
when TLM printing. These colours are Process Yellow and Electric Blue 266, also
Pantone colours. The two colours are used only on Joint Operation Graphic (JOG)
TLMs that are produced at 1:500 000 scale.65 The two colours will be included
within this research to increase refinement variables and provide maximum
alternatives within the research scope. Major changes of colour e.g. vegetation from
green to brown, will not be undertaken within this study. It is beyond the scope of
this research to change the qualitative and cognitive aspects of the TLM that users
are accustomed to, and if major changes of colour are undertaken, the ground / figure
relationship, balance and usability of the TLM would be jeopardised. A prototype
was developed to test the effects of colour on contrast within the TLM by changing
the colour of contours and streams. It was considered possible to achieve good
contrast for acuity by changing colours to those that provide a greater contrast,
without changing their connotative meaning.
65 Royal Australian Survey Corps (1994) Symbolization - All Series (SYMBAS) Ed 2
Cartographic Solutions for Variables Page 87
In the first experiment, readability of critical information, it was discovered that all
text and grid information, printed black, could be easily read with NVG. Black is the
darkest colour used to print TLMs, the second darkest colour is Electric Blue 266. If
the colour of contours and streams are changed to those colours which are known to
be seen with NVG, they may provide a solution within the scope of this research.
Black is known to be seen, so it is theoretically correct to predict that contours
printed black should be seen with NVG. This is supported by the fact that TLM
grids, printed black and 0.05mm in size can be read with NVG. Using this line of
reasoning, it is surmised that changing the colour of watercourses from Process Blue
to Electric Blue 266, which is a darker hue, should provide greater contrast. It
should also not affect comprehension of the TLM as the watercourses would still be
printed blue. However, changing the colours may affect TLM balance and may
reduce the overall TLM legibility. The use of colour only to produce a prototype
TLM was of benefit to this research as it may have provided a simple solution
without the need for changing symbology.
The second variable for use when developing the prototypes was symbology. The
different types of symbology tested previously within this research are detailed in
Table 4-1. The Table shows each of the fundamental variable symbols used on each
edition of the 1:50 000 TLMs. It was determined not to differ from Table 4-1 in the
use of symbology to refine the TLM. Each symbol was given a unique letter
identifier e.g. for contours used on TLMs A and B - C1 and for the vegetation
symbols used on TLM B - V2. These unique letters were used to simplify the use of
each symbol and to best determine combinations of symbols for use on prototypes.

Page 88 Cartographic Solutions for Variables
Symbol Name TLM sheet Experiment TLM
Colour Appendix ID
Contour Mt Tamborine & Wide Bay Training Area Special
B & C Brown 152 B & C C1
Contour Caboolture A Brown A C2 Vegetation Mt Tamborine B Green 367 B V1 Vegetation Wide Bay Training
Area Special C Green 367 C V2 Vegetation Caboolture A Green 367 A V3 Watercourses Mt Tamborine &
Wide Bay Training Area Special
B & C Process Blue B & C H1
Watercourses Caboolture A Process Blue A H2
Table 4.1 Symbology for TLM Refinement
The different symbology for each of the critical information features, as depicted in
Table 4-1, was used to guide the production of prototype TLMs. There are twelve
prototypes that may be produced using the determined critical information features’
symbology. This is shown in Table 4-2. The number of different prototypes that
could be produced was nine, as three of the combinations represent the three TLMs
used throughout this research. The Table gives combinations of the symbology for
use, but fails to take into account some of the characteristics discovered earlier in the
research, which limited symbol usability. The symbol C1 was unable to be read on a
TLM; symbol V1 does not differentiate between vegetation classes sufficiently and
symbol H1 is difficult to read on TLMs. It was considered unrealistic and a waste of
resources to simply build all TLM prototypes based on the combinations available
within Table 4-1. Whilst the combinations were not discarded, a further discussion
of alterations to symbology follows to test findings within this research and facilitate
the achievement of the overall aims.

Cartographic Solutions for Variables Page 89
Variable Variable Variable
C1 (contours on Mt Tamborine
& Wide Bay Training Area
Special)
V1 (vegetation on Mt
Tamborine)
H1 (watercourses on Mt
Tamborine & Wide Bay
Training Area Special)
C2 (contours on Caboolture) V2 (vegetation on Wide Bay
Training Area Special)
H2 (watercourses on
Caboolture)
V3 (vegetation on Caboolture)
Combinations Available Notes
C1 – V1 – H1 This equates to the symbology already on Mt Tamborine TLM.
C1 – V2 – H1 This equates to the symbology already on Wide Bay Training Area
Special TLM.
C1 – V3 – H1 Vegetation classes need development.
C1 – V1 – H2 Contours will not be seen, vegetation difficult to interpret.
C1 – V2 – H2 Contours will not be seen.
C1 – V3 – H2 Vegetation classes need development.
C2 – V1 – H1 Contours will not be seen, hydro difficult to read, vegetation
difficult to interpret.
C2 – V2 – H1 Contours will not be seen, hydro difficult to read.
C2 – V3 – H1 Vegetation classes need development.
C2 – V1 – H2 Contours will not be seen, vegetation difficult to interpret.
C2 – V2 – H2 Contours will not be seen.
C2 – V3 – H2 This equates to the symbology already on Caboolture TLM.
Table 4.2 Symbol Combinations for TLM Prototypes

Page 90 Cartographic Solutions for Variables
The combinations, C1 –V3 – H1, C1 –V3 – H2 and C2 –V3 – H1 provide the best
prospect of achieving a useable product. All of these combinations are similar to the
Caboolture TLM (TLM A) and all use the vegetation specification as depicted on the
Caboolture TLM. Theoretically, they should all have the best overall contrast as the
Caboolture TLM was surveyed as having the best levels of acuity during the
fundamental variable reading experiment.
The one fault with the Caboolture TLM vegetation specification was that it lacked
the ability to portray different vegetation classes such as scattered forest and rain
forest. This presented a problem within the research as its scope prevented the use,
where possible, of standards and specifications outside that used to produce
Australian Army TLMs. To keep as close as possible to TLM specifications used to
produce the Caboolture TLM, scattered and rain forest vegetation classes were
developed based on existing specifications. Scattered vegetation was depicted
exactly as medium vegetation but symbol density per square centimetre was reduced.
In experimentation, users stated they had difficulty determining boundaries between
the two vegetation types on the Caboolture TLM. The introduction of a third
vegetation type would further exasperate this problem. Rain forest was depicted
using the same symbol as used on Mt Tamborine TLM (TLM B). The Mt
Tamborine specifications were the first time that rain forest was introduced as a
separate vegetation class.
Whilst the development of new specifications stepped outside the intended scope, it
was considered a good method of testing contrast theories and was considered an
appropriate basis for one prototype, which will be discussed later in this Chapter
when standards and specifications for prototypes are listed.

Cartographic Solutions for Variables Page 91
Apart from the need to increase the vegetation classes within the Caboolture TLM
specification, all other vegetation symbology was kept within each edition
specification and not broken into individual symbols. As an example, the vegetation
types used on the Wide Bay Training Area Special TLM (TLM C) were not broken
into individual components (scattered, medium, dense forests and rain forest) and
combined with other vegetation symbology from different TLM editions. This
strategy was adopted to preserve the overall balance of the TLM and to reduce any
impact on the psychological and cognitive aspects of the TLM.
The symbology depicting watercourses on the Caboolture TLM was surveyed as the
easiest to read with NVG. This is due to the lighter background of the TLM and the
symbology, which is a dashed line, rather than the continuous lines of Mt Tamborine
and Wide Bay Training Area Special. On Mt Tamborine and Wide Bay Training
Area Special, watercourses were sometimes read but often confused with contours.
Apart from using the best watercourse symbology (Caboolture) and changing the
colour, as discussed previously, the other option available was to change the size of
the symbol.
It was reported in Chapter Three that the only contours able to be read with NVG are
those on the Caboolture TLM. It was surmised that the contours could be read
because contrast of the contours against the background was sufficient for visual
acuity. Therefore, it would seem logical to change all contour specifications to those
on the Caboolture TLM. However there are problems with this approach:
• The contours are of 0.1mm size and proved unreadable against the vegetation
symbols of Mt Tamborine (V1) and Wide Bay Training Area Special (V2).
• The contours are at 20m intervals. On Mt Tamborine and Wide Bay Training
Area Special, they are at 10m intervals. It was assessed that a change of contour
interval would affect the accuracy and usability of a TLM and diverge too far
from the standards and specifications to which the majority of users are
accustomed.
Page 92 Cartographic Solutions for Variables
The issue of contour acuity is difficult. If the background was changed to a lighter,
different symbology (such as the Caboolture vegetation specification), there would
be difficulty differentiating between vegetation classes. If the symbology was
changed to a dashed or dotted line it would conflict with the best symbology for
portrayal of watercourses and could affect the cognitive meaning of the TLM, as
contours have always been represented by solid lines. One option, already proposed,
was to change the colour of contours to a known visible colour. The final option
adopted was to change the size of contour lines.
Both watercourses and contours were constrained by the limits of the standards and
specifications adopted in this research, which prevented a more comprehensive
solution to the problem of contrast. The final option left within the scope of this
research, to improve acuity with NVG, was to change the size of the symbol. During
the experiment to determine the readability of the fundamental variables, some
participants stated they were able to see some of the index contours, which are
0.2mm in width. If colour and symbol type were to remain the same, then increasing
the size of contours and watercourses from 0.1mm to 0.2mm in width was considered
as having the potential to increase their acuity. It may also cause conglomeration
problems where contours are closely spaced, reducing their acuity and obscuring
other features. It was proposed that the larger size of contours and watercourses
would provide a larger target for acuity and provide for greater contrast against the
background. This was trialed on a prototype to ascertain whether a larger target
provided better acuity, without obscuration, on a TLM.
The standards and specifications of the TLM were considered the greatest limiting
factor in development of the prototypes. The three variables of colour, symbology
and size proved to be limiting factors, to a lesser degree, on development of the
prototypes, because they too were constrained by the TLM standards and
specifications. Finally, the psychological and cognitive issues associated with a
TLM were limiting factors, as they would influence the final user’s acceptance of the
prototypes.

Cartographic Solutions for Variables Page 93
3. Prototype Specifications and Construction
The production of four TLM prototypes was undertaken to validate previous
experimentation and to test theories developed within this research. The prototypes
were constructed and printed with the assistance of the 1st Topographical Survey
Squadron, Australian Army. The prototypes were produced using digital
compilation and process printing methods to replicate, as close as possible, a TLM.
This subchapter details the specifications used on each of the prototypes and methods
used to compile them.
3.1 Standards and Specifications
The major aim of the production of each of the four prototypes was to provide
sufficient contrast on each prototype to read the critical information features without
compromising the overall cognitive and aesthetic functions of a TLM. The four
prototype TLMs each tested a different a contrast theory in order to achieve this aim.
The base TLM used for each of the prototypes was the Mt Tamborine TLM (TLM
B). As discussed earlier, this TLM provides a good overall representation of
vegetation types and is information laden, providing for refinements to be tested in a
‘worst case’ scenario.
The specifications for each prototype, along with their aims, are shown at Tables 4-3,
4-4, 4-5 and 4-6. On each of the four prototype TLMs, certain standards and
specifications remain unchanged. These are standards relating to portrayal, TLM
layout and symbology, which did not affect this research, were not operationally
important or were able to be read with NVG. They are:
• Scale: remains for all prototypes at 1:50 000.
• Vertical Datum: is Australian Height Datum (AHD).
• Horizontal Datum: Australian Geodetic Datum 1966 (AGD 66).
• Projection: Transverse Mercator.
• Cultural features and symbology: No change.

Page 94 Cartographic Solutions for Variables
• Text features and symbology: No change.
• Grid features and symbology: No change.
• Marginal Information: No change.
• Vegetation: only changes will be made to scattered, medium, dense and
rainforest.
Prototype One
Feature Symbology Size Colour Comment
Contours Continuous line 0.1mm Process Black
Watercourses Continuous line 0.1mm Electric Blue 266
Scattered vegetation
No change to Mt Tamborine specifications
Green 367
Medium vegetation
No change to Mt Tamborine specifications
Green 367
Dense vegetation
No change to Mt Tamborine specifications
Green 367
Rain forest No change to Mt Tamborine specifications
Green 367
Aims:
1. To test whether contours and watercourses can be read if their colour only is changed to a darker colour.
2. To eliminate the possibility that contours and watercourses cannot be seen because of their 0.1mm size.
3. To see if colour can alone change the contrast of the TLM sufficiently for it to be read with NVG.
Table 4.3 Prototype One

Cartographic Solutions for Variables Page 95
Prototype Two
Feature Symbology Size Colour Comment
Contours Continuous line
0.1mm Brown 152 No change from current specifications.
Watercourses Continuous line
0.1mm Process Blue No change from current specifications.
Scattered vegetation
New symbol Green 367 Same as medium but lower density of symbol per sq cm.
Medium vegetation
Same as Caboolture
Green 367
Dense vegetation
Same as Caboolture
Green 367
Rain forest Same as Mt Tamborine
Green 367 Not new symbol but new class for this old specification
Aims:
1. To test the current contour and creek / stream specifications with the old vegetation specifications and see if the vegetation allows more contrast and acuity.
2. To test whether the addition of new vegetation classes, to this specification, is an effective option.
Table 4.4 Prototype Two

Page 96 Cartographic Solutions for Variables
Prototype Three
Feature Symbology Size Colour Comment
Contours Continuous line
0.2mm Brown 152
Watercourses Continuous line
0.2mm Process Blue
Scattered
vegetation
Same as Wide Bay Training Area Special.
Green 367
Medium
vegetation
Same as Wide Bay Training Area Special.
Green 367
Dense vegetation Same as Wide Bay Training Area Special.
Green 367
Rain forest Same as Wide Bay Training Area Special.
Green 367
Aims:
1. To test if increasing the size of streams / creeks and contours has an effect on contrast and hence acuity.
2. To test if conglomeration and obscuration occurs if size is increased.
3. To keep as close to current specifications as possible whilst increasing contrast and acuity.
Table 4.5 Prototype Three
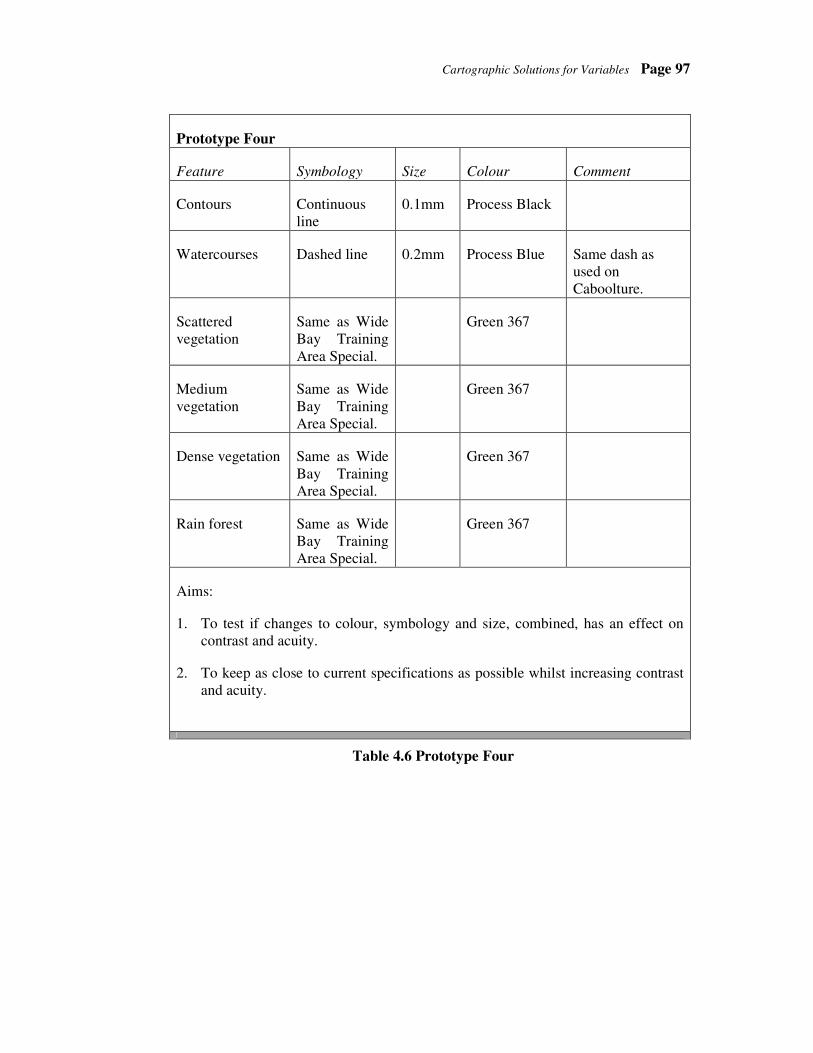
Cartographic Solutions for Variables Page 97
Prototype Four
Feature Symbology Size Colour Comment
Contours Continuous line
0.1mm Process Black
Watercourses Dashed line 0.2mm Process Blue Same dash as used on Caboolture.
Scattered vegetation
Same as Wide Bay Training Area Special.
Green 367
Medium vegetation
Same as Wide Bay Training Area Special.
Green 367
Dense vegetation Same as Wide Bay Training Area Special.
Green 367
Rain forest Same as Wide Bay Training Area Special.
Green 367
Aims:
1. To test if changes to colour, symbology and size, combined, has an effect on contrast and acuity.
2. To keep as close to current specifications as possible whilst increasing contrast and acuity.
Table 4.6 Prototype Four

Page 98 Cartographic Solutions for Variables
Each prototype was developed to test the outcomes of the surveys and experiments
undertaken during this research and primarily focus on problems with NVG and
TLMs. The prototypes required testing with normal vision to rate their level of
acuity and acceptability. This was a key component of the research, as the aim was
to refine the TLM for night use but not to impair day use. Testing conducted using
NVG only would address only half of the scope of the research.
It was considered that each prototype may have affected the balance or figure /
ground relationship of the TLM that would have been evident during testing. The
prototypes were designed also to closely reflect the normal attributes and layout of a
TLM. This was to reduce any cognitive or psychological issues with layout and the
distribution of information throughout the TLM. The processes used to make the
prototypes were reflective of the current methods of TLM production and were used
to promote efficiency to ensure that any symbology changes could be easily applied
to current production methods.
3.2 Prototype Production
The author, in conjunction with the 1st Topographical Survey Squadron produced the
prototypes through digital compilation and process printing methods. The equipment
and software used during production included:
• Heidelberg Digital Imagesetter – used for production of intermediate repromat
(negatives).
• Platemaker – used for production of printing plates for press.
• Heidelberg Single Colour Press – used for printing prototypes.
• Arcview 3.266 – for classification of vegetation areas and manipulation of
contours and watercourses.
66 Arcview is a proprietary GIS software program owned and produced by Earth Sciences Research Institute (ESRI).

Cartographic Solutions for Variables Page 99
• Adobe Photoshop67 – for creation of digital images prior to use with image setter.
All prototypes were process printed to ensure close adherence to TLM standards and
specifications and to increase efficiency. Whilst printing could have been achieved
through use of a digital plotter, the colours, clarity, and plotting system limitations
would preclude the prototype from closely resembling a TLM. The limited number
of changes allowed greatest efficiency to be achieved during the printing process.
For example, none of the marginal or grid information was changed with the result
that enough copies could be printed at single time for use with each of the four
prototypes. This allowed maximum efficiency with a single colour press.
Digital data of cultural features, vegetation boundaries, hydrology and hypsography
features were provided by the 1st Topographical Survey Squadron in the form of
AutoCAD files. The files were converted into Arcview Shapefiles and attributed.
Vegetation classes were identified and attributed to assist in producing intermediate
repromat. The accuracy of the attributing was approximately 90% due to data
cleaning and compilation methods used. This was deemed acceptable to the
research, as it would have no major effects on acuity or contrast.
Intermediate repromat is that which is used to create final repromat. In process
printing, intermediate repromat is used to apply stipples to the final repromat so that
one single plate can be produced for all vegetation classes. Intermediate repromat
was produced for all vegetation classes so that vegetation stipples from the
Caboolture and Wide Bay Training Area Special TLMs could be applied to the Mt
Tamborine TLM. The vegetation intermediate repromat, often called open window
masks, was used in conjunction with the master stipple sheets held by the 1st
Topographical Survey Squadron. The master stipple sheets are defined in SYMBAS
Edition 2.68 The combination of stipples allows for different classes of vegetation to
be shown on a TLM and printed using a single plate and single colour.
67 Adobe Photoshop is a proprietary software program owned and produced by Adobe Systems Incorporated.
68 Stipples are defined in Chapter Two, Table 2-2 and Figure 2-8.

Page 100 Cartographic Solutions for Variables
The Geospatial Intelligence Branch (GIB), Defence Intelligence and Geospatial
Organisation (DIGO) supplied the final repromat of Mt Tamborine TLM. Previously
known as the Army Survey Regiment Bendigo, the GIB is where all Australian
Army TLMs are compiled and printed. The final repromat was then used to produce
plates for printing of the prototypes where features remained constant. New final
repromat was required to be made where features differed from those on the Mt
Tamborine TLM. A short summary of each prototype is detailed below:
• Prototype One (Appendix G). The original repromat was used to produce plates
as only colour and no features changed from the Mt Tamborine TLM
specifications. During printing, new colours (process black / electric blue) were
substituted for the old colours of contours and watercourses (brown / process
blue).
• Prototype Two (Appendix H). New final repromat and a new vegetation plate
were produced, as vegetation was the only change. The changes included two
new vegetation classes. No colours were changed during printing.
• Prototype Three (Appendix I). New final repromat and plates were made for
vegetation, watercourses and hypsography. No colours were changed.
• Prototype Four (Appendix J). New final repromat and plate were made for
watercourses. During printing, the colour used for contours was changed to
black.

Cartographic Solutions for Variables Page 101
The quality of the prototypes closely matched the standard of TLMs printed by
GIB69. Each of the prototypes was produced according to the specifications as
detailed in Tables 4-3, 4-4, 4-5 and 4-6. During printing some minor problems were
encountered:
• Alignment and registration of plates during the printing process was not exact.
There was a misalignment of approximately + 2mm. This is a common problem
with single colour presses. Though a gap between the neat line and the vegetation
is visible, it has little effect on the outcomes of this research.
• The creation of new stipple for scattered vegetation on Prototype Two was
limited in resolution by the software used for production of the repromat. The
stipple appears as a “blob” and is highly pixilated as compared with the other
stipples used to depict medium and dense vegetation. The impact of this problem
was ascertained during subsequent prototype experimentation.
• The dashed lines used to represent watercourses on Prototype Four appear
pixilated and lack good resolution. The lack of resolution gives the watercourses
appearance of greater size than the intended 0.2mm. The cause of this problem is
related to the software limitations for production of the repromat. The impact of
the watercourse portrayal on Prototype Four was ascertained during subsequent
prototype experimentation.
69 GIB use process printing equipment that is technically advanced over the 1st Topographical Survey Squadron. GIB also uses a five colour press for easier registration and faster printing times.

Page 102 Cartographic Solutions for Variables
4. Summary
The development of the prototype TLMs was based on results from the research
experimentation whilst still applying current cartographic design principles. The
scope of the research constrains the amount of changes that could be applied to the
critical information features (contours, watercourses and vegetation). The primary
aim of the changes was to increase the contrast of the TLM so that it could be read
effectively with NVG and normal vision. The use of digital and process printing
techniques to produce the prototypes reduced differences, to a negligible level,
between the prototypes and a standard TLM.
Orientation, shape, size and the three aspects of colour (hue, chroma and value) were
investigated to determine their degree of impact on refining the TLM. Orientation,
including ground / figure relationship was considered to remain stable within the
TLM as changes were made only to shape, size and colour. Shape was used to
enhance watercourses and develop new vegetation classes that complimented the
vegetation specification used on the Caboolture TLM. Size of contours and
watercourses were increased to determine if the larger sizes would provide better
contrast without obscuring or reducing clarity. Colour, as a single factor, was
changed for contours and watercourses to investigate the possibility of providing
sufficient contrast for NVG acuity. The prototype designs use a combination of
shape, size and colour to test different combinations of change to the critical
information features.

Page 103
Chapter 5
Testing the Refinements

Page 104
Chapter 5. Testing the Refinements
1. Prototype Testing
The production of the prototypes was the culmination and linking of the information
gained throughout the surveys conducted in Chapter Two, the experimentation in
Chapter Three and the contrast and cartographic theory discussed in Chapter Four.
The major aim of each of the four prototypes was to produce sufficient contrast by
which to read the critical information features (contours, watercourses, vegetation)
without compromising the overall cognitive and aesthetic functions of a TLM. The
prototype TLMs each were designed and produced to test a different contrast theory
in attempting to achieve this aim.
An experiment was devised and conducted to test if any of the prototypes or
elements of the prototypes were successful in achieving the aim. Members of the
Australian Army participated in the experiment within which they used normal
vision and NVG vision to view and comment on each of the prototypes.
1.1 Aim and Methodology
The aim of the experiment was to test if changes to the TLM through use of colour,
size and symbology, as developed through the prototypes, allowed the critical
information features to be read.
The experiment was conducted in two parts, within the period of a single day, at
Gallipoli Barracks, Enoggera. The first part asked participants to complete a survey
form whilst viewing the four prototypes concurrently with normal vision in daylight
conditions. The second part required participants to view the prototypes
concurrently using the Australian Army NVG. The experiment was conducted in an
outside location for the first part, with each of the four maps laid out on a table.
Each participant was allowed as much time as required to answer the questions and
was allowed to touch the maps and move them about freely.
Chapter 5: Testing the Refinements Page 105
The second part of the experiment was conducted in a military weapons training
facility that replicates night light ambience. The level of light selected was
equivalent to that which is available during a half moon. Half moonlight was chosen
as the timeframe for the experiment was minimal and the difference between full
moonlight and no moonlight could be extrapolated if necessary. The half moonlight
was the same level of light as used in previous experimentation and thus was a
constant. Participants were asked to focus their NVG and then read the two lines of
text printed under the scale bar of TLM C. All participants were able to accurately
read the two lines of text before proceeding with the second part. Participants then
viewed each of the four prototypes concurrently, in their own time, and completed a
simple set of questions.
Twenty two Army personnel participated in the experiment. None of the participants
had been involved in earlier surveys or experiments during this research. By using
personnel who had not been exposed to the previous research methodology, it was
expected that non-biased and uninfluenced results could be achieved. The
questionnaire used during this experiment is at Appendix K.
To simplify the results each prototype is referred to in the remainder of this study as
P1 (Prototype One – Appendix G), P2 (Prototype Two – Appendix H), P3 (Prototype
Three – Appendix I) and P4 (Prototype Four – Appendix J).
1.2 Results
The response to the first two questions by the participants was unanimous. The
prototype that best resembled a standard TLM was P3, whilst P2 was regarded as the
prototype which least resembled a standard TLM. The choice of P3 was expected as
it has the closest specifications to a standard TLM and is of the same colours as a
TLM. P2 does not represent the vegetation specifications that many personnel are
accustomed to. P2 also provides a different contrast background as the prototype is
predominantly white, whilst the other prototypes have a predominantly green
background.

Page 106 Chapter 5: Testing the Refinements
The majority of participants stated that on P1 the contours were easiest to read. The
second highest response was P2 whilst only one response stated P3 and none P4. P4
was rated as the worst prototype on which to read contours with normal vision. These
responses highlight the ease of reading information, coloured black, on a TLM and
shows that the greatest contrast provides the easiest recognition. There are two
reasons why P4 was chosen as the worst on which to read contours; the vegetation on
P4 is of a darker hue than P1 and the overbearing nature of the watercourses on P4
affects the balance of the TLM and readability of contours.
All participants stated that the best prototypes on which to read watercourses were P2
and P3, and the worst was P1. That is to say the best watercourses for reading were
coloured Process Blue. Watercourses were best ‘identified’ on P4, however
participants stated the clarity and accuracy was not as good as the other prototypes
making P4 difficult to read. Some participants stated that the watercourses on P4
changed the overall appearance and feel of the TLM. P1 was rated as the worst as
the contrast between the contours and the watercourses was limited and caused some
confusion. This is in contrast to the fact that contours were rated the best read on P1
and confusion of contours with watercourses was not mentioned during the previous
question. Colour combined with background contrast allows watercourses to be
easily recognised on P2 and P3.
Participants rated P3 as easiest on which to identify different vegetation types. The
common reason given for this was that there is significant difference between the
different hues and the dot stipple affect allows for easy identification of vegetation
types. A few participants stated that P4 allowed for easy recognition. No
participants stated either P1 or P2 as the easiest on which to read different vegetation
types. The reason why both P3 and P4 were rated similarly is because vegetation
specifications on both prototypes are the same.
The worst prototype for identification of vegetation types was P2. The reduced
stipple resolution and lack of a definitive boundary between vegetation types were
given as reasons why vegetation types were difficult to discern and read.
Participants in this question listed no other prototype.

Chapter 5: Testing the Refinements Page 107
When participants were asked to describe their feelings about each of the prototypes,
the following generalised responses were received:
P1
• Watercourses are difficult to discern quickly.
• The map has an overall darker tone as compared to standard TLM.
• Contours are easily read and stand out well.
• Contours sometimes obscure text and make reading difficult, but not impossible.
P2
• Discerning the different vegetation types of scattered, medium and dense is
nearly impossible.
• Contours stand out well.
• Watercourses stand out well.
• The map seems more cluttered with individual features.
P3
• This map is exactly the same as a standard TLM.
• It is a little difficult to read contours when they are close together.
• Discerning different vegetation types is easy.
• The map feels ‘right’.

Page 108 Chapter 5: Testing the Refinements
• P4
• The blue watercourses are overbearing on the map and lack clarity and accuracy.
• The map seems cluttered in places.
• Discerning vegetation types is not too difficult.
• Text is difficult to read on certain areas of the map, generally where contours are
close together.
These responses helped to determine if the prototypes still retained the balance,
figure / ground relationship and cognitive properties of a standard TLM. On P1,
participants stated the map seemed darker than a standard TLM. This was
considered to be a function of the black contours and lack of brown on the prototype.
On P2, many participants responded that the map felt more cluttered than a standard
TLM. This was considered due probably to the vegetation specification that is a
point feature rather than an area feature. The increased amount of point features in
the prototype give the feeling that the map is cluttered. By far, the specifications for
P3 were the closest to a standard TLM, which is why some participants stated the
map felt ‘right’. On P4, the dominant features were the watercourses, which affected
the overall balance of the map. Participants stated that P4 also seemed cluttered
where there was a high density of contours, watercourses and text.
The responses helped identify how the prototypes might be accepted for use during
daylight viewing, if they are successful for use with NVG. Further discussion of the
daylight view of each prototype will be undertaken later in this Chapter.
The final question of the first part of the experiment asked participants to state which
prototype they thought would convey the most amount of information when viewed
with NVG. The majority of participants stated that P4 would be the best with NVG.
The next highest rated was P1 then P2. No participants rated P3 as being possible
the best to convey information when viewed with NVG.

Chapter 5: Testing the Refinements Page 109
The second part of the experiment, using NVG, was conducted immediately after the
first part with the same participants. The first two questions asked which were the
best and worst prototypes for reading contours. Participants equally ranked P1 and
P4 as the prototypes on which contours were easiest to read. On both P1 and P4
contours are black and have an interval of ten metres. All participants stated that
contours could not be read on P3, where contours are brown and 0.02mm in width.
P2 appeared in no answers from participants.
The prototype on which watercourses could be read the best was rated by just over
half of all participants as P3. Remaining participants rated P2 and P4 evenly as the
best on which to read watercourses. All participants rated P1 as the worst on which
to read watercourses. On P3 the watercourses are Process Blue, 0.02mm wide and
are read well against the dot stipple vegetation background. On P1, the watercourses
are Electric Blue, 0.01mm wide and easily confused with contours as stated by
participants.
The majority of participants, answered P3 as the best prototype on which to
differentiate between vegetation classes. The remainder of participants stated that P4
was the best on which to differentiate vegetation classes. Both P3 and P4 have the
same specifications for vegetation portrayal, which is the current standard used by
the Australian Army. All participants responded that P2 was the worst on which to
identify vegetation classes. Participants stated they could clearly identify pine and
rainforest but could not differentiate between scattered, medium and dense
vegetation.

Page 110 Chapter 5: Testing the Refinements
Table 5-1 details the responses to question twenty one, which asked the participants
to rank as a percentage how well they could read each of the features on each of the
prototype TLMs. It is the average of all participants’ ratings and helps substantiate
the responses of the previous questions and helps quantify the readability of each
prototype. Some of the responses differ slightly from the previous questions as the
answer is a percentage of how well a participant could read the entire feature on the
prototype.
Feature / Prototype 1 2 3 4
Contours 100% 84% 0% 100%
Watercourses 22% 84% 90% 78%
Vegetation 44% 20% 100% 90%
Table 5.1 Readability of Critical Features on Prototypes
The final question within the experiment asked participants for any comments on the
prototypes with either type of vision. There were no responses that contributed
further to the research.

Chapter 5: Testing the Refinements Page 111
2. Discussion of Results
The results gained from experimentation on the prototypes was fairly conclusive in
identifying features and cartographic portrayal which work both with normal and
NVG vision. Table 5-2 displays results from both the first part and the second part
of the experiment. Prototypes were rated from best to worst70 according to the
participants ability to read critical information features. If prototypes were rated
evenly by participants they were given the same rating for example both P1 and P4
were rated evenly as the best on which to read contours with NVG.
Prototypes Features P1 P2 P3 P4
Contours 1 2 3 4 Watercourse 4 1 1 3 Normal
Vision Vegetation 3 4 1 2
Contours 1 3 4 1 Watercourse 4 2 1 2 NVG
Vision Vegetation 3 4 1 2
Table 5.2 Rating of Critical Features on Prototypes
From Table 5-2 each critical feature, for each prototype and type of vision can be
added to show the best means of portraying the critical features. Table 5-3 shows the
best cartographic portrayal for critical features in bold.
Prototypes Features P1 P2 P3 P4
Contours 1 + 1 2 2 + 3 5 3 + 4 7 4 + 1 5 Watercourse 4 + 4 8 1 + 2 3 1 + 1 2 3 + 2 5
Normal Vision +
NVG Vision Vegetation 3 + 3 6 4 + 4 8 1 + 1 2 2 + 2 4
Table 3.3 Best Cartographic Portrayal for Both Types of Vision
70 The rating system was from 1-4 with 1 being the best and 4 the worst.
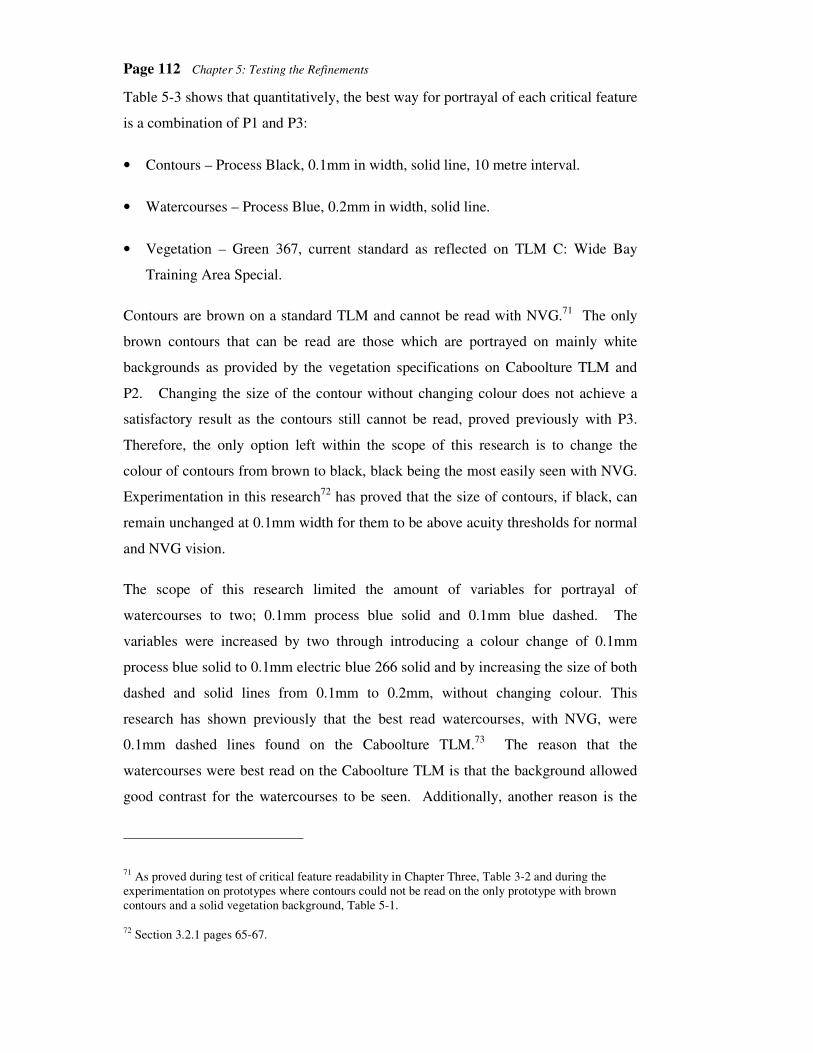
Page 112 Chapter 5: Testing the Refinements
Table 5-3 shows that quantitatively, the best way for portrayal of each critical feature
is a combination of P1 and P3:
• Contours – Process Black, 0.1mm in width, solid line, 10 metre interval.
• Watercourses – Process Blue, 0.2mm in width, solid line.
• Vegetation – Green 367, current standard as reflected on TLM C: Wide Bay
Training Area Special.
Contours are brown on a standard TLM and cannot be read with NVG.71 The only
brown contours that can be read are those which are portrayed on mainly white
backgrounds as provided by the vegetation specifications on Caboolture TLM and
P2. Changing the size of the contour without changing colour does not achieve a
satisfactory result as the contours still cannot be read, proved previously with P3.
Therefore, the only option left within the scope of this research is to change the
colour of contours from brown to black, black being the most easily seen with NVG.
Experimentation in this research72 has proved that the size of contours, if black, can
remain unchanged at 0.1mm width for them to be above acuity thresholds for normal
and NVG vision.
The scope of this research limited the amount of variables for portrayal of
watercourses to two; 0.1mm process blue solid and 0.1mm blue dashed. The
variables were increased by two through introducing a colour change of 0.1mm
process blue solid to 0.1mm electric blue 266 solid and by increasing the size of both
dashed and solid lines from 0.1mm to 0.2mm, without changing colour. This
research has shown previously that the best read watercourses, with NVG, were
0.1mm dashed lines found on the Caboolture TLM.73 The reason that the
watercourses were best read on the Caboolture TLM is that the background allowed
good contrast for the watercourses to be seen. Additionally, another reason is the
71 As proved during test of critical feature readability in Chapter Three, Table 3-2 and during the experimentation on prototypes where contours could not be read on the only prototype with brown contours and a solid vegetation background, Table 5-1.
72 Section 3.2.1 pages 65-67.

Chapter 5: Testing the Refinements Page 113
dashed lines of the watercourses were not easily confused with continuous contour
lines. During testing of the prototypes, the best watercourse portrayal, with normal
vision, was on P2 and P3. The reason for this is that the background allowed for
good contrast and definition of the watercourses. With NVG, the best prototype for
reading watercourses was P3, which was not expected. It was expected that either P2
or P4 would have the best watercourse specifications, due to their background
contrast and symbol size respectively. On P3, the lack of visible contours allows
watercourses to be easily identified. As no contours can be read there is no confusion
between watercourses and contours. This gives P3 the highest rating for
watercourses with NVG. The effect of introducing contours that can be seen with
NVG will probably reduce the overall definition of watercourses as portrayed on P3.
This loss of definition will have to be accepted, as the best vegetation portrayal is
used on P3, P4 and Wide Bay Training Area Special, which is the current standard as
used by the Australian Army.
During the research, there have been only three types of vegetation portrayal
specifications used. These were as applied on Caboolture, Mt Tamborine and Wide
Bay Training Area Special TLMs. The specification that provides the greatest
contrast and definition for reading contours and watercourses with normal and NVG
vision is that used on Caboolture.74 Though this specification provides the best
contrast, it is the worst specification for differentiating between vegetation classes, as
there are no definitive boundaries between classes, and clutters the map with point
symbology.75 Overall, as rated in experiments within this research and during
prototype testing, the vegetation specifications that allows for both vegetation
differentiation and discrimination of watercourses and contours was the current
vegetation specification as shown on P3, P4, and Wide Bay Training Area Special
TLM.
73 Table 3-2 page 63.
74 If the average of all vegetation readability tests undertaken within this research are compared the vegetation specification used on Caboolture provides the best background for contrast and readability of contours and watercourses, even though P3 (with Wide Bay Training Area Special specifications) was rated the best to read watercourses on during prototype testing.
75 As stated by participants during prototype testing.

Page 114 Chapter 5: Testing the Refinements
3. Final Product
A final product was made with the best specifications as defined during the prototype
testing to test the outcome of the prototype experimentation and to achieve the aim of
this research. The product, based on Mt Tamborine, is at Appendix L and has the
following specifications:
• Contours – Process Black, 0.1mm in width, solid line, 10 metre interval.
• Watercourses – Process Blue, 0.2mm in width, solid line.
• Vegetation – Green 367, current specifications as reflected on P3, P4 and Wide
Bay Training Area Special TLM.
• All other features remain unchanged.
The final product contains the best specifications as discovered through the course of
this research. The product differs from the current standards and specifications used
to produce Australian Army TLMs, in the portrayal of contours and watercourses.
The scope of this research defined that changes to current TLMs should be limited to,
where possible, previous standards and specifications used to produce TLMs. As
discussed previously the rigid adherence to previous or current specifications would
preclude this research from achieving its aim. The changes to watercourses and
contours, whilst not falling within previous or current specifications, have remained
as close as possible to established specifications in order to reduce the cognitive or
perception issues that may arise. The change of contours from Brown 152 to Process
Black has the greatest effect on the TLM as it changes the overall tone of the map
and makes it slightly more difficult to read other black features such as grid lines,
text and some cultural features. The change of watercourses from 0.1mm to 0.2mm
has little affect on the overall TLM and looks very similar to the current specification
for portraying watercourses.
Chapter 5: Testing the Refinements Page 115
4. Summary
The prototype experiment aim, to test if changes to the TLM through use of colour,
size and symbology allowed the critical information features to be read, was
achieved. The prototypes were rated against each other to determine if a single
prototype or a combination of features on different prototypes would be acceptable.
The best result was a combination of features from P1 and P3.
The best method of portrayal for the critical information features was determined to
be:
• Contours - change colour to black but no change to size.
• Watercourses – no change to colour but change size to 0.02mm.
• Vegetation – no change to current specifications.
A final TLM using current specifications but applying these three changes was
produced and is contained at Appendix L.

Page 116
Chapter 6
Conclusions and Recommendations

Page 117
Chapter 6. Conclusions and Recommendations
1. Summary
The aim of this research was to refine Australian Army TLM standards and
specifications, to produce a TLM that can be read and used effectively with both
normal vision and NVG. This aim has been achieved through the undertaking of
surveys, conduct of experiments and through investigation and application of
cartographic theory and technique. The final product (Appendix L) shows the
refinements this research recommends should be applied to the Australian Army
TLM standards and specifications.
The secondary aims of this research, as defined in Chapter 1, were achieved through:
• Identification of problems associated with using Australian Army NVG. The
surveys undertaken of experienced NVG users identified problems with the
Australian Army NVG such as weight and alignment, focus, resolution and the
major problem of not being able to read TLMs effectively.
• Identification of cartographic theory and design techniques, which are
applicable to NVG use. Cartographic theories and design techniques, which
have the greatest influence on NVG maps, were identified during this study as
symbology, size and contrast. Contrast is the most important factor and is
influenced by symbology, size and colour. The achromatic nature of NVG lends
itself to theories and techniques used for production of single colour maps and
maps that are designed for people with colour deficiencies.
• Identification of TLM information and features which are critical to the
successful conduct of military operations. The survey of TLM information
priority identified that there are three main features depicted on a TLM that are
critical to operations. These features are contours, watercourses and vegetation.
• Identification of future research areas on NVG and TLM relationships. This
study has identified future areas for research, listed in the next sub-chapter.

Page 118 Chapter 6: Conclusions and Recommendations
The only variation within the scope was with the development of new portrayal
specifications for contours and watercourses. The prohibitive nature of the standards
and specifications for portrayal of contours required the modification of the existing
standards. Although contour colour was changed from brown to black, the
symbology and size remained unchanged. The change to black maintained
efficiency as black is already used during the production of TLMs. The change of
contours to black has the greatest effect of any refinements on the TLM. Black
contours give the map a different feel and have altered the balance slightly. The
black also makes it difficult to read some text, grid lines and cultural features. This
difficulty should be accepted as the overall usability and effectiveness of the TLM
has increased. The change of size in watercourses from 0.1mm to 0.2mm was
needed, as the amount of variables for portrayal was limited. Watercourses retain
their colour and symbology, and therefore have little impact on the balance, figure /
ground relationship and cognitive aspects of the TLM. The changes to both contours
and watercourses were still within the scope.

Chapter 6: Conclusions and Recommendations Page 119
The importance of the research, defined in Section 1.2.3, has been substantiated:
• To solve a problem, identified within the Australian Army. The final product at
Appendix L provides one solution to the problem of reading TLMs with normal
and NVG vision.
• To improve efficiency of military operations and reduce reliance on other, more
cumbersome or tactically inefficient, methods for reading TLMs at night. This
research has proved it is feasible to produce a TLM that can be read with passive
NVG alone. This will allow soldiers to stop using filtered torches on the
battlefield to read maps, saving time and effort. It also reduces the risk of system
failure or operator error by reducing the amount of systems in use.
• To improve the survivability chances of a soldier on the battlefield. If a soldier is
able to accurately read a TLM with NVG, they will be able to make better
decisions and reduce risk. The ability to read TLMs with NVG only is now
achievable. Soldiers can quickly read maps and make quicker decisions, thereby
according them an advantage through time and knowledge.
• No studies have been previously undertaken on the direct relationship between
NVG and TLMs. This research will identify areas for future research and
improvement of NVG and TLM relationships. This study has identified future
areas for research and these are listed later in this chapter.
• The findings of this research may be applied to any NVG and TLM relationship
regardless of individual characteristics of either the NVG system or TLM
standards and specifications. This research has identified that value contrast is
the single most important aspect when designing maps for use with NVG. The
monochromatic environment of NVG allows only for difference in contrast, as
defined by tones, to be interpreted by the human eye. When designing maps for
use with both normal and NVG vision, balance between the two environments
must be accounted for. Whilst there is an easily defined set of good contrast
colours, these colours do not easily lend themselves to good balance and
figure/ground relationships in cartography and have totally different
characteristics when viewed with NVG.

Page 120 Chapter 6: Conclusions and Recommendations
2. Conclusions
This research has resulted in findings and conclusions that affect the use of NVG, use
of TLMs and the interaction between the two systems. The following conclusions
are drawn from the research:
• NVG is an integral operating system of the soldier. Whilst it is currently used to
increase effectiveness during night operations, it is not used to read maps and
TLMs. This is a result of information, on a TLM, being unreadable with NVG.
• Information that is unreadable on a current TLM, when using NVG, is contours,
watercourses and vegetation.
• TLM information that is critical to tactical level military operations is contours,
watercourses, vegetation and grid/marginal information.
• Value contrast is the greatest factor why cartographic features can be read on a
TLM with NVG.
• The development of maps for use under chromatic and achromatic conditions is
difficult and constrained by the few design qualities that affect both chromatic
and achromatic processes, such as value contrast, symbology and size.
• The greatest limitations on production of TLMs are the standards and
specifications to which they must abide. The standards and specifications limit
the TLM greater than the compilation or printing methods.

Chapter 6: Conclusions and Recommendations Page 121
3. Recommendations for Further Research
This research recommends the following areas for future research with respect to
cartography and NVG:
• The undertaking of colour research to identify colours outside the Australian
Army TLM standards and specifications that can be read with both normal and
NVG vision. A potential direction may be to take the Pantone Colours and
equate them to Munsell or CIE colour solids. The colours could then be
mathematically separated to determine best contrast and tested to achieve best
cartographic portrayal of TLM features.
• A comprehensive investigation of cartographic features that are critical to
military operations. This research identified TLM critical, important, not
important and irrelevant information for the successful conduct of military
operations. The results in this study were gained from only the tactical level of
military operations and only from select corps. A more encompassing scoping to
identify critical information at the tactical, operational and strategic levels and in
the context of different operational scenarios would assist map production and
focus limited map making resources accurately.
• This research be extended into how its findings can be applied to rapid mapping
techniques and the development of general standards and specifications for
production of rapid mapping products for use at night with NVG.
• An investigation be conducted into paint and use of reflective additives to make a
map easier to read during night conditions. Paints that can reflect light towards
the infrared end of the light spectrum may be easily read with NVG.

Page 122
Bibliography
American, British, Canadian, Australian Armies (1993). Terrain Analysis - QSTAG 1038. Washington, ABCA Program.
Australian Army (1960). Manual of Map Specifications Large and Medium Scale Series, Royal Australian Survey Corps.
Australian Army (1999). Training Information Bulletin 79 - Project NINOX - Night Fighting Equipment.
Australian Army (2000). User Handbook - Individual Night Fighting Equipment. Puckapunyal, Combined Arms Doctrine and Development Section, Army Combat Arms Training Centre.
Australian Army (2002). www.army.gov.au. 2002.
Australian Defence Force Academy (1988). Geographic Information in the Defence of Australia. Geographic Information in the Defence of Australia, Canberra.
Bateman, M. and R. Riley (1987). The Geography of Defence. Kent, Croom Helm Ltd.
Bertin, J. (1983). The Semiology of Graphics. Wisconsin, University of Wisconsin Press.
Conolly, N. (2001). "GIS in Defence." GIS User 45: 19-21.
Coulthard-Clark, C. (2000). Australia's Military Map Makers. Melbourne, Oxford University Press.
Crowley, J. (1991). Human factors of night vision devices: Anecdotes from the field concerning visual illusions and other effects. Fort Rucker, AL, US Army Aeromedical Research Laboratory.
DeLucia, P. (1999). "Critique of "distance estimation with night vision goggles: A little feedback goes a long way"." Human Factors 41(3): 507-10.
Dent, B. (1996). Cartography Thematic Map Design. Sydney, Wm. C. Brown Publishers.
Essock, E., M. Sinai, McCarley, Krebs and DeFord (1999). "Perceptual ability with real-world nighttime scenes: Image-intensified, infrared and fused colour imagery." Human Factors 41(3): 438-52.
Gamma Scientific (1999). Measuring Spectral Performance of Night Vision Devices. San Diego, Gamma Scientific.

Bibliography Page 123
Green, D. and S. Horbach (1998). "Colour-Difficult to Both Choose and Use in Practice." The Cartographic Journal 35(2): 169-80.
International Commission on Illumination (CIE) (1992). Contrast and Visibility. Vienna, Central Bureau of the CIE.
International Lasers Technology Ltd (2002). www.itlasers.com. 2002.
Keats, J. (1989). Cartographic Design and production. New York, Longman Scientific & Technical.
Kotulak, J. and Rash C (1992). Visual Acuity with Second and Third Generation Night Vision Goggles Obtained from a New Method of Night Sky Simulation Across a Wide Range of Target. Fort Rucker, Alabama, United States Army Aeromedical Research Laboratory.
Metzger, T. (1992). "Terrain Analysis for Desert Storm." Engineer 22
Niall, K. (1999). "The art of descrying distance." Human Factors 41(3): 511-3.
Niall, K., J. Reising, Martin (1999). "Distance estimation with night vision goggles: A little feedback goes a long way." Human Factors 41(3): 495-506.
Rabin, J. (1994). Optical Defocus: Differential Effects on Size and Contrast Letter Recognition Thresholds. Fort Rucker, Alabama, United States Army Aeromedical Research Laboratory.
Rabin, J. (1994). Vernier Acuity Through Night Vision Goggles. Fort Rucker, Alabama, United States Army Aeromedical Research Laboratory.
Rabin, J. (1996). Image Contrast and Visual Acuity Through Night Vision Goggles. Fort Rucker, Alabama, United States Army Aeromedical Research Laboratory.
Robinson, A., J. Morrison, Muehrcke, Kimerling and Cuptil (1995). Elements of Cartography. New York, John Wiley & Sons, INC.
Rowe, J. (1987). Vietnam, The Australian Experience. Sydney, Time-Life Books.
Royal Australian Survey Corps (1984). Symbolization - All Series (SYMBAS) Ed 2, Royal Australian Survey Corps.
Unknown (2002). Janes Electro-Optical Devices, Janes.
Wells, M. and M. Venturio (1990). "Performance and head movements using a helmet mounted display with different sized fields of view." Optical Engineering 29: 870-7.
Wiley, R. (1989). Visual Acuity and Stereopsis with Night Vision Goggles. Fort Rucker, Alabama, United States Army Aeromedical Research Laboratory.

Page 124 Bibliography
Zalevski, A., J. Meehan and Hughes (2001). Size Estimation with Night Vision Goggles. Melbourne, Defence Science and Technology Organisation.

Page 125
Appendix A: Caboolture 1971

Page 126
Appendix B: Mount Tamborine 1988

Page 127
Appendix C: Wide Bay Training Area Special 1999.

Page 128 Appendix D
Appendix D: Survey - Operating with NVG
1. What are some of the effects / limitations of using NVG
2. What are some of the effects / limitations of wearing NVG?
3. What are some of the extra considerations taken into account when planning and
conducting night missions?

Appendix D Page 129
4. How are maps currently read at night? Is this effective or does it place
limitations on successfully conducting missions?
5. How is planning conducted for night missions; under white light, other light or
NVG? What percentage for each?
White Light percentage____________
Other Light type_________________percentage_____________
NVG percentage____________
6. What changes, if any, are made to Standard Operating Procedures (SOPs) to read
maps and navigate successfully at night?

Page 130 Appendix D
7. How are the limitations of NVG compensated for when conducting missions?
Reading Maps 8. Are colours able to be distinguished when using NVG?
YES NO 9. If Yes what colours can be distinguished? 10. Do dark or light tones stand out best with NVG? Dark Light 11. What information on a map is most critical for successful conduct of missions?

Appendix D Page 131
12. Indicate how easy it is to read the following information on a map with NVG contours 1 2 3 4 5 6 7 8 9 10 easy can’t read text 1 2 3 4 5 6 7 8 9 10 easy can’t read grid references 1 2 3 4 5 6 7 8 9 10 easy can’t read roads 1 2 3 4 5 6 7 8 9 10 easy can’t read creeks/streams/rivers 1 2 3 4 5 6 7 8 9 10 easy can’t read vegetation types 1 2 3 4 5 6 7 8 9 10 easy can’t read point features such as buildings/spot heights/dams etc 1 2 3 4 5 6 7 8 9 10 easy can’t read line features such as powerlines and fences 1 2 3 4 5 6 7 8 9 10 easy can’t read

Page 132 Appendix D
13. What information is unreadable on a standard 1:50 000 map with NVG? 14. What information stands out best on a map with NVG? 15. How is information added onto maps during night missions (e.g. other locations,
points of interest, etc)?

Appendix D Page 133
Navigation with NVG 16. Approximately how far can be seen with NVG under good light conditions?
25m 50m 75m 100m 125m 150m 175m 200m 250m 275m 300m 325m 350m 375m 400m 425m 450m 475m 500m 525m 550m 575m 600m more_____________
17. What effects does the reduced Field of View (FOV) have on reading maps? 18. What limitations does the reduced FOV place on the ability to navigate
effectively? 19. Are there any other issues I have not covered that are applicable to NVG map
reading and navigation?

Page 134
Appendix E: Survey Questions for Pl Comd/Pl Sgt/ Sect Comd/Sect 2IC
1. How often is NVG training conducted?
2. How many NVG goggles are in use in a section during night missions?
3. How often is training conducted on navigation / map reading skills?
4. What specific training is conducted on night navigation with NVG?

Appendix E Page 135
5. Approximately what percentage of training sessions are conducted at night?
6. Do you ever conduct night mission training without NVG? If Yes –Why?
YES NO
7. Do you mark maps in any special way (colours/lines/highlighting/etc) for use
during night missions? If Yes – how?
YES NO

Page 136 Appendix E
8. Have you ever conducted night missions during operations? If yes were there
any major differences from your training missions?
YES NO
9. Do you ever use the NVG Extended Range (ER) for navigation? If yes what are
some of the problems associated with its use?
YES NO
10. Do you ever use the NVG ER with compass attached for navigation? If yes what
are some of its limitations?
YES NO

Appendix E Page 137
11. Are you aware when using the NVG ER with compass of the possible errors in
magnetic reading? If so what are they?
YES NO
12. Do you use any other equipment to help you read maps / navigate at night?
13. How do you incorporate NVG, maps and GPS to navigate at night?
14. Are there any other issues or problems not previously mentioned with NVG,
maps and navigation?

Page 138
Appendix F: Map Information Priority
The following notes are relevant to the survey:
Mark your response simply by placing a tick in the box that best reflects your
opinion.
You can refer to a standard 1:50 000 map as much as you like.
All symbols are grouped in like categories in alphabetical order. Please add any
other symbols/information that have been missed or you require.
Definitions of each criteria:
• Critical. You cannot complete your mission if this information is not available.
• Important. You may complete your mission with limitations or difficulties if
this information is not available.
• Not Important. Inclusion of this information is not required to complete your
mission.
• Irrelevant. You have never needed this information to complete your mission.
If you have any questions or don’t understand please ask.
All symbology used comes from Australian Army SYMBAS Edition 2

Appendix F Page 139
Cultural
Description Critical Important Not Important Irrelevant
Causeway Culvert Cutting Divided Highway Embankment Foot bridge Foot track Gate National route marker Metropolitan route marker Road bridge Stock grid Sealed road two or more lanes Unsealed road two or more lanes Unsealed road one lane Underpass Vehicle track Light railway Multiple track railway Railway bridge Railway tunnel Railway underpass Single track railway Siding Station Administrative boundary Built Up Area (BUA) Building Church Drive in theatre Fence Mine Power transmission line Quarry/Pit Recreation reserve Ruin Windpump Yard

Page 140 Appendix F
Hydrography
Description Critical Important Not Important Irrelevant
Beach Coastline Exposed wreck Harbour Intertidal flat Intertidal ledge or reef Navigation Light Pier/Wharf/Jetty/Quay Rock bare or awash Saline coastal flat Submerged reef Submerged rock Submerged wreck Aqueduct Area subject to inundation Channel Dam Ford Intermittent lake Intermittent watercourse Mainly dry lake Mainly dry watercourse Perennial lake Perennial watercourse Swamp Tank or small dam Watercourse with flood limits Waterhole

Appendix F Page 141
Hypsography/Physiography
Description Critical Important Not Important Irrelevant
Contour line Escarpment Depression contour Distorted surface High cliff Horizontal control point Index contour Levee Sand Sand ridge Spot elevation Supplementary contour
Vegetation
Description Critical Important Not Important Irrelevant
Dense Line of trees/windbreak Mangrove swamp Medium Orchard/vineyard Pine Rain forest Scattered

Page 142 Appendix F
Marginal Information / Map Information
Description Critical Important Not
Important Irrelevant
Index to adjoining maps Grid lines Grid numbers outside map Grid numbers inside map Latitude / Longitude Magnetic variance Map name Mean rainfall Mean Temperature Production Information Scale Bar Watercourse guide

Page 143
Appendix G: Prototype 1

Page 144
Appendix H: Prototype 2

Page 145
Appendix I: Prototype 3

Page 146
Appendix J: Prototype 4

Page 147
Appendix K: TLM Prototype Experiment
Experimentation Details:
• This experiment is broken into two parts: normal vision and NVG vision. The
first set of questions are to be answered when viewing each of the TLMs in
normal daylight conditions with normal vision (optical glasses are OK). The
second set of questions is to be answered when viewing the Prototype TLMs with
passive NVG.
• Each TLM is numbered P1, P2, P3 and P4, which directly relates to their
Prototype specifications.
• Do not use the IR light on the NVG to read the TLMs.
• Any questions please ask.

Page 148 Appendix K
Part One – Normal Vision
1. Which map looks most similar to a standard TLM?
2. Which map looks the most different from a standard TLM?
3. Which TLM allows you to read contours the best?

Appendix K Page 149
4. Which TLM is the worst for reading contours?
5. On which TLM is it the easiest to read watercourses?
6. On which TLM is it the hardest to read watercourses?

Page 150 Appendix K
7. On which TLM is it the easiest to identify different vegetation types?
8. On which TLM is it the hardest to identify different vegetation types?
9. Describe how you feel about P1

Appendix K Page 151
10. Describe how you feel about P2
11. Describe how you feel about P3
12. Describe how you feel about P4

Page 152 Appendix K
13. Which TLM do you think will allow you to read the most amount of information
with NVG?
Part Two – NVG vision
14. Which TLM allows you to read contours the best?
15. Which TLM is the worst for reading contours?

Appendix K Page 153
16. On which TLM is it the easiest to read watercourses?
17. On which TLM is it the hardest to read watercourses?
18. On which TLM is it the easiest to identify different vegetation types?
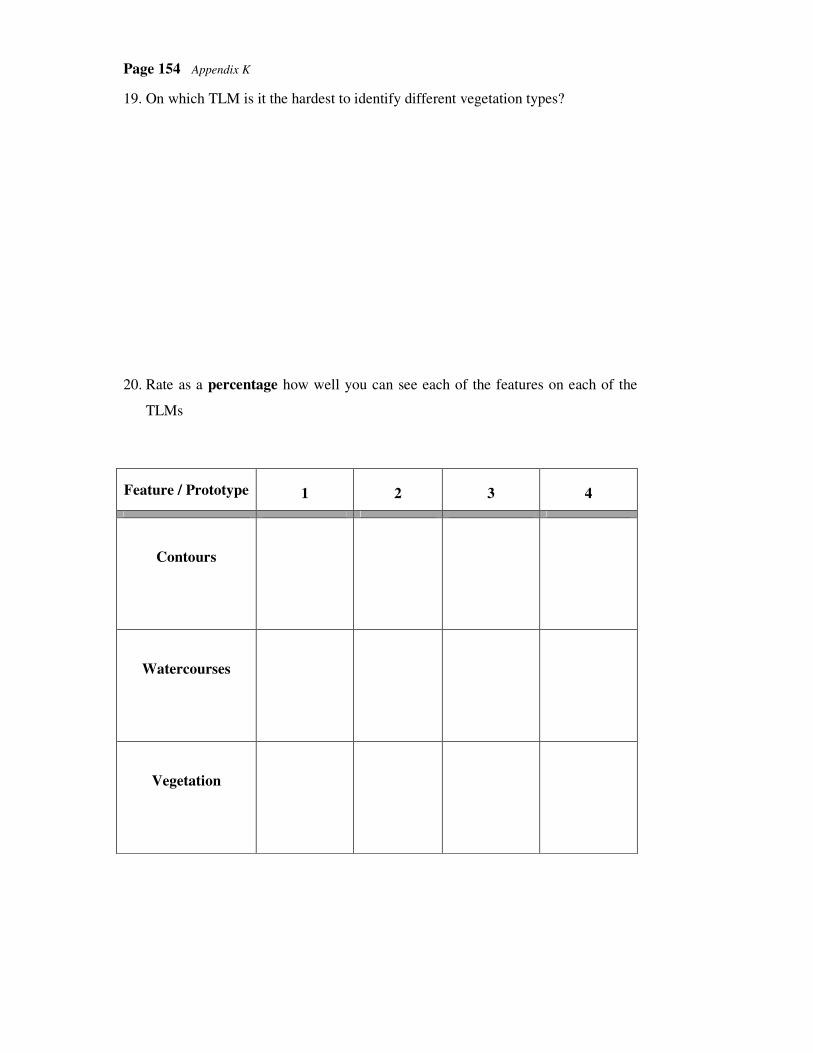
Page 154 Appendix K
19. On which TLM is it the hardest to identify different vegetation types?
20. Rate as a percentage how well you can see each of the features on each of the
TLMs
Feature / Prototype 1 2 3 4
Contours
Watercourses
Vegetation

Appendix K Page 155
21. Do you have any other comments about the TLMs as viewed with normal vision
or NVG?

Page 156
Appendix L: Final TLM, Mount Tamborine