Embed Size (px)
Citation preview
8/6/2019 Reforming Education Finance in Transition Countries
http://slidepdf.com/reader/full/reforming-education-finance-in-transition-countries 1/335
Juan Diego Alonso and
Alonso Sánchez, editors
A W O R L D B A N K S T U D Y
S I X C AS E S TU D I E S I N PE R C API TA
F I N A N C I N G S Y S T E M S
Reforming Education
Finance in TransitionCountries

8/6/2019 Reforming Education Finance in Transition Countries
http://slidepdf.com/reader/full/reforming-education-finance-in-transition-countries 2/335
8/6/2019 Reforming Education Finance in Transition Countries
http://slidepdf.com/reader/full/reforming-education-finance-in-transition-countries 3/335
W O R L D B A N K S T U D Y
Reforming Education Financein Transition Countries
Six Case Studies in PerCapita Financing Systems
Juan Diego Alonso and Alonso Sánchez, editors
8/6/2019 Reforming Education Finance in Transition Countries
http://slidepdf.com/reader/full/reforming-education-finance-in-transition-countries 4/335
Copyright © 2011The International Bank for Reconstruction and Development/The World Bank1818 H Street, NWWashington, DC 20433Telephone: 202-473-1000
Internet: www.worldbank.org
1 2 3 4 14 13 12 11
World Bank Studies are published to communicate the results of the Bank’s work to the developmentcommunity with the least possible delay. The manuscript of this paper therefore has not been prepared inaccordance with the procedures appropriate to formally-edited texts. This volume is a product of the staff of the International Bank for Reconstruction and Development / The World Bank. The findings, interpre-tations, and conclusions expressed in this volume do not necessarily reflect the views of the ExecutiveDirectors of The World Bank or the governments they represent.
The World Bank does not guarantee the accuracy of the data included in this work. The boundaries,colors, denominations, and other information shown on any map in this work do not imply any judge-ment on the part of The World Bank concerning the legal status of any territory or the endorsement or
acceptance of such boundaries.
Rights and PermissionsThe material in this publication is copyrighted. Copying and/or transmiing portions or all of this
work without permission may be a violation of applicable law. The International Bank for Reconstruc-tion and Development/The World Bank encourages dissemination of its work and will normally grantpermission to reproduce portions of the work promptly.
For permission to photocopy or reprint any part of this work, please send a request with completeinformation to the Copyright Clearance Center Inc., 222 Rosewood Drive, Danvers, MA 01923, USA;telephone: 978-750-8400; fax: 978-750-4470; Internet: www.copyright.com.
All other queries on rights and licenses, including subsidiary rights, should be addressed to the Of-fice of the Publisher, The World Bank, 1818 H Street NW, Washington, DC 20433, USA; fax: 202-522-2422;e-mail: [email protected].
ISBN: 978-0-8213-8783-2eISBN: 978-0-8213-8784-9DOI: 10.1596/978-0-8213-8783-2
Library of Congress Cataloging-in-Publication Data has been requested
Reforming education finance in transition countries : six case studies in per capita financing systems. p. cm. ISBN 978-0-8213-8783-2 -- ISBN 978-0-8213-8784-91. Education--Developing countries--Finance--Case studies. I. World Bank.LB2826.6.D44R44 2011 379.1724--dc23 2011020610
Cover photo: “Original graffi ti by SP£ND, anonymous street artist, Oxfordshire, United Kingdom,” byKate Mellersh.
8/6/2019 Reforming Education Finance in Transition Countries
http://slidepdf.com/reader/full/reforming-education-finance-in-transition-countries 5/335
iii
Contents
Foreword .....................................................................................................................................xi
Contributors ............................................................................................................................ xiii
Acronyms and Abbreviations ................................................................................................xv
Executive Summary .............................................................................................................. xvii
1. Reforming Education Financing Systems in Transition Countries: AnIntroduction to Six Case Studies ..................................................................................... 1
1.1. Introduction ................................................................................................................... 1
1.2. From Input-Based Financing to Per Capita Financing ............................................21.3. About This Book ........................................................................................................... 7
2. Per Capita Financing of General Education in Armenia .......................................... 10
2.1. Introduction ................................................................................................................. 10
2.2. Background ................................................................................................................. 11
2.3. The Design of the Funding Formula........................................................................ 13
2.4. The Implementation of the Funding Formula ........................................................15
2.5. Assessment of Outcomes ........................................................................................... 18
2.6. Conclusions ................................................................................................................. 283. Per Capita Financing of Education in Estonia ............................................................ 33
3.1. Introduction ................................................................................................................. 33
3.2. Background ................................................................................................................. 34
3.3. The Design of the Funding Formula........................................................................ 36
3.4. The Implementation of the Funding Formula ........................................................53
3.5. Assessment of Outcomes ........................................................................................... 60
3.6. Conclusions ................................................................................................................. 82
Annex A. Additional Statistics ......................................................................................... 87
Annex B. List of People Interviewed for the Country Case Study ............................. 98
4. School Vouchers in Georgia: Implementation of a Simple Idea in aComplex Environment................................................................................................... 101
4.1. Introduction ...............................................................................................................101
4.2. Background ...............................................................................................................102
4.3. The Design of the Funding Formula...................................................................... 110
4.4. The Implementation of the Funding Formula ......................................................115
4.5. Assessment of Outcomes ......................................................................................... 120
4.6. Conclusions ...............................................................................................................127
8/6/2019 Reforming Education Finance in Transition Countries
http://slidepdf.com/reader/full/reforming-education-finance-in-transition-countries 6/335
iv Contents
5. Student Basket Reform in Lithuania: Fine-Tuning Central and LocalFinancing of Education.................................................................................................. 133
5.1. Introduction ............................................................................................................... 133
5.2. Background ............................................................................................................... 135
5.3. The Design of the Funding Formula...................................................................... 141
5.4. The Implementation of the Funding Formula...................................................... 151
5.5. Assessment of Outcomes ......................................................................................... 170
5.6. Conclusions ............................................................................................................... 177
Annex A. Methodology of Student Basket .................................................................. 182
Annex B. Complete Table of Allocation Coeffi cients for Student Basket in 2007... 189
Annex C. List of People Interviewed for the Country Case Study .......................... 192
6. Per Capita Financing of General Education in Poland: A Case Study ................. 198
6.1. Introduction ............................................................................................................... 198
6.2. Background ............................................................................................................... 199
6.3. The Design of the Funding Formula...................................................................... 204
6.4. The Implementation of the Funding Formula...................................................... 212
6.5. Assessment of Outcomes ......................................................................................... 222
6.6. Conclusions ............................................................................................................... 238
Annex A. Additional Statistics on School Funding .................................................... 242
Annex B. List of People Interviewed for the Country Case Study ........................... 249
7. Per Capita Financing of General Education in Russia: An Assessment ofthe Financing Reform in the Chuvash Republic and the Tver Oblast .................. 252
7.1. Introduction ............................................................................................................... 252
7.2. Background ............................................................................................................... 253
7.3. The Design of the Funding Formula...................................................................... 255
7.4. The Implementation of the Funding Formula...................................................... 257
7.5. Assessment of Outcomes ......................................................................................... 264
7.6. Conclusions ............................................................................................................... 272
Annex A. Factors Influencing the Implementation of PCF in 72 Regions ............... 275
Annex B. List of People Interviewed for the Country Case Study ........................... 277
8. Per Capita Financing of General Education in Europe and Central Asia:Has It Delivered on Its Promise? An Overview of Six Country Case Studies ... 280
8.1. Introduction ............................................................................................................... 280
8.2. Diff erent Objectives of Per Capita Finance Reform in ECA—But in theContext of Decentralization .................................................................................... 280
8.3. Great Variation in Design, Structure, Coverage and Reach of FundingFormulae ................................................................................................................... 284
8.4. Assessing the Reform: What is the Evidence? ...................................................... 289
8.5. Main Lessons Learned ............................................................................................. 300
Annex A. Per Capita Financing Formulae: A Comparative Analysis ...................... 302
8/6/2019 Reforming Education Finance in Transition Countries
http://slidepdf.com/reader/full/reforming-education-finance-in-transition-countries 7/335
vContents
Boxes
Box 1.1. What is Decentralization? ...........................................................................................5
Box 3.1. The Funding of Private Schools in Estonia ............................................................. 42
Box 3.2. Per Student Funding: Effi ciency Eff ects on Private Schools in Estonia .............. 67
Box 3.3. A Look at the Eff ects of the Financing Reform on Quality: Equality ofOutcomes in Estonia .........................................................................................................79
Box 5.1 Teacher Qualifications and Salaries in Lithuania .................................................169
Box 6.1. Non-Public Schools in Poland: Federation of Educational Initiatives ..............229
Box 8.1. To Pilot or not to Pilot? Issues in Introducing the Per Student FinanceReform ...............................................................................................................................290
Figures
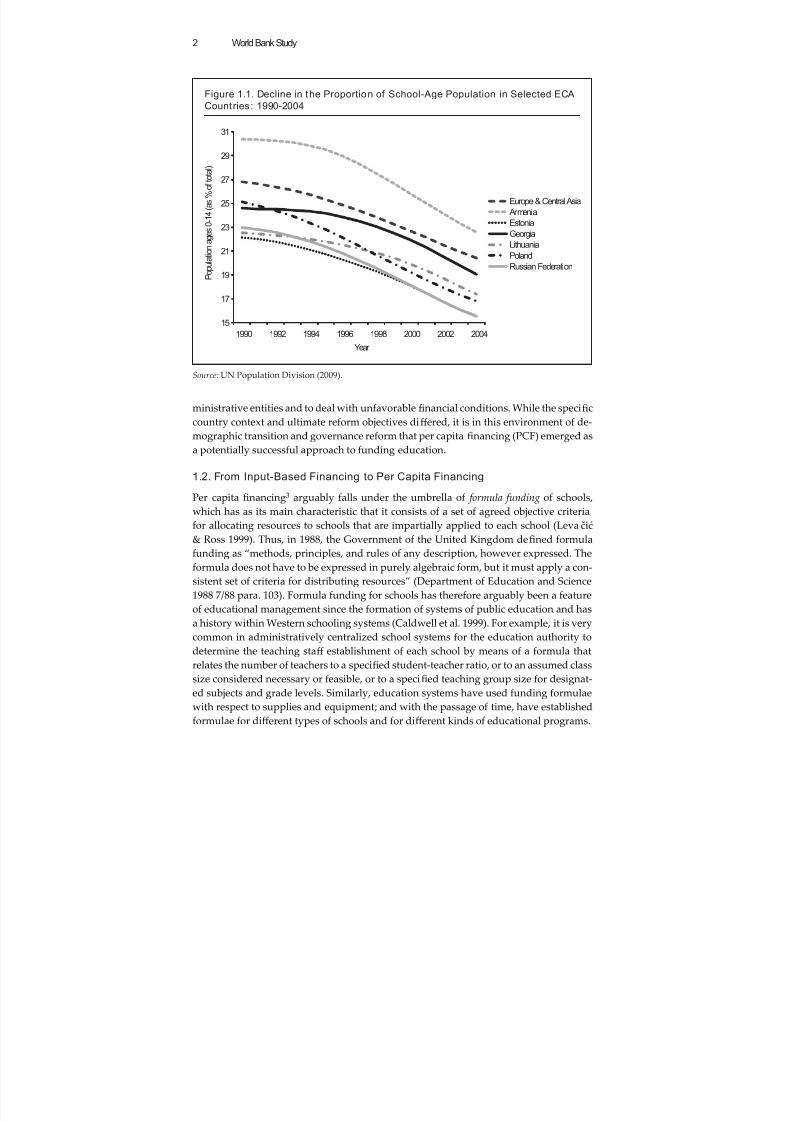
Figure 1.1. Decline in the Proportion of School-Age Population in Selected ECACountries: 1990-2004 ...........................................................................................................2
Figure 2.1. Per Student Expenditures by School: Historical Input-based (1999) vs.Formula-based (2000) Allocations ...................................................................................14
Figure 2.2. Formula-Based Per Student Unit Cost by School Size, 1999-2007 ..................17
Figure 2.3 Kotayk Region: Budgets vs. Actual Expenditures by School, 2006(consolidated picture) .......................................................................................................23
Figure 2.4 Kotayk Region: Budgets vs. Actual Expenditures by School, 2006(breakdown of key portions of picture) ......................................................................... 24
Figure 3.1. Number of Schools and Student Enrolments: 1980 to 2005............................. 35
Figure 3.2. Education Grant as a Proportion of Total Municipal EducationExpenditure, 2005 ..............................................................................................................53
Figure 3.3. Education Expenditure as a Proportion of Municipal TotalExpenditure, 2005 ..............................................................................................................54
Figure 3.4. Municipalities: Sources of Revenue, 2005 ..........................................................54
Figure 3.5. Municipal Tax Revenues Before and After Equalization Grant, 2008 ............55
Figure 3.6. Percentage Change in Students Enrolled in Grades 1 to 12, 2006Compared with 1992 .........................................................................................................61
Figure 3.7. New Formula (2008): How Per Student Allocation Varies with Number
of Students per Grade ....................................................................................................... 71Figure 3.8. Average Salaries Compared: Teacher vs. Other Workers, 2006 ......................72
Figure 3.9. Distribution of Municipal Tax Revenues Per Student, 2005 ............................74
Figure 5.1 Student Basket Allocation to Initial Schools as a Function of StudentNumbers ...........................................................................................................................163
Figure 5.2. Per Class Allocation for Grades 1 to 4 by Class Size ......................................166
Figure 5.3. Average Per Class Allocation by Class Size .....................................................166
Figure 5.4 Average Class Sizes and Actual Student Basket Allocation Per Student ......167
Figure 5.5. Average Class Sizes and Actual Per Class Student Basket Allocation .........168
Figure 6.1. Number of Schools by Type ............................................................................... 224Figure 6.2. Primary Schools in Poland by Size ...................................................................225
Figure 6.3. Student-Teacher Ratio (Full-Time Teachers) and Average Class Size ..........226
8/6/2019 Reforming Education Finance in Transition Countries
http://slidepdf.com/reader/full/reforming-education-finance-in-transition-countries 8/335
vi Contents
Figure 6.4. Distribution of Current Expenditure Per Student in Gminas in 2005 ...........232
Figure 6.5. Subvention for Education as a Proportion of Total Expenditure onEducation in 2005 ............................................................................................................232
Figure 6.6. Gminas’ Per Capita Income .................................................................................233
Figure 7.1. Chuvash Republic: Per Student Normatives—Urban vs. Rural Schools,2001-2007 (at nominal and 2001 prices) ........................................................................260
Figure 7.2. Cheboksary Municipality: Per Student Education Budget—RegionalSubvention and Municipal Budget (at 2004 prices) ....................................................260
Figure 7.3. Tver Oblast: Diversions from the Per Student Normatives, byMunicipality .....................................................................................................................262
Figure 7.4. Tver Oblast: School Budget Adjustment Coeffi cients Applied byMunicipalities................................................................................................................... 263
Figure 7.5. Cheboksary Municipality: Number of Students and Teachers—2001/02-2006/07 ................................................................................................................265
Figure 7.6. Cheboksary Town: Per Student Wages and Salaries bySchool—2004-2007 (at 2004 prices) ...............................................................................266
Figure 7.7. Vishny Volocheck Municipality: Per Student Unit Cost Relative to theNormatives by School, 2006-2007.................................................................................. 268
Figure 7.8. Zubtsov Municipality: Per Student Indicators by School—2004-2007(at 2004 prices) .................................................................................................................270
Tables
Table 2.1. Key Events in Education Financing Reforms in Armenia .................................15Table 2.2. PCF Participating and Non-Participating Schools and Protected Schools ......16
Table 2.3. Number of Protected Schools by Year and by Region .......................................16
Table 2.4. Per Student Unit Cost and Fixed Cost for the PCF formula, 1999-2007 inArmenian Dram (AMD) ...................................................................................................17
Table 2.5. Key Statistics of General Education Schools: 2001-2007 ....................................19
Table 2.6. Key Statistics of General Education Schools: 2001-2007: PCF, Protectedand Non-PCF Schools .......................................................................................................21
Table 2.7. Distribution of General Education Schools by Size, 2001 and 2006 .................22
Table 2.8 Indicative Average Monthly Salaries (incl. Benefits), in AMD........................... 26
Table 2.9. Indicative Average Monthly Salaries (incl. Benefits) for School Directorsand Deputy Directors, in AMD ....................................................................................... 27
Table 2.10. Indicative Average Monthly Salaries (incl. Benefits) for Teachers byCategories, in AMD ...........................................................................................................27
Table 3.1. Summary of Key Events in Estonian General Education: 1989 to 2008 ...........34
Table 3.2 General Education Grant: 2003 to 2007 .................................................................39
Table 3.3. Per Student Coeffi cients in the Funding Formula in 2007 .................................40
Table 3.4. Number of Students by Category, 2006 ...............................................................40
Table 3.5. Additional Factors in the Per Student Funding Formula ..................................41
Table 3.6. Grants for General Education to Municipalities by Type of Grant, 2007 ........42
Table 3.8. Minimum Number of Students Needed to Bring in Suffi cient Funds toPay for Teaching Costs ......................................................................................................46
8/6/2019 Reforming Education Finance in Transition Countries
http://slidepdf.com/reader/full/reforming-education-finance-in-transition-countries 9/335
viiContents
Table 3.7. Calculation of Per Student Funding Amount ......................................................46
Table 3.9. Additional Funding in Stages I to III for Small and Under-sized FullClasses .................................................................................................................................47
Table 3.10. Additional Funding for Grades 1 to 6 with Fewer than 7 Students ...............48
Table 3.12. Allocation for School Directors and Deputies ...................................................49
Table 3.11. Funding for Additional Lessons and for Enhanced Costs ...............................49
Table 3.13. Allocation of State Education Grant to Sub-categories of Grant, 2008 ..........51
Table 3.14. Case-Study Municipalities: Descriptive Statistics .............................................56
Table 3.15. Tallinn City: Formula for Determining the Part of the MunicipalBudget Allocation that Goes to Schools, 2007 ...............................................................58
Table 3.16. Tallinn City: Method of Allocating State Budget for Teaching .......................59
Table 3.17. Number of Schools, by Type: 1992-2006 ............................................................61
Table 3.18. Distribution of Public Schools by Size Categories: 1992 to 2006
(Percentage of Total) .........................................................................................................62
Table 3.19. Average Class Size in Estonian Public Schools: 2000-2004 ..............................62
Table 3.20. Student-Teacher Ratio in Estonian Public Schools: 1990-2006 ........................63
Table 3.21. Tallinn City: Distribution of Schools by Size (Percentage of Total),Selected Years .....................................................................................................................63
Table 3.22. Tallinn City: Classes and Students in the Two Gymnasium Schools, 2007 .....64
Table 3.23. Tallinn City: Distribution of General Education Expenditure byCategory, Selected Years ...................................................................................................68
Table 3.24. Municipalities’ Education Expenditure Per Student and Fiscal Burden
on Residents, 2005 .............................................................................................................75Table 3.25. Determinants of Education Expenditure Per Student, by Type of
Municipality, 2005 .............................................................................................................76
Table 3.26. Comparison of Per Student Expenditure in 7 Schools in 4Municipalities, 2007...........................................................................................................78
Table 3.27. Estonian National Test: 2006 Results (Average Student Marks) .....................79
Table 3.28. Constraints and Flexibilities in the Estonian School Funding System ..........83
Table A1. Calculation of State Grant for Funding a School in a Municipality withLess Than 1600 Students in Each Language Medium, according to the 2008formula ................................................................................................................................87
Table A2. Numbers of schools in Estonia, 1981 to 2006 .......................................................89
Table A3.1. Budget of Prangli Basic School (2007)................................................................90
Table A3.2. Budget of Viimsi Secondary School (2007) .......................................................91
Table A3.3. Budget of Juri Gymnasium School (2007) .........................................................92
Table A3.4. Budget of Mustvee Russian Gymnasium School (2007) .................................93
Table A3.5. Budget of Mustvee Estonian Gymnasium School (2007) ................................94
Table A3.6. Budgets of Tallinn’s Gymnasium Schools: School 21 and RussianGymnasium (2007) ............................................................................................................95
Table 4.1. Timeline of Key Events Related to the Education Finance Reform ................102
Table 4.2. Number of Schools, by School Size .................................................................... 106
Table 4.3. Number of Students, by School Size ................................................................... 106
Table 4.4. Change in the Average Size of Schools ...............................................................107
8/6/2019 Reforming Education Finance in Transition Countries
http://slidepdf.com/reader/full/reforming-education-finance-in-transition-countries 10/335
viii Contents
Table 4.5. Number of Teachers, by School Size .................................................................. 107
Table 4.6. Student-Teacher Ratio, by School Size ................................................................108
Table 4.7. Average Number of Teaching Hours per Week per Teacher, by School Size ................................................................................................................... 108
Table 4.8. FTE Teachers, by School Size ...............................................................................109
Table 4.9. Students per FTE Teacher, by School Size.......................................................... 109
Table 4.10. Administration Staff , by School Size ................................................................. 110
Table 4.11. Administration Staff per School, by School Size .............................................110
Table 4.12. Values of the Vouchers in Successive Years .....................................................112
Table 4.13. Values of the Vouchers in Successive Years as Percentage of CityVoucher .............................................................................................................................113
Table 4.14. Number of Schools in 2006, 2007, 2008, by Size Category and VoucherType ...................................................................................................................................113
Table 4.15. Number of Students and FTE teachers in 2006/07, by School Size andVoucher Type ...................................................................................................................114
Table 4.16. Number of Non-Teaching Staff in 2006/07, by School Size and VoucherType ...................................................................................................................................114
Table 4.17. Students per FTE Staff in 2006/07, by Size Category and Voucher Type ....115
Table 4.18. Minimum Number of Students per FTE Staff , by Voucher Type ................. 117
Table 4.19. Average Value of Student Voucher, by Size Category (in GEL) ...................117
Table 4.20. Minimum Required Expenditures and Their Coverage by Vouchers, by School Size ................................................................................................................... 118
Table 4.21. Required Funding above Voucher, by School Size .........................................119Table 4.22. Average Class Size, by School Size and Voucher’s School Location
Categories .........................................................................................................................121
Table 4.23. Average Per Class Allocation, by School Size and Voucher’s SchoolLocation Categories .........................................................................................................122
Table 5.1. Timeline of Key Events Related to the Education Finance Reform ................135
Table 5.2. Students by School Type: 2000 to 2005 ...............................................................136
Table 5.3. Schools by School Type: 2000 to 2005 .................................................................136
Table 5.4. Students by Instruction Language, Selected School Years ..............................137
Table 5.5. Founders by Type of School .................................................................................137Table 5.6. Students by Transportation Mode ......................................................................138
Table 5.7. Expenditures of Teaching Process and Teaching Environment ......................142
Table 5.8. Education as Part of Lithuanian Public Finances (million Lt).........................144
Table 5.9. Education as a Proportion of the GDP, Central, and Local Budgets..............144
Table 5.10. Structure of Education Spending in Lithuania ................................................145
Table 5.11. Revenues of Panevezis Budget, 2006 ................................................................145
Table 5.12. Expenditures of Panevezis Budget, 2006 ..........................................................145
Table 5.13. Structure of the Student Basket: 2002 to 2007 ..................................................146
Table 5.14. Simplified Structure of the Student Basket: 2002 to 2007 ..............................147Table 5.15. Yearly Rates of Growth of the Student Basket: 2002 to 2007 .........................147
Table 5.16. Major Components of the Student Basket: 2002 to 2007 ................................148
8/6/2019 Reforming Education Finance in Transition Countries
http://slidepdf.com/reader/full/reforming-education-finance-in-transition-countries 11/335
ixContents
Table 5.17. Size Categories of Schools and Normative Class Size ....................................148
Table 5.18. Initial Allocation Coeffi cient by Size Category and Grade Level .................149
Table 5.19 Corrected Allocation Coeffi cient, by Size Category and Grade Level ..........149
Table 5.20. Per Student Allocation to Municipalities 2003 to 2007 ...................................154
Table 5.21. Student Basket Grant and Expenditures on Teaching Process(Thousands Lt.) ................................................................................................................155
Table 5.22. Municipalities That Contribute Most to the Teaching Process above theStudent Basket Grant ......................................................................................................155
Table 5.23. Non-Salary Elements of the Teaching Process: 2003 to 2006 .........................156
Table 5.24. Expenditures on Non-Salary Items in Student Basket Expenditures:2003 to 2006 ......................................................................................................................157
Table 5.25. Incoming and Outgoing Students in Panevezis Municipalities.................... 157
Table 5.26. Reallocation of Student Basket Funds by Municipalities: 2003 to 2006 .......159
Table 5.27. Average School Sizes by School Type 2000 to 2005 ........................................161
Table 5.28. Allocation Thresholds for Initial Schools .........................................................163
Table 5.29. Allocation Thresholds for Basic Schools ..........................................................164
Table 5.30. Allocation Thresholds for Full Secondary Schools .........................................164
Table 5.31. Initial Per Class Allocation by Size Category and Grade Level ....................165
Table 5.32. Corrected Per Class Allocation by Size Category and Grade Level .............165
Table 5.33 Salary Coeffi cients of Lithuanian Teachers, 2002 and 2007 ............................169
Table 5.34 Distribution of Teachers by Career Level, 2002 and 2007 ...............................169
Table 5.35 Student-Teacher Ratios in Lithuanian General Education Schools 71 ............171
Table 5.36. Private Schools: 2000 to 2005 ..............................................................................177
Table 5.37. Value of Factors Used to Calculate the Basic Student Basket Amount ........182
Table 5.38. Teaching Student Basket Coeffi cient: 2002 to 2007 .........................................184
Table 5.39. Non-Teaching Student Basket Coeffi cient: 2002 to 2007 ................................184
Table 5.40. Complete Student Basket Coeffi cient: 2002 to 2007 ........................................185
Table 5.41. Stipulated Structure of the Student Basket: 2002 to 2007............................... 186
Table 5.42. Stipulated Structure of the Average Student Basket: 2002 to 2007 ...............187
Table 5.43. Offi cial Lithuanian Allocation for Teacher Professional Development:2002 to 2007 ......................................................................................................................187
Table 5.44. Adjusted Structure of the Average Student Basket: 2002 to 2007 .................188
Table 5.45. Coeffi cients for Allocation of Student Basket (From January 1, 2007) .........190
Table 6.1. Summary of Key Events in Polish General Education, 1989 to 2005 .............200
Table 6.2. Total Amount of Subvention for Education, 2000-2007 ...................................209
Table 6.3. Kwidzyn Gmina: Education Budget 2006 ...........................................................212
Table 6.4. Annual Per Student Funding of Each School in Kwidzyn (2007) ...................214
Table 6.5. Kwidzyn City Gmina: Number of Pupils, 1998 to 2006 ....................................215
Table 6.6. Kwidzyn City Gmina’s Schools: Teaching and Non-Teaching Posts ..............215
Table 6.7. Kwidzyn City Gmina: Students and Classes at Gimnazjum 2 ..........................216Table 6.8. Kwidzyn City Gmina: Budget for Gimnazjum 2 (2007) .....................................217
Table 6.9. Czosnów Gmina: Education Expenditure and Budget Revenue..................... 218
8/6/2019 Reforming Education Finance in Transition Countries
http://slidepdf.com/reader/full/reforming-education-finance-in-transition-countries 12/335
x Contents
Table 6.10. Czosnów Gmina: The Composition of Total Teachers’ Salaries (2006) ........219
Table 6.11. Czosnów Gmina: Total Actual Expenditures of Schools (2006) ....................220
Table 6.12. Czosnów Gmina: Student Rolls, 2001/2 to 2006/7 ............................................221
Table 6.13. Staffi ng Ratios at Czosnów Schools Compared to Kwidzyn Ones (2007) ...221
Table 6.14. Comparison of Per Student Expenditure in Czosnów and Kwidzyn(2007) .................................................................................................................................222
Table 6.15. Educational Expenditure per Student (Primary and Lower Secondary)in Gminas in 2005, in z ł ....................................................................................................231
Table 6.16. Factors Explaining Current General Education Expenditure PerStudent in Diff erent Type of Gminas............................................................................. 234
Table 6.17. Constraints and Flexibilities in the Polish School Funding System .............239
Table 6.18. Shares of the Education Subvention by School and Student Type in 2000 ...242
Table 6.19. Kwidzyn’s Subvention for 2007 Determined by the Formula ......................243
Table 6.20. Kwidzyn: Calculating Part A of the Voucher ..................................................245
Table 6.21. Czosnów’s Subvention for 2007 Determined by the Formula ......................247
Table 7.1. Key Events in Education Financing Reforms in Russia ...................................254
Table 7.2. Adjustment Coeffi cients by Level of Education ................................................257
Table 7.3. Adjustment Coeffi cients by Type of Class (Educational Program) ................257
Table 7.4. Chuvash Republic: Adjustment Coeffi cients, 2003 and 2007 ..........................259
Table 7.5. Tver Oblast: School Education Budget—Total for 43 Municipalities............. 262
Table 7.6. Tver Oblast: School Statistics—Total for 43 Municipalities .............................269
Table 8.1. Policy Objectives of Per Capita Financing in Case Study Countries.............. 281
Table 8.2. Details of Per Capita Financing Formulae: Main Features ..............................286
Table 8.3. Details of Per Capita Financing Formulae: Adjustment Factors .....................287
8/6/2019 Reforming Education Finance in Transition Countries
http://slidepdf.com/reader/full/reforming-education-finance-in-transition-countries 13/335
xi
Foreword
The year 2011 marks the twentieth anniversary of the independence of many coun-
tries in Eastern Europe and the former Soviet Union. The disintegration of the for-
mer Soviet Union and the former Yugoslavia alone brought about 20 new countries to
the map of Eastern Europe. All of a sudden, these new states were faced with a change
of paradigm for governing their territories. This was also a time when the transition
“recession” imposed severe constraints on public spending. The ensuing years also saw
significant demographic shifts that led to a sizeable reduction in the populations of these
countries. Many of the countries in the region lost, in about a decade, 40 percent of their
pre-independence population due to a combination of a reduction in the birth rates, an
increase in mortality rates, and high rates of emigration to other countries.The size and financing structure of the education system in these countries, tradi-
tionally the biggest employer within the public sector alongside health, quickly became
unsustainable, as these had been designed for a diff erent era and purpose. A declining
school-age population started emptying schools across the system, and authorities began
to realize that the generalized decrease in both average class size and school size needed
a concomitant reduction in spending. When measured in per capita terms, though, edu-
cational expenditure kept increasing. Moreover, higher spending per student did not
go hand in hand with improving the quality of education. Thus, reforming the way the
system was financed became evident, not only for sound public finances but also for
raising the quality of service delivery.This book is about how some countries transitioning from former communist type
of systems undertook financing reforms, and how such reforms moved the systems from
norms to capitation-based financing or per capita financing. Six country case studies are
the bulk of the book and are drawn from a study initiated by the World Bank in 2007.
The choice of countries (Armenia, Estonia, Georgia, Lithuania, Poland and the Russian
Federation) was motivated by the fact that the World Bank was actively involved in
supporting reforms in these countries and, in some cases, played a fundamental role in
bringing these reforms to fruition. Most of the background research and the chapters
were finalized by mid-2008 but, for diff erent reasons, could not be completed during
that year. Juan Diego Alonso and Alonso Sánchez now bring this to completion.This book brings about the personal experience of three experienced professionals
in the field, Rosalind Levačić , Jan Herczyński and Sachiko Kataoka, who have actively
worked with the countries they wrote about (two countries each), to help develop solid
per capita financing systems. Their chapters document the historical background that
preceded the reforms, the intricacies of the design of the formulas, and the challenges
of implementing these systems. The authors also assess whether these reforms have
improved effi ciency, equity and transparency and accountability of education systems.
Dina Abu-Ghaida summarizes the evidence in a final overview chapter that also details
the lessons learned.
8/6/2019 Reforming Education Finance in Transition Countries
http://slidepdf.com/reader/full/reforming-education-finance-in-transition-countries 14/335
xii Foreword
It is our hope that this book will be useful to both educational authorities and gen-
eral practitioners in the field of education finance. We hope that this book will contribute
to policy debates around significant structural reforms that can help free up fiscal space
to allow for higher investment in quality-enhancing inputs in education.
Mamta Murthi
Sector Director
Human Development Department
Europe and Central Asia Region
The World Bank
8/6/2019 Reforming Education Finance in Transition Countries
http://slidepdf.com/reader/full/reforming-education-finance-in-transition-countries 15/335
xiii
Contributors
Dina Abu-Ghaida is a Ph.D. economist who has worked at the World Bank since 2000.
Initially, she worked in the Africa region analyzing poverty in Niger before moving to
the education sector in 2002. During 2002-2005, she worked as an education economist
in both project as well as report teams (in particular poverty assessments), and co-led the
design and training for a Bank-wide toolkit on analyzing the education sector in public
expenditure reviews. In 2005-2008, she led education project and report teams in several
Central Asian countries, as well as the present regional study on education finance re-
form in transition countries. Since 2009, she has worked in the World Bank offi ce in West
Bank and Gaza as Program Manager.
Juan Diego Alonso is an Education Economist working at the World Bank. He currently
works for the Education Unit of the Human Development Department at the Europe and
Central Asia (ECA) Region and is part of the World Bank Education teams working on
Ukraine, Turkey, and Serbia. Juan Diego has been working at the Bank for 4 years and
has also participated in a handful of projects in Africa (Mozambique, Democratic Repub-
lic of the Congo, and the Republic of Guinea) as well as in studies of the eff ectiveness of
aid development. Juan Diego specializes in areas of educationfinance and holds a Ph.D.
in Economics and Education from Teachers College, Columbia University.
Sergo Durglishvili is the school principal of Public School #150 in Tbilisi, Georgia. Aprofessional mathematician and economist by education, he has been involved in edu-
cation finance since 1985 as a deputy principal and later as a school principal. Between
1977 and 1985, he worked as a senior scientist at the Moscow Institute of Economic Re-
search. In 2000, he joined the Georgian ‘Ilia Chavchavadze’ project funded by the Min-
istry of Education and Science of Georgia as a trainer. In the scope of this project, he
had professional relations with school administration and related educational institutes.
From 2006 on, he has worked as an invited trainer and expert on Management and Fi-
nancing in ‘The Center for Strategic Research and Development of Georgia’. He has also
contributed to the Open Society Georgia Foundation as a trainer and to the Open Society
Institute in Budapest as a researcher in education projects.
Jan Herczyński is an Adjunct Professor at the Interdisciplinary Center for Mathematical
and Computer Modeling at Warsaw University in Poland. A professional mathematician
by training, Jan has been working on educationfinance since 1998. In 1999 he supported
the Polish Ministry of National Education in introducing a new allocation formula for
education grant to Polish local governments. He has also been very closely involved in
the introduction of per student allocation formulas for primary and secondary education
in Macedonia in 2005. Since then he has worked in Albania, Bulgaria, Georgia, Kosovo,
Kyrgyzstan, Macedonia, Moldova, Lithuania, Poland, Romania, Serbia and Ukraine. Jan
has also worked as an international consultant for various USAID-funded project, forthe World Bank, and for the Open Society Institute in Budapest. He is the author of many
reports and country analyses focusing on education decentralization, education finance
8/6/2019 Reforming Education Finance in Transition Countries
http://slidepdf.com/reader/full/reforming-education-finance-in-transition-countries 16/335
xiv Contributors
and education management. In 2009, together with Tony Levitas and Miko ł aj Herbst he
published a first major monograph on education finance in Poland, Finansowanie oświaty
w Polsce (Financing of Education in Poland). At present he is the coordinator of the EU-
funded project Strengthening of Strategic Role of Polish Local Governments in Education on
Local and Regional Level , and he is the editor of the forthcoming guidebook for Polish localgovernments on communicating their management of education.
Sachiko Kataoka is an Education Economist at the World Bank. She specializes in edu-
cation finance, higher education, and early childhood development. Since joining the
Bank in 2006, she has primarily worked on Southeastern European, Caucus, and Central
Asian countries. She has worked with the governments of Armenia, Azerbaijan, Kosovo,
Romania, Tajikistan, and Uzbekistan for designing and implementing school financing
reforms, particularly formula-based financing. She holds a D.Phil. in Education from
the University of Sussex in the UK. She conducted her fieldwork on educational decen-
tralization in Sri Lanka for her thesis. Prior to joining the World Bank, she worked as an
Education Economist for the Asian Development Bank and the Japan Bank for Interna-
tional Cooperation, covering Indonesia, Malaysia, Sri Lanka and Nepal.
Rosalind Levačić is Emeritus Professor of Economics and Finance of Education at the
Institute of Education of the University of London. She has been teaching, research-
ing, and consulting in the field of school finance since the late 1980s when England in-
troduced decentralization of school funding and she advised several local authorities.
Ros has been working on school financing reforms in Eastern Europe and Central and
South Asia, in particular on funding formulae and budget management at school level
in Poland, Azerbaijan, Bulgaria, Romania, Serbia, and Kosovo, as a consultant to the
World Bank or to Ministries of Education. She is currently working as an international
consultant for the World Bank-funded Institutional Development for Education Project
in Kosovo and also for the Delivering Improved Local Services project in Serbia. She has
undertaken various studies for the International Institute of Educational Planning and
co-edited (with Kenneth Ross) their publication Needs based resourcing of education via
formula funding of schools (1999).
Alonso Sánchez , a Mexican national, is currently pursuing a doctoral degree at the Har-
vard Graduate School of Education in the Quantitative Policy Analysis Program, andhas interests in teacher quality, child development, and human capital. Before that he
worked for several years as a consultant for the World Bank in various departments on
both operational and research activities related mostly to the economics of education,
including rates of return to education, school-to-work transitions and youth unemploy-
ment, school investment projects, and teacher education reform. He also collaborated
with the Living Standards Measurement Study group. Alonso has two master’s de-
grees—in public aff airs and Latin American studies—from the University of Texas at
Austin. He aended college at Texas Christian University, where he met Annie Laurie
Sánchez, his wife. They currently live in Somerville, Massachuses.
8/6/2019 Reforming Education Finance in Transition Countries
http://slidepdf.com/reader/full/reforming-education-finance-in-transition-countries 17/335
xv
Acronyms and Abbreviations
AMD Armenian Dram
ECA Europe and Central Asia
EEK Estonian Kroons
EMIS Education Management Information System
EU European Union
FT Full-Time
FTE Full Time Equivalent
FY Fiscal Year
GEL Georgian Laris
GER Gross Enrollment RateGDP Gross Domestic Product
GSE General Secondary Education
ICT Information and Communication Technology
IT Information Technology
LG Local Governments
NA Not Applicable
NER Net Enrollment Rate
NCO Non-Commercial Organizations
NTS Non-Teaching Staff
OECD Organisation for Economic Co-operation and Development
PCF Per Capita Financing
PISA Program for International Student Assessment
PIU Project Implementation Unit
PR Public Relations
PRSP Poverty Reduction Strategy Paper
STR Student-Teacher Ratio
SY School Year
UK United Kingdom
UN United Nations
UNESCO United Nations Educational, Scientific and Cultural Organization
USAID United States Agency for International Development
USD U.S. Dollar
USSR Union of the Soviet Socialist Republics
VAT Value Added Tax
WB World Bank
WBI World Bank Institute
XS Extra-Small

8/6/2019 Reforming Education Finance in Transition Countries
http://slidepdf.com/reader/full/reforming-education-finance-in-transition-countries 18/335
8/6/2019 Reforming Education Finance in Transition Countries
http://slidepdf.com/reader/full/reforming-education-finance-in-transition-countries 19/335
xvii
Executive Summary
In the last 20 years two key issues with significant implications for financing education
in Europe and Central Asia (ECA) have been the major governance reforms follow-
ing the end of communist influence in the early 1990s and a significant demograph-
ic transition. From the early 1990s to the early 2000s, a decreasing fertility rate and a
considerable exodus in many of the region’s countries caused a gradual decline in the
population growth rate, which went from 0.64 percent annual growth in 1990 to 0.10 in
1995 to hovering around zero in the early 2000s. Consequently, schools in this period be-
came increasingly ineffi cient and unequal in their relative spending as the population of
school-age children diminished while the number of schools, classes, teachers and other
school inputs generally stayed the same. This situation created pressure on central gov-ernments to reduce such ineffi ciencies and spending imbalances among communities.
Following the end of the Soviet era, countries in the region have gradually reformed
their governance structures by decentralizing power and turning to a market-based
economy. This gradual but major reorganization has required, at diff erent stages, ac-
companying reforms of funding systems to successfully support newly empowered ad-
ministrative entities and to deal with unfavorable financial conditions. While the spe-
cific country context and ultimate reform objectives diff ered, it is in this environment of
demographic transition and governance reform that per capita financing emerged as a
potentially successful approach to funding education.
This book reviews the experience with one specific though widely introduced ap-proach to funding general education, namely per capita financing (PCF), in six countries
in the Europe and Central Asia (ECA) region in an eff ort to learn which outcomes were
achieved and how. Per capita financing is a type of formula funding of schools–funding
characterized by a set of agreed objective criteria for allocating resources to schools–that
provides schools fixed amounts of financing based on the numbers of students enrolled.
Five of the six case study countries—Armenia, Estonia, Lithuania, Poland and the Rus-
sian Federation—were chosen primarily since they represent ECA countries with rela-
tively long experience in implementing PCF schemes1. The hope is that, as a result, the
likelihood of observing the outcomes of per capita financing is higher. Since per capita
financing replaced a school budget allocation process (input-based or normative budget-ing) that was non-transparent and conducive to ineffi cient use and inequitable alloca-
tion of resources, the main expected outcomes of the per student finance reform were
improved effi ciency, equity, and transparency and accountability of public education
expenditures. Indeed, the case studies document a range of policy objectives of the per
student finance reform in the individual countries, with a specific focus on the three
types of outcomes just described.
Decentralization of responsibility for general education to either local governments
or directly to schools features prominently in the reforms implemented in tandem with,
or as precursors to, per student finance reform in the case study countries. These ECA
countries were aempting to come to grips with financing schools in the context of on-going decentralization reforms, and resorted to per capita financing of education as it
promised to deliver on the many objectives policymakers hoped to achieve. The degree
8/6/2019 Reforming Education Finance in Transition Countries
http://slidepdf.com/reader/full/reforming-education-finance-in-transition-countries 20/335
xviii Executive Summary
of decentralization and, by extension, the reach of the per student formula, varied. In
some countries, recently elected local governments were charged with providing educa-
tion services and the per student formula was used by the central government to allocate
funding to local government, which in turn chose the approach by which it determined
funding for individual schools. In other countries, the central government used the perstudent formula to determine the budget of individual schools, which it then either pro-
vided for all schools to the relevant local government or directly to the individual school.
The per student formulae encountered in the ECA country case studies show con-
siderable variation in their complexity and hence desire to accommodate the diff erent
cost structures of schools. In general, the per student funding formulae observed in the
case studies begin with an amount apportioned for each student enrolled and subse-
quently incorporate adjustment factors, either based on school or student characteris-
tics. Examples of school characteristics that feature in the diff erent formulae include
geographic location, e.g. mountainous, rural, urban, or island; school size; school type,
e.g. primary, basic, or boarding school; whether a minority school or one with migrant
students; and whether a school with multiple languages of instruction or integrated
teaching. Examples of student characteristics that feature in the country case study for-
mulae include the grade level; type of special needs, if any, e.g. students with learning
diffi culties, mental disorders, or sensory or physical disabilities; adult, evening, or dis-
tance learning student; and specialized student, e.g. sports, music, ballet, or art student.
The funding formulae in Armenia and Georgia include the lowest number of adjustment
factors based on school and student characteristics, whereas the formulae in Lithuania
and Poland contain the greatest number—a fact that is likely related to the diff erent ap-
proaches to decentralization in those countries, as described above.
The funding formulae vary in the degree to which they cover the school budget, i.e.
whether they include capital expenditures in addition to recurrent expenditures, and
which elements of the laer. Thus, the formulae in Armenia and Georgia cover all re-
current costs–but not capital expenditures. Indeed, the Estonian funding formula alone
includes a per student allocation for capital expenditures, though only as of 2005, having
previously covered only teacher salaries and textbooks. Despite the inclusion of capital
expenditures in the Estonian formula, not all recurrent costs are included, and munici-
palities are expected to pay for schools’ operational costs and non-teaching staff out of
own budgets. The situation is similar in Russia where municipalities are expected to
cover utilities, maintenance, and repairs out of their own resources. Lithuania, on theother hand, distinguishes between expenditures on the teaching process versus the teach-
ing environment , with only thefirst covered by the funding formula. The teaching process
includes salaries of teachers, administrators and professional staff , teacher in-service
training, textbooks, library books, and teaching aids, while the teaching environment
covers the salaries of technical staff (e.g. cleaners, drivers, gardeners and cooks), utilities
and communications (telephone and internet). Finally, Poland’s formula is exceptional
in that it does not stipulate what aspects of the school budget it is meant to cover, which
may be interpreted as the formula covering the entire school budget in theory, but in
practice municipalities supplement the formula allocation from their own resources.
Turning to an assessment of the results achieved by implementing per student fi-nance reforms, beginning with improvements in effi ciency of expenditures, it is impor-
tant to describe the measures of effi ciency in question. A broad definition of effi cient
8/6/2019 Reforming Education Finance in Transition Countries
http://slidepdf.com/reader/full/reforming-education-finance-in-transition-countries 21/335
xixExecutive Summary
spending is that it obtains the maximum social value of output from a given quantity of
resources. More specific to education, an education system that enrolls a student at low-
er unit cost than another education system is, other things equal, more effi cient2. Argu-
ably, however, even this second definition remains too abstract and does not reflect the
concrete priorities identified by ECA countries undertaking education finance reform.Instead, ECA policymakers found themselves burdened, at a time of fiscal constraint,
with large school networks that included many small schools, small class sizes and low
student-teacher ratios, and a financing system that provided no incentives for actors at
the school level to save (whether in general or on certain schooling inputs versus others).
Thus, it is changes in the above aributes of the general education system, in particular
the size of the school network and the student-teacher ratio, that will serve as proxies for
an assessment of improved effi ciency of education spending as a result of implementa-
tion of per capita financing.
Regarding the rationalization of school networks, the country case studies demon-
strate that closure of under-enrolled schools is by no means an automatic corollary of
puing in place per capita financing and that local governments play a key role. The
underlying logic is that per capita financing imposes effi ciency measures on jurisdic-
tions with under-enrolled schools, and falling enrollment causes further drops in school
funding. Consequently, the need of local governments to find the most effi cient means
of providing education within the overall spending envelope available will result in clo-
sure of schools they can no longer aff ord.
■
The case of Poland comes perhaps closest to this scenario: the initial 1994 design
of the per student formula guaranteed individual local governments at least
100 percent of their inflation-adjusted allocation in the previous year, so thatin those local governments where student numbers fell, allocation per student
increased and effi ciency gains were not realized. However, an important reform
of the per student formula took place in 2000, which only guaranteed that the
per student allocation could not be cut below or increased above certain levels.
This meant that jurisdictions with declining student rolls could experience for
the first time a reduction year by year in total allocation, leading them to econo-
mize and close down under-enrolled schools3.
■ Lithuania succeeded in rationalizing its school network by a combination of the
incentives inherent in the funding formula as well as the obligation imposed on
all municipalities by the central government to adopt network consolidationstrategies.
■ In the Russian Chuvash Republic , the Republican government required all
municipalities to prepare a school-restructuring plan. These restructuring plans
were then supported by improving roads and providing school buses through
Republican and Federal programs.
■ Estonia implemented a per student formula that put pressure on municipalities
to close small schools and has recently decided to design a new formula that
instead favors municipalities with 1,600 students or less.
■ Armenia from the beginning excluded small schools from the application of
the per student formula. In addition, the fact that regions (marzes)—with decon-centrated offi ces of the Ministry of Education and Science—have no authority
to reallocate budgets between schools or to arrange for student transportation
8/6/2019 Reforming Education Finance in Transition Countries
http://slidepdf.com/reader/full/reforming-education-finance-in-transition-countries 22/335
xx Executive Summary
to schools meant that they have neither the incentives nor the tools to promote
school consolidation. Thus, for considerable school consolidation to take place
within per capita financing reform, financial management authority between
the center, localities and schools must be properly distributed, and the per capi-
ta financing arrangements must include earmarkedfinancing, bonuses, or otheradjustments that facilitate school closings.
■ Georgia , on the other hand, conducted a centrally mandated massive school
network consolidation process in preparation for and as a precursor to imple-
mentation of per capita financing.
In terms of increasing the student-teacher ratio—the other effi ciency indicator this
book considers4—the case studies demonstrate the importance of the correct incentives
emanating from the funding formula, as well as taking into account political economy
considerations. Thus, Armenia succeeded in increasing the student-teacher ratio primar-
ily by making teachers redundant and providing a teacher redundancy package underthe Education Sector Reform Program. As a result, 7,200 teachers were made redundant
during 2004-06, which fell short of the original 2003 target of 15,000 teachers, partly as
a result of growing political opposition. On the issue of teacher redundancy, political
economy considerations were of particular importance in Poland. Initially in 1994, the
design of the formula in Poland ensured that per pupil allocations were higher for local
governments—known as gminas—with low pupil-teacher ratios. Naturally, this arrange-
ment provided perverse effi ciency incentives, which were removed in 1996 when the
class size criteria were abandoned. Nonetheless, the Teachers Charter in Poland includes
regulations that make the market for teachers very rigid. Consequently, in response to
the decline in student numbers in the country, surplus teachers were absorbed by thesystem by creating more teaching hours by spliing classes. Poland has, therefore, ex-
perienced a 14 percent decline in the student-teacher ratio over the period 2000-07 as
student numbers fell by 16 percent over the same period.
Regarding the equity5 impact of per student finance reforms, the majority of per
student formulae include adjustment factors based on school or student characteristics
that seek to ensure adequate funding for good quality education for all students. The
principle here is that there are structural diff erences in education provision for schools in
diff erent geographic locations, for example, that have cost repercussions that need to be
taken into account to ensure equity of expenditures (e.g. the smaller average size of rural
schools, the extra cost of heating mountainous schools, etc.) In addition, several of theformulae take into account student special education needs since such students require
additional inputs to ensure equity, whether in terms of human resources or equipment.
The Polish and Lithuania formulae additionally provide adjustment factors for minority
students, and Lithuania further takes into account migrant students. Accounting for the
minority or migrant status of students is probably the closest that any of the formulae
comes to actually considering student welfare level, but none of the formulae reviewed
makes explicit adjustments based on student socioeconomic status.
Beyond the actual formula, local governments again play a key role in terms of the
equity impact of per student finance reform. On the one hand, it is arguably the case
that per student funding allows the central government to ensure a minimum level ofeducation financing in all jurisdictions. On the other hand, in most case studies, central
government allocates funding based on the per student formula but dispenses it to the
8/6/2019 Reforming Education Finance in Transition Countries
http://slidepdf.com/reader/full/reforming-education-finance-in-transition-countries 23/335
xxiExecutive Summary
municipality. Once at the municipal level, diff erent approaches are employed to allocate
funding to schools, including, in the case of Poland and Estonia, the ability to supple-
ment the central education allocation. In fact, the data show that one of the main fac-
tors contributing to diff erences in education spending per student is diff erences in the
amount that gminas fund from their own revenues, with urban gminas tending to con-tribute the most. In other words, the equity impact of per student funding is mitigated
by the impact of decentralization reforms, which give local governments the ability to
influence the final per student allocation depending on local preferences but also on
the size of its revenues. Nonetheless, this same leeway in funding, which resulted from
strong decentralization eff orts, has led to a process leading to improved equity within
a few gmina in Poland that have chosen to adjust their per student funding across their
own schools.
In terms of the impact of per capita financing on the quality of education, a poten-
tial tension exists between healthy school competition for students6 , on the one hand,
and the incentive to increase student-teacher ratios, on the other. Thus, Armenia has
increased class size and the student-teacher ratio and fostered multi-grade teaching to
reap effi ciency gains from per capita financing without collecting, in parallel, data on
student learning. On the other hand, Lithuania does demonstrate improved education
quality between 2002 and 2006, probably in no small measure as a result of its distinctive
pro-quality per student formula. Thus, the funding formula expressly focuses on the
teaching process, and apart from the basic amount for teacher salaries includes a num-
ber of components that contribute to the quality of the pedagogical process, including
textbooks, teaching aids, teacher professional development, pedagogical and psycho-
logical services, career guidance, and cognitive development of students. Furthermore,
the share of non-wage items of the per student amount increased over time, indicating a
substitution away from pure teaching wages to the above-mentioned quality-enhancing
inputs.
Per student financing off ers, last but not least, the opportunity for improved trans-
parency and accountability of education funding as the amount each school receives is
calculated objectively and can be made available to the public. In addition, simplicity
of the per student formula contributes to its transparency and accountability, while its
growing complexity deters technical debate and therefore public oversight. In the case of
Estonia, strong features of the old funding formula were its simplicity and the stability
over time of its adjustment factors. While the process for designing the new formula has been transparent, with wide involvement of stakeholders and consultations with local
governments and school directors, it is doubtful that the complex calculations entailed
are equally well comprehended. At the local level, accountability and transparency de-
pend on the process by which the local government determines school budgets and the
availability and publicizing of the relevant data. Thus, in Poland, all local governments
discuss the annual school budgets in council where they are agreed as part of the local
government’s annual budget. However, while school councils are presented with the
school’s annual budget plan and ratify it, they have no executive authority over the bud-
get and do not monitor it at regular intervals. This lack of involvement of school council
members therefore limits accountability. Furthermore, while schools and localities havegreater financial authority and there is more availability of school-level information
since the implementation of recent education finance reforms, the ability of stakehold-
8/6/2019 Reforming Education Finance in Transition Countries
http://slidepdf.com/reader/full/reforming-education-finance-in-transition-countries 24/335
xxii Executive Summary
ers to fully exercise either their authority or oversight duties remains elusive because of
their limited capacity or information. In Georgia, the budgeting and planning skills of
school administrators are insuffi cient, which has led them to not take advantage of such
opportunities as additional funding from donations or participation in projects. School
boards also do not have the necessary skills to be active participants and full partnersin school management, which makes them rely heavily on school directors and limits
accountability.
Notes
1. In the case of Georgia, it was felt that the approach to implementing PCF in the country already
demonstrated certain outcomes of interest despite the short period of implementation.
2. The concept of effi ciency under discussion is referred to as internal e ffi ciency as opposed to exter-
nal e ffi ciency. The laer measures the ability of education systems to produce graduates who can
achieve positive labor market outcomes, and is outside the scope of this report.
3. Data from the Polish National Statistics Offi ce indicate that between 2000 and 2005 the number ofprimary schools declined by 10 percent while the number of classes fell by 9 percent.
4. The potentially detrimental impact of increased student-teacher ratios on quality of education
is discussed below.
5. This report looks at both horizontal equity (i.e. like treatment of recipients whose needs are simi-
lar) as well as vertical equity (i.e. diff erential funding levels for recipients whose needs diff er) on the
premise that equitable funding needs to ensure equality of opportunity.
6. Insofar as per student finance rewards greater student enrolment, it is assumed that schools
will compete against each other by increasing the overall quality of education as a way to a ract
students.
8/6/2019 Reforming Education Finance in Transition Countries
http://slidepdf.com/reader/full/reforming-education-finance-in-transition-countries 25/335
1
C H A P T E R 1
Reforming Education FinancingSystems in Transition
Countries: An Introductionto Six Case Studies
Dina Abu-Ghaida1
Juan Diego Alonso
Alonso Sánchez
1.1. Introduction
I
n the last 20 years two key issues with significant implications for financing education
in Europe and Central Asia (ECA)2 have been the major governance reforms follow-
ing the end of the communist influence in the early 1990s and a significant demographic
transition. In regards to the former, the appearance of democratic states on the ruins of
the “communist camp,” as it used to call itself, created an impetus for change unseen in
the regions since the end of World War II. While not all the countries progressed equally,
and many stalled in their democratic evolution, the peaceful transition to democracy
and market economy of Central European and former Soviet republics is the dramatic
background to all other reforms. In education, in particular, as we discuss below, de-
mocratization was accompanied often by decentralization and by making many voices.
At the same time as they embarked on their democratic journey, ECA countries faced
major challenges due to demographic shifts. From the early 1990s to the early 2000s, a de-
creasing fertility rate and a considerable exodus in many of the region’s countries caused
a gradual decline in the population growth rate, which went from 0.64 percent annual
growth in 1990 to 0.10 in 1995 to hovering around zero in the early 2000s (UN Population
Division 2009). Consequently, schools in this period became increasingly ineffi cient and
unequal in their relative spending as the population of school-age children diminished
(see Figure 1.1) while the number of schools, classes, teachers and other school inputs
generally stayed the same. This situation created pressure on central governments to
reduce such ineffi ciencies and spending imbalances among communities.
Following the end of the Soviet era, countries in the region have gradually reformed
their governance structures by decentralizing power and turning to a market-basedeconomy. This gradual but major reorganization has required, at diff erent stages, ac-
companying reforms of funding systems to successfully support newly empowered ad-
8/6/2019 Reforming Education Finance in Transition Countries
http://slidepdf.com/reader/full/reforming-education-finance-in-transition-countries 26/335
World Bank Study2
ministrative entities and to deal with unfavorablefi
nancial conditions. While the specifi
ccountry context and ultimate reform objectives diff ered, it is in this environment of de-
mographic transition and governance reform that per capita financing (PCF) emerged as
a potentially successful approach to funding education.
1.2. From Input-Based Financing to Per Capita Financing
Per capita financing3 arguably falls under the umbrella of formula funding of schools,
which has as its main characteristic that it consists of a set of agreed objective criteria
for allocating resources to schools that are impartially applied to each school (Levačić
& Ross 1999). Thus, in 1988, the Government of the United Kingdom defined formula
funding as “methods, principles, and rules of any description, however expressed. The
formula does not have to be expressed in purely algebraic form, but it must apply a con-
sistent set of criteria for distributing resources” (Department of Education and Science
1988 7/88 para. 103). Formula funding for schools has therefore arguably been a feature
of educational management since the formation of systems of public education and has
a history within Western schooling systems (Caldwell et al. 1999). For example, it is very
common in administratively centralized school systems for the education authority to
determine the teaching staff establishment of each school by means of a formula that
relates the number of teachers to a specified student-teacher ratio, or to an assumed class
size considered necessary or feasible, or to a specified teaching group size for designat-
ed subjects and grade levels. Similarly, education systems have used funding formulae
with respect to supplies and equipment; and with the passage of time, have established
formulae for diff erent types of schools and for diff erent kinds of educational programs.
Figure 1.1. Decline in the Proportion of School-Age Population in Selected ECA
Countries: 1990-2004
Source: UN Population Division (2009).
15
17
19
21
23
25
27
29
31
1990 1992 1994 1996 1998 2000 2002 2004
Year
Europe & Central Asia
Armenia
Estonia
Georgia
Lithuania
Poland
Russian Federation
P o
p u l a t i o n a g e s 0 - 1 4 ( a s % o f t o t a l )
8/6/2019 Reforming Education Finance in Transition Countries
http://slidepdf.com/reader/full/reforming-education-finance-in-transition-countries 27/335
Reforming Education Finance in Transition Countries 3
In the case of ECA, the education finance approach in place prior to the transition
is often referred to as input-based, or normative budgeting. It included staffi ng norms
allocating teaching resources by number of classes, so that each class got a teacher and
teaching aids according to the grade-specific number of lessons stipulated by the curric-
ulum. This encouraged schools to minimize class size in order to maximize the numberof teachers and teaching aids. Furthermore, a fragmented and specialized curriculum,
with limited opportunity for teachers to teach across related fields, further inflated the
need for teachers in all but the largest schools. Separate staffi ng norms applied to admin-
istrative and custodial staff . Furthermore, detailed space norms specified funding based
on the area of school facilities and led to much wasted space, such as large lobbies and
highly specialized laboratories and workshops that often were underutilized (Berryman
2000). The rules further encouraged jurisdictions to regard the building of new schools
as beneficial, since more schools meant more classes, which meant more staff and more
resources.
Although formula funding has a history in public education systems world-wide
and in ECA in particular, it is important to stress that three alternatives to funding
schools were (Levačić and Ross 1999) and continue to be more prevalent. These three
alternatives are by no means mutually exclusive and can be described as:
■ Historic funding or incrementalism: the school receives funding for this year,
which is the same as it spent the previous year modified up or down by a few
percentage points;
■ Bidding and bargaining: the school presents a case for funding based on known
criteria and is awarded financing according to how well the funding agency
considers the bid meets the criteria;■ Discretion: the school receives funding according to the opinions and judgments
exercised by the funding agency administrators.
Under any of the above three approaches to resource allocation, no clear relation-
ship between the funding needs of the school and actual resources received arises. In the
case of historic funding, the allocations to diff erent schools may often seem illogical and
unexplainable based on currently observed criteria. Allowing schools to bid and bar-
gain for resources simply rewards the more entrepreneurial school heads and can bear
lile relationship to the needs of the student body. And the personal opinions and pref-
erences of school system administrators, while ideally policy-driven, are by no means
guaranteed to be so.
For ECA countries, there is much evidence that input-based budgeting created a
budget planning process closely resembling a specific combination of historic funding,
bidding and discretion (World Bank 2004). The starting point for budget negotiations
always was the last year’s funding level. The bidding and negotiations focused on in-
cremental changes to the historical funding, where schools, which did not formulate
their budget per se, used staffi ng norms to determine the number of teaching and non-
teaching positions required.4 The schools then submied their estimate to the municipal
administration where proposals were reviewed against actual resource availability. In
addition, multiple bargaining processes took place at diff
erent levels of government.At the end, what diff erent schools obtained above and beyond their historical budgets
was based on discretion and favoritism of local or central level bureaucrats. Usually,
the actual funding received by a school was less than that demanded. Often, it simply
8/6/2019 Reforming Education Finance in Transition Countries
http://slidepdf.com/reader/full/reforming-education-finance-in-transition-countries 28/335
World Bank Study4
resembled last year’s allocation with an adjustment for inflation and emergency needs
(Fiszbein 2001). In other words, the actual application of input-based funding of schools
was then tempered by a combination of historic funding, bargaining and discretion.
For ECA countries, the resulting school budget allocation process was therefore,
and in many countries remains, non-transparent and conducive to ineffi cient use andinequitable allocation of resources. Schools receive their allotment on a monthly basis,
by line item with no provision for any kind of monitoring, evaluation and feedback. This
line-item budgeting procedure limits school directors’ autonomy in making allocative
choices. There is no incentive for schools to economize on particular areas of spending
since the school is unlikely to benefit from the savings. School budgets are sometimes cut
by the amount saved during the previous year. Indeed, there is an incentive for schools
to inflate their “needs.” For instance a school could create classes with low number of
students, in order to increase artificially the relative number of teachers (see above). In
some cases, recurrent deficits of local budgets and associated repeated budget amend-
ments led to a perverse budgeting process called “deficit budgeting” in which institu-
tions strive to achieve higher deficits since it will increase their additional allocation
when the budgets are amended (Levitas & Herczyński 2001). In addition, inequities are
more likely to be fostered since the poorest and weakest municipalities have less chance
of making their voices heard in the bargaining process and thereby securing a higher
allocation. Combined with the fact that a common feature of ECA countries is the wide
diff erence in tax bases among localities, the result is that some jurisdictions are beer
than others at securing funds for education, whether in terms of the central allocation
or their ability to generate revenues locally, leading to inequities in per pupil spending.
Yet in the West, starting in the 1960s, funding formulae using various indices of eco-
nomic and social disadvantage were developed in order to allocate additional resources
to schools serving disadvantaged communities. Following the recognition at that time of
the relationship between economic disadvantage and poor educational aainment, poli-
cies to provide additional resources for schools with particularly large concentrations of
disadvantaged students were introduced, for example in the USA, Australia, Britain and
France (Caldwell et al. 1999). However, most of these early aempts at formula fund-
ing of schools were program-specific, usually targeted at special sub-groups of schools,
and almost always confined to a relatively small proportion of the total budget that was
available for schools (Ross & Hallak 1999). Examples include the Educational Priority
Areas program in the United Kingdom and the Disadvantaged Schools Project in Aus-tralia, which had formulae that employed detailed social indicators based on income,
education, occupational status, language spoken in the home and ethnicity. Diff erent
formulae were usually used for diff erent programs. Additional resources were usually
supplied in kind (i.e., additional teachers or auxiliary staff , equipment and materials). If
additional money was provided, it was an earmarked allocation, so that transfers across
diff erent categories of resources were generally not an issue. Finally, although the focus
in these early formulae was on the student, class, or school, these developments gener-
ally occurred in systems of public education that were centralized in respect to the locus
of decision-making on most maers of importance.
Major advances in the conceptual and methodological aspects of formula fundingin education emerged in the 1990s, when school systems in countries such as Australia,
Canada, New Zealand, United Kingdom and USA started to implement radically decen-
tralized approaches (see Box 1.1) to educational administration (Ross & Hallak 1999).
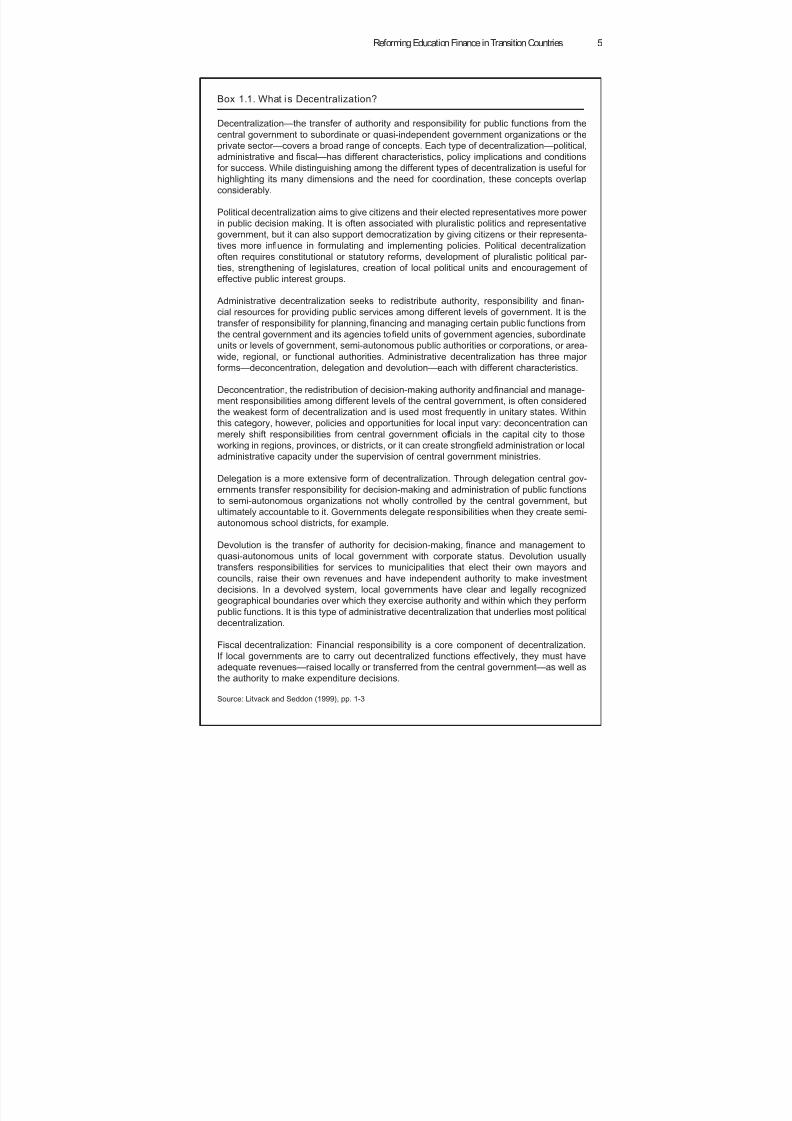
8/6/2019 Reforming Education Finance in Transition Countries
http://slidepdf.com/reader/full/reforming-education-finance-in-transition-countries 29/335
Reforming Education Finance in Transition Countries 5
Box 1.1. What is Decentralization?
Decentralization—the transfer of authority and responsibility for public functions from the
central government to subordinate or quasi-independent government organizations or theprivate sector—covers a broad range of concepts. Each type of decentralization—political,
administrative and fiscal—has different characteristics, policy implications and conditions
for success. While distinguishing among the different types of decentralization is useful for
highlighting its many dimensions and the need for coordination, these concepts overlap
considerably.
Political decentralization aims to give citizens and their elected representatives more power
in public decision making. It is often associated with pluralistic politics and representative
government, but it can also support democratization by giving citizens or their representa-
tives more influence in formulating and implementing policies. Political decentralization
often requires constitutional or statutory reforms, development of pluralistic political par-
ties, strengthening of legislatures, creation of local political units and encouragement of
effective public interest groups.
Administrative decentralization seeks to redistribute authority, responsibility and finan-
cial resources for providing public services among different levels of government. It is the
transfer of responsibility for planning, financing and managing certain public functions from
the central government and its agencies to field units of government agencies, subordinate
units or levels of government, semi-autonomous public authorities or corporations, or area-
wide, regional, or functional authorities. Administrative decentralization has three major
forms—deconcentration, delegation and devolution—each with different characteristics.
Deconcentration, the redistribution of decision-making authority and financial and manage-
ment responsibilities among different levels of the central government, is often considered
the weakest form of decentralization and is used most frequently in unitary states. Withinthis category, however, policies and opportunities for local input vary: deconcentration can
merely shift responsibilities from central government of ficials in the capital city to those
working in regions, provinces, or districts, or it can create strong field administration or local
administrative capacity under the supervision of central government ministries.
Delegation is a more extensive form of decentralization. Through delegation central gov-
ernments transfer responsibility for decision-making and administration of public functions
to semi-autonomous organizations not wholly controlled by the central government, but
ultimately accountable to it. Governments delegate responsibilities when they create semi-
autonomous school districts, for example.
Devolution is the transfer of authority for decision-making,finance and management toquasi-autonomous units of local government with corporate status. Devolution usually
transfers responsibilities for services to municipalities that elect their own mayors and
councils, raise their own revenues and have independent authority to make investment
decisions. In a devolved system, local governments have clear and legally recognized
geographical boundaries over which they exercise authority and within which they perform
public functions. It is this type of administrative decentralization that underlies most political
decentralization.
Fiscal decentralization: Financial responsibility is a core component of decentralization.
If local governments are to carry out decentralized functions effectively, they must have
adequate revenues—raised locally or transferred from the central government—as well as
the authority to make expenditure decisions.
Source: Litvack and Seddon (1999), pp. 1-3
8/6/2019 Reforming Education Finance in Transition Countries
http://slidepdf.com/reader/full/reforming-education-finance-in-transition-countries 30/335
World Bank Study6
These school systems started to employ school-based management models in which
the majority, sometimes over eighty percent, of a school system’s available educational
resources was placed under the direct control of schools. The arrival of these models
generated a very strong demand for formula funding because this was seen as the only
way in which to establish valid and defensible methods for making decisions about ex-actly how much each school should receive from a total school system budget. The most
sophisticated approaches to formula funding to date have been associated with recent
eff orts to reform public education in a number of countries, especially where that reform
involves a significant level of decentralization of authority, responsibility and account-
ability to schools within a centrally determined framework of policies, priorities and
standards (Ross & Hallak 2004). If resources were to be allocated directly to schools as
one line or lump sum budgets for local decision-making, then governments and their
agencies were confronted with questions such as “What amount should be allocated to
each school?” and “What factors should be taken into account in determining the level of
resources that should be allocated to a particular school?” These questions raised others,
especially when it became evident that existing approaches to resource allocation were
unclear or inconsistent, or in some instances, open to manipulation on the basis of spe-
cial pleading or political interference. Fair and transparent approaches were demanded.
Three main policy functions of formula funding emerged in Western countries in
this regard: an equity, a directive and a market regulation function (Levačić & Ross,
1999). Here, two forms of equity need to be distinguished. On the one hand, horizon-
tal equity implies the like treatment of recipients whose needs are similar, so that, for
example, significantly diff erent funding of comparable students in diff erent regions
is considered horizontally inequitable, unless the diff erence in funding is addressing
structural inequalities among the regions, such as variability in costs that result from
a region’s geographic location, population density, or size. On the other hand, vertical
equity implies diff erential funding levels for recipients whose needs diff er, e.g. greater
per student funding for disabled or socially disadvantaged students may be vertically
equitable. Formula funding aempts, therefore, to determine the learning needs of each
category of student and the cost of providing for those needs so that the allocation of
inputs is equitable. In addition, a funding formula is used directively when it contains
specific incentives or sanctions for schools that are intended to influence the behavior of
school managers in ways consistent with the policy aims and objectives of the funding
agency. For example, if the funding agency wishes to sustain small schools and to enablethem to deliver the same quality of curricular provision as other schools, then the fund-
ing formula could give additional payments to schools with smaller enrolments. Finally,
the market regulation function operates in school systems with emphasis on parental
choice of school so that the education authority or funding agency uses a formula to
allocate money to each school according to the number and nature of students in given
grade levels that it has recruited. In other words, the school responds to the financial
incentives linked to parental choice by providing a high quality of education so as to
induce a suffi cient number of parents to choose that school rather than an alternative.
The above three policy functions of the formula may be at odds with each other at times,
so that in practice the funding agency performs a subtle balancing act to accommodatediff erent priorities and political pressures.
8/6/2019 Reforming Education Finance in Transition Countries
http://slidepdf.com/reader/full/reforming-education-finance-in-transition-countries 31/335
Reforming Education Finance in Transition Countries 7
As the newly democratic ECA countries begun their reforms of inherited education
systems, they could not avoid taking into account the discussions and models concur-
rently developed in Western countries. In particular, some ECA countries moved to per
capita financing to achieve the above policy priorities, reformulated upon their specific
conditions. They also hoped to improve the effi ciency of education spending, seriouslyworsening under the impact of demographic changes, and made even more urgent by
the fiscal constraints they faced. One way to define effi cient spending is that it obtains
the maximum social value of output from a given quantity of resources. More specific
to education, an education system that enrolls a student at lower unit cost than another
education system is, other things equal, more effi cient.5 Arguably, however, even this
second definition remains too abstract and does not reflect the concrete priorities identi-
fied by ECA countries undertaking education finance reform. Instead, ECA policymak-
ers found themselves burdened, at a time of fiscal constraint, with large school networks
that included many small schools, small class sizes and low student-teacher ratios, and
a financing system that provided no incentives to actors at the school or municipal level
to save (whether in general or on certain schooling inputs versus others). Thus, it is
changes in the above aributes of the general education system that will serve as prox-
ies for an assessment on changes to the effi ciency of education spending as a result of
implementation of per capita financing.
1.3. About This Book
This book reviews the experience with one specific though widely introduced approach
to funding general education,6 namely per capita financing (PCF), in six countries in
the Europe and Central Asia (ECA) region in an eff ort to learn which outcomes wereachieved and how. Five of the six case study countries—Armenia, Estonia, Lithuania,
Poland, and the Russian Federation—were chosen primarily since they represent ECA
countries with relatively long experience in implementing PCF schemes.7 The hope
is that, as a result, the likelihood of observing the outcomes of per capita financing is
higher. An aempt was made at geographic variation across the ECA region as well.8
Naturally, the approach of relying on country case studies entails certain trade-off s: on
the one hand, in-depth knowledge of the experience of the six countries9 is available and
documented in the individual case studies; on the other hand, any generalizations across
the entire ECA region will require additional nuances based on individual country sce-
narios and specificities.The rest of the book is organized as follows. Chapters 2 through 7 discuss the coun-
try case studies. For no specific reason other than a given sorting mechanism for display-
ing the chapters is needed, the case studies are presented in alphabetical order: Arme-
nia (chapter 2), Estonia (chapter 3), Georgia (chapter 4), Lithuania (Chapter 5), Poland
(Chapter 6), and Russia (chapter 7). All six chapters present a similar structure. First, an
introduction is provided to motivate the discussion. Second, the historical background
to the introduction of the PCF system is discussed. Third, the design of the PCF scheme
is analyzed. Fourth, the peculiarities of the implementation of the scheme are described.
Fifth, an assessment of a set of three main outcomes—effi ciency, equity, and transpar-
ency/accountability—is presented. A sixth and final section provides a summary of thelessons learned in each of the cases. Chapter 8 presents an in-depth overview of the case
studies within a common framework to compare these experiences.
8/6/2019 Reforming Education Finance in Transition Countries
http://slidepdf.com/reader/full/reforming-education-finance-in-transition-countries 32/335
World Bank Study8
References
Berryman, S. (2000); Hidden Challenges to Education Systems in Transition Economies , World
Bank, Washington, D.C.
Bischoff
, C. (ed.) (2009); Public Money for Public Schools—Financing Education in SouthEastern Europe. Local Government and Public Service Reform Initiative, Open So-
ciety Initiative, Budapest.
Caldwell, B., Levačić , R., and Ross, K. (1999); “The role of formula funding of schools in
diff erent educational policy contexts” in Kenneth N. Ross and Rosalind Levačić
(editors) Needs-based Resource Allocation in Education via Formula Funding of Schools ,
Paris: UNESCO International Institute for Educational Planning.
Department of Education and Science (1988); Education Reform Act: Local Management of
Schools , Circular No. 7/88. London: Her Majesty’s Stationery Offi ce.
Fazekas, M. (2009); “School Funding Formulas: A Literature Review”, Unpublished
Manuscript.Fiszbein, A. (editor). (2001); Decentralizing Education in Transition Societies: Case Studies
from Central and Eastern Europe , World Bank Institute, World Bank, Washington,
D.C.
Levačić , R. and Ross, K. (1999). “Principles for designing needs-based school funding
formulae” in Kenneth N. Ross and Rosalind Levačić (editors) Needs-based Resource
Allocation in Education via Formula Funding of Schools , Paris: UNESCO International
Institute for Educational Planning.
Levitas, T., and Herczyński, J. (2001); Education Policy and Finance in Lviv: Strategic Pro-
posals. Report Wrien for Lviv City Council under Largis Project, Lviv, Ukraine.
Litvack, J., and Seddon, J. (1999). Decentralization Brie fing Notes , WBI Working Papers,World Bank Institute, World Bank, Washington, D.C.
Ross, K., and Hallak, J. (1999); “Introduction” in Kenneth N. Ross and Rosalind Levačić
(editors) Needs-based Resource Allocation in Education via Formula Funding of Schools ,
Paris: UNESCO International Institute for Educational Planning.
United Nations Population Division (2009); World Population Prospects: The 2008 Revision.
New York, United Nations, Department of Economic and Social Aff airs (advanced
Excel tables). Available at hp://esa.un.org/unpd/wpp2008/index.htm.
World Bank (2004); Per Capita Financing of Education: Experience and Issues , World Bank
Russian Country Offi ce, Moscow, Russian Federation.
Notes
1. The authors of this chapter have benefied from many exchanges and conversations with the
authors of each of the country case studies. Special thanks go, however, to Jan Herczyński for thor-
oughly revising it and suggesting further edits and changes. All mistakes and errors of interpreta-
tion or judgment are, of course, our sole responsibility.
2. The reference to the Europe and Central Asia (ECA) Region, in this book, alludes to the 30 coun-
tries which are World Bank client countries in this region, namely, Albania, Armenia, Azerbaijan,
Belarus, Bosnia and Herzegovina, Bulgaria, Croatia, the Czech Republic, Estonia, Georgia, Hun-
gary, Kazakhstan, Kosovo, the Kyrgyz Republic, Latvia, Lithuania, Macedonia, Moldova, Monte-
negro, Poland, Romania, the Russian Federation, Serbia, the Slovak Republic, Slovenia, Tajikistan,
Turkey, Turkmenistan, Ukraine, and Uzbekistan.
3. “Per capita” financing is also referred to in the literature as per student or capitation financing.
8/6/2019 Reforming Education Finance in Transition Countries
http://slidepdf.com/reader/full/reforming-education-finance-in-transition-countries 33/335
Reforming Education Finance in Transition Countries 9
4. Other school costs, such as utilities, were paid directly by the relevant municipality or local
government.
5. The concept of effi ciency under discussion is referred to as internal e ffi ciency as opposed to exter-
nal e ffi ciency. The laer measures the ability of education systems to produce graduates who can
achieve positive labor market outcomes, and is outside the scope of this report.
6. The term general education is used in this report to refer to primary, lower secondary, and upper
secondary academic, i.e. excluding vocational or technical, education.
7. In the case of Georgia, it was felt that the approach to implementing PCF in the country already
demonstrated certain outcomes of interest despite the short period of implementation.
8. The chosen approach means that some important countries or groups of countries within the
ECA region, like the Western Balkan countries, were left out of the present book given that they
either had very recent—and limited—or no experience or a very recent and limited one. For the
interested reader, a recent review of education finance in Albania, Bulgaria, Croatia, Macedonia,
Romania, and Moldova is provided by Bischoff (2009). For a comprehensive literature review on
the worldwide experience with formula funding, see Fazekas (2009).
9. Note that in the case of the Russian Federation, the chapter in this book only refers to the experi-
ence of PCF introduction in two regions (the Tver Oblast and the Chuvash Republic).
8/6/2019 Reforming Education Finance in Transition Countries
http://slidepdf.com/reader/full/reforming-education-finance-in-transition-countries 34/335
10
C H A P T E R 2
Per Capita Financing ofGeneral Education in Armenia
Sachiko Kataoka1
2.1. Introduction
After independence from the Soviet Union in 1991, Armenia’s public education sys-
tem was put on the verge of total collapse with spending plummeting dramati-
cally. Until the late 1980s, total education expenditure in Armenia was supported by the
general budget of the Soviet Union at an estimated average unit cost per student across
all levels equivalent to approximately US$500-600.2 Following the collapse of the Soviet
Union, Armenia faced a severe economic recession, and the new government of Armenia
was no longer able to allocate its budget to education at the same level as before. Public
education expenditure dropped from almost 8 percent of GDP in 1989 to 1.2 percent in
1994. Teacher salaries dropped sharply—as low as US$3 per month in 1994, which forced
many teachers to become part-time teachers and have a second job. Per student public
expenditure on general secondary education (GSE)3 declined from an estimated US$292
in 1989 to about US$33 in 2001.4 With limited government resources, the education sys-
tem could no longer survive without substantial contributions from parents.
The ever grimmer situation of education financing in Armenia was compounded
by the lack of necessary adjustment of the system to the new demographic trends. Be-
tween 1990 and 2000, while the number of students declined by almost 6 percent (from
597,000 to 564,000) primarily due to the declining birth rate,5 the number of teachers in-
creased by 2.7 percent (from 55,500 to 57,000). Education spending was also distributed
unevenly between schools. Many schools had idle capacity, while some in urban areas
were overcrowded. Given the severely scarce resources and the rapidly deteriorating
education system as a result, the government felt an imminent need to spend available
budget more effi ciently and eff ectively. To restore and improve the education system,
the Ministry of Education and Science (MOES) singled out education financing as a key
reform area in the overall general education reform strategy of 1997 and proposed to
introduce per capita financing (PCF) as a major reform to start addressing the fiscal
problems in the sector.
The rest of this chapter discusses how the introduction of a system based on capita-
tion principles (PCF) played a critical role in the general education reforms. Section 2.2
reviews the Armenian school system and discusses the policy objectives of introducingPCF in general education. Section 2.3 examines how the government designed the PCF
8/6/2019 Reforming Education Finance in Transition Countries
http://slidepdf.com/reader/full/reforming-education-finance-in-transition-countries 35/335
Reforming Education Finance in Transition Countries 11
scheme on a pilot basis. It also discusses other key reforms which were running in par-
allel to the financing reform. Section 2.4 analyzes how the new financing system was
implemented, and adjusted in the process of gradual nationwide expansion. Section 2.5
assesses the outcomes of the PCF scheme in terms of effi ciency, equity, transparency and
accountability, and some other outcome indicators, i.e. , school autonomy, academic ef-fectiveness. The last section concludes with a summary of the key findings.
2.2. Background
2.2.1. The General Secondary Education (GSE) System
The management responsibilities for GSE are shared between the central government
and its deconcentrated administration offi ces at the regional level. MOES is responsible
for curriculum and textbook development, teacher training and qualifications, students’
assessment, capital investment, and management of boarding and special needs schools.
School administration and distribution of recurrent budget to GSE schools are the re-sponsibility of the regional education departments. Regions, referred to as marzes, were
established after independence as the deconcentrated offi ces of the central government,
and their offi cials are not elected, but are appointed by and accountable to the central
government. In the country, there are 11 regions (10 marzes and the City of Yerevan).
Recurrent budgets for general education are channeled from the Ministry of Finance and
Economy (MFE) to regional finance departments, which are responsible for disbursing
funds to individual schools on the basis of budget line items. Regional education depart-
ments are responsible for appointing school directors, and managing the regional school
inspectorate.
Armenia’s GSE system is being extended from 10 to 12 years. Until recently, the GSEsystem in Armenia consisted of eight years of compulsory basic education (three years of
primary andfive years of lower secondary) and two years of upper secondary education.
Currently, this Soviet-era system is being extended, in two steps, first, to nine years of
basic education (grades 1-4 for primary and grades 5-9 for lower secondary) and, sec-
ond, to three years of upper secondary education (grades 10-12).6
Over 96 percent of primary and secondary students are enrolled in various types of
state schools. In the school year 2009/10, there were 1,368 public schools, consisting of
nine primary-only schools (grades 1–4), 293 basic schools (grades 1-9), 999 full general
secondary schools (grades 1–11/12), 19 lyceums (grades 5–11/12, and 48 high schools
(grades 10–11/12) . In addition, there were 46 vocational education schools. Finally, therewere 53 private schools off ering general secondary education. Altogether, 381,286 stu-
dents were enrolled in these various types of public GSE schools and 5,992 in private
schools, or 387,278 in total.
Compared to other countries at similar income levels,7 basic (primary and lower sec-
ondary) education enrollment rates are relatively high, but they decline significantly at
upper secondary.8 Because children are not necessarily enrolled at the offi cially intended
level of education, however, the net enrollment rate (NER) for basic education (grades
1-8) was much lower, only 89 percent, than the gross enrollment rate (GER), 114 percent
in 2005. This is partly the result of variations in the entry age and cumulative repetitions
throughout basic education. Similarly, while the GER for upper secondary education
8/6/2019 Reforming Education Finance in Transition Countries
http://slidepdf.com/reader/full/reforming-education-finance-in-transition-countries 36/335
World Bank Study12
(grades 9-10) is estimated at 89 percent, the NER is only 70 percent. The GER goes up
to 104 percent for higher secondary level if those in preliminary (secondary level) voca-
tional training are included.
2.2.2. Policy Objectives
In 1997, the MOES adopted the Strategy for Reform of the General Education System in
an eff ort to restore and enhance the quality, equity, and effi ciency of the educational sys-
tem.10 The comprehensive strategy aimed at: (i) the diversification of education financ-
ing by concentrating public funding in core general education and promoting private
investment in extra-curriculum activities and other levels of education; (ii) structural
reforms of the education system based on decentralization, school autonomy, and ratio-
nalization, supported by a new information system; and (iii) continuous improvement
of curriculum and teaching methods and upgrading of knowledge evaluation consistent
with international educational standards.
The Strategy proposed to introduce PCF for general education as a tool to ensuregreater school autonomy, to improve cost eff ectiveness, to facilitate the consolidation
of the school network, and to eliminate staff redundancy. On education management
and financing, the Strategy pointed out that school directors had no incentive to be ef-
ficient or cost-eff ective because they had received school budgets based on the number
of classes and teachers and therefore opted for ineffi ciently low class sizes and student-
teacher ratios, and because they were given no decision-making authority over financial
management with very lile non-salary budget. Therefore, an important element of the
education reforms was to transform schools from budgetary institutions to autonomous legal
entities with the right to hold their own bank accounts and manage their own budgets.
The introduction of the PCF scheme in Armenia was, therefore, accompanied bythe enhancement of school autonomy and accountability in management and financing
to achieve multiple objectives.
The Government Decree No. 377 on the Approval of the
Pilot Project on the Republic of Armenia General Education System Reforms dated June
1, 1999 envisaged the objectives of the PCF pilot project as follows:
■ to assess possibilities of the general education system reforms and implement
mechanisms;
■ to establish favorable and promotional conditions by increasing the rationaliza-
tion and e ffi ciency of the education system; and
■ to implement education reform innovations, particularly decentralization of man-agement and financing autonomy to schools , and promotion of e ffi cient and sustain-
able mechanisms for self-dependent schools.
In addition, under the Education Law dated April 14, 1999 and the new regula-
tory framework for school-based management, all schools were required to establish
the school board, comprised of parents, teachers, and local government representatives,
as an accountability
mechanism by involving communities in school management. Deci-
sions relating to the allocation of resources within the school, including the selection,
hiring and firing of staff , became the responsibility of the school board, in compliance
with the selection rules and procedures and standards established by MOES. The school
director would implement the daily school activities and decisions of the Board.
8/6/2019 Reforming Education Finance in Transition Countries
http://slidepdf.com/reader/full/reforming-education-finance-in-transition-countries 37/335
Reforming Education Finance in Transition Countries 13
2.3. The Design of the Funding Formula
2.3.1. The Design of the PCF Scheme
Initially, the PCF scheme was implemented on a pilot basis in three selected regions.
In 1999, 154 schools (about 10 percent of the country’s total) in Yerevan City and theKotayk and Vayots Dzor regions participated in the PCF pilot project. The piloting of the
system was supported under the World Bank-funded Education Financing and Manage-
ment Reform Project (EFMRP) (1998-2003). The schools were selected by their respective
regions to represent diff erent types of schools and were based on the willingness of
school principals to participate and the availability of an accountant in school.
The project tested the management capacities of the elected local authority, the ha-
maink , which is administratively the second level of jurisdictional authority below the
region.11 When the pilot project was being designed in 1998, the government passed the
Government Decree No. 661 on Further Decentralization of the Management of the State
General School System dated October 28, 1998, which aimed to decentralize significantresponsibilities for delivering public services, including GSE, to hamainks. In order to
test their potential roles and capacities in managing general education, one third of the
pilot schools were transferred to the hamaink authority, while two thirds remained under
regions. Most hamainks , being small and inexperienced, however, lacked administrative
and management capacities to take on the new responsibilities such as school adminis-
tration and distribution of recurrent budget to schools. Furthermore, some newly elected
community leaders misunderstood their functions and misused power such as the ap-
pointment of school directors. Consequently, the schools under them were taken back to
the regional level after the first year of the pilot project implementation.12
2.3.2. The PCF Formula
An inter-ministerial Working Group on Education Finance and Management developed
a relatively simple formula based on the input-based budget of the 154 pilot schools,
which was supplemented by a transitional mitigation measure. First, the government
decided to exclude 18 small schools with less than 100 pupils from the formula-based
financing completely and to continue allocating budgets based on the number of classes
as in the earlier days because the potential budgetary gaps for these schools would have
been too large.13 Second, a simple formula was developed based on a linear regression
analysis of the input-based budget of the remaining 136 schools. The formula consisted
of only two variables without any adjustment factors as follows:
Total School Budget = A x N + B
where A = Per student unit cost
N = Number of students
B = Fixed cost (informally called ‘maintenance costs’14)
To avoid radical changes in school budget, and in particular, in terms of staffi ng, the
government decided that no pilot school would receive a lower budget than the one in
the previous year. As illustrated in Figure 2.1, out of the 136 schools, 41 schools were go-
ing to receive a smaller budget under the formula-based allocations than with the histor-
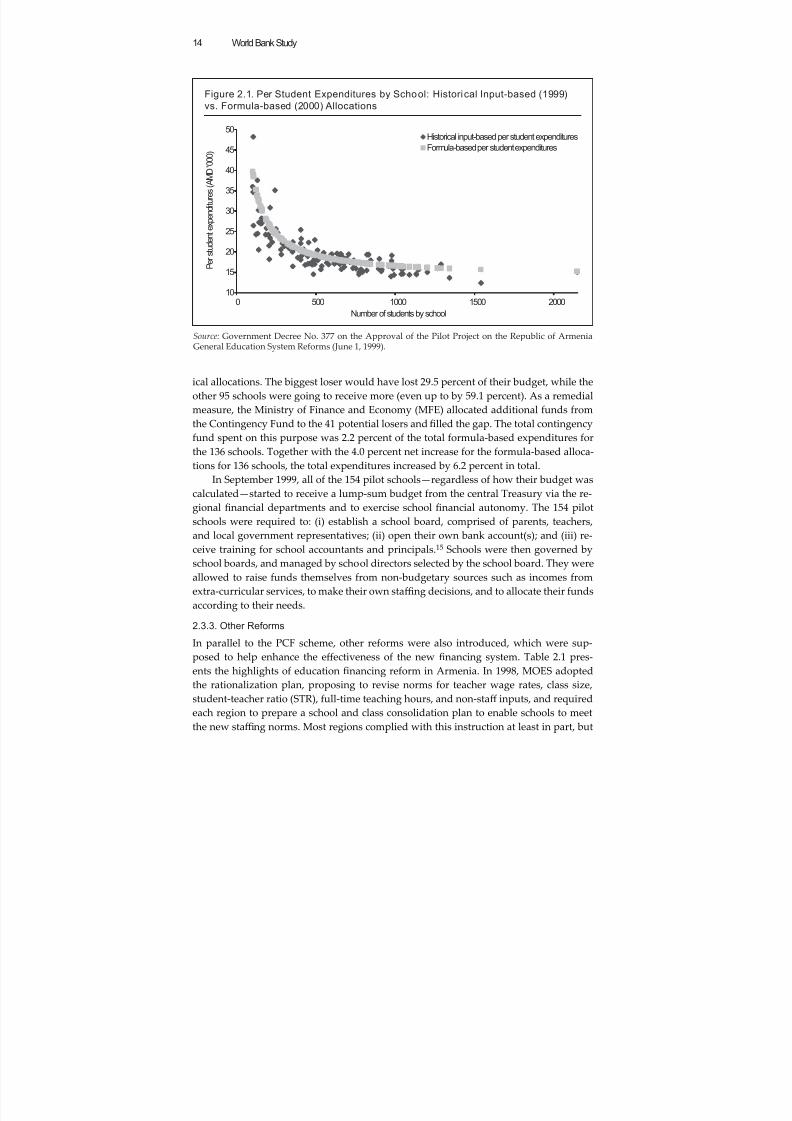
8/6/2019 Reforming Education Finance in Transition Countries
http://slidepdf.com/reader/full/reforming-education-finance-in-transition-countries 38/335
World Bank Study14
ical allocations. The biggest loser would have lost 29.5 percent of their budget, while the
other 95 schools were going to receive more (even up to by 59.1 percent). As a remedial
measure, the Ministry of Finance and Economy (MFE) allocated additional funds fromthe Contingency Fund to the 41 potential losers and filled the gap. The total contingency
fund spent on this purpose was 2.2 percent of the total formula-based expenditures for
the 136 schools. Together with the 4.0 percent net increase for the formula-based alloca-
tions for 136 schools, the total expenditures increased by 6.2 percent in total.
In September 1999, all of the 154 pilot schools—regardless of how their budget was
calculated—started to receive a lump-sum budget from the central Treasury via the re-
gional financial departments and to exercise school financial autonomy. The 154 pilot
schools were required to: (i) establish a school board, comprised of parents, teachers,
and local government representatives; (ii) open their own bank account(s); and (iii) re-
ceive training for school accountants and principals.15 Schools were then governed byschool boards, and managed by school directors selected by the school board. They were
allowed to raise funds themselves from non-budgetary sources such as incomes from
extra-curricular services, to make their own staffi ng decisions, and to allocate their funds
according to their needs.
2.3.3. Other Reforms
In parallel to the PCF scheme, other reforms were also introduced, which were sup-
posed to help enhance the eff ectiveness of the new financing system. Table 2.1
pres-
ents the highlights of education financing reform in Armenia. In 1998, MOES adopted
the rationalization plan, proposing to revise norms for teacher wage rates, class size,student-teacher ratio (STR), full-time teaching hours, and non-staff inputs, and required
each region to prepare a school and class consolidation plan to enable schools to meet
the new staffi ng norms. Most regions complied with this instruction at least in part, but
Figure 2.1. Per Student Expenditures by School: Historical Input-based (1999)
vs. Formula-based (2000) Allocations
10
15
20
25
30
35
40
45
50
0 500 1000 1500 2000
P e r s t u d e n t e x p e n d i t u r e s ( A M D ' 0 0 0 )
Number of students by school
Historical input-based per student expendituresFormula-based per student expenditures
Source: Government Decree No. 377 on the Approval of the Pilot Project on the Republic of ArmeniaGeneral Education System Reforms (June 1, 1999).
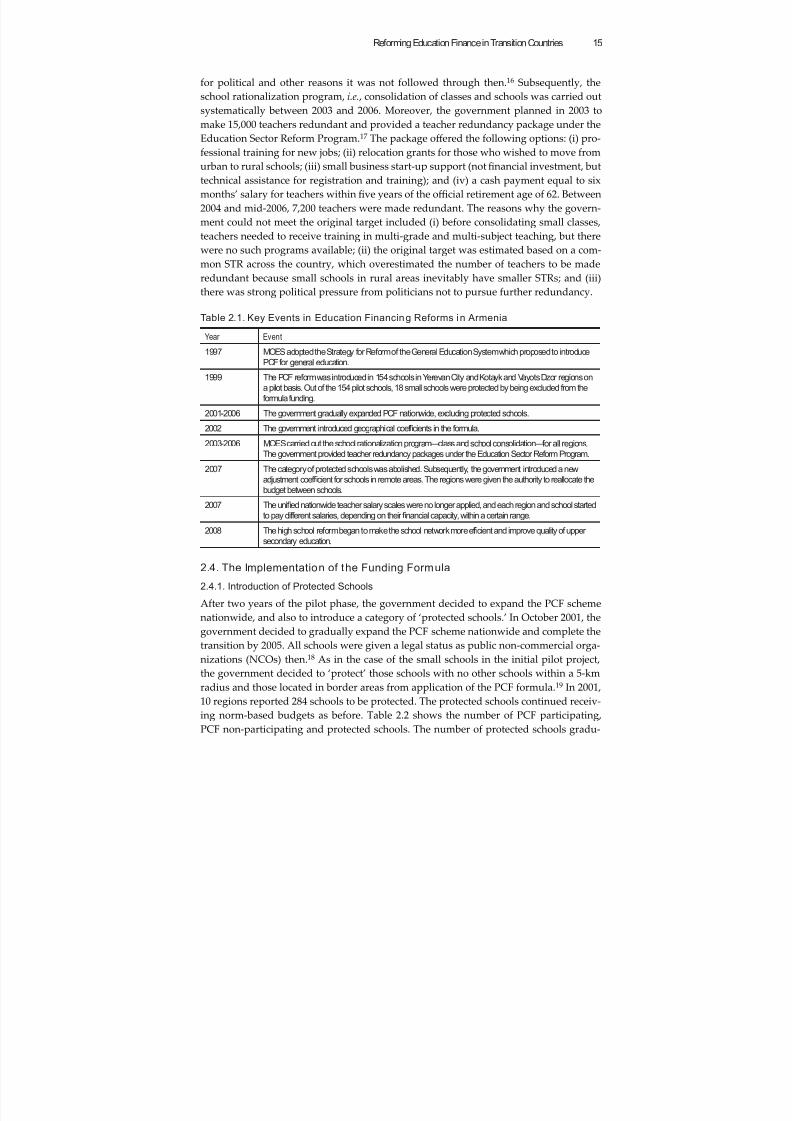
8/6/2019 Reforming Education Finance in Transition Countries
http://slidepdf.com/reader/full/reforming-education-finance-in-transition-countries 39/335
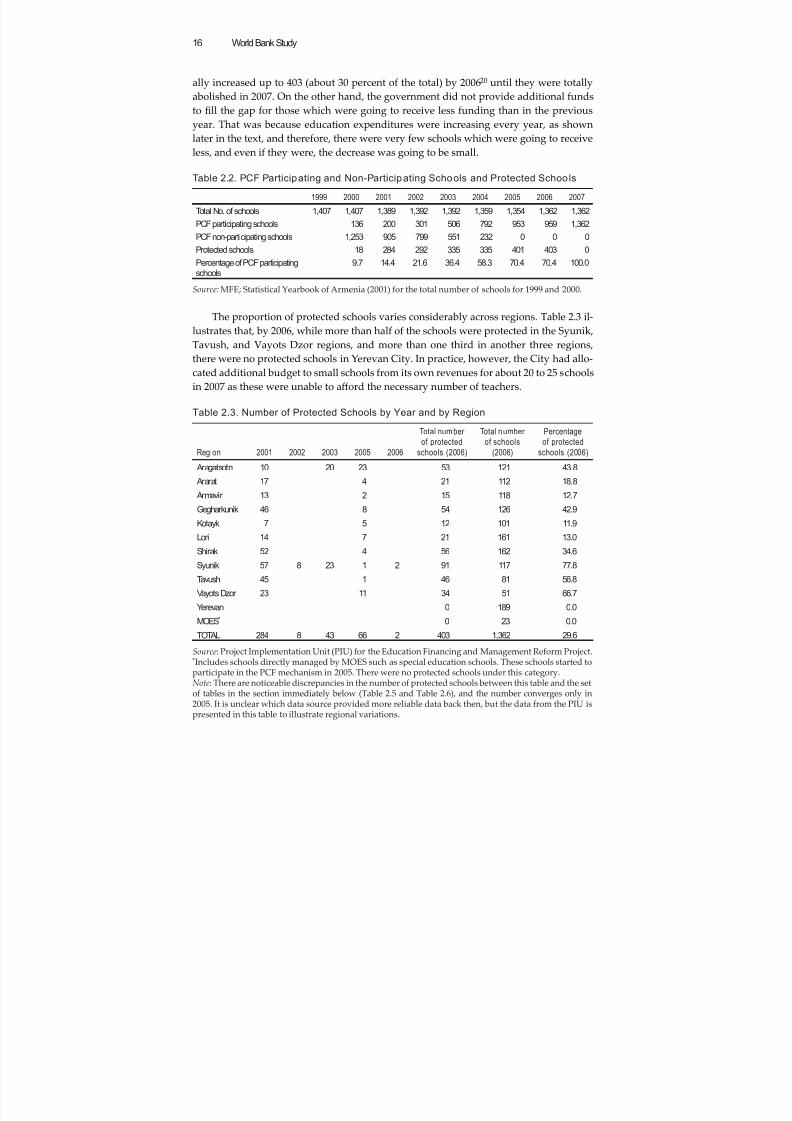
8/6/2019 Reforming Education Finance in Transition Countries
http://slidepdf.com/reader/full/reforming-education-finance-in-transition-countries 40/335
World Bank Study16
ally increased up to 403 (about 30 percent of the total) by 200620 until they were totally
abolished in 2007. On the other hand, the government did not provide additional funds
to fill the gap for those which were going to receive less funding than in the previous
year. That was because education expenditures were increasing every year, as shown
later in the text, and therefore, there were very few schools which were going to receiveless, and even if they were, the decrease was going to be small.
Table 2.2. PCF Participating and Non-Participating Schools and Protected Schools
1999 2000 2001 2002 2003 2004 2005 2006 2007
Total No. of schools 1,407 1,407 1,389 1,392 1,392 1,359 1,354 1,362 1,362
PCF participating schools 136 200 301 506 792 953 959 1,362
PCF non-participating schools 1,253 905 799 551 232 0 0 0
Protected schools 18 284 292 335 335 401 403 0
Percentage of PCF participating
schools
9.7 14.4 21.6 36.4 58.3 70.4 70.4 100.0
Source: MFE; Statistical Yearbook of Armenia (2001) for the total number of schools for 1999 and 2000.
The proportion of protected schools varies considerably across regions. Table 2.3 il-
lustrates that, by 2006, while more than half of the schools were protected in the Syunik,
Tavush, and Vayots Dzor regions, and more than one third in another three regions,
there were no protected schools in Yerevan City. In practice, however, the City had allo-
cated additional budget to small schools from its own revenues for about 20 to 25 schools
in 2007 as these were unable to aff ord the necessary number of teachers.
Table 2.3. Number of Protected Schools by Year and by Region
Region 2001 2002 2003 2005 2006
Total number
of protected
schools (2006)
Total number
of schools
(2006)
Percentage
of protected
schools (2006)
Aragatsotn 10 20 23 53 121 43.8
Ararat 17 4 21 112 18.8
Armavir 13 2 15 118 12.7
Gegharkunik 46 8 54 126 42.9
Kotayk 7 5 12 101 11.9
Lori 14 7 21 161 13.0
Shirak 52 4 56 162 34.6
Syunik 57 8 23 1 2 91 117 77.8
Tavush 45 1 46 81 56.8
Vayots Dzor 23 11 34 51 66.7
Yerevan 0 189 0.0
MOES* 0 23 0.0
TOTAL 284 8 43 66 2 403 1,362 29.6
Source: Project Implementation Unit (PIU) for the Education Financing and Management Reform Project.*Includes schools directly managed by MOES such as special education schools. These schools started toparticipate in the PCF mechanism in 2005. There were no protected schools under this category.
Note: There are noticeable discrepancies in the number of protected schools between this table and the setof tables in the section immediately below (Table 2.5 and Table 2.6), and the number converges only in2005. It is unclear which data source provided more reliable data back then, but the data from the PIU ispresented in this table to illustrate regional variations.
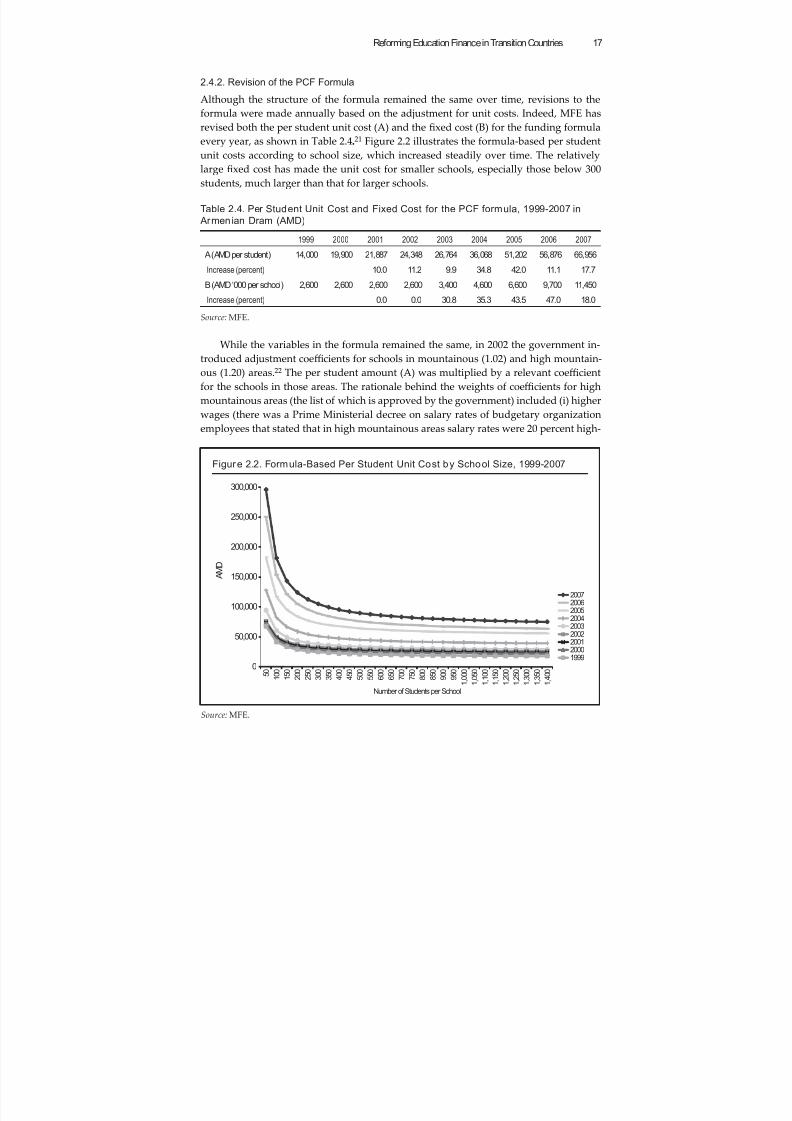
8/6/2019 Reforming Education Finance in Transition Countries
http://slidepdf.com/reader/full/reforming-education-finance-in-transition-countries 41/335
Reforming Education Finance in Transition Countries 17
2.4.2. Revision of the PCF Formula
Although the structure of the formula remained the same over time, revisions to the
formula were made annually based on the adjustment for unit costs. Indeed, MFE has
revised both the per student unit cost (A) and the fixed cost (B) for the funding formula
every year, as shown in Table 2.4.
21 Figure 2.2 illustrates the formula-based per student
unit costs according to school size, which increased steadily over time. The relatively
large fixed cost has made the unit cost for smaller schools, especially those below 300
students, much larger than that for larger schools.
Table 2.4. Per Student Unit Cost and Fixed Cost for the PCF formula, 1999-2007 in
Armenian Dram (AMD)
1999 2000 2001 2002 2003 2004 2005 2006 2007
A (AMD per student) 14,000 19,900 21,887 24,348 26,764 36,068 51,202 56,876 66,956
Increase (percent) 10.0 11.2 9.9 34.8 42.0 11.1 17.7B (AMD ‘000 per school) 2,600 2,600 2,600 2,600 3,400 4,600 6,600 9,700 11,450
Increase (percent) 0.0 0.0 30.8 35.3 43.5 47.0 18.0
Source: MFE.
While the variables in the formula remained the same, in 2002 the government in-
troduced adjustment coeffi cients for schools in mountainous (1.02) and high mountain-
ous (1.20) areas.22 The per student amount (A) was multiplied by a relevant coeffi cient
for the schools in those areas. The rationale behind the weights of coeffi cients for high
mountainous areas (the list of which is approved by the government) included (i) higher
wages (there was a Prime Ministerial decree on salary rates of budgetary organizationemployees that stated that in high mountainous areas salary rates were 20 percent high-
Figure 2.2. Formula-Based Per Student Unit Cost by School Size, 1999-2007
Source: MFE.
0
50,000
100,000
150,000
200,000
250,000
300,000
5 0
1 0 0
1 5 0
2 0 0
2 5 0
3 0 0
3 5 0
4 0 0
4 5 0
5 0 0
5 5 0
6 0 0
6 5 0
7 0 0
7 5 0
8 0 0
8 5 0
9 0 0
9 5 0
1 , 0
0 0
1 , 0
5 0
1 , 1
0 0
1 , 1
5 0
1 , 2
0 0
1 , 2
5 0
1 , 3
0 0
1 , 3
5 0
1 , 4
0 0
A M D
Number of Students per School
200720062005200420032002200120001999
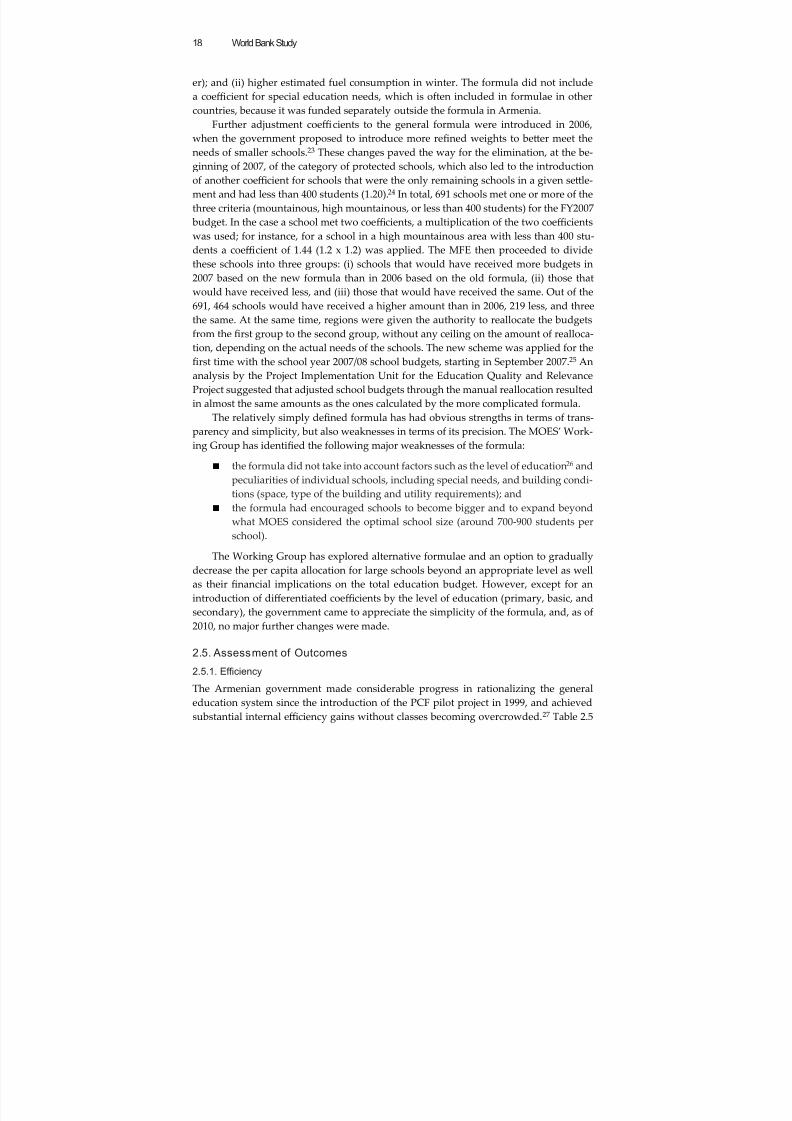
8/6/2019 Reforming Education Finance in Transition Countries
http://slidepdf.com/reader/full/reforming-education-finance-in-transition-countries 42/335
World Bank Study18
er); and (ii) higher estimated fuel consumption in winter. The formula did not include
a coeffi cient for special education needs, which is often included in formulae in other
countries, because it was funded separately outside the formula in Armenia.
Further adjustment coeffi cients to the general formula were introduced in 2006,
when the government proposed to introduce more refined weights to beer meet theneeds of smaller schools.23 These changes paved the way for the elimination, at the be-
ginning of 2007, of the category of protected schools, which also led to the introduction
of another coeffi cient for schools that were the only remaining schools in a given sele-
ment and had less than 400 students (1.20).24 In total, 691 schools met one or more of the
three criteria (mountainous, high mountainous, or less than 400 students) for the FY2007
budget. In the case a school met two coeffi cients, a multiplication of the two coeffi cients
was used; for instance, for a school in a high mountainous area with less than 400 stu-
dents a coeffi cient of 1.44 (1.2 x 1.2) was applied. The MFE then proceeded to divide
these schools into three groups: (i) schools that would have received more budgets in
2007 based on the new formula than in 2006 based on the old formula, (ii) those that
would have received less, and (iii) those that would have received the same. Out of the
691, 464 schools would have received a higher amount than in 2006, 219 less, and three
the same. At the same time, regions were given the authority to reallocate the budgets
from the first group to the second group, without any ceiling on the amount of realloca-
tion, depending on the actual needs of the schools. The new scheme was applied for the
first time with the school year 2007/08 school budgets, starting in September 2007.25 An
analysis by the Project Implementation Unit for the Education Quality and Relevance
Project suggested that adjusted school budgets through the manual reallocation resulted
in almost the same amounts as the ones calculated by the more complicated formula.
The relatively simply defined formula has had obvious strengths in terms of trans-
parency and simplicity, but also weaknesses in terms of its precision. The MOES’ Work-
ing Group has identified the following major weaknesses of the formula:
■ the formula did not take into account factors such as the level of education26 and
peculiarities of individual schools, including special needs, and building condi-
tions (space, type of the building and utility requirements); and
■ the formula had encouraged schools to become bigger and to expand beyond
what MOES considered the optimal school size (around 700-900 students per
school).
The Working Group has explored alternative formulae and an option to gradually
decrease the per capita allocation for large schools beyond an appropriate level as well
as their financial implications on the total education budget. However, except for an
introduction of diff erentiated coeffi cients by the level of education (primary, basic, and
secondary), the government came to appreciate the simplicity of the formula, and, as of
2010, no major further changes were made.
2.5. Assessment of Outcomes
2.5.1. Ef ficiency
The Armenian government made considerable progress in rationalizing the generaleducation system since the introduction of the PCF pilot project in 1999, and achieved
substantial internal effi ciency gains without classes becoming overcrowded.27 Table 2.5
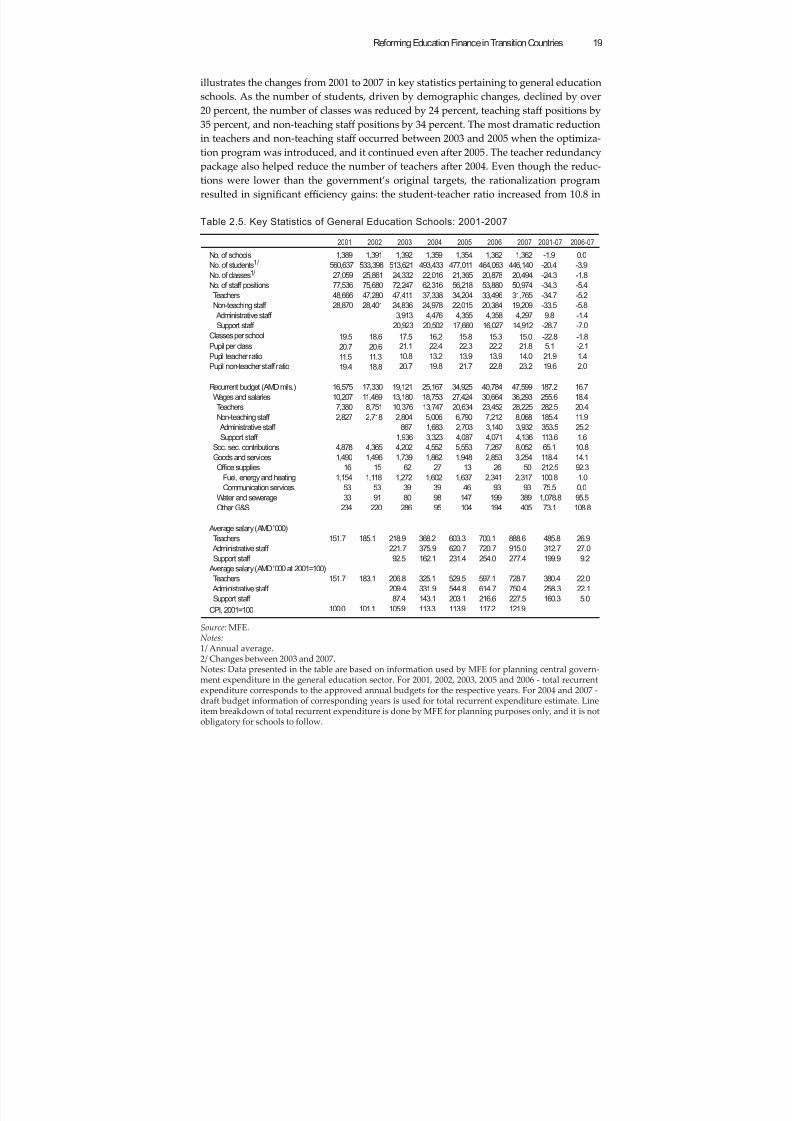
8/6/2019 Reforming Education Finance in Transition Countries
http://slidepdf.com/reader/full/reforming-education-finance-in-transition-countries 43/335
Reforming Education Finance in Transition Countries 19
illustrates the changes from 2001 to 2007 in key statistics pertaining to general education
schools. As the number of students, driven by demographic changes, declined by over
20 percent, the number of classes was reduced by 24 percent, teaching staff positions by
35 percent, and non-teaching staff positions by 34 percent. The most dramatic reduction
in teachers and non-teaching staff occurred between 2003 and 2005 when the optimiza-tion program was introduced, and it continued even after 2005. The teacher redundancy
package also helped reduce the number of teachers after 2004. Even though the reduc-
tions were lower than the government’s original targets, the rationalization program
resulted in significant effi ciency gains: the student-teacher ratio increased from 10.8 in
2001 2002 2003 2004 2005 2006 2007 2001-07 2006-07
No. of schools 1,389 1,391 1,392 1,359 1,354 1,362 1,362 -1.9 0.0
No. of students1/ 560,637 533,398 513,621 493,433 477,011 464,063 446,140 -20.4 -3.9
No. of classes1/ 27,059 25,861 24,332 22,016 21,365 20,878 20,494 -24.3 -1.8No. of staff positions 77,536 75,680 72,247 62,316 56,218 53,880 50,974 -34.3 -5.4
Teachers 48,666 47,280 47,411 37,338 34,204 33,496 31,765 -34.7 -5.2
Non-teaching staff 28,870 28,401 24,836 24,978 22,015 20,384 19,209 -33.5 -5.8
Administrative staff 3,913 4,476 4,355 4,358 4,297 9.8 -1.4
Support staff 20,923 20,502 17,660 16,027 14,912 -28.7 -7.0
Classes per school 19.5 18.6 17.5 16.2 15.8 15.3 15.0 -22.8 -1.8Pupil per class 20.7 20.6 21.1 22.4 22.3 22.2 21.8 5.1 -2.1
Pupil teacher ratio 11.5 11.3 10.8 13.2 13.9 13.9 14.0 21.9 1.4
Pupil non-teacher staff ratio 19.4 18.8 20.7 19.8 21.7 22.8 23.2 19.6 2.0
Recurrent budget (AMD mils.) 16,575 17,330 19,121 25,167 34,925 40,784 47,599 187.2 16.7
Wages and salaries 10,207 11,469 13,180 18,753 27,424 30,664 36,293 255.6 18.4
Teachers 7,380 8,751 10,376 13,747 20,634 23,452 28,225 282.5 20.4
Non-teaching staff 2,827 2,718 2,804 5,006 6,790 7,212 8,068 185.4 11.9
Administrative staff 867 1,683 2,703 3,140 3,932 353.5 25.2
Support staff 1,936 3,323 4,087 4,071 4,136 113.6 1.6
Soc. sec. contributions 4,878 4,365 4,202 4,552 5,553 7,267 8,052 65.1 10.8
Goods and services 1,490 1,496 1,739 1,862 1,948 2,853 3,254 118.4 14.1
Office supplies 16 15 62 27 13 26 50 212.5 92.3
Fuel, energy and heating 1,154 1,118 1,272 1,602 1,637 2,341 2,317 100.8 -1.0
Communication services 53 53 39 39 46 93 93 75.5 0.0
Water and sewerage 33 91 80 98 147 199 389 1,078.8 95.5
Other G&S 234 220 286 95 104 194 405 73.1 108.8
Average salary (AMD '000)
Teachers 151.7 185.1 218.9 368.2 603.3 700.1 888.6 485.8 26.9
Administrative staff 221.7 375.9 620.7 720.7 915.0 312.7 27.0Support staff 92.5 162.1 231.4 254.0 277.4 199.9 9.2
Average salary (AMD '000 at 2001=100)
Teachers 151.7 183.1 206.8 325.1 529.5 597.1 728.7 380.4 22.0
Administrative staff 209.4 331.9 544.8 614.7 750.4 258.3 22.1
Support staff 87.4 143.1 203.1 216.6 227.5 160.3 5.0
CPI, 2001=100 100.0 101.1 105.9 113.3 113.9 117.2 121.9
Source: MFE.Notes:1/ Annual average.2/ Changes between 2003 and 2007.Notes: Data presented in the table are based on information used by MFE for planning central govern-ment expenditure in the general education sector. For 2001, 2002, 2003, 2005 and 2006 - total recurrentexpenditure corresponds to the approved annual budgets for the respective years. For 2004 and 2007 -draft budget information of corresponding years is used for total recurrent expenditure estimate. Lineitem breakdown of total recurrent expenditure is done by MFE for planning purposes only, and it is notobligatory for schools to follow.
Table 2.5. Key Statistics of General Education Schools: 2001-2007
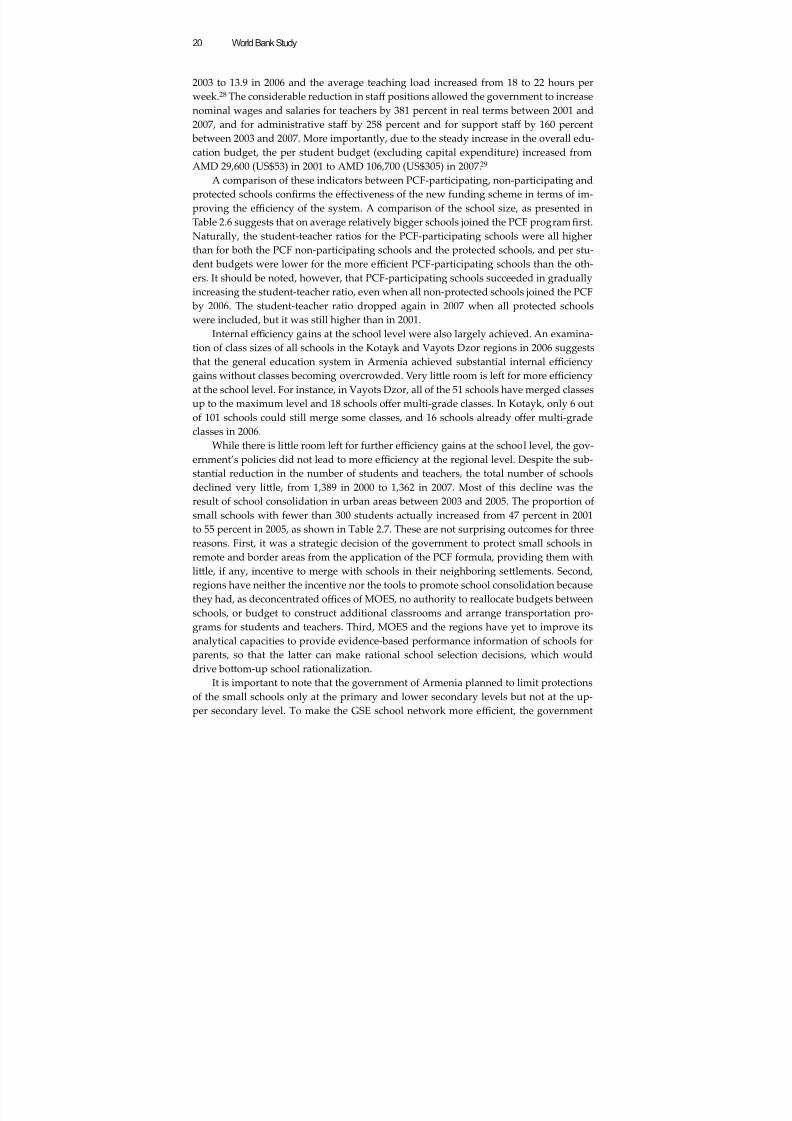
8/6/2019 Reforming Education Finance in Transition Countries
http://slidepdf.com/reader/full/reforming-education-finance-in-transition-countries 44/335
World Bank Study20
2003 to 13.9 in 2006 and the average teaching load increased from 18 to 22 hours per
week.28 The considerable reduction in staff positions allowed the government to increase
nominal wages and salaries for teachers by 381 percent in real terms between 2001 and
2007, and for administrative staff by 258 percent and for support staff by 160 percent
between 2003 and 2007. More importantly, due to the steady increase in the overall edu-cation budget, the per student budget (excluding capital expenditure) increased from
AMD 29,600 (US$53) in 2001 to AMD 106,700 (US$305) in 2007.29
A comparison of these indicators between PCF-participating, non-participating and
protected schools confirms the eff ectiveness of the new funding scheme in terms of im-
proving the effi ciency of the system. A comparison of the school size, as presented in
Table 2.6 suggests that on average relatively bigger schools joined the PCF programfirst.
Naturally, the student-teacher ratios for the PCF-participating schools were all higher
than for both the PCF non-participating schools and the protected schools, and per stu-
dent budgets were lower for the more effi cient PCF-participating schools than the oth-
ers. It should be noted, however, that PCF-participating schools succeeded in gradually
increasing the student-teacher ratio, even when all non-protected schools joined the PCF
by 2006. The student-teacher ratio dropped again in 2007 when all protected schools
were included, but it was still higher than in 2001.
Internal effi ciency gains at the school level were also largely achieved. An examina-
tion of class sizes of all schools in the Kotayk and Vayots Dzor regions in 2006 suggests
that the general education system in Armenia achieved substantial internal effi ciency
gains without classes becoming overcrowded. Very lile room is left for more effi ciency
at the school level. For instance, in Vayots Dzor, all of the 51 schools have merged classes
up to the maximum level and 18 schools off er multi-grade classes. In Kotayk, only 6 out
of 101 schools could still merge some classes, and 16 schools already off er multi-grade
classes in 2006.
While there is lile room left for further effi ciency gains at the school level, the gov-
ernment’s policies did not lead to more effi ciency at the regional level. Despite the sub-
stantial reduction in the number of students and teachers, the total number of schools
declined very lile, from 1,389 in 2000 to 1,362 in 2007. Most of this decline was the
result of school consolidation in urban areas between 2003 and 2005. The proportion of
small schools with fewer than 300 students actually increased from 47 percent in 2001
to 55 percent in 2005, as shown in Table 2.7. These are not surprising outcomes for three
reasons. First, it was a strategic decision of the government to protect small schools inremote and border areas from the application of the PCF formula, providing them with
lile, if any, incentive to merge with schools in their neighboring selements. Second,
regions have neither the incentive nor the tools to promote school consolidation because
they had, as deconcentrated offi ces of MOES, no authority to reallocate budgets between
schools, or budget to construct additional classrooms and arrange transportation pro-
grams for students and teachers. Third, MOES and the regions have yet to improve its
analytical capacities to provide evidence-based performance information of schools for
parents, so that the laer can make rational school selection decisions, which would
drive boom-up school rationalization.
It is important to note that the government of Armenia planned to limit protectionsof the small schools only at the primary and lower secondary levels but not at the up-
per secondary level.
To make the GSE school network more effi cient, the government
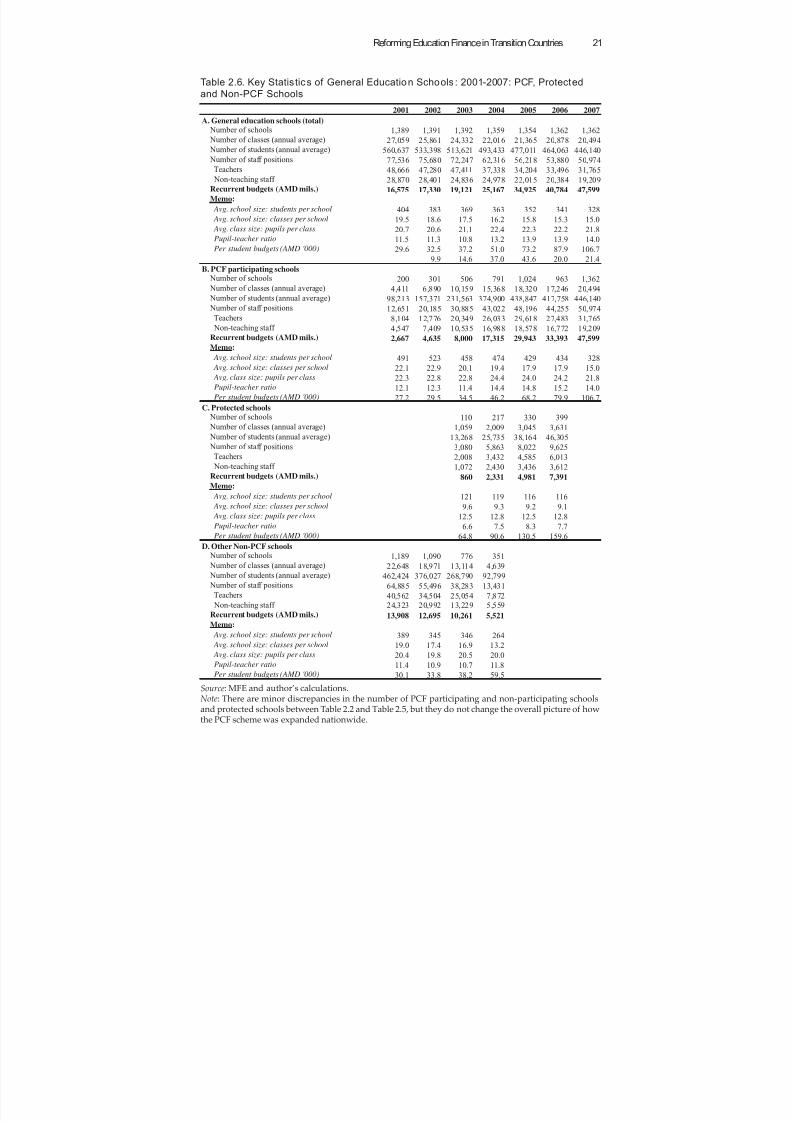
8/6/2019 Reforming Education Finance in Transition Countries
http://slidepdf.com/reader/full/reforming-education-finance-in-transition-countries 45/335
Reforming Education Finance in Transition Countries 21
2001 2002 2003 2004 2005 2006 2007
A. General education schools (total) Number of schools 1,389 1,391 1,392 1,359 1,354 1,362 1,362
Number of classes (annual average) 27,059 25,861 24,332 22,016 21,365 20,878 20,494 Number of students (annual average) 560,637 533,398 513,621 493,433 477,011 464,063 446,140 Number of staff positions 77,536 75,680 72,247 62,316 56,218 53,880 50,974 Teachers 48,666 47,280 47,411 37,338 34,204 33,496 31,765 Non-teaching staff 28,870 28,401 24,836 24,978 22,015 20,384 19,209Recurrent budgets (AMD mils.) 16,575 17,330 19,121 25,167 34,925 40,784 47,599Memo:
Avg. school size: students per school 404 383 369 363 352 341 328 Avg. school size: classes per school 19.5 18.6 17.5 16.2 15.8 15.3 15.0 Avg. class size: pupils per class 20.7 20.6 21.1 22.4 22.3 22.2 21.8 Pupil-teacher ratio 11.5 11.3 10.8 13.2 13.9 13.9 14.0 Per student budgets (AMD '000) 29.6 32.5 37.2 51.0 73.2 87.9 106.7
9.9 14.6 37.0 43.6 20.0 21.4
B. PCF participating schools Number of schools 200 301 506 791 1,024 963 1,362 Number of classes (annual average) 4,411 6,890 10,159 15,368 18,320 17,246 20,494 Number of students (annual average) 98,213 157,371 231,563 374,900 438,847 417,758 446,140 Number of staff positions 12,651 20,185 30,885 43,022 48,196 44,255 50,974 Teachers 8,104 12,776 20,349 26,033 29,618 27,483 31,765 Non-teaching staff 4,547 7,409 10,535 16,988 18,578 16,772 19,209Recurrent budgets (AMD mils.) 2,667 4,635 8,000 17,315 29,943 33,393 47,599Memo:
Avg. school size: students per school 491 523 458 474 429 434 328 Avg. school size: classes per school 22.1 22.9 20.1 19.4 17.9 17.9 15.0 Avg. class size: pupils per class 22.3 22.8 22.8 24.4 24.0 24.2 21.8 Pupil-teacher ratio 12.1 12.3 11.4 14.4 14.8 15.2 14.0 Per student budgets (AMD '000) 27.2 29.5 34.5 46.2 68.2 79.9 106.7
C. Protected schools Number of schools 110 217 330 399 Number of classes (annual average) 1,059 2,009 3,045 3,631 Number of students (annual average) 13,268 25,735 38,164 46,305 Number of staff positions 3,080 5,863 8,022 9,625 Teachers 2,008 3,432 4,585 6,013 Non-teaching staff 1,072 2,430 3,436 3,612Recurrent budgets (AMD mils.) 860 2,331 4,981 7,391Memo:
Avg. school size: students per school 121 119 116 116 Avg. school size: classes per school 9.6 9.3 9.2 9.1 Avg. class size: pupils per class 12.5 12.8 12.5 12.8 Pupil-teacher ratio 6.6 7.5 8.3 7.7 Per student budgets (AMD '000) 64.8 90.6 130.5 159.6
D. Other Non-PCF schools Number of schools 1,189 1,090 776 351 Number of classes (annual average) 22,648 18,971 13,114 4,639 Number of students (annual average) 462,424 376,027 268,790 92,799 Number of staff positions 64,885 55,496 38,283 13,431 Teachers 40,562 34,504 25,054 7,872 Non-teaching staff 24,323 20,992 13,229 5,559
Recurrent budgets (AMD mils.) 13,908 12,695 10,261 5,521Memo:
Avg. school size: students per school 389 345 346 264 Avg. school size: classes per school 19.0 17.4 16.9 13.2 Avg. class size: pupils per class 20.4 19.8 20.5 20.0 Pupil-teacher ratio 11.4 10.9 10.7 11.8 Per student budgets (AMD '000) 30.1 33.8 38.2 59.5
Table 2.6. Key Statistics of General Education Schools : 2001-2007: PCF, Protected
and Non-PCF Schools
Source: MFE and author’s calculations.Note: There are minor discrepancies in the number of PCF participating and non-participating schoolsand protected schools between Table 2.2 and Table 2.5, but they do not change the overall picture of howthe PCF scheme was expanded nationwide.
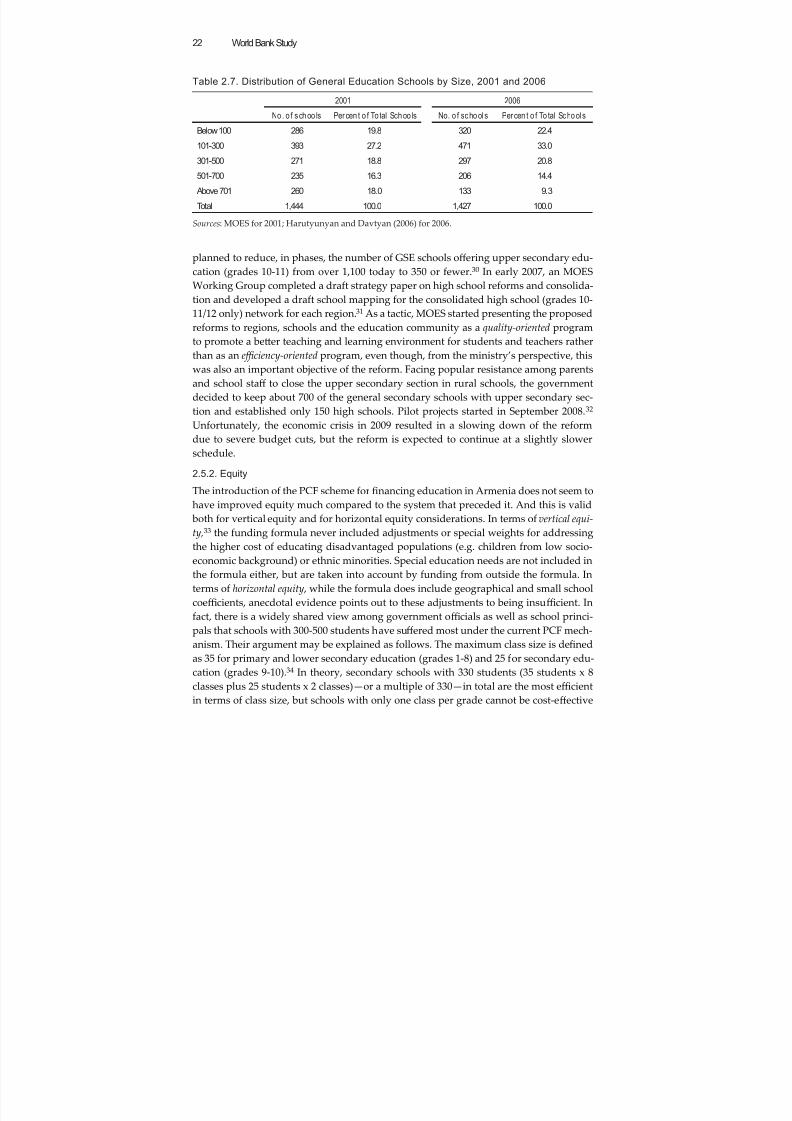
8/6/2019 Reforming Education Finance in Transition Countries
http://slidepdf.com/reader/full/reforming-education-finance-in-transition-countries 46/335
World Bank Study22
planned to reduce, in phases, the number of GSE schools off ering upper secondary edu-
cation (grades 10-11) from over 1,100 today to 350 or fewer.30
In early 2007, an MOESWorking Group completed a draft strategy paper on high school reforms and consolida-
tion and developed a draft school mapping for the consolidated high school (grades 10-
11/12 only) network for each region.31 As a tactic, MOES started presenting the proposed
reforms to regions, schools and the education community as a quality-oriented program
to promote a beer teaching and learning environment for students and teachers rather
than as an e ffi ciency-oriented program, even though, from the ministry’s perspective, this
was also an important objective of the reform. Facing popular resistance among parents
and school staff to close the upper secondary section in rural schools, the government
decided to keep about 700 of the general secondary schools with upper secondary sec-
tion and established only 150 high schools. Pilot projects started in September 2008.32 Unfortunately, the economic crisis in 2009 resulted in a slowing down of the reform
due to severe budget cuts, but the reform is expected to continue at a slightly slower
schedule.
2.5.2. Equity
The introduction of the PCF scheme for financing education in Armenia does not seem to
have improved equity much compared to the system that preceded it. And this is valid
both for vertical equity and for horizontal equity considerations. In terms of vertical equi-
ty,33 the funding formula never included adjustments or special weights for addressing
the higher cost of educating disadvantaged populations (e.g. children from low socio-economic background) or ethnic minorities. Special education needs are not included in
the formula either, but are taken into account by funding from outside the formula. In
terms of horizontal equity , while the formula does include geographical and small school
coeffi cients, anecdotal evidence points out to these adjustments to being insuffi cient. In
fact, there is a widely shared view among government offi cials as well as school princi-
pals that schools with 300-500 students have suff ered most under the current PCF mech-
anism. Their argument may be explained as follows. The maximum class size is defined
as 35 for primary and lower secondary education (grades 1-8) and 25 for secondary edu-
cation (grades 9-10).34 In theory, secondary schools with 330 students (35 students x 8
classes plus 25 students x 2 classes)—or a multiple of 330—in total are the most effi cientin terms of class size, but schools with only one class per grade cannot be cost-eff ective
Table 2.7. Distribution of General Education Schools by Size, 2001 and 2006
2001 2006
No . o f s choo ls Per cen t o f To tal Schoo ls No. o f sc hools Per cen t o f To tal Sc hools
Below 100 286 19.8 320 22.4
101-300 393 27.2 471 33.0
301-500 271 18.8 297 20.8
501-700 235 16.3 206 14.4
Above 701 260 18.0 133 9.3
Total 1,444 100.0 1,427 100.0
Sources: MOES for 2001; Harutyunyan and Davtyan (2006) for 2006.
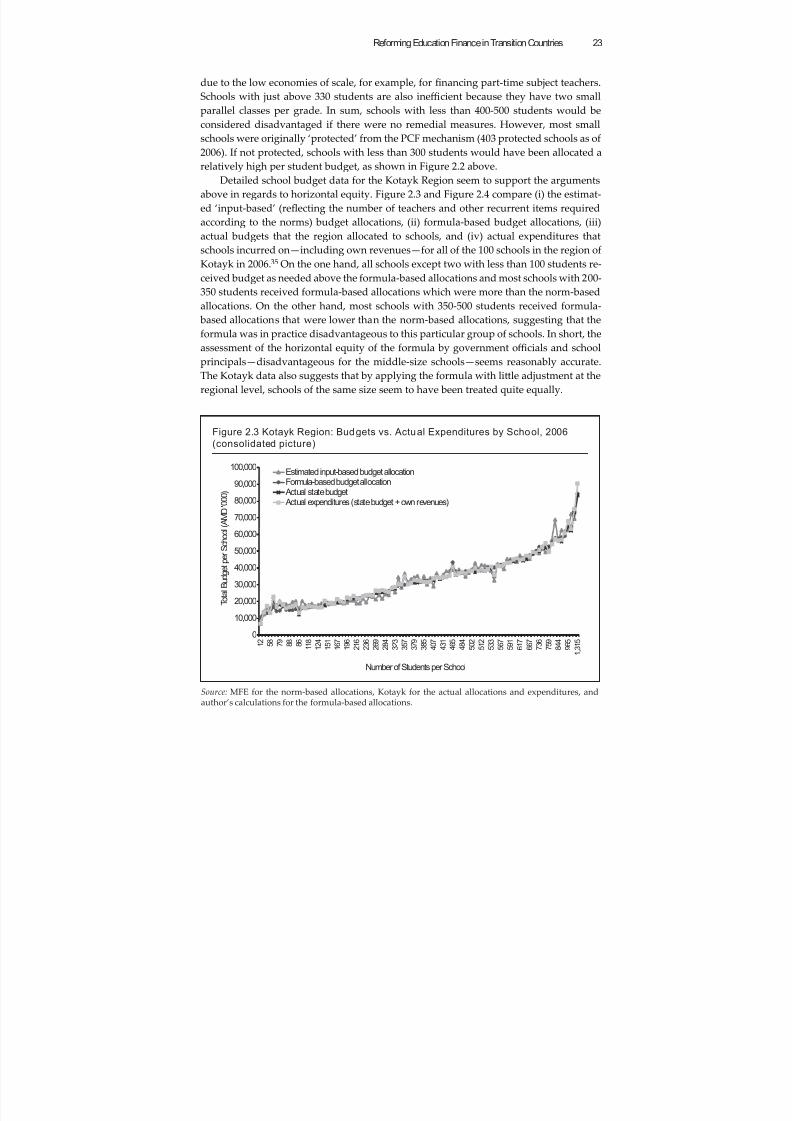
8/6/2019 Reforming Education Finance in Transition Countries
http://slidepdf.com/reader/full/reforming-education-finance-in-transition-countries 47/335
Reforming Education Finance in Transition Countries 23
due to the low economies of scale, for example, for financing part-time subject teachers.
Schools with just above 330 students are also ineffi cient because they have two small
parallel classes per grade. In sum, schools with less than 400-500 students would be
considered disadvantaged if there were no remedial measures. However, most small
schools were originally ‘protected’ from the PCF mechanism (403 protected schools as of2006). If not protected, schools with less than 300 students would have been allocated a
relatively high per student budget, as shown in Figure 2.2 above.
Detailed school budget data for the Kotayk Region seem to support the arguments
above in regards to horizontal equity. Figure 2.3 and Figure 2.4 compare (i) the estimat-
ed ‘input-based’ (reflecting the number of teachers and other recurrent items required
according to the norms) budget allocations, (ii) formula-based budget allocations, (iii)
actual budgets that the region allocated to schools, and (iv) actual expenditures that
schools incurred on—including own revenues—for all of the 100 schools in the region of
Kotayk in 2006.35 On the one hand, all schools except two with less than 100 students re-
ceived budget as needed above the formula-based allocations and most schools with 200-
350 students received formula-based allocations which were more than the norm-based
allocations. On the other hand, most schools with 350-500 students received formula-
based allocations that were lower than the norm-based allocations, suggesting that the
formula was in practice disadvantageous to this particular group of schools. In short, the
assessment of the horizontal equity of the formula by government offi cials and school
principals—disadvantageous for the middle-size schools—seems reasonably accurate.
The Kotayk data also suggests that by applying the formula with lile adjustment at the
regional level, schools of the same size seem to have been treated quite equally.
Figure 2.3 Kotayk Region: Budgets vs. Actual Expenditures by School, 2006
(consolidated picture)
Source: MFE for the norm-based allocations, Kotayk for the actual allocations and expenditures, andauthor’s calculations for the formula-based allocations.
0
10,000
20,000
30,000
40,000
50,000
60,000
70,000
80,000
90,000
100,000
1 2
5 8
7 9
8 8
8 6
1 1 8
1 2 4
1 5 1
1 6 7
1 9 6
2 1 6
2 3 6
2 6 9
2 8 4
3 2 3
3 5 7
3 7 9
3 8 5
4 0 7
4 3 1
4 6 5
4 8 4
5 0 2
5 1 2
5 3 3
5 6 7
5 9 1
6 1 7
6 6 7
7 3 6
7 5 9
8 4 4
9 6 5
1 , 3
1 5
T o t a l B u d g e t p e r S
c h o o l ( A M D ' 0 0 0 )
Number of Students per School
Estimated input-based budget allocationFormula-based budget allocation Actual state budget Actual expenditures (state budget + own revenues)
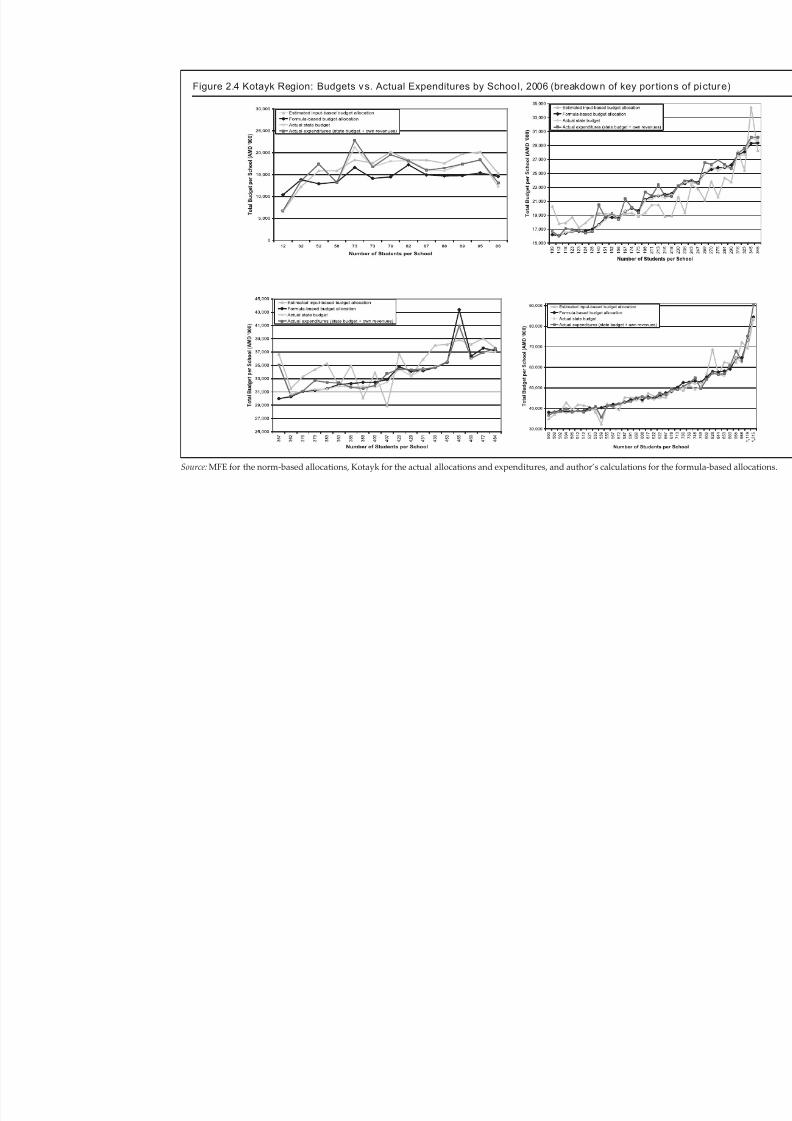
8/6/2019 Reforming Education Finance in Transition Countries
http://slidepdf.com/reader/full/reforming-education-finance-in-transition-countries 48/335
Figure 2.4 Kotayk Region: Budgets vs. Actual Expenditures by School, 2006 (breakdown of key por tion
Source: MFE for the norm-based allocations, Kotayk for the actual allocations and expenditures, and author’s calculations for the
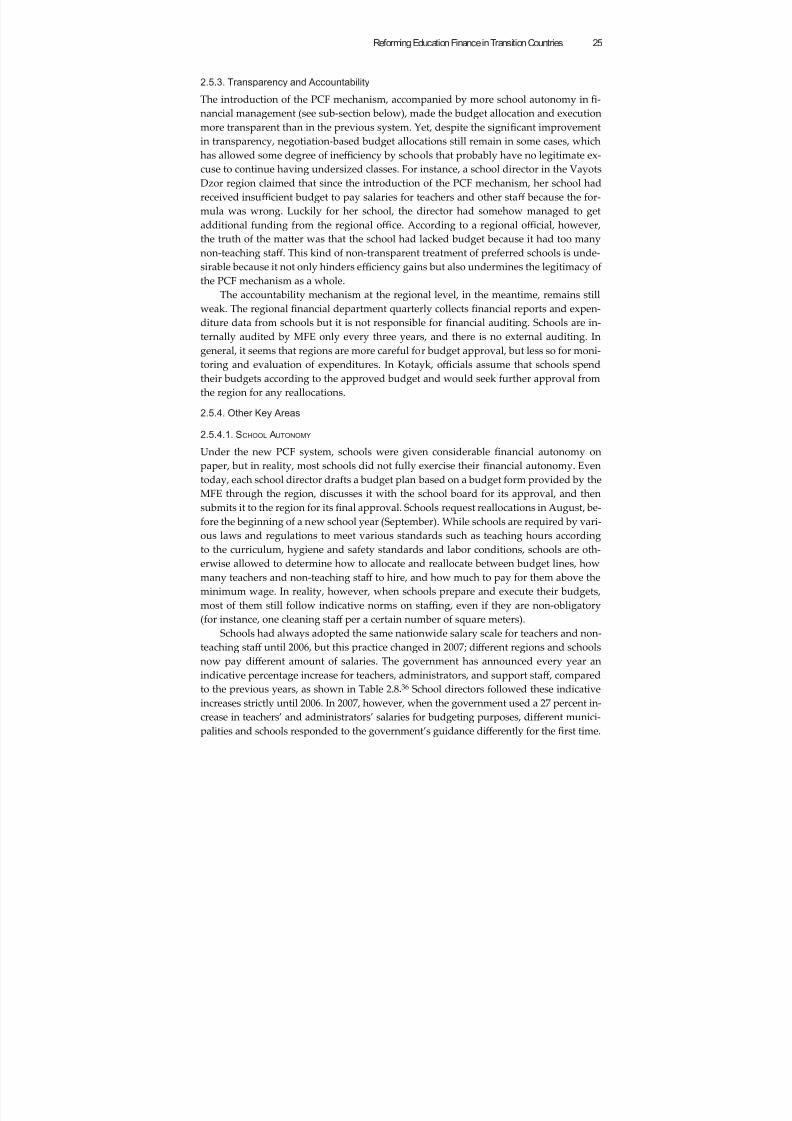
8/6/2019 Reforming Education Finance in Transition Countries
http://slidepdf.com/reader/full/reforming-education-finance-in-transition-countries 49/335
Reforming Education Finance in Transition Countries 25
2.5.3. Transparency and Accountability
The introduction of the PCF mechanism, accompanied by more school autonomy in fi-
nancial management (see sub-section below), made the budget allocation and execution
more transparent than in the previous system. Yet, despite the significant improvement
in transparency, negotiation-based budget allocations still remain in some cases, which
has allowed some degree of ineffi ciency by schools that probably have no legitimate ex-
cuse to continue having undersized classes. For instance, a school director in the Vayots
Dzor region claimed that since the introduction of the PCF mechanism, her school had
received insuffi cient budget to pay salaries for teachers and other staff because the for-
mula was wrong. Luckily for her school, the director had somehow managed to get
additional funding from the regional offi ce. According to a regional offi cial, however,
the truth of the maer was that the school had lacked budget because it had too many
non-teaching staff . This kind of non-transparent treatment of preferred schools is unde-
sirable because it not only hinders effi ciency gains but also undermines the legitimacy of
the PCF mechanism as a whole.
The accountability mechanism at the regional level, in the meantime, remains still
weak. The regional financial department quarterly collects financial reports and expen-
diture data from schools but it is not responsible for financial auditing. Schools are in-
ternally audited by MFE only every three years, and there is no external auditing. In
general, it seems that regions are more careful for budget approval, but less so for moni-
toring and evaluation of expenditures. In Kotayk, offi cials assume that schools spend
their budgets according to the approved budget and would seek further approval from
the region for any reallocations.
2.5.4. Other Key Areas
2.5.4.1. SCHOOL AUTONOMY
Under the new PCF system, schools were given considerable financial autonomy on
paper, but in reality, most schools did not fully exercise their financial autonomy.
Even
today, each school director drafts a budget plan based on a budget form provided by the
MFE through the region, discusses it with the school board for its approval, and then
submits it to the region for its final approval. Schools request reallocations in August, be-
fore the beginning of a new school year (September). While schools are required by vari-
ous laws and regulations to meet various standards such as teaching hours according
to the curriculum, hygiene and safety standards and labor conditions, schools are oth-erwise allowed to determine how to allocate and reallocate between budget lines, how
many teachers and non-teaching staff to hire, and how much to pay for them above the
minimum wage. In reality, however, when schools prepare and execute their budgets,
most of them still follow indicative norms on staffi ng, even if they are non-obligatory
(for instance, one cleaning staff per a certain number of square meters).
Schools had always adopted the same nationwide salary scale for teachers and non-
teaching staff until 2006, but this practice changed in 2007; diff erent regions and schools
now pay diff erent amount of salaries. The government has announced every year an
indicative percentage increase for teachers, administrators, and support staff , compared
to the previous years, as shown in Table 2.8.36 School directors followed these indicative
increases strictly until 2006. In 2007, however, when the government used a 27 percent in-
crease in teachers’ and administrators’ salaries for budgeting purposes, diff erent munici-
palities and schools responded to the government’s guidance diff erently for the first time.
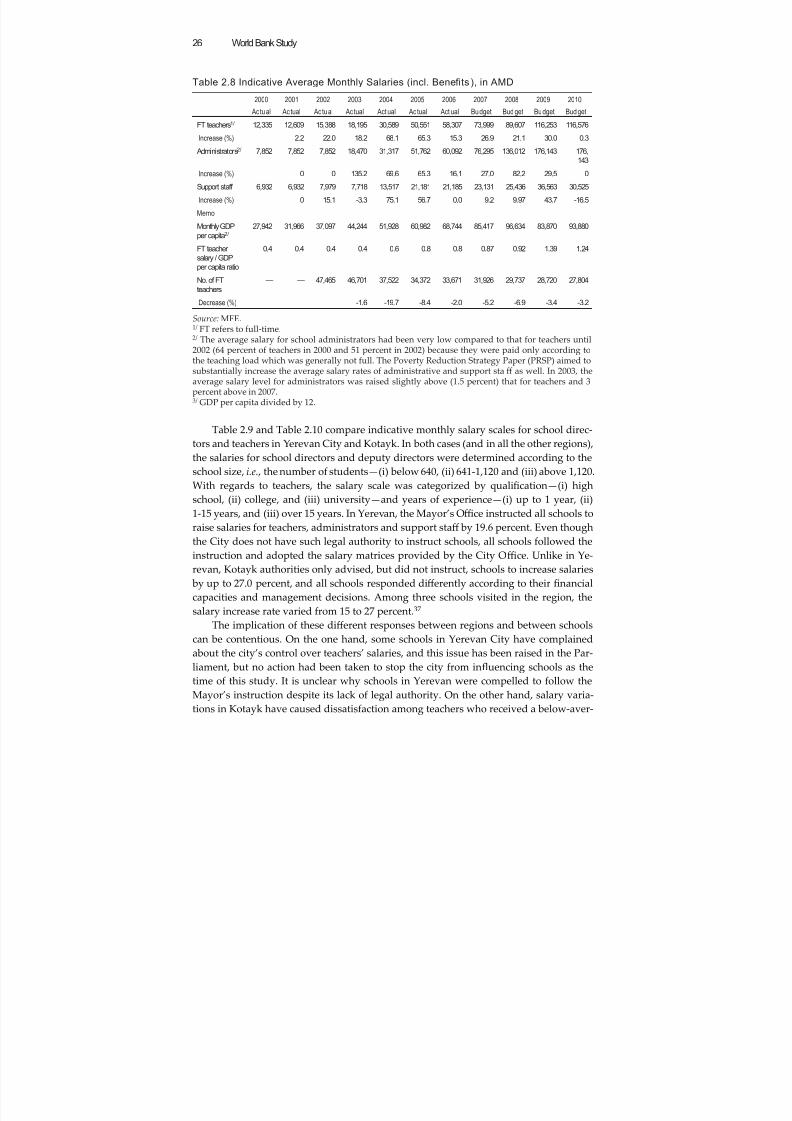
8/6/2019 Reforming Education Finance in Transition Countries
http://slidepdf.com/reader/full/reforming-education-finance-in-transition-countries 50/335
World Bank Study26
Table 2.8 Indicative Average Monthly Salaries (incl. Benefi ts ), in AMD
2000 2001 2002 2003 2004 2005 2006 2007 2008 2009 2010
Ac tual Ac tual Ac tual Ac tual Act ual Ac tual Act ual Budget Bud get Budget Bud get
FT teachers1/ 12,335 12,609 15,388 18,195 30,589 50,551 58,307 73,999 89,607 116,253 116,576
Increase (%) 2.2 22.0 18.2 68.1 65.3 15.3 26.9 21.1 30.0 0.3
Administrators2/ 7,852 7,852 7,852 18,470 31,317 51,762 60,092 76,295 136,012 176,143 176,
143
Increase (%) 0 0 135.2 69.6 65.3 16.1 27.0 82.2 29.5 0
Support staff 6,932 6,932 7,979 7,718 13,517 21,181 21,185 23,131 25,436 36,563 30,525
Increase (%) 0 15.1 -3.3 75.1 56.7 0.0 9.2 9.97 43.7 -16.5
Memo
Monthly GDP
per capita2/
27,942 31,966 37,097 44,244 51,928 60,982 68,744 85,417 96,634 83,870 93,880
FT teacher
salary / GDP
per capita ratio
0.4 0.4 0.4 0.4 0.6 0.8 0.8 0.87 0.92 1.39 1.24
No. of FT
teachers
— — 47,465 46,701 37,522 34,372 33,671 31,926 29,737 28,720 27,804
Decrease (%) -1.6 -19.7 -8.4 -2.0 -5.2 -6.9 -3.4 -3.2
Source: MFE.1/ FT refers to full-time.2/ The average salary for school administrators had been very low compared to that for teachers until2002 (64 percent of teachers in 2000 and 51 percent in 2002) because they were paid only according tothe teaching load which was generally not full. The Poverty Reduction Strategy Paper (PRSP) aimed tosubstantially increase the average salary rates of administrative and support staff as well. In 2003, theaverage salary level for administrators was raised slightly above (1.5 percent) that for teachers and 3percent above in 2007.3/ GDP per capita divided by 12.
Table 2.9 and Table 2.10 compare indicative monthly salary scales for school direc-
tors and teachers in Yerevan City and Kotayk. In both cases (and in all the other regions),
the salaries for school directors and deputy directors were determined according to the
school size, i.e. , the number of students—(i) below 640, (ii) 641-1,120 and (iii) above 1,120.
With regards to teachers, the salary scale was categorized by qualification—(i) high
school, (ii) college, and (iii) university—and years of experience—(i) up to 1 year, (ii)
1-15 years, and (iii) over 15 years. In Yerevan, the Mayor’s Offi ce instructed all schools to
raise salaries for teachers, administrators and support staff by 19.6 percent. Even though
the City does not have such legal authority to instruct schools, all schools followed the
instruction and adopted the salary matrices provided by the City Offi ce. Unlike in Ye-
revan, Kotayk authorities only advised, but did not instruct, schools to increase salaries
by up to 27.0 percent, and all schools responded diff erently according to their financial
capacities and management decisions. Among three schools visited in the region, the
salary increase rate varied from 15 to 27 percent.37
The implication of these diff erent responses between regions and between schools
can be contentious. On the one hand, some schools in Yerevan City have complained
about the city’s control over teachers’ salaries, and this issue has been raised in the Par-
liament, but no action had been taken to stop the city from influencing schools as the
time of this study. It is unclear why schools in Yerevan were compelled to follow theMayor’s instruction despite its lack of legal authority. On the other hand, salary varia-
tions in Kotayk have caused dissatisfaction among teachers who received a below-aver-
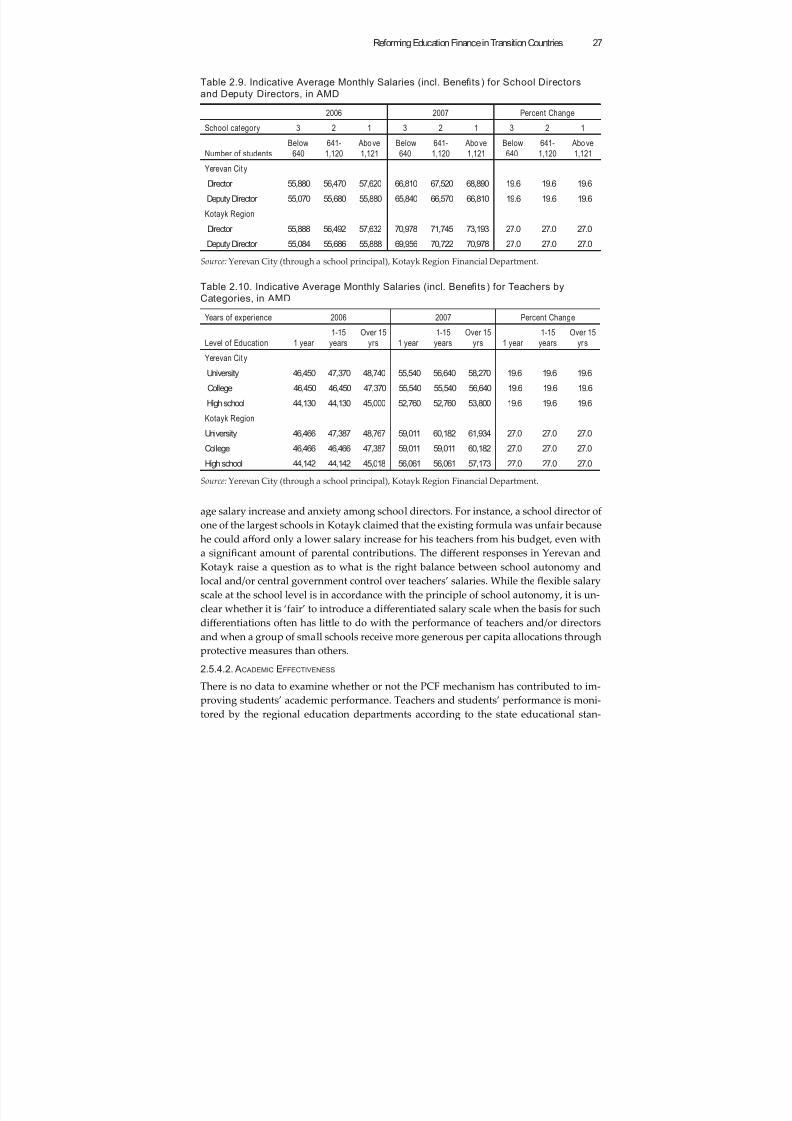
8/6/2019 Reforming Education Finance in Transition Countries
http://slidepdf.com/reader/full/reforming-education-finance-in-transition-countries 51/335
Reforming Education Finance in Transition Countries 27
age salary increase and anxiety among school directors. For instance, a school director of
one of the largest schools in Kotayk claimed that the existing formula was unfair because
he could aff ord only a lower salary increase for his teachers from his budget, even with
a significant amount of parental contributions. The diff erent responses in Yerevan and
Kotayk raise a question as to what is the right balance between school autonomy and
local and/or central government control over teachers’ salaries. While theflexible salary
scale at the school level is in accordance with the principle of school autonomy, it is un-
clear whether it is ‘fair’ to introduce a diff erentiated salary scale when the basis for such
diff erentiations often has lile to do with the performance of teachers and/or directors
and when a group of small schools receive more generous per capita allocations through
protective measures than others.
2.5.4.2. ACADEMIC EFFECTIVENESS
There is no data to examine whether or not the PCF mechanism has contributed to im-proving students’ academic performance. Teachers and students’ performance is moni-
tored by the regional education departments according to the state educational stan-
Table 2.9. Indicative Average Monthly Salaries (incl. Benefi ts ) for School Directors
and Deputy Directors, in AMD
2006 2007 Percent Change
School category 3 2 1 3 2 1 3 2 1
Number of students
Below
640
641-
1,120
Above
1,121
Below
640
641-
1,120
Above
1,121
Below
640
641-
1,120
Above
1,121
Yerevan Cit y
Director 55,880 56,470 57,620 66,810 67,520 68,890 19.6 19.6 19.6
Deputy Director 55,070 55,680 55,880 65,840 66,570 66,810 19.6 19.6 19.6
Kotayk Region
Director 55,888 56,492 57,632 70,978 71,745 73,193 27.0 27.0 27.0
Deputy Director 55,084 55,686 55,888 69,956 70,722 70,978 27.0 27.0 27.0
Source: Yerevan City (through a school principal), Kotayk Region Financial Department.
Table 2.10. Indicative Average Monthly Salaries (incl. Benefi ts ) for Teachers by
Categories, in AMD
Years of experience 2006 2007 Percent Change
Level of Education 1 year
1-15
years
Over 15
yrs 1 year
1-15
years
Over 15
yrs 1 year
1-15
years
Over 15
yrs
Yerevan Cit y
University 46,450 47,370 48,740 55,540 56,640 58,270 19.6 19.6 19.6
College 46,450 46,450 47,370 55,540 55,540 56,640 19.6 19.6 19.6
High school 44,130 44,130 45,000 52,760 52,760 53,800 19.6 19.6 19.6
Kotayk Region
University 46,466 47,387 48,767 59,011 60,182 61,934 27.0 27.0 27.0
College 46,466 46,466 47,387 59,011 59,011 60,182 27.0 27.0 27.0
High school 44,142 44,142 45,018 56,061 56,061 57,173 27.0 27.0 27.0
Source: Yerevan City (through a school principal), Kotayk Region Financial Department.
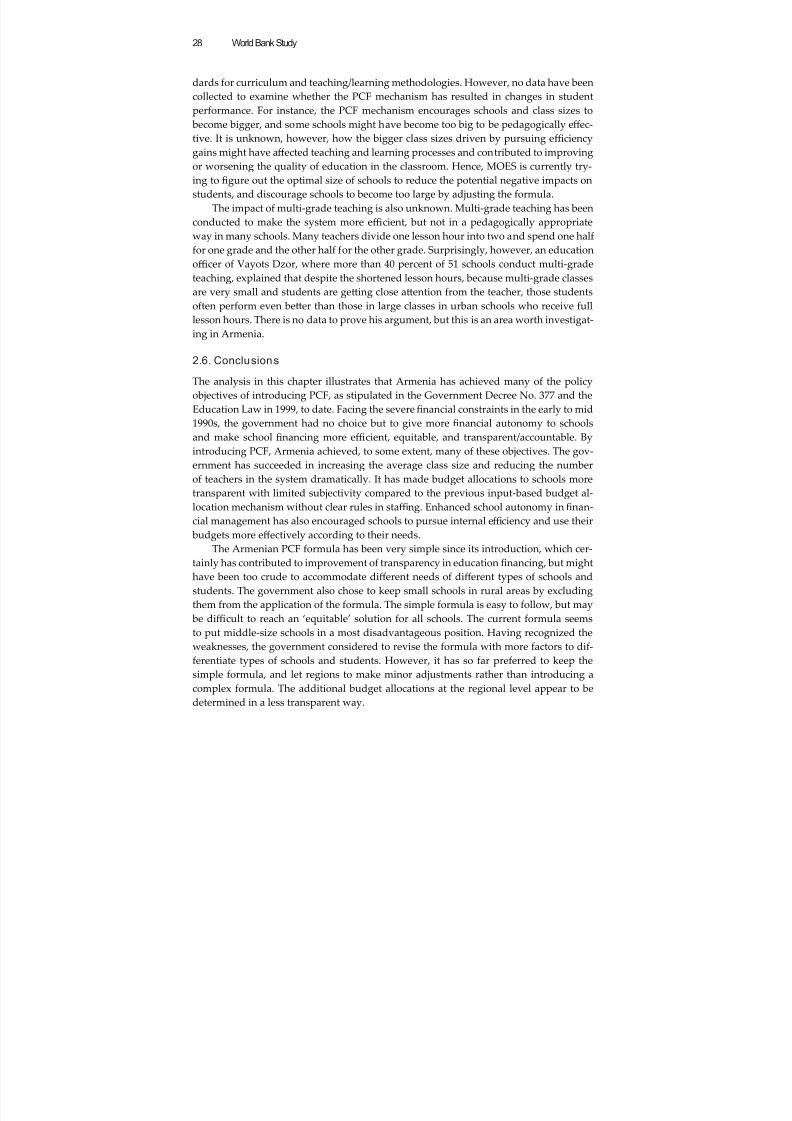
8/6/2019 Reforming Education Finance in Transition Countries
http://slidepdf.com/reader/full/reforming-education-finance-in-transition-countries 52/335
World Bank Study28
dards for curriculum and teaching/learning methodologies. However, no data have been
collected to examine whether the PCF mechanism has resulted in changes in student
performance. For instance, the PCF mechanism encourages schools and class sizes to
become bigger, and some schools might have become too big to be pedagogically eff ec-
tive. It is unknown, however, how the bigger class sizes driven by pursuing effi ciencygains might have aff ected teaching and learning processes and contributed to improving
or worsening the quality of education in the classroom. Hence, MOES is currently try-
ing to figure out the optimal size of schools to reduce the potential negative impacts on
students, and discourage schools to become too large by adjusting the formula.
The impact of multi-grade teaching is also unknown. Multi-grade teaching has been
conducted to make the system more effi cient, but not in a pedagogically appropriate
way in many schools. Many teachers divide one lesson hour into two and spend one half
for one grade and the other half for the other grade. Surprisingly, however, an education
offi cer of Vayots Dzor, where more than 40 percent of 51 schools conduct multi-grade
teaching, explained that despite the shortened lesson hours, because multi-grade classes
are very small and students are geing close aention from the teacher, those students
often perform even beer than those in large classes in urban schools who receive full
lesson hours. There is no data to prove his argument, but this is an area worth investigat-
ing in Armenia.
2.6. Conclusions
The analysis in this chapter illustrates that Armenia has achieved many of the policy
objectives of introducing PCF, as stipulated in the Government Decree No. 377 and the
Education Law in 1999, to date. Facing the severefinancial constraints in the early to mid1990s, the government had no choice but to give more financial autonomy to schools
and make school financing more effi cient, equitable, and transparent/accountable. By
introducing PCF, Armenia achieved, to some extent, many of these objectives. The gov-
ernment has succeeded in increasing the average class size and reducing the number
of teachers in the system dramatically. It has made budget allocations to schools more
transparent with limited subjectivity compared to the previous input-based budget al-
location mechanism without clear rules in staffi ng. Enhanced school autonomy in finan-
cial management has also encouraged schools to pursue internal effi ciency and use their
budgets more eff ectively according to their needs.
The Armenian PCF formula has been very simple since its introduction, which cer-tainly has contributed to improvement of transparency in education financing, but might
have been too crude to accommodate diff erent needs of diff erent types of schools and
students. The government also chose to keep small schools in rural areas by excluding
them from the application of the formula. The simple formula is easy to follow, but may
be diffi cult to reach an ‘equitable’ solution for all schools. The current formula seems
to put middle-size schools in a most disadvantageous position. Having recognized the
weaknesses, the government considered to revise the formula with more factors to dif-
ferentiate types of schools and students. However, it has so far preferred to keep the
simple formula, and let regions to make minor adjustments rather than introducing a
complex formula. The additional budget allocations at the regional level appear to bedetermined in a less transparent way.
8/6/2019 Reforming Education Finance in Transition Countries
http://slidepdf.com/reader/full/reforming-education-finance-in-transition-countries 53/335
Reforming Education Finance in Transition Countries 29
Considerable effi ciency gains have been made at the school level through class con-
solidation. Many small schools have introduced multi-grade classes, and there seems
to be lile room to merge classes. The class consolidation strategy has contributed to
improve pupil-teacher ratios while the number of students kept declining. On the other
hand, the school network rationalization at the regional level has not made much prog-ress, except for a small number of school consolidations mainly in urban areas. The gov-
ernment is fully aware of the ineffi ciency in rural areas, but it is a deliberate government
policy to maintain rural schools to assure access particularly at the basic education level.
To make the school network more effi cient, the government has started the high school
reform, but due to pressures from rural communities, the rationalization plan is still
limited. As the new high schools begin demonstrating themselves as a place for beer
opportunities for students, the government may be able to pursue further high school
network rationalization.
Schools have started enjoying more decision-making power over budget planning
and spending and human resource management, but financial autonomy is still limited.
Not only the Treasury system, but also socio-economic pressures to keep redundant
teachers and non-teaching staff have limited schools to exercise their financial autono-
my. Also, participation of the school boards is often limited to approval of the budget,
and the budget planning process may still be carried out by principals and a small num-
ber of teachers. Financial monitoring by the regional government is weak, and needs to
be strengthened to improve accountability. Diff erentiated teacher salary scales adopted
by diff erent regions and schools are in line with the principle of school autonomy, but it
raises a question in terms of fairness because the basis for such diff erentiations often has
lile to do with teachers’ performance.
Finally, the considerable achievement in school rationalization through class con-
solidation and teacher redundancy has resulted in social dissatisfaction among those
negatively aff ected by the achievements, including many teachers and non-teaching
staff who were made redundant. An offi cial of MOES explained that it was not because
the PCF was the wrong mechanism, but because the government has failed to address
these people’s needs. This suggests that any education reform needs to be closely linked
with social protection programs in order to be successfully implemented and accepted
in the long run by all elements of society.
References
Harutyunyan, K. (2002), First Project Final Report for the Education Financing and Manage-
ment Reform Project , project manuscript dated March 14, 2002, Yerevan.
Harutyunyan, K. and Davtyan, N. (2006), Education in Armenia: The Information in the
Booklet Concerns 2005-2006 School Year , Yerevan, Edit Print.
Ministry of Education and Science (1997), Strategy for Reform of the General Education Sys-
tem of the Republic of Armenia.
Monk, D. (1990), Educational Finance: An Economic Approach , Mc-Graw Hill College.
Perkins, G. and Yemtsov, R. (2001), Armenia: Restructuring to Sustain Universal General
Education , World Bank Technical Paper No. 498.
World Bank (1997), Armenia Education Financing and Management Reform Project , Staff Ap-praisal Report, Report No. 16474-AM. Washington, D.C.
8/6/2019 Reforming Education Finance in Transition Countries
http://slidepdf.com/reader/full/reforming-education-finance-in-transition-countries 54/335
World Bank Study30
World Bank (2001), Report and Recommendation of the President of the International Develop-
ment Association to the Executive Directors on a Proposed Fourth Structural Adjustment
Credit in the Amount of SDR 38.4 Million (US$50.0 Million Equivalent) to the Republic
of Armenia , Report No. P-7430-AM. Washington, DC.
World Bank (2006), “Education Quality and Relevance Project, Mid-Term Review”,Washington, DC: The World Bank.
World Bank (2008), Armenia Public Expenditure Review Education Sector , Washington, DC:
The World Bank.
Notes
1. I would like to thank Aleksan Hovhannisyan (Education Specialist, World Bank Country Offi ce
at Yerevan) for conducting the fieldwork with me in June-July 2007, and Melik Gasparyan (Con-
sultant) for kindly collecting financial and educational data. The team is also most grateful to the
offi cers of the Ministry of Education and Science, the Ministry of Economy and Finance, the Yere-
van City, the Kotayk Marz and the Vayots Dzor Marz , and the school directors for their generosityin sharing their valuable experience and providing us with statistical data. All mistakes, errors of
interpretation and judgments made are my sole responsibility.
2. World Bank (1997).
3. The term General Secondary Education (GSE) is a literal translation from a Russian expression
that prevailed from former Soviet times. GSE refers to both primary and secondary education. For
purposes of consistency with the usage in Armenian, however, the remainder of this chapter will
refer to GSE.
4. Perkins and Yemtsov (2001).
5. Between 1989 and 1995, the total population dropped by 5.5 percent from 3.45 million to 3.26
million, but it has been fairly constant since then (3.21 million in 2001 and 3.24 million in 2009). On
the other hand, the average birth rate per 1,000 females at age 15-49 sharply dropped from 48.5 in1995 to 31.7 in 2000, which started to recover throughout the 2000s up to 44.6 in 2008, which was
still lower than the level in the early 1990s (Source: National Statistical Service, Yearbooks , various
issues, hp://www.armstat.am/en/?nid=45).
6. First, in the school year (SY) 2001/02, compulsory education was extended to nine years, and
the first cohort under the new structure will complete grade 11 in SY 2011/12. As a result, there
will be neither grade 10 nor grade 11 graduates in SY 2010/11. Second, in SY 2006/07, the new Na-
tional Curriculum Framework based on a 12-year GSE cycle was introduced, consisting of primary
education (grades 1-4), lower secondary education (grades 5-9) and high school education (grades
10-12). While a half (6.5-7 years old) of grade 1 cohort in SY 2006/07 will continue in the 11-year
GSE system, the other half (6-6.5 years old) will be the first to complete the 12-year GSE cycle in
SY 2017/18.
7. GDP per capita was US$1,981 in 2006.8. World Bank (2008).
9. Harutyunyan and Davtyan (2006).
10. Ministry of Education and Science (1997).
11. Hamainks were established in 1992 after independence.
12. Source: Harutyunyan (2002) and an interview the author of this report held with the Director of
the Project Implementation Unit for the pilot project.
13. No data is available to observe the gaps.
14. The imprecise naming of the variables in the formula caused a general misunderstanding of the
principle of PCF when the scheme was first launched. This happened, to a large extent, due to the
government having called fixed variable costs as ‘maintenance costs’, even though the former were
not meant to embed just maintenance expenditures. This unfortunate misnomer generated somecontroversy among groups of schools: while large schools tended to complain that the formula
favored small schools with extremely generous budgets for maintenance, small schools claimed
that their per student unit cost was too low and that they were forced to reallocate the maintenance
8/6/2019 Reforming Education Finance in Transition Countries
http://slidepdf.com/reader/full/reforming-education-finance-in-transition-countries 55/335
Reforming Education Finance in Transition Countries 31
budget to teacher salaries. Neither of the interpretations was indeed correct and probably some of
these misinterpretations could have been avoided if the formula had been adjusted to allow for
more diff erentiations, for instance, by school size.
15. World Bank (2001), p. 18.
16. Perkins and Yemtsov (2001).
17. The First Phase of the Education Sector Reform Program was supported by the World Bank-
funded Education Quality and Relevance Project, which was approved in December of 2003 and
succeeded the 1998-2003 Education Financing and Management Reform Project, referred above. In
parallel, a set of conditionalities under a series of structural adjustment credits (SAC) and poverty
reduction support credits (PRSC) facilitated the implementation of teacher redundancy across the
country (five SACs between 1996 and 2003, and three PRSCs between 2004 and 2007).
18. NCOs are regulated under the Law of the Republic of Armenia on Non-Commercial State Organiza-
tions dated on October 23, 2001.
19. Government Decree No. 773 on Approval of the List of the Republic of Armenia General Education
Schools to be Financed Irrespective of the Number of the Pupils dated August 25, 2001.
20. The government approved the protected schools according to the reporting from each marz. It is
unclear how the number of protected schools could have increased so rapidly despite the fact thatthe criteria had not changed over time.
21. There was no defined rule (mechanism) for calculating the unit and fixed costs, and the govern-
ment revised those parameters based on the budget envelope for the general education sector. In
2006, additional regression analysis was conducted to justify changes in formula parameters.
22. As stipulated in the Government Decree No. 377 that ‘The Republic of Armenia Ministry of Fi-
nance and Economy and the Republic of Armenia Ministry of Education and Science shall diff er-
entiate the annual amount per pupil by the formula of the general education institutions involved
in the pilot project on the Republic of Armenia general education system reforms also for schools lo-
cated in high mountainous areas and schools with specialized courses at the upper secondary level.’
23. Leer of Development Policy for the World Bank’s Poverty Reduction Strategy Credit (PRSC)
II (2006).24. Government Decree No. 1262-N dated August 24, 2006 on approving the procedure of calculation
of expenditures of the state general education institutions, reallocations made in the expenditures
of state general education institutions, and canceling the Decree No. 773 of the Government of the
Republic of Armenia dated August 25, 2001. The decree also stipulated that these coeffi cients might
be revised annually.
25. The fiscal year in Armenia starts in January, but MFE makes budgetary adjustments for schools
in September to reflect changes in the number of students. MFE will use this opportunity to allow
marzes to make necessary adjustments between schools, if they deemed necessary.
26. According to the latest curriculum for SY2007/08, the weekly lesson hours are as follows: (i) Pri-
mary (Grades 1-4): G1-20; G2-23, G3-26, G4-27; (ii) Basic (Grades 5-9): G5-31, G6-30, G7-34, G8-34,
G9-36; (iii) Secondary (Grades 10-11): G10-36, G11-35.
27. The maximum class size is set at 35 for grades 1-8 and 25 for grades 9-10.28. The full-time (FT) equivalent teaching load was 21 hours until it was reduced to 18 hours in
1996. Then, it was increased to 22 hours in January 2005 (World Bank, 2006). When out-of-class
activities such as lesson preparation, marking, etc. are taken into account the teachers’ workload
may have increased up to 27 hours per week (Harutyunyan & Davtyan, 2006).
29. Using exchange rates at US$1 = AMD 555.1 in 2001 and US$1 = AMD 350 in 2007.
30. It was agreed in the mid-term review of the Education Quality and Relevance Project in October
2006 that the government would study scenarios for the consolidation of upper secondary schools
and would conduct preparatory work in order to finalize the consolidation strategy and scale it
up to the entire country, preceded by a pilot in two communities (rural/urban). This would set the
foundations for further effi ciency gains and quality improvement.
31. Under the Education Quality and Relevance Project, there were 52 school centers across thecountry, which off ered teacher training programs. These school centers were selected in such a
way that all teachers could reach one of them within one hour of travel. Hence, with a careful
planning of catchment areas, the planned consolidation of high schools would not require board-
8/6/2019 Reforming Education Finance in Transition Countries
http://slidepdf.com/reader/full/reforming-education-finance-in-transition-countries 56/335
World Bank Study32
ing facilities. At the same time, the country needed to have a limited number of specialized high
schools, for instance, for arts and talented students, which were likely to require boarding facilities.
32. Aide Memoire for the Supervision Mission for the Education Quality and Relevance Project,
April 2007.
33. Vertical equity is the ‘unequal treatment of unequals’ (Monk, 1990). In other words, it refers in
particular to providing extra funding to those students with greater learning needs who therefore
require more resources to support their learning.
34. General education is currently being gradually changed to nine years of compulsory education
and three years of higher secondary education (grades 10-12) (see footnote 6 for details), which is
not taken into account here.
35. The first series is used by the MFE for a budget estimation purpose and indicates how much
budget each school would receive if it got budgets allocated on the basis of norms such as the num-
ber of classes and teachers. The second series is calculated according to the formula, even for small
protected schools. The third and fourth are self-explanatory.
36. It should be noted, however, that these are indicative figures to estimate the total education
budget, and are not necessarily the actual average monthly salary. For instance, an average salary
for teachers in 2000 was AMD 8,000.37. It was 15, 20 and 27 percent, respectively. One of the principals mentioned that the increase was
14 percent in her neighboring school. The lowest end in the marz may have been below 14 percent,
although the highest end was probably 27 percent.
8/6/2019 Reforming Education Finance in Transition Countries
http://slidepdf.com/reader/full/reforming-education-finance-in-transition-countries 57/335
33
C H A P T E R 3
Per Capita Financing ofEducation in Estonia
Rosalind Levač ić 1
3.1. IntroductionEstonia is a small country of 1.34 million people by the Baltic Sea and bordering Russia.It first gained independence as nation in 1918 but was incorporated into the USSR afterWorld War II. It regained its independence in 1991. Since then Estonia has experiencedrapid political and economic change. The first post-independence government was liber-al, pro-market and keen to foster decentralization: it revived the pre-war municipalitiesas units of local government (Põllumäe 2002).2 For its size Estonia has a large number ofmunicipalities—227 in 2007. Although almost 70 percent of the population live in urbanmunicipalities, over eighty percent of local governments are rural. Around half of themunicipalities have less than 2000 residents, with the smallest in 2006 having only 70residents. In contrast, the average size of an urban municipality is just over 26,000, withthe largest–Tallinn–having a population of 396,000.
The structure of local government and the consequent political clout of the ruralareas is important for education because the Basic Schools and Upper Secondary Schools(BSUSS) Act (Estonian State Chancellery 1993) assigned responsibility for general edu-cation to local governments.3 The ownership of the vast majority of public schools wastransferred to municipalities which began to increase the number of schools despite therapid fall in the school age population. This Act also provided for municipality schoolsto have budgets and to be funded from both municipal and state revenues. In 1994 afirst aempt was made to introduce per capita funding of general education, though agenuine per capita formula was only implemented in 1998. This was relatively simple asit contained 6 and later 8 coeffi cients related to municipal characteristics. As the schoolpopulation continued to decline so did class and school sizes in rural areas, leadingto complaints that rural schools were not suffi ciently protected by the funding regime.Consequently, in 2008, the formula was drastically revised and its per capita elementwas disapplied to small schools in small rural municipalities which were funded insteadon the number of classes they were deemed to need. The timeline for key developmentsin the Estonian school system is shown in Table 3.1.
As the chapter will demonstrate, Estonia provides an interesting case-study of how
political pressures for maintaining small rural schools can weaken the effi
ciency incen-tives of a school funding formula. Section 3.2 of this chapter gives the historical back-ground to the Estonian general education system. The design and implementation of
8/6/2019 Reforming Education Finance in Transition Countries
http://slidepdf.com/reader/full/reforming-education-finance-in-transition-countries 58/335
World Bank Study34
the funding formula are examined in sections 3.3 and 3.4. Section 3.3.3 describes thedevelopment and evolution of school funding formula from 1994 to 2008. The municipalfunding of schools is discussed in section 3.4.1, focusing on the school funding formuladeveloped by Tallinn in section 3.4.2. Sections 3.5.1, 3.5.2 and 3.5.3 respectively assess the
impact of the previous formula (1998-2007) and new formula on effi ciency, equity andtransparency and accountability, while section 3.6 concludes with key findings.
Table 3.1. Summary of Key Events in Estonian General Education: 1989 to 2008
1989 Local-self government re-established and local democratic elections held. Over 240 municipalities created.
Counties stayed as deconcentrated units of central government ministries.
1991 Estonia left the Union of Soviet Socialist Republics (USSR) and returned to its pre World War II status as an
independent state.
1993 First Basic Schools and Upper Secondary Schools Act assigned responsibility for basic and upper secondary
education (not vocational) to municipalities and provided for schools being funded from municipal and state
budgets. State budget covers teaching costs and the municipal contribution other costs.
1994-97 A rough and ready per student division of each county’s education budgets passed on to municipal schools
1998 A genuine per student (per capita) funding formula introduced, initially with 6 weights for different types of
municipality differentiated by urban/rural, size and island location. Funding continued to be channeled to
counties which directly funded schools in the traditional way.
2001 Ministry of Finance began to pay state education grant directly to municipalities which now felt full force of per
capita funding.
2003 State grant extended to cover extra-curricular activities
2005 Capital expenditure allocations included in the state grant for education.
2007 Grant for workbooks included
2008 A new, more complex funding formula introduced after four years deliberation. Per student allocation based
on a calculation of teaching costs; small schools in municipalities with fewer than 1600 students protected by
additional allocations so that they are funded to organize smaller classes than assumed for the standard per
student amount.
3.2. Background
The costs of school provision in Estonia in the last two decades were heavily influenced by two structural features of the population. The first was the drastic decline in the num- ber of school children which has imposed severe adjustment problems for the schoolnetwork. The school age population peaked at 218,000 in 1997/98, falling 25 percent by2006/7.4 Another important feature of Estonia is that only 69 percent of the populationis ethnic Estonian. Russians5 represent 26 percent, and a large number of non-Estonianethnic groups make up the remaining five percent (Estonian Ministry of Foreign Aff airs2006). The main language of instruction in a municipal school is decided by the localcouncil.6 The requirement to provide teaching in minority languages (mainly Russian)leads to smaller school and classes and hence higher per pupil costs than if only a singlelanguage of instruction were used.
The Estonian education system (reviewed by OECD (2001)) provides 9 years of com-pulsory eduction, starting at the age of 7, with grades 10 to 12 being optional. There arethree types of public schools: primary schools catering to grades 1 to 6, basic schools for
grades 1 to 9 and secondary schools, some of which are called gymnasiums, educatingpupils from grades 1 to 12. In 2006 there were 85 primary schools, 264 basic schoolsand 236 secondary schools. Vocational schools also educate students in grades 10 to 12;their funding, however, is not considered in this chapter. There is a small private sector
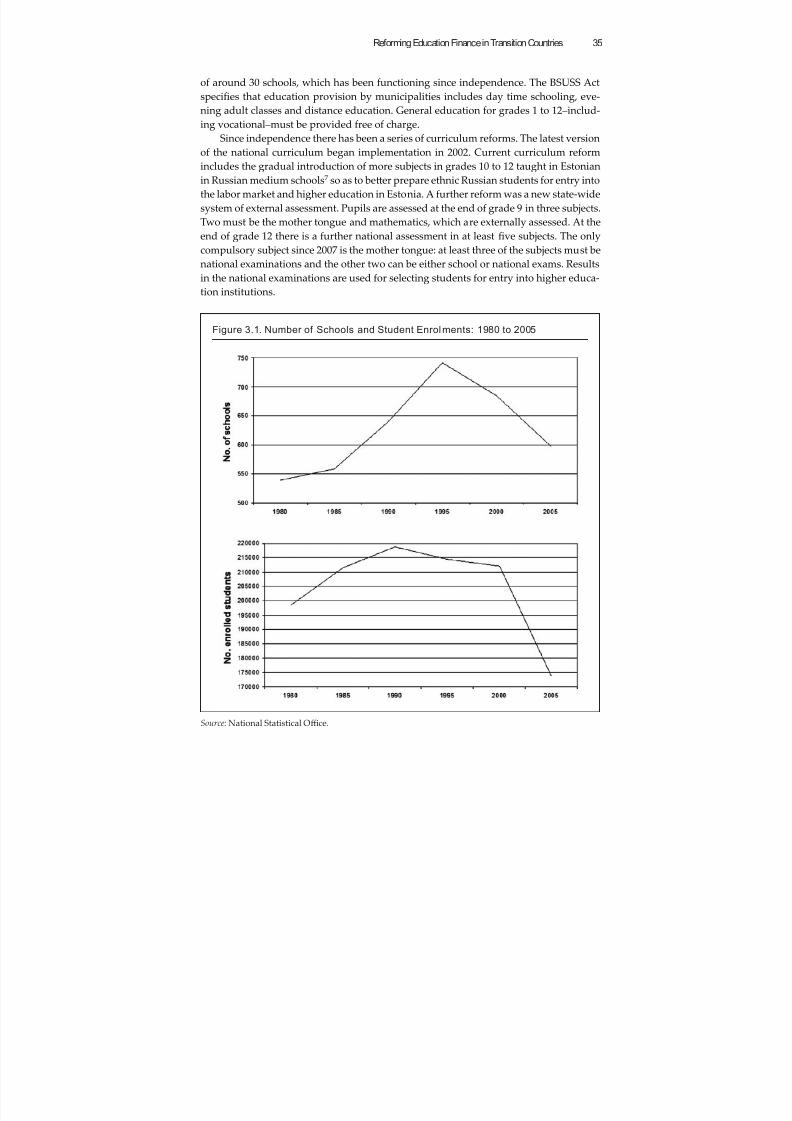
8/6/2019 Reforming Education Finance in Transition Countries
http://slidepdf.com/reader/full/reforming-education-finance-in-transition-countries 59/335
Reforming Education Finance in Transition Countries 35
of around 30 schools, which has been functioning since independence. The BSUSS Actspecifies that education provision by municipalities includes day time schooling, eve-ning adult classes and distance education. General education for grades 1 to 12–includ-ing vocational–must be provided free of charge.
Since independence there has been a series of curriculum reforms. The latest versionof the national curriculum began implementation in 2002. Current curriculum reformincludes the gradual introduction of more subjects in grades 10 to 12 taught in Estonianin Russian medium schools7 so as to beer prepare ethnic Russian students for entry intothe labor market and higher education in Estonia. A further reform was a new state-widesystem of external assessment. Pupils are assessed at the end of grade 9 in three subjects.Two must be the mother tongue and mathematics, which are externally assessed. At theend of grade 12 there is a further national assessment in at least five subjects. The onlycompulsory subject since 2007 is the mother tongue: at least three of the subjects must benational examinations and the other two can be either school or national exams. Results
in the national examinations are used for selecting students for entry into higher educa-tion institutions.
Figure 3.1. Number of Schools and Student Enrolments: 1980 to 2005
Source: National Statistical Offi ce.
8/6/2019 Reforming Education Finance in Transition Countries
http://slidepdf.com/reader/full/reforming-education-finance-in-transition-countries 60/335
World Bank Study36
Since 1993/4 the most general education is provided in municipality administeredschools. Exceptions are a a small group of 64 state’ schools, half of which were specialschools, under which remained under central government control, which also adminis-ters most of the vocational schools.8 A municipality applies for an education license to
the Ministry of Education and Research (MER) in order to establish a school, which hasto conform to the national curriculum and be at least of minimum size as specified in theAct. The municipality defines a catchment area for each school for grades 1 to 9, thoughnot all schools have catchment areas. Parents can choose an out-of-catchment schoolfor their child if there is a vacant slot. Entry at grade 1 to schools that are perceived byparents to be of high quality and that do not have catchment areas is competitive sincethese schools can select students by oral or wrien examination. The BSUSS Act statesthat local governments shall allow children with special needs to aend their catchmentarea school, and if the local school cannot provide for their needs they have the right toaend the nearest suitable school.
On acquiring their responsibilities for education, the new municipalities were keento open schools, which they were able to do with lile capital expenditure by bring-ing empty pre-World War II school buildings back into use. The rise in the number ofschools in the 1990s compared with falling student numbers is shown in Figure 3.1.Given the relative ease of opening small schools in old school buildings, the growth inschools was concentrated in primary schools, which increased from 149 to 190 from 1991to 1993 and consist of grades 1 to 6.
3.3. The Design of the Funding Formula
3.3.1. The Per Student Funding Formula for General EducationThe financing of general education has also undergone considerable reform, in particu-lar the introduction of a per student grant for education for municipalities. This sectionof the chapter outlines the introduction of the national per student funding formula, ex-amines the formula which used from 1998 to 2007 and then its replacement in 2008. Thischange represents a move away from per student funding as the new formula ensuresthat schools in small municipalities are funded a suffi cient amount to cover the teachingcosts of the number of classes that according to the formula they need. The number ofclasses needed according to the formula depends on the number of students in a gradeand on the maximum permied class size, which the government in 2008 reduced to 24
pupils in grades 1 to 9. A major reason for changing the formula was to make it easier formunicipalities to aff ord the maintenance of small rural basic schools.
3.3.2. Introduction to Formula Funding
To finance the local services for which they are responsible, municipalities—local gov-ernments—receive a share of state income tax, have their own local taxes and in additionreceive grants from the state. The requirement for the state to provide grants to own-ers of schools—both municipal and private—toward defraying the costs of educationalprovision was set out in the BSUSS Act passed in 1993. Chapter 8 of the Act states that:
1. a school shall have its own budget and may have its own bank account;2. the school budget revenue comprises allocations from the municipality bud-
get and the state budget, revenue from foundations, donations and income re-ceived from extracurricular activities provided for in the statutes of the school;
8/6/2019 Reforming Education Finance in Transition Countries
http://slidepdf.com/reader/full/reforming-education-finance-in-transition-countries 61/335
Reforming Education Finance in Transition Countries 37
3. the expenses of a municipal school shall be covered by the municipality as theowner;
4. grants for education, based on the number of students, shall be allocated to lo-cal governments from the state budget each year in accordance with the State
Budget Act in order to cover expenses related to the remuneration of teachers,related social taxes, in-service training of teachers of municipal schools and thepurchase of textbooks;9
5. the draft budget of a municipal school shall be approved by the Board of Trust-ees of the municipal school and by the local government council.
Private schools are also entitled to the same per student current funding as the munici-pal schools in the municipality in which they are located. This is regulated under thePrivate Schools Act.
The BSUSS Act therefore required a fundamental change in how the newly assigned
municipal schools were to be funded. Under the soviet system, the Ministry of Educa-tion channeled both revenue and capital funding for education to the 15 non-electedregional governments, known as counties. The counties then distributed revenue fund-ing to schools using a set of norms for calculating how many teachers were required toteach a given number of students in a grade as determined by regulations regarding thenumber of lessons per subject per grade in the national curriculum. Further norms wereused to allocate the school’s complementary staff posts (i.e. a range of posts from direc-tors, laboratory assistants to cleaners) depending on the number of classes or number ofstudents within specified ranges. Per student funding was intended to replace the ‘sovietera system of norms’ for the determination of funding to support municipal education
spending.The government in power in 1993 was led by politicians of a neo-liberal persuasion,
to whom per student funding of general education appealed for a number of reasons. Itwanted to promote competition both between public schools and between public schoolsand private schools, whose growth would be encouraged by a per student state subsidy.There was, in addition, a desire to promote internal effi ciency by inducing municipali-ties to reduce the number of schools, which had burgeoned since 1991, despite a stableor sharply decreasing–from 1998 onward–number of students of compulsory school age.From a peak of 218,000 in 1998, student numbers had plummeted to around 174,000 in2005–a 20 percent reduction. As most of the newly opened schools were primary and
basic schools, these types of school were particularly severely aff ected–numbers of chil-dren in grade 1 fell from 22,000 in 1995 to just over 12,000 in 2004 at which level it stabi-lized, though total enrolment will continue to decline till at least 2011. Thus, the fact thatstudent numbers would continue to decline was, and remains, a vital consideration indesigning the method of school funding.
The first aempt at per student funding was made in 1994.10 In order to allocate thestate budget contribution to general education, the Ministry of Education and Research(MER) took the total budget for general education for each county, which was still de-termined historically as in Soviet times, and divided it by the number of students in thecounty to derive the per student amount per county. Thus, there were 15 per student
amounts–one for each county. MER channeled the money to the counties, which con-tinued to distribute resources to schools using the Soviet era norms. This system was, ofcourse, only per student in name as nothing had really changed.
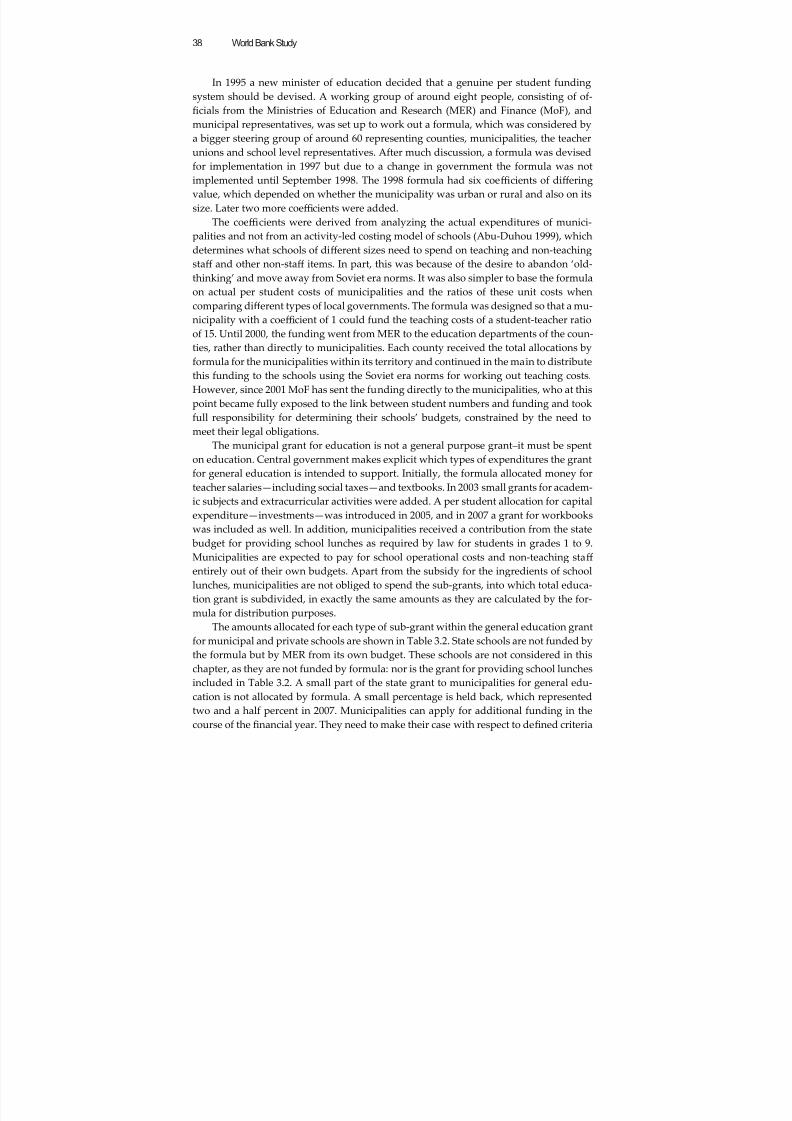
8/6/2019 Reforming Education Finance in Transition Countries
http://slidepdf.com/reader/full/reforming-education-finance-in-transition-countries 62/335
World Bank Study38
In 1995 a new minister of education decided that a genuine per student fundingsystem should be devised. A working group of around eight people, consisting of of-ficials from the Ministries of Education and Research (MER) and Finance (MoF), andmunicipal representatives, was set up to work out a formula, which was considered by
a bigger steering group of around 60 representing counties, municipalities, the teacherunions and school level representatives. After much discussion, a formula was devisedfor implementation in 1997 but due to a change in government the formula was notimplemented until September 1998. The 1998 formula had six coeffi cients of diff eringvalue, which depended on whether the municipality was urban or rural and also on itssize. Later two more coeffi cients were added.
The coeffi cients were derived from analyzing the actual expenditures of munici-palities and not from an activity-led costing model of schools (Abu-Duhou 1999), whichdetermines what schools of diff erent sizes need to spend on teaching and non-teachingstaff and other non-staff items. In part, this was because of the desire to abandon ‘old-
thinking’ and move away from Soviet era norms. It was also simpler to base the formulaon actual per student costs of municipalities and the ratios of these unit costs whencomparing diff erent types of local governments. The formula was designed so that a mu-nicipality with a coeffi cient of 1 could fund the teaching costs of a student-teacher ratioof 15. Until 2000, the funding went from MER to the education departments of the coun-ties, rather than directly to municipalities. Each county received the total allocations byformula for the municipalities within its territory and continued in the main to distributethis funding to the schools using the Soviet era norms for working out teaching costs.However, since 2001 MoF has sent the funding directly to the municipalities, who at thispoint became fully exposed to the link between student numbers and funding and tookfull responsibility for determining their schools’ budgets, constrained by the need tomeet their legal obligations.
The municipal grant for education is not a general purpose grant–it must be spenton education. Central government makes explicit which types of expenditures the grantfor general education is intended to support. Initially, the formula allocated money forteacher salaries—including social taxes—and textbooks. In 2003 small grants for academ-ic subjects and extracurricular activities were added. A per student allocation for capitalexpenditure—investments—was introduced in 2005, and in 2007 a grant for workbookswas included as well. In addition, municipalities received a contribution from the state
budget for providing school lunches as required by law for students in grades 1 to 9.Municipalities are expected to pay for school operational costs and non-teaching staff entirely out of their own budgets. Apart from the subsidy for the ingredients of schoollunches, municipalities are not obliged to spend the sub-grants, into which total educa-tion grant is subdivided, in exactly the same amounts as they are calculated by the for-mula for distribution purposes.
The amounts allocated for each type of sub-grant within the general education grantfor municipal and private schools are shown in Table 3.2. State schools are not funded bythe formula but by MER from its own budget. These schools are not considered in thischapter, as they are not funded by formula: nor is the grant for providing school lunches
included in Table 3.2. A small part of the state grant to municipalities for general edu-cation is not allocated by formula. A small percentage is held back, which representedtwo and a half percent in 2007. Municipalities can apply for additional funding in thecourse of the financial year. They need to make their case with respect to defined criteria
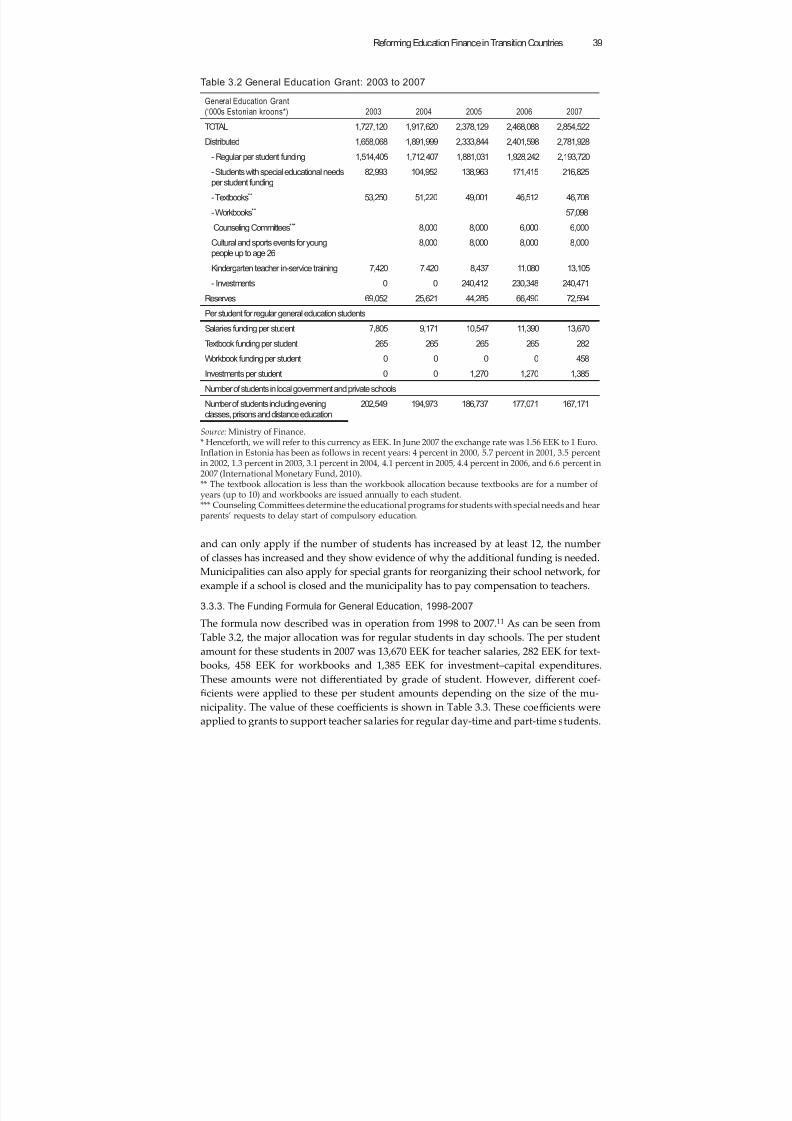
8/6/2019 Reforming Education Finance in Transition Countries
http://slidepdf.com/reader/full/reforming-education-finance-in-transition-countries 63/335
Reforming Education Finance in Transition Countries 39
and can only apply if the number of students has increased by at least 12, the numberof classes has increased and they show evidence of why the additional funding is needed.Municipalities can also apply for special grants for reorganizing their school network, forexample if a school is closed and the municipality has to pay compensation to teachers.
3.3.3. The Funding Formula for General Education, 1998-2007
The formula now described was in operation from 1998 to 2007.11 As can be seen fromTable 3.2, the major allocation was for regular students in day schools. The per studentamount for these students in 2007 was 13,670 EEK for teacher salaries, 282 EEK for text- books, 458 EEK for workbooks and 1,385 EEK for investment–capital expenditures.These amounts were not diff erentiated by grade of student. However, diff erent coef-ficients were applied to these per student amounts depending on the size of the mu-nicipality. The value of these coeffi cients is shown in Table 3.3. These coeffi cients wereapplied to grants to support teacher salaries for regular day-time and part-time students.
Table 3.2 General Education Grant: 2003 to 2007
General Education Grant
(‘000s Estonian kroons*) 2003 2004 2005 2006 2007
TOTAL 1,727,120 1,917,620 2,378,129 2,468,088 2,854,522
Distributed 1,658,068 1,891,999 2,333,844 2,401,598 2,781,928
- Regular per student funding 1,514,405 1,712,407 1,881,031 1,928,242 2,193,720
- Students with special educational needs
per student funding
82,993 104,952 138,963 171,415 216,825
- Textbooks** 53,250 51,220 49,001 46,512 46,708
- Workbooks** 57,098
Counseling Committees*** 8,000 8,000 6,000 6,000
Cultural and sports events for young
people up to age 26
8,000 8,000 8,000 8,000
Kindergarten teacher in-service training 7,420 7,420 8,437 11,080 13,105
- Investments 0 0 240,412 230,348 240,471
Reserves 69,052 25,621 44,285 66,490 72,594
Per student for regular general education students
Salaries funding per student 7,805 9,171 10,547 11,390 13,670
Textbook funding per student 265 265 265 265 282
Workbook funding per student 0 0 0 0 458
Investments per student 0 0 1,270 1,270 1,385
Number of students in local government and private schools
Number of students including evening
classes, prisons and distance education
202,549 194,973 186,737 177,071 167,171
Source: Ministry of Finance.* Henceforth, we will refer to this currency as EEK. In June 2007 the exchange rate was 1.56 EEK to 1 Euro.Inflation in Estonia has been as follows in recent years: 4 percent in 2000, 5.7 percent in 2001, 3.5 percentin 2002, 1.3 percent in 2003, 3.1 percent in 2004, 4.1 percent in 2005, 4.4 percent in 2006, and 6.6 percent in2007 (International Monetary Fund, 2010).** The textbook allocation is less than the workbook allocation because textbooks are for a number ofyears (up to 10) and workbooks are issued annually to each student.*** Counseling Commiees determine the educational programs for students with special needs and hearparents’ requests to delay start of compulsory education.
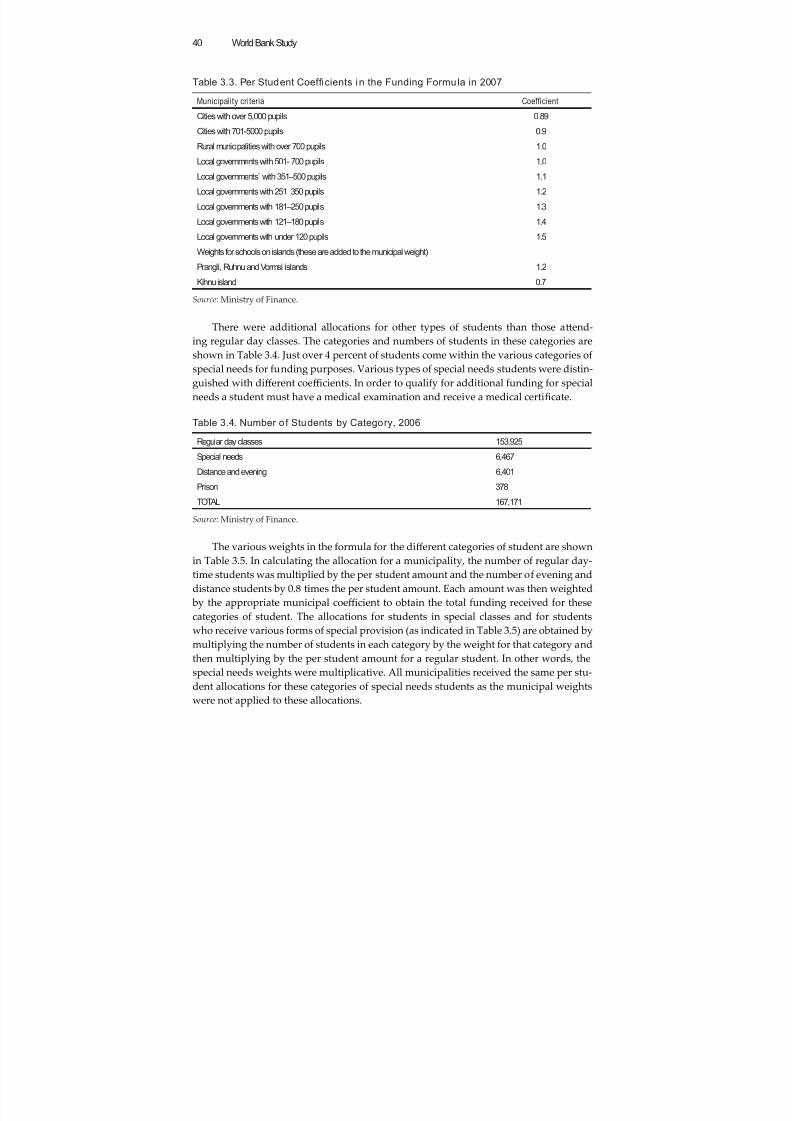
8/6/2019 Reforming Education Finance in Transition Countries
http://slidepdf.com/reader/full/reforming-education-finance-in-transition-countries 64/335
World Bank Study40
There were additional allocations for other types of students than those aend-ing regular day classes. The categories and numbers of students in these categories areshown in Table 3.4. Just over 4 percent of students come within the various categories ofspecial needs for funding purposes. Various types of special needs students were distin-guished with diff erent coeffi cients. In order to qualify for additional funding for specialneeds a student must have a medical examination and receive a medical certificate.
Table 3.4. Number o f Students by Category, 2006
Regular day classes 153,925
Special needs 6,467
Distance and evening 6,401
Prison 378
TOTAL 167,171
Source: Ministry of Finance.
The various weights in the formula for the diff erent categories of student are shownin Table 3.5. In calculating the allocation for a municipality, the number of regular day-time students was multiplied by the per student amount and the number of evening anddistance students by 0.8 times the per student amount. Each amount was then weighted by the appropriate municipal coeffi cient to obtain the total funding received for thesecategories of student. The allocations for students in special classes and for studentswho receive various forms of special provision (as indicated in Table 3.5) are obtained bymultiplying the number of students in each category by the weight for that category andthen multiplying by the per student amount for a regular student. In other words, thespecial needs weights were multiplicative. All municipalities received the same per stu-
dent allocations for these categories of special needs students as the municipal weightswere not applied to these allocations.
Table 3.3. Per Student Coef fi cients in the Funding Formula in 2007
Municipality criteria Coef ficient
Cities with over 5,000 pupils 0.89
Cities with 701-5000 pupils 0.9
Rural municipalities with over 700 pupils 1.0
Local governments with 501- 700 pupils 1.0
Local governments̀ with 351–500 pupils 1.1
Local governments with 251–350 pupils 1.2
Local governments with 181–250 pupils 1.3
Local governments with 121–180 pupils 1.4
Local governments with under 120 pupils 1.5
Weights for schools on islands (these are added to the municipal weight)
Prangli, Ruhnu and Vormsi islands 1.2
Kihnu island 0.7
Source: Ministry of Finance.
8/6/2019 Reforming Education Finance in Transition Countries
http://slidepdf.com/reader/full/reforming-education-finance-in-transition-countries 65/335
Reforming Education Finance in Transition Countries 41
The textbook allocation was calculated as the number of day-time, evening courseand prison students times the per student allocation for textbooks. Workbooks wereallocated per student for day-time students in grades 1 to 9. The municipal coeffi cientswere not applied to textbooks and workbooks. In the Setumaa region three small localgovernments received in addition to the grant determined by their municipal coeffi cienta 20 percent addition to the grant for teacher salaries, textbooks and workbooks. Localgovernments also received a compensation grant for having amalgamated with anotherlocal government in previous years, but there were few in this category.MoF shows how the grant is split into allocations for:
■ salaries and teaching aids–including in-service teacher training–calculated us-ing the above formula;■ investments (allocated per student);■ academic subjects, which are additional unweighted per student allocations;■ events and extracurricular activities, which are also an unweighted per student
amount.
The types of grant allocated within the general education grant are shown in Table3.6. General education grant in 2005 financed 36 percent of municipal spending on edu-cation, with municipalities funding 64 percent of the total, according to National Statisti-cal Offi ce.
Table 3.5. Additional Factors in the Per Student Funding Formula
Special factors 2003 2004 2005 2006 2007
Distance learning or evening courses 0.8 0.8 0.8 0.8 0.8
Prison education 1.6 1.6 1.6 1.6 1.6
Special classes
Supplementary learning class (with minor mental disorders) 1.9 1.9 2.2 2.2 2.2
Classes for children with severe and profound learning disabilities 3.5 3.5 3.8 3.8 3.8
Students with behavioral problems (including minor mental disorders) 1.6 1.6 2.2 2.2 2.2
Children with speech impairments, sensory and physical disabilities 2.3 2.3 2.6 2.6 2.6
Sanatorium school 1.2 1.2 1.2 1.2 1.2
Opportunity class (learning dif ficulties) 1.3 1.3 1.4 1.4 1.4
Students with various types of special provision
Remedial classes 0.2 0.2 0.2 0.2 0.2
Home teaching 4.4 4.4 4 4 4
Psychiatry 1.3 1.3 1.3 1.3 1.3
Hospitals 0.6 0.6 0.6 0.6 0.6
Language integration 0.2 0.2
Students learning a simplified curriculum in regular classes 0 0 0 1.2 1.2
Students learning the curriculum for those with moderate or severe
learning dif ficulties in regular classes
0 0 0 2.8 2.8
Source: Ministry of Finance.
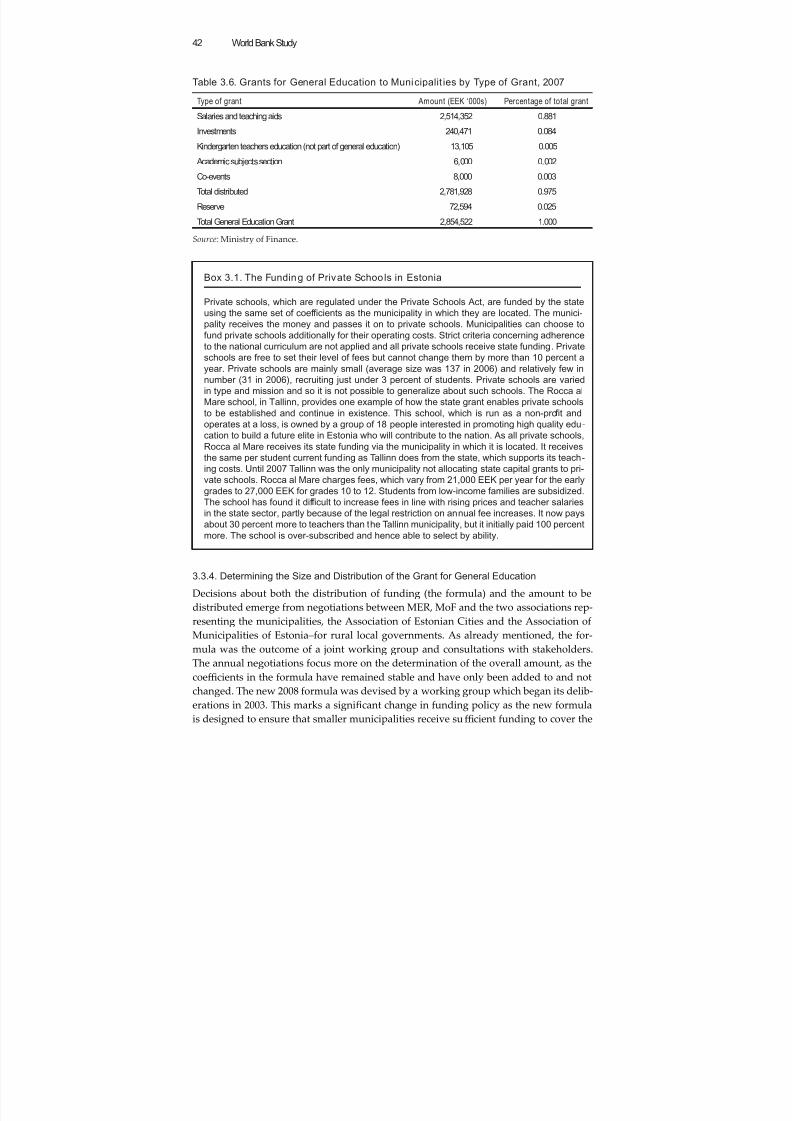
8/6/2019 Reforming Education Finance in Transition Countries
http://slidepdf.com/reader/full/reforming-education-finance-in-transition-countries 66/335
World Bank Study42
3.3.4. Determining the Size and Distribution of the Grant for General Education
Decisions about both the distribution of funding (the formula) and the amount to bedistributed emerge from negotiations between MER, MoF and the two associations rep-resenting the municipalities, the Association of Estonian Cities and the Association ofMunicipalities of Estonia–for rural local governments. As already mentioned, the for-mula was the outcome of a joint working group and consultations with stakeholders.The annual negotiations focus more on the determination of the overall amount, as thecoeffi cients in the formula have remained stable and have only been added to and notchanged. The new 2008 formula was devised by a working group which began its delib-erations in 2003. This marks a significant change in funding policy as the new formulais designed to ensure that smaller municipalities receive suffi cient funding to cover the
Table 3.6. Grants for General Education to Municipalit ies by Type of Grant, 2007
Type of grant Amount (EEK ‘000s) Percentage of total grant
Salaries and teaching aids 2,514,352 0.881
Investments 240,471 0.084
Kindergarten teachers education (not part of general education) 13,105 0.005
Academic subjects section 6,000 0.002
Co-events 8,000 0.003
Total distributed 2,781,928 0.975
Reserve 72,594 0.025
Total General Education Grant 2,854,522 1.000
Source: Ministry of Finance.
Box 3.1. The Funding of Private Schools in Estonia
Private schools, which are regulated under the Private Schools Act, are funded by the state
using the same set of coef ficients as the municipality in which they are located. The munici-
pality receives the money and passes it on to private schools. Municipalities can choose to
fund private schools additionally for their operating costs. Strict criteria concerning adherence
to the national curriculum are not applied and all private schools receive state funding. Private
schools are free to set their level of fees but cannot change them by more than 10 percent a
year. Private schools are mainly small (average size was 137 in 2006) and relatively few in
number (31 in 2006), recruiting just under 3 percent of students. Private schools are varied
in type and mission and so it is not possible to generalize about such schools. The Rocca al
Mare school, in Tallinn, provides one example of how the state grant enables private schools
to be established and continue in existence. This school, which is run as a non-profit andoperates at a loss, is owned by a group of 18 people interested in promoting high quality edu-
cation to build a future elite in Estonia who will contribute to the nation. As all private schools,
Rocca al Mare receives its state funding via the municipality in which it is located. It receives
the same per student current funding as Tallinn does from the state, which supports its teach-
ing costs. Until 2007 Tallinn was the only municipality not allocating state capital grants to pri-
vate schools. Rocca al Mare charges fees, which vary from 21,000 EEK per year for the early
grades to 27,000 EEK for grades 10 to 12. Students from low-income families are subsidized.
The school has found it dif ficult to increase fees in line with rising prices and teacher salaries
in the state sector, partly because of the legal restriction on annual fee increases. It now pays
about 30 percent more to teachers than the Tallinn municipality, but it initially paid 100 percent
more. The school is over-subscribed and hence able to select by ability.
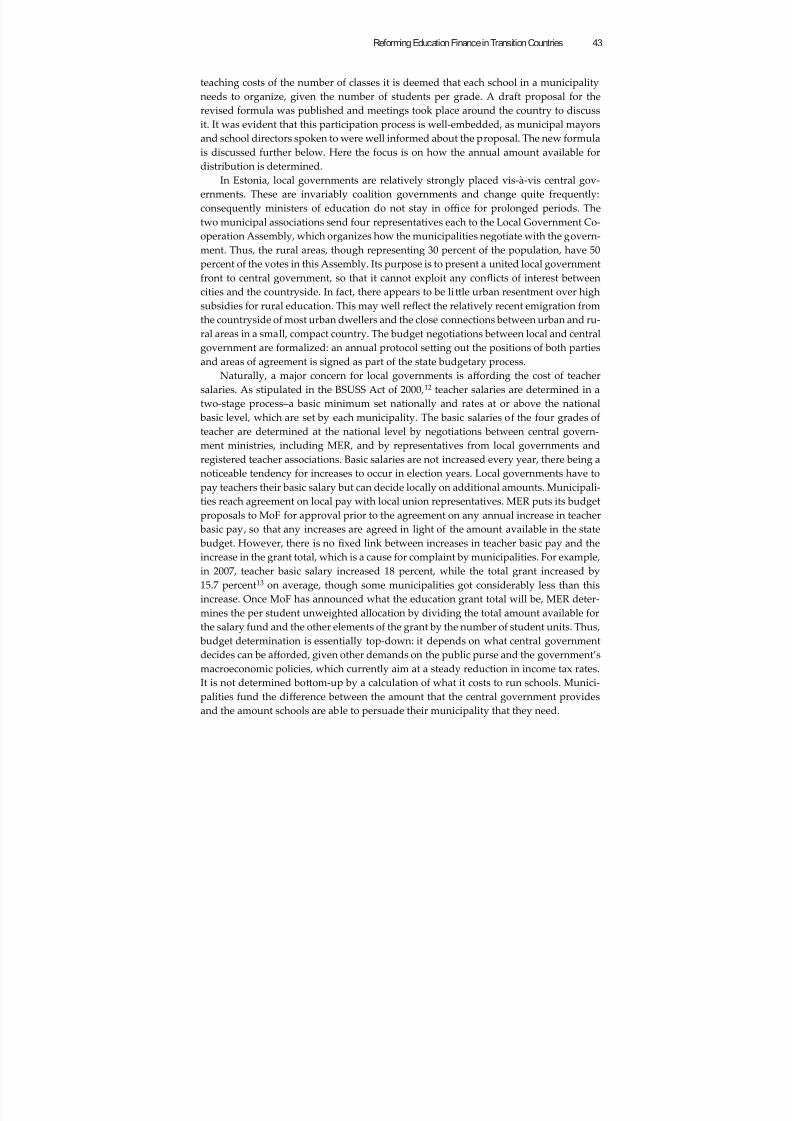
8/6/2019 Reforming Education Finance in Transition Countries
http://slidepdf.com/reader/full/reforming-education-finance-in-transition-countries 67/335
Reforming Education Finance in Transition Countries 43
teaching costs of the number of classes it is deemed that each school in a municipalityneeds to organize, given the number of students per grade. A draft proposal for therevised formula was published and meetings took place around the country to discussit. It was evident that this participation process is well-embedded, as municipal mayors
and school directors spoken to were well informed about the proposal. The new formulais discussed further below. Here the focus is on how the annual amount available fordistribution is determined.
In Estonia, local governments are relatively strongly placed vis-à-vis central gov-ernments. These are invariably coalition governments and change quite frequently:consequently ministers of education do not stay in offi ce for prolonged periods. Thetwo municipal associations send four representatives each to the Local Government Co-operation Assembly, which organizes how the municipalities negotiate with the govern-ment. Thus, the rural areas, though representing 30 percent of the population, have 50percent of the votes in this Assembly. Its purpose is to present a united local government
front to central government, so that it cannot exploit any conflicts of interest betweencities and the countryside. In fact, there appears to be lile urban resentment over highsubsidies for rural education. This may well reflect the relatively recent emigration fromthe countryside of most urban dwellers and the close connections between urban and ru-ral areas in a small, compact country. The budget negotiations between local and centralgovernment are formalized: an annual protocol seing out the positions of both partiesand areas of agreement is signed as part of the state budgetary process.
Naturally, a major concern for local governments is aff ording the cost of teachersalaries. As stipulated in the BSUSS Act of 2000,12 teacher salaries are determined in atwo-stage process–a basic minimum set nationally and rates at or above the national basic level, which are set by each municipality. The basic salaries of the four grades ofteacher are determined at the national level by negotiations between central govern-ment ministries, including MER, and by representatives from local governments andregistered teacher associations. Basic salaries are not increased every year, there being anoticeable tendency for increases to occur in election years. Local governments have topay teachers their basic salary but can decide locally on additional amounts. Municipali-ties reach agreement on local pay with local union representatives. MER puts its budgetproposals to MoF for approval prior to the agreement on any annual increase in teacher basic pay, so that any increases are agreed in light of the amount available in the state
budget. However, there is nofi
xed link between increases in teacher basic pay and theincrease in the grant total, which is a cause for complaint by municipalities. For example,in 2007, teacher basic salary increased 18 percent, while the total grant increased by15.7 percent13 on average, though some municipalities got considerably less than thisincrease. Once MoF has announced what the education grant total will be, MER deter-mines the per student unweighted allocation by dividing the total amount available forthe salary fund and the other elements of the grant by the number of student units. Thus, budget determination is essentially top-down: it depends on what central governmentdecides can be aff orded, given other demands on the public purse and the government’smacroeconomic policies, which currently aim at a steady reduction in income tax rates.
It is not determined boom-up by a calculation of what it costs to run schools. Munici-palities fund the diff erence between the amount that the central government providesand the amount schools are able to persuade their municipality that they need.
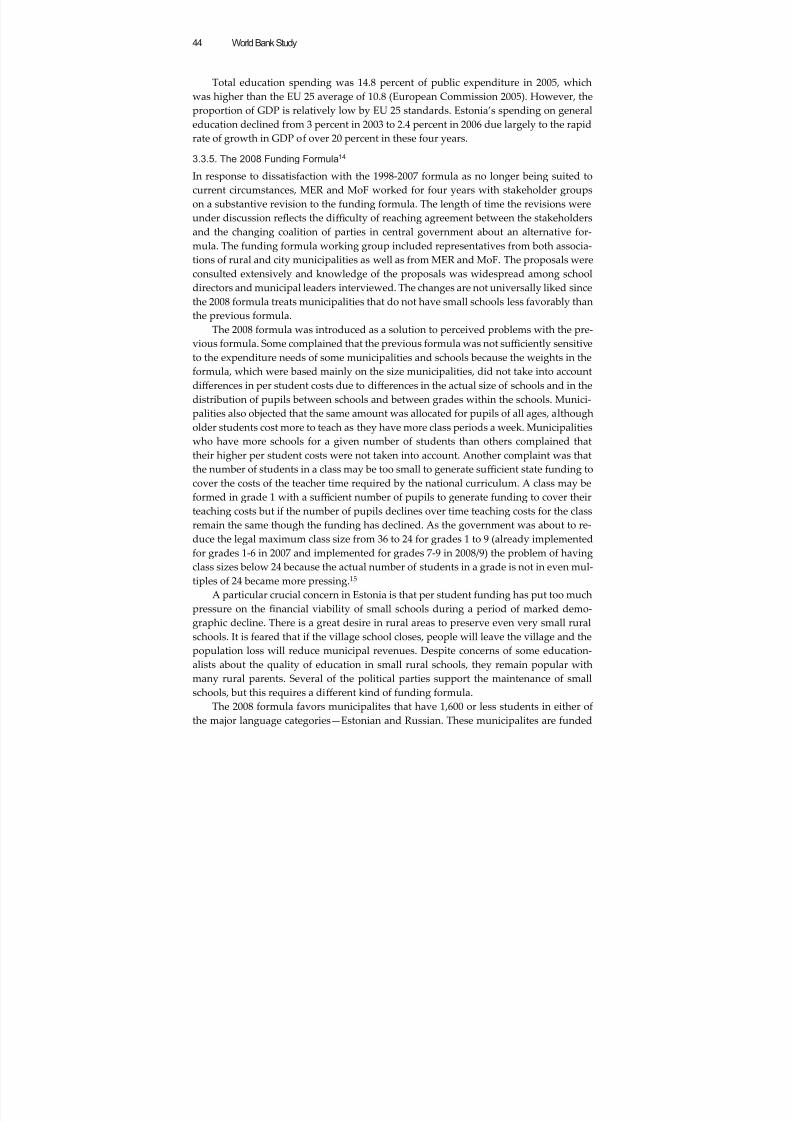
8/6/2019 Reforming Education Finance in Transition Countries
http://slidepdf.com/reader/full/reforming-education-finance-in-transition-countries 68/335
World Bank Study44
Total education spending was 14.8 percent of public expenditure in 2005, whichwas higher than the EU 25 average of 10.8 (European Commission 2005). However, theproportion of GDP is relatively low by EU 25 standards. Estonia’s spending on generaleducation declined from 3 percent in 2003 to 2.4 percent in 2006 due largely to the rapid
rate of growth in GDP of over 20 percent in these four years.
3.3.5. The 2008 Funding Formula14
In response to dissatisfaction with the 1998-2007 formula as no longer being suited tocurrent circumstances, MER and MoF worked for four years with stakeholder groupson a substantive revision to the funding formula. The length of time the revisions wereunder discussion reflects the diffi culty of reaching agreement between the stakeholdersand the changing coalition of parties in central government about an alternative for-mula. The funding formula working group included representatives from both associa-tions of rural and city municipalities as well as from MER and MoF. The proposals were
consulted extensively and knowledge of the proposals was widespread among schooldirectors and municipal leaders interviewed. The changes are not universally liked sincethe 2008 formula treats municipalities that do not have small schools less favorably thanthe previous formula.
The 2008 formula was introduced as a solution to perceived problems with the pre-vious formula. Some complained that the previous formula was not suffi ciently sensitiveto the expenditure needs of some municipalities and schools because the weights in theformula, which were based mainly on the size municipalities, did not take into accountdiff erences in per student costs due to diff erences in the actual size of schools and in thedistribution of pupils between schools and between grades within the schools. Munici-
palities also objected that the same amount was allocated for pupils of all ages, althougholder students cost more to teach as they have more class periods a week. Municipalitieswho have more schools for a given number of students than others complained thattheir higher per student costs were not taken into account. Another complaint was thatthe number of students in a class may be too small to generate suffi cient state funding tocover the costs of the teacher time required by the national curriculum. A class may beformed in grade 1 with a suffi cient number of pupils to generate funding to cover theirteaching costs but if the number of pupils declines over time teaching costs for the classremain the same though the funding has declined. As the government was about to re-duce the legal maximum class size from 36 to 24 for grades 1 to 9 (already implemented
for grades 1-6 in 2007 and implemented for grades 7-9 in 2008/9) the problem of havingclass sizes below 24 because the actual number of students in a grade is not in even mul-tiples of 24 became more pressing.15
A particular crucial concern in Estonia is that per student funding has put too muchpressure on the financial viability of small schools during a period of marked demo-graphic decline. There is a great desire in rural areas to preserve even very small ruralschools. It is feared that if the village school closes, people will leave the village and thepopulation loss will reduce municipal revenues. Despite concerns of some education-alists about the quality of education in small rural schools, they remain popular withmany rural parents. Several of the political parties support the maintenance of smallschools, but this requires a diff erent kind of funding formula.
The 2008 formula favors municipalites that have 1,600 or less students in either ofthe major language categories—Estonian and Russian. These municipalites are funded
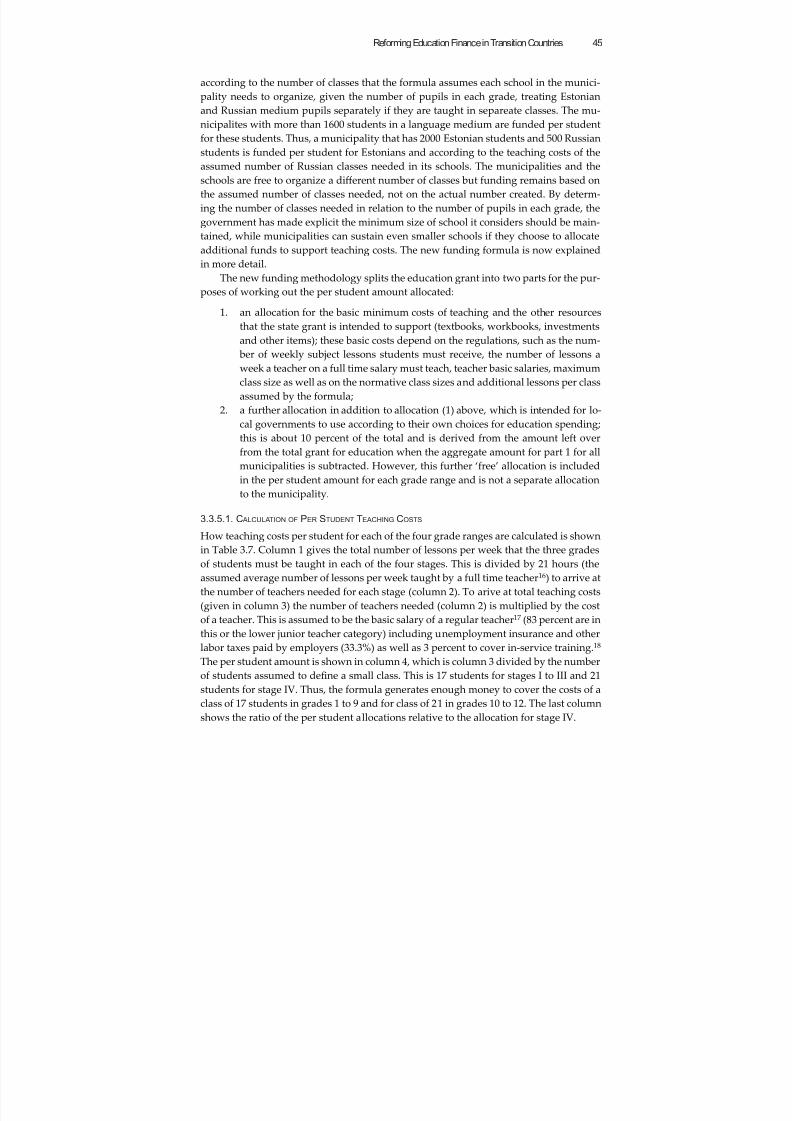
8/6/2019 Reforming Education Finance in Transition Countries
http://slidepdf.com/reader/full/reforming-education-finance-in-transition-countries 69/335
Reforming Education Finance in Transition Countries 45
according to the number of classes that the formula assumes each school in the munici-pality needs to organize, given the number of pupils in each grade, treating Estonianand Russian medium pupils separately if they are taught in separeate classes. The mu-nicipalites with more than 1600 students in a language medium are funded per student
for these students. Thus, a municipality that has 2000 Estonian students and 500 Russianstudents is funded per student for Estonians and according to the teaching costs of theassumed number of Russian classes needed in its schools. The municipalities and theschools are free to organize a diff erent number of classes but funding remains based onthe assumed number of classes needed, not on the actual number created. By determ-ing the number of classes needed in relation to the number of pupils in each grade, thegovernment has made explicit the minimum size of school it considers should be main-tained, while municipalities can sustain even smaller schools if they choose to allocateadditional funds to support teaching costs. The new funding formula is now explainedin more detail.
The new funding methodology splits the education grant into two parts for the pur-poses of working out the per student amount allocated:
1. an allocation for the basic minimum costs of teaching and the other resourcesthat the state grant is intended to support (textbooks, workbooks, investmentsand other items); these basic costs depend on the regulations, such as the num- ber of weekly subject lessons students must receive, the number of lessons aweek a teacher on a full time salary must teach, teacher basic salaries, maximumclass size as well as on the normative class sizes and additional lessons per classassumed by the formula;
2. a further allocation in addition to allocation (1) above, which is intended for lo-cal governments to use according to their own choices for education spending;this is about 10 percent of the total and is derived from the amount left overfrom the total grant for education when the aggregate amount for part 1 for allmunicipalities is subtracted. However, this further ‘free’ allocation is includedin the per student amount for each grade range and is not a separate allocationto the municipality.
3.3.5.1. C ALCULATION OF PER STUDENT TEACHING COSTS
How teaching costs per student for each of the four grade ranges are calculated is shown
in Table 3.7. Column 1 gives the total number of lessons per week that the three gradesof students must be taught in each of the four stages. This is divided by 21 hours (theassumed average number of lessons per week taught by a full time teacher16) to arrive atthe number of teachers needed for each stage (column 2). To arive at total teaching costs(given in column 3) the number of teachers needed (column 2) is multiplied by the costof a teacher. This is assumed to be the basic salary of a regular teacher17 (83 percent are inthis or the lower junior teacher category) including unemployment insurance and otherlabor taxes paid by employers (33.3%) as well as 3 percent to cover in-service training.18 The per student amount is shown in column 4, which is column 3 divided by the numberof students assumed to define a small class. This is 17 students for stages I to III and 21
students for stage IV. Thus, the formula generates enough money to cover the costs of aclass of 17 students in grades 1 to 9 and for class of 21 in grades 10 to 12. The last columnshows the ratio of the per student allocations relative to the allocation for stage IV.
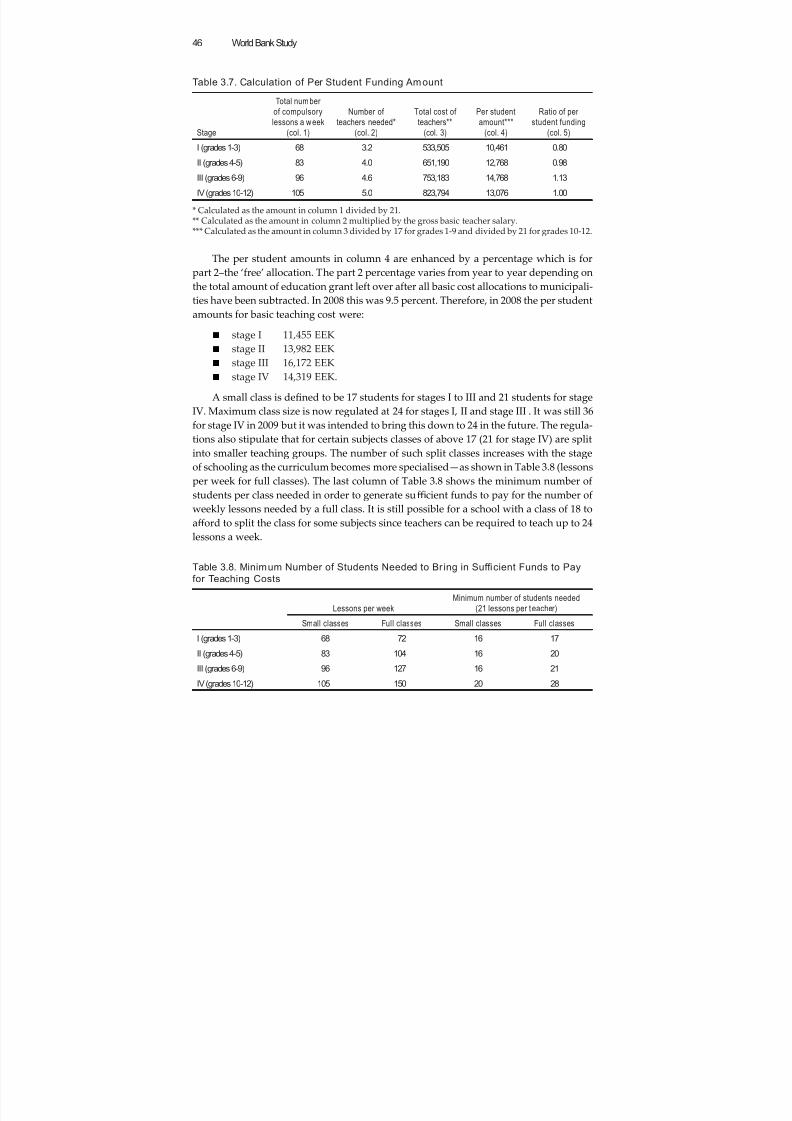
8/6/2019 Reforming Education Finance in Transition Countries
http://slidepdf.com/reader/full/reforming-education-finance-in-transition-countries 70/335
World Bank Study46
Table 3.7. Calculation of Per Student Funding Amount
Stage
Total number
of compulsory
lessons a week
(col. 1)
Number of
teachers needed*
(col. 2)
Total cost of
teachers**
(col. 3)
Per student
amount***
(col. 4)
Ratio of per
student funding
(col. 5)I (grades 1-3) 68 3.2 533,505 10,461 0.80
II (grades 4-5) 83 4.0 651,190 12,768 0.98
III (grades 6-9) 96 4.6 753,183 14,768 1.13
IV (grades 10-12) 105 5.0 823,794 13,076 1.00
* Calculated as the amount in column 1 divided by 21.** Calculated as the amount in column 2 multiplied by the gross basic teacher salary.*** Calculated as the amount in column 3 divided by 17 for grades 1-9 and divided by 21 for grades 10-12.
The per student amounts in column 4 are enhanced by a percentage which is for
part 2–the ‘free’ allocation. The part 2 percentage varies from year to year depending onthe total amount of education grant left over after all basic cost allocations to municipali-ties have been subtracted. In 2008 this was 9.5 percent. Therefore, in 2008 the per studentamounts for basic teaching cost were:
■ stage I 11,455 EEK■ stage II 13,982 EEK■ stage III 16,172 EEK■ stage IV 14,319 EEK.
A small class is defined to be 17 students for stages I to III and 21 students for stage
IV. Maximum class size is now regulated at 24 for stages I, II and stage III . It was still 36for stage IV in 2009 but it was intended to bring this down to 24 in the future. The regula-tions also stipulate that for certain subjects classes of above 17 (21 for stage IV) are splitinto smaller teaching groups. The number of such split classes increases with the stageof schooling as the curriculum becomes more specialised—as shown in Table 3.8 (lessonsper week for full classes). The last column of Table 3.8 shows the minimum number ofstudents per class needed in order to generate suffi cient funds to pay for the number ofweekly lessons needed by a full class. It is still possible for a school with a class of 18 toaff ord to split the class for some subjects since teachers can be required to teach up to 24lessons a week.
Table 3.8. Minimum Number of Students Needed to Br ing in Suf fi cient Funds to Pay
for Teaching Costs
Lessons per week
Minimum number of students needed
(21 lessons per teacher)
Small classes Full classes Small classes Full classes
I (grades 1-3) 68 72 16 17
II (grades 4-5) 83 104 16 20
III (grades 6-9) 96 127 16 21
IV (grades 10-12) 105 150 20 28
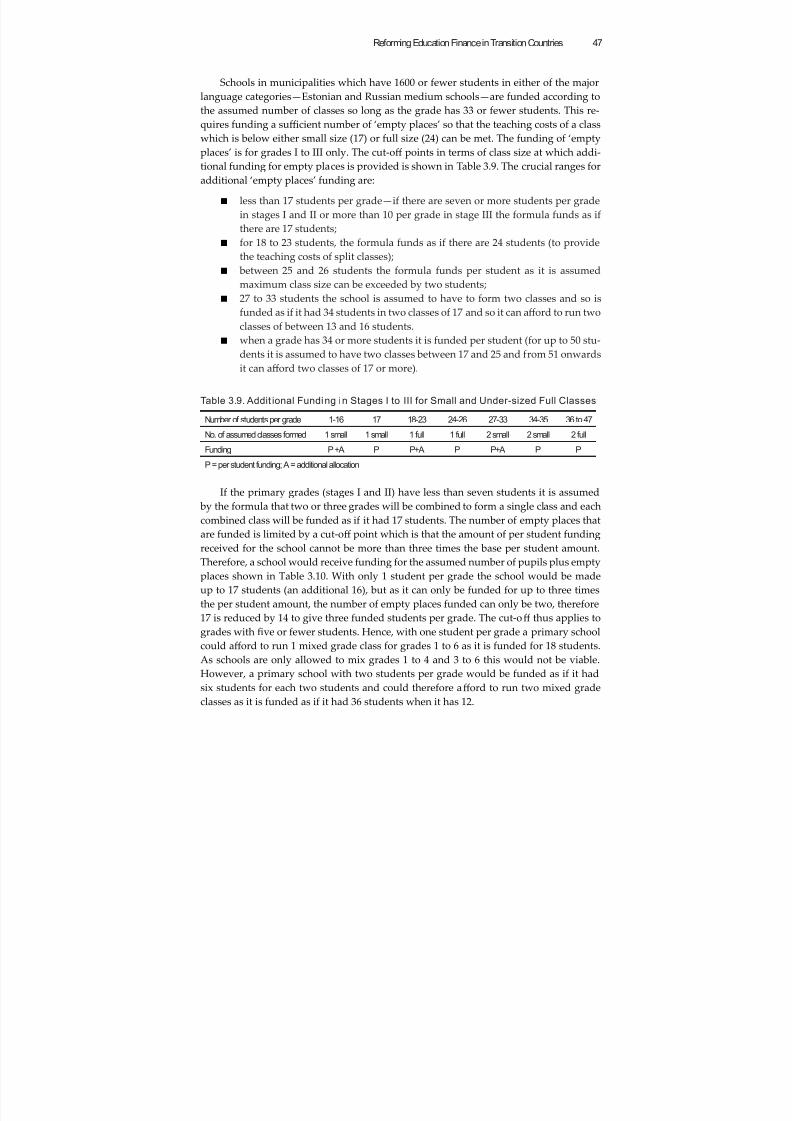
8/6/2019 Reforming Education Finance in Transition Countries
http://slidepdf.com/reader/full/reforming-education-finance-in-transition-countries 71/335
Reforming Education Finance in Transition Countries 47
Schools in municipalities which have 1600 or fewer students in either of the majorlanguage categories—Estonian and Russian medium schools—are funded according tothe assumed number of classes so long as the grade has 33 or fewer students. This re-quires funding a suffi cient number of ‘empty places’ so that the teaching costs of a class
which is below either small size (17) or full size (24) can be met. The funding of ‘emptyplaces’ is for grades I to III only. The cut-off points in terms of class size at which addi-tional funding for empty places is provided is shown in Table 3.9. The crucial ranges foradditional ‘empty places’ funding are:
■ less than 17 students per grade—if there are seven or more students per gradein stages I and II or more than 10 per grade in stage III the formula funds as ifthere are 17 students;
■ for 18 to 23 students, the formula funds as if there are 24 students (to providethe teaching costs of split classes);
■
between 25 and 26 students the formula funds per student as it is assumedmaximum class size can be exceeded by two students;■ 27 to 33 students the school is assumed to have to form two classes and so is
funded as if it had 34 students in two classes of 17 and so it can aff ord to run twoclasses of between 13 and 16 students.
■ when a grade has 34 or more students it is funded per student (for up to 50 stu-dents it is assumed to have two classes between 17 and 25 and from 51 onwardsit can aff ord two classes of 17 or more).
Table 3.9. Addit ional Funding in Stages I to III for Small and Under-sized Full Classes
Number of students per grade 1-16 17 18-23 24-26 27-33 34-35 36 to 47
No. of assumed classes formed 1 small 1 small 1 full 1 full 2 small 2 small 2 full
Funding P +A P P+A P P+A P P
P = per student funding; A = additional allocation
If the primary grades (stages I and II) have less than seven students it is assumed by the formula that two or three grades will be combined to form a single class and eachcombined class will be funded as if it had 17 students. The number of empty places thatare funded is limited by a cut-off point which is that the amount of per student funding
received for the school cannot be more than three times the base per student amount.Therefore, a school would receive funding for the assumed number of pupils plus emptyplaces shown in Table 3.10. With only 1 student per grade the school would be madeup to 17 students (an additional 16), but as it can only be funded for up to three timesthe per student amount, the number of empty places funded can only be two, therefore17 is reduced by 14 to give three funded students per grade. The cut-off thus applies togrades with five or fewer students. Hence, with one student per grade a primary schoolcould aff ord to run 1 mixed grade class for grades 1 to 6 as it is funded for 18 students.As schools are only allowed to mix grades 1 to 4 and 3 to 6 this would not be viable.However, a primary school with two students per grade would be funded as if it had
six students for each two students and could therefore aff ord to run two mixed gradeclasses as it is funded as if it had 36 students when it has 12.
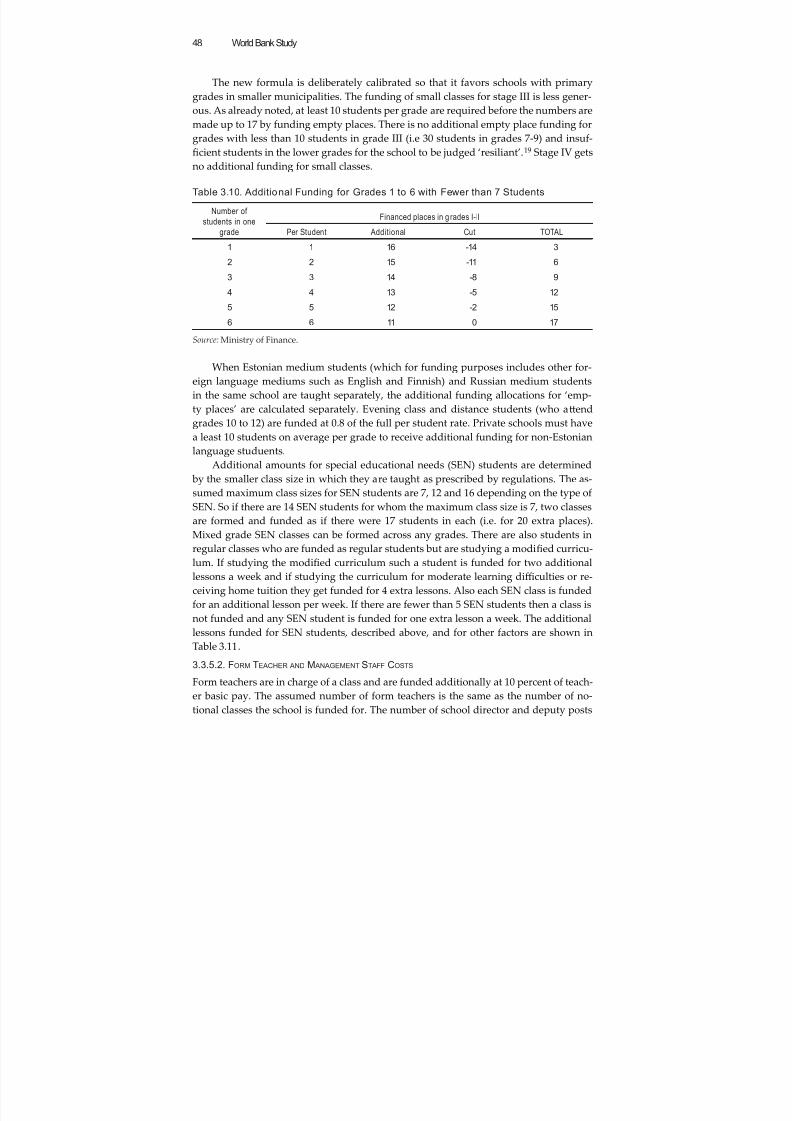
8/6/2019 Reforming Education Finance in Transition Countries
http://slidepdf.com/reader/full/reforming-education-finance-in-transition-countries 72/335
World Bank Study48
The new formula is deliberately calibrated so that it favors schools with primarygrades in smaller municipalities. The funding of small classes for stage III is less gener-ous. As already noted, at least 10 students per grade are required before the numbers aremade up to 17 by funding empty places. There is no additional empty place funding for
grades with less than 10 students in grade III (i.e 30 students in grades 7-9) and insuf-ficient students in the lower grades for the school to be judged ‘resiliant’.19 Stage IV getsno additional funding for small classes.
Table 3.10. Additional Funding for Grades 1 to 6 with Fewer than 7 Students
Number of
students in one
grade
Financed places in g rades I-II
Per Student Additional Cut TOTAL
1 1 16 -14 3
2 2 15 -11 6
3 3 14 -8 9
4 4 13 -5 12
5 5 12 -2 15
6 6 11 0 17
Source: Ministry of Finance.
When Estonian medium students (which for funding purposes includes other for-eign language mediums such as English and Finnish) and Russian medium studentsin the same school are taught separately, the additional funding allocations for ‘emp-
ty places’ are calculated separately. Evening class and distance students (who aendgrades 10 to 12) are funded at 0.8 of the full per student rate. Private schools must havea least 10 students on average per grade to receive additional funding for non-Estonianlanguage studuents.
Additional amounts for special educational needs (SEN) students are determined by the smaller class size in which they are taught as prescribed by regulations. The as-sumed maximum class sizes for SEN students are 7, 12 and 16 depending on the type ofSEN. So if there are 14 SEN students for whom the maximum class size is 7, two classesare formed and funded as if there were 17 students in each (i.e. for 20 extra places).Mixed grade SEN classes can be formed across any grades. There are also students in
regular classes who are funded as regular students but are studying a modified curricu-lum. If studying the modified curriculum such a student is funded for two additionallessons a week and if studying the curriculum for moderate learning diffi culties or re-ceiving home tuition they get funded for 4 extra lessons. Also each SEN class is fundedfor an additional lesson per week. If there are fewer than 5 SEN students then a class isnot funded and any SEN student is funded for one extra lesson a week. The additionallessons funded for SEN students, described above, and for other factors are shown inTable 3.11.
3.3.5.2. FORM TEACHER AND M ANAGEMENT STAFF COSTS
Form teachers are in charge of a class and are funded additionally at 10 percent of teach-er basic pay. The assumed number of form teachers is the same as the number of no-tional classes the school is funded for. The number of school director and deputy posts
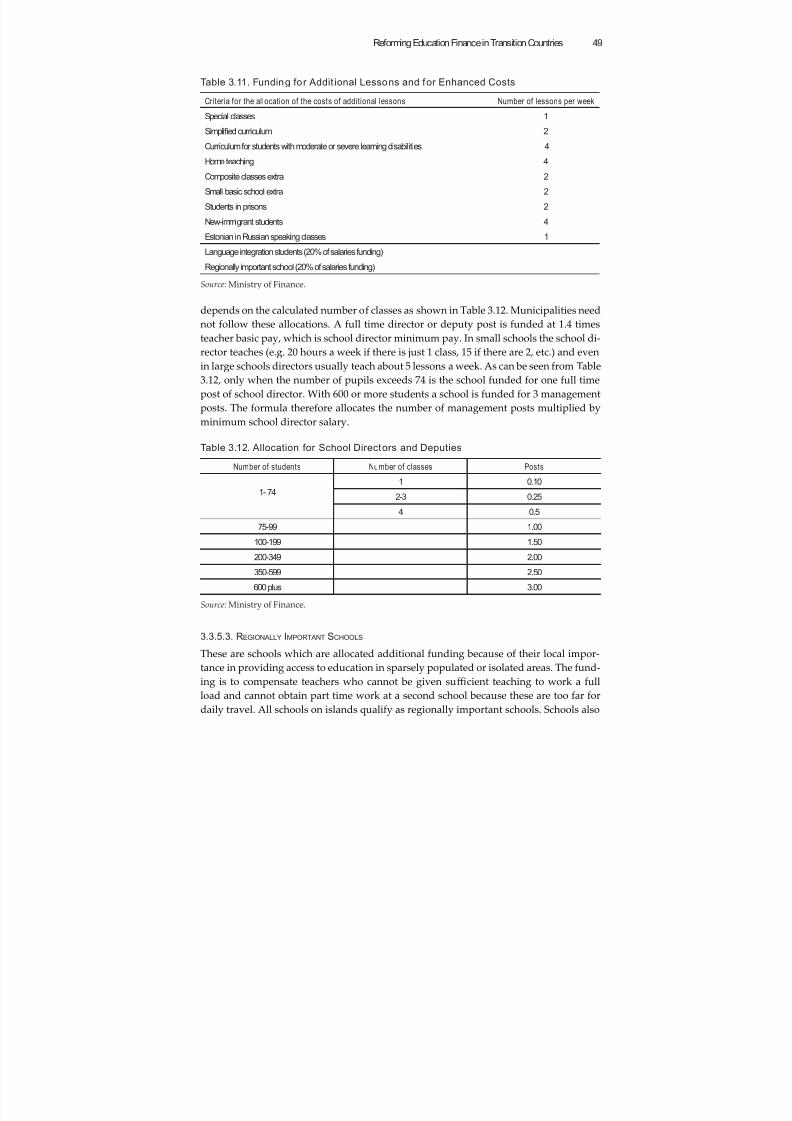
8/6/2019 Reforming Education Finance in Transition Countries
http://slidepdf.com/reader/full/reforming-education-finance-in-transition-countries 73/335
8/6/2019 Reforming Education Finance in Transition Countries
http://slidepdf.com/reader/full/reforming-education-finance-in-transition-countries 74/335
World Bank Study50
qualify as regional schools if they have 10-30 students in stage III with the nearest alter-native school with stage III classes more than 30 km distant by a metalled road.20 Cur-rently there are no schools in this cateogory. Regionally important schools are fundedadditionally for small classes but if situated on small islands they are funded 20 percent
more per student than the standard rate and their funding is not capped at three timesthe basic per student amount.
3.3.5.4. SPLIT SITE SCHOOLS
Schools that have a single management but are on two or more sites at least 10 km apartfor grade 1 and II funding and 30 km apart for grade III funding can, if the municipal-ity requests this, have their funding allocation calculated as if the sites were separateschools.
3.3.5.5. ADJUSTMENT FUNDING
To prevent large year-to-year reductions in a school’s funding there are provisions fordampening reductions in funding taking one year with the next. The adjustment fund-ing is triggered when a school’s annual increase in salary grant is less than the averagenational increase. If this is the case then:
■ if the calculated number of classes is less than that in the previous year, perstudent funding compared to the previous year is increased by at least half theaverage increase in the state education grant;
■ if the calculated number of classes is not lower than last year, then the smallerof the following is allocated:• the previous year’s grant for teacher salaries is increased by half the national
rate of growth;• the salary grant the school would have received according to the previous
year’s formula (i.e. if the formula has changed).
The adjustment funding was due to operate for three years (2008 to 2010) and was esti-mated to cost around 14 million EEK a year.
3.3.5.6. TEXTBOOKS, WORKBOOKS AND C APITAL FUNDING
As in the current formula there is a per student grant for textbooks (282 EEK per student)and workbooks (458 EEK per student). The investment grant is now allocated at 21,900
EEK per class and 438 EEK per student.21
Evening and distance students do not countfor workbooks and are weighted 0.8 for textbooks and per student investment grant.Counselling commiee costs are funded for each municipality at 50 EEK pre student andfor each youth in the municipality aged up to 26 there is 80 EEK for cultural and sportsevents.22
3.3.5.7. AMALGAMATIONS
In the year after amalgamation, an amalgamated municipality receives a compensationgrant for 3 years.
3.3.5.8. RESERVES
The 2008 formula requires a smaller reserve fund than the previous formula because itfunds for the number of classes schools need to create and the per student allocation istied directly to teacher basic pay. Therefore municipalities are fully funded for teacher
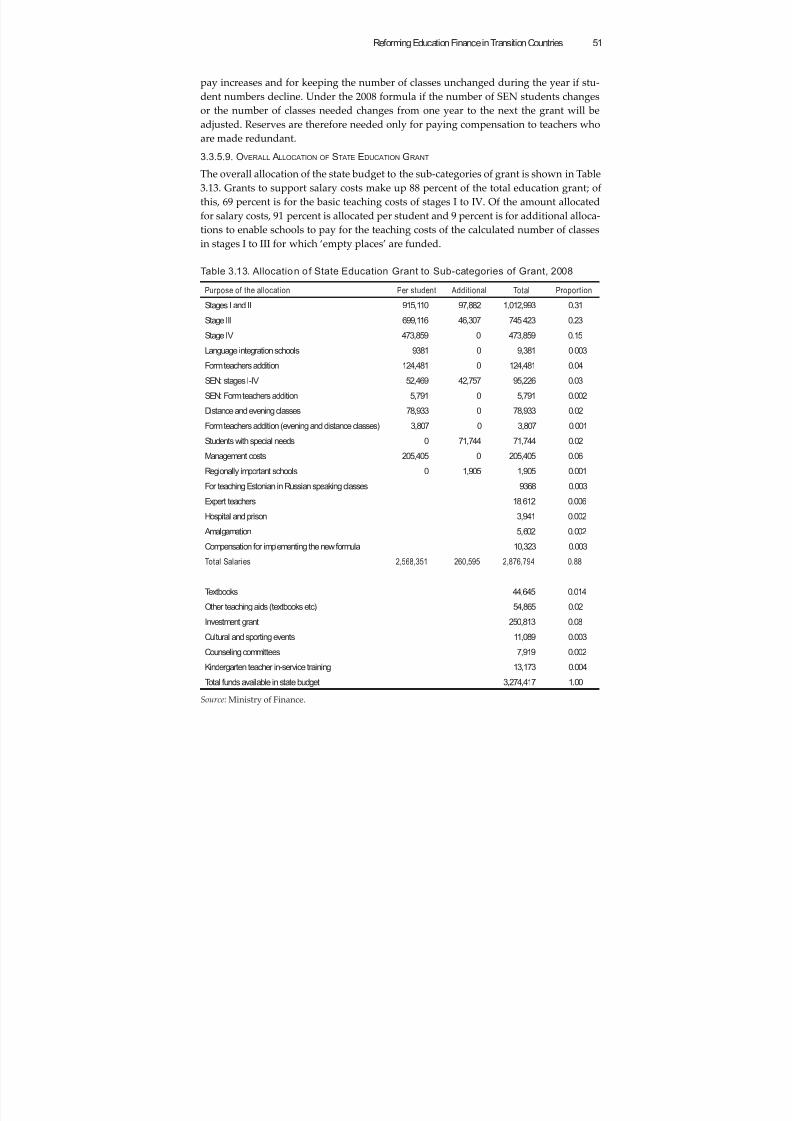
8/6/2019 Reforming Education Finance in Transition Countries
http://slidepdf.com/reader/full/reforming-education-finance-in-transition-countries 75/335
Reforming Education Finance in Transition Countries 51
pay increases and for keeping the number of classes unchanged during the year if stu-dent numbers decline. Under the 2008 formula if the number of SEN students changesor the number of classes needed changes from one year to the next the grant will beadjusted. Reserves are therefore needed only for paying compensation to teachers who
are made redundant.3.3.5.9. OVERALL ALLOCATION OF STATE EDUCATION GRANT
The overall allocation of the state budget to the sub-categories of grant is shown in Table3.13. Grants to support salary costs make up 88 percent of the total education grant; ofthis, 69 percent is for the basic teaching costs of stages I to IV. Of the amount allocatedfor salary costs, 91 percent is allocated per student and 9 percent is for additional alloca-tions to enable schools to pay for the teaching costs of the calculated number of classesin stages I to III for which ‘empty places’ are funded.
Table 3.13. Allocation of State Education Grant to Sub-categories of Grant, 2008
Purpose of the allocation Per student Additional Total Proportion
Stages I and II 915,110 97,882 1,012,993 0.31
Stage III 699,116 46,307 745,423 0.23
Stage IV 473,859 0 473,859 0.15
Language integration schools 9381 0 9,381 0.003
Form teachers addition 124,481 0 124,481 0.04
SEN: stages I-IV 52,469 42,757 95,226 0.03
SEN: Form teachers addition 5,791 0 5,791 0.002
Distance and evening classes 78,933 0 78,933 0.02
Form teachers addition (evening and distance classes) 3,807 0 3,807 0.001
Students with special needs 0 71,744 71,744 0.02
Management costs 205,405 0 205,405 0.06
Regionally important schools 0 1,905 1,905 0.001
For teaching Estonian in Russian speaking classes 9368 0.003
Expert teachers 18,612 0.006
Hospital and prison 3,941 0.002
Amalgamation 5,602 0.002
Compensation for implementing the new formula 10,323 0.003Total Salaries 2,568,351 260,595 2,876,794 0.88
Textbooks 44,645 0.014
Other teaching aids (textbooks etc) 54,865 0.02
Investment grant 250,813 0.08
Cultural and sporting events 11,089 0.003
Counseling committees 7,919 0.002
Kindergarten teacher in-service training 13,173 0.004
Total funds available in state budget 3,274,417 1.00Source: Ministry of Finance.
8/6/2019 Reforming Education Finance in Transition Countries
http://slidepdf.com/reader/full/reforming-education-finance-in-transition-countries 76/335
World Bank Study52
3.3.5.10. SUMMARY: COMPARISON OF OLD AND NEW FORMULAE
From an effi ciency perspective a per student formula, which takes no account of thenumber of schools within a municipality or of the number of classes within schools,is desirable since it encourages municipalities to rationalize their school network and
schools to organize effi ciently-sized classes. However, to be horizontally equitable23 aschool funding formula should reflect diff erences in municipal costs per student thatare due to structural factors beyond the control of the municipality. So, for example,if two municipalities with the same number of students each have three schools, butmunicipality A is sparsely populated and has three villages 2 hours to travel time apartwhile municipality B is quite densely populated and could operate with one school, thenthe formula should allocate more funding to municipality A according to its populationdensity and poor road communications. The 1998-2007 funding formula did not containindicators of population density or of travel times but relied only on municipal studentnumbers and city/rural/island distinction for diff erentiating per student allocations toreflect diff erences in structural costs.
The 2008 formula is derived from an activity-led model (Abu-Duhou 1999) of thecosts of teaching and learning and therefore makes it easier for municipalities to fundtheir schools from the state budget for teaching and materials costs, so long as the mu-nicipality applies the costing model on which the funding formula is based. The 2008formula provides funding for the calculated teaching costs of classes of assumed size,dependent on required lessons per week and an assumed average teaching load. It ad- justs for variations in these costs by grade range. Because the formula is activity-led,any changes in government policy which aff ect teaching costs, such as the prescribed
numbers of lessons per week or increases in teacher basic salaries, are directly mirroredin the grant allocations. The 2008 formula reflects a government commitment to reducemaximum class size to 24 and sustain small schools with less than 34 students per gradein stages I, II and III but not in upper secondary grades. There is a deliberate bias toprovide additional funding for schools with very few students in the primary gradeswhen the number of students in either language medium in the municipality is below1600. A primary school with as few as 2 students per grade (12 in all) is funded to run2 mixed grade classes. The 2008 formula also also explicitly funds minority languageclasses which the previous formula did not. Muncipalities with fewer than 1600 Russianstudents and small numbers of these students per grade receive suffi cient funding for
organizing mixed classes of 3 grades with as few as 6 Russian medium students. Theprevious formula funded just on the number of students regardless of lanuage medium.Greater financial stability is provided to municipalities through the adjustment fac-
tor. As the allocation per student per stage exceeds the basic costs of teaching provision,there is built in flexibility for municipalities to spend this premium on additional expen-ditures not included in the activity-led model such as smaller teaching groups, more les-sons per week or higher teacher salaries. While there is no requirement for a municipal-ity to fund schools according to the MER/MoF funding model (apart from adhering tolegal norms) the formula designers expected that municipalities will base their fundingof their schools on it. The implications of the 2008 formula for equity and effi ciency are
discussed in the sections below on these issues.
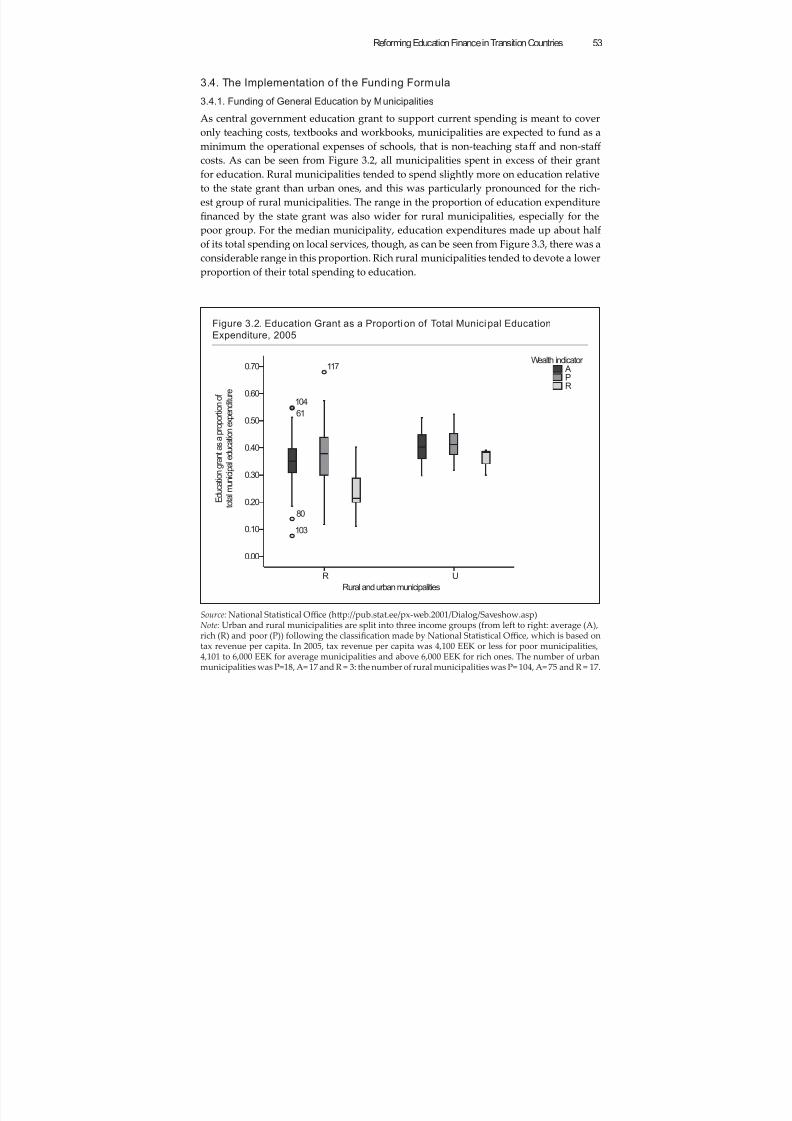
8/6/2019 Reforming Education Finance in Transition Countries
http://slidepdf.com/reader/full/reforming-education-finance-in-transition-countries 77/335
Reforming Education Finance in Transition Countries 53
3.4. The Implementation of the Funding Formula
3.4.1. Funding of General Education by Municipalities
As central government education grant to support current spending is meant to cover
only teaching costs, textbooks and workbooks, municipalities are expected to fund as aminimum the operational expenses of schools, that is non-teaching staff and non-staff costs. As can be seen from Figure 3.2, all municipalities spent in excess of their grantfor education. Rural municipalities tended to spend slightly more on education relativeto the state grant than urban ones, and this was particularly pronounced for the rich-est group of rural municipalities. The range in the proportion of education expenditurefinanced by the state grant was also wider for rural municipalities, especially for thepoor group. For the median municipality, education expenditures made up about halfof its total spending on local services, though, as can be seen from Figure 3.3, there was aconsiderable range in this proportion. Rich rural municipalities tended to devote a lower
proportion of their total spending to education.
Figure 3.2. Education Grant as a Proportion of Total Municipal Education
Expenditure, 2005
Source: National Statistical Offi ce (hp://pub.stat.ee/px-web.2001/Dialog/Saveshow.asp)Note: Urban and rural municipalities are split into three income groups (from left to right: average (A),rich (R) and poor (P)) following the classification made by National Statistical Offi ce, which is based ontax revenue per capita. In 2005, tax revenue per capita was 4,100 EEK or less for poor municipalities,4,101 to 6,000 EEK for average municipalities and above 6,000 EEK for rich ones. The number of urbanmunicipalities was P=18, A= 17 and R = 3: the number of rural municipalities was P= 104, A= 75 and R = 17.
UR
Rural and urban municipalities
0.70
0.60
0.50
0.40
0.30
0.20
0.10
0.00
E d u c a t i o n g r a n t a s a p r o p o r t i o n o f
t o t a l m u n i c i p a l e d u c a t i o n e x p e n
d i t u r e
117
104
61
80
103
RP A
Wealth indicator
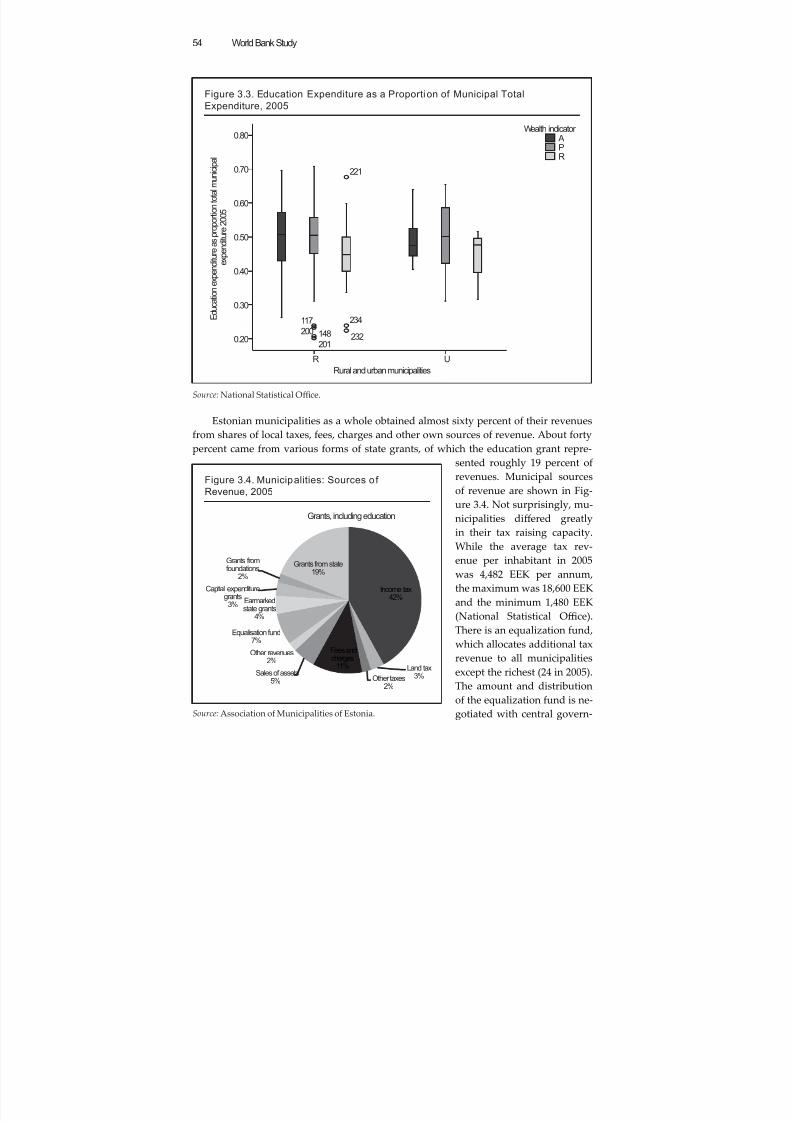
8/6/2019 Reforming Education Finance in Transition Countries
http://slidepdf.com/reader/full/reforming-education-finance-in-transition-countries 78/335
World Bank Study54
Estonian municipalities as a whole obtained almost sixty percent of their revenuesfrom shares of local taxes, fees, charges and other own sources of revenue. About fortypercent came from various forms of state grants, of which the education grant repre-
sented roughly 19 percent ofrevenues. Municipal sourcesof revenue are shown in Fig-ure 3.4. Not surprisingly, mu-nicipalities diff ered greatlyin their tax raising capacity.
While the average tax rev-enue per inhabitant in 2005was 4,482 EEK per annum,the maximum was 18,600 EEKand the minimum 1,480 EEK(National Statistical Offi ce).There is an equalization fund,which allocates additional taxrevenue to all municipalitiesexcept the richest (24 in 2005).
The amount and distributionof the equalization fund is ne-gotiated with central govern-
Figure 3.3. Education Expenditure as a Proportion of Municipal Total
Expenditure, 2005
Source: National Statistical Offi ce.
UR
Rural and urban municipalities
0.80
0.70
0.60
0.50
0.40
0.30
0.20
E d u c a t i o n e x p e
n d i t u r e a s p r o p o r t i o n t o t a l m u n i c i p a l
e x p e n d i t u r e 2 0 0 5
221
234
232
117
148200
201
RP A
Wealth indicator
Income tax42%
Land tax3%Other taxes
2%
Fees andcharges
11%Sales of assets
5%
Other revenues2%
Equalisation fund7%
Earmarkedstate grants
4%
Capital expendituregrants3%
Grants fromfoundations
2%
Grants from state19%
Grants, including education
Figure 3.4. Municipalities: Sources of
Revenue, 2005
Source: Association of Municipalities of Estonia.
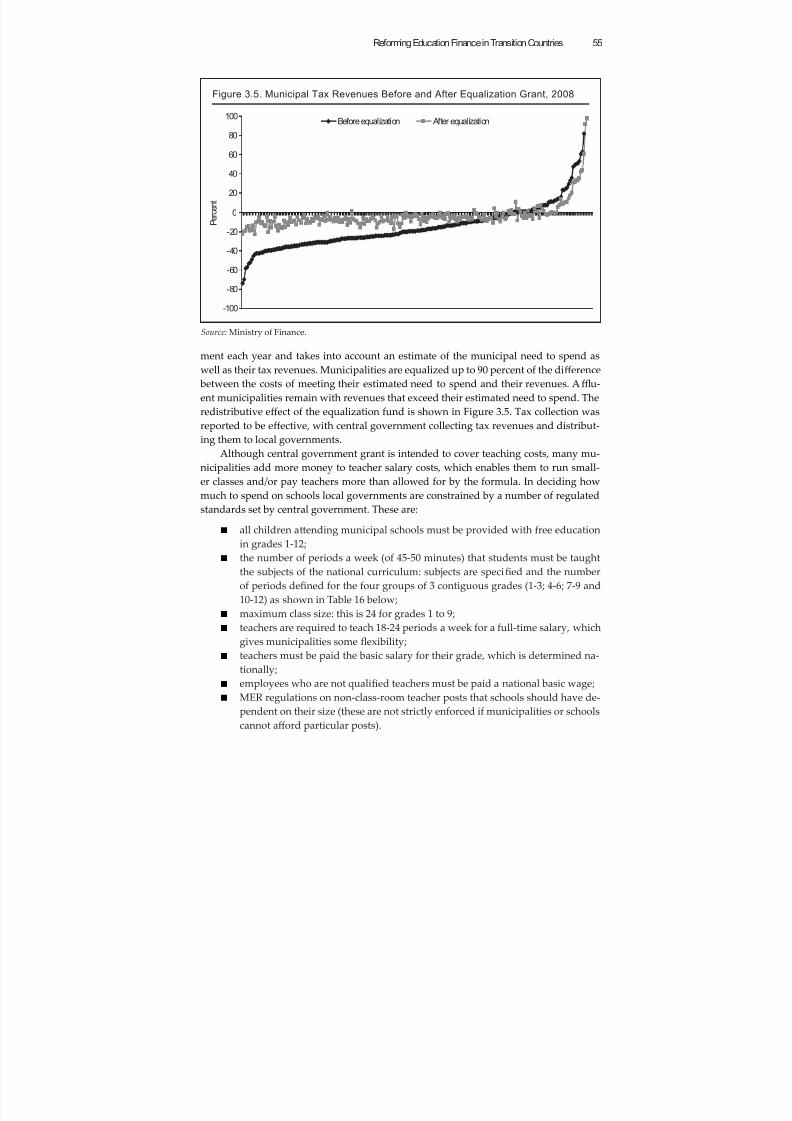
8/6/2019 Reforming Education Finance in Transition Countries
http://slidepdf.com/reader/full/reforming-education-finance-in-transition-countries 79/335
Reforming Education Finance in Transition Countries 55
ment each year and takes into account an estimate of the municipal need to spend aswell as their tax revenues. Municipalities are equalized up to 90 percent of the diff erence between the costs of meeting their estimated need to spend and their revenues. Affl u-ent municipalities remain with revenues that exceed their estimated need to spend. The
redistributive eff ect of the equalization fund is shown in Figure 3.5. Tax collection wasreported to be eff ective, with central government collecting tax revenues and distribut-ing them to local governments.
Although central government grant is intended to cover teaching costs, many mu-nicipalities add more money to teacher salary costs, which enables them to run small-er classes and/or pay teachers more than allowed for by the formula. In deciding howmuch to spend on schools local governments are constrained by a number of regulatedstandards set by central government. These are:
■ all children aending municipal schools must be provided with free education
in grades 1-12;■ the number of periods a week (of 45-50 minutes) that students must be taught
the subjects of the national curriculum: subjects are specified and the numberof periods defined for the four groups of 3 contiguous grades (1-3; 4-6; 7-9 and10-12) as shown in Table 16 below;
■ maximum class size: this is 24 for grades 1 to 9;■ teachers are required to teach 18-24 periods a week for a full-time salary, which
gives municipalities some flexibility;■ teachers must be paid the basic salary for their grade, which is determined na-
tionally;
■ employees who are not qualified teachers must be paid a national basic wage;■ MER regulations on non-class-room teacher posts that schools should have de-
pendent on their size (these are not strictly enforced if municipalities or schoolscannot aff ord particular posts).
-100
-80
-60
-40
-20
0
20
40
60
80
100Before equalization After equalization
P e r c e n t
Figure 3.5. Municipal Tax Revenues Before and After Equalization Grant, 2008
Source: Ministry of Finance.
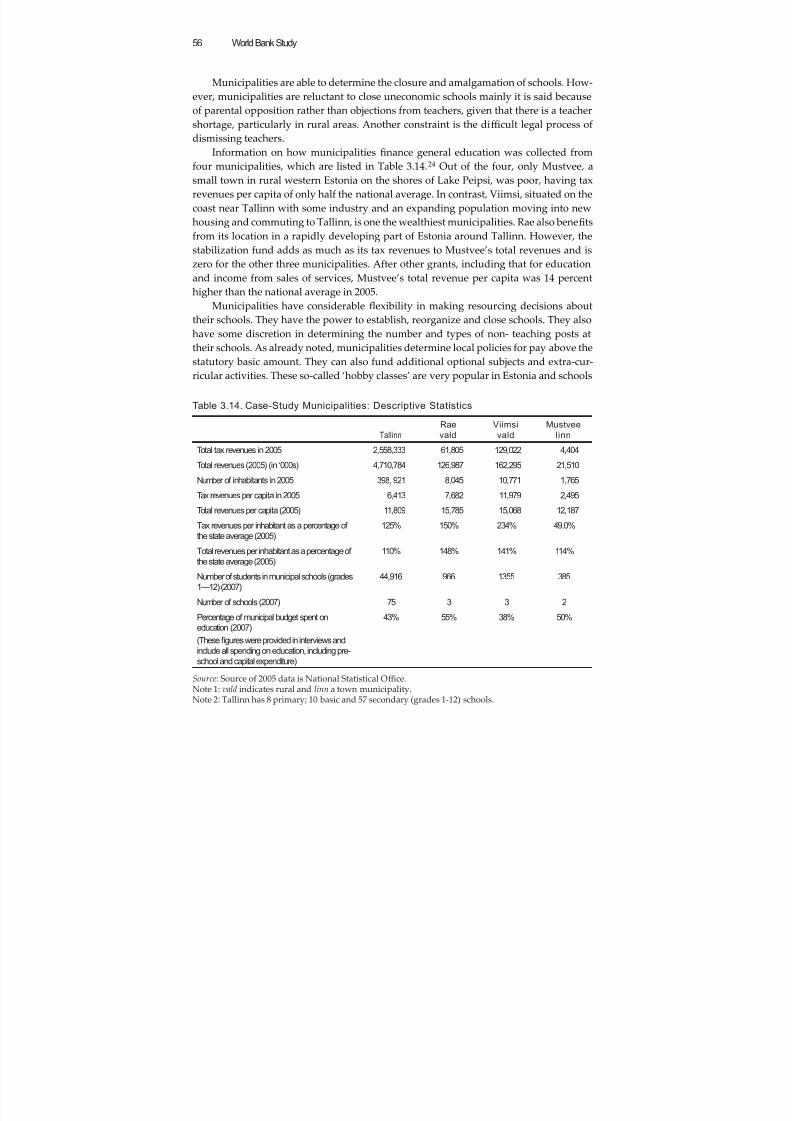
8/6/2019 Reforming Education Finance in Transition Countries
http://slidepdf.com/reader/full/reforming-education-finance-in-transition-countries 80/335
World Bank Study56
Municipalities are able to determine the closure and amalgamation of schools. How-ever, municipalities are reluctant to close uneconomic schools mainly it is said becauseof parental opposition rather than objections from teachers, given that there is a teachershortage, particularly in rural areas. Another constraint is the diffi cult legal process of
dismissing teachers.Information on how municipalities finance general education was collected from
four municipalities, which are listed in Table 3.14.24 Out of the four, only Mustvee, asmall town in rural western Estonia on the shores of Lake Peipsi, was poor, having taxrevenues per capita of only half the national average. In contrast, Viimsi, situated on thecoast near Tallinn with some industry and an expanding population moving into newhousing and commuting to Tallinn, is one the wealthiest municipalities. Rae also benefitsfrom its location in a rapidly developing part of Estonia around Tallinn. However, thestabilization fund adds as much as its tax revenues to Mustvee’s total revenues and iszero for the other three municipalities. After other grants, including that for education
and income from sales of services, Mustvee’s total revenue per capita was 14 percenthigher than the national average in 2005.
Municipalities have considerable flexibility in making resourcing decisions abouttheir schools. They have the power to establish, reorganize and close schools. They alsohave some discretion in determining the number and types of non- teaching posts attheir schools. As already noted, municipalities determine local policies for pay above thestatutory basic amount. They can also fund additional optional subjects and extra-cur-ricular activities. These so-called ‘hobby classes’ are very popular in Estonia and schools
Table 3.14. Case-Study Municipalities: Descriptive Statistics
Tallinn
Rae
vald
Viimsi
vald
Mustvee
linn
Total tax revenues in 2005 2,558,333 61,805 129,022 4,404
Total revenues (2005) (in ‘000s) 4,710,784 126,987 162,295 21,510
Number of inhabitants in 2005 398, 921 8,045 10,771 1,765
Tax revenues per capita in 2005 6,413 7,682 11,979 2,495
Total revenues per capita (2005) 11,809 15,785 15,068 12,187
Tax revenues per inhabitant as a percentage of
the state average (2005)
125% 150% 234% 49.0%
Total revenues per inhabitant as a percentage ofthe state average (2005)
110% 148% 141% 114%
Number of students in municipal schools (grades
1—12) (2007)
44,916 966 1355 385
Number of schools (2007) 75 3 3 2
Percentage of municipal budget spent on
education (2007)
(Thesefigures were provided in interviews and
include all spending on education, including pre-
school and capital expenditure)
43% 55% 38% 50%
Source: Source of 2005 data is National Statistical Offi ce.Note 1: vald indicates rural and linn a town municipality.Note 2: Tallinn has 8 primary; 10 basic and 57 secondary (grades 1-12) schools.
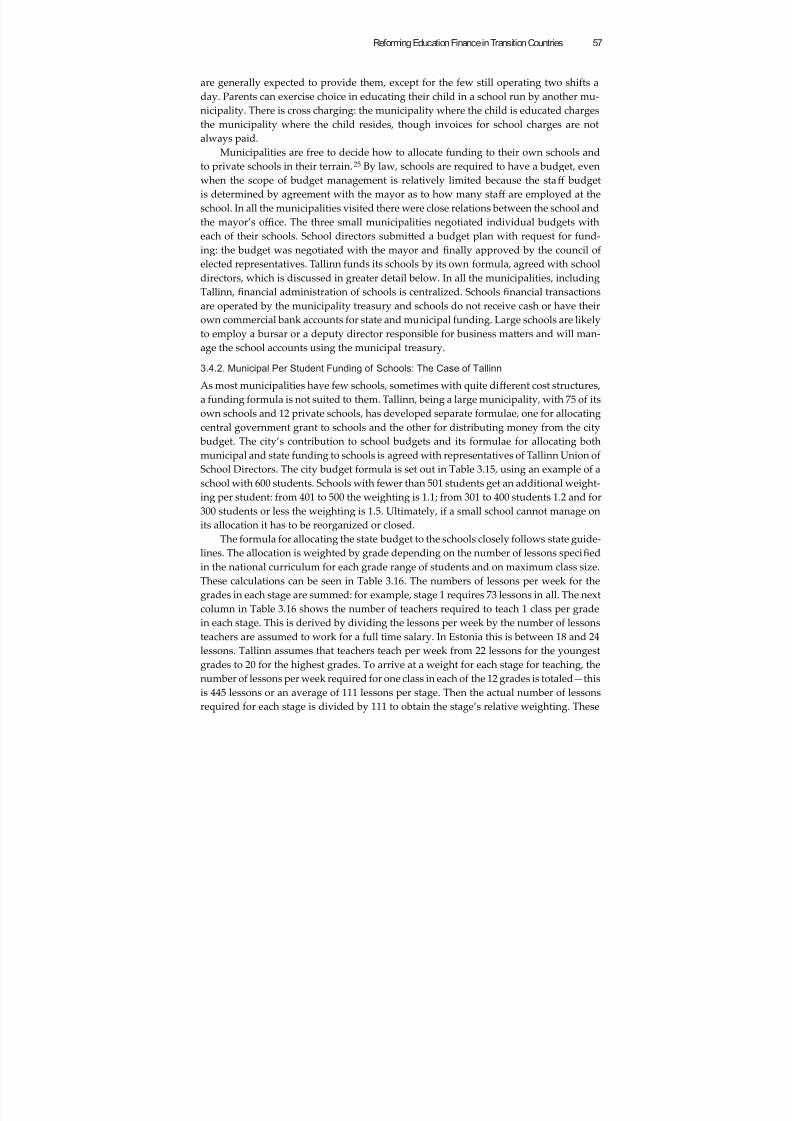
8/6/2019 Reforming Education Finance in Transition Countries
http://slidepdf.com/reader/full/reforming-education-finance-in-transition-countries 81/335
Reforming Education Finance in Transition Countries 57
are generally expected to provide them, except for the few still operating two shifts aday. Parents can exercise choice in educating their child in a school run by another mu-nicipality. There is cross charging: the municipality where the child is educated chargesthe municipality where the child resides, though invoices for school charges are not
always paid.Municipalities are free to decide how to allocate funding to their own schools and
to private schools in their terrain.25 By law, schools are required to have a budget, evenwhen the scope of budget management is relatively limited because the staff budgetis determined by agreement with the mayor as to how many staff are employed at theschool. In all the municipalities visited there were close relations between the school andthe mayor’s offi ce. The three small municipalities negotiated individual budgets witheach of their schools. School directors submied a budget plan with request for fund-ing: the budget was negotiated with the mayor and finally approved by the council ofelected representatives. Tallinn funds its schools by its own formula, agreed with school
directors, which is discussed in greater detail below. In all the municipalities, includingTallinn, financial administration of schools is centralized. Schools financial transactionsare operated by the municipality treasury and schools do not receive cash or have theirown commercial bank accounts for state and municipal funding. Large schools are likelyto employ a bursar or a deputy director responsible for business maers and will man-age the school accounts using the municipal treasury.
3.4.2. Municipal Per Student Funding of Schools: The Case of Tallinn
As most municipalities have few schools, sometimes with quite diff erent cost structures,a funding formula is not suited to them. Tallinn, being a large municipality, with 75 of its
own schools and 12 private schools, has developed separate formulae, one for allocatingcentral government grant to schools and the other for distributing money from the city budget. The city’s contribution to school budgets and its formulae for allocating bothmunicipal and state funding to schools is agreed with representatives of Tallinn Union ofSchool Directors. The city budget formula is set out in Table 3.15, using an example of aschool with 600 students. Schools with fewer than 501 students get an additional weight-ing per student: from 401 to 500 the weighting is 1.1; from 301 to 400 students 1.2 and for300 students or less the weighting is 1.5. Ultimately, if a small school cannot manage onits allocation it has to be reorganized or closed.
The formula for allocating the state budget to the schools closely follows state guide-
lines. The allocation is weighted by grade depending on the number of lessons specifiedin the national curriculum for each grade range of students and on maximum class size.These calculations can be seen in Table 3.16. The numbers of lessons per week for thegrades in each stage are summed: for example, stage 1 requires 73 lessons in all. The nextcolumn in Table 3.16 shows the number of teachers required to teach 1 class per gradein each stage. This is derived by dividing the lessons per week by the number of lessonsteachers are assumed to work for a full time salary. In Estonia this is between 18 and 24lessons. Tallinn assumes that teachers teach per week from 22 lessons for the youngestgrades to 20 for the highest grades. To arrive at a weight for each stage for teaching, thenumber of lessons per week required for one class in each of the 12 grades is totaled—thisis 445 lessons or an average of 111 lessons per stage. Then the actual number of lessonsrequired for each stage is divided by 111 to obtain the stage’s relative weighting. These
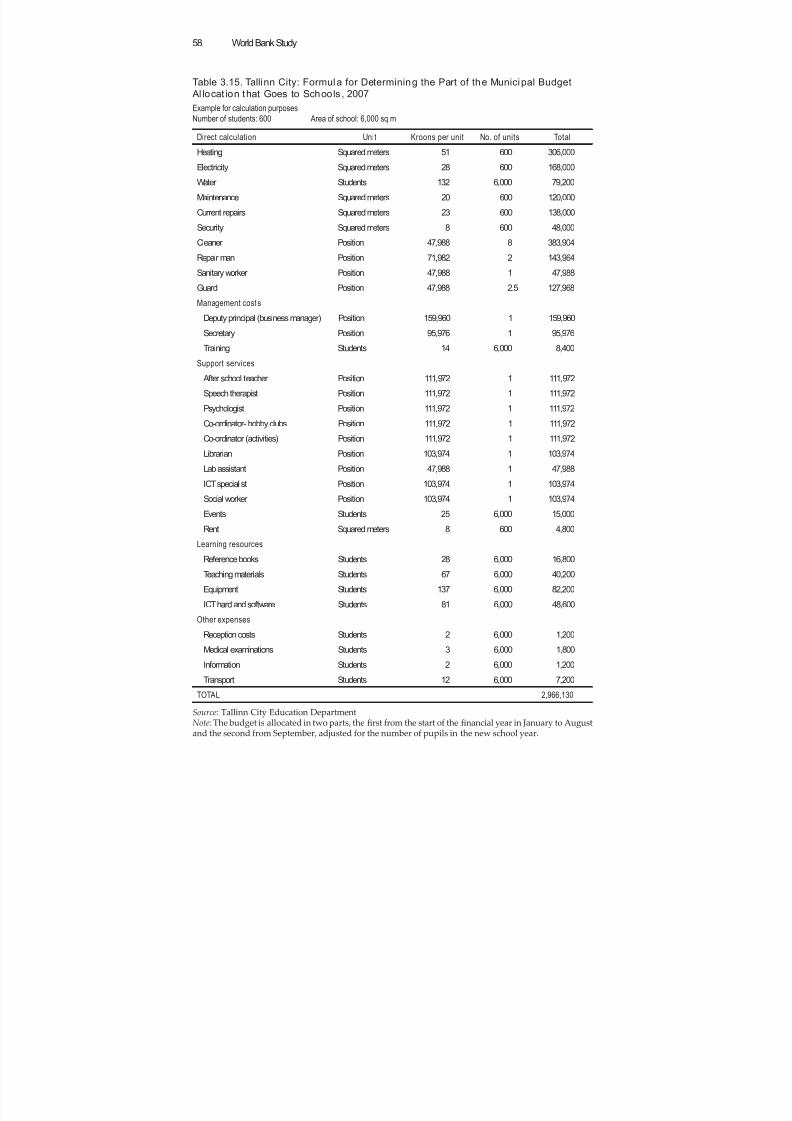
8/6/2019 Reforming Education Finance in Transition Countries
http://slidepdf.com/reader/full/reforming-education-finance-in-transition-countries 82/335
World Bank Study58
Table 3.15. Talli nn City: Formula for Determining the Part of the Municipal Budget
Al locat ion that Goes to Schools , 2007
Example for calculation purposes
Number of students: 600 Area of school: 6,000 sq m
Direct calculation Unit Kroons per unit No. of units Total
Heating Squared meters 51 600 306,000
Electricity Squared meters 28 600 168,000
Water Students 132 6,000 79,200
Maintenance Squared meters 20 600 120,000
Current repairs Squared meters 23 600 138,000
Security Squared meters 8 600 48,000
Cleaner Position 47,988 8 383,904
Repair man Position 71,982 2 143,964
Sanitary worker Position 47,988 1 47,988Guard Position 47,988 2.5 127,968
Management costs
Deputy principal (business manager) Position 159,960 1 159,960
Secretary Position 95,976 1 95,976
Training Students 14 6,000 8,400
Support services
After school teacher Position 111,972 1 111,972
Speech therapist Position 111,972 1 111,972
Psychologist Position 111,972 1 111,972Co-ordinator- hobby clubs Position 111,972 1 111,972
Co-ordinator (activities) Position 111,972 1 111,972
Librarian Position 103,974 1 103,974
Lab assistant Position 47,988 1 47,988
ICT specialist Position 103,974 1 103,974
Social worker Position 103,974 1 103,974
Events Students 25 6,000 15,000
Rent Squared meters 8 600 4,800
Learning resourcesReference books Students 28 6,000 16,800
Teaching materials Students 67 6,000 40,200
Equipment Students 137 6,000 82,200
ICT hard and software Students 81 6,000 48,600
Other expenses
Reception costs Students 2 6,000 1,200
Medical examinations Students 3 6,000 1,800
Information Students 2 6,000 1,200
Transport Students 12 6,000 7,200
TOTAL 2,966,130
Source: Tallinn City Education DepartmentNote: The budget is allocated in two parts, the first from the start of the financial year in January to Augustand the second from September, adjusted for the number of pupils in the new school year.
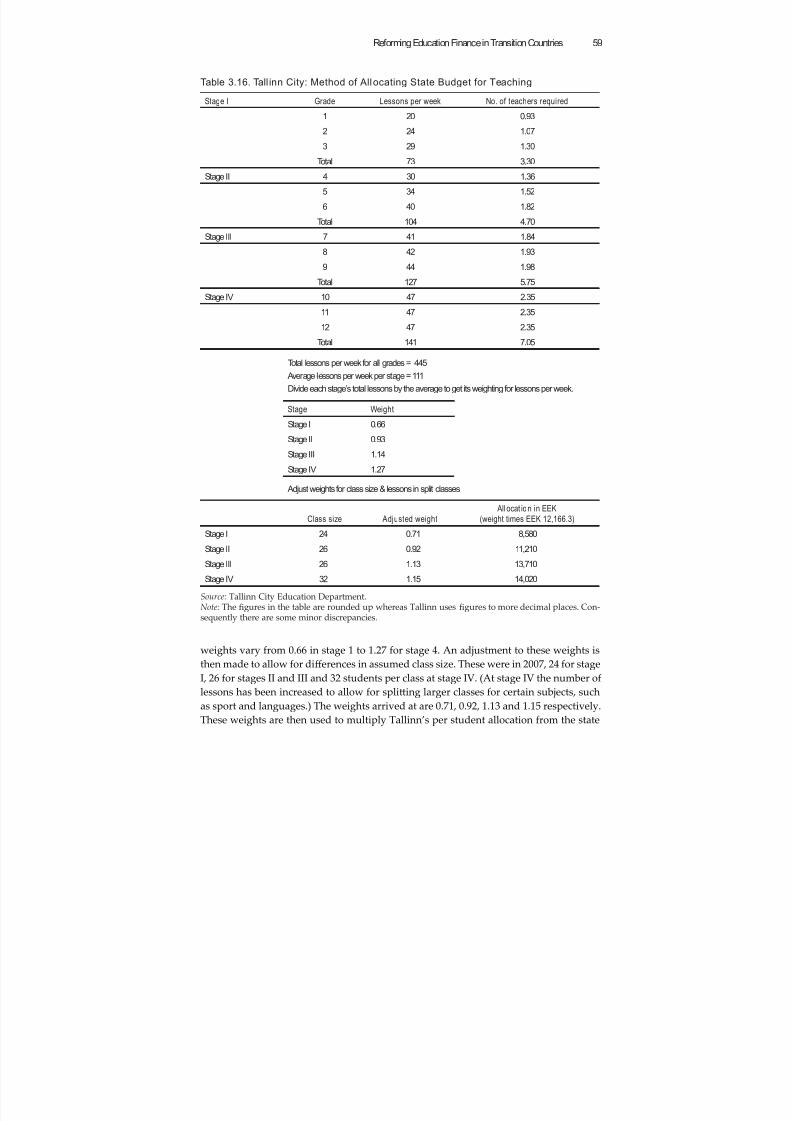
8/6/2019 Reforming Education Finance in Transition Countries
http://slidepdf.com/reader/full/reforming-education-finance-in-transition-countries 83/335
Reforming Education Finance in Transition Countries 59
Table 3.16. Tall inn City: Method of Allocating State Budget for Teaching
Stage I Grade Lessons per week No. of teachers required
1 20 0.93
2 24 1.07
3 29 1.30
Total 73 3.30
Stage II 4 30 1.36
5 34 1.52
6 40 1.82
Total 104 4.70
Stage III 7 41 1.84
8 42 1.93
9 44 1.98
Total 127 5.75
Stage IV 10 47 2.35
11 47 2.35
12 47 2.35
Total 141 7.05
Total lessons per week for all grades = 445
Average lessons per week per stage = 111
Divide each stage’s total lessons by the average to get its weighting for lessons per week.
Stage Weight Stage I 0.66
Stage II 0.93
Stage III 1.14
Stage IV 1.27
Adjust weights for class size & lessons in split classes
Class size Adjusted weight
All ocat ion in EEK
(weight times EEK 12,166.3)
Stage I 24 0.71 8,580
Stage II 26 0.92 11,210
Stage III 26 1.13 13,710
Stage IV 32 1.15 14,020
Source: Tallinn City Education Department.Note: The figures in the table are rounded up whereas Tallinn uses figures to more decimal places. Con-sequently there are some minor discrepancies.
weights vary from 0.66 in stage 1 to 1.27 for stage 4. An adjustment to these weights isthen made to allow for diff erences in assumed class size. These were in 2007, 24 for stageI, 26 for stages II and III and 32 students per class at stage IV. (At stage IV the number oflessons has been increased to allow for spliing larger classes for certain subjects, suchas sport and languages.) The weights arrived at are 0.71, 0.92, 1.13 and 1.15 respectively.These weights are then used to multiply Tallinn’s per student allocation from the state
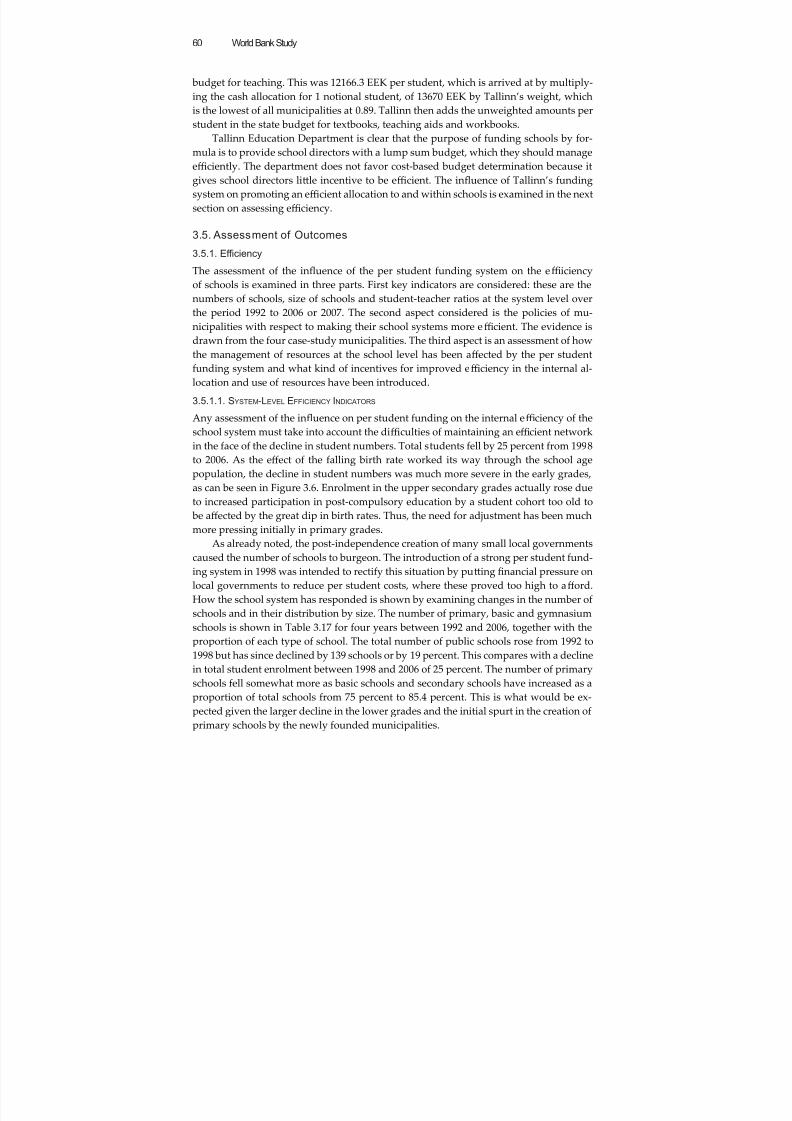
8/6/2019 Reforming Education Finance in Transition Countries
http://slidepdf.com/reader/full/reforming-education-finance-in-transition-countries 84/335
World Bank Study60
budget for teaching. This was 12166.3 EEK per student, which is arrived at by multiply-ing the cash allocation for 1 notional student, of 13670 EEK by Tallinn’s weight, whichis the lowest of all municipalities at 0.89. Tallinn then adds the unweighted amounts perstudent in the state budget for textbooks, teaching aids and workbooks.
Tallinn Education Department is clear that the purpose of funding schools by for-mula is to provide school directors with a lump sum budget, which they should manageeffi ciently. The department does not favor cost-based budget determination because itgives school directors lile incentive to be effi cient. The influence of Tallinn’s fundingsystem on promoting an effi cient allocation to and within schools is examined in the nextsection on assessing effi ciency.
3.5. Assessment of Outcomes
3.5.1. Ef ficiency
The assessment of the infl
uence of the per student funding system on the effi iciencyof schools is examined in three parts. First key indicators are considered: these are thenumbers of schools, size of schools and student-teacher ratios at the system level overthe period 1992 to 2006 or 2007. The second aspect considered is the policies of mu-nicipalities with respect to making their school systems more effi cient. The evidence isdrawn from the four case-study municipalities. The third aspect is an assessment of howthe management of resources at the school level has been aff ected by the per studentfunding system and what kind of incentives for improved effi ciency in the internal al-location and use of resources have been introduced.
3.5.1.1. SYSTEM-LEVEL EFFICIENCY INDICATORS
Any assessment of the influence on per student funding on the internal effi ciency of theschool system must take into account the diffi culties of maintaining an effi cient networkin the face of the decline in student numbers. Total students fell by 25 percent from 1998to 2006. As the eff ect of the falling birth rate worked its way through the school agepopulation, the decline in student numbers was much more severe in the early grades,as can be seen in Figure 3.6. Enrolment in the upper secondary grades actually rose dueto increased participation in post-compulsory education by a student cohort too old to be aff ected by the great dip in birth rates. Thus, the need for adjustment has been muchmore pressing initially in primary grades.
As already noted, the post-independence creation of many small local governmentscaused the number of schools to burgeon. The introduction of a strong per student fund-ing system in 1998 was intended to rectify this situation by puing financial pressure onlocal governments to reduce per student costs, where these proved too high to aff ord.How the school system has responded is shown by examining changes in the number ofschools and in their distribution by size. The number of primary, basic and gymnasiumschools is shown in Table 3.17 for four years between 1992 and 2006, together with theproportion of each type of school. The total number of public schools rose from 1992 to1998 but has since declined by 139 schools or by 19 percent. This compares with a declinein total student enrolment between 1998 and 2006 of 25 percent. The number of primary
schools fell somewhat more as basic schools and secondary schools have increased as aproportion of total schools from 75 percent to 85.4 percent. This is what would be ex-pected given the larger decline in the lower grades and the initial spurt in the creation ofprimary schools by the newly founded municipalities.
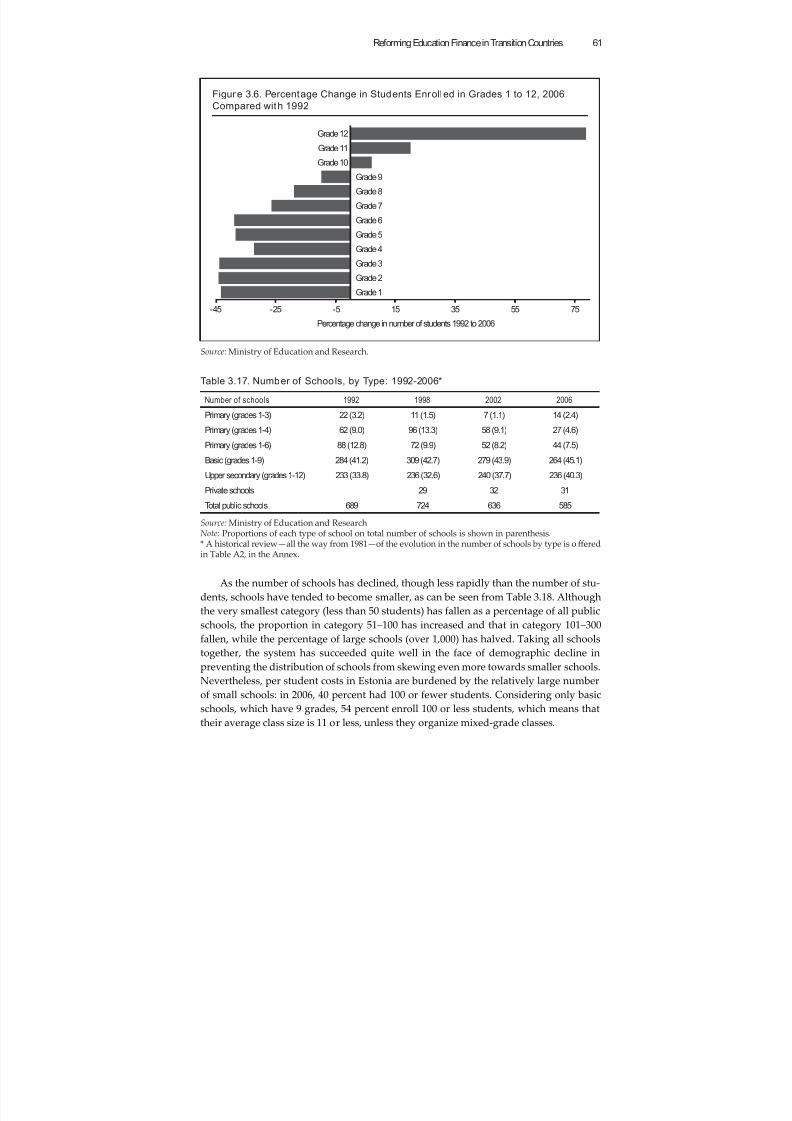
8/6/2019 Reforming Education Finance in Transition Countries
http://slidepdf.com/reader/full/reforming-education-finance-in-transition-countries 85/335
Reforming Education Finance in Transition Countries 61
As the number of schools has declined, though less rapidly than the number of stu-dents, schools have tended to become smaller, as can be seen from Table 3.18. Althoughthe very smallest category (less than 50 students) has fallen as a percentage of all publicschools, the proportion in category 51–100 has increased and that in category 101–300fallen, while the percentage of large schools (over 1,000) has halved. Taking all schoolstogether, the system has succeeded quite well in the face of demographic decline inpreventing the distribution of schools from skewing even more towards smaller schools.
Nevertheless, per student costs in Estonia are burdened by the relatively large numberof small schools: in 2006, 40 percent had 100 or fewer students. Considering only basicschools, which have 9 grades, 54 percent enroll 100 or less students, which means thattheir average class size is 11 or less, unless they organize mixed-grade classes.
Figure 3.6. Percentage Change in Students Enrolled in Grades 1 to 12, 2006
Compared with 1992
-45 -25 -5 15 35 55 75
Grade 1
Grade 2
Grade 3
Grade 4
Grade 5
Grade 6
Grade 7
Grade 8
Grade 9
Grade 10
Grade 11Grade 12
Percentage change in number of students 1992 to 2006
Source: Ministry of Education and Research.
Table 3.17. Number of Schools, by Type: 1992-2006*
Number of schools 1992 1998 2002 2006
Primary (grades 1-3) 22 (3.2) 11 (1.5) 7 (1.1) 14 (2.4)
Primary (grades 1-4) 62 (9.0) 96 (13.3) 58 (9.1) 27 (4.6)
Primary (grades 1-6) 88 (12.8) 72 (9.9) 52 (8.2) 44 (7.5)
Basic (grades 1-9) 284 (41.2) 309 (42.7) 279 (43.9) 264 (45.1)
Upper secondary (grades 1-12) 233 (33.8) 236 (32.6) 240 (37.7) 236 (40.3)
Private schools 29 32 31
Total public schools 689 724 636 585
Source: Ministry of Education and ResearchNote: Proportions of each type of school on total number of schools is shown in parenthesis.
* A historical review—all the way from 1981—of the evolution in the number of schools by type is off
eredin Table A2, in the Annex.
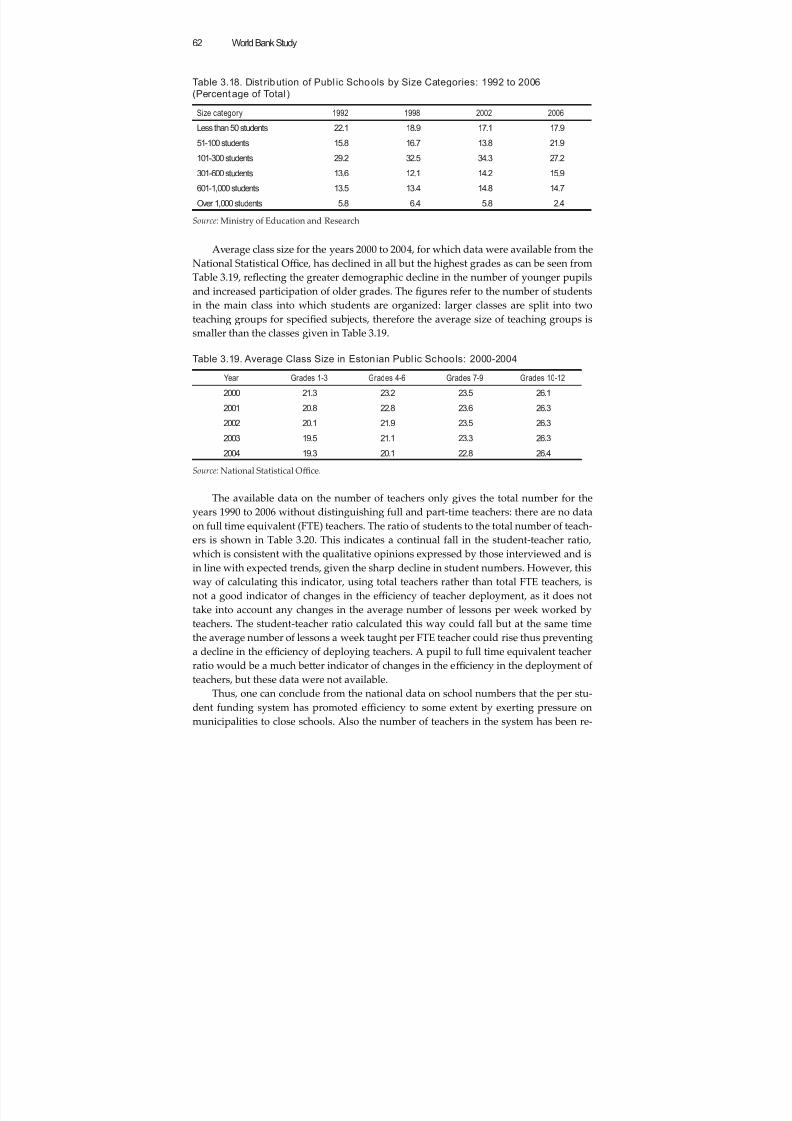
8/6/2019 Reforming Education Finance in Transition Countries
http://slidepdf.com/reader/full/reforming-education-finance-in-transition-countries 86/335
World Bank Study62
Average class size for the years 2000 to 2004, for which data were available from theNational Statistical Offi ce, has declined in all but the highest grades as can be seen from
Table 3.19, reflecting the greater demographic decline in the number of younger pupilsand increased participation of older grades. The figures refer to the number of studentsin the main class into which students are organized: larger classes are split into twoteaching groups for specified subjects, therefore the average size of teaching groups issmaller than the classes given in Table 3.19.
Table 3.19. Average Class Size in Eston ian Publ ic Schools: 2000-2004
Year Grades 1-3 Grades 4-6 Grades 7-9 Grades 10-12
2000 21.3 23.2 23.5 26.1
2001 20.8 22.8 23.6 26.32002 20.1 21.9 23.5 26.3
2003 19.5 21.1 23.3 26.3
2004 19.3 20.1 22.8 26.4
Source: National Statistical Offi ce.
The available data on the number of teachers only gives the total number for theyears 1990 to 2006 without distinguishing full and part-time teachers: there are no dataon full time equivalent (FTE) teachers. The ratio of students to the total number of teach-ers is shown in Table 3.20. This indicates a continual fall in the student-teacher ratio,which is consistent with the qualitative opinions expressed by those interviewed and isin line with expected trends, given the sharp decline in student numbers. However, thisway of calculating this indicator, using total teachers rather than total FTE teachers, isnot a good indicator of changes in the effi ciency of teacher deployment, as it does nottake into account any changes in the average number of lessons per week worked byteachers. The student-teacher ratio calculated this way could fall but at the same timethe average number of lessons a week taught per FTE teacher could rise thus preventinga decline in the effi ciency of deploying teachers. A pupil to full time equivalent teacherratio would be a much beer indicator of changes in the effi ciency in the deployment ofteachers, but these data were not available.
Thus, one can conclude from the national data on school numbers that the per stu-dent funding system has promoted effi ciency to some extent by exerting pressure onmunicipalities to close schools. Also the number of teachers in the system has been re-
Table 3.18. Dist ribution of Publ ic Schools by Size Categories: 1992 to 2006
(Percentage of Total)
Size category 1992 1998 2002 2006
Less than 50 students 22.1 18.9 17.1 17.9
51-100 students 15.8 16.7 13.8 21.9
101-300 students 29.2 32.5 34.3 27.2
301-600 students 13.6 12.1 14.2 15.9
601-1,000 students 13.5 13.4 14.8 14.7
Over 1,000 students 5.8 6.4 5.8 2.4
Source: Ministry of Education and Research
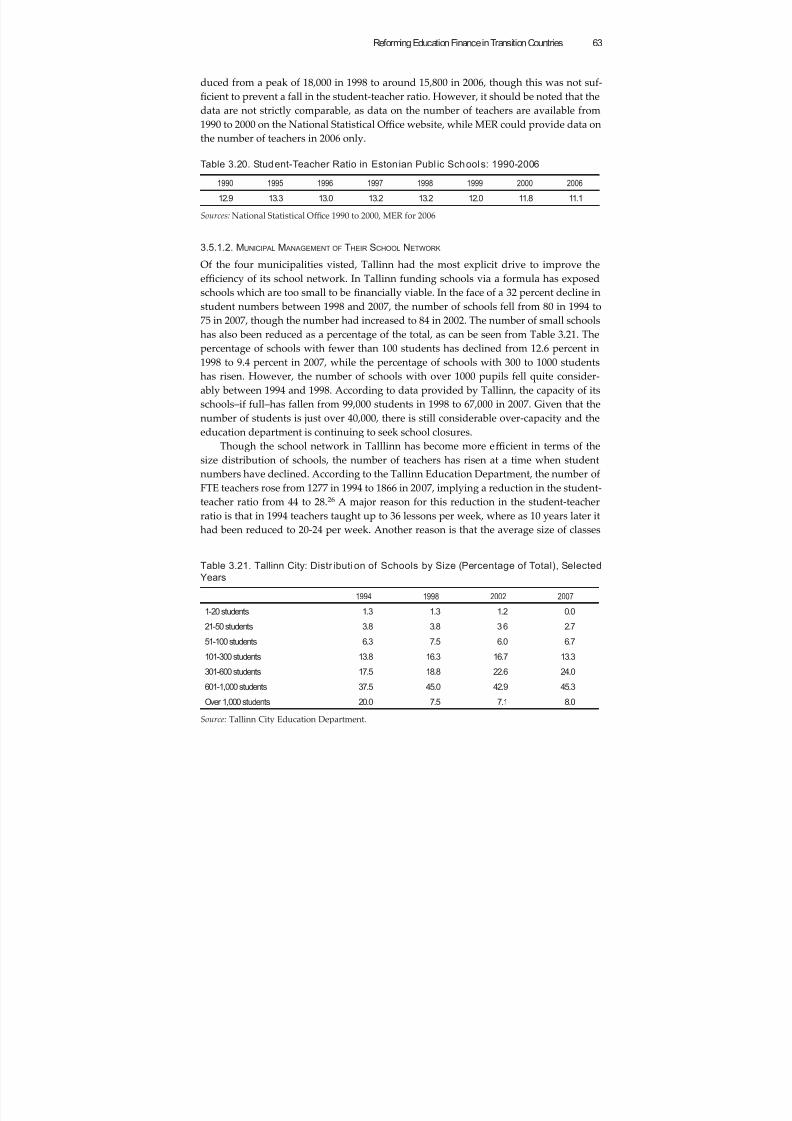
8/6/2019 Reforming Education Finance in Transition Countries
http://slidepdf.com/reader/full/reforming-education-finance-in-transition-countries 87/335
Reforming Education Finance in Transition Countries 63
duced from a peak of 18,000 in 1998 to around 15,800 in 2006, though this was not suf-ficient to prevent a fall in the student-teacher ratio. However, it should be noted that thedata are not strictly comparable, as data on the number of teachers are available from1990 to 2000 on the National Statistical Offi ce website, while MER could provide data on
the number of teachers in 2006 only.
Table 3.20. Student-Teacher Ratio in Eston ian Publ ic Schools: 1990-2006
1990 1995 1996 1997 1998 1999 2000 2006
12.9 13.3 13.0 13.2 13.2 12.0 11.8 11.1
Sources: National Statistical Offi ce 1990 to 2000, MER for 2006
3.5.1.2. MUNICIPAL M ANAGEMENT OF THEIR SCHOOL NETWORK
Of the four municipalities visted, Tallinn had the most explicit drive to improve the
effi ciency of its school network. In Tallinn funding schools via a formula has exposedschools which are too small to be financially viable. In the face of a 32 percent decline instudent numbers between 1998 and 2007, the number of schools fell from 80 in 1994 to75 in 2007, though the number had increased to 84 in 2002. The number of small schoolshas also been reduced as a percentage of the total, as can be seen from Table 3.21. Thepercentage of schools with fewer than 100 students has declined from 12.6 percent in1998 to 9.4 percent in 2007, while the percentage of schools with 300 to 1000 studentshas risen. However, the number of schools with over 1000 pupils fell quite consider-ably between 1994 and 1998. According to data provided by Tallinn, the capacity of itsschools–if full–has fallen from 99,000 students in 1998 to 67,000 in 2007. Given that thenumber of students is just over 40,000, there is still considerable over-capacity and theeducation department is continuing to seek school closures.
Though the school network in Talllinn has become more effi cient in terms of thesize distribution of schools, the number of teachers has risen at a time when studentnumbers have declined. According to the Tallinn Education Department, the number ofFTE teachers rose from 1277 in 1994 to 1866 in 2007, implying a reduction in the student-teacher ratio from 44 to 28.26 A major reason for this reduction in the student-teacherratio is that in 1994 teachers taught up to 36 lessons per week, where as 10 years later ithad been reduced to 20-24 per week. Another reason is that the average size of classes
Table 3.21. Tallinn City: Distr ibution of Schools by Size (Percentage of Total), Selected
Years
1994 1998 2002 2007
1-20 students 1.3 1.3 1.2 0.0
21-50 students 3.8 3.8 3.6 2.7
51-100 students 6.3 7.5 6.0 6.7
101-300 students 13.8 16.3 16.7 13.3
301-600 students 17.5 18.8 22.6 24.0
601-1,000 students 37.5 45.0 42.9 45.3
Over 1,000 students 20.0 7.5 7.1 8.0
Source: Tallinn City Education Department.
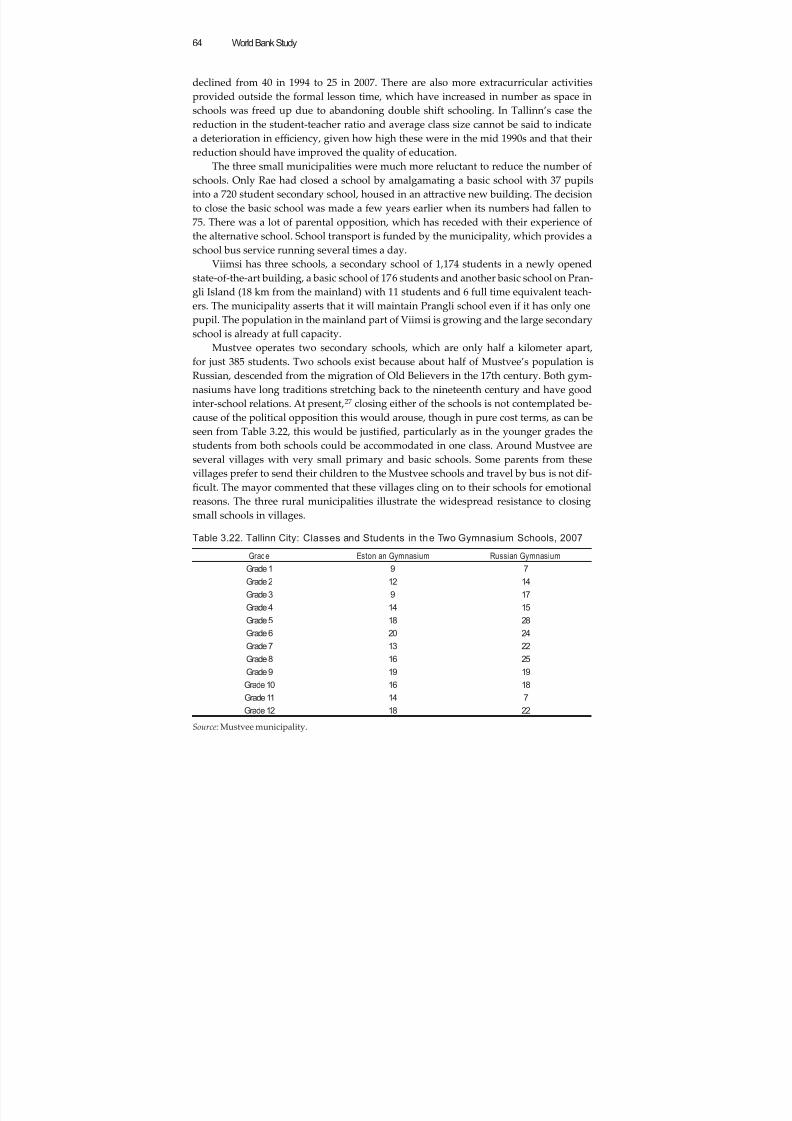
8/6/2019 Reforming Education Finance in Transition Countries
http://slidepdf.com/reader/full/reforming-education-finance-in-transition-countries 88/335
World Bank Study64
declined from 40 in 1994 to 25 in 2007. There are also more extracurricular activitiesprovided outside the formal lesson time, which have increased in number as space inschools was freed up due to abandoning double shift schooling. In Tallinn’s case thereduction in the student-teacher ratio and average class size cannot be said to indicate
a deterioration in effi ciency, given how high these were in the mid 1990s and that theirreduction should have improved the quality of education.
The three small municipalities were much more reluctant to reduce the number ofschools. Only Rae had closed a school by amalgamating a basic school with 37 pupilsinto a 720 student secondary school, housed in an aractive new building. The decisionto close the basic school was made a few years earlier when its numbers had fallen to75. There was a lot of parental opposition, which has receded with their experience ofthe alternative school. School transport is funded by the municipality, which provides aschool bus service running several times a day.
Viimsi has three schools, a secondary school of 1,174 students in a newly opened
state-of-the-art building, a basic school of 176 students and another basic school on Pran-gli Island (18 km from the mainland) with 11 students and 6 full time equivalent teach-ers. The municipality asserts that it will maintain Prangli school even if it has only onepupil. The population in the mainland part of Viimsi is growing and the large secondaryschool is already at full capacity.
Mustvee operates two secondary schools, which are only half a kilometer apart,for just 385 students. Two schools exist because about half of Mustvee’s population isRussian, descended from the migration of Old Believers in the 17th century. Both gym-nasiums have long traditions stretching back to the nineteenth century and have goodinter-school relations. At present,27 closing either of the schools is not contemplated be-cause of the political opposition this would arouse, though in pure cost terms, as can beseen from Table 3.22, this would be justified, particularly as in the younger grades thestudents from both schools could be accommodated in one class. Around Mustvee areseveral villages with very small primary and basic schools. Some parents from thesevillages prefer to send their children to the Mustvee schools and travel by bus is not dif-ficult. The mayor commented that these villages cling on to their schools for emotionalreasons. The three rural municipalities illustrate the widespread resistance to closingsmall schools in villages.
Table 3.22. Tallinn City: Classes and Students in the Two Gymnasium Schools, 2007
Grade Estonian Gymnasium Russian Gymnasium
Grade 1 9 7
Grade 2 12 14
Grade 3 9 17
Grade 4 14 15
Grade 5 18 28
Grade 6 20 24
Grade 7 13 22
Grade 8 16 25
Grade 9 19 19
Grade 10 16 18Grade 11 14 7
Grade 12 18 22
Source: Mustvee municipality.
8/6/2019 Reforming Education Finance in Transition Countries
http://slidepdf.com/reader/full/reforming-education-finance-in-transition-countries 89/335
Reforming Education Finance in Transition Countries 65
3.5.13. MUNICIPAL M ANAGEMENT OF SCHOOL RESOURCES
Tallinn’s formula funding regime is intended to promote internal effi ciency withinschools by “placing demands on school directors that they find the most economicalway of running their school” (Tallinn Director of Education Services). The other three
municipalities fund their schools by agreeing a budget for each school which will pay forthe number of classes the municipality agrees to fund and hence the consequent teacherhours required by MER regulations, with additional teaching time funded at the munici-pality’s discretion. The school budgets include funding for non-classroom based staff ,utlities, maintenance and learning materials. Viimsi requires each school to produce adevelopment plan to support its budget proposals. Both Rae and Viimsi have great dif-ferences in expenditure per student in their schools because of diff erences in their size.This is particularly marked in Viimsi where Prangli school’s (11 students) recurrent costsper student were 173,000 EEK in 2007 compared 46,000 EEK at Viimsi secondary school(1,174 pupils). While Viimsi secondary school teaching allocation per student are rough-ly the same as the per student state grant, the municipality funds higher teaching costsat the other two schools from its own revenues.
Viimsi puts pressure on school directors to manage their budgets effi ciently by giv-ing them the annual budget as a control total within which the school director mustmanage. Once agreed, the school director has to manage the schools’ expenditureswithin the control total. The other two municipalities practiced traditional input-based budget allocation and reimbursed expenditures. Apart from their ability to influence theannual budget selement, these school directors’ subsequent discretion was limited tocertain non-staff items, such as learning materials.
All four municipalities have centralised accounting systems. While the schools haveindividual budgets, the financial transactions are administered by the municipality.This saves on the costs of employing personnel with accounting skills at school level,which would not be an effi cient use of resources for small schools. Tallinn has recentlycentralised its school accounting, eliminating the diff erent accounting systems used byschools in favor of a single accounting software package. Schools never handle cash. Thetwo school directors interviewed considered the system worked well, for example in-voices are paid in a day. This compared favorably with the previous arrangement whenthe school had to order cash some time in advance before being able to order and pay forgoods and services. The interview evidence indicates that the municipalities operate an
effi cient accounting system for schools. In part this reflects the early adoption of comput-erized accounting in the Estonian public sector.The four municipalities have spent considerable sums in recent years on refurbish-
ing school buildings. The schools visited were quite well-maintained, while some hadreceived lavish renovation (e.g. two had an olympic standard swimmming pool) andtwo schools had been relocated in new buildings. As central government limits mu-nicipal borrowing to 60 percent of their annual revenues, municipalities have to findother sources of capital funding. Rae sold municipal assets such as land to invest in anew building for its largest school, Juri Gymnasium. Viimsi, being short of its own land,devised a public finance initative scheme to fund a new building for Viimsi secondary
school. The municipality set up a private company, which could borrow on the capitalmarket, to build the school.28 Now that the school has been built, the company rentsthe building to the school and charges for its services in operating the building. The ef-
8/6/2019 Reforming Education Finance in Transition Countries
http://slidepdf.com/reader/full/reforming-education-finance-in-transition-countries 90/335
World Bank Study66
ficiency of this arrangement is questionable. The school director can no longer directlymanage the school building. The quality of cleaning is poor and the school director cando lile to improve it. The annual building operation cost (including rent) per student is21,000 EEK or 46 percent of the school budget, which is extremely high.
3.5.1.4. THE RELATIONSHIP BETWEEN RESOURCE M ANAGEMENT AND LEARNING OUTCOMES
The line of accountability between responsibility for providing schools with resourcesand accountability for the quality of learning outcomes in the Estonian education systemis blurred by the joint responsibility of MER and municipalities for funding schools and by the remaining role of the county education department in inspecting and evaluatingschools. MER regulates educational standards through legislation specifying the statenational curriculum content and teaching times. Maximum class sizes are also specified.There are national tests at grades 3, 6, 9 and 12, but only the results of tests at grades 9and 12 are publicly available. They are published at school level by the press for the best
100 schools. The county education departments used to inspect schools by observinglessons and testing students in grades 3 and 6 and making comparisons with nationalaverages. This inspection regime has been recently replaced by school self-evaluation inwhich schools evaluate their processes. The education departments provide schools withtraining for self-evaluation as well as professional development and consultancy advicefor teachers and schools. Three percent of the state grant for teacher salaries should bespent on teacher professional development and county education department inspectorscan put pressure on municipalities if they think insuffi cient is being spent on training orlearning materials.
There is some debate as to whether county education departments still have a useful
function. For a large municipality, like Tallinn, the value of a parallel organization withresponsibility for school quality is questioned. However, small municipalities do nothave the resources to employ staff for monitoring and promoting school quality. Tallinnhas an explicit education strategy in which the main priorities are managing the educa-tion network so as to provide every child with a place according to their needs and abili-ties, and improving the learning environment and the quality of management. Tallinnhas promoted and funded ICT in schools, including the e-school which provides parentswith detailed information about their child’s school and the child’s progress. Tallinn alsouses a system of performance related pay for school directors who are evaluated annu-ally on their management of staff , finances, student learning and behavior, and external
relations. Evidence examined includes student drop out and test results.Currently, there is lack of data on which to assess the comparative quality of schools
in value added terms. As far as has been ascertained, no value added analysis of thegrade 9 and 12 test results or of PISA 2006 scores was available at the time of writing. Thelack of such data makes it particularly diffi cult to make any judgement of the influenceof per student funding on students’ learning outcomes. Some experts express concernthat per student funding, by rewarding schools which recruit well, contributes to in-creased diff erences in educational aainment between schools as parents become morecompetitive in their aempts to secure a place for their child at an elite school. Becausesecondary schools recruit pupils from grade 1, pressures on children to secure selection
to a high performing school can start very young in areas where parents have choice ofschool. Some parents compete to secure places at those kindergartens which focus onpreparing children for selection tests to elite schools at seven years old. Competition
8/6/2019 Reforming Education Finance in Transition Countries
http://slidepdf.com/reader/full/reforming-education-finance-in-transition-countries 91/335
Reforming Education Finance in Transition Countries 67
for school places at an early age is due to the pre-independence structure of the schoolsystem: post-communist pressures for individual economic success in the labor marketand per student funding of schools have further accentuated it. However, changing thestructure of the school system to eliminate all-age schools (even in urban areas) is not
on the political agenda, despite the reported concerns of educationists about the unde-sirable eff ects of such selection, especially on children who fail to get selected for ‘elite’schools.
Box 3.2. Per Student Funding: Ef fi ciency Effects on Private Schools in Estonia
The funding formula has encouraged the development of private schools, though at 30 or so,
taking 3 percent of students. This is still a small sector. This has provided a greater range of
schools since the private schools are quite varied in character. They are not all expensive and
exclusive schools for rich parents. There are a few international schools (these teach in Eng-
lish for both ex-patriate children as well as local children whose parents wish them to acquirefluency in English) and others, like Rocca al Mare, founded to promote specific educational
values. Others cater for children with special needs. An interesting development is that some
have been set up to fill a market niche for students who have attended secondary schools
for grades 10-12 but failed to qualify for higher education and also failed to gain vocational
qualifications by opting for the academic stream.
3.5.1.5. THE M ANAGEMENT OF RESOURCES WITHIN THE SCHOOL
Having now considered effi ciency issues at the national and municipal level, the nextand last level to examine is the school. To what extent does the funding system promote
effi cient management of resources within schools? Evidence from nine schools visitedin the four municipalities is drawn upon in considering how budgetary allocations aremade within schools, focusing on determining the numbers and pay of teachers andnon-teaching staff and on non-staff expenditures.
Municipalities and schools have some freedom with respect to teacher pay. There isno longer any diff erentiation of teacher pay by experience, as in soviet times. Salaries arediff erentiated according to four grades of teacher. Schools can assess teacher suitabilityfor the first three grades. For the highest grade a teacher must take courses and pres-ent a portfolio and application to the National Examinations and Qualifications Center.Teachers must be paid the basic national salary for their grade. Municipalities can decide
on their own salary rates in excess of the national basic rate. Viimsi, for example, hasdecided to pay 10-15 percent more than Tallinn in order to aract teachers. It also paysdiff erent salary rates at its three schools. Teachers in Viimsi secondary school get paidmore as they teach larger classes. Teachers at the island school receive 20 percent moreas this is mandated at state level. There is also variability in the number of lessons a weeka teacher is required to teach for a full time salary of between 18 to 24 lessons a week. Thisprovides some flexibility for schools with a tight budget to require more lessons per weekor for schools which can aff ord it to award teachers by requiring fewer lessons per week.
The amount of grant allocated by the formula is designed to be suffi cient so thatin most schools there is money left over in the state funded part of the budget after basic salaries have been paid which is used for additional payments to teachers. Theschool director has the main say in determining the criteria for the bonuses, which var-ied amongst the schools visited. All awarded teachers for extra work, such as overtime,
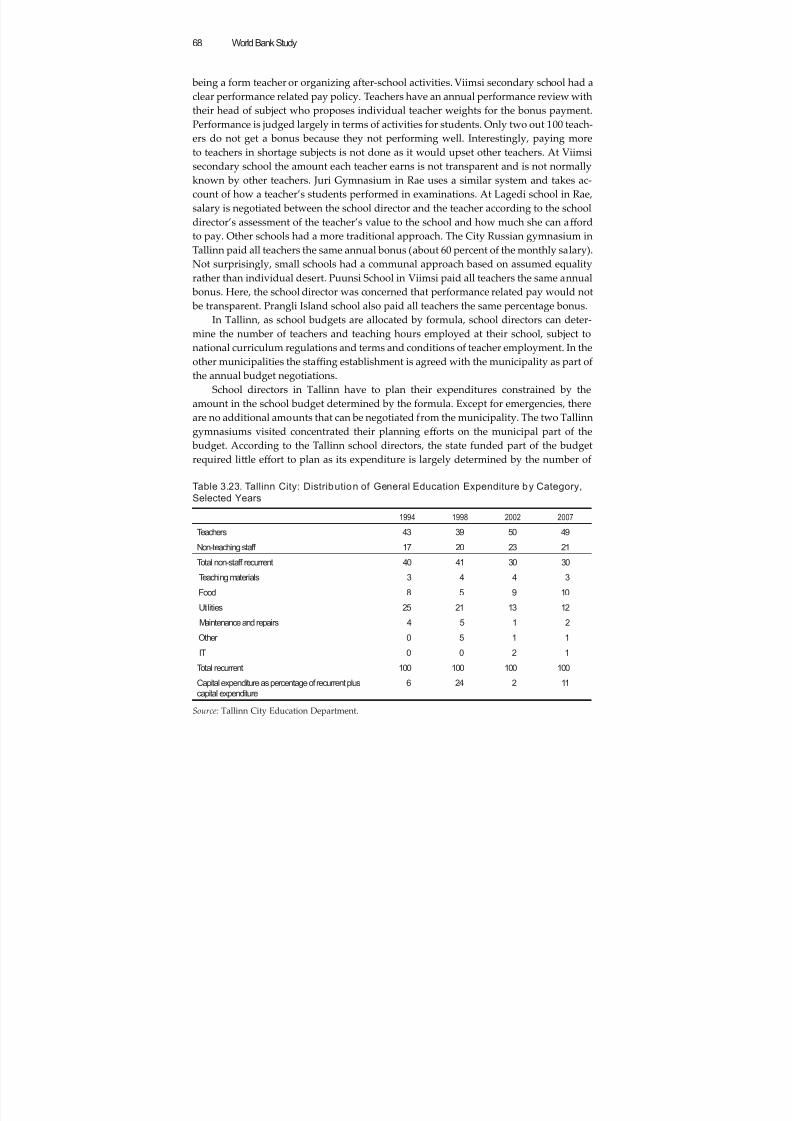
8/6/2019 Reforming Education Finance in Transition Countries
http://slidepdf.com/reader/full/reforming-education-finance-in-transition-countries 92/335
World Bank Study68
being a form teacher or organizing after-school activities. Viimsi secondary school had aclear performance related pay policy. Teachers have an annual performance review withtheir head of subject who proposes individual teacher weights for the bonus payment.Performance is judged largely in terms of activities for students. Only two out 100 teach-
ers do not get a bonus because they not performing well. Interestingly, paying moreto teachers in shortage subjects is not done as it would upset other teachers. At Viimsisecondary school the amount each teacher earns is not transparent and is not normallyknown by other teachers. Juri Gymnasium in Rae uses a similar system and takes ac-count of how a teacher’s students performed in examinations. At Lagedi school in Rae,salary is negotiated between the school director and the teacher according to the schooldirector’s assessment of the teacher’s value to the school and how much she can aff ordto pay. Other schools had a more traditional approach. The City Russian gymnasium inTallinn paid all teachers the same annual bonus (about 60 percent of the monthly salary).Not surprisingly, small schools had a communal approach based on assumed equality
rather than individual desert. Puunsi School in Viimsi paid all teachers the same annual bonus. Here, the school director was concerned that performance related pay would not be transparent. Prangli Island school also paid all teachers the same percentage bonus.
In Tallinn, as school budgets are allocated by formula, school directors can deter-mine the number of teachers and teaching hours employed at their school, subject tonational curriculum regulations and terms and conditions of teacher employment. In theother municipalities the staffi ng establishment is agreed with the municipality as part ofthe annual budget negotiations.
School directors in Tallinn have to plan their expenditures constrained by theamount in the school budget determined by the formula. Except for emergencies, thereare no additional amounts that can be negotiated from the municipality. The two Tallinngymnasiums visited concentrated their planning eff orts on the municipal part of the budget. According to the Tallinn school directors, the state funded part of the budgetrequired lile eff ort to plan as its expenditure is largely determined by the number of
Table 3.23. Tallinn City: Distribution of General Education Expenditure by Category,
Selected Years
1994 1998 2002 2007
Teachers 43 39 50 49
Non-teaching staff 17 20 23 21Total non-staff recurrent 40 41 30 30
Teaching materials 3 4 4 3
Food 8 5 9 10
Utilities 25 21 13 12
Maintenance and repairs 4 5 1 2
Other 0 5 1 1
IT 0 0 2 1
Total recurrent 100 100 100 100
Capital expenditure as percentage of recurrent pluscapital expenditure 6 24 2 11
Source: Tallinn City Education Department.
8/6/2019 Reforming Education Finance in Transition Countries
http://slidepdf.com/reader/full/reforming-education-finance-in-transition-countries 93/335
Reforming Education Finance in Transition Countries 69
teachers that can be aff orded from the state part of the budget. The municipal part ofthe budget is planned by first estimating all unavoidable expenditures and out of theremainder the school director decides how much is available to pay the technical andadministrative staff as well as for learning resources.
Municipalities fund non-teaching staff from their own revenues. This term is usedto cover all staff who are not classroom-based teachers, and includes school directors,deputies, educational psychologists and speech therapists as well as clerical staff andcleaners. The state makes a contribution to the salaries of school directors and deputies, but not other non-teaching staff categories. The MER has regulations, issued in 1999,specifying in some considerable detail, similar to the soviet era staffi ng norms, the non-teaching staff posts schools should have depending on school type and size (MER, 1999).Municipalities need to take account of these norms when determining their school bud-gets, as can be seen in Tallinn’s funding formula in Table 3.15. When schools are smallthe municipality will fund a post, such as psychologist or speech therapist to cover sev-
eral schools, or expect a large school to share staff services with smaller schools. Schooldirectors have some discretion in the employment of non-teaching staff . For example thediretor of a Russian gymnasium in Tallinn had been forced by a falling budget allocationdue to decling students numbers to fire one of the 3 cloakroom aendants. He statedthat the use of cleaners had become more effi cient since the introduction of funding byformula. The MER was not able to provide data on the number of non-teaching staff em-ployed at schools over time. Tallinn did provide such data, which show a steady increasefrom 387 in 1994 to 735 in 2007. This is due to schols employing new kinds of staff , inparticular IT support staff and more security guards. Thus, there is lile evidence thatper student funding has been able to improve effi ciency in the use of non-teaching staff apart from in some instances economising on cleaning staff .
One indicator of ineffi ciency in resource utilization at school level is a high pro-portion of recurrent expenditure on staff compared to the OECD average of around 19percent.29 Transition states were often characterized by a very high proportion of ex-penditure on gross wage costs as during a period of reduced funding for education staff posts were protected at the expense of non-staff expenditures, in particular buildingsmaintenance and learning materials. Of course, economic recovery and higher educa-tion spending can correct this tendency. Per student funding, if accompanied by greaterschool autonomy over budgeting, is also expected to promote some re-allocation of re-
sources if schools no longer need to adhere to regulations on staffi
ng norms and can overtime shift spending from salaries to non-staff expenditures. MER was not able to providedata at national level on the distribution of education expenditure between diff erenteconomic categories. However, Tallinn was able to do this for selected years from 1994 to2007. As shown in Table 3.23 the proportion of expenditure on staff in 1994 was relativelylow at 60 percent and has increased to 70 percent over the period to 2007. The fall in thepercentage of expenditure that is for non-staff items is largely due to the fall in expen-diture on utilities from 25 percent to 12 percent. The increase in the percentage spent onstaff could be explained by increased flexibility in pay rates now that municipalities canset their own salaries, though teachers are still regarded as relatively lowly paid.
3.5.1.6. COMPARISON OF 1998-2007 AND 2008 FORMULAE
Comparing the effi ciency incentives signaled by the previoius and the revised formulaeis not easy as it is too early to tell how municipalities will react to the 2008 formula. The
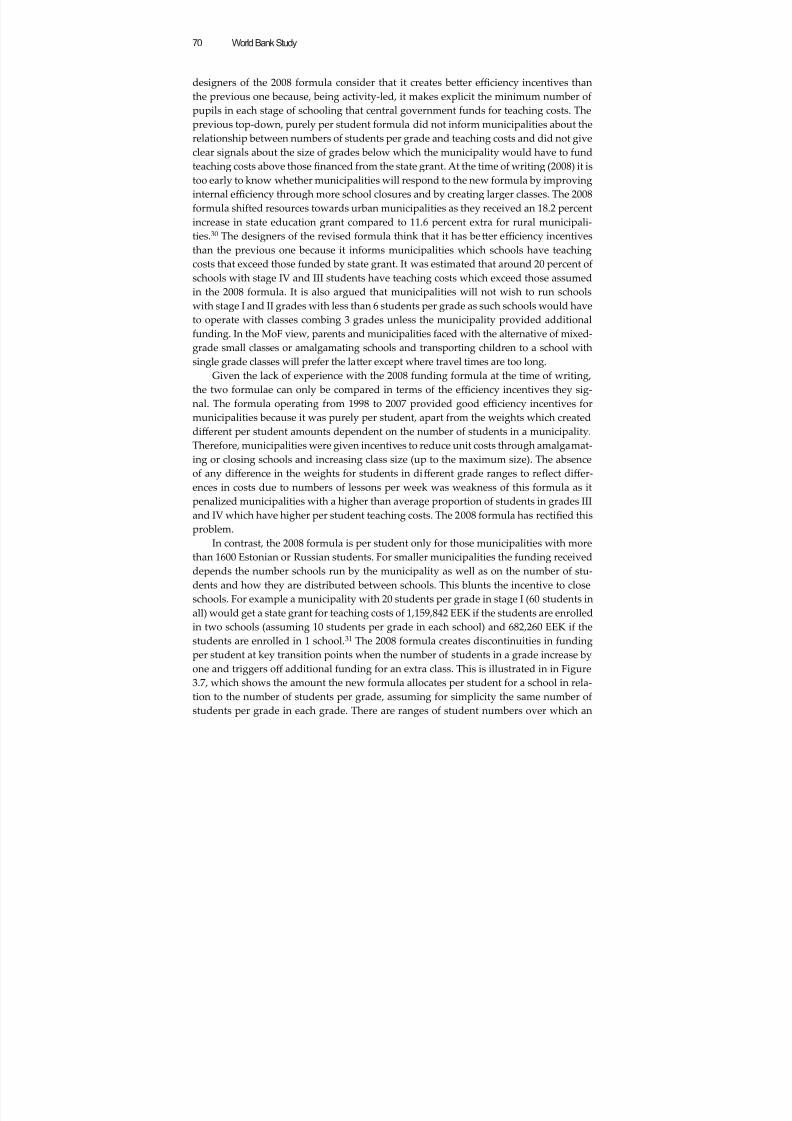
8/6/2019 Reforming Education Finance in Transition Countries
http://slidepdf.com/reader/full/reforming-education-finance-in-transition-countries 94/335
World Bank Study70
designers of the 2008 formula consider that it creates beer effi ciency incentives thanthe previous one because, being activity-led, it makes explicit the minimum number ofpupils in each stage of schooling that central government funds for teaching costs. Theprevious top-down, purely per student formula did not inform municipalities about the
relationship between numbers of students per grade and teaching costs and did not giveclear signals about the size of grades below which the municipality would have to fundteaching costs above those financed from the state grant. At the time of writing (2008) it istoo early to know whether municipalities will respond to the new formula by improvinginternal effi ciency through more school closures and by creating larger classes. The 2008formula shifted resources towards urban municipalities as they received an 18.2 percentincrease in state education grant compared to 11.6 percent extra for rural municipali-ties.30 The designers of the revised formula think that it has beer effi ciency incentivesthan the previous one because it informs municipalities which schools have teachingcosts that exceed those funded by state grant. It was estimated that around 20 percent of
schools with stage IV and III students have teaching costs which exceed those assumedin the 2008 formula. It is also argued that municipalities will not wish to run schoolswith stage I and II grades with less than 6 students per grade as such schools would haveto operate with classes combing 3 grades unless the municipality provided additionalfunding. In the MoF view, parents and municipalities faced with the alternative of mixed-grade small classes or amalgamating schools and transporting children to a school withsingle grade classes will prefer the laer except where travel times are too long.
Given the lack of experience with the 2008 funding formula at the time of writing,the two formulae can only be compared in terms of the effi ciency incentives they sig-nal. The formula operating from 1998 to 2007 provided good effi ciency incentives formunicipalities because it was purely per student, apart from the weights which createddiff erent per student amounts dependent on the number of students in a municipality.Therefore, municipalities were given incentives to reduce unit costs through amalgamat-ing or closing schools and increasing class size (up to the maximum size). The absenceof any diff erence in the weights for students in diff erent grade ranges to reflect diff er-ences in costs due to numbers of lessons per week was weakness of this formula as itpenalized municipalities with a higher than average proportion of students in grades IIIand IV which have higher per student teaching costs. The 2008 formula has rectified thisproblem.
In contrast, the 2008 formula is per student only for those municipalities with morethan 1600 Estonian or Russian students. For smaller municipalities the funding receiveddepends the number schools run by the municipality as well as on the number of stu-dents and how they are distributed between schools. This blunts the incentive to closeschools. For example a municipality with 20 students per grade in stage I (60 students inall) would get a state grant for teaching costs of 1,159,842 EEK if the students are enrolledin two schools (assuming 10 students per grade in each school) and 682,260 EEK if thestudents are enrolled in 1 school.31 The 2008 formula creates discontinuities in fundingper student at key transition points when the number of students in a grade increase byone and triggers off additional funding for an extra class. This is illustrated in in Figure
3.7, which shows the amount the new formula allocates per student for a school in rela-tion to the number of students per grade, assuming for simplicity the same number ofstudents per grade in each grade. There are ranges of student numbers over which an
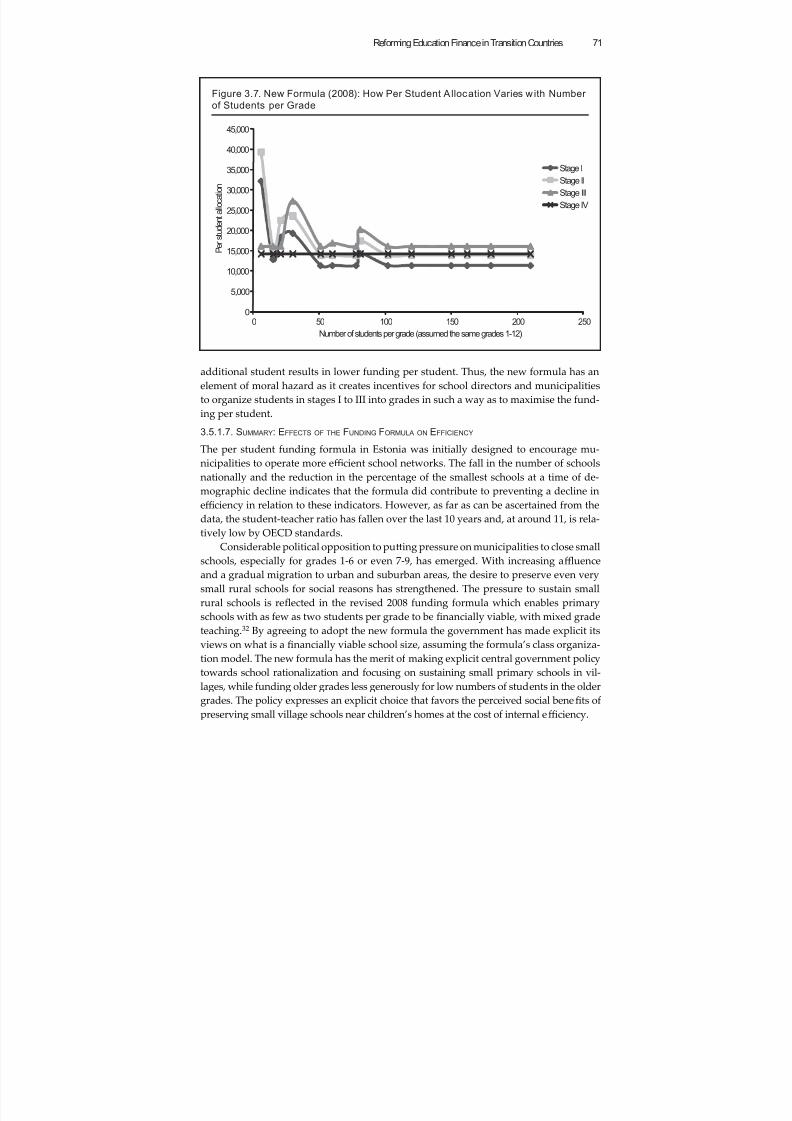
8/6/2019 Reforming Education Finance in Transition Countries
http://slidepdf.com/reader/full/reforming-education-finance-in-transition-countries 95/335
Reforming Education Finance in Transition Countries 71
additional student results in lower funding per student. Thus, the new formula has anelement of moral hazard as it creates incentives for school directors and municipalitiesto organize students in stages I to III into grades in such a way as to maximise the fund-
ing per student.3.5.1.7. SUMMARY: EFFECTS OF THE FUNDING FORMULA ON EFFICIENCY
The per student funding formula in Estonia was initially designed to encourage mu-nicipalities to operate more effi cient school networks. The fall in the number of schoolsnationally and the reduction in the percentage of the smallest schools at a time of de-mographic decline indicates that the formula did contribute to preventing a decline ineffi ciency in relation to these indicators. However, as far as can be ascertained from thedata, the student-teacher ratio has fallen over the last 10 years and, at around 11, is rela-tively low by OECD standards.
Considerable political opposition to puing pressure on municipalities to close smallschools, especially for grades 1-6 or even 7-9, has emerged. With increasing affl uenceand a gradual migration to urban and suburban areas, the desire to preserve even verysmall rural schools for social reasons has strengthened. The pressure to sustain smallrural schools is reflected in the revised 2008 funding formula which enables primaryschools with as few as two students per grade to be financially viable, with mixed gradeteaching.32 By agreeing to adopt the new formula the government has made explicit itsviews on what is a financially viable school size, assuming the formula’s class organiza-tion model. The new formula has the merit of making explicit central government policytowards school rationalization and focusing on sustaining small primary schools in vil-
lages, while funding older grades less generously for low numbers of students in the oldergrades. The policy expresses an explicit choice that favors the perceived social benefits ofpreserving small village schools near children’s homes at the cost of internal effi ciency.
Figure 3.7. New Formula (2008): How Per Student A llocation Varies w ith Number
of Students per Grade
0
5,000
10,000
15,000
20,000
25,000
30,000
35,000
40,000
45,000
0 50 100 150 200 250
P e r s t u d e n t a l l o c a t i o n
Number of students per grade (assumed the same grades 1-12)
Stage I
Stage II
Stage III
Stage IV
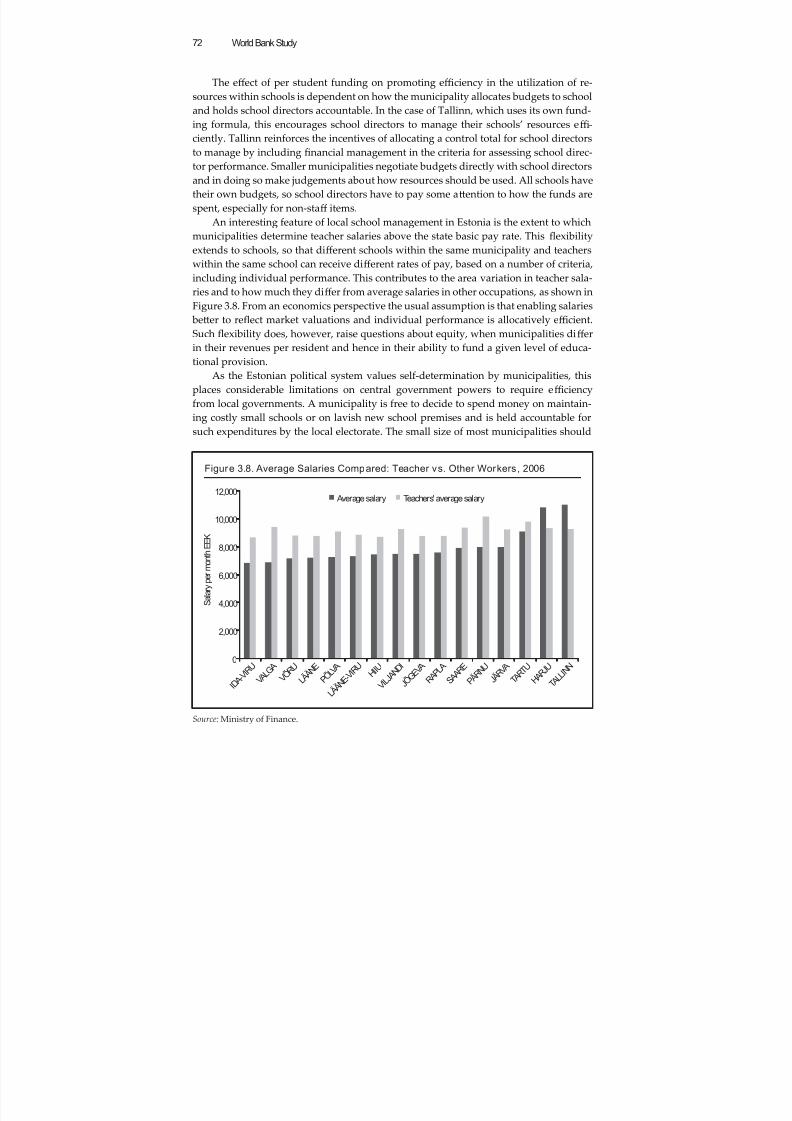
8/6/2019 Reforming Education Finance in Transition Countries
http://slidepdf.com/reader/full/reforming-education-finance-in-transition-countries 96/335
World Bank Study72
The eff ect of per student funding on promoting effi ciency in the utilization of re-sources within schools is dependent on how the municipality allocates budgets to schooland holds school directors accountable. In the case of Tallinn, which uses its own fund-ing formula, this encourages school directors to manage their schools’ resources effi -
ciently. Tallinn reinforces the incentives of allocating a control total for school directorsto manage by including financial management in the criteria for assessing school direc-tor performance. Smaller municipalities negotiate budgets directly with school directorsand in doing so make judgements about how resources should be used. All schools havetheir own budgets, so school directors have to pay some aention to how the funds arespent, especially for non-staff items.
An interesting feature of local school management in Estonia is the extent to whichmunicipalities determine teacher salaries above the state basic pay rate. This flexibilityextends to schools, so that diff erent schools within the same municipality and teacherswithin the same school can receive diff erent rates of pay, based on a number of criteria,
including individual performance. This contributes to the area variation in teacher sala-ries and to how much they diff er from average salaries in other occupations, as shown inFigure 3.8. From an economics perspective the usual assumption is that enabling salaries beer to reflect market valuations and individual performance is allocatively effi cient.Such flexibility does, however, raise questions about equity, when municipalities diff erin their revenues per resident and hence in their ability to fund a given level of educa-tional provision.
As the Estonian political system values self-determination by municipalities, thisplaces considerable limitations on central government powers to require effi ciencyfrom local governments. A municipality is free to decide to spend money on maintain-ing costly small schools or on lavish new school premises and is held accountable forsuch expenditures by the local electorate. The small size of most municipalities should
Figure 3.8. Average Salaries Compared: Teacher vs. Other Workers, 2006
Source: Ministry of Finance.
0
2,000
4,000
6,000
8,000
10,000
12,000
I D A - V I R U
V A L G
A
V Õ R U
L Ä Ä N E
P Õ L V A
L Ä Ä N E - V I R U H I
I U
V I L J
A N D I
J Õ G
E V A
R A P L
A
S A A R E
P Ä R N U
J Ä R V
A
T A R T U
H A R J U
T A L L I N
N
S a l a r y p e r m o n t h E
E K
Average salary Teachers' average salary
8/6/2019 Reforming Education Finance in Transition Countries
http://slidepdf.com/reader/full/reforming-education-finance-in-transition-countries 97/335
Reforming Education Finance in Transition Countries 73
make it easier for local people to have greater involvement in local democratic decisionmaking and be beer informed about it than in large local government jurisdictions.Resource allocations that are internally effi cient using narrow criteria of cost per studentfor a given quality of education, may well be diff erent from those that are selected by
collective local preference for a wider range of social objectives. Given the value placedon the freedom of local governments to determine their own priorities and the relativeweakness of central governments formed from coalitions of parties, the absence of astrong drive from central government to improve the internal effi ciency of the educationsystem is understandable, especially in a period when the total demand of the schoolingsystem on the public purse has been declining due to the falling number of children andrising public revenues.
Overall, the relative effi ciency of the Estonian education system, as far as can be judged by international comparisons of expenditure per student relative to GDP percapita and the results in the PISA 2006, is high. Estonia scored significantly above the
OECD average in maths, reading and science—where it came fifth. The proportion ofhigh scoring students in science was high and that of low scoring students small. Thisgood performance was acheived with a expenditure only slightly higher than the OECDaverage. Estonian lower secondary student expenditure as a ratio of GDP per capita was0.25 in 2004 compared to the OECD average of 0.23.33
3.5.2. Equity
In assessing the per student funding system in relation to equity, vertical and horizontalequity are considered.
3.5.2.1. VERTICAL EQUITY
Vertical equity refers to the unequal treatment of unequals (Monk 1990). Here two di-mensions of inequality are considered: diff erences in students’ learning needs as defined by indicators of `special need` and diff erences in municipal ability to pay for educationalprovision. The laer consideration is about equity in the distribution of the fiscal burdenon residents.
The funding formula addresses vertical equity in relation to diff erences in learningability by including a number of additional indicators for students with special educa-tional needs. The categories and additional weights for funding for special needs areshown in Table 4 above. From this it can be seen that children with special needs are
mainly educated in separate classes, units or schools and the muncipilaties are fundedon a per student basis for children aending these forms of provision. Home-teachinghas a particularly high weight of 4 to 4.4 reflecting the one-to-one teacher student ra-tio. From 2006 the previous formula included allocations for pupils with special edu-cational needs in regular classes. The 2008 formula continued with the same categoriesand weights. The main problem with special educational needs funding commented on by teachers and school directors is not the inadequacy of the weights but the fact thatparents are very reluctant for their child to be identified as having special needs. Thereis a medical process of certification which requires parental agreement. Parents are re-ported to fear that their child will be stigmatised by such a label and refuse to co-operate
with the certification process. Consequently, children whom teachers perceive as havingspecial needs and requiring additional provision do not obtain additional funding, leav-ing schools to cope with any ensuing problems due to lack of funding for appropriate
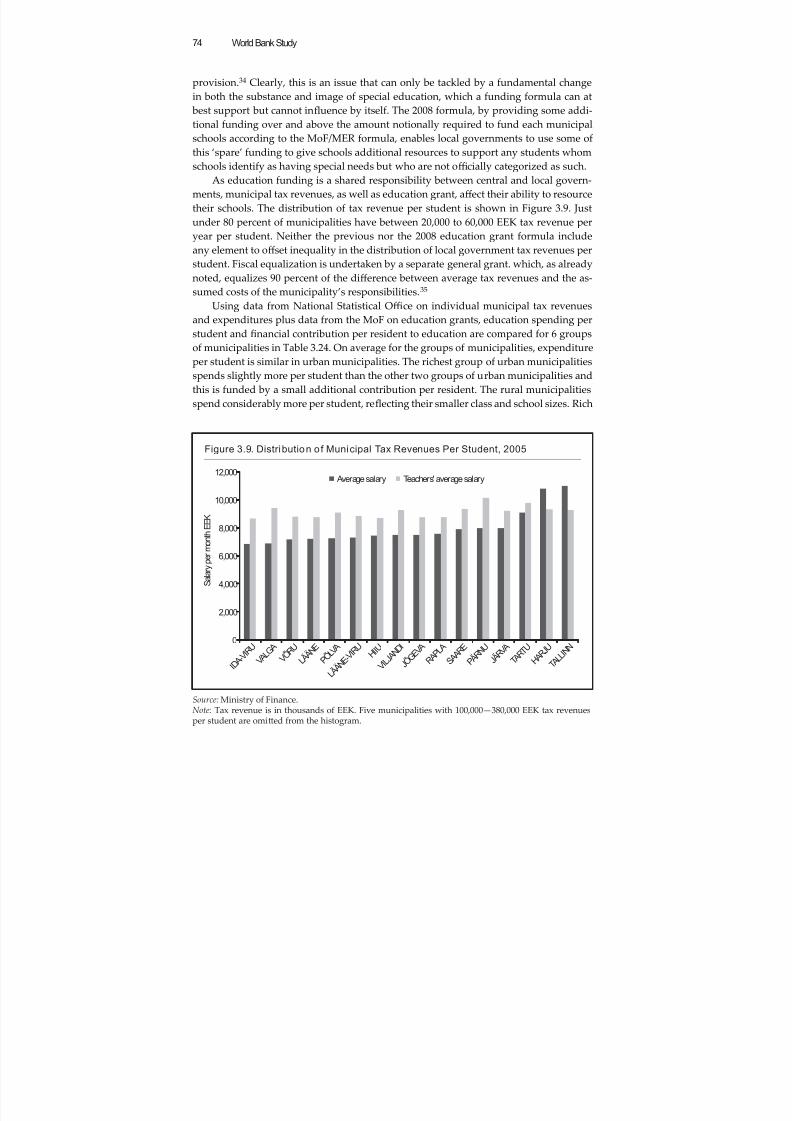
8/6/2019 Reforming Education Finance in Transition Countries
http://slidepdf.com/reader/full/reforming-education-finance-in-transition-countries 98/335
World Bank Study74
provision.34 Clearly, this is an issue that can only be tackled by a fundamental changein both the substance and image of special education, which a funding formula can at best support but cannot influence by itself. The 2008 formula, by providing some addi-tional funding over and above the amount notionally required to fund each municipal
schools according to the MoF/MER formula, enables local governments to use some ofthis ‘spare’ funding to give schools additional resources to support any students whomschools identify as having special needs but who are not offi cially categorized as such.
As education funding is a shared responsibility between central and local govern-ments, municipal tax revenues, as well as education grant, aff ect their ability to resourcetheir schools. The distribution of tax revenue per student is shown in Figure 3.9. Justunder 80 percent of municipalities have between 20,000 to 60,000 EEK tax revenue peryear per student. Neither the previous nor the 2008 education grant formula includeany element to off set inequality in the distribution of local government tax revenues perstudent. Fiscal equalization is undertaken by a separate general grant. which, as already
noted, equalizes 90 percent of the diff erence between average tax revenues and the as-sumed costs of the municipality’s responsibilities.35
Using data from National Statistical Offi ce on individual municipal tax revenuesand expenditures plus data from the MoF on education grants, education spending perstudent and financial contribution per resident to education are compared for 6 groupsof municipalities in Table 3.24. On average for the groups of municipalities, expenditureper student is similar in urban municipalities. The richest group of urban municipalitiesspends slightly more per student than the other two groups of urban municipalities andthis is funded by a small additional contribution per resident. The rural municipalitiesspend considerably more per student, reflecting their smaller class and school sizes. Rich
Figure 3.9. Distribution of Municipal Tax Revenues Per Student, 2005
Source: Ministry of Finance.Note: Tax revenue is in thousands of EEK. Five municipalities with 100,000—380,000 EEK tax revenuesper student are omied from the histogram.
0
2,000
4,000
6,000
8,000
10,000
12,000
I D A - V I R U
V A L G
A
V Õ R U
L Ä Ä N E
P Õ L V A
L Ä Ä N E - V I R U H I
I U
V I L J A N D I
J Õ G E V A
R A P L
A
S A A R E
P Ä R N U
J Ä R V
A
T A R T U
H A R J U
T A L L I N N
S a l a r y p e r m
o n t h E E K
Average salary Teachers' average salary
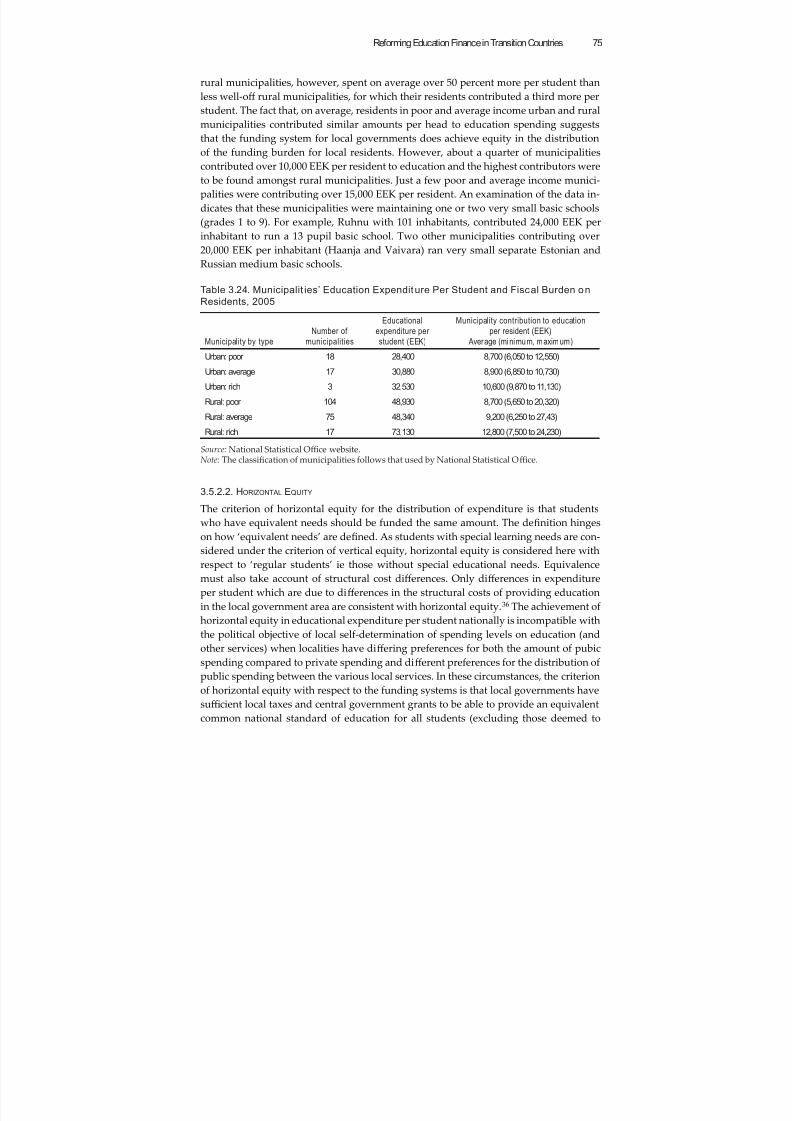
8/6/2019 Reforming Education Finance in Transition Countries
http://slidepdf.com/reader/full/reforming-education-finance-in-transition-countries 99/335
Reforming Education Finance in Transition Countries 75
rural municipalities, however, spent on average over 50 percent more per student thanless well-off rural municipalities, for which their residents contributed a third more perstudent. The fact that, on average, residents in poor and average income urban and ruralmunicipalities contributed similar amounts per head to education spending suggests
that the funding system for local governments does achieve equity in the distributionof the funding burden for local residents. However, about a quarter of municipalitiescontributed over 10,000 EEK per resident to education and the highest contributors wereto be found amongst rural municipalities. Just a few poor and average income munici-palities were contributing over 15,000 EEK per resident. An examination of the data in-dicates that these municipalities were maintaining one or two very small basic schools(grades 1 to 9). For example, Ruhnu with 101 inhabitants, contributed 24,000 EEK perinhabitant to run a 13 pupil basic school. Two other municipalities contributing over20,000 EEK per inhabitant (Haanja and Vaivara) ran very small separate Estonian andRussian medium basic schools.
Table 3.24. Municipalit ies’ Education Expenditure Per Student and Fiscal Burden on
Residents, 2005
Municipality by type
Number of
municipalities
Educational
expenditure per
student (EEK)
Municipality contribution to education
per resident (EEK)
Average (minimum, maximum)
Urban: poor 18 28,400 8,700 (6,050 to 12,550)
Urban: average 17 30,880 8,900 (6,850 to 10,730)
Urban: rich 3 32,530 10,600 (9,870 to 11,130)
Rural: poor 104 48,930 8,700 (5,650 to 20,320)
Rural: average 75 48,340 9,200 (6,250 to 27,43)
Rural: rich 17 73,130 12,800 (7,500 to 24,230)
Source: National Statistical Offi ce website.Note: The classification of municipalities follows that used by National Statistical Offi ce.
3.5.2.2. HORIZONTAL EQUITY
The criterion of horizontal equity for the distribution of expenditure is that studentswho have equivalent needs should be funded the same amount. The definition hingeson how ‘equivalent needs’ are defined. As students with special learning needs are con-
sidered under the criterion of vertical equity, horizontal equity is considered here withrespect to ‘regular students’ ie those without special educational needs. Equivalencemust also take account of structural cost diff erences. Only diff erences in expenditureper student which are due to diff erences in the structural costs of providing educationin the local government area are consistent with horizontal equity.36 The achievement ofhorizontal equity in educational expenditure per student nationally is incompatible withthe political objective of local self-determination of spending levels on education (andother services) when localities have diff ering preferences for both the amount of pubicspending compared to private spending and diff erent preferences for the distribution ofpublic spending between the various local services. In these circumstances, the criterion
of horizontal equity with respect to the funding systems is that local governments havesuffi cient local taxes and central government grants to be able to provide an equivalentcommon national standard of education for all students (excluding those deemed to
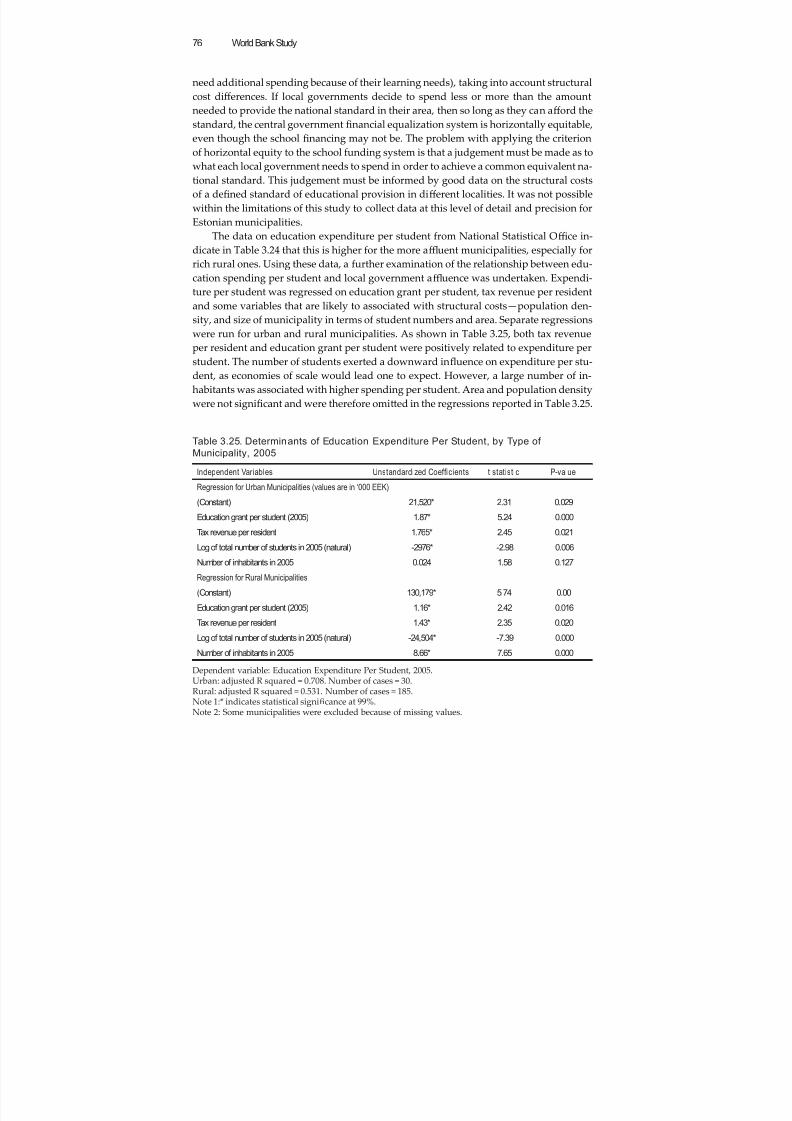
8/6/2019 Reforming Education Finance in Transition Countries
http://slidepdf.com/reader/full/reforming-education-finance-in-transition-countries 100/335
World Bank Study76
need additional spending because of their learning needs), taking into account structuralcost diff erences. If local governments decide to spend less or more than the amountneeded to provide the national standard in their area, then so long as they can aff ord thestandard, the central government financial equalization system is horizontally equitable,
even though the school financing may not be. The problem with applying the criterionof horizontal equity to the school funding system is that a judgement must be made as towhat each local government needs to spend in order to achieve a common equivalent na-tional standard. This judgement must be informed by good data on the structural costsof a defined standard of educational provision in diff erent localities. It was not possiblewithin the limitations of this study to collect data at this level of detail and precision forEstonian municipalities.
The data on education expenditure per student from National Statistical Offi ce in-dicate in Table 3.24 that this is higher for the more affl uent municipalities, especially forrich rural ones. Using these data, a further examination of the relationship between edu-
cation spending per student and local government affl uence was undertaken. Expendi-ture per student was regressed on education grant per student, tax revenue per residentand some variables that are likely to associated with structural costs—population den-sity, and size of municipality in terms of student numbers and area. Separate regressionswere run for urban and rural municipalities. As shown in Table 3.25, both tax revenueper resident and education grant per student were positively related to expenditure perstudent. The number of students exerted a downward influence on expenditure per stu-dent, as economies of scale would lead one to expect. However, a large number of in-habitants was associated with higher spending per student. Area and population densitywere not significant and were therefore omied in the regressions reported in Table 3.25.
Table 3.25. Determinants of Education Expenditure Per Student, by Type of
Municipality, 2005
Independent Variables Unstandardized Coef ficients t statistic P-value
Regression for Urban Municipalities (values are in ‘000 EEK)
(Constant) 21,520* 2.31 0.029
Education grant per student (2005) 1.87* 5.24 0.000
Tax revenue per resident 1.765* 2.45 0.021
Log of total number of students in 2005 (natural) -2976* -2.98 0.006Number of inhabitants in 2005 0.024 1.58 0.127
Regression for Rural Municipalities
(Constant) 130,179* 5.74 0.00
Education grant per student (2005) 1.16* 2.42 0.016
Tax revenue per resident 1.43* 2.35 0.020
Log of total number of students in 2005 (natural) -24,504* -7.39 0.000
Number of inhabitants in 2005 8.66* 7.65 0.000
Dependent variable: Education Expenditure Per Student, 2005.
Urban: adjusted R squared = 0.708. Number of cases = 30.Rural: adjusted R squared = 0.531. Number of cases = 185.Note 1:* indicates statistical significance at 99%.Note 2: Some municipalities were excluded because of missing values.
8/6/2019 Reforming Education Finance in Transition Countries
http://slidepdf.com/reader/full/reforming-education-finance-in-transition-countries 101/335
Reforming Education Finance in Transition Countries 77
The positive association between higher per capita tax revenues and education spendingper student within both the urban and rural groups of authorities, indicates that evenafter for controlling for education grant, the school finance system overall was not hori-zontally equitable in 2005: the amount spent on a student’s education, taking account
of whether the municipality was urban or rural, depended on local income levels (asindicated by tax revenues per capita).
In making a judgment about horizontal equity it is also useful to examine school budgets in the case-study municipalities, as these diff er considerably in wealth. In termsof tax revenue per student in 2005, Viimsi ranked 8th out of 220 municipalities, Raeranked 25th , Tallinn 47th , while Mustvee was one of the poorest, at rank 217. As can beseen from Table 3.26, expenditure per student by school diff ered markedly. Prangli’sextremely high expenditure is related to its very small size. Mustsvee’s two schools arerelatively small, while Viimsi and Juri and the two Tallinn gymnasiums are of morethan minimum effi cient size. Despite Mustvee’s schools being smaller less was spent
per student than in Viimsi and Juri secondary schools.37 However, Prangli aside, thepersonnel costs per student were quite similar in the three rural municipalities, rangingfrom 23,457 to 19,575 EEK. Tallinn schools had the lowest per student personnel costs.Those for Tallinn Russian gymnasium were just 48 percent of those at Juri. There areeven greater diff erences in expenditure per student in non-staff costs per student wherethe lowest is 12 percent of the highest. These school budget comparisons indicate thatthe main diff erence in spending between rich and poor rural municipalities is in operat-ing costs. There is also a considerable diff erence between Tallinn where costs are lowper student and the richer rural municipal larger schools. Municipalities have to fundnon-staff costs largely out of their own budget whereas a much lower proportion of per-sonnel costs come out of the municipal budget. Viimsi, as a rich municipality, was par-ticularly lavish in the proportion of total expenditure on operational costs: at 50 percentthis was well above the OECD average of 20 percent. The proportion was lower for thepoor rural municipality, even though its schools are small, compared to the two richermunicipalities. A school director in Mustvee pointed out that the school did not employa psychologist or social worker or off er optional subjects, were short of foreign languageteachers apart from English and lacked suffi cient textbooks. When capital expenditure isincluded, costs per student were more equal as Mustvee spent a significant amount perstudent in 2007 on renovating old school buildings.
While Mustvee funds its two gymnasiums roughly equally, there is quite a disparityin per student expenditure between the two gymnasiums visited in Tallinn. The highercost Gymnasium 21, has more teachers on the highest grade but it also spends consider-ably more on ICT and on the running costs for its building. This has been recently reno-vated by the municipality to a very high standard with an olympic standard swimmingpool, splendid atrium and specialist teaching rooms, while the Russian gymnasium isstill in an unrenovated building. School 21 earns a good income from leing its facilitieswhich enables it to spend more on non-staff items than the Russian gymnasium.
Further disparities in spending per student might be observed if spending out of theschools’ trustee funds could be compared. Schools can raise their own revenues from
sponsorships and from ’voluntary’ contributions from parents. It is to be expected thatan ‘elite’ gymnasium, such as School 21 with a large proprotion of middle class parents,is in a beer position than most schools to raise additional funds.38 Thus, diff erences
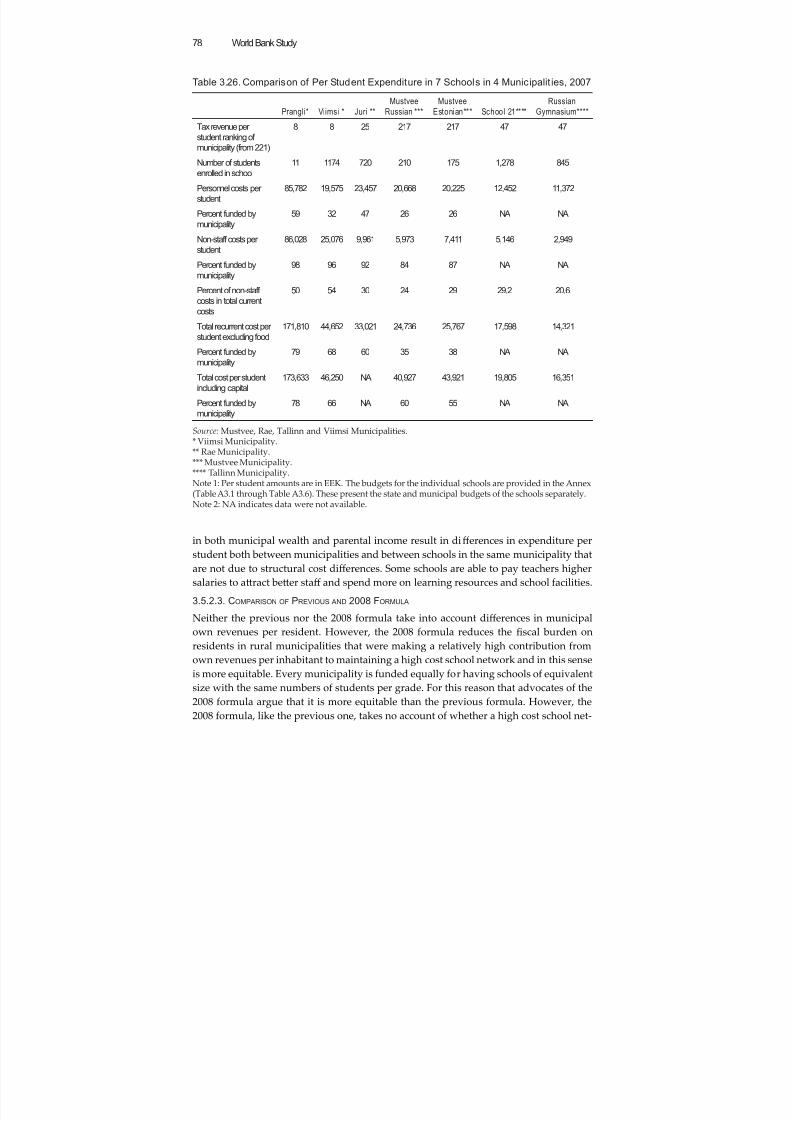
8/6/2019 Reforming Education Finance in Transition Countries
http://slidepdf.com/reader/full/reforming-education-finance-in-transition-countries 102/335
World Bank Study78
in both municipal wealth and parental income result in diff erences in expenditure perstudent both between municipalities and between schools in the same municipality thatare not due to structural cost diff erences. Some schools are able to pay teachers highersalaries to aract beer staff and spend more on learning resources and school facilities.
3.5.2.3. COMPARISON OF PREVIOUS AND 2008 FORMULA
Neither the previous nor the 2008 formula take into account diff erences in municipalown revenues per resident. However, the 2008 formula reduces the fiscal burden onresidents in rural municipalities that were making a relatively high contribution fromown revenues per inhabitant to maintaining a high cost school network and in this senseis more equitable. Every municipality is funded equally for having schools of equivalent
size with the same numbers of students per grade. For this reason that advocates of the2008 formula argue that it is more equitable than the previous formula. However, the2008 formula, like the previous one, takes no account of whether a high cost school net-
Table 3.26. Comparison of Per Student Expenditure in 7 Schools in 4 Municipalit ies, 2007
Prangli* Viimsi * Juri **
Mustvee
Russian ***
Mustvee
Estonian*** School 21****
Russian
Gymnasium****
Tax revenue per
student ranking ofmunicipality (from 221)
8 8 25 217 217 47 47
Number of students
enrolled in school
11 1174 720 210 175 1,278 845
Personnel costs per
student
85,782 19,575 23,457 20,668 20,225 12,452 11,372
Percent funded by
municipality
59 32 47 26 26 NA NA
Non-staff costs per
student
86,028 25,076 9,961 5,973 7,411 5,146 2,949
Percent funded by
municipality
98 96 92 84 87 NA NA
Percent of non-staff
costs in total current
costs
50 54 30 24 29 29.2 20.6
Total recurrent cost per
student excluding food
171,810 44,652 33,021 24,736 25,767 17,598 14,321
Percent funded by
municipality
79 68 60 35 38 NA NA
Total cost per student
including capital
173,633 46,250 NA 40,927 43,921 19,805 16,351
Percent funded by
municipality
78 66 NA 60 55 NA NA
Source: Mustvee, Rae, Tallinn and Viimsi Municipalities.* Viimsi Municipality.** Rae Municipality.*** Mustvee Municipality.**** Tallinn Municipality.Note 1: Per student amounts are in EEK. The budgets for the individual schools are provided in the Annex(Table A3.1 through Table A3.6). These present the state and municipal budgets of the schools separately.Note 2: NA indicates data were not available.
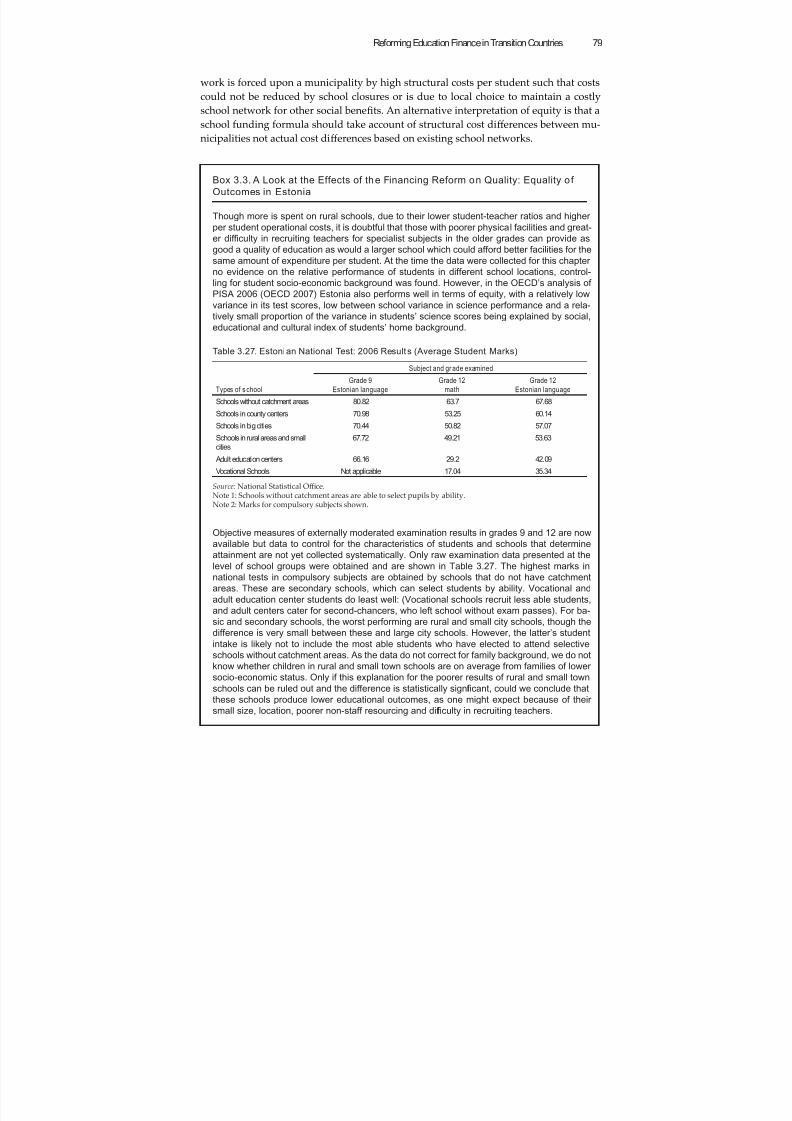
8/6/2019 Reforming Education Finance in Transition Countries
http://slidepdf.com/reader/full/reforming-education-finance-in-transition-countries 103/335
Reforming Education Finance in Transition Countries 79
work is forced upon a municipality by high structural costs per student such that costscould not be reduced by school closures or is due to local choice to maintain a costlyschool network for other social benefits. An alternative interpretation of equity is that aschool funding formula should take account of structural cost diff erences between mu-
nicipalities not actual cost diff erences based on existing school networks.
Box 3.3. A Look at the Effects of the Financing Reform on Quality: Equality o f
Outcomes in Estonia
Though more is spent on rural schools, due to their lower student-teacher ratios and higher
per student operational costs, it is doubtful that those with poorer physical facilities and great-
er dif ficulty in recruiting teachers for specialist subjects in the older grades can provide as
good a quality of education as would a larger school which could afford better facilities for the
same amount of expenditure per student. At the time the data were collected for this chapter
no evidence on the relative performance of students in different school locations, control-ling for student socio-economic background was found. However, in the OECD’s analysis of
PISA 2006 (OECD 2007) Estonia also performs well in terms of equity, with a relatively low
variance in its test scores, low between school variance in science performance and a rela-
tively small proportion of the variance in students’ science scores being explained by social,
educational and cultural index of students’ home background.
Table 3.27. Estonian National Test: 2006 Results (Average Student Marks)
Types of s chool
Subject and gr ade examined
Grade 9
Estonian language
Grade 12
math
Grade 12
Estonian language
Schools without catchment areas 80.82 63.7 67.68
Schools in county centers 70.98 53.25 60.14
Schools in big cities 70.44 50.82 57.07
Schools in rural areas and small
cities
67.72 49.21 53.63
Adult education centers 66.16 29.2 42.09
Vocational Schools Not applicable 17.04 35.34
Source: National Statistical Offi ce.Note 1: Schools without catchment areas are able to select pupils by ability.Note 2: Marks for compulsory subjects shown.
Objective measures of externally moderated examination results in grades 9 and 12 are now
available but data to control for the characteristics of students and schools that determineattainment are not yet collected systematically. Only raw examination data presented at the
level of school groups were obtained and are shown in Table 3.27. The highest marks in
national tests in compulsory subjects are obtained by schools that do not have catchment
areas. These are secondary schools, which can select students by ability. Vocational and
adult education center students do least well: (Vocational schools recruit less able students,
and adult centers cater for second-chancers, who left school without exam passes). For ba-
sic and secondary schools, the worst performing are rural and small city schools, though the
difference is very small between these and large city schools. However, the latter’s student
intake is likely not to include the most able students who have elected to attend selective
schools without catchment areas. As the data do not correct for family background, we do not
know whether children in rural and small town schools are on average from families of lower
socio-economic status. Only if this explanation for the poorer results of rural and small town
schools can be ruled out and the difference is statistically significant, could we conclude thatthese schools produce lower educational outcomes, as one might expect because of their
small size, location, poorer non-staff resourcing and dif ficulty in recruiting teachers.
8/6/2019 Reforming Education Finance in Transition Countries
http://slidepdf.com/reader/full/reforming-education-finance-in-transition-countries 104/335
World Bank Study80
3.5.2.4. SUMMARY: EFFECTS OF THE FUNDING FORMULA ON EQUITY
The 1998-2007 funding formula was equitable in a number of respects. It provided ad-ditional weightings for students with special educational needs, which were generallyaccepted as appropriate reflections of relative costs, as these are mainly determined by
smaller class sizes. The failure of these weightings to apply to all students who need ad-ditional resources is due not to the formula itself but to problems of identifying specialneeds students because of the social stigma aached to this categorization.
Though the previous formula did not take account of diff erences in municipal taxraising capacity, municipalities are brought up to 90 of the diff erence between their es-timated costs and tax revenues through a state equalization grant. This degree of equal-ization still does not provide a level playing field, given the evidence above that perstudent spending in municipalities is positively associated with tax revenues per capita
The previous formula took into account diff erences in the need to spend in a fairlycrude way—apart from an island category, it used municipal school population sizeas predictors of diff erences in municipal structural costs. The reliance on these simpleweightings is the main criticism voiced about the previous formula. It was quite widelyperceived as unfair because it was claimed that some municipalities received more thanthey needed while others received less. However, in my view, this line of criticism usu-ally assumes that the existing school structure in a local government determines its needto spend. So if two municipalities have roughly the same number of students in a similarsized area with similar transport links, and one municipality has one school and theother three, the laer is deemed to ‘need’ more per student than the former. It is this lineof criticism of the previous formula that has motivated the design of the 2008 formula
which interprets equity as meaning equivalent funding for municipalities for their exist-ing number and size of schools.Even though the municipal weights in the previous formula were fairly crude pre-
dictors of diff erences in municipal structural costs, the comparison of urban and ruralmunicipal expenditure per student and municipal contribution to education spendingper resident, indicate that on average urban and rural inhabitants’ fiscal burden wasroughly the same for average and poor municipalities, though there were some notableexceptions, with a few poor and average income municipalities having very high budgetcontributions to education per inhabitant. However, spending per student and contribu-tion per resident were highest in the richest group of municipalities. So, while the fiscal
burden did not appear to be inequitable for most municipalities, the evidence suggestshorizontal inequity for students, since richer municipalities tend to spend more per stu-dent, particularly on non-staff items, for which there is a very small element of statefunding. Comparisons of budgets for seven schools show considerable diff erences inexpenditure per student that cannot be aributed to structural cost diff erences alone.
3.5.3. Transparency and Accountability
In examining transparency and accountability in the Estonian school finance system,first central govenment will be considered and then the financial flows followed to mu-nicipal level and finally to school level.
In terms of transparency a strong feature of the 1998- 2007 funding formula was itssimplicity, with just 8 weights for diff erent municipalities of diff erent size and two forislands. The stability over time of the weights in the formula also aided transparency.
8/6/2019 Reforming Education Finance in Transition Countries
http://slidepdf.com/reader/full/reforming-education-finance-in-transition-countries 105/335
Reforming Education Finance in Transition Countries 81
The previous formula was first developed by a working party with representatives fromthe major stakeholders (the two local government associations and school director as-sociation as well as MER and MoF) and was accurately known by all those interviewedin 2007. The development of the replacement formula was overseen by a representative
working group of around 30 stakeholders. Consultative meetings of local governmentrepresentatives and school directors were held where the proposals were discussed. In-terviewees were all aware of these proposals and knowledgeable about the main fea-tures of the new formula.
Information about the flow of funds for education from central government to mu-nicipalities has changed as the method of transmission has changed. Before 2001 thesefunds were transferred by the MER to counties for disbursement to municipalities, andsince then grants for education have been transferred to individual municipalities bythe MoF. The amount of education grant each municipality receives is published on theMoF website. It was stated by some interviewees that the transparency of education ex-
penditure had declined since the MoF took over the transfer of education grant directlyto municipalities. According to MOF offi cers, this perception may be because the controlmethods of soviet times, when unspent money at local level was returned to the Ministryof Finance have been abandoned as a result of decentralization. Since municipalities arefree to determine their own spending, detailed information on municipal budget linesno longer flows back and forth between counties and municipalities.
The calculation of each municipality’s state grant for education by the previous for-mula was quite simple whereas the 2008 formula is very complex. While the generalprinciple, that schools are funded so as to be able to aff ord the number of classes centralgovernment considers they need given the numbers of students in the diff erent graderanges, is relatively easy to grasp, the calculations of the amount of funding each mu-nicipality is entitled to are complex. The defintion of two kinds of classes—‘small’ and‘full’—is more complex than assuming one class size per education stage. Additionalcomplexity is created by the amendment of per student funding to include additionallessons per week dependent on class size and additional funding to make up studentnumbers when either small classes or full classes have fewer students than needed togenerate suffi cient funding to cover teaching costs.
At municipal level there is a reasonable degree of transparency. As the law requiresevery school to have a budget, the amount spent on each school is publicly available
information, though not widely published. Each municipality issues each of its schoolswith an annual budget, which is adjusted in September at the start of the new year.These budgets are approved by the municipal council. In small municipalities with onlya few schools, the council should have intimate knowledge of the schools’ budgets. Themunicipality holds the school director accountable for the management of the school budget. This is a major responsibility for a school director in Tallinn, which issues eachschool with a global budget to manage: the school director must provide the resourcesneeded within the control total. In two other case-study municipalities, which base bud-gets on cost estimates, the municipality practices hands-on management of the budget.All the municipalities have centralised financial administration, which greatly restricts
the scope for improper use of the school budget by schol personnel. School directorsneed to seek municipal approval if they wish to switch money from one budget line toanother.
8/6/2019 Reforming Education Finance in Transition Countries
http://slidepdf.com/reader/full/reforming-education-finance-in-transition-countries 106/335
World Bank Study82
All the school directors interviewed stated that they presented the budget plan forthe forthcoming year to the School Board for discussion and approval. School Boardswere set up in the late 1990s. Their membership mainly consists of parents, with oneor two municipal representatives or an ex-student. Boards at the schools visited varied
between 7 to 10 members. School Boards are advisory and so do not have legal respon-sibilities for managing the budget. In the main, School Boards do not monitor the bud-get through the financial year, though they do usually receive a financial report on thespending of the budget at the end of the year.
Thus,the quality of financial control and management depends on the competenceand financial probity of the municipality. One potential weakness in accountability atlocal level is that the school director is appointed by the municipality. These appoint-ments can be politically motivated, as the political party in control of the local councilmay prefer to appoint a party member or sympathizer. School directors, as they are notstate employees, can be members of the municipal council. It is therefore quite possible
for school resourcing decisions at local level to be captured by particular interests.Municipalities’ accounts and financial procedures are subject to external audit. The
Ministry of Finance does not check municipal expenditure—this is done by the stateaudit offi ce. The presumption of a decentralized political system is that municipalitiesare free to make their own decisions and are therefore not subject to central governmentscrutiny, even for moneys provided by central government. The municipalities makeannual financial returns to the MoF of their budget ouurns, which contain details of thefunctional and economic categories of municipal education expenditure, though theremay be some inconsistency in classification so that social expenditures, as on schoolfood programs, are included as education spending. However, the MoF does not publishdetailed data on municipal budget ouurns on its website. The Estonian Statistics Offi cedoes publish data on municipal expenditures by service categories and by economic cat-egories, but all education expenditure is included in a single category. It is not possibleto separate out spending by stage of schooling or by national curriculum teaching andextra curricular activities.
Transparency and accountabilty in the school finance system present, therefore, asomewhat mixed picture. The transparency of the formula was good, though less sosince 2008 due to the more complex formula. However, there are thorough consultationprocesses for agreeing the formula. School budgets are transparent at local level and,
provided the municipality is competent and upright, school directors are held account-able for those areas of school budget expenditure that are within their discretion. Apartfrom standard auditing, lile appears to be done to hold municipalities accountable forthe expenditure of public money on schooling, as it is assumed that municipalities arenot, apart from rare instances, engaged in fraudulent practices.39
3.6. Conclusions
In Estonia, the prime motivation for introducing per student funding to general educa-tion was political decentralization, which had led to the creation of numerous smallmunicipalities. It is acknowledged that many municipalities are too small to be effi cient
administrative units for education; however they are valued as vital organs for local self-determination. The funding of general education was changed to a form of per studentfunding soon after independence. The opportunity was also taken to encourage the de-
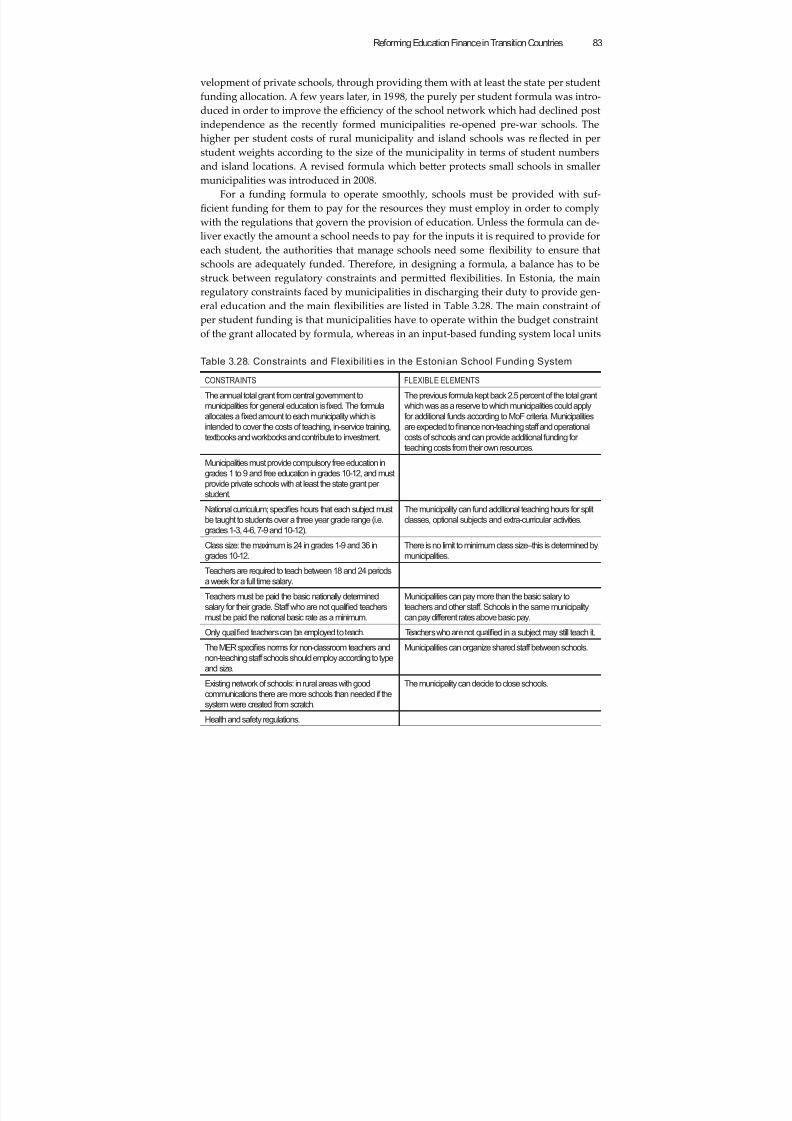
8/6/2019 Reforming Education Finance in Transition Countries
http://slidepdf.com/reader/full/reforming-education-finance-in-transition-countries 107/335
Reforming Education Finance in Transition Countries 83
velopment of private schools, through providing them with at least the state per studentfunding allocation. A few years later, in 1998, the purely per student formula was intro-duced in order to improve the effi ciency of the school network which had declined postindependence as the recently formed municipalities re-opened pre-war schools. The
higher per student costs of rural municipality and island schools was reflected in perstudent weights according to the size of the municipality in terms of student numbersand island locations. A revised formula which beer protects small schools in smallermunicipalities was introduced in 2008.
For a funding formula to operate smoothly, schools must be provided with suf-ficient funding for them to pay for the resources they must employ in order to complywith the regulations that govern the provision of education. Unless the formula can de-liver exactly the amount a school needs to pay for the inputs it is required to provide foreach student, the authorities that manage schools need some flexibility to ensure thatschools are adequately funded. Therefore, in designing a formula, a balance has to be
struck between regulatory constraints and permied flexibilities. In Estonia, the mainregulatory constraints faced by municipalities in discharging their duty to provide gen-eral education and the main flexibilities are listed in Table 3.28. The main constraint ofper student funding is that municipalities have to operate within the budget constraintof the grant allocated by formula, whereas in an input-based funding system local units
Table 3.28. Constraints and Flexibiliti es in the Estonian School Funding System
CONSTRAINTS FLEXIBLE ELEMENTS
The annual total grant from central government to
municipalities for general education isfixed. The formula
allocates afixed amount to each municipality which is
intended to cover the costs of teaching, in-service training,
textbooks and workbooks and contribute to investment.
The previous formula kept back 2.5 percent of the total grant
which was as a reserve to which municipalities could apply
for additional funds according to MoF criteria. Municipalities
are expected tofinance non-teaching staff and operational
costs of schools and can provide additional funding for
teaching costs from their own resources.
Municipalities must provide compulsory free education in
grades 1 to 9 and free education in grades 10-12, and must
provide private schools with at least the state grant per
student.
National curriculum; specifies hours that each subject must
be taught to students over a three year grade range (i.e.
grades 1-3, 4-6, 7-9 and 10-12).
The municipality can fund additional teaching hours for split
classes, optional subjects and extra-curricular activities.
Class size: the maximum is 24 in grades 1-9 and 36 ingrades 10-12. There is no limit to minimum class size–this is determined bymunicipalities.
Teachers are required to teach between 18 and 24 periods
a week for a full time salary.
Teachers must be paid the basic nationally determined
salary for their grade. Staff who are not qualified teachers
must be paid the national basic rate as a minimum.
Municipalities can pay more than the basic salary to
teachers and other staff. Schools in the same municipality
can pay different rates above basic pay.
Only qualified teachers can be employed to teach. Teachers who are not qualified in a subject may still teach it.
The MER specifies norms for non-classroom teachers and
non-teaching staff schools should employ according to type
and size.
Municipalities can organize shared staff between schools.
Existing network of schools: in rural areas with goodcommunications there are more schools than needed if the
system were created from scratch.
The municipality can decide to close schools.
Health and safety regulations.
8/6/2019 Reforming Education Finance in Transition Countries
http://slidepdf.com/reader/full/reforming-education-finance-in-transition-countries 108/335
World Bank Study84
are funded in relation to the inputs they already have in place and in accordance withpast spending levels. There are suffi cient flexibilities in the Estonian system, for the for-mula funding system to function smoothly (by this is meant that there are few instancesof schools being unable to pay for necessary inputs). The budget constraint imposed by
the state grant is eased by the ability of municipalities to use their own revenues and ap-ply for additional funding from central reserves. The 2008 formula has further eased thefunding constraint for small municipalities with small schools and classes.
The 1998-2007 pure per student formula provided a countervailing force to thegrowing ineffi ciency of the school system due to falling student numbers: it exerted pres-sure on municipalities to close small schools so preventing a greater decline in effi ciencythan would otherwise have occurred. Political will to use per student funding as an in-strument for promoting school effi ciency waned given economic growth more buoyantpublic revenues and strong rural opposition to the closure of village schools. The 2008formula has weaker effi ciency incentives than its predecessor as it reflects a preference
for the perceived social benefits of preserving village primary and basic schools over thealternative use of the resources, such as creating larger and beer resourced schools inrural areas to which students are bussed. The 2008 formula ensures that municipalitieswith less than 1600 Estonian or Russian medium students can aff ord the teaching costsof the number of classes within existing schools that the formula assumes tare needed,given the values of key determinants of school costs. The 2008 formula is a decisive moveaway from pure per student funding though not from funding schools by formula.
The legislative requirement that all schools have a budget should be a strong fac-tor in promoting effi ciency in the allocation and management of schools’ resources bymaking school costs and their allocation to diff erent inputs transparent. School budgetsprovide directors with the means to improve school effi ciency, if they are able to availthemselves of it. All the school directors interviewed were actively involved in manag-ing their school budgets, though the extent of this varied with the degree of budgetdelegation practiced by the municipality. As Estonians value local self-determination,there is a widely prevailing view that municipalities should be able to operate a highcost schools system if they so choose, as do many of the rich municipalities as well assome small rural ones. However Tallinn, which accounts for a quarter of Estonia’s schoolpopulation, does strive to achieve an effi cient sized school network and promotes theeffi cient management of resources within schools by operating its own school funding
formula. Overall, the PISA 2006 results taken in conjunction with international com-parisons of education spending per student as a proportion of per capita GDP indicatethat Estonian education at lower secondary level is comparatively effi cient, despite the burden of financing high cost small schools.
At the time it was devised, the 1998-2007 funding formula was supported as anequitable method of allocating state education grant between the local governments ina decentralized system. The municipal weights in relation to numbers of students wereselected as a simple and transparent way of reflecting average cost diff erences betweenmunicipalities in relation to their size. The fiscal burden on residents, in terms of themunicipal contribution to education spending per resident in 2005, was on average very
similar between urban and rural municipalities of poor and average tax revenues perinhabitant, indicating that the local government financing system overall was equita- ble for tax payers, though there were exceptions—a few poor municipalities with very
8/6/2019 Reforming Education Finance in Transition Countries
http://slidepdf.com/reader/full/reforming-education-finance-in-transition-countries 109/335
Reforming Education Finance in Transition Countries 85
high educational contributions per inhabitant. Analysis of data for 2005 shows that theschool financing system in Estonia was horizontally inequitable, as students in more af-fluent municipalities had more spent on them per capita. The 2008 formula is unlikelyto change these spending paerns, though it will make it less burdensome for poor and
average income municipalities to maintain small schools. Both the previous and 2008formulae contain no equity enhancing element for allocating additional funding to areaswith lower income or more socially disadvantaged residents. Fiscal equalization grants bring municipalities up to 90 percent of the diff erence between estimated costs and taxrevenues, but this still leaves a considerable disparity in revenues between the majorityof municipalities and the high income municipalities. Diff erences in expenditure perstudent are illustrated in the budgets of individual schools which were examined for thisstudy. Even if fiscal equalization succeeded in creating a level financial playing field forlocal governments, a political system which prizes local self determination for spendingon public services will be nationally horizontally inequitable in the provision of specific
local services when local preferences for spending on these services diff er.The assessment with respect to transparency and accountability is mixed. The pre-
vious funding formula was simple and hence transparent. In contrast, the 2008 formulais much more complex. As schools are legally required to have a budget, the allocationof resources to schools is transparent at local level and, given the small size of manymunicipalities, involves direct negotiation between school directors and mayors andis approved by the council. Tallinn has a transparent funding formula. Municipalitiesappear to operate effi cient financial administration systems, which are centralized andcomputerized. As it is left to municipalities to determine how they utilize public funds,the MoF and MER take lile interest in how municipalities spend education funding.Consequently, despite the existence of data on school budget ouurns, there are no na-tional level data on the amount spent on diff erent types of educational resources or ondiff erent types of schools or grade ranges of students.
The recent history of school funding formula in Estonia well illustrates that schoolfunding mechanisms cannot address all objectives equally: trade-off s have to be made between equity in its various interpretations, internal effi ciency, transparency and exter-nal social benefits derived from specific types of schools. In replacing the previous for-mula the Estonian government has chosen to give greater priority to a particular variantof equity and to the perceived social benefits of preserving village schools at the cost of
weaker effi
ciency incentives for the smaller municipalities and a more complex and lesstransparent formula.
References
Abu-Duhou, I. (1999). Issues in funding basic allocations per pupil by grade level: activ-ity led funding. In K. Ross and R. Levačić , (Eds.) Needs Based Resource Allocation
in Education via Formula Funding of Schools. Paris: International Institute of Educa-tional Planning.
Estonian Ministry of Foreign Aff airs (2006). ‘Estonia Today: Population by Nationality:Fact Sheet’. Tallinn: Press and Information Department, Estonian Ministry of For-
eign Aff airs www.vm.ee accessed 10.12.2007.Estonian State Chancellery (1993). Basic Schools and Upper Secondary Schools Act: www.
legaltext.ee/text/en/X30049K9.htm (accessed 12.12.2007).
8/6/2019 Reforming Education Finance in Transition Countries
http://slidepdf.com/reader/full/reforming-education-finance-in-transition-countries 110/335
World Bank Study86
European Commission (2005). Key Data on Education in Europe 2005. Brussels: EuropeanCommission.
International Monetary Fund. (2010). International Finance Statistics and Data Files.
Monk, D. (1990). Educational Finance: An Economic Approach. New York: McGraw-Hill.
OECD (2001). Reviews of National Policies for Education: Estonia. Paris: OECD.OECD (2007). PISA 2006: Science Competencies for Tomorrow’s World Vol 1. Paris: OECD.Põllumäe, S. (2002). “Rethinking the Sub-municipal Level of Local Government.” Tallinn
University of Educational Sciences, Department of Government Summer School“Public Management Reform” unpan1.un.org/intradoc/groups/public/docu-ments/NISPAcee/UNPAN007842.pdf (accessed 14.12.2007).
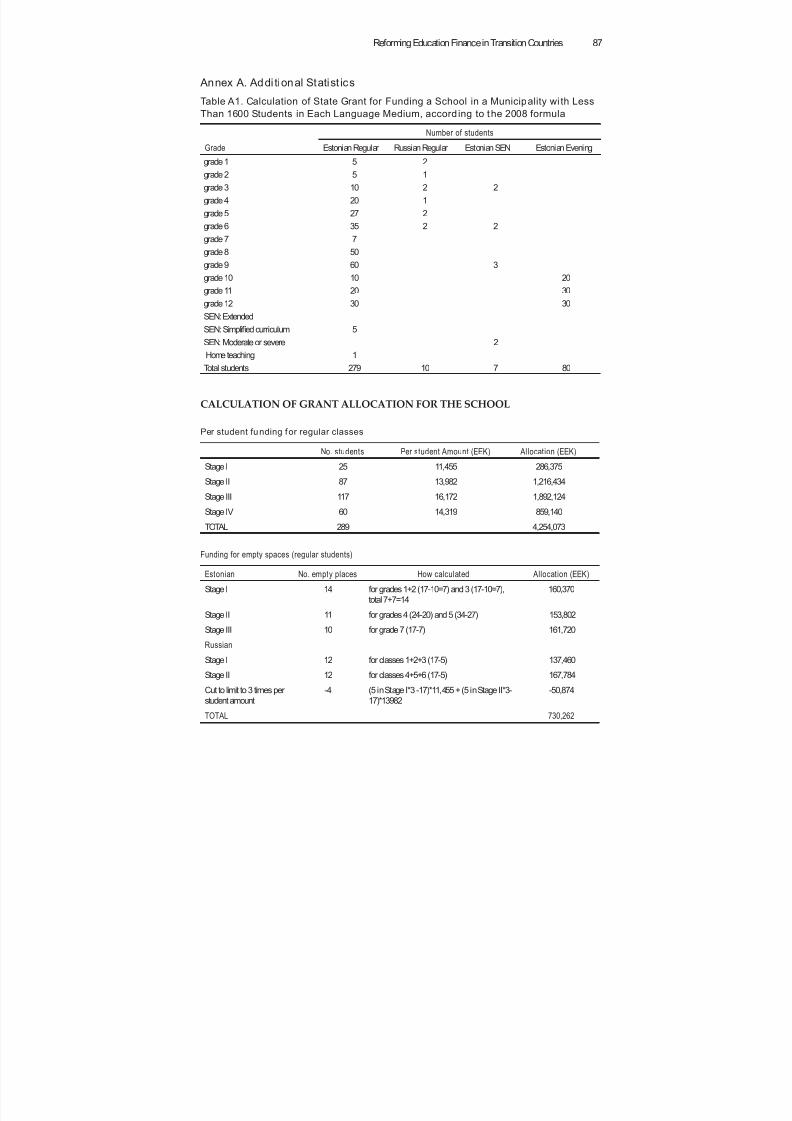
8/6/2019 Reforming Education Finance in Transition Countries
http://slidepdf.com/reader/full/reforming-education-finance-in-transition-countries 111/335
Reforming Education Finance in Transition Countries 87
Annex A. Addi tional Statist ics
Table A1. Calculation of State Grant for Funding a School in a Municipality wi th Less
Than 1600 Students in Each Language Medium, accord ing to the 2008 formula
GradeNumber of students
Estonian Regular Russian Regular Estonian SEN Estonian Evening
grade 1 5 2
grade 2 5 1
grade 3 10 2 2
grade 4 20 1
grade 5 27 2
grade 6 35 2 2
grade 7 7
grade 8 50
grade 9 60 3
grade 10 10 20
grade 11 20 30
grade 12 30 30
SEN: Extended
SEN: Simplified curriculum 5
SEN: Moderate or severe 2
Home teaching 1
Total students 279 10 7 80
CALCULATION OF GRANT ALLOCATION FOR THE SCHOOL
Per student funding for regular classes
No. students Per student Amount (EEK) Allocation (EEK)
Stage I 25 11,455 286,375
Stage II 87 13,982 1,216,434
Stage III 117 16,172 1,892,124
Stage IV 60 14,319 859,140
TOTAL 289 4,254,073
Funding for empty spaces (regular students)
Estonian No. empty places How calculated Allocation (EEK)
Stage I 14 for grades 1+2 (17-10=7) and 3 (17-10=7),
total 7+7=14
160,370
Stage II 11 for grades 4 (24-20) and 5 (34-27) 153,802
Stage III 10 for grade 7 (17-7) 161,720
Russian
Stage I 12 for classes 1+2+3 (17-5) 137,460
Stage II 12 for classes 4+5+6 (17-5) 167,784
Cut to limit to 3 times per
student amount
-4 (5 in Stage I*3 -17)*11,455 + (5 in Stage II*3-
17)*13982
-50,874
TOTAL 730,262
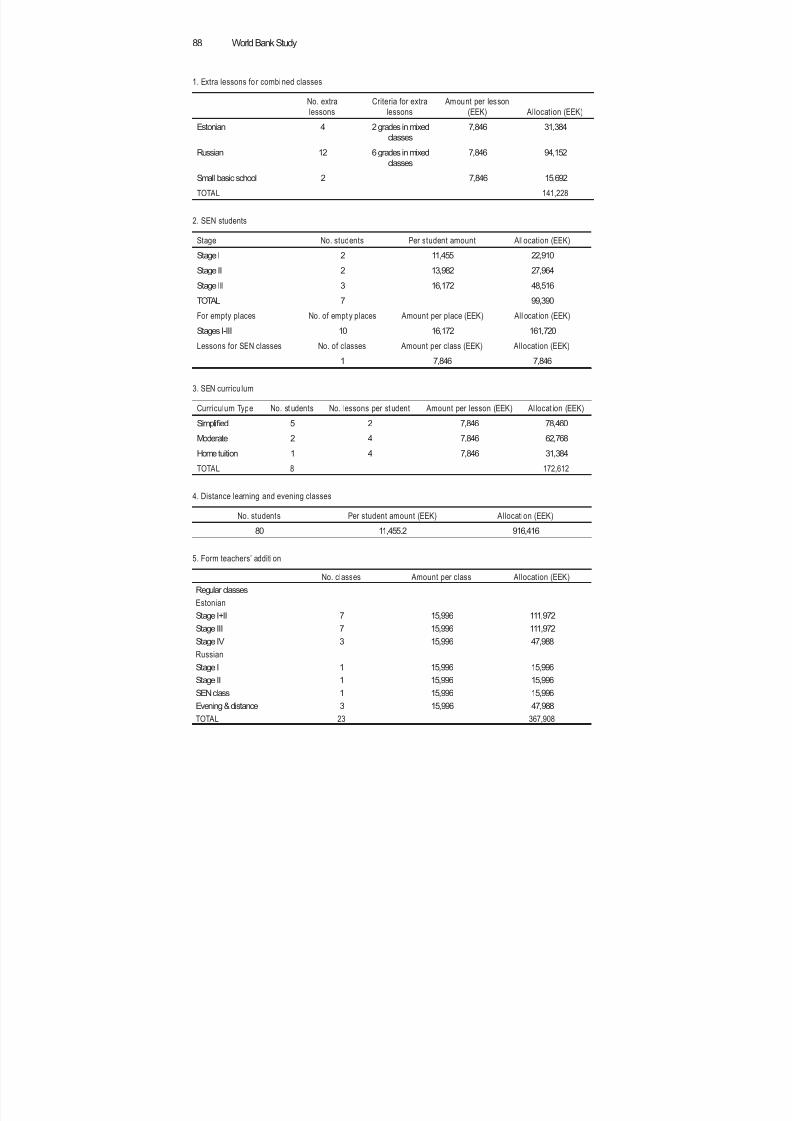
8/6/2019 Reforming Education Finance in Transition Countries
http://slidepdf.com/reader/full/reforming-education-finance-in-transition-countries 112/335
World Bank Study88
1. Extra lessons fo r combined classes
No. extra
lessons
Criteria for extra
lessons
Amount per lesson
(EEK) Allocation (EEK)
Estonian 4 2 grades in mixed
classes
7,846 31,384
Russian 12 6 grades in mixed
classes
7,846 94,152
Small basic school 2 7,846 15,692
TOTAL 141,228
2. SEN students
Stage No. students Per student amount Allocation (EEK)
Stage I 2 11,455 22,910
Stage II 2 13,982 27,964Stage III 3 16,172 48,516
TOTAL 7 99,390
For empty places No. of empt y places Amount per place (EEK) All ocat ion (EEK)
Stages I-III 10 16,172 161,720
Lessons for SEN classes No. of classes Amount per class (EEK) Allocation (EEK)
1 7,846 7,846
3. SEN curricu lum
Curriculum Type No. st udents No. lessons per st udent Amount per lesson (EEK) Al locat ion (EEK)Simplified 5 2 7,846 78,460
Moderate 2 4 7,846 62,768
Home tuition 1 4 7,846 31,384
TOTAL 8 172,612
4. Distance learning and evening classes
No. students Per student amount (EEK) Allocation (EEK)
80 11,455.2 916,416
5. Form teachers’ additi on
No. classes Amount per class Allocation (EEK)
Regular classes
Estonian
Stage I+II 7 15,996 111,972
Stage III 7 15,996 111,972
Stage IV 3 15,996 47,988
Russian
Stage I 1 15,996 15,996
Stage II 1 15,996 15,996
SEN class 1 15,996 15,996
Evening & distance 3 15,996 47,988
TOTAL 23 367,908
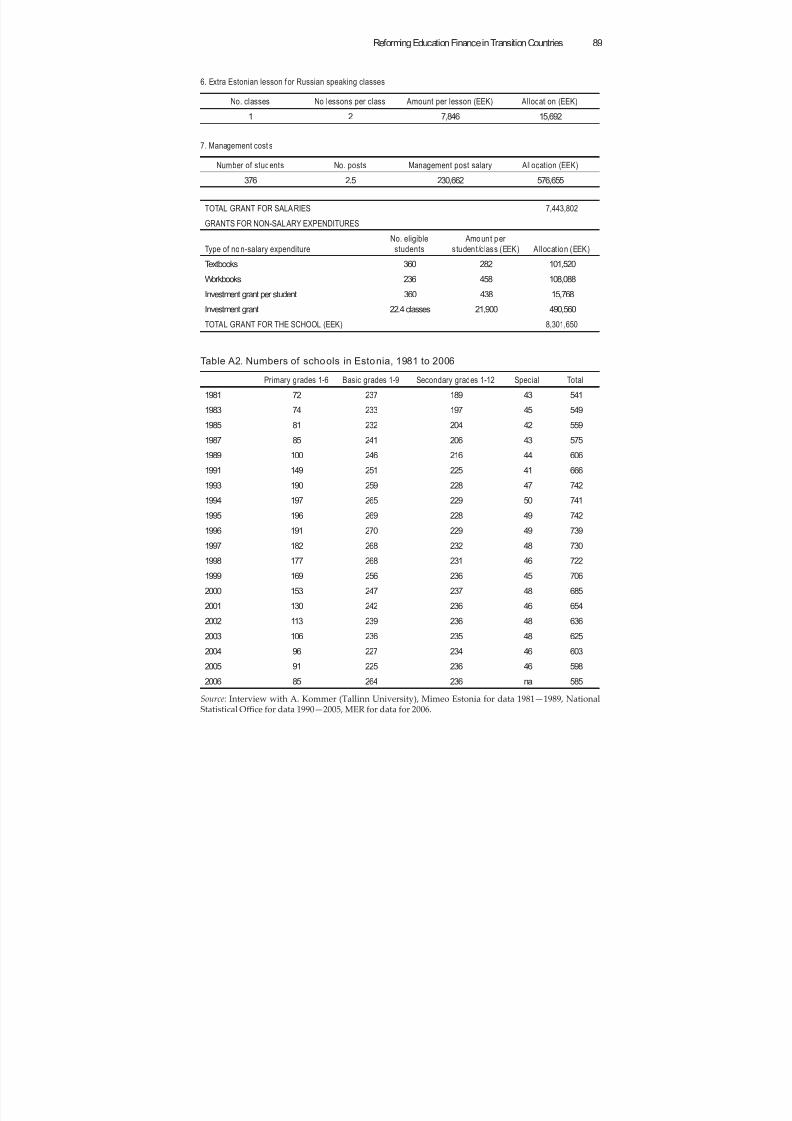
8/6/2019 Reforming Education Finance in Transition Countries
http://slidepdf.com/reader/full/reforming-education-finance-in-transition-countries 113/335
Reforming Education Finance in Transition Countries 89
6. Extra Estonian lesson for Russian speaking classes
No. classes No lessons per class Amount per lesson (EEK) Allocation (EEK)
1 2 7,846 15,692
7. Management cost s
Number of students No. posts Management post salary Allocation (EEK)
376 2.5 230,662 576,655
TOTAL GRANT FOR SALARIES 7,443,802
GRANTS FOR NON-SALARY EXPENDITURES
Type of non-salary expenditure
No. eligible
students
Amount per
student/c lass (EEK) Allocat ion (EEK)
Textbooks 360 282 101,520
Workbooks 236 458 108,088
Investment grant per student 360 438 15,768
Investment grant 22.4 classes 21,900 490,560
TOTAL GRANT FOR THE SCHOOL (EEK) 8,301,650
Table A2. Numbers of schools in Estonia, 1981 to 2006
Primary grades 1-6 Basic grades 1-9 Secondary grades 1-12 Special Total
1981 72 237 189 43 541
1983 74 233 197 45 5491985 81 232 204 42 559
1987 85 241 206 43 575
1989 100 246 216 44 606
1991 149 251 225 41 666
1993 190 259 228 47 742
1994 197 265 229 50 741
1995 196 269 228 49 742
1996 191 270 229 49 739
1997 182 268 232 48 7301998 177 268 231 46 722
1999 169 256 236 45 706
2000 153 247 237 48 685
2001 130 242 236 46 654
2002 113 239 236 48 636
2003 106 236 235 48 625
2004 96 227 234 46 603
2005 91 225 236 46 598
2006 85 264 236 na 585Source: Interview with A. Kommer (Tallinn University), Mimeo Estonia for data 1981—1989, NationalStatistical Offi ce for data 1990—2005, MER for data for 2006.
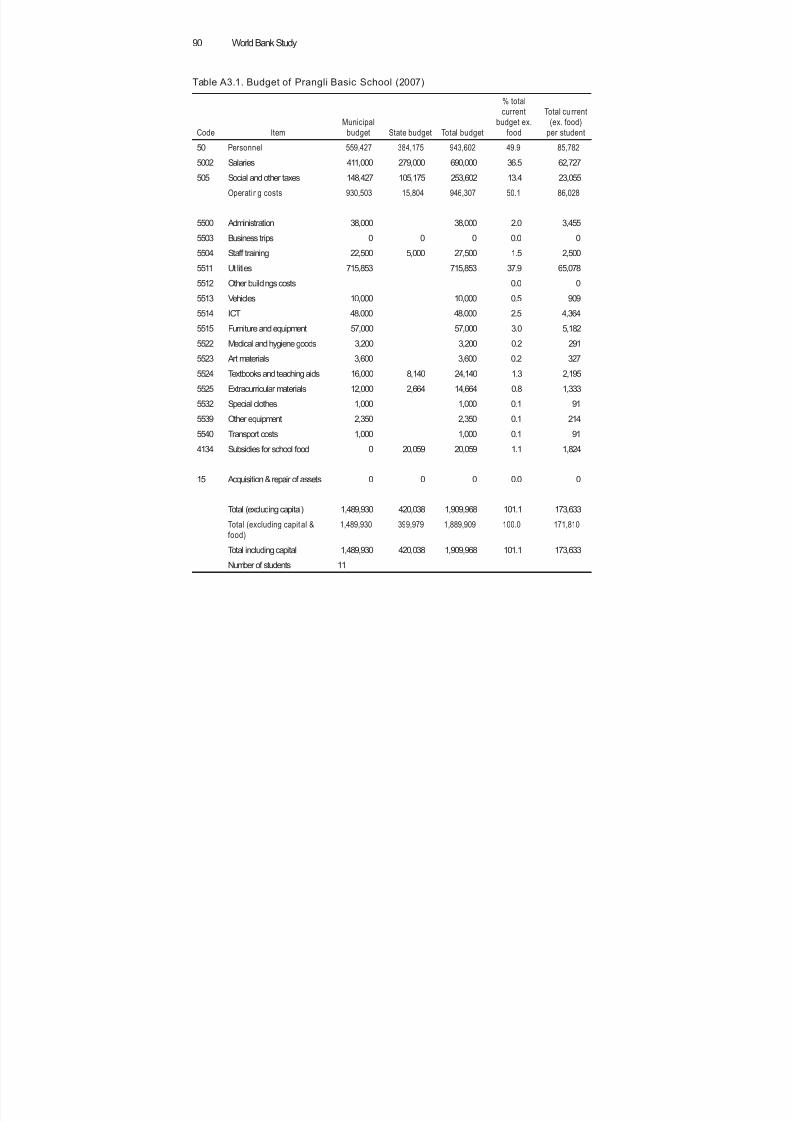
8/6/2019 Reforming Education Finance in Transition Countries
http://slidepdf.com/reader/full/reforming-education-finance-in-transition-countries 114/335
World Bank Study90
Table A3.1. Budget of Prangli Basic School (2007)
Code Item
Municipal
budget State budget Total budget
% total
current
budget ex.
food
Total cu rrent
(ex. food)
per student50 Personnel 559,427 384,175 943,602 49.9 85,782
5002 Salaries 411,000 279,000 690,000 36.5 62,727
505 Social and other taxes 148,427 105,175 253,602 13.4 23,055
Operating costs 930,503 15,804 946,307 50.1 86,028
5500 Administration 38,000 38,000 2.0 3,455
5503 Business trips 0 0 0 0.0 0
5504 Staff training 22,500 5,000 27,500 1.5 2,500
5511 Utilities 715,853 715,853 37.9 65,078
5512 Other buildings costs 0.0 0
5513 Vehicles 10,000 10,000 0.5 909
5514 ICT 48,000 48,000 2.5 4,364
5515 Furniture and equipment 57,000 57,000 3.0 5,182
5522 Medical and hygiene goods 3,200 3,200 0.2 291
5523 Art materials 3,600 3,600 0.2 327
5524 Textbooks and teaching aids 16,000 8,140 24,140 1.3 2,195
5525 Extracurricular materials 12,000 2,664 14,664 0.8 1,333
5532 Special clothes 1,000 1,000 0.1 91
5539 Other equipment 2,350 2,350 0.1 214
5540 Transport costs 1,000 1,000 0.1 91
4134 Subsidies for school food 0 20,059 20,059 1.1 1,824
15 Acquisition & repair of assets 0 0 0 0.0 0
Total (excluding capital) 1,489,930 420,038 1,909,968 101.1 173,633
Total (excluding capital &
food)
1,489,930 399,979 1,889,909 100.0 171,810
Total including capital 1,489,930 420,038 1,909,968 101.1 173,633
Number of students 11
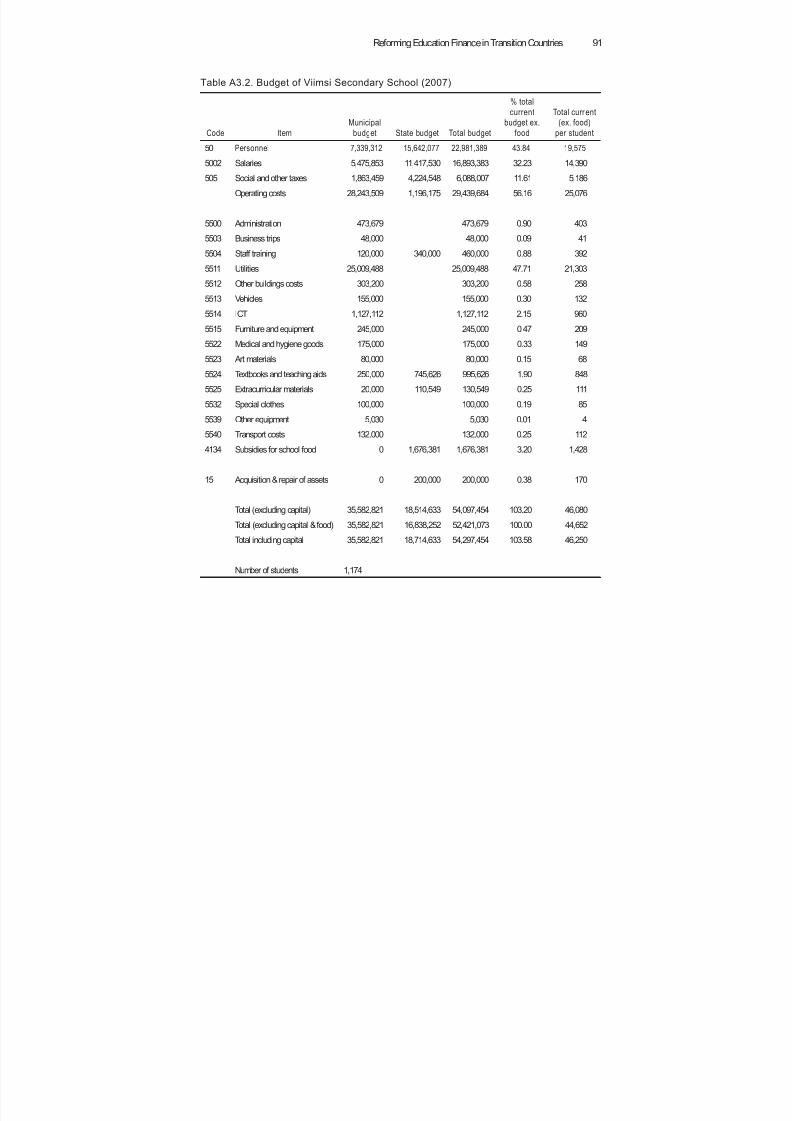
8/6/2019 Reforming Education Finance in Transition Countries
http://slidepdf.com/reader/full/reforming-education-finance-in-transition-countries 115/335
Reforming Education Finance in Transition Countries 91
Table A3.2. Budget of Viimsi Secondary School (2007)
Code Item
Municipal
budget State budget Total budget
% total
current
budget ex.
food
Total curr ent
(ex. food)
per student50 Personnel 7,339,312 15,642,077 22,981,389 43.84 19,575
5002 Salaries 5,475,853 11,417,530 16,893,383 32.23 14,390
505 Social and other taxes 1,863,459 4,224,548 6,088,007 11.61 5,186
Operating costs 28,243,509 1,196,175 29,439,684 56.16 25,076
5500 Administration 473,679 473,679 0.90 403
5503 Business trips 48,000 48,000 0.09 41
5504 Staff training 120,000 340,000 460,000 0.88 392
5511 Utilities 25,009,488 25,009,488 47.71 21,303
5512 Other buildings costs 303,200 303,200 0.58 258
5513 Vehicles 155,000 155,000 0.30 132
5514 ICT 1,127,112 1,127,112 2.15 960
5515 Furniture and equipment 245,000 245,000 0.47 209
5522 Medical and hygiene goods 175,000 175,000 0.33 149
5523 Art materials 80,000 80,000 0.15 68
5524 Textbooks and teaching aids 250,000 745,626 995,626 1.90 848
5525 Extracurricular materials 20,000 110,549 130,549 0.25 111
5532 Special clothes 100,000 100,000 0.19 85
5539 Other equipment 5,030 5,030 0.01 4
5540 Transport costs 132,000 132,000 0.25 112
4134 Subsidies for school food 0 1,676,381 1,676,381 3.20 1,428
15 Acquisition & repair of assets 0 200,000 200,000 0.38 170
Total (excluding capital) 35,582,821 18,514,633 54,097,454 103.20 46,080
Total (excluding capital & food) 35,582,821 16,838,252 52,421,073 100.00 44,652
Total including capital 35,582,821 18,714,633 54,297,454 103.58 46,250
Number of students 1,174
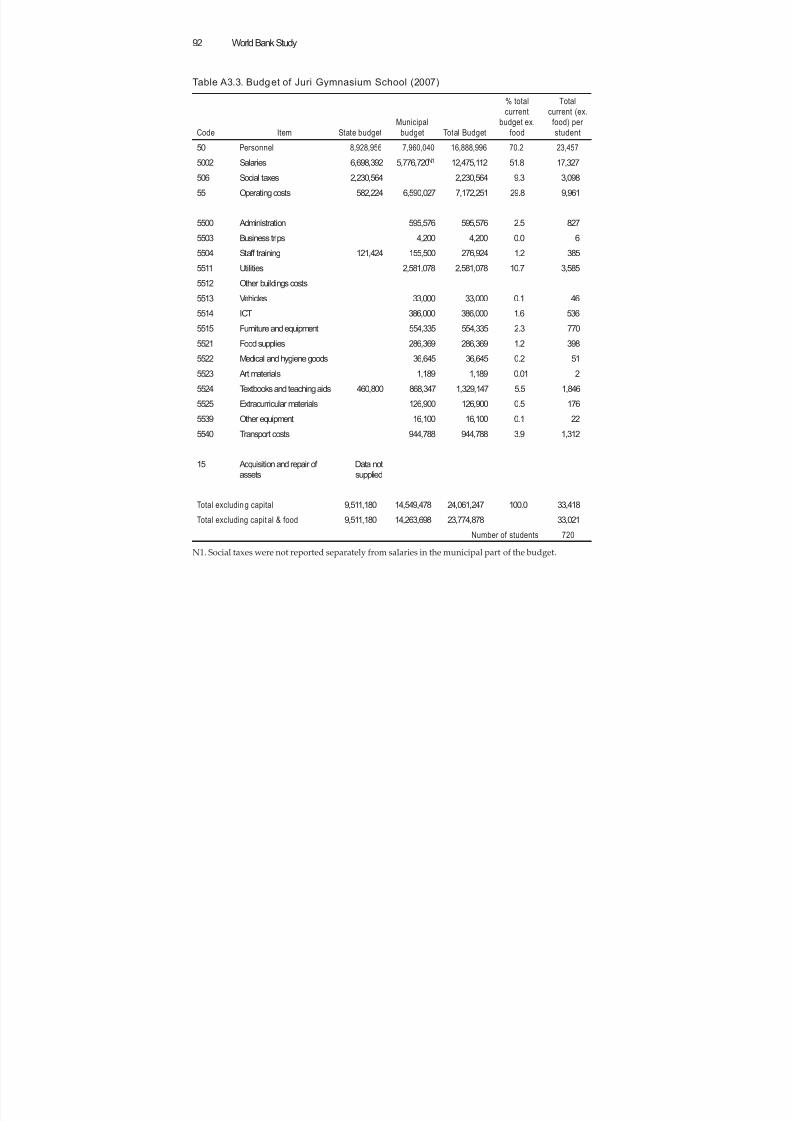
8/6/2019 Reforming Education Finance in Transition Countries
http://slidepdf.com/reader/full/reforming-education-finance-in-transition-countries 116/335
World Bank Study92
Table A3.3. Budget of Juri Gymnasium School (2007)
Code Item State budget
Municipal
budget Total Budget
% total
current
budget ex.
food
Total
current (ex.
food) per
student50 Personnel 8,928,956 7,960,040 16,888,996 70.2 23,457
5002 Salaries 6,698,392 5,776,720N1 12,475,112 51.8 17,327
506 Social taxes 2,230,564 2,230,564 9.3 3,098
55 Operating costs 582,224 6,590,027 7,172,251 29.8 9,961
5500 Administration 595,576 595,576 2.5 827
5503 Business trips 4,200 4,200 0.0 6
5504 Staff training 121,424 155,500 276,924 1.2 385
5511 Utilities 2,581,078 2,581,078 10.7 3,585
5512 Other buildings costs
5513 Vehicles 33,000 33,000 0.1 46
5514 ICT 386,000 386,000 1.6 536
5515 Furniture and equipment 554,335 554,335 2.3 770
5521 Food supplies 286,369 286,369 1.2 398
5522 Medical and hygiene goods 36,645 36,645 0.2 51
5523 Art materials 1,189 1,189 0.01 2
5524 Textbooks and teaching aids 460,800 868,347 1,329,147 5.5 1,846
5525 Extracurricular materials 126,900 126,900 0.5 176
5539 Other equipment 16,100 16,100 0.1 22
5540 Transport costs 944,788 944,788 3.9 1,312
15 Acquisition and repair of
assets
Data not
supplied
Total excluding capital 9,511,180 14,549,478 24,061,247 100.0 33,418
Total excluding capit al & food 9,511,180 14,263,698 23,774,878 33,021
Number of students 720
N1. Social taxes were not reported separately from salaries in the municipal part of the budget.
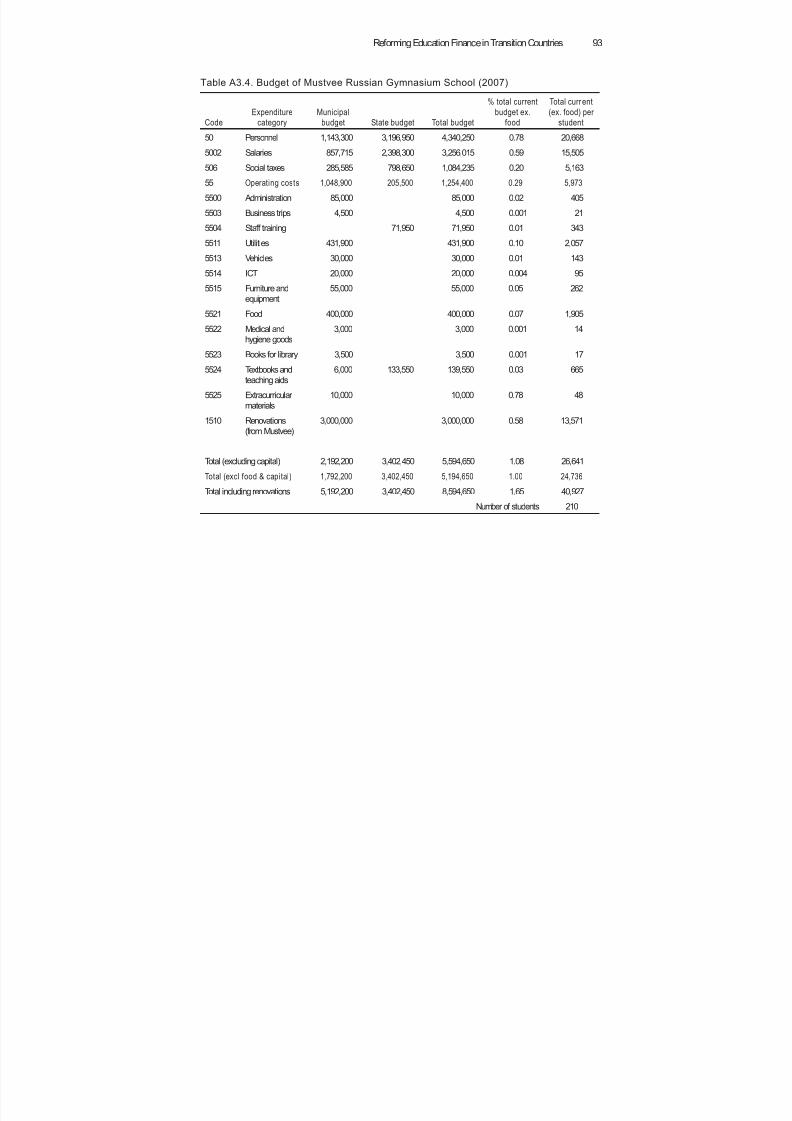
8/6/2019 Reforming Education Finance in Transition Countries
http://slidepdf.com/reader/full/reforming-education-finance-in-transition-countries 117/335
Reforming Education Finance in Transition Countries 93
Table A3.4. Budget of Mustvee Russian Gymnasium School (2007)
Code
Expenditure
category
Municipal
budget State budget Total budget
% total current
budget ex.
food
Total curr ent
(ex. food) per
student
50 Personnel 1,143,300 3,196,950 4,340,250 0.78 20,668
5002 Salaries 857,715 2,398,300 3,256,015 0.59 15,505
506 Social taxes 285,585 798,650 1,084,235 0.20 5,163
55 Operating costs 1,048,900 205,500 1,254,400 0.29 5,973
5500 Administration 85,000 85,000 0.02 405
5503 Business trips 4,500 4,500 0.001 21
5504 Staff training 71,950 71,950 0.01 343
5511 Utilities 431,900 431,900 0.10 2,057
5513 Vehicles 30,000 30,000 0.01 143
5514 ICT 20,000 20,000 0.004 95
5515 Furniture and
equipment
55,000 55,000 0.05 262
5521 Food 400,000 400,000 0.07 1,905
5522 Medical and
hygiene goods
3,000 3,000 0.001 14
5523 Books for library 3,500 3,500 0.001 17
5524 Textbooks and
teaching aids
6,000 133,550 139,550 0.03 665
5525 Extracurricular
materials
10,000 10,000 0.78 48
1510 Renovations
(from Mustvee)
3,000,000 3,000,000 0.58 13,571
Total (excluding capital) 2,192,200 3,402,450 5,594,650 1.08 26,641
Total (excl food & capital) 1,792,200 3,402,450 5,194,650 1.00 24,736
Total including renovations 5,192,200 3,402,450 8,594,650 1.65 40,927
Number of students 210
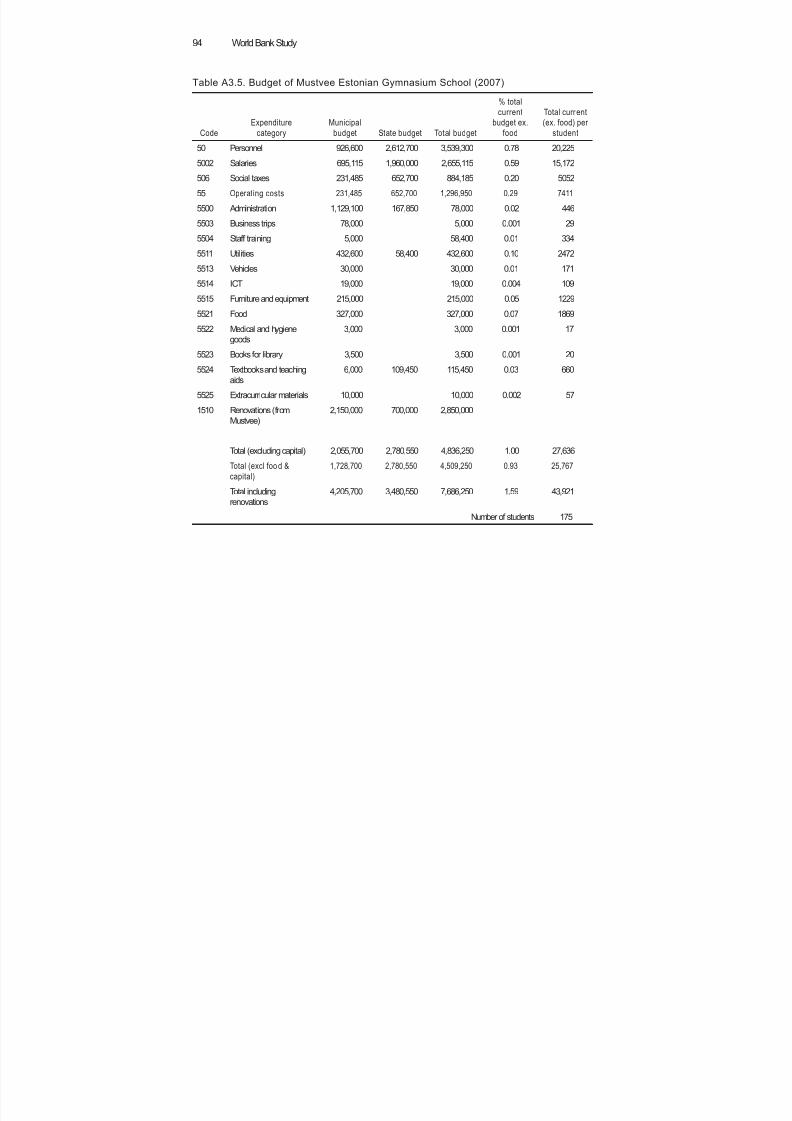
8/6/2019 Reforming Education Finance in Transition Countries
http://slidepdf.com/reader/full/reforming-education-finance-in-transition-countries 118/335
World Bank Study94
Table A3.5. Budget of Mustvee Estonian Gymnasium School (2007)
Code
Expenditure
category
Municipal
budget State budget Total budget
% total
current
budget ex.
food
Total curr ent
(ex. food) per
student50 Personnel 926,600 2,612,700 3,539,300 0.78 20,225
5002 Salaries 695,115 1,960,000 2,655,115 0.59 15,172
506 Social taxes 231,485 652,700 884,185 0.20 5052
55 Operating costs 231,485 652,700 1,296,950 0.29 7411
5500 Administration 1,129,100 167,850 78,000 0.02 446
5503 Business trips 78,000 5,000 0.001 29
5504 Staff training 5,000 58,400 0.01 334
5511 Utilities 432,600 58,400 432,600 0.10 2472
5513 Vehicles 30,000 30,000 0.01 171
5514 ICT 19,000 19,000 0.004 109
5515 Furniture and equipment 215,000 215,000 0.05 1229
5521 Food 327,000 327,000 0.07 1869
5522 Medical and hygiene
goods
3,000 3,000 0.001 17
5523 Books for library 3,500 3,500 0.001 20
5524 Textbooks and teaching
aids
6,000 109,450 115,450 0.03 660
5525 Extracurricular materials 10,000 10,000 0.002 57
1510 Renovations (fromMustvee)
2,150,000 700,000 2,850,000
Total (excluding capital) 2,055,700 2,780,550 4,836,250 1.00 27,636
Total (excl food &
capital)
1,728,700 2,780,550 4,509,250 0.93 25,767
Total including
renovations
4,205,700 3,480,550 7,686,250 1.59 43,921
Number of students 175
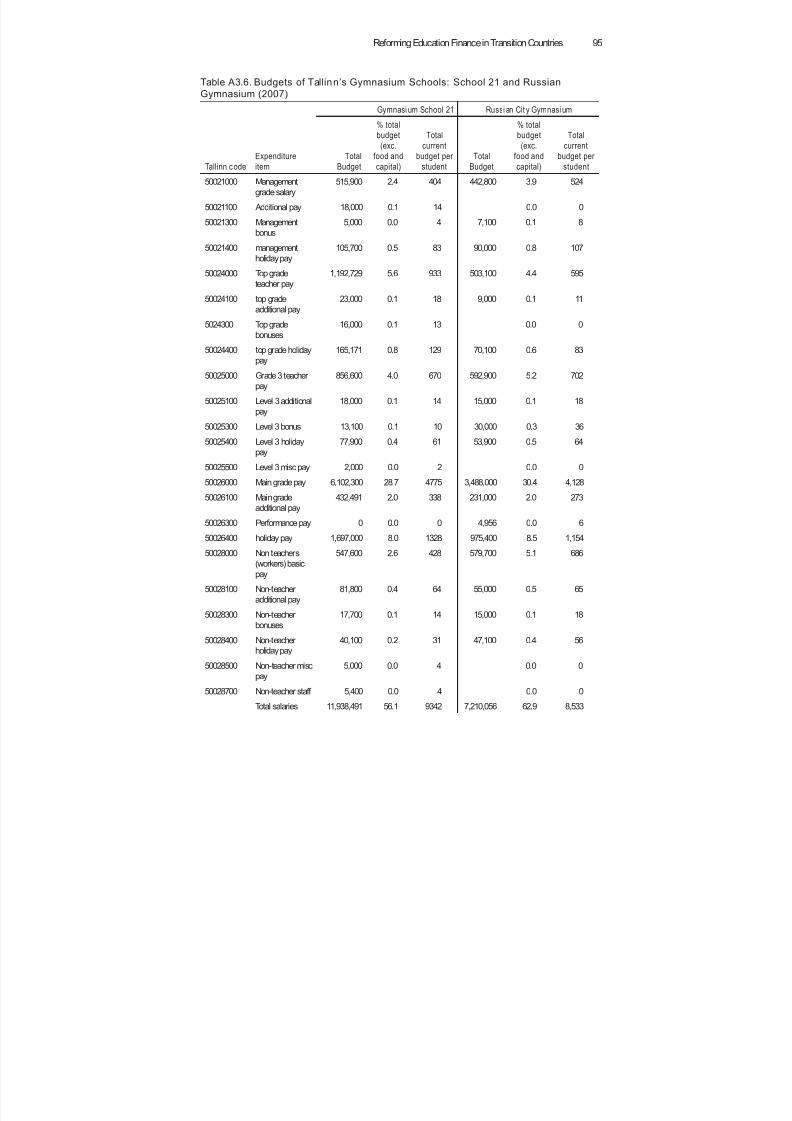
8/6/2019 Reforming Education Finance in Transition Countries
http://slidepdf.com/reader/full/reforming-education-finance-in-transition-countries 119/335
Reforming Education Finance in Transition Countries 95
Table A3.6. Budgets of Tallinn’s Gymnasium Schools: School 21 and Russian
Gymnasium (2007)
Gymnasi um School 21 Russi an Cit y Gymnasi um
Tallinn c ode
Expenditure
item
Total
Budget
% total
budget(exc.
food and
capital)
Totalcurrent
budget per
student
Total
Budget
% total
budget(exc.
food and
capital)
Totalcurrent
budget per
student
50021000 Management
grade salary
515,900 2.4 404 442,800 3.9 524
50021100 Additional pay 18,000 0.1 14 0.0 0
50021300 Management
bonus
5,000 0.0 4 7,100 0.1 8
50021400 management
holiday pay
105,700 0.5 83 90,000 0.8 107
50024000 Top gradeteacher pay
1,192,729 5.6 933 503,100 4.4 595
50024100 top grade
additional pay
23,000 0.1 18 9,000 0.1 11
5024300 Top grade
bonuses
16,000 0.1 13 0.0 0
50024400 top grade holiday
pay
165,171 0.8 129 70,100 0.6 83
50025000 Grade 3 teacher
pay
856,600 4.0 670 592,900 5.2 702
50025100 Level 3 additional
pay
18,000 0.1 14 15,000 0.1 18
50025300 Level 3 bonus 13,100 0.1 10 30,000 0.3 36
50025400 Level 3 holiday
pay
77,900 0.4 61 53,900 0.5 64
50025500 Level 3 misc pay 2,000 0.0 2 0.0 0
50026000 Main grade pay 6,102,300 28.7 4775 3,488,000 30.4 4,128
50026100 Main grade
additional pay
432,491 2.0 338 231,000 2.0 273
50026300 Performance pay 0 0.0 0 4,956 0.0 6
50026400 holiday pay 1,697,000 8.0 1328 975,400 8.5 1,154
50028000 Non teachers
(workers) basic
pay
547,600 2.6 428 579,700 5.1 686
50028100 Non-teacher
additional pay
81,800 0.4 64 55,000 0.5 65
50028300 Non-teacher
bonuses
17,700 0.1 14 15,000 0.1 18
50028400 Non-teacher
holiday pay
40,100 0.2 31 47,100 0.4 56
50028500 Non-teacher misc
pay
5,000 0.0 4 0.0 0
50028700 Non-teacher staff 5,400 0.0 4 0.0 0
Total salaries 11,938,491 56.1 9342 7,210,056 62.9 8,533
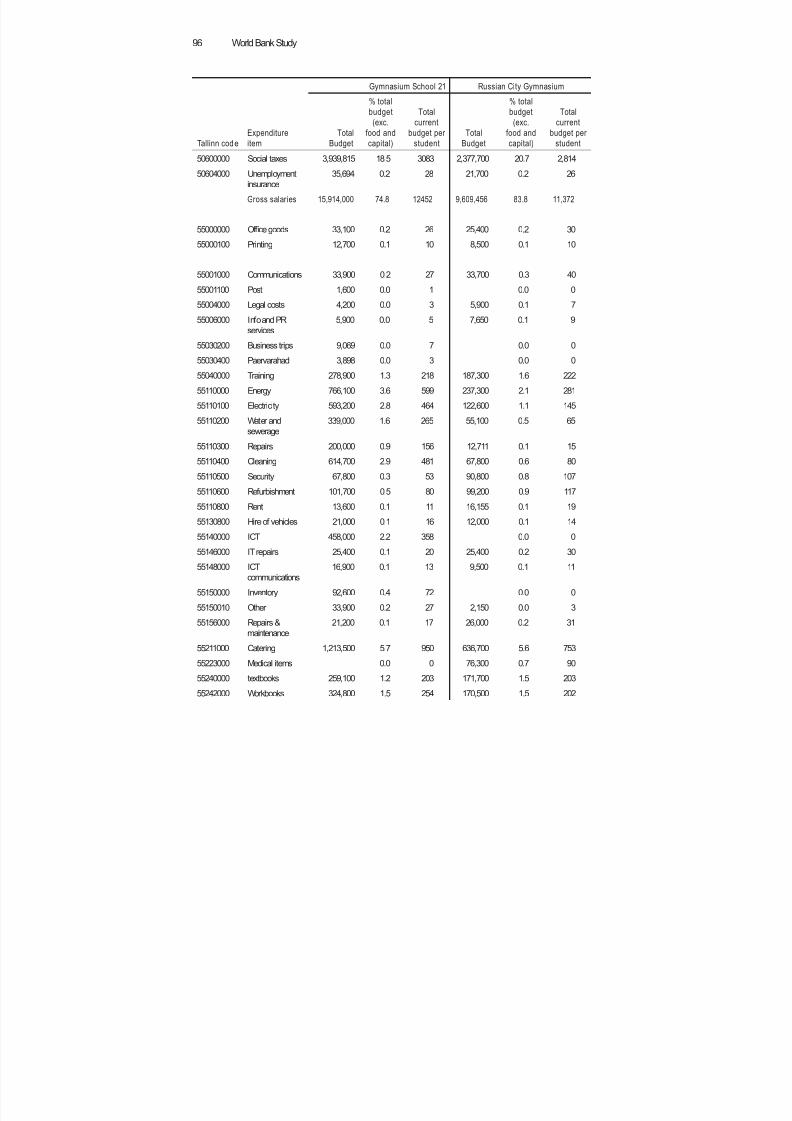
8/6/2019 Reforming Education Finance in Transition Countries
http://slidepdf.com/reader/full/reforming-education-finance-in-transition-countries 120/335
World Bank Study96
Gymnasium School 21 Russian City Gymnasium
Tallinn code Expenditureitem TotalBudget
% total
budget
(exc.
food andcapital)
Total
current
budget perstudent TotalBudget
% total
budget
(exc.
food andcapital)
Total
current
budget perstudent
50600000 Social taxes 3,939,815 18.5 3083 2,377,700 20.7 2,814
50604000 Unemployment
insurance
35,694 0.2 28 21,700 0.2 26
Gross salaries 15,914,000 74.8 12452 9,609,456 83.8 11,372
55000000 Of fice goods 33,100 0.2 26 25,400 0.2 30
55000100 Printing 12,700 0.1 10 8,500 0.1 10
55001000 Communications 33,900 0.2 27 33,700 0.3 40
55001100 Post 1,600 0.0 1 0.0 0
55004000 Legal costs 4,200 0.0 3 5,900 0.1 7
55006000 Info and PR
services
5,900 0.0 5 7,650 0.1 9
55030200 Business trips 9,069 0.0 7 0.0 0
55030400 Paervarahad 3,898 0.0 3 0.0 0
55040000 Training 278,900 1.3 218 187,300 1.6 222
55110000 Energy 766,100 3.6 599 237,300 2.1 281
55110100 Electricity 593,200 2.8 464 122,600 1.1 145
55110200 Water and
sewerage
339,000 1.6 265 55,100 0.5 65
55110300 Repairs 200,000 0.9 156 12,711 0.1 15
55110400 Cleaning 614,700 2.9 481 67,800 0.6 80
55110500 Security 67,800 0.3 53 90,800 0.8 107
55110600 Refurbishment 101,700 0.5 80 99,200 0.9 117
55110800 Rent 13,600 0.1 11 16,155 0.1 19
55130800 Hire of vehicles 21,000 0.1 16 12,000 0.1 14
55140000 ICT 458,000 2.2 358 0.0 0
55146000 IT repairs 25,400 0.1 20 25,400 0.2 30
55148000 ICT
communications
16,900 0.1 13 9,500 0.1 11
55150000 Inventory 92,600 0.4 72 0.0 0
55150010 Other 33,900 0.2 27 2,150 0.0 3
55156000 Repairs &
maintenance
21,200 0.1 17 26,000 0.2 31
55211000 Catering 1,213,500 5.7 950 636,700 5.6 753
55223000 Medical items 0.0 0 76,300 0.7 90
55240000 textbooks 259,100 1.2 203 171,700 1.5 203
55242000 Workbooks 324,800 1.5 254 170,500 1.5 202
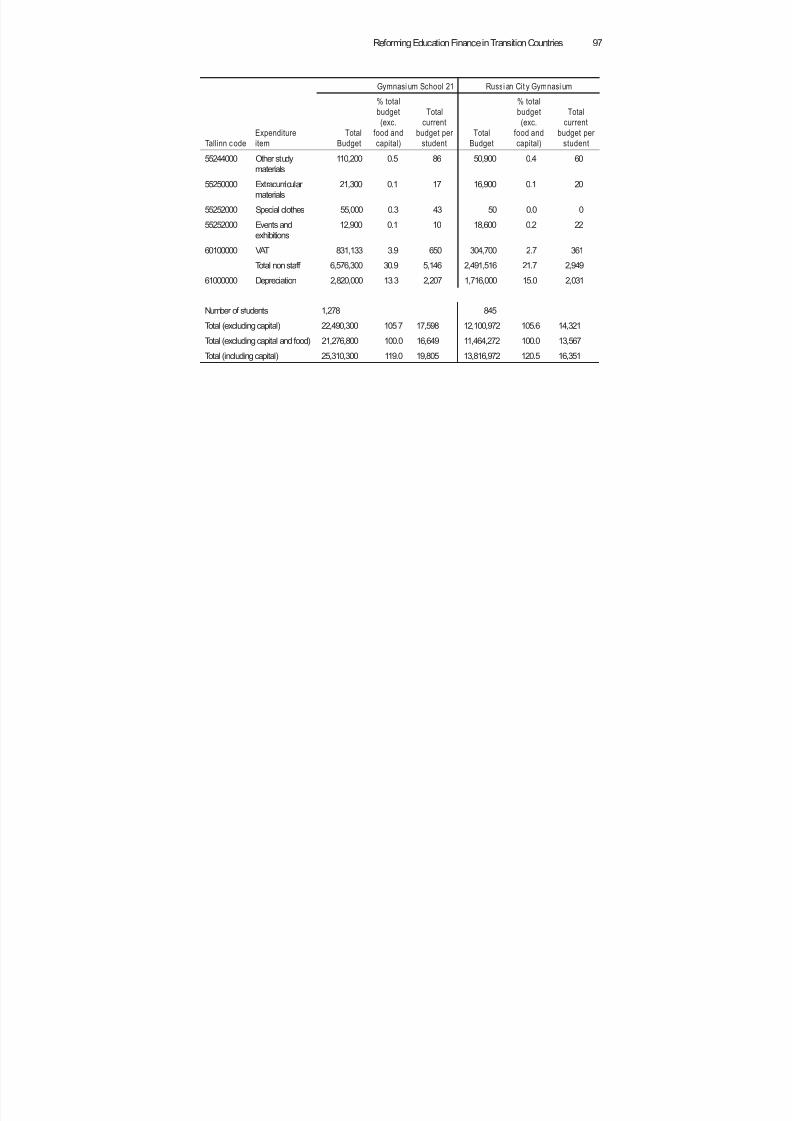
8/6/2019 Reforming Education Finance in Transition Countries
http://slidepdf.com/reader/full/reforming-education-finance-in-transition-countries 121/335
Reforming Education Finance in Transition Countries 97
Gymnasi um School 21 Russi an Cit y Gymnasi um
Tallinn c ode Expenditureitem TotalBudget
% total
budget
(exc.
food andcapital)
Total
current
budget perstudent TotalBudget
% total
budget
(exc.
food andcapital)
Total
current
budget perstudent
55244000 Other study
materials
110,200 0.5 86 50,900 0.4 60
55250000 Extracurricular
materials
21,300 0.1 17 16,900 0.1 20
55252000 Special clothes 55,000 0.3 43 50 0.0 0
55252000 Events and
exhibitions
12,900 0.1 10 18,600 0.2 22
60100000 VAT 831,133 3.9 650 304,700 2.7 361
Total non staff 6,576,300 30.9 5,146 2,491,516 21.7 2,949
61000000 Depreciation 2,820,000 13.3 2,207 1,716,000 15.0 2,031
Number of students 1,278 845
Total (excluding capital) 22,490,300 105.7 17,598 12,100,972 105.6 14,321
Total (excluding capital and food) 21,276,800 100.0 16,649 11,464,272 100.0 13,567
Total (including capital) 25,310,300 119.0 19,805 13,816,972 120.5 16,351
8/6/2019 Reforming Education Finance in Transition Countries
http://slidepdf.com/reader/full/reforming-education-finance-in-transition-countries 122/335
World Bank Study98
Annex B. List o f People Interviewed for the Country Case Study
Tatjana Kiilo, Chief Expert, Foreign Relations Department, Ministry of Education andResearch
Meelis Steinberg, Chief Specialist, State Budget Department, Ministry of FinanceAndrus Jõgi, Chief Specialist, Local Government Division, State Budget Department,
Ministry of Finance
Teet Tiko, Head of School Network Bureau
Anneli Kommer, Tallinn University
Avo Veermäe, Head of General Secondary Education Division, Ministry of Educationand Research in Tartu
Priit Laanoja, Analyst, Analysis Department, Ministry of Education and Research inTartu
Director and inspectors, Tartu County Government
Mati Kepp, Mayor, Mustvee Municipality
School directors of Estonian and Russian Gymnasiums, Mustvee Municipality
Meelis Kond, Director of Education Services, Tallinn municipality
Andres Pajula Tallin, Head of the Education Department, Tallinn municipality
Liilia Oberg, Chief Expert, General Secondary Education Division, Tallinn municipality
Sigre Rõuk, Senior Specialist, International Relations, Tallinn municipality
School directors and deputy directors of Russian City Gymnasium and Gynmasium 21,
Tallinn MunicipalityUrmas Arumäe, Mayor, Viimsi Municipality
Endel Lepik, Vice Mayor, Viimsi Municipality
Kadi Bruus, Head of Education and Youth Department, Viimsi Municipality
School directors of Viimsi Secondary School, Pűűunsi Basic School and Prangli BasicSchool, Viimsi Municipality
Raivo Uukkivi, Mayor, Rae Municipality
Enn Mänd, Vice Mayor, Rae Municipality
Tiit Keerma, Head Accountant, Rae MunicipalitySchool directors of Juri Gymnasium and Lagedi Basic School, Rae Municipality
Rien Rebane, Director, Rocca al Mare Private School
Tiit Kirss, Advisor, Association of Municipalities of Estonia
Jüri Võigemast, Managing Director, Association of Municipalities of Estonia
Toomas Kruusimägi, School Director, Tallinn English College and chairman of SchoolDirectors´ Association (Koolijuhtide Ühendus)
8/6/2019 Reforming Education Finance in Transition Countries
http://slidepdf.com/reader/full/reforming-education-finance-in-transition-countries 123/335
Reforming Education Finance in Transition Countries 99
Notes
1. I would like to thank Tatjana Kiilo, of the International Relations Department of the Ministryof Education and Research, for organizing my study visit to Estonia from May 28 through June 8of 2007. I would also like to thank Andrus Jõgi, of the Local Government Financial Management
Department of the Ministry of Finance, for his unstinting assistance with information on fundingformulae. I would finally like to thank everyone with whom I discussed education and who gaveso generously of their time to explain the Estonian school funding system to me and show mearound their schools. They are too many to name here and are listed in the appendix. All mistakes,errors of interpretation and judgments made are my responsibility.2. “The Local Self-government Foundation Act adopted on November 10, 1989, re-established the basis for the local government system in Estonia. A month later, on December 10, 1989, the firstdemocratic post-war municipal elections were held. From 1989 to 1993 the first tier of the Estonianlocal government consisted of rural communities, boroughs, and towns; the second—of counties.In December 1990 the Parliament established the Principles of local government. When the Consti-tution was adopted in June 1992, 90% of Estonia’s 249 rural municipalities, boroughs, and towns
were granted the status of self-governments. In May 1993 the State Assembly approved the creationof the one-level local government system and on June 2, 1993 adopted the Local Self-governmentOrganization Act. On September 28, 1994, the State Assembly ratified in full the European Charterof Local Self Government.” Excerpt from Põllumäe, S. (2002).3. The BSUSS Act has been modified several times–the last being in 2005.4. From data supplied by Ministry of Education and Research.5. The majority of Russians originate from those who emigrated to work in new factories in Estoniaafter WWII, but there is also a long-established Russian emigré community of ‘Old Believers’ whomoved to Estonia in the 17th century to escape religious persecution.6. The language of instruction is that is used in 60 percent of teaching.7. Schools which use Russian as the main language of instruction and which serve the Russiancommunity.
8. Consequently vocational schools are not funded by the national formula examined in this chapter.9. Section 6 of chapter 8 states that the expenses of a state school (i.e. one owned by MER) shall be covered by the annual State Budget Act in the amount prescribed for state schools within the budget of MER.10. Information on the history of the formula is from an interview with Ms. Anneli Kommer, Headof Planning at MER in the period 1994-2002. Any errors are my responsibility.11. The visit to Estonia to collect data took place in June 2007. I was updated on developments withrespect to the 2008 formula by email correspondence with Andrus Jõgi.12. The BSUSS Act is periodically revised.13. Interview at MER.14. I am indebted to Andrus Jõgi for this section, as he wrote a detailed explanation for it, which I have
paraphrased, and unstintingly responded to my many queries. Any mistakes are my responsibility.15. This issue can be illustrated by an example. Assume a per capita funding formula allocatessuffi cient money to fund the teachers for a class of 25 pupils. However the school has some gradesin which there are 20 pupils and others in which there are 30. So it can organize classes of 20, forwhich it receives insuffi cient money, and off set these costs by having other grades with classes of30 and use the spare pupil funding for five students to top up the teaching costs of the classes of20. But if the maximum permied class size is say, 28, then the school cannot have classes of 29or more and would have to split them but it does not receive enough money in the formula fororganizing classes of 15.16. Teachers are required to teach between 18 and 24 lessons per week for a full time salary. Theaverage of 21 hours is assumed for the formula.17. There are four categories of teachers: junior teacher, teacher, senior teacher and expert teacher.18. For the 2008 formula the basic teacher salary for the purposes of the formula is taken to be10,000 EEK per month. This multiplied by 12 to get the annual salary, then by 1.333 to add in socialfund contributions and then by 1.03 to include the costs of in-service teacher training. The totalcosts of a teacher in 2008 is 164, 759 EEK per year.
8/6/2019 Reforming Education Finance in Transition Countries
http://slidepdf.com/reader/full/reforming-education-finance-in-transition-countries 124/335
World Bank Study100
19. Additional funding in stage III is not granted if the number of students in grades 7-9 is less than30 and in there are less than the following numbers of students: less than 36 in grades 1-3, 35 ingrades 2-4, 34 in grades 3-5, 33 in grades 4-6, 32 in grades 5-7, 31 in grades 6-8.20. The presence of gravel roads merits a coeffi cient of 1.2.21. There is no investment grant for students in prisons.22. Table A1 presents an example of how the new formula calculates the grant for a school in amunicipality with less than 1,600 students in both the Estonian and Russian language mediums.The total state grant for the municipality consists of the sum of the grants worked out for each ofits schools. As already noted, a municipality does not need to allocate to each school exactly theamount that the formula calculates.23. Horizontal equity is defined as the equal treatment of equals and vertical equity as the un-equal treatment of unequals (Monk 1990). The main problem with operationalizing the concept ofhorizontal equity is defining equals. It is standard to regard students in the same grade range andwho have no special needs (i.e. ‘regular students’) as equals. Horizontal equity requires that suchstudents receive the same per capita funding. The specification of equals requires further refine-ment when costs per student vary for structural reasons—that is factors beyond the control of the
education authority, such as regional cost diff erences and geographic factors that make it infeasibleto educate all ‘regular’ students in schools of minimum effi cient size. Thus, for horizontal equityexpenditure per student in each grade range (e.g. primary and lower secondary grade ranges)should be the same throughout the country, with any diff erences in expenditure per student beingdue only to diff erence in structural costs.24. The municipalities were selected to include a poor small municipality (Mustvee) and a wealthyrural municipality (Viimsi) plus Tallinn. Rae was also visited as it was accessible from Tallinn.25. Under the current (2007) formula the municipality could determine the allocation of statefunding to private schools. The new formula will allocate the same amount to private and publicschools, which have the same number of students per grade range.26. The total number of teachers rose from 3,757 in 1994 to 5,490 in 2007, not only due to the re-
duction in lesson hours a teacher has to teach for a full time salary but also due to a considerableincrease in the number of part-time teachers, of which there were only a few in 1994.27. It is important to remind the reader that this chapter was finalized in 2008. Therefore, the situ-ation refers to the prevailing conditions back then.28. The legality of this arrangement was being investigated.29. This percentage is reported in OECD (2006) Education at a Glance (and earlier editions).30. Communication from MoF February 2008.31. This assumes the same cash amounts per student as in given in Table 6.32. With 2 students per grade the state grant would fund as if there were 18 pupils. One mixed ageclass for grades 1 to 6 could be aff orded. As it is not permied to mix so many grades the munici-pality would have to provide additional funding to run 2 classes. The formula designers think thatfewer than 7 students per class in grades 1 to 6 is unlikely.
33. A simple regression of the PISA average score for maths, reading and science in 2006 on expen-diture per lower secondary student as a proportion of GDP per capita for 33 countries indicatedthat the PISA score for Estonia is 20 points higher than would be predicted from the estimatedcoeffi cients and that this diff erence is statistically significant.34. This point was made by some of the school directors and teachers interviewed.35. From interview with Association of Estonian Cities.36. In general structural cost diff erences are defined as those that are due to factors that the localgovernment cannot control, such as small school and class size due to low population density, poortransport communications, climate and the divergence of the prices of local educational inputsfrom the national average.37. Mustvee had recently experienced financial diffi culties due to subsidizing communal water
and heating, which it has now ceased doing. Thus, it chose to spend on these services rather thanspend more on education.38. A parent commented that the school made quite substantial requests for parental contributions.39. Estonia ranked 24th out of 163 countries in the Transparency International Corruption Index2006 (www.transparency.org/news_room/in_focus/2006/cpi_2006/cpi_table accessed December20th , 2007). This is the highest of any ex-communist country.
8/6/2019 Reforming Education Finance in Transition Countries
http://slidepdf.com/reader/full/reforming-education-finance-in-transition-countries 125/335
101
C H A P T E R 4
School Vouchers in Georgia:Implementation of a Simple Idea
in a Complex Environment
Jan Herczyński1
Sergo Durglishvili
4.1. Introduction
The rose revolution of 2003 has brought to power in Tbilisi the strong reformist govern-
ment of President Saakashvili. The government has been undertaking a series of far
reaching reforms in many sectors of public life, trying to make up for the sluggish pace
of reforms under the previous administration of Shevardnadze. The reforms in all sec-
tors had been driven by liberal principles and the desire to grant more autonomy and
freedom to most institutions. In education, the key beneficiary of the reforms was theschool itself. Freed from the control and monitoring of corrupt local governments, and
instead subordinated to the local community of parents, the autonomous school was
given the right to decide, in the interest of the students and teachers alike, on key ques-
tions of budget and management.
The financing of autonomous schools had to come directly from the central Gov-
ernment to the schools, by-passing the local governments to avoid re-emergence of the
previous system inherited from the Soviet times. The chosen financing system were the
vouchers , which allocate the funds to each school proportionally to the enrollment (with
some exceptions based on school location, see below). The voucher systems have many
theoretical proponents, but few practical implementations. Georgia, alongside neighbor-ing Armenia though in a completely diff erent manner (see respective chapter on Arme-
nian experience), made a bold if somewhat risky step to introduce an untried financing
system. This brave step was part of wider radical overhaul of the country’s administra-
tive and institutional structures and very much in line with the hopes and promises of
the rose revolution of 2003 (see Table 4.1).
The present chapter provides a sympathetic yet critical review of the voucher sys-
tem in Georgia. It focuses on some key shortcomings of the system in the belief that only
analysis of actual problems and diffi culties may contribute to long term success of in-
novative and brave policy initiative. We review a number of thoughtful early decisions
taken by Georgian reformers, such as network consolidation prior to education finance
reform2 and the avoidance of piloting phase (see also the timeline below). We point out,
however, that serious changes need to be implemented to reduce the widespread phe-
8/6/2019 Reforming Education Finance in Transition Countries
http://slidepdf.com/reader/full/reforming-education-finance-in-transition-countries 126/335
World Bank Study102
nomenon of de ficit schools and the significant inequities inherent in the current system, if
the vouchers are to become a stable financing system of schools.
The structure of the chapter is as follows.3 In section 4.2, we discuss the background
to the introduction of vouchers, in particular the preparatory work conducted by the
Ministry of Education. The design and implementation of the voucher system is dis-cussed in sections 4.3 and 4.4. An important implementation issue is how the Ministry
treats the so—called deficit schools. The outcomes of the reforms are assessed in section
4.4. Section 4.5 assesses the outcomes of the financing reform along the domains of ef-
ficiency, equity, and transparency/accountability, but also touching on other important
key areas like the reaction of stakeholders to the new system, and issues related to school
autonomy and school competition. We conclude in section 4.6 with a brief review of
main challenges facing the school voucher system in Georgia.
Table 4.1. Timeline of Key Events Related to the Education Finance Reform
Year Key event related to per student financing reform in education
2003 Rose revolution open possibility of wide ranging reforms in Georgia
2005 Introduction of new data collection system in Georgian education
Major school network consolidation
Preparation of voucher system under Ilya Chavchavadze Project
Ministry of Education becomes responsible for financing schools
Ministry of Education obtains 30% increase of education spending in the national budget
2006 Introduction of the voucher system in Georgia
Dissolution of local governments’ education of fices
Increased institutional and budgetary autonomy of schools
Creation of Education Support Centers to assist autonomous schools
4.2. Background
One of the main distinctive marks of the current reforms is a consistent and well publi-
cized fight against corruption. Given the recent history of corruption at all levels within
public institutions in Georgia, this approach has proved to be quite challenging.
Education finance was not immune to corrupt practices.4 Two of the key challenges
were the lack of transparency and the weak budgetary discipline, which characterizedthe inherited system of Soviet style local governments at the rayon and oblast levels. An
important feature of those institutions were double reporting lines, both to elected local
offi cials and to higher level institutions such as the line ministry. Thus, in education,
rayon offi ces reported both to the local council, elected by voters, and to the oblast-level
representatives of the Ministry, appointed by the central government. Similarly, and
perhaps even more significantly, the analogous double reporting of budget offi ces ef-
fectively destroyed the budgetary autonomy of local governments.5 This confusing ar-
rangement dissolved any individual responsibility for financial decision making. The
funds for education were sent to the oblast and rayons , which then distributed them
among schools, in an unclear and unsupervised manner. Often a telephone call wasmore important in determining funding than decisions of local councils agreed through
a formal voting procedure. Melikidze (2003) does a review of corruption in the Georgian
8/6/2019 Reforming Education Finance in Transition Countries
http://slidepdf.com/reader/full/reforming-education-finance-in-transition-countries 127/335
Reforming Education Finance in Transition Countries 103
education system just before the beginning of the current reforms. On the basis of a large
survey and many interviews, the author assesses that there are two main forms of cor-
ruption in Georgian schools. One is private payments to public schools, solicited by the
school director from the parents for the general purpose of school maintenance. These
are very common and confirmed by 65 percent of parents and by 59 percent of schooldirectors surveyed. This situation is usually accepted as “normal” by all stakeholders,
especially in view of the very low teacher salaries (and is very diff erent, we need to add,
from paying teachers to increase marks given to students). Moreover, the sums of money
involved are not very large. The second and much more serious issue is the misappropri-
ation of funds earmarked for schools at the local government level. As Melikidze (2003)
correctly points out, this type of corruption happened in fact outside of the education
system. Anecdotal evidence shows that in some instances, complete investment projects
were recorded and accounted for in the city documents, without anything being in fact
done in the school itself, and without the school director being aware of the process.
As a result, the first radical step undertaken by the Ministry of Education (MoE) was
to agree with the Ministry of Finance (MoF) to take those funds away from the system
of local governments and to entrust them back entirely to the MoE. With this move, the
loss of funds on the way to schools was stopped and their financial situation improved
remarkably, even without increasing the allocation at the national level.
It is important to note that this line of reform activities of the Ministry was entirely
consistent with overall liberal policies of the new Georgian government, which was to
minimize the role of local governments, especially in the area of public finance. The main
motivation for this approach stemmed from the need to fight corruption. The govern-
ment took away most local government responsibilities, including health, social pro-
tection, and transportation. Some functions were decentralized to the level of service
providers, some were centralized, accompanied by a serious eff ort to privatize providers
of social services and to create market mechanisms.6 Therefore, it was natural for Geor-
gia to do likewise in education and to introduce decentralization directly to the school
level in the area of school finance, while centralizing other functions in the sector. For
example, openings and closings of schools is a responsibility of MoE, and as we discuss
below it is exercised to achieve optimization of school networks. The Ministry also has to
formally approve employment levels in all schools, although the current policy is to ap-
prove all the proposals from the schools, on the assumption your vouchers, your decisions.
Thus,fi
ghting corruption was the main motivation of reform-minded educationMinister Aleksander Lomaia and his team, which were in line with the priorities of the
government. The reforms introduced to Georgian education management and finance
very clearly serve this purpose. The key elements of the reforms may be summarized as
follows:
■ Enhanced school autonomy. Schools became independent entities under public
law, with their own bank accounts and a right to enter contracts. School facili-
ties are the property of the Ministry, given to the schools for use free of charge.7
Schools are accountable to local communities, represented by school boards (or
board of trustees, as they are sometimes called in Georgia). School boards have
assumed significant responsibilities in the activities of schools, including the
selection of school directors and approval of the budget.
8/6/2019 Reforming Education Finance in Transition Countries
http://slidepdf.com/reader/full/reforming-education-finance-in-transition-countries 128/335
World Bank Study104 Reforming Education Finance in Transition Countries
■ Enhanced budgetary autonomy. Although as discussed above formally the Min-
istry still approves the employment levels (number of positions), their salaries
are set by the school director, together with the salaries of administrative and
technical staff . Interestingly, the director sets his own salary as well. The key
requirements are to fit within the budget as formed by the vouchers, and tohave the approval of the school boards. An interesting open question is what
happens if the school board does not approve the budget; it seems that this type
of dispute is not regulated in the law.
■ Dissolution of rayon education o ffi ces and removal of any in fluence of local govern-
ments in education. Direct administrative control over schools was removed,
with a number of prerogatives taken over by the Ministry.
■ Introduction of state exams for school director candidates. For each school, the Min-
istry proposes between 2 and 3 candidates who have passed the exams, and the
director is chosen by the school board. Among the candidates, those who best
passed the exams–top 20 percent of successful applicants–can choose to which
school they will apply, while others are sent to specific schools chosen at ran-
dom by the Ministry.8
■ Introduction of a school accreditation process and a teacher licensing system to en-
sure that the decentralized education system conforms to required education standards.
School accreditation will be performed every 5 years and will be a required con-
dition of continued school operation. There is no separate school inspection in
Georgia,9 so accreditation will be the key education quality control mechanism.
■ Introduction of a per student voucher system to finance individual schools, which be-
gan in January 2006. This element of the reform is the main focus of the present
chapter.
The Georgian use of the term school vouchers is fully justified. Typically, school
vouchers are such education finance systems in which the lump sum budget of the
school is set to be proportional to the number of students, see for example Swanson and
King (1991). In other words, vouchers represent the simplest possible formula-based
allocation to schools, without regard to special needs of diff erent groups of students.10
The Georgian scheme departs slightly from strict proportionality in that it uses three dif-
ferentiated values of vouchers for city, rural and mountain schools.
Although the reforms have been undertaken very recently, there has already been
significant research into their design and impact. Godfrey (2007) discusses the fiscal anddemographic context of the education reform.11 In particular, the author analyzes the
eff ects on Georgian schools of the very low proportion of the Gross Domestic Product
(GDP) devoted to education. Zurab Simonia, the chief expert of the Ilia Chavchavadze
Project involved in the design and implementation of the voucher system, wrote a re-
view of the design of the voucher system (Simonia, 2007), including the new design of
teacher wages. Tsagareishvili (2007) performed a financial review of finances of the so
called de ficit schools–those where the voucher funding is insuffi cient. Shapiro et al. (2007)
also provide an assessment of the recent reforms based mostly on stakeholder opinions
using surveys and focus groups. We use some of their insights in diff erent places of
the chapter. Therefore, the present chapter focuses mostly on the specific issues of the
voucher system.
8/6/2019 Reforming Education Finance in Transition Countries
http://slidepdf.com/reader/full/reforming-education-finance-in-transition-countries 129/335
Reforming Education Finance in Transition Countries 105
4.2.1. Preparatory Work to Introduce Vouchers
Preparations for the introduction of a new managerial and financial system in general
education in Georgia were conducted by MoE in cooperation with the World Bank(WB)-
supported Ilia Chavchavadze Project.12 This project was responsible for the design of key
new reforms in Georgian education, including also school director examination, school
accreditation, and new institutional structure of the Ministry. The project received sup-
port from outside experts– provided by the consulting company Research Triangle In-
stitute (RTI).
Prior to the introduction of the vouchers, the Ministry made two very important
simultaneous steps as preparation to the introduction of vouchers:
■ Conducted a massive school network consolidation process, reducing the num-
ber of schools from 3,154 in 2004/05 to 2,215 in 2007/08 with the target number
of 1,800 schools. The ability to perform such a wide process of closing small
schools testifies to great political strength of the Ministry. Consolidation pro-cess is still continuing, although on a smaller scale.
■ MoE sought and obtained a government decision for a significant increase in
the overall education allocation of 30 percent. Again, obtaining approval from
the MoF for such a large increase of funds for education shows that MoE is a
very strong political player. Nevertheless, education spending at under 2 per-
cent of GDP is extremely low and should be increased.13
Regarding the consolidation process, MoE conducted a sort of school mapping exer-
cise, and introduced some criteria for network optimization, such as proximity to a large
school (especially in the cities), unsustainable small schools with possibility to transportstudents to a larger school (especially availability of roads in the mountains and country-
side), small initial schools (which were changed into affi liated schools subordinated to a
larger full secondary institution). The target of 1,800 schools was established on the basis
of this analysis. The Ministry also bought a number of buses to help transport children
to consolidated schools.
Those two steps made the introduction of the voucher system much easier, since
they had reduced the number of schools with insuffi cient funding levels. It is very im-
portant to stress here that the voucher system is not seen as a tool to identify weak
schools and to close them, rather the closures of small schools is a tool to introduce
transparentfi
nancing mechanism of vouchers.To support the newly autonomous schools with their new functions, MoE created a
system of Education Resource Centers (ERC), whose function is to provide schools with
legal and pedagogical support, with accounting services, and with management sup-
port for school directors. However, the Centers have no managerial and control respon-
sibilities over the schools, whose full autonomy they are obliged to respect. ERC also
collect enrollment and other statistical information from the schools and perform legal
inspection of school activities. The design of ERC responsibilities was prepared by Ilia
Chavchavadze Project , while USAID Georgia Educational Decentralization and Accredita-
tion (GEDA) project assisted in their implementation14 (through logistic support, initial
and on the job training, provision of manuals and training materials, as well as supportin rehabilitation of the premises and equipping the Centers).
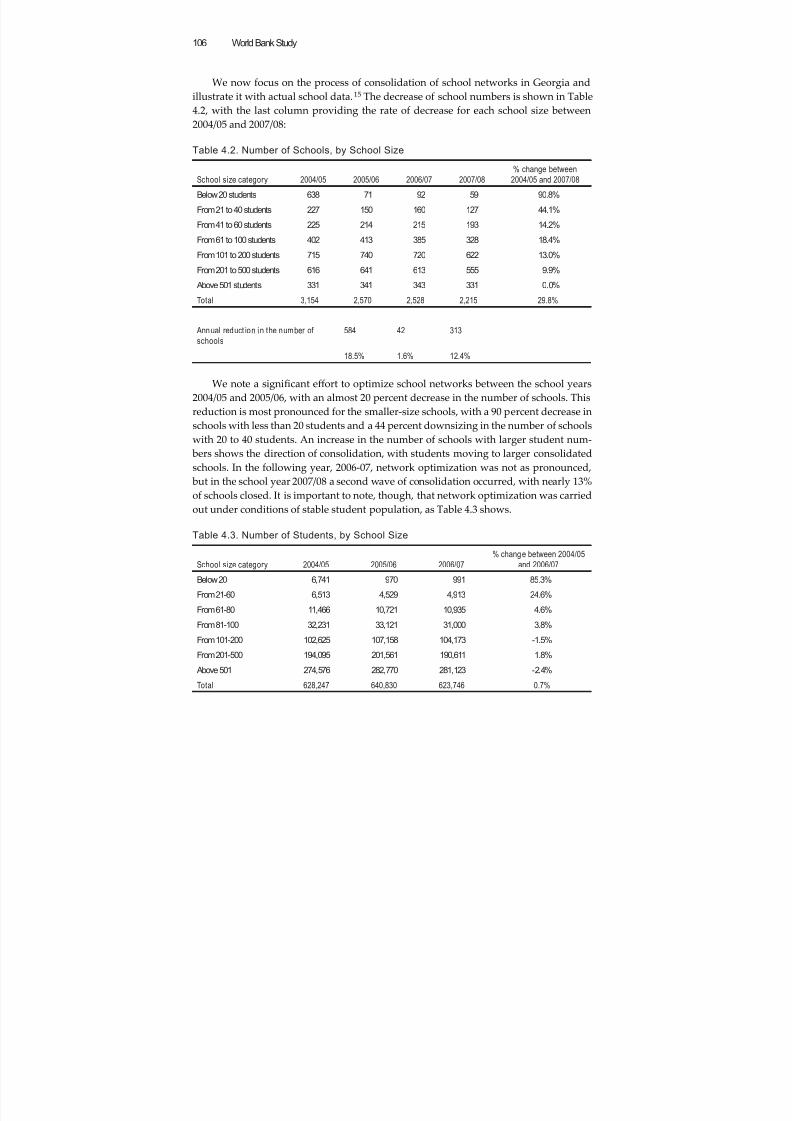
8/6/2019 Reforming Education Finance in Transition Countries
http://slidepdf.com/reader/full/reforming-education-finance-in-transition-countries 130/335
World Bank Study106
We now focus on the process of consolidation of school networks in Georgia and
illustrate it with actual school data.15 The decrease of school numbers is shown in Table
4.2, with the last column providing the rate of decrease for each school size between
2004/05 and 2007/08:
Table 4.2. Number of Schools, by School Size
School size category 2004/05 2005/06 2006/07 2007/08
% change between
2004/05 and 2007/08
Below 20 students 638 71 92 59 90.8%
From 21 to 40 students 227 150 160 127 44.1%
From 41 to 60 students 225 214 215 193 14.2%
From 61 to 100 students 402 413 385 328 18.4%
From 101 to 200 students 715 740 720 622 13.0%
From 201 to 500 students 616 641 613 555 9.9% Above 501 students 331 341 343 331 0.0%
Total 3,154 2,570 2,528 2,215 29.8%
Annual reduct ion in the number of
schools
584 42 313
18.5% 1.6% 12.4%
We note a significant eff ort to optimize school networks between the school years
2004/05 and 2005/06, with an almost 20 percent decrease in the number of schools. This
reduction is most pronounced for the smaller-size schools, with a 90 percent decrease inschools with less than 20 students and a 44 percent downsizing in the number of schools
with 20 to 40 students. An increase in the number of schools with larger student num-
bers shows the direction of consolidation, with students moving to larger consolidated
schools. In the following year, 2006-07, network optimization was not as pronounced,
but in the school year 2007/08 a second wave of consolidation occurred, with nearly 13%
of schools closed. It is important to note, though, that network optimization was carried
out under conditions of stable student population, as Table 4.3 shows.
Table 4.3. Number of Students, by School Size
School size category 2004/05 2005/06 2006/07
% change between 2004/05
and 2006/07
Below 20 6,741 970 991 85.3%
From 21-60 6,513 4,529 4,913 24.6%
From 61-80 11,466 10,721 10,935 4.6%
From 81-100 32,231 33,121 31,000 3.8%
From 101-200 102,625 107,158 104,173 -1.5%
From 201-500 194,095 201,561 190,611 1.8%
Above 501 274,576 282,770 281,123 -2.4%
Total 628,247 640,830 623,746 0.7%
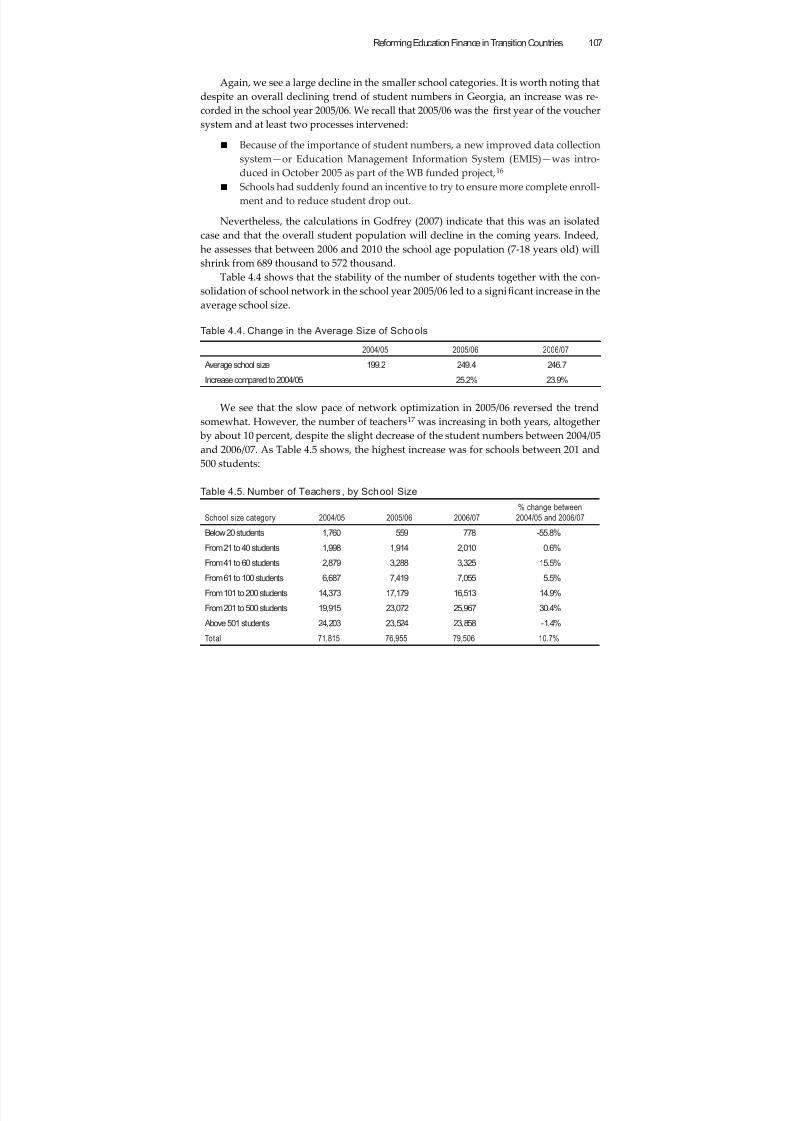
8/6/2019 Reforming Education Finance in Transition Countries
http://slidepdf.com/reader/full/reforming-education-finance-in-transition-countries 131/335
Reforming Education Finance in Transition Countries 107
Again, we see a large decline in the smaller school categories. It is worth noting that
despite an overall declining trend of student numbers in Georgia, an increase was re-
corded in the school year 2005/06. We recall that 2005/06 was the first year of the voucher
system and at least two processes intervened:
■ Because of the importance of student numbers, a new improved data collection
system—or Education Management Information System (EMIS)—was intro-
duced in October 2005 as part of the WB funded project,16
■ Schools had suddenly found an incentive to try to ensure more complete enroll-
ment and to reduce student drop out.
Nevertheless, the calculations in Godfrey (2007) indicate that this was an isolated
case and that the overall student population will decline in the coming years. Indeed,
he assesses that between 2006 and 2010 the school age population (7-18 years old) will
shrink from 689 thousand to 572 thousand.
Table 4.4 shows that the stability of the number of students together with the con-solidation of school network in the school year 2005/06 led to a significant increase in the
average school size.
Table 4.4. Change in the Average Size of Schools
2004/05 2005/06 2006/07
Average school size 199.2 249.4 246.7
Increase compared to 2004/05 25.2% 23.9%
We see that the slow pace of network optimization in 2005/06 reversed the trendsomewhat. However, the number of teachers17 was increasing in both years, altogether
by about 10 percent, despite the slight decrease of the student numbers between 2004/05
and 2006/07. As Table 4.5 shows, the highest increase was for schools between 201 and
500 students:
Table 4.5. Number of Teachers , by School Size
School size category 2004/05 2005/06 2006/07
% change between
2004/05 and 2006/07
Below 20 students 1,760 559 778 -55.8%
From 21 to 40 students 1,998 1,914 2,010 0.6%
From 41 to 60 students 2,879 3,288 3,325 15.5%
From 61 to 100 students 6,687 7,419 7,055 5.5%
From 101 to 200 students 14,373 17,179 16,513 14.9%
From 201 to 500 students 19,915 23,072 25,967 30.4%
Above 501 students 24,203 23,524 23,858 -1.4%
Total 71,815 76,955 79,506 10.7%
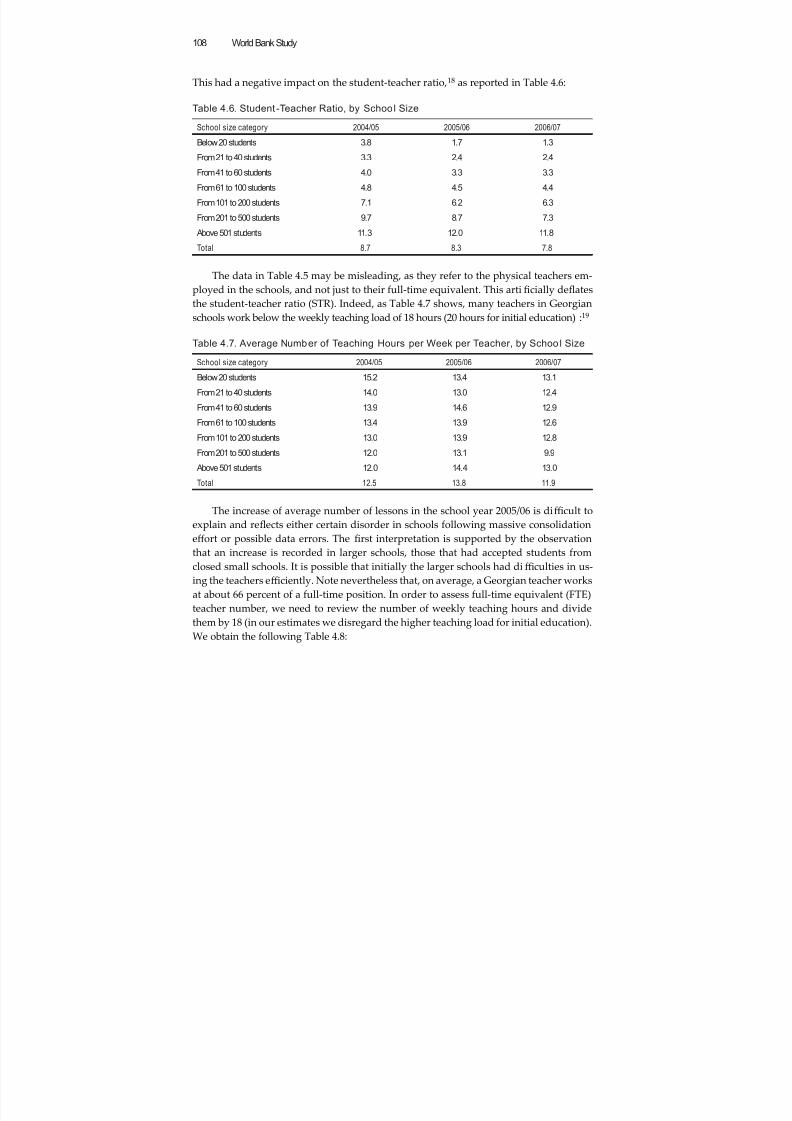
8/6/2019 Reforming Education Finance in Transition Countries
http://slidepdf.com/reader/full/reforming-education-finance-in-transition-countries 132/335
World Bank Study108
This had a negative impact on the student-teacher ratio,18 as reported in Table 4.6:
Table 4.6. Student-Teacher Ratio, by School Size
School size category 2004/05 2005/06 2006/07
Below 20 students 3.8 1.7 1.3
From 21 to 40 students 3.3 2.4 2.4
From 41 to 60 students 4.0 3.3 3.3
From 61 to 100 students 4.8 4.5 4.4
From 101 to 200 students 7.1 6.2 6.3
From 201 to 500 students 9.7 8.7 7.3
Above 501 students 11.3 12.0 11.8
Total 8.7 8.3 7.8
The data in Table 4.5 may be misleading, as they refer to the physical teachers em-ployed in the schools, and not just to their full-time equivalent. This artificially deflates
the student-teacher ratio (STR). Indeed, as Table 4.7 shows, many teachers in Georgian
schools work below the weekly teaching load of 18 hours (20 hours for initial education) :19
Table 4.7. Average Number of Teaching Hours per Week per Teacher, by Schoo l Size
School size category 2004/05 2005/06 2006/07
Below 20 students 15.2 13.4 13.1
From 21 to 40 students 14.0 13.0 12.4
From 41 to 60 students 13.9 14.6 12.9From 61 to 100 students 13.4 13.9 12.6
From 101 to 200 students 13.0 13.9 12.8
From 201 to 500 students 12.0 13.1 9.9
Above 501 students 12.0 14.4 13.0
Total 12.5 13.8 11.9
The increase of average number of lessons in the school year 2005/06 is diffi cult to
explain and reflects either certain disorder in schools following massive consolidation
eff ort or possible data errors. The first interpretation is supported by the observation
that an increase is recorded in larger schools, those that had accepted students from
closed small schools. It is possible that initially the larger schools had diffi culties in us-
ing the teachers effi ciently. Note nevertheless that, on average, a Georgian teacher works
at about 66 percent of a full-time position. In order to assess full-time equivalent (FTE)
teacher number, we need to review the number of weekly teaching hours and divide
them by 18 (in our estimates we disregard the higher teaching load for initial education).
We obtain the following Table 4.8:
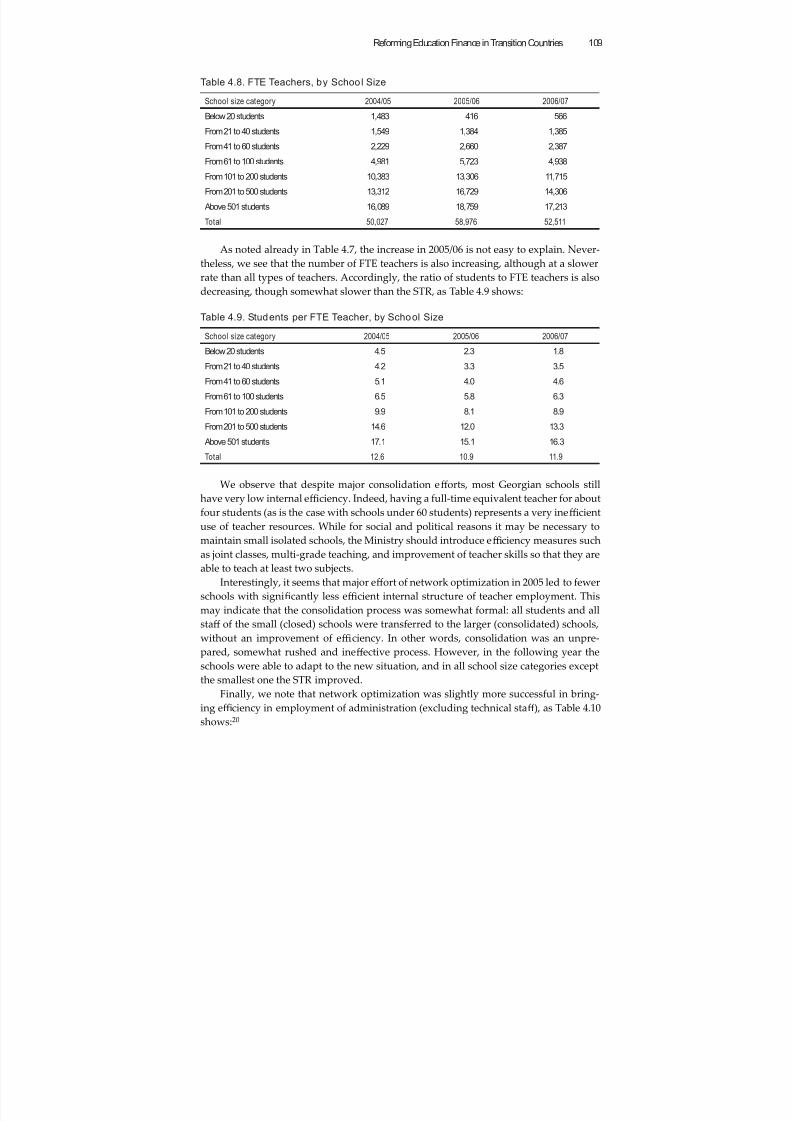
8/6/2019 Reforming Education Finance in Transition Countries
http://slidepdf.com/reader/full/reforming-education-finance-in-transition-countries 133/335
Reforming Education Finance in Transition Countries 109
Table 4.8. FTE Teachers, by School Size
School size category 2004/05 2005/06 2006/07
Below 20 students 1,483 416 566
From 21 to 40 students 1,549 1,384 1,385
From 41 to 60 students 2,229 2,660 2,387
From 61 to 100 students 4,981 5,723 4,938
From 101 to 200 students 10,383 13,306 11,715
From 201 to 500 students 13,312 16,729 14,306
Above 501 students 16,089 18,759 17,213
Total 50,027 58,976 52,511
As noted already in Table 4.7, the increase in 2005/06 is not easy to explain. Never-
theless, we see that the number of FTE teachers is also increasing, although at a slower
rate than all types of teachers. Accordingly, the ratio of students to FTE teachers is alsodecreasing, though somewhat slower than the STR, as Table 4.9 shows:
Table 4.9. Students per FTE Teacher, by School Size
School size category 2004/05 2005/06 2006/07
Below 20 students 4.5 2.3 1.8
From 21 to 40 students 4.2 3.3 3.5
From 41 to 60 students 5.1 4.0 4.6
From 61 to 100 students 6.5 5.8 6.3
From 101 to 200 students 9.9 8.1 8.9
From 201 to 500 students 14.6 12.0 13.3
Above 501 students 17.1 15.1 16.3
Total 12.6 10.9 11.9
We observe that despite major consolidation eff orts, most Georgian schools still
have very low internal effi ciency. Indeed, having a full-time equivalent teacher for about
four students (as is the case with schools under 60 students) represents a very ineffi cient
use of teacher resources. While for social and political reasons it may be necessary to
maintain small isolated schools, the Ministry should introduce effi ciency measures such
as joint classes, multi-grade teaching, and improvement of teacher skills so that they are
able to teach at least two subjects.
Interestingly, it seems that major eff ort of network optimization in 2005 led to fewer
schools with significantly less effi cient internal structure of teacher employment. This
may indicate that the consolidation process was somewhat formal: all students and all
staff of the small (closed) schools were transferred to the larger (consolidated) schools,
without an improvement of effi ciency. In other words, consolidation was an unpre-
pared, somewhat rushed and ineff ective process. However, in the following year the
schools were able to adapt to the new situation, and in all school size categories except
the smallest one the STR improved.Finally, we note that network optimization was slightly more successful in bring-
ing effi ciency in employment of administration (excluding technical staff ), as Table 4.10
shows:20
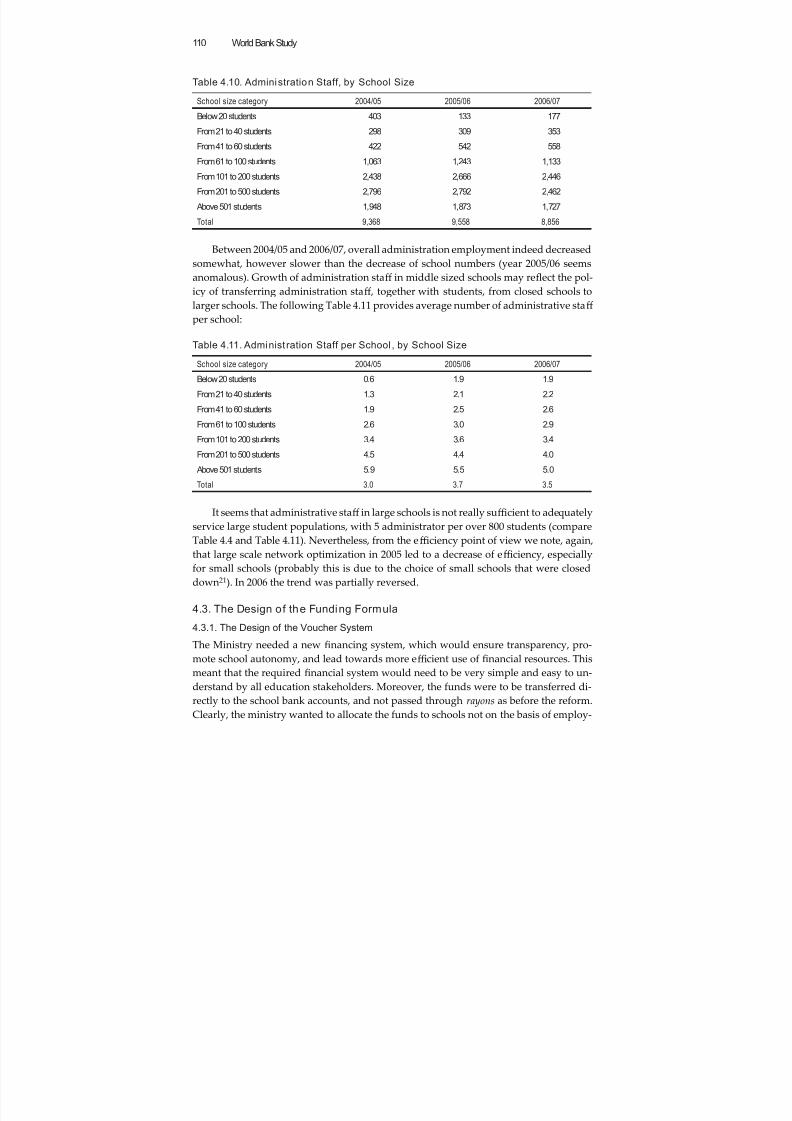
8/6/2019 Reforming Education Finance in Transition Countries
http://slidepdf.com/reader/full/reforming-education-finance-in-transition-countries 134/335
World Bank Study110
Table 4.10. Administration Staff, by School Size
School size category 2004/05 2005/06 2006/07
Below 20 students 403 133 177
From 21 to 40 students 298 309 353
From 41 to 60 students 422 542 558
From 61 to 100 students 1,063 1,243 1,133
From 101 to 200 students 2,438 2,666 2,446
From 201 to 500 students 2,796 2,792 2,462
Above 501 students 1,948 1,873 1,727
Total 9,368 9,558 8,856
Between 2004/05 and 2006/07, overall administration employment indeed decreased
somewhat, however slower than the decrease of school numbers (year 2005/06 seems
anomalous). Growth of administration staff in middle sized schools may reflect the pol-icy of transferring administration staff , together with students, from closed schools to
larger schools. The following Table 4.11 provides average number of administrative staff
per school:
Table 4.11. Administ ration Staff per School , by School Size
School size category 2004/05 2005/06 2006/07
Below 20 students 0.6 1.9 1.9
From 21 to 40 students 1.3 2.1 2.2
From 41 to 60 students 1.9 2.5 2.6From 61 to 100 students 2.6 3.0 2.9
From 101 to 200 students 3.4 3.6 3.4
From 201 to 500 students 4.5 4.4 4.0
Above 501 students 5.9 5.5 5.0
Total 3.0 3.7 3.5
It seems that administrative staff in large schools is not really suffi cient to adequately
service large student populations, with 5 administrator per over 800 students (compare
Table 4.4 and Table 4.11). Nevertheless, from the effi ciency point of view we note, again,
that large scale network optimization in 2005 led to a decrease of effi ciency, especially
for small schools (probably this is due to the choice of small schools that were closed
down21). In 2006 the trend was partially reversed.
4.3. The Design of the Funding Formula
4.3.1. The Design of the Voucher System
The Ministry needed a new financing system, which would ensure transparency, pro-
mote school autonomy, and lead towards more effi cient use of financial resources. This
meant that the required financial system would need to be very simple and easy to un-
derstand by all education stakeholders. Moreover, the funds were to be transferred di-rectly to the school bank accounts, and not passed through rayons as before the reform.
Clearly, the ministry wanted to allocate the funds to schools not on the basis of employ-
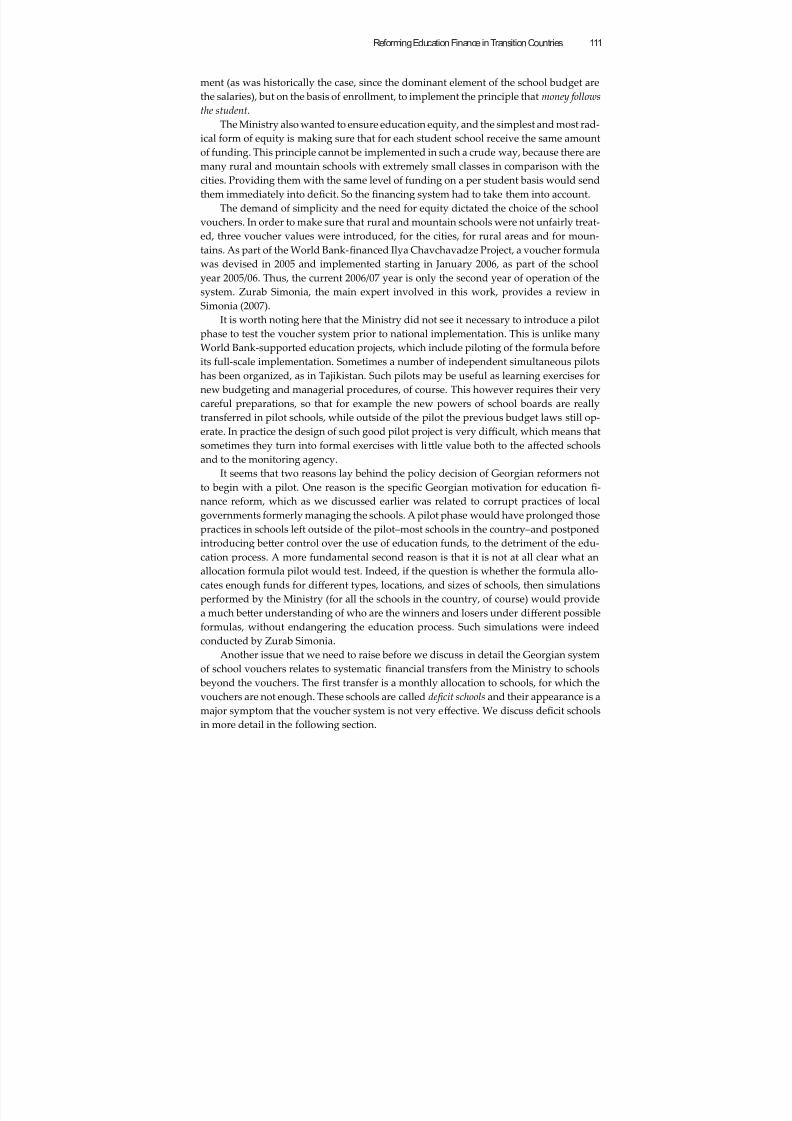
8/6/2019 Reforming Education Finance in Transition Countries
http://slidepdf.com/reader/full/reforming-education-finance-in-transition-countries 135/335
Reforming Education Finance in Transition Countries 111
ment (as was historically the case, since the dominant element of the school budget are
the salaries), but on the basis of enrollment, to implement the principle that money follows
the student.
The Ministry also wanted to ensure education equity, and the simplest and most rad-
ical form of equity is making sure that for each student school receive the same amountof funding. This principle cannot be implemented in such a crude way, because there are
many rural and mountain schools with extremely small classes in comparison with the
cities. Providing them with the same level of funding on a per student basis would send
them immediately into deficit. So the financing system had to take them into account.
The demand of simplicity and the need for equity dictated the choice of the school
vouchers. In order to make sure that rural and mountain schools were not unfairly treat-
ed, three voucher values were introduced, for the cities, for rural areas and for moun-
tains. As part of the World Bank-financed Ilya Chavchavadze Project, a voucher formula
was devised in 2005 and implemented starting in January 2006, as part of the school
year 2005/06. Thus, the current 2006/07 year is only the second year of operation of the
system. Zurab Simonia, the main expert involved in this work, provides a review in
Simonia (2007).
It is worth noting here that the Ministry did not see it necessary to introduce a pilot
phase to test the voucher system prior to national implementation. This is unlike many
World Bank-supported education projects, which include piloting of the formula before
its full-scale implementation. Sometimes a number of independent simultaneous pilots
has been organized, as in Tajikistan. Such pilots may be useful as learning exercises for
new budgeting and managerial procedures, of course. This however requires their very
careful preparations, so that for example the new powers of school boards are really
transferred in pilot schools, while outside of the pilot the previous budget laws still op-
erate. In practice the design of such good pilot project is very diffi cult, which means that
sometimes they turn into formal exercises with lile value both to the aff ected schools
and to the monitoring agency.
It seems that two reasons lay behind the policy decision of Georgian reformers not
to begin with a pilot. One reason is the specific Georgian motivation for education fi-
nance reform, which as we discussed earlier was related to corrupt practices of local
governments formerly managing the schools. A pilot phase would have prolonged those
practices in schools left outside of the pilot–most schools in the country–and postponed
introducing be
er control over the use of education funds, to the detriment of the edu-cation process. A more fundamental second reason is that it is not at all clear what an
allocation formula pilot would test. Indeed, if the question is whether the formula allo-
cates enough funds for diff erent types, locations, and sizes of schools, then simulations
performed by the Ministry (for all the schools in the country, of course) would provide
a much beer understanding of who are the winners and losers under diff erent possible
formulas, without endangering the education process. Such simulations were indeed
conducted by Zurab Simonia.
Another issue that we need to raise before we discuss in detail the Georgian system
of school vouchers relates to systematic financial transfers from the Ministry to schools
beyond the vouchers. The first transfer is a monthly allocation to schools, for which thevouchers are not enough. These schools are called de ficit schools and their appearance is a
major symptom that the voucher system is not very eff ective. We discuss deficit schools
in more detail in the following section.
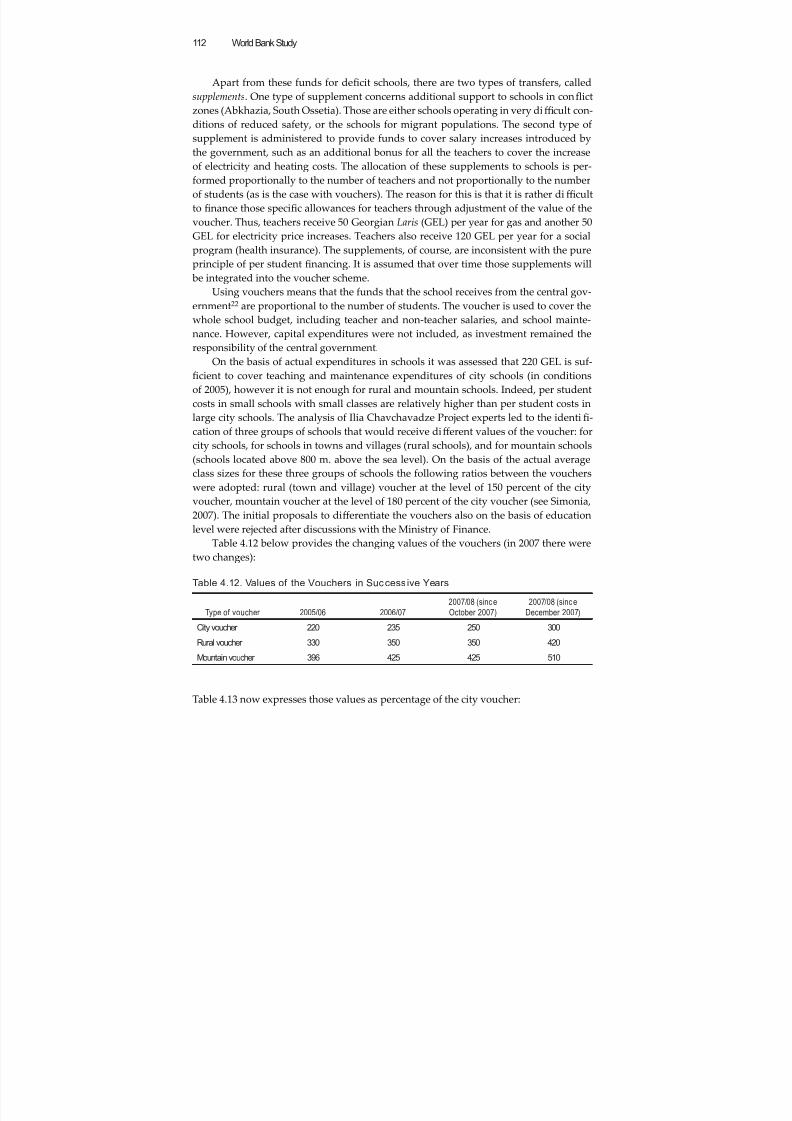
8/6/2019 Reforming Education Finance in Transition Countries
http://slidepdf.com/reader/full/reforming-education-finance-in-transition-countries 136/335
World Bank Study112
Apart from these funds for deficit schools, there are two types of transfers, called
supplements. One type of supplement concerns additional support to schools in conflict
zones (Abkhazia, South Ossetia). Those are either schools operating in very diffi cult con-
ditions of reduced safety, or the schools for migrant populations. The second type of
supplement is administered to provide funds to cover salary increases introduced bythe government, such as an additional bonus for all the teachers to cover the increase
of electricity and heating costs. The allocation of these supplements to schools is per-
formed proportionally to the number of teachers and not proportionally to the number
of students (as is the case with vouchers). The reason for this is that it is rather diffi cult
to finance those specific allowances for teachers through adjustment of the value of the
voucher. Thus, teachers receive 50 Georgian Laris (GEL) per year for gas and another 50
GEL for electricity price increases. Teachers also receive 120 GEL per year for a social
program (health insurance). The supplements, of course, are inconsistent with the pure
principle of per student financing. It is assumed that over time those supplements will
be integrated into the voucher scheme.
Using vouchers means that the funds that the school receives from the central gov-
ernment22 are proportional to the number of students. The voucher is used to cover the
whole school budget, including teacher and non-teacher salaries, and school mainte-
nance. However, capital expenditures were not included, as investment remained the
responsibility of the central government.
On the basis of actual expenditures in schools it was assessed that 220 GEL is suf-
ficient to cover teaching and maintenance expenditures of city schools (in conditions
of 2005), however it is not enough for rural and mountain schools. Indeed, per student
costs in small schools with small classes are relatively higher than per student costs in
large city schools. The analysis of Ilia Chavchavadze Project experts led to the identifi-
cation of three groups of schools that would receive diff erent values of the voucher: for
city schools, for schools in towns and villages (rural schools), and for mountain schools
(schools located above 800 m. above the sea level). On the basis of the actual average
class sizes for these three groups of schools the following ratios between the vouchers
were adopted: rural (town and village) voucher at the level of 150 percent of the city
voucher, mountain voucher at the level of 180 percent of the city voucher (see Simonia,
2007). The initial proposals to diff erentiate the vouchers also on the basis of education
level were rejected after discussions with the Ministry of Finance.
Table 4.12 below provides the changing values of the vouchers (in 2007 there weretwo changes):
Table 4.12. Values of the Vouchers in Successive Years
Type of voucher 2005/06 2006/07
2007/08 (sinc e
October 2007)
2007/08 (sinc e
December 2007)
City voucher 220 235 250 300
Rural voucher 330 350 350 420
Mountain voucher 396 425 425 510
Table 4.13 now expresses those values as percentage of the city voucher:
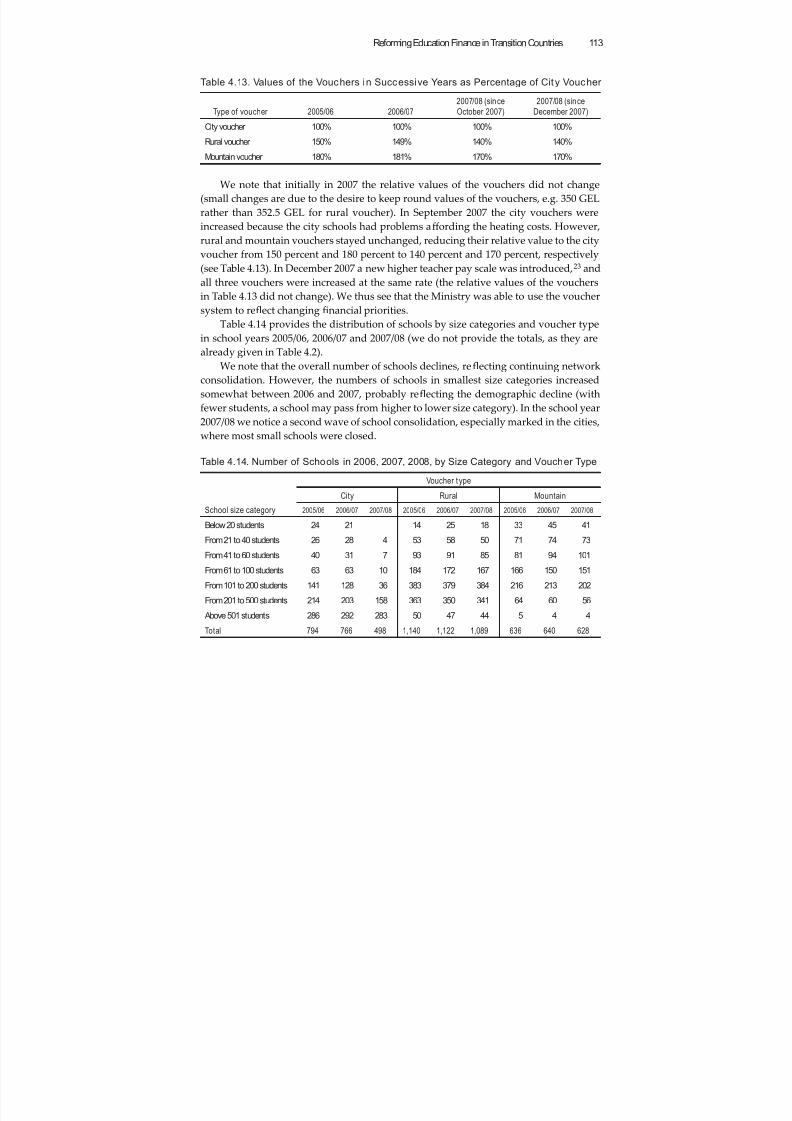
8/6/2019 Reforming Education Finance in Transition Countries
http://slidepdf.com/reader/full/reforming-education-finance-in-transition-countries 137/335
Reforming Education Finance in Transition Countries 113
Table 4.13. Values of the Vouchers in Successive Years as Percentage of City Voucher
Type of voucher 2005/06 2006/07
2007/08 (since
October 2007)
2007/08 (since
December 2007)
City voucher 100% 100% 100% 100%
Rural voucher 150% 149% 140% 140%
Mountain voucher 180% 181% 170% 170%
We note that initially in 2007 the relative values of the vouchers did not change
(small changes are due to the desire to keep round values of the vouchers, e.g. 350 GEL
rather than 352.5 GEL for rural voucher). In September 2007 the city vouchers were
increased because the city schools had problems aff ording the heating costs. However,
rural and mountain vouchers stayed unchanged, reducing their relative value to the city
voucher from 150 percent and 180 percent to 140 percent and 170 percent, respectively
(see Table 4.13). In December 2007 a new higher teacher pay scale was introduced,
23
andall three vouchers were increased at the same rate (the relative values of the vouchers
in Table 4.13 did not change). We thus see that the Ministry was able to use the voucher
system to reflect changing financial priorities.
Table 4.14 provides the distribution of schools by size categories and voucher type
in school years 2005/06, 2006/07 and 2007/08 (we do not provide the totals, as they are
already given in Table 4.2).
We note that the overall number of schools declines, reflecting continuing network
consolidation. However, the numbers of schools in smallest size categories increased
somewhat between 2006 and 2007, probably reflecting the demographic decline (with
fewer students, a school may pass from higher to lower size category). In the school year2007/08 we notice a second wave of school consolidation, especially marked in the cities,
where most small schools were closed.
Table 4.14. Number of Schools in 2006, 2007, 2008, by Size Category and Voucher Type
School size category
Voucher t ype
City Rural Mountain
2005/06 2006/07 2007/08 2005/06 2006/07 2007/08 2005/06 2006/07 2007/08
Below 20 students 24 21 14 25 18 33 45 41
From 21 to 40 students 26 28 4 53 58 50 71 74 73
From 41 to 60 students 40 31 7 93 91 85 81 94 101
From 61 to 100 students 63 63 10 184 172 167 166 150 151
From 101 to 200 students 141 128 36 383 379 384 216 213 202
From 201 to 500 students 214 203 158 363 350 341 64 60 56
Above 501 students 286 292 283 50 47 44 5 4 4
Total 794 766 498 1,140 1,122 1,089 636 640 628
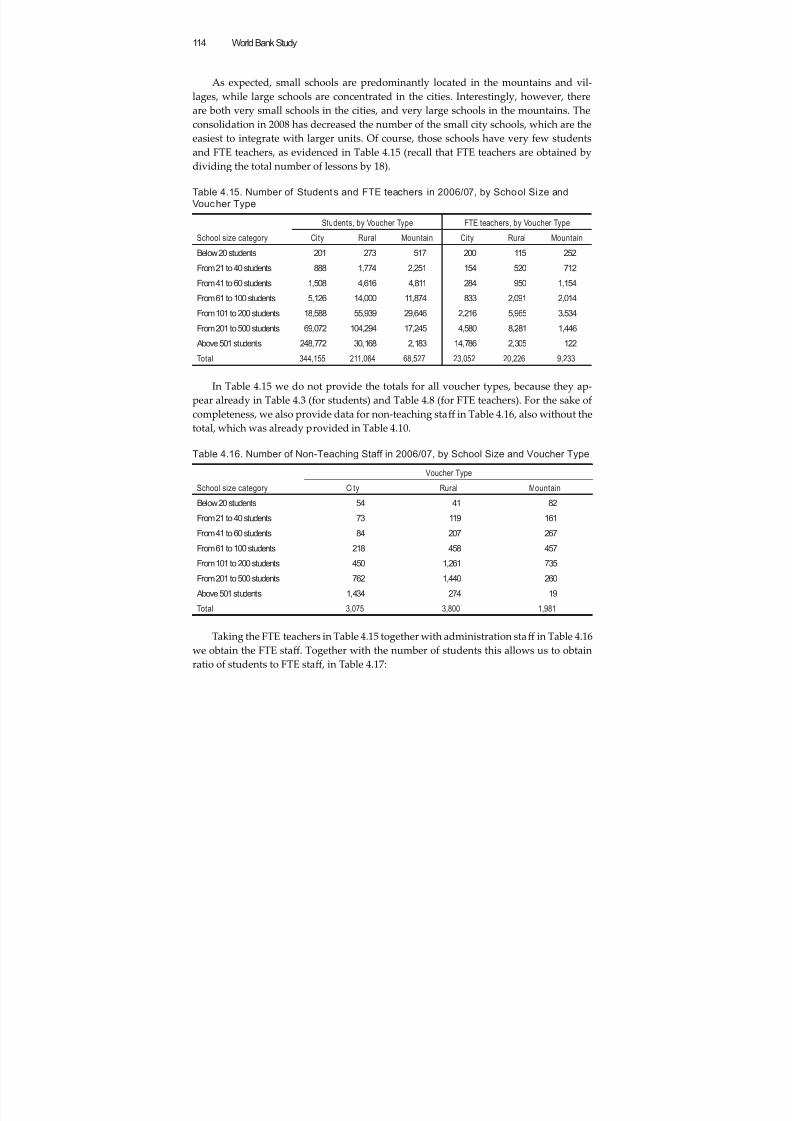
8/6/2019 Reforming Education Finance in Transition Countries
http://slidepdf.com/reader/full/reforming-education-finance-in-transition-countries 138/335
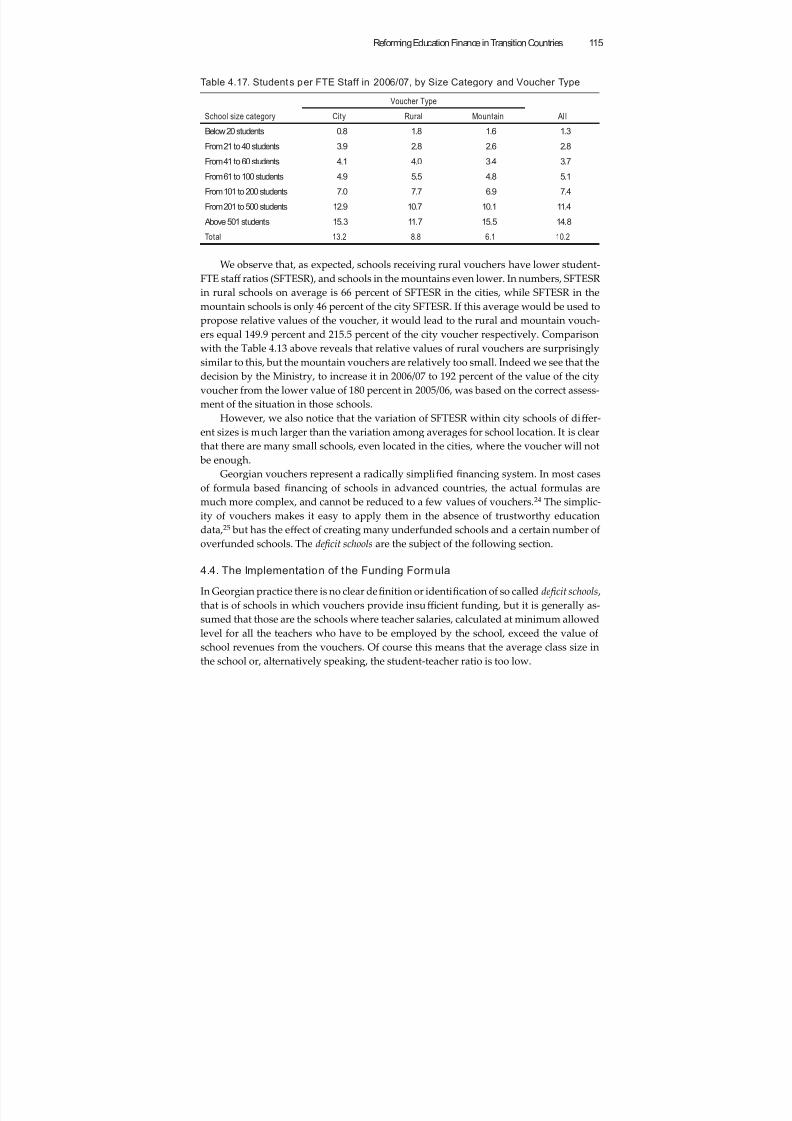
8/6/2019 Reforming Education Finance in Transition Countries
http://slidepdf.com/reader/full/reforming-education-finance-in-transition-countries 139/335
Reforming Education Finance in Transition Countries 115
Table 4.17. Students per FTE Staff in 2006/07, by Size Category and Voucher Type
School size category
Voucher Type
Al lCity Rural Mountain
Below 20 students 0.8 1.8 1.6 1.3
From 21 to 40 students 3.9 2.8 2.6 2.8
From 41 to 60 students 4.1 4.0 3.4 3.7
From 61 to 100 students 4.9 5.5 4.8 5.1
From 101 to 200 students 7.0 7.7 6.9 7.4
From 201 to 500 students 12.9 10.7 10.1 11.4
Above 501 students 15.3 11.7 15.5 14.8
Total 13.2 8.8 6.1 10.2
We observe that, as expected, schools receiving rural vouchers have lower student-
FTE staff ratios (SFTESR), and schools in the mountains even lower. In numbers, SFTESR
in rural schools on average is 66 percent of SFTESR in the cities, while SFTESR in the
mountain schools is only 46 percent of the city SFTESR. If this average would be used to
propose relative values of the voucher, it would lead to the rural and mountain vouch-
ers equal 149.9 percent and 215.5 percent of the city voucher respectively. Comparison
with the Table 4.13 above reveals that relative values of rural vouchers are surprisingly
similar to this, but the mountain vouchers are relatively too small. Indeed we see that the
decision by the Ministry, to increase it in 2006/07 to 192 percent of the value of the city
voucher from the lower value of 180 percent in 2005/06, was based on the correct assess-
ment of the situation in those schools.
However, we also notice that the variation of SFTESR within city schools of diff er-
ent sizes is much larger than the variation among averages for school location. It is clear
that there are many small schools, even located in the cities, where the voucher will not
be enough.
Georgian vouchers represent a radically simplified financing system. In most cases
of formula based financing of schools in advanced countries, the actual formulas are
much more complex, and cannot be reduced to a few values of vouchers.24 The simplic-
ity of vouchers makes it easy to apply them in the absence of trustworthy education
data,25 but has the eff ect of creating many underfunded schools and a certain number of
overfunded schools. The de ficit schools are the subject of the following section.
4.4. The Implementation of the Funding Formula
In Georgian practice there is no clear definition or identification of so called de ficit schools ,
that is of schools in which vouchers provide insuffi cient funding, but it is generally as-
sumed that those are the schools where teacher salaries, calculated at minimum allowed
level for all the teachers who have to be employed by the school, exceed the value of
school revenues from the vouchers. Of course this means that the average class size in
the school or, alternatively speaking, the student-teacher ratio is too low.
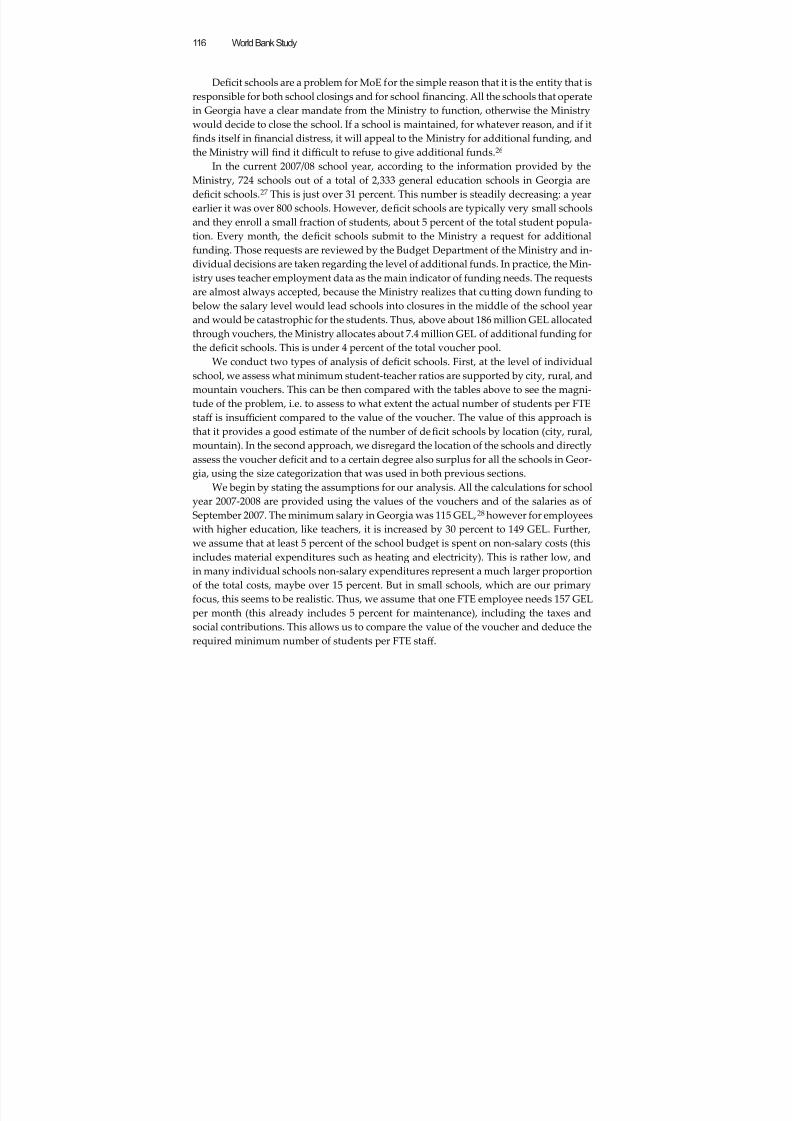
8/6/2019 Reforming Education Finance in Transition Countries
http://slidepdf.com/reader/full/reforming-education-finance-in-transition-countries 140/335
World Bank Study116
Deficit schools are a problem for MoE for the simple reason that it is the entity that is
responsible for both school closings and for school financing. All the schools that operate
in Georgia have a clear mandate from the Ministry to function, otherwise the Ministry
would decide to close the school. If a school is maintained, for whatever reason, and if it
finds itself in financial distress, it will appeal to the Ministry for additional funding, andthe Ministry will find it diffi cult to refuse to give additional funds.26
In the current 2007/08 school year, according to the information provided by the
Ministry, 724 schools out of a total of 2,333 general education schools in Georgia are
deficit schools.27 This is just over 31 percent. This number is steadily decreasing: a year
earlier it was over 800 schools. However, deficit schools are typically very small schools
and they enroll a small fraction of students, about 5 percent of the total student popula-
tion. Every month, the deficit schools submit to the Ministry a request for additional
funding. Those requests are reviewed by the Budget Department of the Ministry and in-
dividual decisions are taken regarding the level of additional funds. In practice, the Min-
istry uses teacher employment data as the main indicator of funding needs. The requests
are almost always accepted, because the Ministry realizes that cuing down funding to
below the salary level would lead schools into closures in the middle of the school year
and would be catastrophic for the students. Thus, above about 186 million GEL allocated
through vouchers, the Ministry allocates about 7.4 million GEL of additional funding for
the deficit schools. This is under 4 percent of the total voucher pool.
We conduct two types of analysis of deficit schools. First, at the level of individual
school, we assess what minimum student-teacher ratios are supported by city, rural, and
mountain vouchers. This can be then compared with the tables above to see the magni-
tude of the problem, i.e. to assess to what extent the actual number of students per FTE
staff is insuffi cient compared to the value of the voucher. The value of this approach is
that it provides a good estimate of the number of deficit schools by location (city, rural,
mountain). In the second approach, we disregard the location of the schools and directly
assess the voucher deficit and to a certain degree also surplus for all the schools in Geor-
gia, using the size categorization that was used in both previous sections.
We begin by stating the assumptions for our analysis. All the calculations for school
year 2007-2008 are provided using the values of the vouchers and of the salaries as of
September 2007. The minimum salary in Georgia was 115 GEL,28 however for employees
with higher education, like teachers, it is increased by 30 percent to 149 GEL. Further,
we assume that at least 5 percent of the school budget is spent on non-salary costs (thisincludes material expenditures such as heating and electricity). This is rather low, and
in many individual schools non-salary expenditures represent a much larger proportion
of the total costs, maybe over 15 percent. But in small schools, which are our primary
focus, this seems to be realistic. Thus, we assume that one FTE employee needs 157 GEL
per month (this already includes 5 percent for maintenance), including the taxes and
social contributions. This allows us to compare the value of the voucher and deduce the
required minimum number of students per FTE staff .
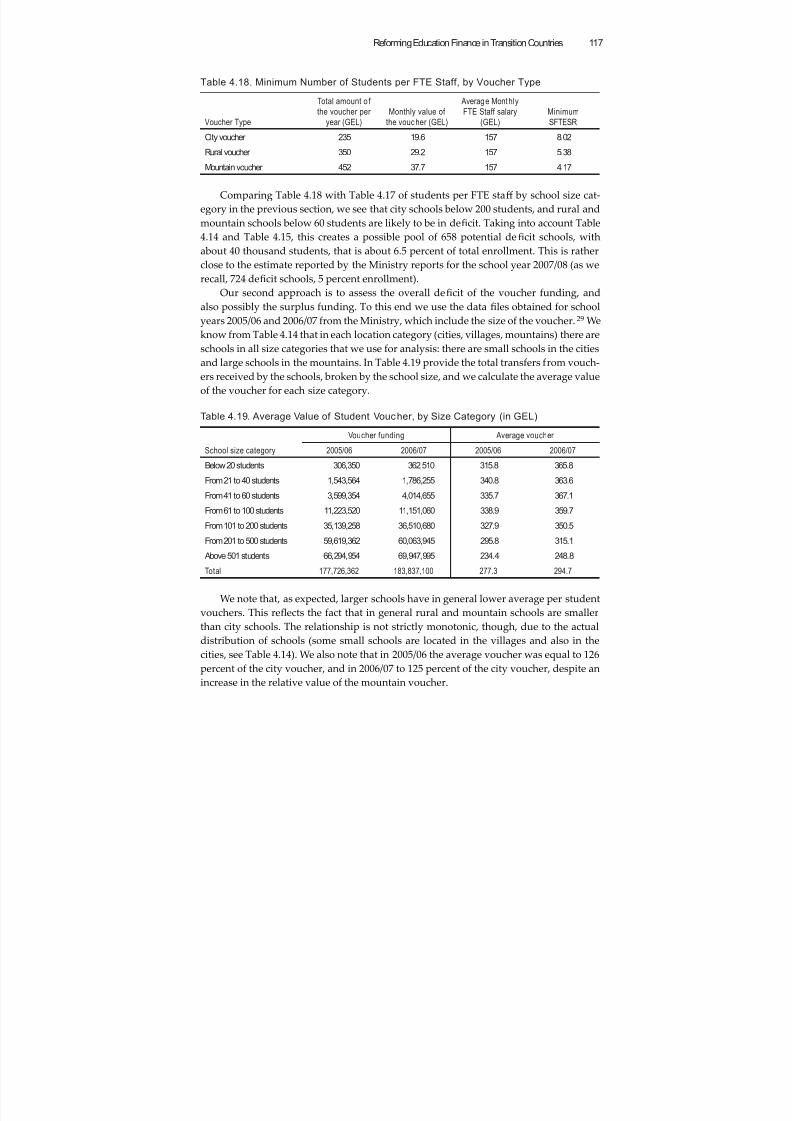
8/6/2019 Reforming Education Finance in Transition Countries
http://slidepdf.com/reader/full/reforming-education-finance-in-transition-countries 141/335
Reforming Education Finance in Transition Countries 117
Table 4.18. Minimum Number of Students per FTE Staff, by Voucher Type
Voucher Type
Total amount o f
the voucher per
year (GEL)
Monthly value of
the vouc her (GEL)
Average Mont hly
FTE Staff salary
(GEL)
Minimum
SFTESR
City voucher 235 19.6 157 8.02
Rural voucher 350 29.2 157 5.38
Mountain voucher 452 37.7 157 4.17
Comparing Table 4.18 with Table 4.17 of students per FTE staff by school size cat-
egory in the previous section, we see that city schools below 200 students, and rural and
mountain schools below 60 students are likely to be in deficit. Taking into account Table
4.14 and Table 4.15, this creates a possible pool of 658 potential deficit schools, with
about 40 thousand students, that is about 6.5 percent of total enrollment. This is rather
close to the estimate reported by the Ministry reports for the school year 2007/08 (as we
recall, 724 deficit schools, 5 percent enrollment).
Our second approach is to assess the overall deficit of the voucher funding, and
also possibly the surplus funding. To this end we use the data files obtained for school
years 2005/06 and 2006/07 from the Ministry, which include the size of the voucher.29 We
know from Table 4.14 that in each location category (cities, villages, mountains) there are
schools in all size categories that we use for analysis: there are small schools in the cities
and large schools in the mountains. In Table 4.19 provide the total transfers from vouch-
ers received by the schools, broken by the school size, and we calculate the average value
of the voucher for each size category.
Table 4.19. Average Value of Student Voucher, by Size Category (in GEL)
School size category
Voucher funding Average voucher
2005/06 2006/07 2005/06 2006/07
Below 20 students 306,350 362,510 315.8 365.8
From 21 to 40 students 1,543,564 1,786,255 340.8 363.6
From 41 to 60 students 3,599,354 4,014,655 335.7 367.1
From 61 to 100 students 11,223,520 11,151,060 338.9 359.7
From 101 to 200 students 35,139,258 36,510,680 327.9 350.5
From 201 to 500 students 59,619,362 60,063,945 295.8 315.1
Above 501 students 66,294,954 69,947,995 234.4 248.8
Total 177,726,362 183,837,100 277.3 294.7
We note that, as expected, larger schools have in general lower average per student
vouchers. This reflects the fact that in general rural and mountain schools are smaller
than city schools. The relationship is not strictly monotonic, though, due to the actual
distribution of schools (some small schools are located in the villages and also in the
cities, see Table 4.14). We also note that in 2005/06 the average voucher was equal to 126
percent of the city voucher, and in 2006/07 to 125 percent of the city voucher, despite an
increase in the relative value of the mountain voucher.
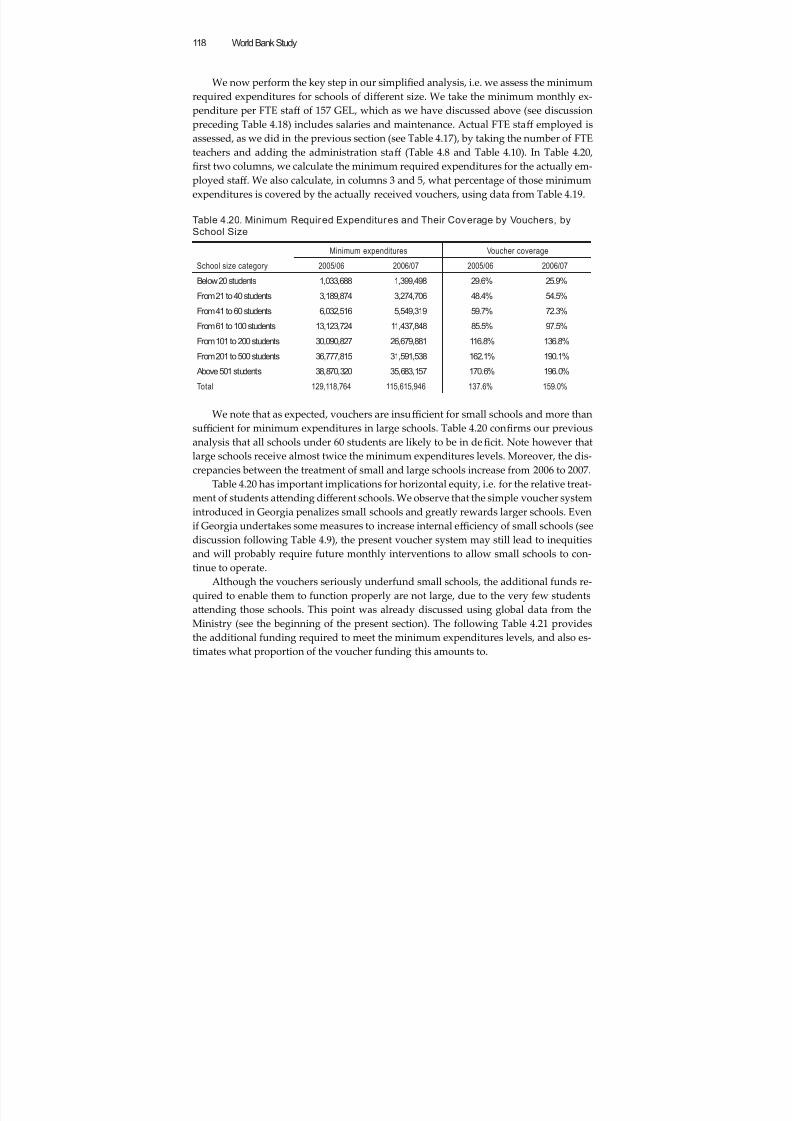
8/6/2019 Reforming Education Finance in Transition Countries
http://slidepdf.com/reader/full/reforming-education-finance-in-transition-countries 142/335
World Bank Study118
We now perform the key step in our simplified analysis, i.e. we assess the minimum
required expenditures for schools of diff erent size. We take the minimum monthly ex-
penditure per FTE staff of 157 GEL, which as we have discussed above (see discussion
preceding Table 4.18) includes salaries and maintenance. Actual FTE staff employed is
assessed, as we did in the previous section (see Table 4.17), by taking the number of FTEteachers and adding the administration staff (Table 4.8 and Table 4.10). In Table 4.20,
first two columns, we calculate the minimum required expenditures for the actually em-
ployed staff . We also calculate, in columns 3 and 5, what percentage of those minimum
expenditures is covered by the actually received vouchers, using data from Table 4.19.
Table 4.20. Minimum Required Expenditures and Their Coverage by Vouchers, by
School Size
School size category
Minimum expenditures Voucher coverage
2005/06 2006/07 2005/06 2006/07
Below 20 students 1,033,688 1,399,498 29.6% 25.9%
From 21 to 40 students 3,189,874 3,274,706 48.4% 54.5%
From 41 to 60 students 6,032,516 5,549,319 59.7% 72.3%
From 61 to 100 students 13,123,724 11,437,848 85.5% 97.5%
From 101 to 200 students 30,090,827 26,679,881 116.8% 136.8%
From 201 to 500 students 36,777,815 31,591,538 162.1% 190.1%
Above 501 students 38,870,320 35,683,157 170.6% 196.0%
Total 129,118,764 115,615,946 137.6% 159.0%
We note that as expected, vouchers are insuffi cient for small schools and more thansuffi cient for minimum expenditures in large schools. Table 4.20 confirms our previous
analysis that all schools under 60 students are likely to be in deficit. Note however that
large schools receive almost twice the minimum expenditures levels. Moreover, the dis-
crepancies between the treatment of small and large schools increase from 2006 to 2007.
Table 4.20 has important implications for horizontal equity, i.e. for the relative treat-
ment of students aending diff erent schools. We observe that the simple voucher system
introduced in Georgia penalizes small schools and greatly rewards larger schools. Even
if Georgia undertakes some measures to increase internal effi ciency of small schools (see
discussion following Table 4.9), the present voucher system may still lead to inequities
and will probably require future monthly interventions to allow small schools to con-
tinue to operate.
Although the vouchers seriously underfund small schools, the additional funds re-
quired to enable them to function properly are not large, due to the very few students
aending those schools. This point was already discussed using global data from the
Ministry (see the beginning of the present section). The following Table 4.21 provides
the additional funding required to meet the minimum expenditures levels, and also es-
timates what proportion of the voucher funding this amounts to.
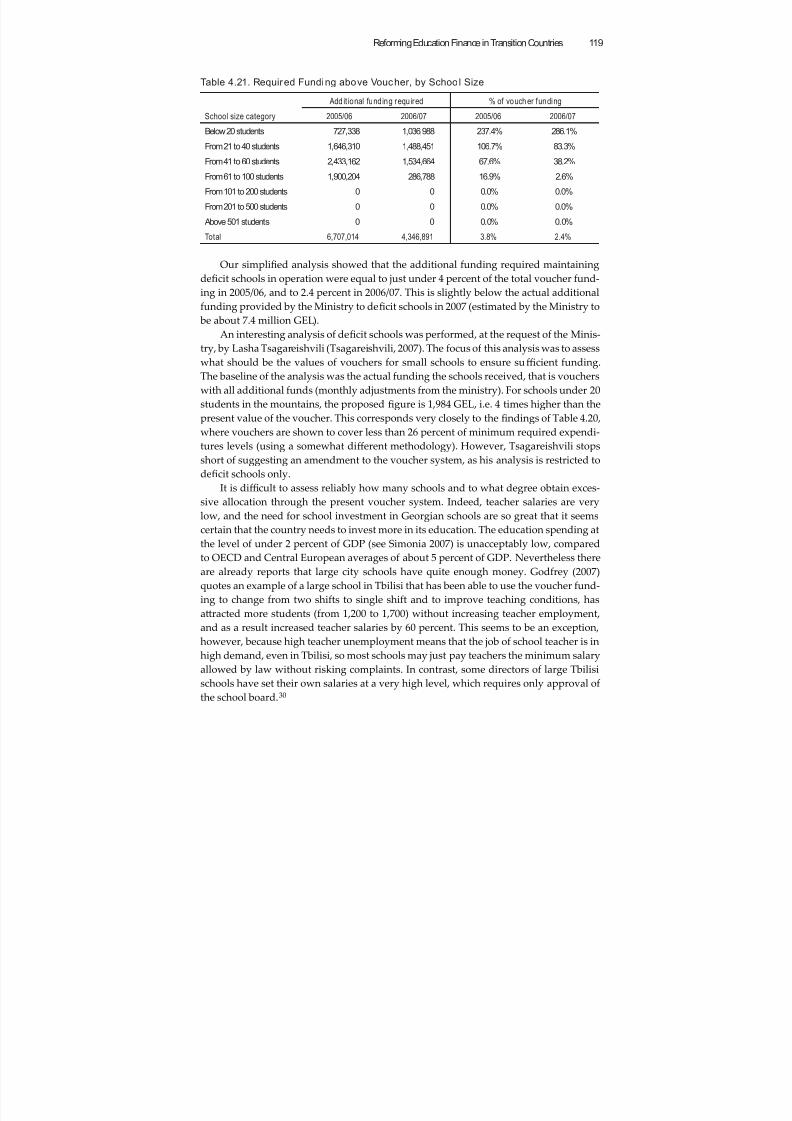
8/6/2019 Reforming Education Finance in Transition Countries
http://slidepdf.com/reader/full/reforming-education-finance-in-transition-countries 143/335
Reforming Education Finance in Transition Countries 119
Table 4.21. Required Funding above Voucher, by School Size
School size category
Add it ional funding required % of voucher funding
2005/06 2006/07 2005/06 2006/07
Below 20 students 727,338 1,036,988 237.4% 286.1%
From 21 to 40 students 1,646,310 1,488,451 106.7% 83.3%
From 41 to 60 students 2,433,162 1,534,664 67.6% 38.2%
From 61 to 100 students 1,900,204 286,788 16.9% 2.6%
From 101 to 200 students 0 0 0.0% 0.0%
From 201 to 500 students 0 0 0.0% 0.0%
Above 501 students 0 0 0.0% 0.0%
Total 6,707,014 4,346,891 3.8% 2.4%
Our simplified analysis showed that the additional funding required maintaining
deficit schools in operation were equal to just under 4 percent of the total voucher fund-
ing in 2005/06, and to 2.4 percent in 2006/07. This is slightly below the actual additional
funding provided by the Ministry to deficit schools in 2007 (estimated by the Ministry to
be about 7.4 million GEL).
An interesting analysis of deficit schools was performed, at the request of the Minis-
try, by Lasha Tsagareishvili (Tsagareishvili, 2007). The focus of this analysis was to assess
what should be the values of vouchers for small schools to ensure suffi cient funding.
The baseline of the analysis was the actual funding the schools received, that is vouchers
with all additional funds (monthly adjustments from the ministry). For schools under 20
students in the mountains, the proposed figure is 1,984 GEL, i.e. 4 times higher than the
present value of the voucher. This corresponds very closely to the findings of Table 4.20,
where vouchers are shown to cover less than 26 percent of minimum required expendi-
tures levels (using a somewhat diff erent methodology). However, Tsagareishvili stops
short of suggesting an amendment to the voucher system, as his analysis is restricted to
deficit schools only.
It is diffi cult to assess reliably how many schools and to what degree obtain exces-
sive allocation through the present voucher system. Indeed, teacher salaries are very
low, and the need for school investment in Georgian schools are so great that it seems
certain that the country needs to invest more in its education. The education spending at
the level of under 2 percent of GDP (see Simonia 2007) is unacceptably low, comparedto OECD and Central European averages of about 5 percent of GDP. Nevertheless there
are already reports that large city schools have quite enough money. Godfrey (2007)
quotes an example of a large school in Tbilisi that has been able to use the voucher fund-
ing to change from two shifts to single shift and to improve teaching conditions, has
aracted more students (from 1,200 to 1,700) without increasing teacher employment,
and as a result increased teacher salaries by 60 percent. This seems to be an exception,
however, because high teacher unemployment means that the job of school teacher is in
high demand, even in Tbilisi, so most schools may just pay teachers the minimum salary
allowed by law without risking complaints. In contrast, some directors of large Tbilisi
schools have set their own salaries at a very high level, which requires only approval ofthe school board.30
8/6/2019 Reforming Education Finance in Transition Countries
http://slidepdf.com/reader/full/reforming-education-finance-in-transition-countries 144/335
World Bank Study120
4.5. Assessment of Outcomes
The education management reforms were introduced in Georgia only two years ago.
There has been lile time to fine tune all the relevant laws and regulations, and to im-
prove managerial capacities at all levels in line with the new allocation of responsibili-ties. The present section briefly addresses some of the implementation issues connected
to the new financing system in regards to the following areas:31
■ Effi ciency,
■ Equity,
■ Transparency/Accountability and auditing of schools,
■ Other issues (Reaction of stakeholders to the new system, School autonomy,
School competition)
4.5.1. Ef ficiency
This section analyzes whether the education system in Georgia improved its allocativeeffi ciency upon the introduction of the voucher system. By allocative effi ciency we mean
the ability of the education finance system to allocate funds so that all schools (in case
of direct allocation to schools) or all local governments (in case the grants are allocated
to municipalities) receive more or less what they need. Here of course the relative (or
minimum) needs of schools have to be carefully assessed. We can use the assessment
of minimum needs on which our Table 4.20 was based. A diff erent methodological ap-
proach based on per class allocation and on Table 4.23, provides an independent, diff er-
ent insight into effi ciency issues.
Table 4.20 seems to imply that Georgian vouchers were a highly non-effi cient ap-
proach to education finance. Small schools appear to be seriously underfunded, whilelarge schools are seriously overfunded. Indeed, schools with less than 40 students re-
ceive about 50% of what they need as minimum, while schools with over 500 students
receive almost twice as much as they need. Of course, the model of minimum needs on
which the calculations are based is rather simple. Still, informal information gathered in
Tbilisi did indicate that some large Tbilisi schools have too many funds. This may be due
to the fact that there are many unemployed teachers seeking work, so there is no need
for schools to significantly raise their salaries, even if they could aff ord to do this. The
salaries of teachers remain depressingly low.
Interestingly, the schools with highest surplus are the large, well known, presti-
gious education institutions, whose students include the elite of the country. They often
operate in shifts and have very large classes, due to huge demand from the parents and
students. It is rather amazing that elite students aend overcrowded schools, often in
afternoon shifts.
A second way to assess effi ciency is to review from the point of view per class alloca-
tion, summarized in Table 4.23 (see below). We assume that the national per class alloca-
tion is an empirical benchmark, representing the funds which the national government
is able and wishing to allocate to schools. We can compare this benchmark to per class
allocation for diff erent groups of schools and assess for which schools the allocation far
exceeds the benchmark. We note that excessive, ineffi cient allocation is provided to large
schools, especially to schools with over 200 students (20 percent excess) and over 500
students (30 percent excess). In the same way, on average, city schools receive 20 percent
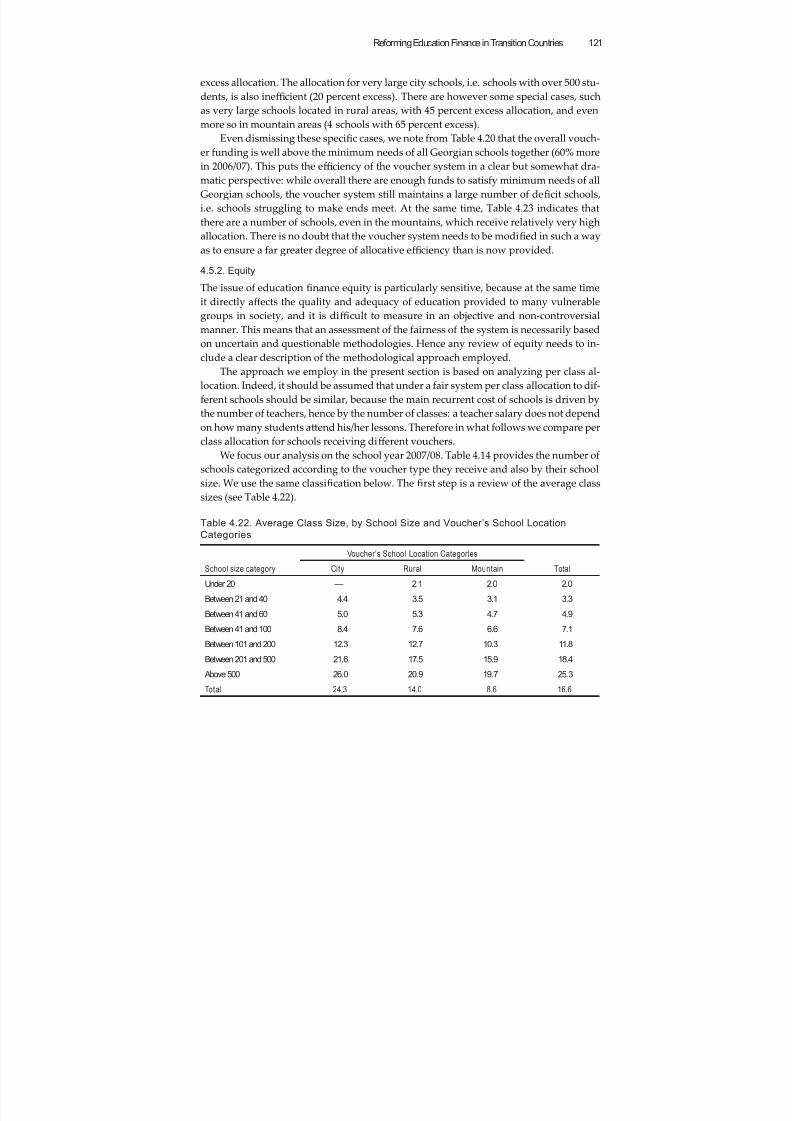
8/6/2019 Reforming Education Finance in Transition Countries
http://slidepdf.com/reader/full/reforming-education-finance-in-transition-countries 145/335
Reforming Education Finance in Transition Countries 121
excess allocation. The allocation for very large city schools, i.e. schools with over 500 stu-
dents, is also ineffi cient (20 percent excess). There are however some special cases, such
as very large schools located in rural areas, with 45 percent excess allocation, and even
more so in mountain areas (4 schools with 65 percent excess).
Even dismissing these specific cases, we note from Table 4.20 that the overall vouch-er funding is well above the minimum needs of all Georgian schools together (60% more
in 2006/07). This puts the effi ciency of the voucher system in a clear but somewhat dra-
matic perspective: while overall there are enough funds to satisfy minimum needs of all
Georgian schools, the voucher system still maintains a large number of deficit schools,
i.e. schools struggling to make ends meet. At the same time, Table 4.23 indicates that
there are a number of schools, even in the mountains, which receive relatively very high
allocation. There is no doubt that the voucher system needs to be modified in such a way
as to ensure a far greater degree of allocative effi ciency than is now provided.
4.5.2. EquityThe issue of education finance equity is particularly sensitive, because at the same time
it directly aff ects the quality and adequacy of education provided to many vulnerable
groups in society, and it is diffi cult to measure in an objective and non-controversial
manner. This means that an assessment of the fairness of the system is necessarily based
on uncertain and questionable methodologies. Hence any review of equity needs to in-
clude a clear description of the methodological approach employed.
The approach we employ in the present section is based on analyzing per class al-
location. Indeed, it should be assumed that under a fair system per class allocation to dif-
ferent schools should be similar, because the main recurrent cost of schools is driven by
the number of teachers, hence by the number of classes: a teacher salary does not dependon how many students aend his/her lessons. Therefore in what follows we compare per
class allocation for schools receiving diff erent vouchers.
We focus our analysis on the school year 2007/08. Table 4.14 provides the number of
schools categorized according to the voucher type they receive and also by their school
size. We use the same classification below. The first step is a review of the average class
sizes (see Table 4.22).
Table 4.22. Average Class Size, by School Size and Voucher’s School Location
Categories
School size category
Voucher’s School Location Categories
TotalCity Rural Mountain
Under 20 — 2.1 2.0 2.0
Between 21 and 40 4.4 3.5 3.1 3.3
Between 41 and 60 5.0 5.3 4.7 4.9
Between 41 and 100 8.4 7.6 6.6 7.1
Between 101 and 200 12.3 12.7 10.3 11.8
Between 201 and 500 21.6 17.5 15.9 18.4
Above 500 26.0 20.9 19.7 25.3
Total 24.3 14.0 8.6 16.6
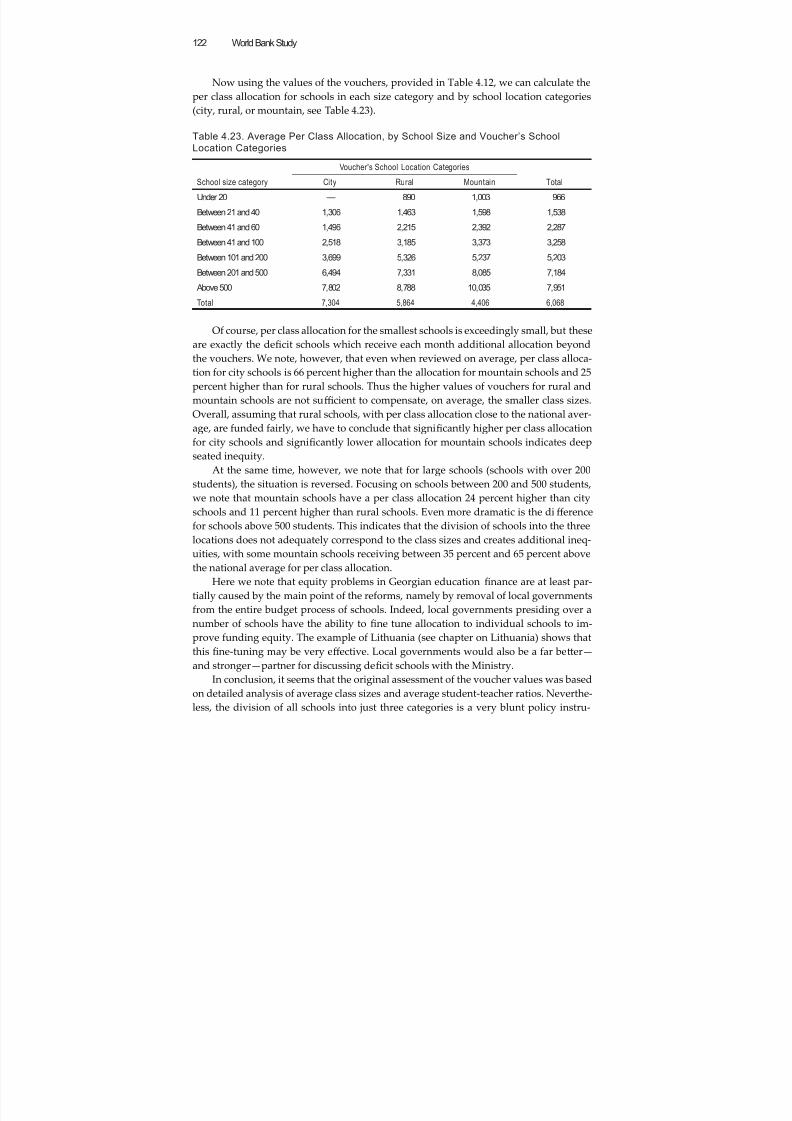
8/6/2019 Reforming Education Finance in Transition Countries
http://slidepdf.com/reader/full/reforming-education-finance-in-transition-countries 146/335
World Bank Study122
Now using the values of the vouchers, provided in Table 4.12, we can calculate the
per class allocation for schools in each size category and by school location categories
(city, rural, or mountain, see Table 4.23).
Table 4.23. Average Per Class Allocation, by School Size and Voucher’s SchoolLocation Categories
School size category
Voucher's School Location Categories
TotalCity Rural Mountain
Under 20 — 890 1,003 966
Between 21 and 40 1,306 1,463 1,598 1,538
Between 41 and 60 1,496 2,215 2,392 2,287
Between 41 and 100 2,518 3,185 3,373 3,258
Between 101 and 200 3,699 5,326 5,237 5,203
Between 201 and 500 6,494 7,331 8,085 7,184 Above 500 7,802 8,788 10,035 7,951
Total 7,304 5,864 4,406 6,068
Of course, per class allocation for the smallest schools is exceedingly small, but these
are exactly the deficit schools which receive each month additional allocation beyond
the vouchers. We note, however, that even when reviewed on average, per class alloca-
tion for city schools is 66 percent higher than the allocation for mountain schools and 25
percent higher than for rural schools. Thus the higher values of vouchers for rural and
mountain schools are not suffi cient to compensate, on average, the smaller class sizes.
Overall, assuming that rural schools, with per class allocation close to the national aver-age, are funded fairly, we have to conclude that significantly higher per class allocation
for city schools and significantly lower allocation for mountain schools indicates deep
seated inequity.
At the same time, however, we note that for large schools (schools with over 200
students), the situation is reversed. Focusing on schools between 200 and 500 students,
we note that mountain schools have a per class allocation 24 percent higher than city
schools and 11 percent higher than rural schools. Even more dramatic is the diff erence
for schools above 500 students. This indicates that the division of schools into the three
locations does not adequately correspond to the class sizes and creates additional ineq-
uities, with some mountain schools receiving between 35 percent and 65 percent above
the national average for per class allocation.
Here we note that equity problems in Georgian education finance are at least par-
tially caused by the main point of the reforms, namely by removal of local governments
from the entire budget process of schools. Indeed, local governments presiding over a
number of schools have the ability to fine tune allocation to individual schools to im-
prove funding equity. The example of Lithuania (see chapter on Lithuania) shows that
this fine-tuning may be very eff ective. Local governments would also be a far beer—
and stronger—partner for discussing deficit schools with the Ministry.
In conclusion, it seems that the original assessment of the voucher values was based
on detailed analysis of average class sizes and average student-teacher ratios. Neverthe-
less, the division of all schools into just three categories is a very blunt policy instru-
8/6/2019 Reforming Education Finance in Transition Countries
http://slidepdf.com/reader/full/reforming-education-finance-in-transition-countries 147/335
Reforming Education Finance in Transition Countries 123
ment, and it is not surprising that changes in the relative values of the vouchers were not
enough to keep pace with the evolution of the school system, such as network consolida-
tion and demographic changes. Presently the equity of the education finance system in
Georgia appears to need thorough reexamination.
4.5.3. Transparency and Accountability
4.5.3.1. TRANSPARENCY
The issue of transparency is a very subtle one. On the one hand there is no doubt that
transparency of the financial flows has increased considerably, and that in particular
the opportunities for corrupt practices was very much reduced. The financial flows are
well regulated, and are under the scrutiny of a number of stakeholders, primarily school
directors, school boards, and ERC. As Shapiro et al. (2007) underline, schools are receiv-
ing the funds without any delays and are able to pay their teachers also without delay.
At the same time, Shapiro et al. (2007) note that parents and teachers who are not
members of the school board “are very poorly informed about school management and
budgeting issues”. There are no eff ective ways of sharing the essential information with
the wider school community. This creates the dangers that when experienced school
board members leave, the new ones will be less able to monitor school activities and con-
trol the school director. This risk increases because of the election system, which results
in a renewal of the full composition of the school board every 3 years.32
An important element of transparency is the public availability of the school bud-
gets for scrutiny and comparison by diff erent stakeholders. There is no legal require-
ment for the school boards to publish school budgets, and no established procedure
for this (outside of Tbilisi, Internet access among the parents in Georgia is not high). Intheory, parents may approach school board members to ask about the financial details,
but this is a good source of information only if the board members themselves have good
understanding of budget issues.
Interestingly, both deficit schools and schools with surplus allocation have very
lile incentives to publish their budgets. Budgets of deficit schools are usually quite
unrealistic, with planned expenditures (mainly teacher salaries) far in excess of planned
revenues (vouchers). However, budgets of surplus schools are also somewhat shameful,
because they would exhibit an opposite situation, in which planned expenditures are
significantly smaller than planned revenues. Publication of these budgets would raise
uncomfortable questions, such as how to use the surplus resources for the benefit ofstudents and teachers, or indeed what the schools intend to do with their excess funds.
Forcing all schools to publish their budgets, for example by notifying them to the respec-
tive local government, would be a good step towards increased transparency.
4.5.3.2. ACCOUNTABILITY AND AUDITING OF SCHOOLS
We discussed above the problem of capacities of school directors to manage school bud-
gets. Similar capacity issues undermine the role of the school boards. The introduction of
powerful school boards, with the right to nominate and dismiss a school director and to
approve the budget was intended to increase school accountability with respect to the
parents of students and introduce a measure of social control over schools, especiallynecessary after the local governments’ role in education was severely curtailed. How-
ever, in many places school boards have proved unable to control and oversee the ac-
8/6/2019 Reforming Education Finance in Transition Countries
http://slidepdf.com/reader/full/reforming-education-finance-in-transition-countries 148/335
World Bank Study124
tivities of the school director, to assess his leadership skills and to analyze the proposed
school budget.
To a large extent, the boards rely on the school director for information, including
budgetary data, information about the activities of the schools, assessment of teachers,
and for proposals on what to do. For example, school boards may expect that the schooldirector will undertake actions to aract more students and thus to improve financial
situation of the school, or, alternatively, that the director will apply to the Ministry for
additional funds. It is however very diffi cult for the board to decide on the course of
action diff erent from what the director suggests. Reliance on opinions from one person
creates a passive and reactive aitude of board members. The board has no budget of
its own, so it cannot procure an independent assessment of the school activities or of the
school budget. Unless well-trained specialists are already members of the board, it has
lile choice but to accept the director’s proposals without discussions. Excessive salaries
of some directors of Tbilisi schools, discussed in section 4.4, have all been approved by
their respective school boards.
The situation is not eased by lack of clarity and absence of exact procedures. The
Ministry expects that autonomous school boards will establish their own procedures
and schedules of activity as is most useful for their specific schools, but this is often dif-
ficult and the boards themselves are sometimes lost. In particular, it is usually the school
director who may prepare and propose such procedures, but many directors will chose
not to do this and some boards operate without wrien procedures. One of the most
important of these procedures regards selection of school board members. As many
parents have insuffi cient motivation to participate in the process (board membership
is unpaid, of course), sometimes it is the school director who tries to identify and per-
suade some parents to “volunteer” for the position. This obviously weakens the control
mechanisms foreseen by the reformers. Anecdotal evidence shows that in many schools
the board simply approves all the proposals of the school director, assuming that she or
he is best placed to take professional decisions.
The diffi culties faced by the school boards in their eff orts to assume an active role
in the system were made obvious during the first round of national selection process for
the school directors in 2007. Aware of the problems of choosing the “right” candidate,
the Ministry organized a sort of “national tests” for candidates, awarding the certificates
to all persons who passed the tests. The school boards were supposed to choose candi-
dates from this pool of persons. More than half of all the positions of school directorswere left vacant and former directors were asked to continue to manage the schools.
There are many reasons for this failure, in part the boards were not prepared enough for
the decision-making process, in part former directors refused to take the tests and the
boards had asked “their” directors to continue to work, and in part some remote schools
had no good candidates. A second round of selection had to be organized, and some
changes in the law have become necessary.
Lack of certainty regarding the roles of diff erent stakeholders includes also the Edu-
cation Resource Centers (ERC). As the schools turn to them for guidance and sugges-
tions in many specific areas, ERC find themselves overwhelmed and unable to provide
suffi cient support. Shapiro et al. (2007) conclude that “ERC are entrusted with too manytasks and their physical and human resources are insuffi cient”. It seems unlikely that
without some legal changes ERC will contribute to school accountability.
8/6/2019 Reforming Education Finance in Transition Countries
http://slidepdf.com/reader/full/reforming-education-finance-in-transition-countries 149/335
Reforming Education Finance in Transition Countries 125
With weak accountability of schools, the main audit instrument available to the
Ministry is the controls performed in schools by the General Inspection (a budget con-
trol institution). Due to personnel constraints, every year this may happen only in some
selected schools. The typical situation therefore is for the Ministry to learn, either from
the Education Resource Center or from parents, that a school violates a given budgetaryrule, and to send a team of General Inspection to verify and punish the persons respon-
sible for this mismanagement. However, these controls are usually restricted to the veri-
fication of budgetary misconduct (improper use of funds etc.) or to criminal activities.
No systematic audit of schools aimed at improving their functioning exists in Georgia
as of today.
There is no doubt that the introduction of proper accountability standards requires
new skills and additional training of all stakeholders: school board members, teachers,
school directors, and ERC staff .
4.5.4. Other Key Areas
4.5.4.1. REACTION OF STAKEHOLDERS TO THE NEW SYSTEM
There is no doubt that in general the reaction of Georgian population to the reforms
initiated with the rose revolution was enthusiastic, and this includes the reaction to the
reforms of school finance. The most positive reactions were apparent among the schools
themselves, especially among the school directors. They liked the simplicity and clarity
of the voucher system, and especially the fact that they knew in advance budget re-
sources used to finance school activities. The lessening of corrupt practices in education
management from local governments that came out as a result of the financing reforms is
very much appreciated even today, many years after the reform started, as most schooldirectors still remember corrupt practices under the former system.
Parents also accepted their increased role in the education system, especially as dur-
ing initial years of the reform a number of training courses and support was directed
towards improving the competencies of the school board members.
The creation of Education Resource Centers was greeted with great expectations by
the schools. In sharp contrast to former education departments of local governments and
to delegated offi ces of the Ministry, ERC were designed to support schools and to off er
advice rather than to issue orders and instructions. The fact that ERC do not have access
to education funding, and therefore have no temptation for corruption, rather paradoxi-
cally strengthened their position and created good will from the school directors.The main opponents of the reforms, unsurprisingly, were the local governments.
The new, democratically elected mayors were interested in the quality and activities of
the schools, and faced pressure from parents, but had no legal grounds for interference.
In particular, some relatively rich cities, especially the city of Tbilisi, felt constrained
in their desire to support the schools, decide on the school network, and promote bet-
ter teaching practices. Some education initiatives of local governments are now taking
shape, but as mayors have limited influence over key decisions of schools, they are not
keen on commiing significant funds or embarking on significant long-term projects.
Over time, the initial positive reaction of the education stakeholders became over-
shadowed with new, less fortunate experiences. Deficit schools have become a perma-nent phenomenon of the system, dragging energy and resourcefulness away from stra-
tegic planning and adaptation to needs of parents and students. The need for monthly
8/6/2019 Reforming Education Finance in Transition Countries
http://slidepdf.com/reader/full/reforming-education-finance-in-transition-countries 150/335
World Bank Study126
requests for additional funds from the Ministry reduces the autonomy of schools and
weakens planning at the school level. The uncertainty regarding how much the school
should request and on what grounds the allocation decisions are being made further
diminishes incentives for good budgetary practice.
Some Education Resource Centers have shown initiative and have been workingvery closely with the schools to address new challenges and help them in their decision-
making process. For example, some ERC have been able to eff ectively support schools
in the budget process, by advising how the budget should look like, by discussing with
school boards past budgets of schools and their execution, and by proposing some prac-
tical steps to improve budget planning. Other ERC, however, have become lile more
than an agency that only takes care of the transmission of Ministerial guidelines and col-
lection of data from schools, which shows that the role of ERC is very diffi cult to fulfill
in practice.
4.5.4.2. SCHOOL AUTONOMY
The eff orts to increase school autonomy were described in the introduction. Schools adopt
their budgets, within the funding received, and need just an approval of the Ministry,
which is always granted. In particular, they can set the salaries of all staff , although in
practice the typical situation is that teachers receive the national minimum wage for
their education level, plus bonuses awarded by the school directors (interestingly, even
schools running impressive voucher surplus tend to pay their teachers minimum na-
tional salary, because with high teacher unemployment teachers are not likely to de-
mand pay increases). Schools may receive funding from sources other than vouchers
(donations, participation in projects), but this opportunity is mainly used in the cities:
according to Shapiro et al. (2007), only 16 percent of mountain schools had an experienceof applying for funds from non-budget sources (apart from vouchers or additional al-
location from the Ministry).
However, Shapiro et al. (2007) also note that schools “are not yet ready to fully uti-
lize the opportunities off ered by a decentralized education system”, mainly because of
insuffi cient budgeting and planning skills. Over time, school directors are becoming
more adept at managing their schools. However, constrained fiscal situation and fre-
quent changes of the values of the vouchers and of basic teacher salaries make system-
atic planning extremely diffi cult. Development of proper planning and budgeting skills
requires more stability.
An important barrier to school autonomy is the insuffi cient voucher funding (seesection 4.4). Schools which are under deficit are in fact highly dependent on the monthly
decisions of the Ministry in response to their budget requests. Thus remote Ministry offi -
cials may have more impact on the decisions of the school director than the school board.
In discussing the need for school autonomy, one must also consider some necessary
limitations of that autonomy. For example, as school funding depends only on student
numbers, some schools have lowered their requirements, especially regarding student
marking (beer marks without good reason), student discipline, and school aendance.
The Ministry may respond to such problems by creating a proper independent school
inspection. This is indeed being developed in Georgia, but the process is much delayed.
School autonomy is also diminished by the fact that parents may threaten the school
director that unless some of their demands are met, they will move their children to
a diff erent school (this may happen only in large cities). Such a move, especially by a
8/6/2019 Reforming Education Finance in Transition Countries
http://slidepdf.com/reader/full/reforming-education-finance-in-transition-countries 151/335
Reforming Education Finance in Transition Countries 127
group of parents, may hit finances of the school quite painfully. Conflicting demands
by parents, unless negotiated through the school board, present a real challenge to the
school.
In practice, the reform has strengthened the position of the school director, who
typically proposes the budget and the school plan for approval by the school board, andsingle-handedly negotiates additional allocations with the Ministry of Education. This is
seen in part by excessive salaries some school directors in larger cities decide to allocate
to themselves (see the previous section). At the same time, the position of directors of
deficit schools has become very weak, as they are dependent upon monthly decisions of
offi cials in the Ministry. The question of how this aff ected autonomy of schools as teach-
ing institutions (pedagogical process) and as financial units (budgeting process) requires
a more in-depth empirical review.
4.5.4.3. SCHOOL COMPETITION
Turning to school competition , we note that it is inherently built into the system in whichdecisions by students to choose schools have a direct and immediate impact on school
budgets. There are already some cases of schools experiencing a rapid increase in en-
rollment (mostly in Tbilisi). This must come at the expense of some schools that lose
students, of course. The expected sharp decline in the student population in the coming
years will make this competition even harder. However, it is still unclear how strong
this competition is and what forms it will take. Godfrey (2007) warns that schools may
be unwilling to take in special needs students and students who find learning diffi cult,
and suggests that a separate voucher for those students would be needed. Teachers and
school directors interviewed by Shapiro et al. (2007) were talking about the vicious cir-
cle , in which schools in less competitive situations—poorer conditions of building andequipment and poorer student community served—may find themselves losing both
students and funding, thus compromising quality, in turn, leading to further exodus
of students to beer schools. They would like to see some sort of safety nets for those
schools provided, for example, by ERC. There seems to be a need to review voucher
financing quite independent of the problem of deficit schools.
4.6. Conclusions
The reforms introduced in Georgian education have been relatively successful. The new
radically simple system of voucherfi
nancing has been well prepared in terms of legal basis, and was introduced in a rather smooth manner. Despite some ineffi ciencies and
inequities, a workable modus operandi was developed, which is still functional after a
few years of operations. The first round of selection of new school directors was only
partially satisfactory, but during the second round most positions were filled, in what
certainly represents a completely new democratic experience for all the school directors,
teachers, and the school boards. Most importantly, the reforms have cut the most diffi -
cult and corrupt practices in Georgian education, namely management by local govern-
ments operating under double reporting lines, and have introduced transparency and
clarity to education finance.
Interestingly, although the desire to improve school eff
ectiveness was one of thegoals of the voucher system, the actual approach taken by the Ministry was diff erent.
Rather than waiting until the voucher system eliminated unviable schools, the Ministry
8/6/2019 Reforming Education Finance in Transition Countries
http://slidepdf.com/reader/full/reforming-education-finance-in-transition-countries 152/335
World Bank Study128
made a very significant eff ort into the optimization of the school network as a condition
for a smooth operation of the voucher system. This sequencing of reforms seems to have
been the crucial decision of the reformers leading to early success. Even now the number
of deficit schools is significant, but one can imagine that without prior network consoli-
dation it would have been almost impossible to introduce vouchers. One can make arough approximate calculation.33 Table 4.20 indicates that schools under 100 students are
most likely to be in deficit. Table 4.2 tells us that without any consolidation eff ort, in the
conditions of 2004 we would have about 1,500 deficit schools (half of the total). Another
important condition for the success of the voucher system was an increase in overall allo-
cation. Since any formula based allocation system creates losers, an increase of the fund-
ing level is a good way to minimize their numbers and to reduce the stress put on them.
Despite clear success of the reforms, there are still a number of problems. About 30
percent of all Georgian schools receive in vouchers insuffi cient funds for basic opera-
tions, and every month submit requests for additional funds, which they always receive.
At the same time, it seems that a fair number of large schools in the cities—and, as seen
from Table 4.14, also a few in the villages and in the mountains—receive far more funds
then they actually need for regular school operations. Those funds may be used to im-
prove the education process and for own school investments (computers, school equip-
ment etc.), of course, but this type of allocation cannot be considered optimal. The func-
tioning of many deficit schools makes it very diffi cult if not impossible to impose budget
discipline. Nevertheless, the appearance of the deficit schools provided the Ministry
with a new insight into how Georgian schools are operating. As there are examples of
schools with similar numbers of students, some of which are functioning well, and some
which are in deficit, the voucher system has revealed ineffi ciencies of internal school op-
erations, which up to now were hidden. At present, those ineffi ciencies are maintained
by allocating the deficit schools additional funding every month. The Ministry has yet
to develop a more strategic approach to deficit schools, and to devise ways of actually
refusing additional support in cases when there are no compelling reasons to maintain
the small schools, or when the internal school management is evidently ineffi cient.
Another diffi culty is the increasing number of supplements to the vouchers that
are being introduced by the Ministry. As discussed in section 4.2.1, some of those sup-
plements are related to specific Government policies, such as maintenance of Georgian
schools in areas of armed conflict, while others reflect recent Government initiatives to
increase teacher salaries. While in each case the introduction of the supplement may bedefended on policy grounds, altogether their influence is dangerous, because they un-
dermine the simplicity and transparency of the voucher system. They also show that the
voucher financing system is not yet suffi ciently flexible to allow implementation of new
education policies. This may be a reflection of the fact that the vouchers, being a very
simple system, cannot adequately take into account structural cost diff erences among
areas or among schools of diff erent size and type. Thus, the challenge is to integrate
the supplements into the voucher scheme itself. If the Ministry fails to achieve this, the
risk is that in the future, with the necessary yearly adjustment to the voucher levels, the
Ministry will also have to manage the adjustments to all the supplements. This threatens
to become a cumbersome task.Funding of schools on the basis of school vouchers creates the illusion that educa-
tion finance equity has been automatically achieved. Our simple review of equity in
8/6/2019 Reforming Education Finance in Transition Countries
http://slidepdf.com/reader/full/reforming-education-finance-in-transition-countries 153/335
Reforming Education Finance in Transition Countries 129
terms of per class allocation reveals that very significant areas of inequity remain. These
issues have to be addressed directly by the Ministry of Education, either through a re-
form of the voucher system itself, or through a reform of the management of education
finance. The first approach may include a more subtle diff erentiation of the vouchers
or an introduction of lump sum allocation to schools, alongside voucher allocation (seeHerczyński 2008). The second approach may include returning to local governments
some role in seing the school budgets.
Analysis of voucher allocation also reveals issues with allocative effi ciency. This
is demonstrated by the fact that while overall allocation is much higher than overall
minimum needs of schools, there are still many schools whose allocation is below their
minimum needs (see section 4.4).
It is also not clear how the school autonomy will be strengthened. With very lile
capacities for self management and no experience in running their own budgets, schools
rely on ERC for support and guidance. There is a risk therefore that ERC will take over
the functions of former rayon education offi ces. The planned introduction of strong
school boards may prevent this, but certainly the challenges are serious.
Finally, there is as yet no experience on what eff ect the new financing system will
have on school performance and more importantly on education quality. The Georgian
Ministry of Education has yet to understand the system of incentives the voucher sys-
tem is puing in place, and its positive and adverse eff ects. In recent years the tone of
discussions of education reforms has changed.34 Initial enthusiastic reactions have been
replaced with more sober understanding that the system needs continued revision and
improvement. Much stronger control over individual schools is considered necessary,
especially in the budget sphere. Discussions regarding the number of positions in each
school have become standard. Stronger school inspection has reduced the freedom to
keep non-aending and non-progressing students enrolled in the school. This probably
eroded school autonomy, but at the same time improved monitoring and reduced inef-
ficiency. Due to much greater control over the schools, the allocation of additional funds
(above the vouchers) should become more rational, leading to improvement of equity.
Nothing comes without a cost, however: the system may become less transparent and
much more complicated than it was. The laws regarding the training and the selection
of school directors are also being reviewed and changed. The Ministry understands now
that it needs to monitor the situation very closely and be ready to adapt the financing
system to new challenges. Hopefully, this new phase of reforms of Georgian educationwill benefit good schools, schools focused on proper education and on preparation of
students to life in a democratic society, but striking the correct balance between au-
tonomy and control is never easy.
References
Godfrey, M. (2007); Education Policy Note: Georgia , processed text, World Bank
Herczyński, J. (2001); The Financing of Georgian Education , CASE Studies and Analyzes
240
Herczyński, J. (2005a); The Needs of Georgian Ministry of Education and Sport: Education
Finance and Education Resource Centers , processed text, GEDA, TbilisiHerczyński, J. (2005b), Short Term Problems of Education Finance in Georgia , processed text,
GEDA, Tbilisi
8/6/2019 Reforming Education Finance in Transition Countries
http://slidepdf.com/reader/full/reforming-education-finance-in-transition-countries 154/335
World Bank Study130
Herczyński, J. (2008), Possible Modi fication of the Voucher System. Explanations and Instruc-
tions for Simulator 08 , processed text, OSI/LGI, Tbilisi
Melikidze, V. (2003), Role of the Formal Decision Making in Emerging of the “New Corrup-
tion” in a School Education in Transitional Societies (Case of Georgia) , Tbilisi
Ross, K. and Levačić , R. (1999); Needs Based Resource Allocation via Formula Funding ofSchools , Paris: IIEP UNESCO
Shapiro, M. (team leader), Nakata, S., Chakhaia, L., Zhvania, E., Babunashvili, G., Pru-
idze, N. and Tskhomeldze, M. (2007); Evaluation of the Ilia Chavchavadze Program in
Reforming and Strengthening Georgia’s Schools, Padeco Co. Ltd.
Rekhviashvili, I. (2001); Decentralization Experience and Reforms: Case Study on Georgia ,
processed text, Tbilisi
Simonia, Z. (2007); School Funding System in Georgia , processed text, World Bank,
Swanson, A. and King, R. (1991), School Finance. Its Economics and Politics, New York:
Longman
Tsagareishvili, Lasha (2007), Voucher Funding for General Education Schools: Financial Anal-
ysis (Interim Report) , Georgian Education Project Coordination Center
Notes
1. We have profited from many discussions with Georgian experts, but particular gratitude must
be expressed to Archil Gagnidze, former Deputy Minister of Education, responsible for school
finance, for openly discussing with us the problems facing Georgian reformers.
2. In many countries, reformers hope that per student financing system, by introducing strong
financial incentives, will motivate network consolidation, but that hope rarely materializes, see for
instance chapter on Lithuania.
3. Georgia was included in the scope of the project quite late so it was decided that the Georgianchapter will be more focused on a few specific issues. This explains why the present chapter is
much shorter and provides less detail than other chapters, like those on Lithuania or Poland.
4. See Herczyński (2001) and Melikidze (2003) for a review of Georgian education finance prior to
the current reforms.
5. In Soviet times, this system of double reporting lines did not lead to confusion despite its obvious
ineffi ciency since the real power rested with the Party organizations, which created the third, and
only functional, chain of command and control. When that chain disappeared, the dysfunctional
administrative system immediately became prone to mismanagement and corruption. Among
post-Soviet republics, Georgia was maybe exceptional only in the degree of this corruption. In-
terestingly, the State Audit was empowered to investigate only state and oblast level institutions,
leaving the finances of local governments completely unaudited. See Herczyński (2001) for details.
6. Documented descriptions of the process of local government weakening since the 2003 revolu-
tion do not seem to be available. However, in an ironic summary of this situation, a Georgian of-
ficial informally stated that “responsibilities of local governments in Georgia have been reduced to
waste collection and preschools, but waste collection will be privatized soon”. For a pre-revolution
review of decentralization, see for example Rekhviashvili (2001).
7. However, only a few schools have registered with the notary because of the additional costs
required–mainly for creating a current plan of school buildings. Moreover, any non-educational
use of school property, such as renting the school, needs permission from both the MoE and MoF.
8. The first round of exams was held in April 2007, and by July school boards were supposed to
select new directors. About 30 percent of school boards failed to select new school directors, partly
due to a lack of qualified candidates. The second round of elections of school boards in October
2007 filled most of the vacant positions.9. Lack of independent school inspections is another trait of post-Soviet education systems, which
inherited this feature. Under the Soviet system, inspecting the schools and checking the work of
8/6/2019 Reforming Education Finance in Transition Countries
http://slidepdf.com/reader/full/reforming-education-finance-in-transition-countries 155/335
Reforming Education Finance in Transition Countries 131
teachers was performed by the same institution that managed the schools–i.e. the rayon and oblast
education offi ces.
10. See Ross and Levačić (1999).
11. Unfortunately, most of the data used by Godfrey are from before 2005, so these exclude the
impact of current reforms.
12. The preparatory work is described in the report by Simonia (2007).
13. See Simonia (2007). The main eff ect of increase education spending will be an increase of teach-
er salaries and beer and more motivated teaching workforce. Additionally, non-salary expendi-
tures should also be increased.
14. See Herczyński (2005a).
15. This and the following tables are obtained from the data files on all schools in Georgia, received
from the Ministry. The data file include the following information about each school: number of
students, teachers, weekly teaching hours, administrative staff , for the school years indicated in
the table. For school years 2005/06 and 2006/07 the data file also provides the value of the voucher
allocated to the school. The data files were filled in by the schools with limited verification by the
ministry, so care must be taken in interpreting them. All data with the exception of Table 4.2, Table
4.14 and tables in section 4.5 use data up until the school year 2006/07.16. As noted in Herczyński (2005b), just prior to the introduction of vouchers the Ministry had
highly unreliable data on student numbers, in particular for a number of schools no student data
were available.
17. This is the physical number of teachers, see Table 4.8 and Table 4.9 for full-time equivalent
teachers. The data used may require some additional verification.
18. Student-teacher ratio in Georgia is one of the lowest in the region, see Godfrey (2007).
19. The number of FTE teachers in Table 4.8 is an underestimate, because a number of schools re-
corded zero number of weekly teaching hours. We assume those are random data errors, and use
the data for the full set of schools.
20. This finding is supported by Shapiro et al. (2007), who found that while consolidated and non
consolidates schools had about the same student-teacher ratio, ratio of students to not teachingstaff is significantly higher in consolidated schools. On the other hand, Godfrey (2007) observes
that Georgia has relatively high share of non-teaching staff in school employment. Data reported
in Table 4.10 may require additional verification.
21. Indeed, one can assume that it was easier to close schools with fewer number of staff , because
the eff ort of relocating those staff to larger consolidated schools was much smaller. Thus, the small
schools which remained may have had less effi cient employment levels.
22. In principle the schools may receive funds from other sources as well, including from local
governments, from parents, or donations from local or international donors, but those non-budget
revenues of schools are not significant in the school budgets.
23. Minimum salary was increased from 115 GEL to 165 GEL, an increase not paralleled by the
increase of the vouchers.
24. Typically, there are components for basic teaching program, for strong students (academically,in sport, or in arts), for weak students (requiring remedial teaching etc.), and for maintenance costs.
See Ross and Levačić (1999).
25. If the implementation of EMIS, currently under development, is successful, it will become pos-
sible to move to more subtle financial instruments than vouchers.
26. The risk of appearance of deficit schools and the need of the Ministry to prepare to deal with
them was identified in Herczyński (2005a). Also the Ministry knew that about 38 percent of schools
with about 10 percent of students will become deficit schools, and set aside 5 percent reserve for
them, Simonia (2007).
27. The total number of schools and students from diff erent sources are diff erent, maybe due to the
inclusion or exclusion of private schools.
28. In December 2007 this was increased to 165 GEL, but we do not refl
ect this or the increase of thevouchers in our calculations below.
8/6/2019 Reforming Education Finance in Transition Countries
http://slidepdf.com/reader/full/reforming-education-finance-in-transition-countries 156/335
8/6/2019 Reforming Education Finance in Transition Countries
http://slidepdf.com/reader/full/reforming-education-finance-in-transition-countries 157/335
133
C H A P T E R 5
Student Basket Reform inLithuania: Fine-Tuning Centraland Local Financing of Education
Jan Herczyński1
5.1. Introduction
Like all post-communist countries, Lithuania in the early 1990s faced the dauntingtask of not only introducing the necessary political reforms, leading to a democraticsociety based on the rule of law and on the market economy, but also of changing thewhole structure of management and methods of financing of each and every sector ofthe economy. In education the two tasks were particularly diffi cult to reconcile. Themovement toward democracy involved removing ideological constraints on schools and
teachers, retraining of all teachers to help them move away from traditional teaching based on one acceptable truth, given to students to memorize and repeat uncritically,and toward education based on dialogue and asking questions. This required changingthe curricula, introducing more open and flexible teaching programs, rewriting all thetextbooks, changing teaching methodologies, overhauling teacher pre-service trainingand especially in-service training. Given the traditions of Soviet schools and the strongideological control exercised over the pedagogical process, this was a serious effort.2 Nowonder therefore that changes in management and financing were initially consideredsecondary and were introduced only in 2002.
Historically in the Soviet Union, education was managed and financed by rayons ,
under close scrutiny of the oblast and controlled by central or republican ministriesthrough a web of double reporting lines.3 Usually school buildings belonged to therayons , and schools were financed from rayon budgets. Local government reforms inLithuania in 1990 had created democratic rayon administrations,4 which cut the doublereporting lines and replaced them with autonomous budgetary procedures. Yet, generalschools, with their complete budgets, remained under local government authority. Untilthe introduction of education finance reforms in 2002 municipalities received negotiatedtransfers for education.
The specific Lithuanian solution, quite different from other financing arrangementsin post communist countries, is called the Student Basket. The Student Basket is a per stu-
dent amount, calculated according to a formula adjusted every year through a decisionof the Cabinet of Ministers that is designed to cover the teaching process , which includesteacher salaries, school management, education support staff such as psychologists, text-
8/6/2019 Reforming Education Finance in Transition Countries
http://slidepdf.com/reader/full/reforming-education-finance-in-transition-countries 158/335
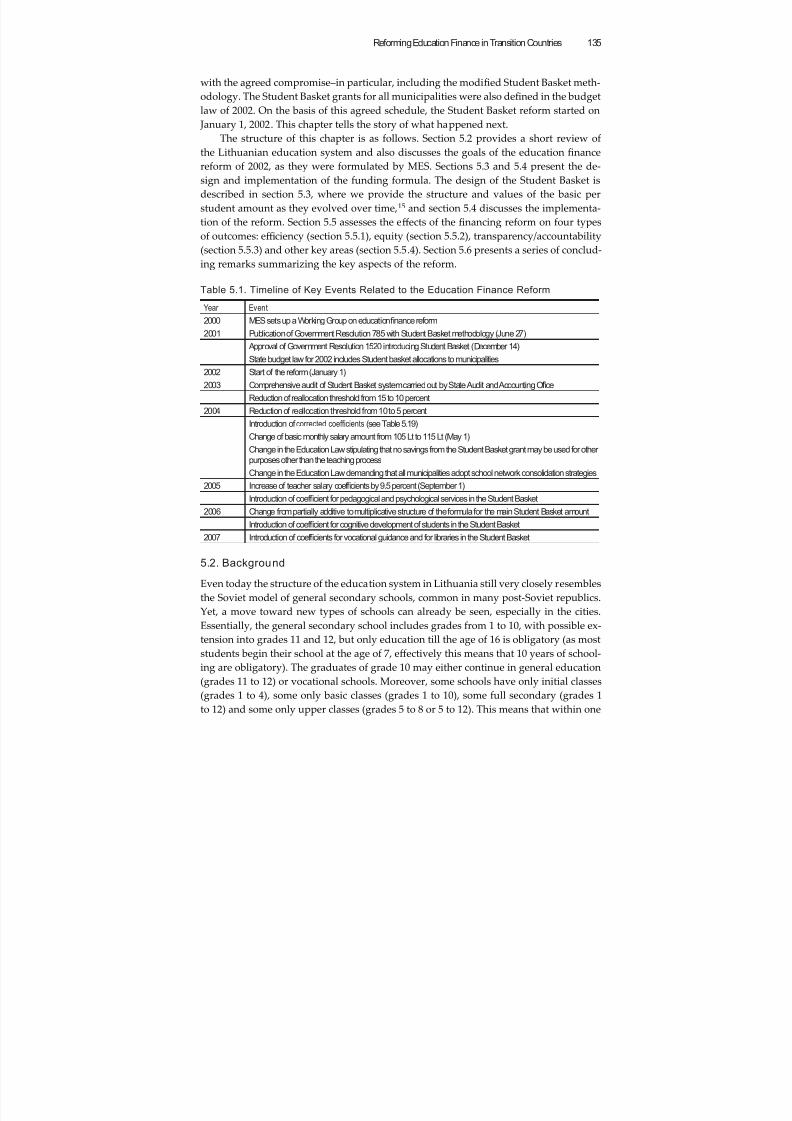
8/6/2019 Reforming Education Finance in Transition Countries
http://slidepdf.com/reader/full/reforming-education-finance-in-transition-countries 159/335
Reforming Education Finance in Transition Countries 135
with the agreed compromise–in particular, including the modified Student Basket meth-odology. The Student Basket grants for all municipalities were also defined in the budgetlaw of 2002. On the basis of this agreed schedule, the Student Basket reform started on January 1, 2002. This chapter tells the story of what happened next.
The structure of this chapter is as follows. Section 5.2 provides a short review ofthe Lithuanian education system and also discusses the goals of the education financereform of 2002, as they were formulated by MES. Sections 5.3 and 5.4 present the de-sign and implementation of the funding formula. The design of the Student Basket isdescribed in section 5.3, where we provide the structure and values of the basic perstudent amount as they evolved over time,15 and section 5.4 discusses the implementa-tion of the reform. Section 5.5 assesses the effects of the financing reform on four typesof outcomes: effi ciency (section 5.5.1), equity (section 5.5.2), transparency/accountability(section 5.5.3) and other key areas (section 5.5.4). Section 5.6 presents a series of conclud-ing remarks summarizing the key aspects of the reform.
Table 5.1. Timeline of Key Events Related to the Education Finance Reform
Year Event
2000 MES sets up a Working Group on educationfinance reform
2001 Publication of Government Resolution 785 with Student Basket methodology (June 27)
Approval of Government Resolution 1520 introducing Student Basket (December 14)
State budget law for 2002 includes Student basket allocations to municipalities
2002 Start of the reform (January 1)
2003 Comprehensive audit of Student Basket system carried out by State Audit and Accounting Of fice
Reduction of reallocation threshold from 15 to 10 percent
2004 Reduction of reallocation threshold from 10 to 5 percentIntroduction of corrected coef ficients (see Table 5.19)
Change of basic monthly salary amount from 105 Lt to 115 Lt (May 1)
Change in the Education Law stipulating that no savings from the Student Basket grant may be used for otherpurposes other than the teaching process
Change in the Education Law demanding that all municipalities adopt school network consolidation strategies
2005 Increase of teacher salary coef ficients by 9.5 percent (September 1)
Introduction of coef ficient for pedagogical and psychological services in the Student Basket
2006 Change from partially additive to multiplicative structure of the formula for the main Student Basket amount
Introduction of coef ficient for cognitive development of students in the Student Basket
2007 Introduction of coef ficients for vocational guidance and for libraries in the Student Basket
5.2. Background
Even today the structure of the education system in Lithuania still very closely resemblesthe Soviet model of general secondary schools, common in many post-Soviet republics.Yet, a move toward new types of schools can already be seen, especially in the cities.Essentially, the general secondary school includes grades from 1 to 10, with possible ex-tension into grades 11 and 12, but only education till the age of 16 is obligatory (as moststudents begin their school at the age of 7, effectively this means that 10 years of school-ing are obligatory). The graduates of grade 10 may either continue in general education
(grades 11 to 12) or vocational schools. Moreover, some schools have only initial classes(grades 1 to 4), some only basic classes (grades 1 to 10), some full secondary (grades 1to 12) and some only upper classes (grades 5 to 8 or 5 to 12). This means that within one
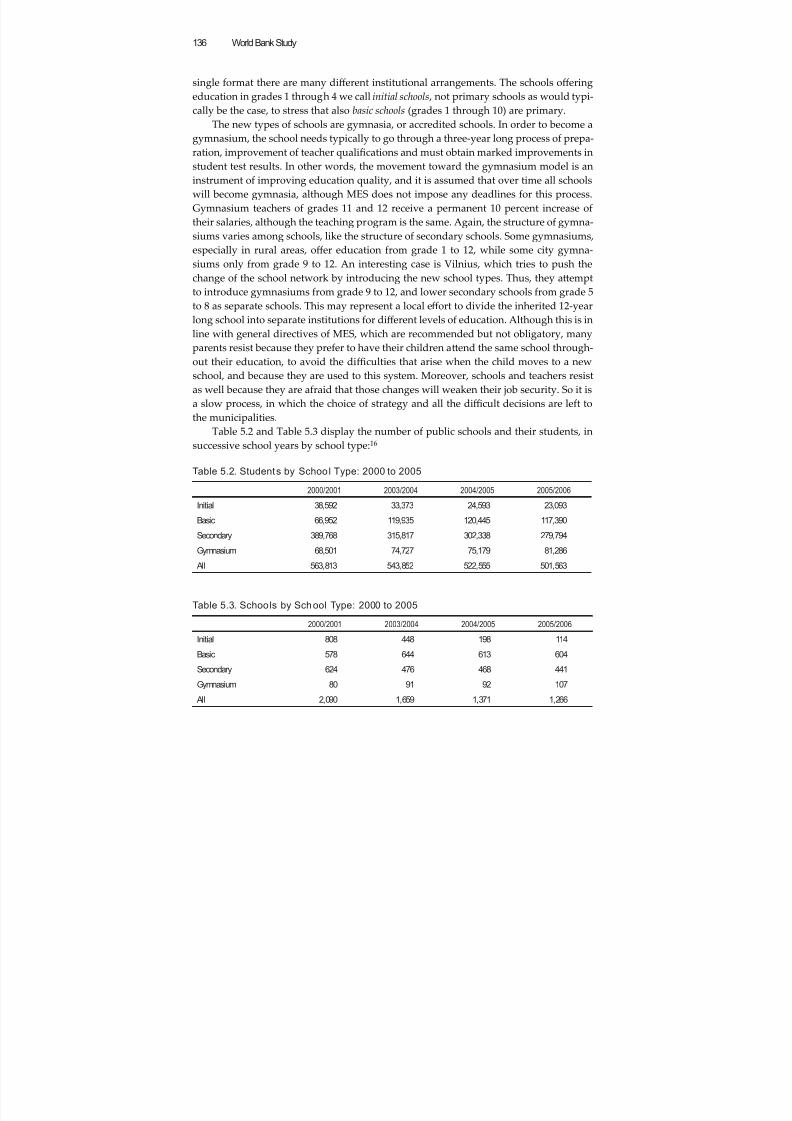
8/6/2019 Reforming Education Finance in Transition Countries
http://slidepdf.com/reader/full/reforming-education-finance-in-transition-countries 160/335
World Bank Study136
single format there are many different institutional arrangements. The schools offeringeducation in grades 1 through 4 we call initial schools , not primary schools as would typi-cally be the case, to stress that also basic schools (grades 1 through 10) are primary.
The new types of schools are gymnasia, or accredited schools. In order to become a
gymnasium, the school needs typically to go through a three-year long process of prepa-ration, improvement of teacher qualifications and must obtain marked improvements instudent test results. In other words, the movement toward the gymnasium model is aninstrument of improving education quality, and it is assumed that over time all schoolswill become gymnasia, although MES does not impose any deadlines for this process.Gymnasium teachers of grades 11 and 12 receive a permanent 10 percent increase oftheir salaries, although the teaching program is the same. Again, the structure of gymna-siums varies among schools, like the structure of secondary schools. Some gymnasiums,especially in rural areas, offer education from grade 1 to 12, while some city gymna-siums only from grade 9 to 12. An interesting case is Vilnius, which tries to push the
change of the school network by introducing the new school types. Thus, they aemptto introduce gymnasiums from grade 9 to 12, and lower secondary schools from grade 5to 8 as separate schools. This may represent a local effort to divide the inherited 12-yearlong school into separate institutions for different levels of education. Although this is inline with general directives of MES, which are recommended but not obligatory, manyparents resist because they prefer to have their children aend the same school through-out their education, to avoid the diffi culties that arise when the child moves to a newschool, and because they are used to this system. Moreover, schools and teachers resistas well because they are afraid that those changes will weaken their job security. So it isa slow process, in which the choice of strategy and all the diffi cult decisions are left tothe municipalities.
Table 5.2 and Table 5.3 display the number of public schools and their students, insuccessive school years by school type:16
Table 5.2. Students by School Type: 2000 to 2005
2000/2001 2003/2004 2004/2005 2005/2006
Initial 38,592 33,373 24,593 23,093
Basic 66,952 119,935 120,445 117,390
Secondary 389,768 315,817 302,338 279,794
Gymnasium 68,501 74,727 75,179 81,286 All 563,813 543,852 522,555 501,563
Table 5.3. Schools by School Type: 2000 to 2005
2000/2001 2003/2004 2004/2005 2005/2006
Initial 808 448 198 114
Basic 578 644 613 604
Secondary 624 476 468 441
Gymnasium 80 91 92 107 All 2,090 1,659 1,371 1,266
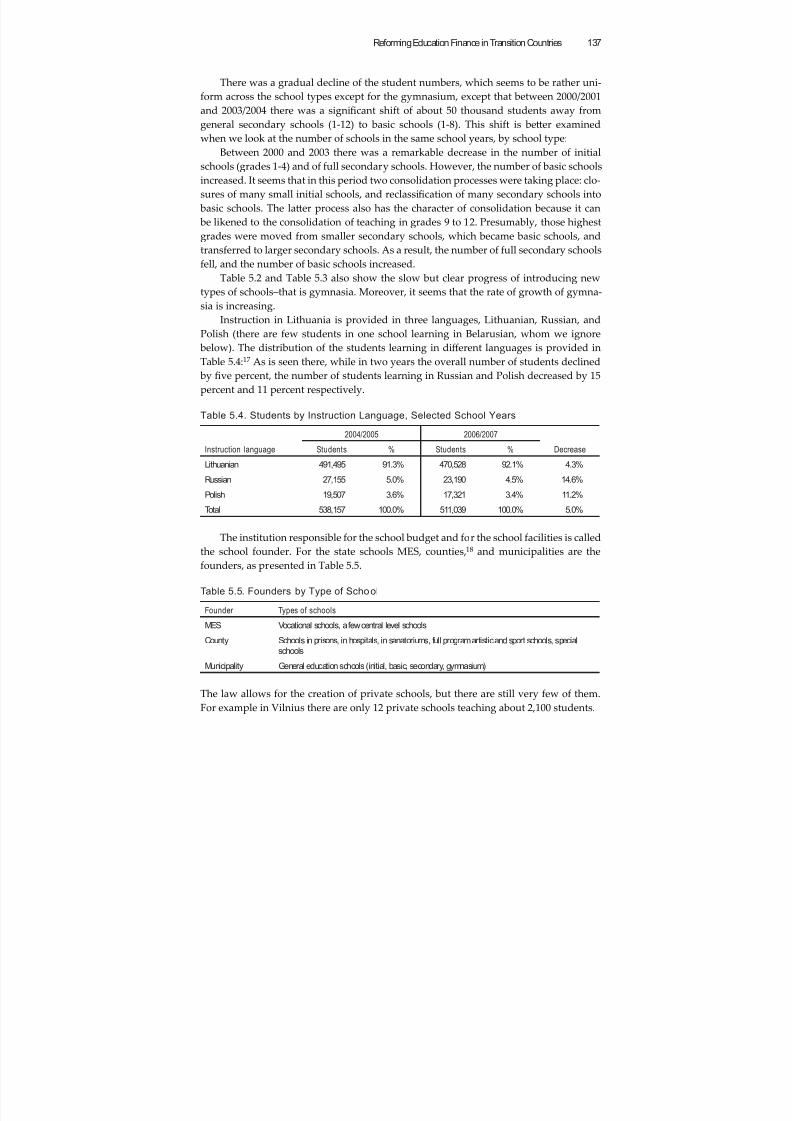
8/6/2019 Reforming Education Finance in Transition Countries
http://slidepdf.com/reader/full/reforming-education-finance-in-transition-countries 161/335
Reforming Education Finance in Transition Countries 137
There was a gradual decline of the student numbers, which seems to be rather uni-form across the school types except for the gymnasium, except that between 2000/2001and 2003/2004 there was a significant shift of about 50 thousand students away fromgeneral secondary schools (1-12) to basic schools (1-8). This shift is beer examined
when we look at the number of schools in the same school years, by school type:Between 2000 and 2003 there was a remarkable decrease in the number of initial
schools (grades 1-4) and of full secondary schools. However, the number of basic schoolsincreased. It seems that in this period two consolidation processes were taking place: clo-sures of many small initial schools, and reclassification of many secondary schools into basic schools. The laer process also has the character of consolidation because it can be likened to the consolidation of teaching in grades 9 to 12. Presumably, those highestgrades were moved from smaller secondary schools, which became basic schools, andtransferred to larger secondary schools. As a result, the number of full secondary schoolsfell, and the number of basic schools increased.
Table 5.2 and Table 5.3 also show the slow but clear progress of introducing newtypes of schools–that is gymnasia. Moreover, it seems that the rate of growth of gymna-sia is increasing.
Instruction in Lithuania is provided in three languages, Lithuanian, Russian, andPolish (there are few students in one school learning in Belarusian, whom we ignore below). The distribution of the students learning in different languages is provided inTable 5.4:17 As is seen there, while in two years the overall number of students declined by five percent, the number of students learning in Russian and Polish decreased by 15percent and 11 percent respectively.
Table 5.4. Students by Instruction Language, Selected School Years
Instruction language
2004/2005 2006/2007
DecreaseStudents % Students %
Lithuanian 491,495 91.3% 470,528 92.1% 4.3%
Russian 27,155 5.0% 23,190 4.5% 14.6%
Polish 19,507 3.6% 17,321 3.4% 11.2%
Total 538,157 100.0% 511,039 100.0% 5.0%
The institution responsible for the school budget and for the school facilities is called
the school founder. For the state schools MES, counties,18 and municipalities are thefounders, as presented in Table 5.5.
Table 5.5. Founders by Type of School
Founder Types of schools
MES Vocational schools, a few central level schools
County Schools in prisons, in hospitals, in sanatoriums, full program artistic and sport schools, specialschools
Municipality General education schools (initial, basic, secondary, gymnasium)
The law allows for the creation of private schools, but there are still very few of them.For example in Vilnius there are only 12 private schools teaching about 2,100 students.
8/6/2019 Reforming Education Finance in Transition Countries
http://slidepdf.com/reader/full/reforming-education-finance-in-transition-countries 162/335
World Bank Study138
The responsibilities of the founder in the system are defined in the Education Law.They have influence on the choice of the school director because they have two represen-tatives in the 5-person selection commission, which is created ad hoc whenever needed.The other three representatives are nominated by MES, by the county, and by the school
council (the last person may be either teacher or parent).Founders are responsible for the school network. In particular municipalities de-
cide whether to consolidate schools or change the status of the school. Municipalitiesalso finance student transportation, leaving its organization to schools. The legal obliga-tion is to transport the students who live farther than three kilometers from the nearestschool, to that nearest school free of charge. This can be either through public or privatetransport, or using transportation owned by schools, which include the newly acquiredso called yellow buses that typically are Mercedes vans with carrying capacity of 12 to 19and are provided by the government.19 Table 5.6 provides a breakdown of transportedstudents by transportation type in the school year 2006/2007.20
Table 5.6. Students by Transportation Mode
Type of transportation Students %
Public 61,195 62.4%
Private 9,243 9.4%
School vehicles 7,547 7.7%
Yellow busses 14,842 15.1%
Other (incl. parents) 5,259 5.4%
All 98,086 100.0%
Interestingly, although the municipalities are obliged to provide transport to thenearest school only, about 9,500 students are transported to a school that is not the near-est. This may be due to instruction language or to specific parental preferences.
5.2.1. Policy Objectives
In 2000 and 2001 a working group was set up by MES with the goal of assessing theinherited system of education finance in Lithuania, identifying the main problems, andproposing reform measures. The report of the Working Group was the basis for theintroduction and further adjustment of the Student Basket system. Additionally, impor-
tant parts of the report were used in the Government Resolution 785 of June 27, 200121—including the general methodology of calculating the Student Basket. That documentlisted the main problems of the previous financing system:
1. Education spending varied greatly in different regions or municipalities, al-though the Education Standards for pupil achievement were the same.
2. The network of schools of general education was not at its optimum; hence thefunds were used ineffi ciently.
3. The largest share of funding was spent on running the schools and paying sala-ries to teachers, while the part for modernization of the teaching process or for
purchase of teaching aids was in decline every year.4. Student transportation issues had grown in importance because of school net-work reform. The number of students living at considerable distance fromschool was increasing. Parents were afraid to send their children to a school fur-
8/6/2019 Reforming Education Finance in Transition Countries
http://slidepdf.com/reader/full/reforming-education-finance-in-transition-countries 163/335
8/6/2019 Reforming Education Finance in Transition Countries
http://slidepdf.com/reader/full/reforming-education-finance-in-transition-countries 164/335
World Bank Study140
among school types would lead to more choice and beer quality. However in Lithuaniathe growth of non-public schools was slow in part because of high tuition fees. To helpthe non-public schools, MES included them in the Student Basket system.
The following results were expected from the proper functioning of the Student Basket:
1. Education funds would be distributed according to uniform principles andwould be used more effi ciently.
2. It is likely that the quality of education services would improve even without anincrease in funding, purely through inter-school competition that is encouraged by this system.
3. The number of children who do not aend school would decline becauseschools would be motivated to keep existing students and aract new students.
4. The school community would know what amount of funds to expect each year,hence it would be able to plan and manage its activities economically.
5. The network of non-governmental schools would expand.6. The school network would acquire a form that would beer accommodate theneeds of students and parents and guarantee implementation of the ‘Nationalstandards’ of education.
As with all complex reform projects, there were many goals of the introduction ofthe Student Basket in Lithuania, all of which were linked and complementary to eachother, but not all of which are clearly stated. Thus, for example, the wording of the firstexpected result above suggests, but does not express unequivocally, a desire to achievehorizontal equity in education. Thus, identification of key goals of the reforms is to somedegree a maer of interpretation. Three main areas of expected results may be identifiedas follows:
1. Quality:Improvement of quality and ensuring complete aendance in schools were theprimary goal of the reform. Improved quality of education was foreseen to bethe result of beer effi ciency (leaving more funds for the education process) andof competition among schools with a real choice (so that schools would improvetheir education standards to aract students). Introduction of non-governmen-tal schools would also strengthen competition and introduce more diversity,leading to beer quality. Finally, by motivating schools to increase their enroll-ment and to draw in more students, MES hoped to obtain more relevant educa-tion and a reduction of dropouts.
2. Effi ciency:Effi ciency would be mainly improved through consolidation of school net-works, and through beer management at the school level due to increasedresponsibilities and autonomy of schools. It is also assumed that competitionamong schools would motivate the schools to more effi cient use of resources, to beer serve the teaching needs of students and thus to aract them.
3. Autonomy:Autonomy of schools would increase due to their financial independence andto strengthened responsibilities and positions of schools directors. Stability of
8/6/2019 Reforming Education Finance in Transition Countries
http://slidepdf.com/reader/full/reforming-education-finance-in-transition-countries 165/335
Reforming Education Finance in Transition Countries 141
funding provided by the Student Basket system will allow schools to beer plantheir activities and achieve beer effi ciency. School autonomy is the prerequi-site for school competition, and is therefore seen in Lithuania as an importanttool toward beer education.
In order to review how Lithuania tried to achieve those objectives and to assess thesuccess of this effort, we have to review first the design of the Student Basket and un-derstand how it was implemented in practice. Each of them is presented sequentially inthe next section.
5.3. The Design of the Funding Formula
Our discussion of the Student Basket is divided into three parts:
1. Legal framework within which the Student Basket was introduced, including
the determination of what is included in the basket and what is excluded.2. The place of the Student Basket within general public finances of Lithuania,including the growth of the pool of funds dedicated to the basket.
3. The formula for the Student Basket as it evolved over time (the detailed meth-odology is discussed in Annex A), including the internal structure of the basket.
5.3.1. Legal Framework
The introduction of the Student basket was preceded by very serious legislative prepara-tion, including amendments to the Law on Education, Budget Law, as well as numerousgovernment resolutions. In particular, the amended Law on Local Self Government,25 article 5, divides all the functions of local governments into four categories:
1. Independent functions,2. Assigned functions of limited independence,3. Delegated functions by the state, financed through targeted grants from the cen-
tral budget to local budgets.4. Contractual functions.
Whether a specific function is an independent function, assigned function, or del-egated function depends on sectoral legislation, not on general definitions in the Law onLocal Self Government, which distinguishes them mainly through the financing mecha-
nisms. Thus, independent functions arefi
nanced from local governments' own revenues(such as shared taxes, property tax, locally collected fees, etc.). Assigned functions arefinanced by grants received from the central budget. Delegated functions are financed by special grants.26 There are 27 such grants for different functions delegated to localgovernments, from social protection to education. Contractual functions are typicallywhen a municipality signs a contract with the central government to execute some in-vestment project.
Specifically, education functions are also divided among those categories (arts. 6, 7,and 8):
1. Independent education functions: preschools27; additional education (involve-
ment in after school activities and vocational training of children and youth);informal education of adults; provision of meals at preschools and generalschools.
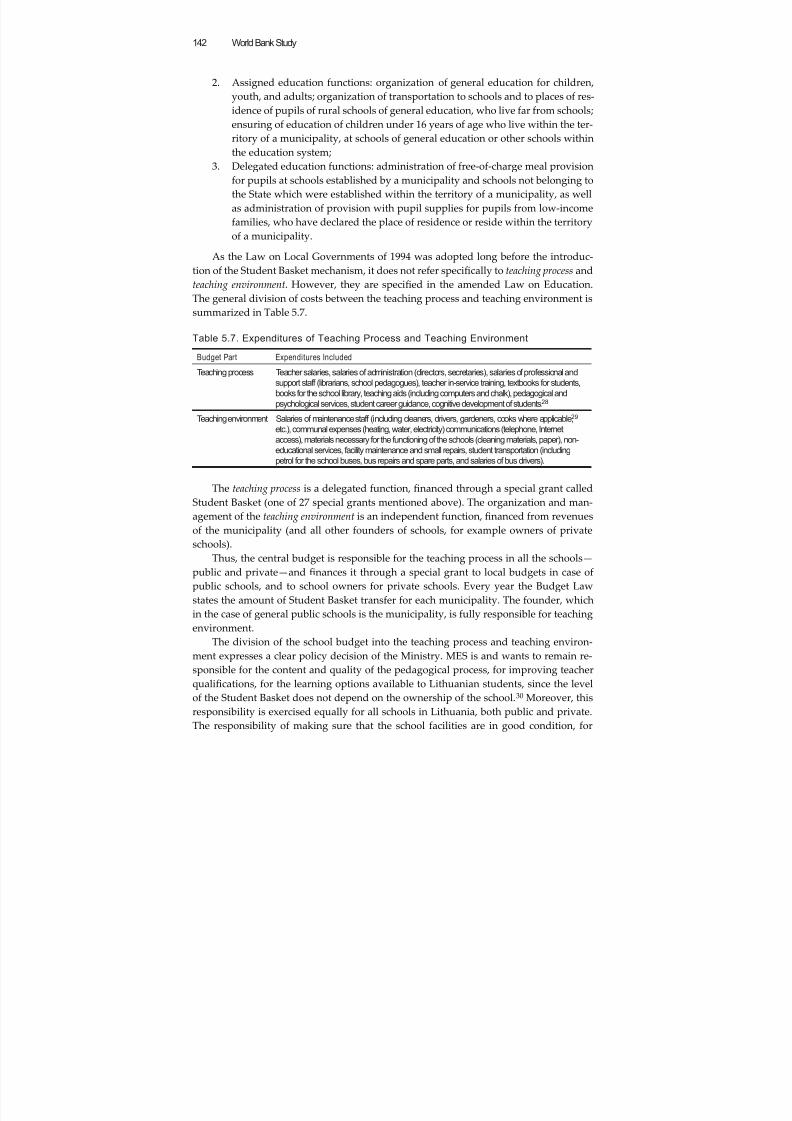
8/6/2019 Reforming Education Finance in Transition Countries
http://slidepdf.com/reader/full/reforming-education-finance-in-transition-countries 166/335
World Bank Study142
2. Assigned education functions: organization of general education for children,youth, and adults; organization of transportation to schools and to places of res-idence of pupils of rural schools of general education, who live far from schools;ensuring of education of children under 16 years of age who live within the ter-
ritory of a municipality, at schools of general education or other schools withinthe education system;
3. Delegated education functions: administration of free-of-charge meal provisionfor pupils at schools established by a municipality and schools not belonging tothe State which were established within the territory of a municipality, as wellas administration of provision with pupil supplies for pupils from low-incomefamilies, who have declared the place of residence or reside within the territoryof a municipality.
As the Law on Local Governments of 1994 was adopted long before the introduc-
tion of the Student Basket mechanism, it does not refer specifi
cally to teaching process andteaching environment. However, they are specified in the amended Law on Education.The general division of costs between the teaching process and teaching environment issummarized in Table 5.7.
Table 5.7. Expenditures of Teaching Process and Teaching Environment
Budget Part Expenditures Included
Teaching process Teacher salaries, salaries of administration (directors, secretaries), salaries of professional andsupport staff (librarians, school pedagogues), teacher in-service training, textbooks for students,books for the school library, teaching aids (including computers and chalk), pedagogical andpsychological services, student career guidance, cognitive development of students.28
Teaching environment Salaries of maintenance staff (including cleaners, drivers, gardeners, cooks where applicable,29 etc.), communal expenses (heating, water, electricity) communications (telephone, Internetaccess), materials necessary for the functioning of the schools (cleaning materials, paper), non-educational services, facility maintenance and small repairs, student transportation (includingpetrol for the school buses, bus repairs and spare parts, and salaries of bus drivers).
The teaching process is a delegated function, financed through a special grant calledStudent Basket (one of 27 special grants mentioned above). The organization and man-agement of the teaching environment is an independent function, financed from revenuesof the municipality (and all other founders of schools, for example owners of private
schools).Thus, the central budget is responsible for the teaching process in all the schools—public and private—and finances it through a special grant to local budgets in case ofpublic schools, and to school owners for private schools. Every year the Budget Lawstates the amount of Student Basket transfer for each municipality. The founder, whichin the case of general public schools is the municipality, is fully responsible for teachingenvironment.
The division of the school budget into the teaching process and teaching environ-ment expresses a clear policy decision of the Ministry. MES is and wants to remain re-sponsible for the content and quality of the pedagogical process, for improving teacher
qualifications, for the learning options available to Lithuanian students, since the levelof the Student Basket does not depend on the ownership of the school.30 Moreover, thisresponsibility is exercised equally for all schools in Lithuania, both public and private.The responsibility of making sure that the school facilities are in good condition, for
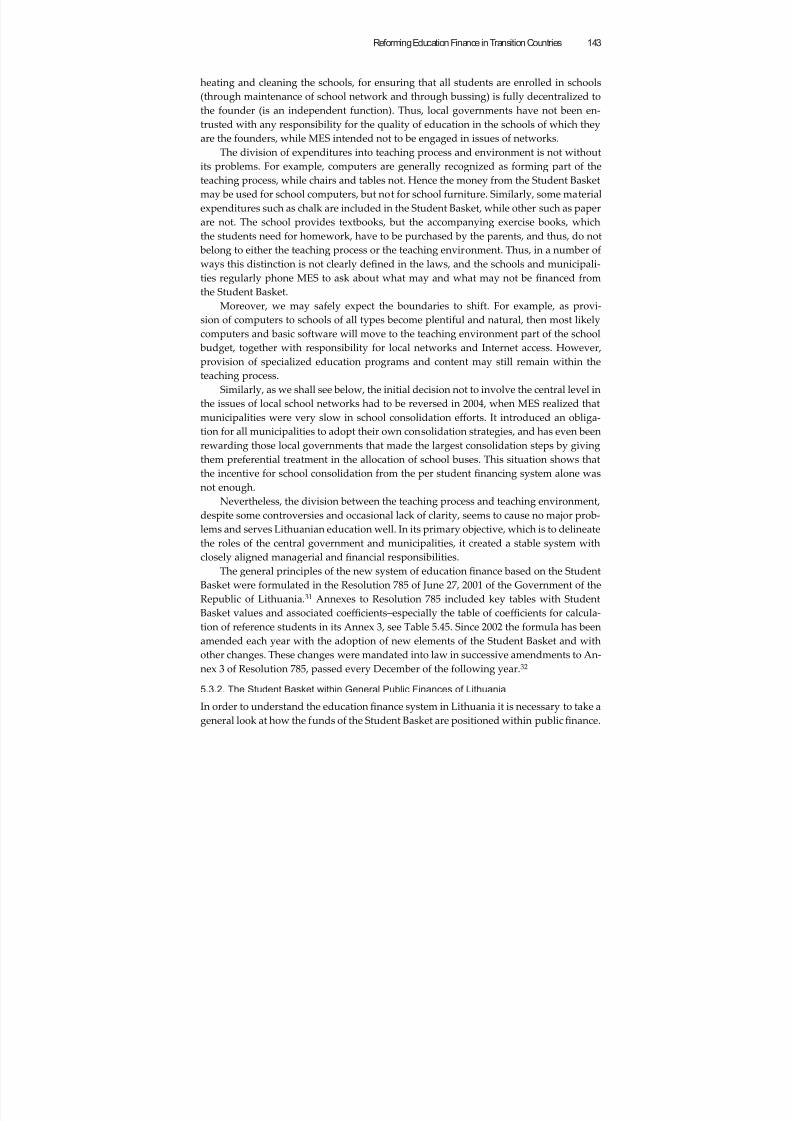
8/6/2019 Reforming Education Finance in Transition Countries
http://slidepdf.com/reader/full/reforming-education-finance-in-transition-countries 167/335
Reforming Education Finance in Transition Countries 143
heating and cleaning the schools, for ensuring that all students are enrolled in schools(through maintenance of school network and through bussing) is fully decentralized tothe founder (is an independent function). Thus, local governments have not been en-trusted with any responsibility for the quality of education in the schools of which they
are the founders, while MES intended not to be engaged in issues of networks.The division of expenditures into teaching process and environment is not without
its problems. For example, computers are generally recognized as forming part of theteaching process, while chairs and tables not. Hence the money from the Student Basketmay be used for school computers, but not for school furniture. Similarly, some materialexpenditures such as chalk are included in the Student Basket, while other such as paperare not. The school provides textbooks, but the accompanying exercise books, whichthe students need for homework, have to be purchased by the parents, and thus, do not belong to either the teaching process or the teaching environment. Thus, in a number ofways this distinction is not clearly defined in the laws, and the schools and municipali-
ties regularly phone MES to ask about what may and what may not be financed fromthe Student Basket.
Moreover, we may safely expect the boundaries to shift. For example, as provi-sion of computers to schools of all types become plentiful and natural, then most likelycomputers and basic software will move to the teaching environment part of the school budget, together with responsibility for local networks and Internet access. However,provision of specialized education programs and content may still remain within theteaching process.
Similarly, as we shall see below, the initial decision not to involve the central level inthe issues of local school networks had to be reversed in 2004, when MES realized thatmunicipalities were very slow in school consolidation efforts. It introduced an obliga-tion for all municipalities to adopt their own consolidation strategies, and has even beenrewarding those local governments that made the largest consolidation steps by givingthem preferential treatment in the allocation of school buses. This situation shows thatthe incentive for school consolidation from the per student financing system alone wasnot enough.
Nevertheless, the division between the teaching process and teaching environment,despite some controversies and occasional lack of clarity, seems to cause no major prob-lems and serves Lithuanian education well. In its primary objective, which is to delineate
the roles of the central government and municipalities, it created a stable system withclosely aligned managerial and financial responsibilities.The general principles of the new system of education finance based on the Student
Basket were formulated in the Resolution 785 of June 27, 2001 of the Government of theRepublic of Lithuania.31 Annexes to Resolution 785 included key tables with StudentBasket values and associated coeffi cients–especially the table of coeffi cients for calcula-tion of reference students in its Annex 3, see Table 5.45. Since 2002 the formula has beenamended each year with the adoption of new elements of the Student Basket and withother changes. These changes were mandated into law in successive amendments to An-nex 3 of Resolution 785, passed every December of the following year.32
5.3.2. The Student Basket within General Public Finances of Lithuania
In order to understand the education finance system in Lithuania it is necessary to take ageneral look at how the funds of the Student Basket are positioned within public finance.
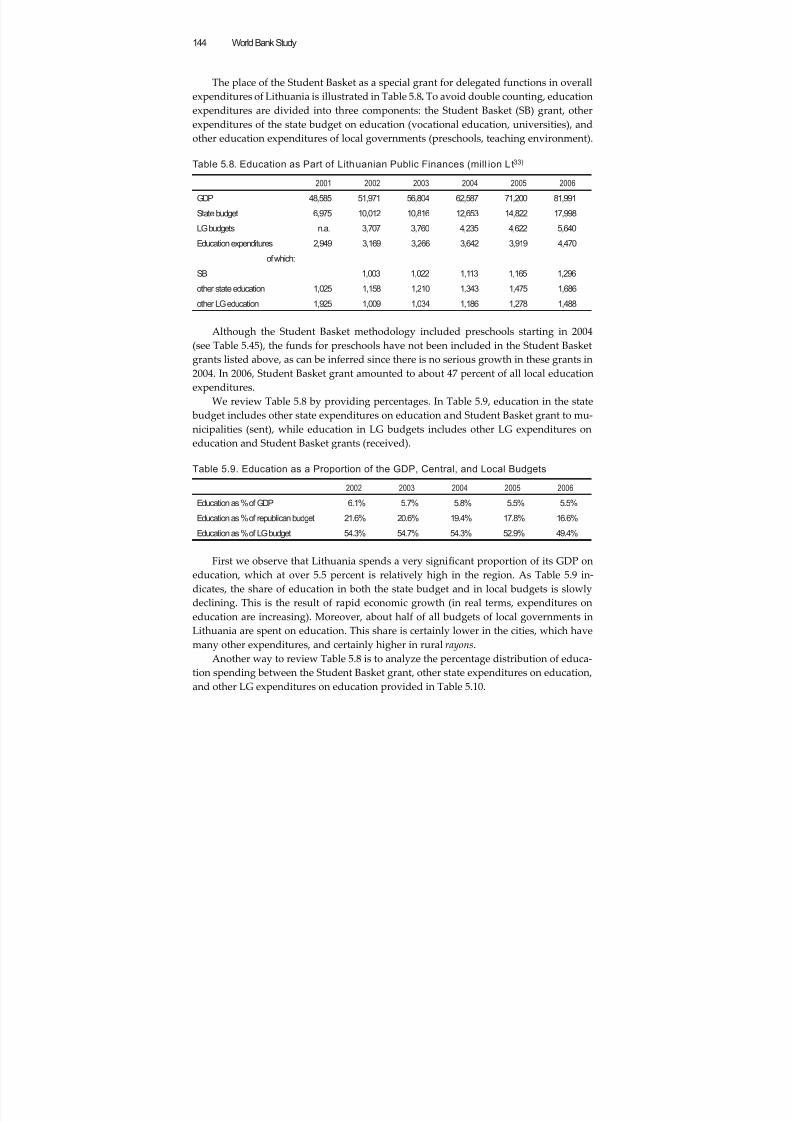
8/6/2019 Reforming Education Finance in Transition Countries
http://slidepdf.com/reader/full/reforming-education-finance-in-transition-countries 168/335
World Bank Study144
The place of the Student Basket as a special grant for delegated functions in overallexpenditures of Lithuania is illustrated in Table 5.8. To avoid double counting, educationexpenditures are divided into three components: the Student Basket (SB) grant, otherexpenditures of the state budget on education (vocational education, universities), and
other education expenditures of local governments (preschools, teaching environment).
Table 5.8. Education as Part of Lithuanian Public Finances (mill ion Lt33)
2001 2002 2003 2004 2005 2006
GDP 48,585 51,971 56,804 62,587 71,200 81,991
State budget 6,975 10,012 10,816 12,653 14,822 17,998
LG budgets n.a. 3,707 3,760 4,235 4,622 5,640
Education expenditures 2,949 3,169 3,266 3,642 3,919 4,470
of which:
SB 1,003 1,022 1,113 1,165 1,296other state education 1,025 1,158 1,210 1,343 1,475 1,686
other LG education 1,925 1,009 1,034 1,186 1,278 1,488
Although the Student Basket methodology included preschools starting in 2004(see Table 5.45), the funds for preschools have not been included in the Student Basketgrants listed above, as can be inferred since there is no serious growth in these grants in2004. In 2006, Student Basket grant amounted to about 47 percent of all local educationexpenditures.
We review Table 5.8 by providing percentages. In Table 5.9, education in the state
budget includes other state expenditures on education and Student Basket grant to mu-nicipalities (sent), while education in LG budgets includes other LG expenditures oneducation and Student Basket grants (received).
Table 5.9. Education as a Proportion of the GDP, Central, and Local Budgets
2002 2003 2004 2005 2006
Education as % of GDP 6.1% 5.7% 5.8% 5.5% 5.5%
Education as % of republican budget 21.6% 20.6% 19.4% 17.8% 16.6%
Education as % of LG budget 54.3% 54.7% 54.3% 52.9% 49.4%
First we observe that Lithuania spends a very significant proportion of its GDP oneducation, which at over 5.5 percent is relatively high in the region. As Table 5.9 in-dicates, the share of education in both the state budget and in local budgets is slowlydeclining. This is the result of rapid economic growth (in real terms, expenditures oneducation are increasing). Moreover, about half of all budgets of local governments inLithuania are spent on education. This share is certainly lower in the cities, which havemany other expenditures, and certainly higher in rural rayons.
Another way to review Table 5.8 is to analyze the percentage distribution of educa-tion spending between the Student Basket grant, other state expenditures on education,
and other LG expenditures on education provided in Table 5.10.
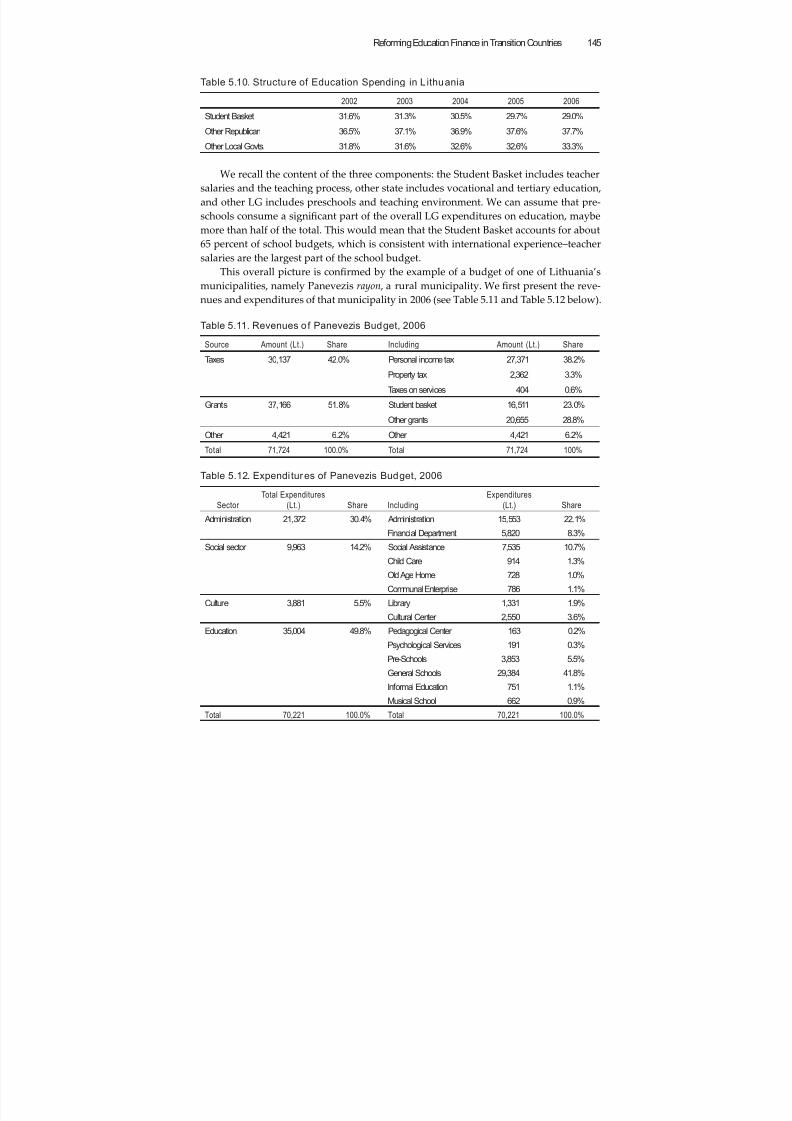
8/6/2019 Reforming Education Finance in Transition Countries
http://slidepdf.com/reader/full/reforming-education-finance-in-transition-countries 169/335
Reforming Education Finance in Transition Countries 145
Table 5.10. Structure of Education Spending in L ithuania
2002 2003 2004 2005 2006
Student Basket 31.6% 31.3% 30.5% 29.7% 29.0%
Other Republican 36.5% 37.1% 36.9% 37.6% 37.7%
Other Local Govts. 31.8% 31.6% 32.6% 32.6% 33.3%
We recall the content of the three components: the Student Basket includes teachersalaries and the teaching process, other state includes vocational and tertiary education,and other LG includes preschools and teaching environment. We can assume that pre-schools consume a significant part of the overall LG expenditures on education, maybemore than half of the total. This would mean that the Student Basket accounts for about65 percent of school budgets, which is consistent with international experience–teachersalaries are the largest part of the school budget.
This overall picture is confirmed by the example of a budget of one of Lithuania’smunicipalities, namely Panevezis rayon , a rural municipality. We first present the reve-nues and expenditures of that municipality in 2006 (see Table 5.11 and Table 5.12 below).
Table 5.11. Revenues of Panevezis Budget, 2006
Source Amount (Lt.) Share Including Amount (Lt.) Share
Taxes 30,137 42.0% Personal income tax 27,371 38.2%
Property tax 2,362 3.3%
Taxes on services 404 0.6%
Grants 37,166 51.8% Student basket 16,511 23.0%
Other grants 20,655 28.8%
Other 4,421 6.2% Other 4,421 6.2%
Total 71,724 100.0% Total 71,724 100%
Table 5.12. Expenditures of Panevezis Budget, 2006
Sector
Total Expenditures
(Lt.) Share Including
Expenditures
(Lt.) Share
Administration 21,372 30.4% Administration 15,553 22.1%
Financial Department 5,820 8.3%
Social sector 9,963 14.2% Social Assistance 7,535 10.7%Child Care 914 1.3%
Old Age Home 728 1.0%
Communal Enterprise 786 1.1%
Culture 3,881 5.5% Library 1,331 1.9%
Cultural Center 2,550 3.6%
Education 35,004 49.8% Pedagogical Center 163 0.2%
Psychological Services 191 0.3%
Pre-Schools 3,853 5.5%
General Schools 29,384 41.8%
Informal Education 751 1.1%Musical School 662 0.9%
Total 70,221 100.0% Total 70,221 100.0%
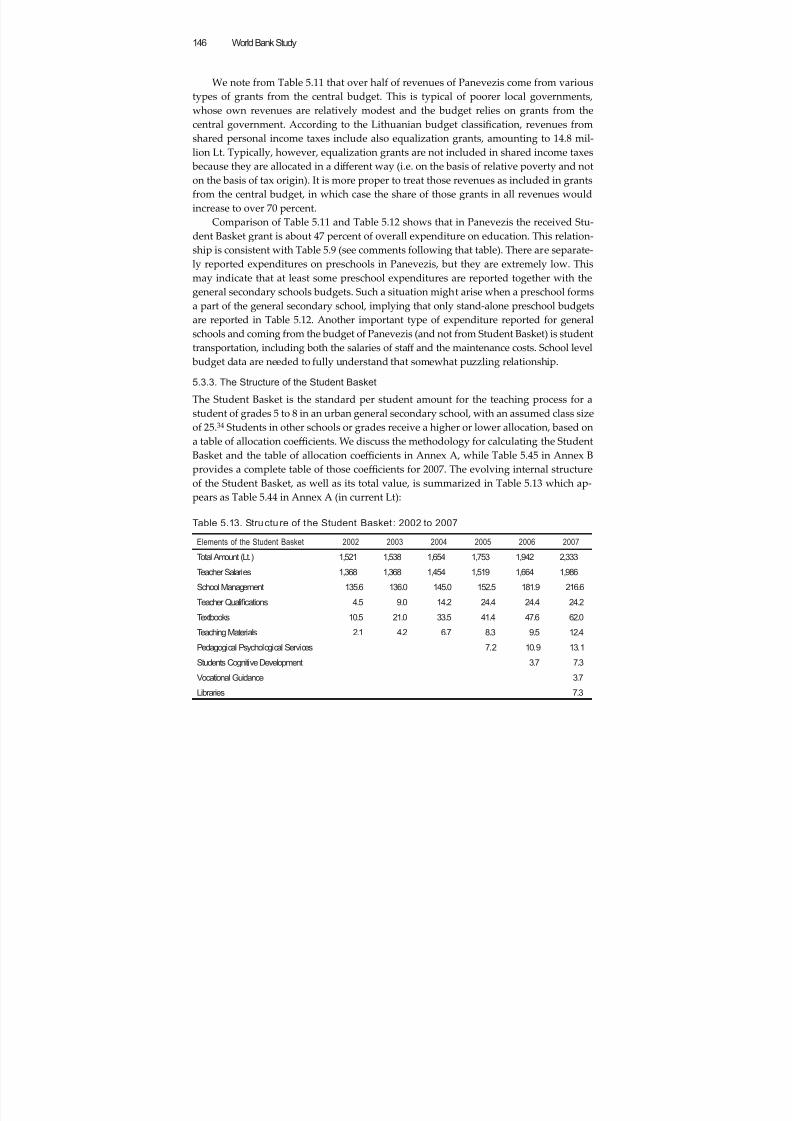
8/6/2019 Reforming Education Finance in Transition Countries
http://slidepdf.com/reader/full/reforming-education-finance-in-transition-countries 170/335
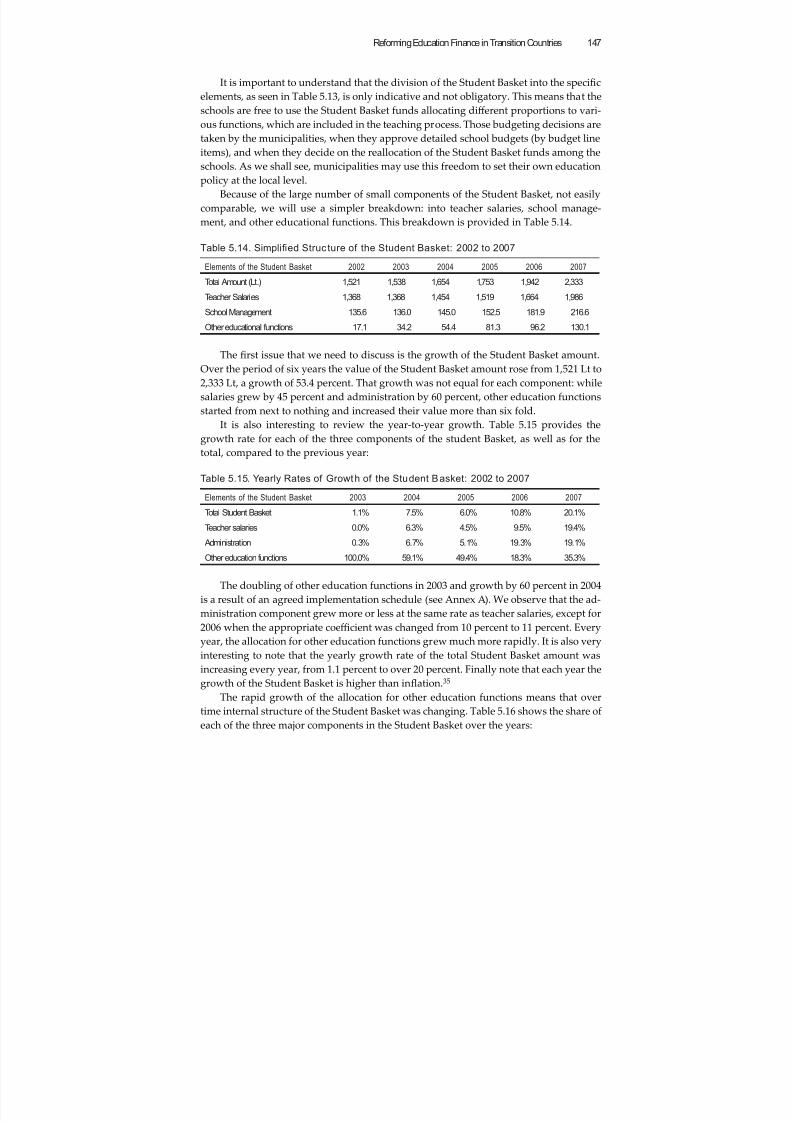
8/6/2019 Reforming Education Finance in Transition Countries
http://slidepdf.com/reader/full/reforming-education-finance-in-transition-countries 171/335
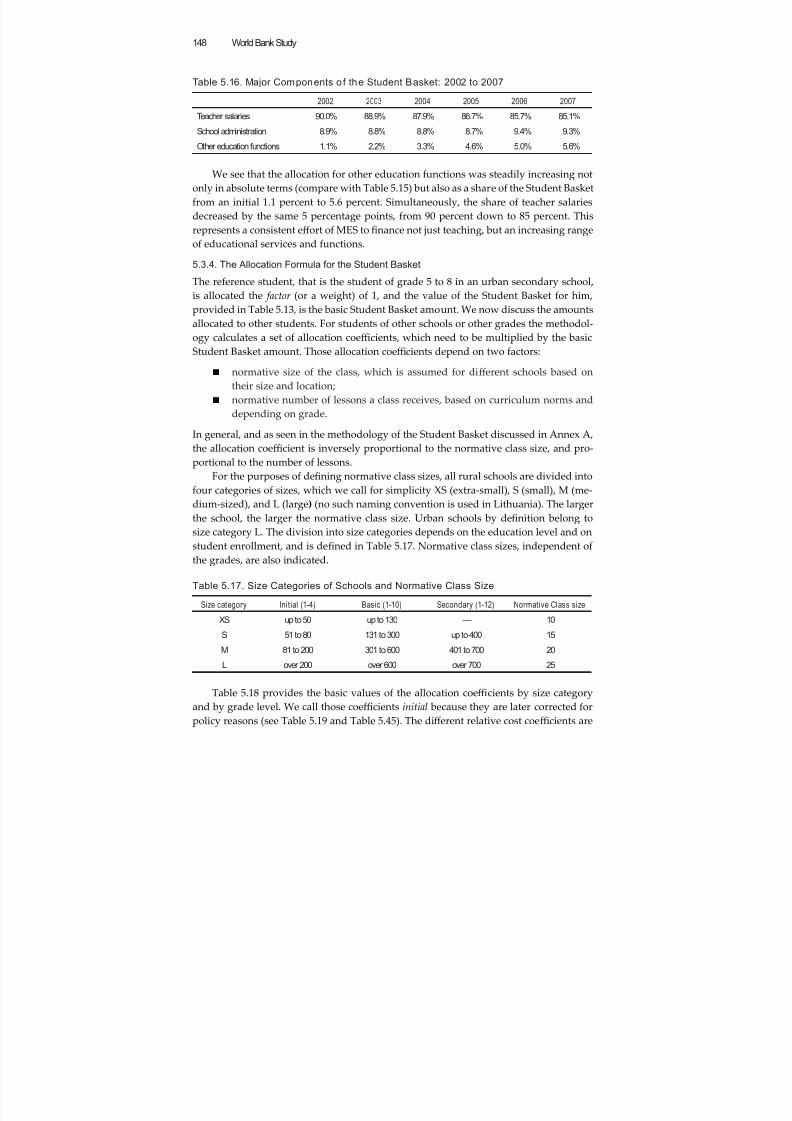
8/6/2019 Reforming Education Finance in Transition Countries
http://slidepdf.com/reader/full/reforming-education-finance-in-transition-countries 172/335
World Bank Study148
Table 5.16. Major Components o f the Student Basket: 2002 to 2007
2002 2003 2004 2005 2006 2007
Teacher salaries 90.0% 88.9% 87.9% 86.7% 85.7% 85.1%
School administration 8.9% 8.8% 8.8% 8.7% 9.4% 9.3%
Other education functions 1.1% 2.2% 3.3% 4.6% 5.0% 5.6%
We see that the allocation for other education functions was steadily increasing notonly in absolute terms (compare with Table 5.15) but also as a share of the Student Basketfrom an initial 1.1 percent to 5.6 percent. Simultaneously, the share of teacher salariesdecreased by the same 5 percentage points, from 90 percent down to 85 percent. Thisrepresents a consistent effort of MES to finance not just teaching, but an increasing rangeof educational services and functions.
5.3.4. The Allocation Formula for the Student Basket
The reference student, that is the student of grade 5 to 8 in an urban secondary school,is allocated the factor (or a weight) of 1, and the value of the Student Basket for him,provided in Table 5.13, is the basic Student Basket amount. We now discuss the amountsallocated to other students. For students of other schools or other grades the methodol-ogy calculates a set of allocation coeffi cients, which need to be multiplied by the basicStudent Basket amount. Those allocation coeffi cients depend on two factors:
■ normative size of the class, which is assumed for different schools based ontheir size and location;
■ normative number of lessons a class receives, based on curriculum norms and
depending on grade.
In general, and as seen in the methodology of the Student Basket discussed in Annex A,the allocation coeffi cient is inversely proportional to the normative class size, and pro-portional to the number of lessons.
For the purposes of defining normative class sizes, all rural schools are divided intofour categories of sizes, which we call for simplicity XS (extra-small), S (small), M (me-dium-sized), and L (large) (no such naming convention is used in Lithuania). The largerthe school, the larger the normative class size. Urban schools by definition belong tosize category L. The division into size categories depends on the education level and on
student enrollment, and is defined in Table 5.17. Normative class sizes, independent ofthe grades, are also indicated.
Table 5.17. Size Categories of Schools and Normative Class Size
Size category Initial (1-4) Basic (1-10) Secondary (1-12) Normative Class size
XS up to 50 up to 130 — 10
S 51 to 80 131 to 300 up to 400 15
M 81 to 200 301 to 600 401 to 700 20
L over 200 over 600 over 700 25
Table 5.18 provides the basic values of the allocation coeffi cients by size categoryand by grade level. We call those coeffi cients initial because they are later corrected forpolicy reasons (see Table 5.19 and Table 5.45). The different relative cost coeffi cients are
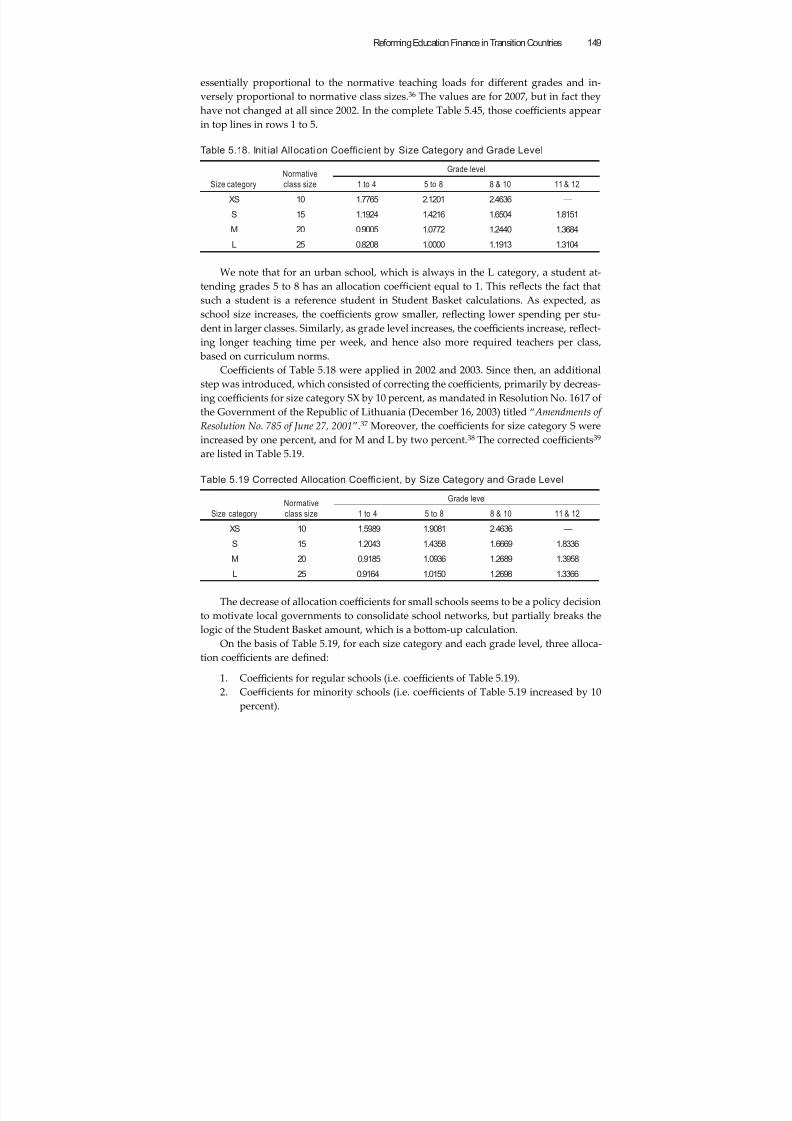
8/6/2019 Reforming Education Finance in Transition Countries
http://slidepdf.com/reader/full/reforming-education-finance-in-transition-countries 173/335
Reforming Education Finance in Transition Countries 149
essentially proportional to the normative teaching loads for different grades and in-versely proportional to normative class sizes.36 The values are for 2007, but in fact theyhave not changed at all since 2002. In the complete Table 5.45, those coeffi cients appearin top lines in rows 1 to 5.
Table 5.18. Init ial Allocation Coef fi c ient by Size Category and Grade Level
Size category
Normative
class size
Grade level
1 to 4 5 to 8 8 & 10 11 & 12
XS 10 1.7765 2.1201 2.4636 —
S 15 1.1924 1.4216 1.6504 1.8151
M 20 0.9005 1.0772 1.2440 1.3684
L 25 0.8208 1.0000 1.1913 1.3104
We note that for an urban school, which is always in the L category, a student at-tending grades 5 to 8 has an allocation coeffi cient equal to 1. This reflects the fact thatsuch a student is a reference student in Student Basket calculations. As expected, asschool size increases, the coeffi cients grow smaller, reflecting lower spending per stu-dent in larger classes. Similarly, as grade level increases, the coeffi cients increase, reflect-ing longer teaching time per week, and hence also more required teachers per class, based on curriculum norms.
Coeffi cients of Table 5.18 were applied in 2002 and 2003. Since then, an additionalstep was introduced, which consisted of correcting the coeffi cients, primarily by decreas-ing coeffi cients for size category SX by 10 percent, as mandated in Resolution No. 1617 of
the Government of the Republic of Lithuania (December 16, 2003) titled “ Amendments ofResolution No. 785 of June 27, 2001”.37 Moreover, the coeffi cients for size category S wereincreased by one percent, and for M and L by two percent.38 The corrected coeffi cients39 are listed in Table 5.19.
Table 5.19 Corrected Allocation Coef fi c ient, by Size Category and Grade Level
Size category
Normative
class size
Grade level
1 to 4 5 to 8 8 & 10 11 & 12
XS 10 1.5989 1.9081 2.4636 —
S 15 1.2043 1.4358 1.6669 1.8336
M 20 0.9185 1.0936 1.2689 1.3958
L 25 0.9164 1.0150 1.2698 1.3366
The decrease of allocation coeffi cients for small schools seems to be a policy decisionto motivate local governments to consolidate school networks, but partially breaks thelogic of the Student Basket amount, which is a boom-up calculation.
On the basis of Table 5.19, for each size category and each grade level, three alloca-tion coeffi cients are defined:
1. Coeffi cients for regular schools (i.e. coeffi cients of Table 5.19).2. Coeffi cients for minority schools (i.e. coeffi cients of Table 5.19 increased by 10
percent).
8/6/2019 Reforming Education Finance in Transition Countries
http://slidepdf.com/reader/full/reforming-education-finance-in-transition-countries 174/335
8/6/2019 Reforming Education Finance in Transition Countries
http://slidepdf.com/reader/full/reforming-education-finance-in-transition-countries 175/335
8/6/2019 Reforming Education Finance in Transition Countries
http://slidepdf.com/reader/full/reforming-education-finance-in-transition-countries 176/335
8/6/2019 Reforming Education Finance in Transition Countries
http://slidepdf.com/reader/full/reforming-education-finance-in-transition-countries 177/335
Reforming Education Finance in Transition Countries 153
dicted the goals of the reform and should be addressed because some municipalitieswere reducing their contributions to the teaching process by using the Student Basketfunds for other education purposes. According to AAT estimates, about 4.7 percent ofthe Student Basket allocation was not used for the teaching process. That recommenda-
tion was indeed adopted by MES in the amendment of the Law on Education, and since2004 any savings from the Student Basket may be used only for the teaching process.
Further criticism of AAT was that there were no criteria or methodologies for thereallocation of the Student Basket funds among the schools. It was recommended thatsuch criteria should be defined by MES, so that all financial decisions would be basedon a clear legal stipulation. However, MES did not issue such a methodology becauseit believes that different municipalities face many specific circumstances, and thereforethe municipal governments should have the authority and autonomy to decide on thereallocation on their own. In this MES strongly defended the right of local governmentsto define and pursue their local education policies, which may and should be different
in different counties and communities. Nevertheless, at least partially in reaction to AATcriticism, MES had reduced the margin of allowed reallocation from initial 15 percent tothe current five percent, as discussed above.
The report also criticized the large differences in the per student allocation formunicipalities, maintaining that one of the policy goals was to reduce the inequalitiesamong different local governments in education finance (see the review of those differ-ences in the following subsection). Again, this criticism was not accepted by MES, whichhad argued that some expenditure differences due to school organization and to teach-ing programs were justified, and has in fact maintained the main allocation coeffi cientsunchanged.
The report of AAT and subsequent decisions by MES testify to healthy open policydialogue in Lithuanian education. However, it is a pity that such a thorough review ofthe Student Basket was not repeated. In part this is needed because the Student Basketsystem has undergone major changes since 2003. However, the key issue is that MEShas lile independent assessment of the financing of schools. We will have the occasionto use below a later report by AAT on school network consolidation published in 2006.
5.4.2. Practical Functioning of the Student Basket in Municipalities
In the present subsection we take a look at the functioning of the Student Basket systemat the municipality level. We first discuss the actual allocation of Student Basket grants
to local governments, and then how they use of these funds.Regarding the determination of Student Basket grants to municipalities, it is clear
that because of the large number of allocation coeffi cients that were higher than 1 (seeTable 5.45), the actual per student allocation to municipalities was likely to be higherthan the Student Basket amount. This was indeed the case, as Table 5.20 shows for years2003 to 2007.51 We use the basic Student Basket amount (from Table 5.13), the nationalaverage per student allocation for the republic, the per student allocations for the mu-nicipality that received the lowest and the highest per student allocation, as well as theirrelation to the basic Student Basket amount.
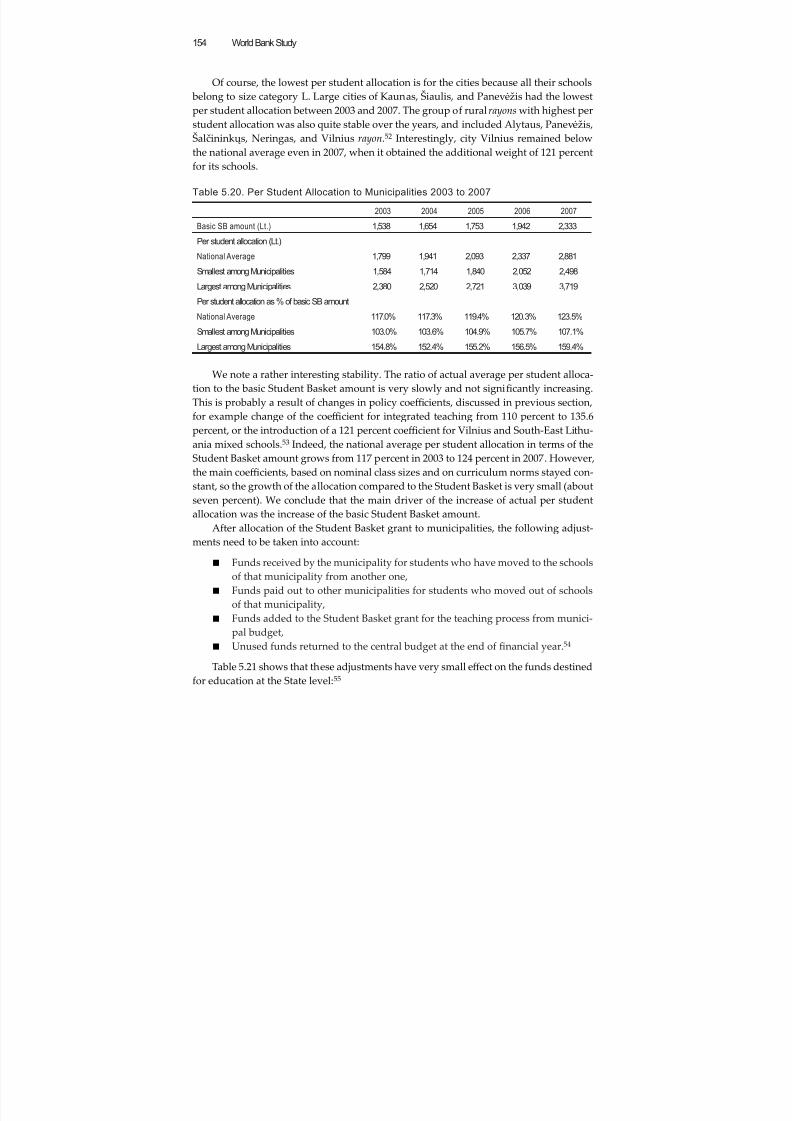
8/6/2019 Reforming Education Finance in Transition Countries
http://slidepdf.com/reader/full/reforming-education-finance-in-transition-countries 178/335
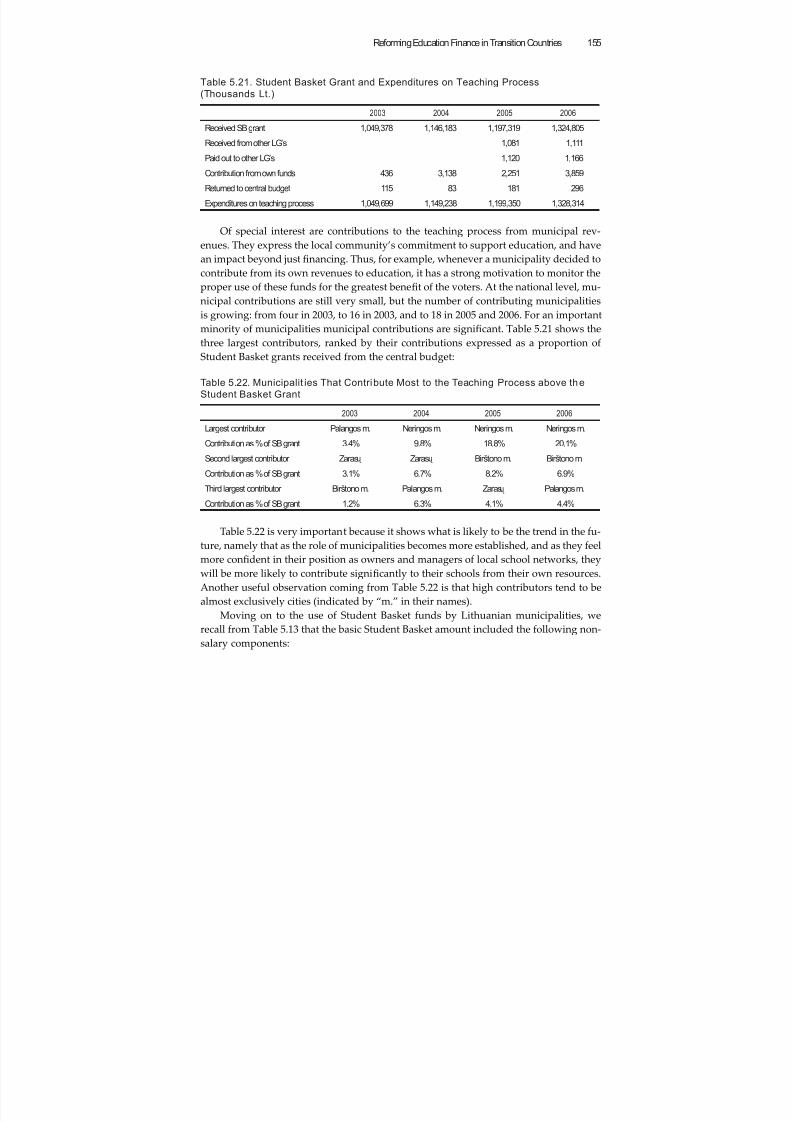
8/6/2019 Reforming Education Finance in Transition Countries
http://slidepdf.com/reader/full/reforming-education-finance-in-transition-countries 179/335
Reforming Education Finance in Transition Countries 155
Table 5.21. Student Basket Grant and Expenditures on Teaching Process
(Thousands Lt.)
2003 2004 2005 2006
Received SB grant 1,049,378 1,146,183 1,197,319 1,324,805
Received from other LG’s 1,081 1,111
Paid out to other LG’s 1,120 1,166
Contribution from own funds 436 3,138 2,251 3,859
Returned to central budget 115 83 181 296
Expenditures on teaching process 1,049,699 1,149,238 1,199,350 1,328,314
Of special interest are contributions to the teaching process from municipal rev-enues. They express the local community’s commitment to support education, and havean impact beyond just financing. Thus, for example, whenever a municipality decided to
contribute from its own revenues to education, it has a strong motivation to monitor theproper use of these funds for the greatest benefit of the voters. At the national level, mu-nicipal contributions are still very small, but the number of contributing municipalitiesis growing: from four in 2003, to 16 in 2003, and to 18 in 2005 and 2006. For an importantminority of municipalities municipal contributions are significant. Table 5.21 shows thethree largest contributors, ranked by their contributions expressed as a proportion ofStudent Basket grants received from the central budget:
Table 5.22. Municipalit ies That Contribute Most to the Teaching Process above the
Student Basket Grant
2003 2004 2005 2006
Largest contributor Palangos m. Neringos m. Neringos m. Neringos m.
Contribution as % of SB grant 3.4% 9.8% 18.8% 20.1%
Second largest contributor Zarasų Zarasų Birštono m. Birštono m.
Contribution as % of SB grant 3.1% 6.7% 8.2% 6.9%
Third largest contributor Birštono m. Palangos m. Zarasų Palangos m.
Contribution as % of SB grant 1.2% 6.3% 4.1% 4.4%
Table 5.22 is very important because it shows what is likely to be the trend in the fu-
ture, namely that as the role of municipalities becomes more established, and as they feelmore confident in their position as owners and managers of local school networks, theywill be more likely to contribute significantly to their schools from their own resources.Another useful observation coming from Table 5.22 is that high contributors tend to bealmost exclusively cities (indicated by “m.” in their names).
Moving on to the use of Student Basket funds by Lithuanian municipalities, werecall from Table 5.13 that the basic Student Basket amount included the following non-salary components:
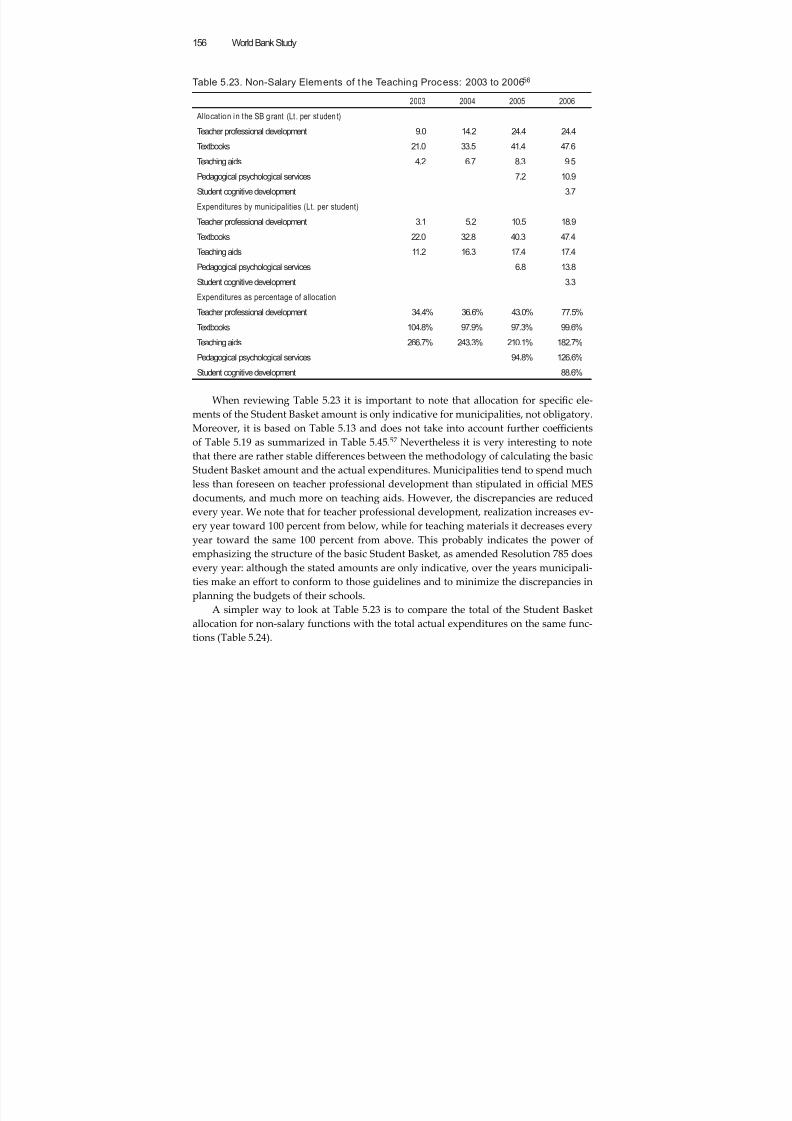
8/6/2019 Reforming Education Finance in Transition Countries
http://slidepdf.com/reader/full/reforming-education-finance-in-transition-countries 180/335
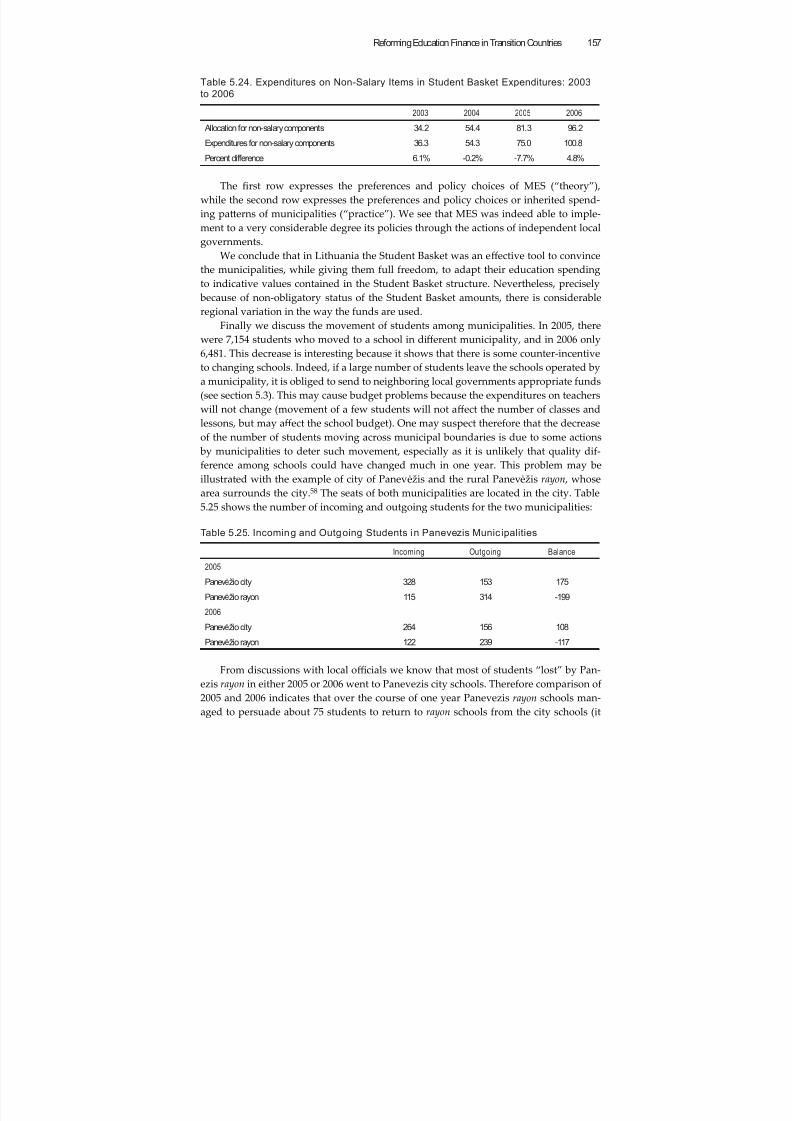
8/6/2019 Reforming Education Finance in Transition Countries
http://slidepdf.com/reader/full/reforming-education-finance-in-transition-countries 181/335
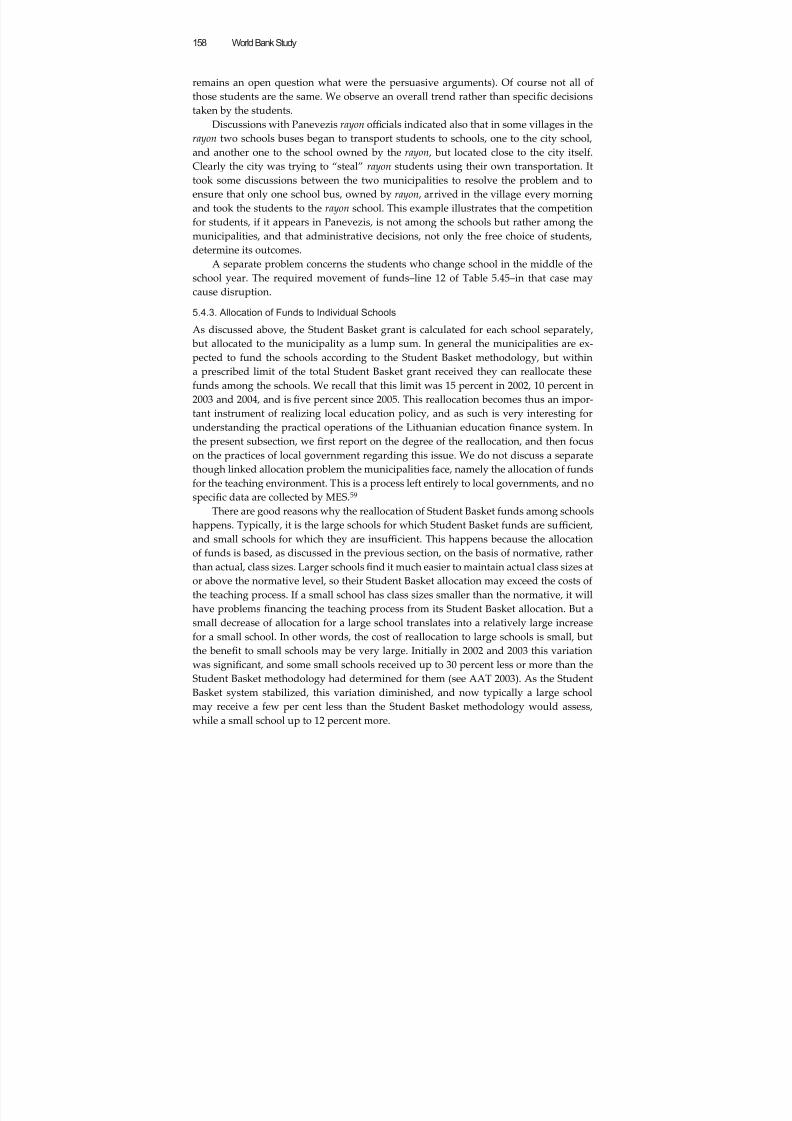
8/6/2019 Reforming Education Finance in Transition Countries
http://slidepdf.com/reader/full/reforming-education-finance-in-transition-countries 182/335
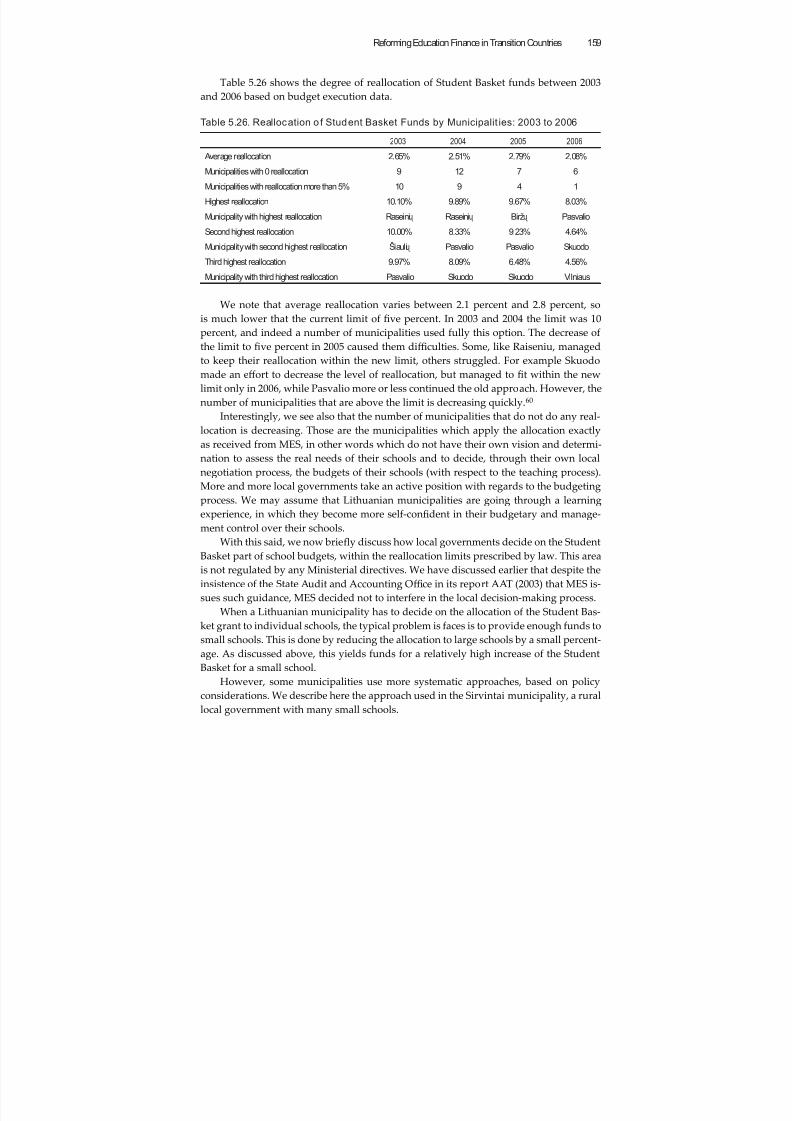
8/6/2019 Reforming Education Finance in Transition Countries
http://slidepdf.com/reader/full/reforming-education-finance-in-transition-countries 183/335
Reforming Education Finance in Transition Countries 159
Table 5.26 shows the degree of reallocation of Student Basket funds between 2003and 2006 based on budget execution data.
Table 5.26. Reallocation o f Student Basket Funds by Municipalit ies: 2003 to 2006
2003 2004 2005 2006
Average reallocation 2.65% 2.51% 2.79% 2.08%
Municipalities with 0 reallocation 9 12 7 6
Municipalities with reallocation more than 5% 10 9 4 1
Highest reallocation 10.10% 9.89% 9.67% 8.03%
Municipality with highest reallocation Raseinių Raseinių Biržų Pasvalio
Second highest reallocation 10.00% 8.33% 9.23% 4.64%
Municipality with second highest reallocation Šiaulių Pasvalio Pasvalio Skuodo
Third highest reallocation 9.97% 8.09% 6.48% 4.56%
Municipality with third highest reallocation Pasvalio Skuodo Skuodo Vilniaus
We note that average reallocation varies between 2.1 percent and 2.8 percent, sois much lower that the current limit of five percent. In 2003 and 2004 the limit was 10percent, and indeed a number of municipalities used fully this option. The decrease ofthe limit to five percent in 2005 caused them diffi culties. Some, like Raiseniu, managedto keep their reallocation within the new limit, others struggled. For example Skuodomade an effort to decrease the level of reallocation, but managed to fit within the newlimit only in 2006, while Pasvalio more or less continued the old approach. However, thenumber of municipalities that are above the limit is decreasing quickly.60
Interestingly, we see also that the number of municipalities that do not do any real-location is decreasing. Those are the municipalities which apply the allocation exactlyas received from MES, in other words which do not have their own vision and determi-nation to assess the real needs of their schools and to decide, through their own localnegotiation process, the budgets of their schools (with respect to the teaching process).More and more local governments take an active position with regards to the budgetingprocess. We may assume that Lithuanian municipalities are going through a learningexperience, in which they become more self-confident in their budgetary and manage-ment control over their schools.
With this said, we now briefly discuss how local governments decide on the StudentBasket part of school budgets, within the reallocation limits prescribed by law. This areais not regulated by any Ministerial directives. We have discussed earlier that despite theinsistence of the State Audit and Accounting Offi ce in its report AAT (2003) that MES is-sues such guidance, MES decided not to interfere in the local decision-making process.
When a Lithuanian municipality has to decide on the allocation of the Student Bas-ket grant to individual schools, the typical problem is faces is to provide enough funds tosmall schools. This is done by reducing the allocation to large schools by a small percent-age. As discussed above, this yields funds for a relatively high increase of the StudentBasket for a small school.
However, some municipalities use more systematic approaches, based on policyconsiderations. We describe here the approach used in the Sirvintai municipality, a rurallocal government with many small schools.
8/6/2019 Reforming Education Finance in Transition Countries
http://slidepdf.com/reader/full/reforming-education-finance-in-transition-countries 184/335
8/6/2019 Reforming Education Finance in Transition Countries
http://slidepdf.com/reader/full/reforming-education-finance-in-transition-countries 185/335
Reforming Education Finance in Transition Countries 161
does not change this. The schools have some limited freedom to choose additional ex-tracurricular activities according to the needs of students. However, it is still impossiblefor Lithuanian schools to compete with each other by adopting different curricula orexperimental pedagogical programs.
There is nevertheless a difference between the two models of accounting systems,and to review it we describe briefly the procedure that the school director has to gothrough when buying some piece of equipment or materials for his school (based ondiscussions with school directors):
■ Centralized accounting (non-autonomous schools):After a decision to buy some equipment or materials is taken, the school direc-tor needs to visit the supplier (most often a shop or wholesaler in Vilnius64),obtain the document for ordering the supplies, visit the municipal offi ce, havethe order document approved and signed by city accountant, return to the sup-
plier, order the purchase, and submit the invoices to the municipal authoritiesfor execution.
■ School based accounting (autonomous schools):After a decision to buy some equipment or materials is taken, the school ac-countant may issue an appropriate document certifying that funds for the pur-chase are available. With this document the director visits the supplier and buysthe supplies. The number of visits to the capital is thus reduced from two to one.
We see that the non-autonomous schools have to follow some archaic accountingprocedures inherited from the Soviet past, while autonomous schools have those pro-
cedures streamlined and rationalized. Even they, however, are severely limited in theirpedagogical and budgetary autonomy.
5.4.5. Consolidation of the School Network
Consolidation of the school network was one of key policy goals of the reform and it washoped that it would lead to improvement of life chances of students from rural schools(the two goals were stated together). We have seen in Table 5.3 the dramatic decrease inthe number of small initial schools (teaching grades 1 through 4), from 808 in the schoolyear 2000/2001 to just 114 in the school year 2005/2006. Table 5.27 below displays schoolsizes in the same period:
Table 5.27. Average School Sizes by School Type 2000 to 2005
2000/2001 2003/2004 2004/2005 2005/2006
Initial 48 74 124 203
Basic 116 186 196 194
Secondary 625 663 646 634
Gymnasium 856 821 817 760
All 270 328 381 396
We see, indeed, that consolidation of initial schools led to a dramatic increase oftheir average size from under 50 to over 200. The same is true of the results consolida-tion of teaching at grades 9 to 12.65 By reducing the number of full secondary schools,and transferring highest grades to larger secondary schools, the average size of both
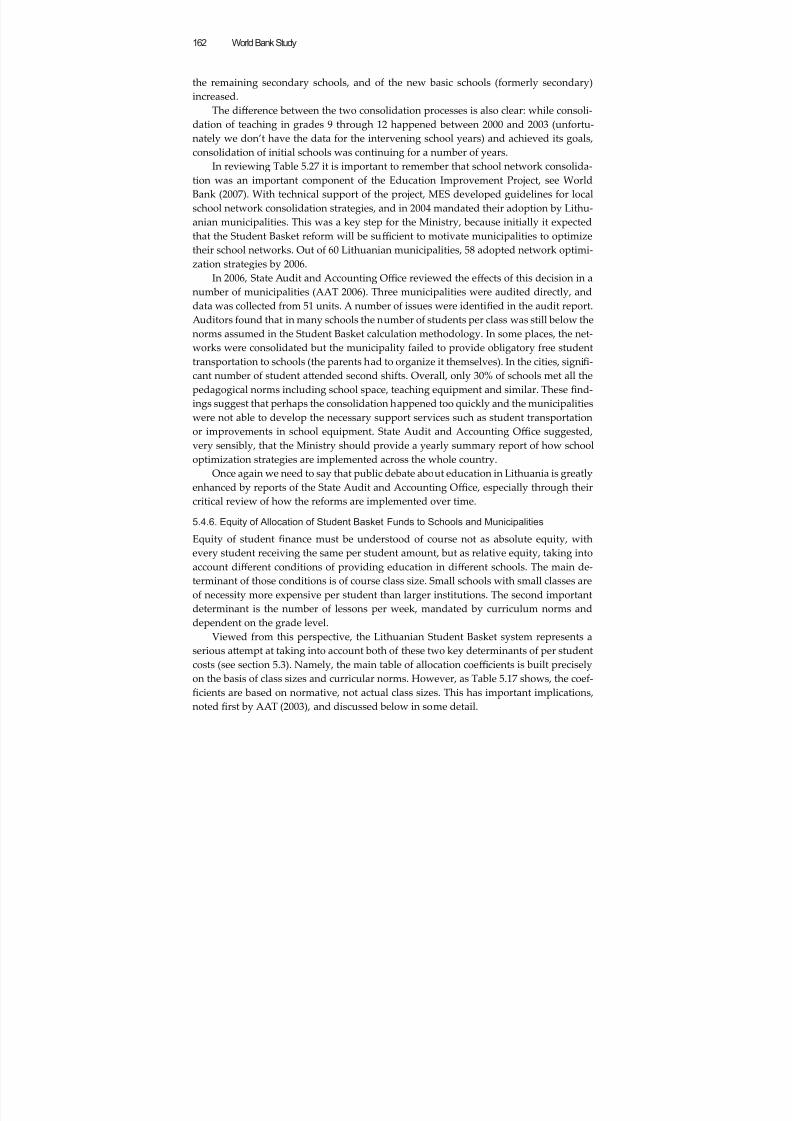
8/6/2019 Reforming Education Finance in Transition Countries
http://slidepdf.com/reader/full/reforming-education-finance-in-transition-countries 186/335
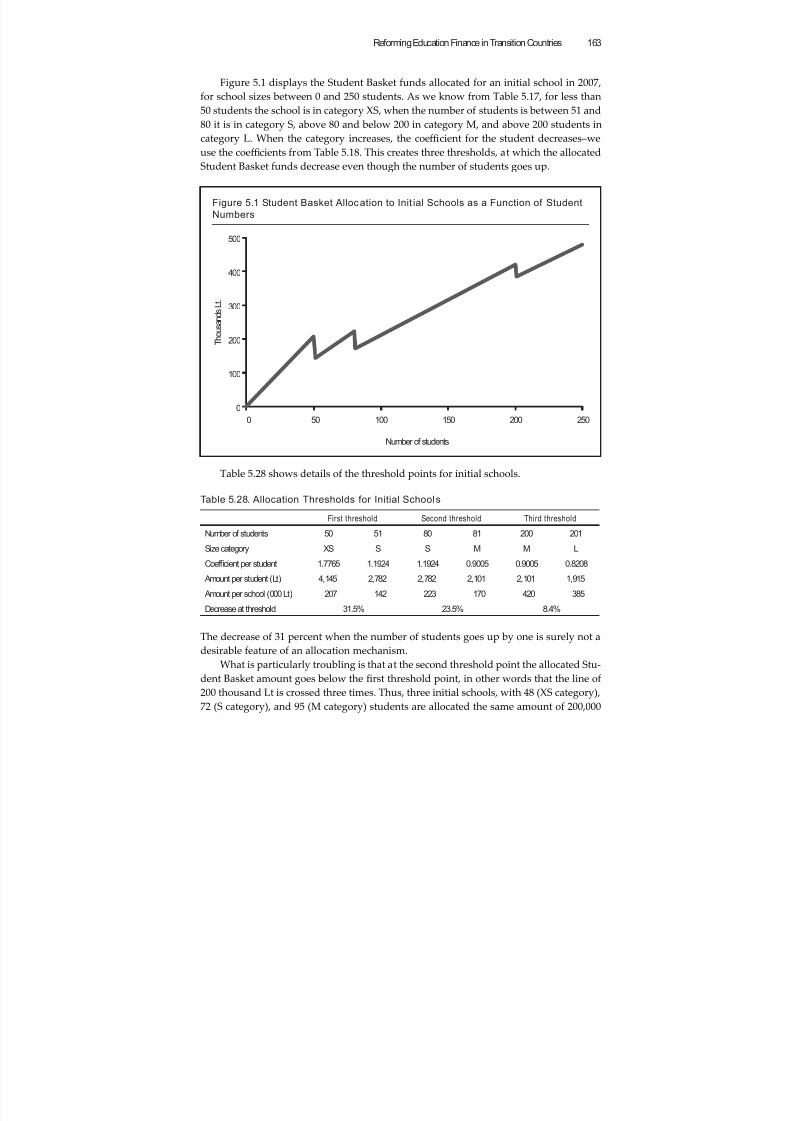
8/6/2019 Reforming Education Finance in Transition Countries
http://slidepdf.com/reader/full/reforming-education-finance-in-transition-countries 187/335
Reforming Education Finance in Transition Countries 163
Figure 5.1 displays the Student Basket funds allocated for an initial school in 2007,for school sizes between 0 and 250 students. As we know from Table 5.17, for less than50 students the school is in category XS, when the number of students is between 51 and80 it is in category S, above 80 and below 200 in category M, and above 200 students in
category L. When the category increases, the coeffi cient for the student decreases–weuse the coeffi cients from Table 5.18. This creates three thresholds, at which the allocatedStudent Basket funds decrease even though the number of students goes up.
Figure 5.1 Student Basket Allocation to Init ial Schools as a Function of Student
Numbers
0
100
200
300
400
500
0 50 100 150 200 250
T h o u s a n d s L t .
Number of students
Table 5.28 shows details of the threshold points for initial schools.
Table 5.28. Allocation Thresholds for Initial Schools
First threshold Second threshold Third threshold
Number of students 50 51 80 81 200 201
Size category XS S S M M LCoef ficient per student 1.7765 1.1924 1.1924 0.9005 0.9005 0.8208
Amount per student (Lt) 4,145 2,782 2,782 2,101 2,101 1,915
Amount per school (000 Lt) 207 142 223 170 420 385
Decrease at threshold 31.5% 23.5% 8.4%
The decrease of 31 percent when the number of students goes up by one is surely not adesirable feature of an allocation mechanism.
What is particularly troubling is that at the second threshold point the allocated Stu-dent Basket amount goes below the first threshold point, in other words that the line of200 thousand Lt is crossed three times. Thus, three initial schools, with 48 (XS category),72 (S category), and 95 (M category) students are allocated the same amount of 200,000
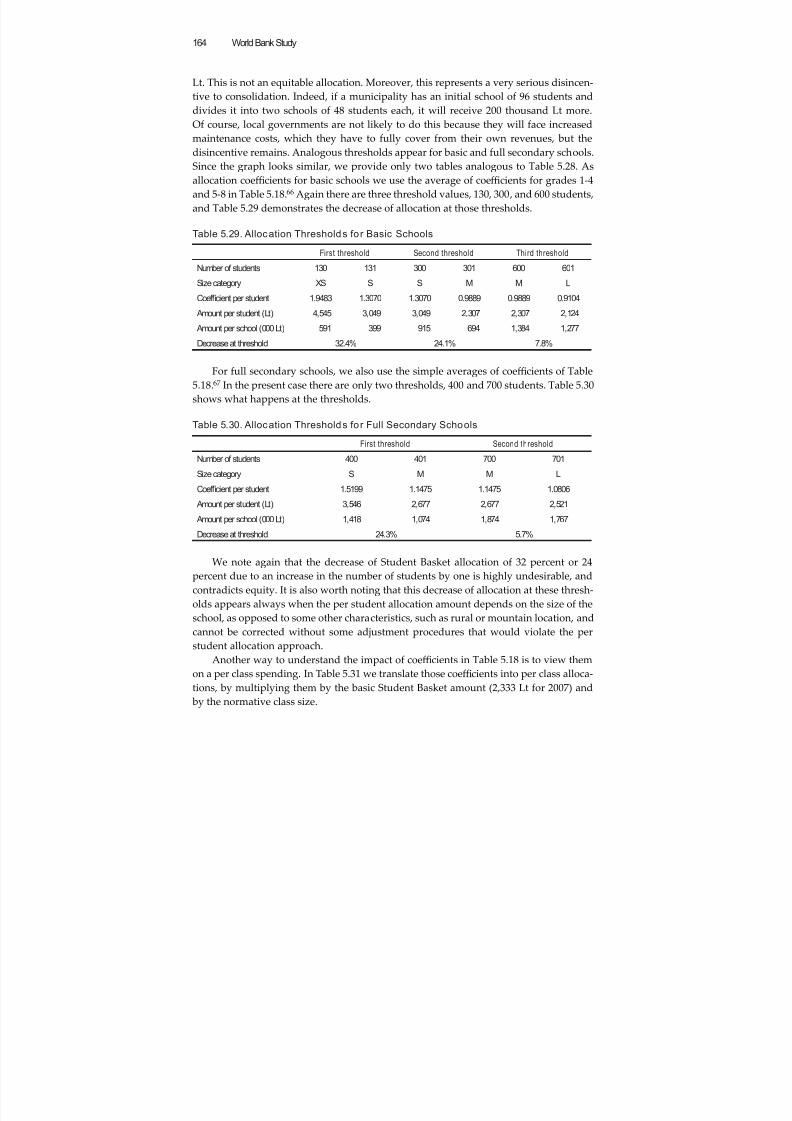
8/6/2019 Reforming Education Finance in Transition Countries
http://slidepdf.com/reader/full/reforming-education-finance-in-transition-countries 188/335
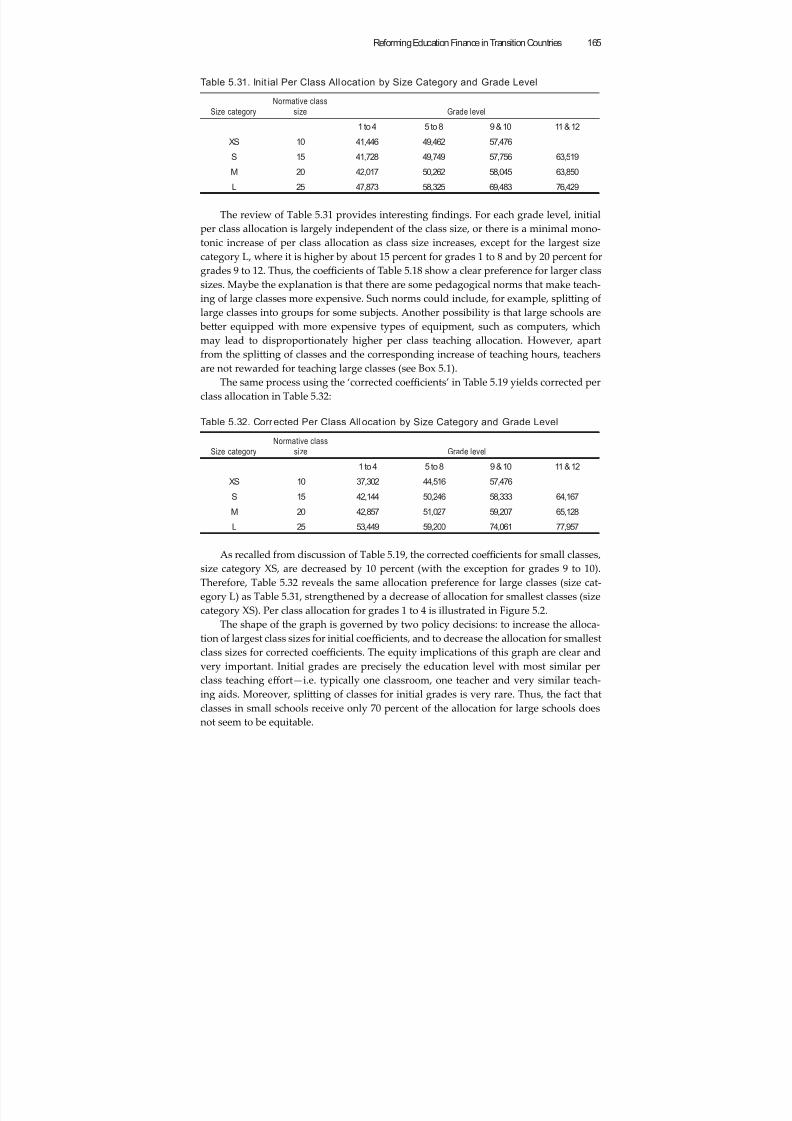
8/6/2019 Reforming Education Finance in Transition Countries
http://slidepdf.com/reader/full/reforming-education-finance-in-transition-countries 189/335
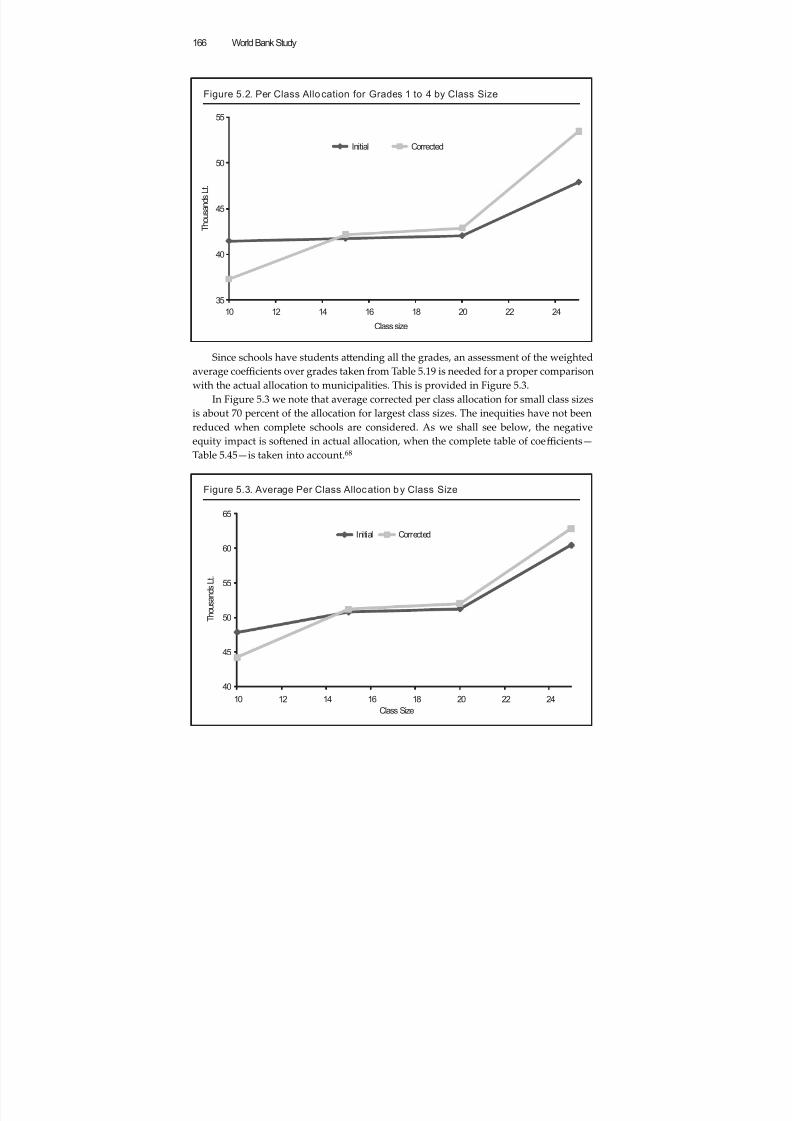
8/6/2019 Reforming Education Finance in Transition Countries
http://slidepdf.com/reader/full/reforming-education-finance-in-transition-countries 190/335
World Bank Study166
Since schools have students aending all the grades, an assessment of the weightedaverage coeffi cients over grades taken from Table 5.19 is needed for a proper comparisonwith the actual allocation to municipalities. This is provided in Figure 5.3.
In Figure 5.3 we note that average corrected per class allocation for small class sizes
is about 70 percent of the allocation for largest class sizes. The inequities have not beenreduced when complete schools are considered. As we shall see below, the negativeequity impact is softened in actual allocation, when the complete table of coeffi cients—Table 5.45—is taken into account.68
Figure 5.2. Per Class Allocation for Grades 1 to 4 by Class Size
35
40
45
50
55
10 12 14 16 18 20 22 24
T h o u s a n d s L t .
Class size
Initial Corrected
Figure 5.3. Average Per Class Allocation by Class Size
40
45
50
55
60
65
10 12 14 16 18 20 22 24
T h o u s a n d s L t .
Class Size
Initial Corrected
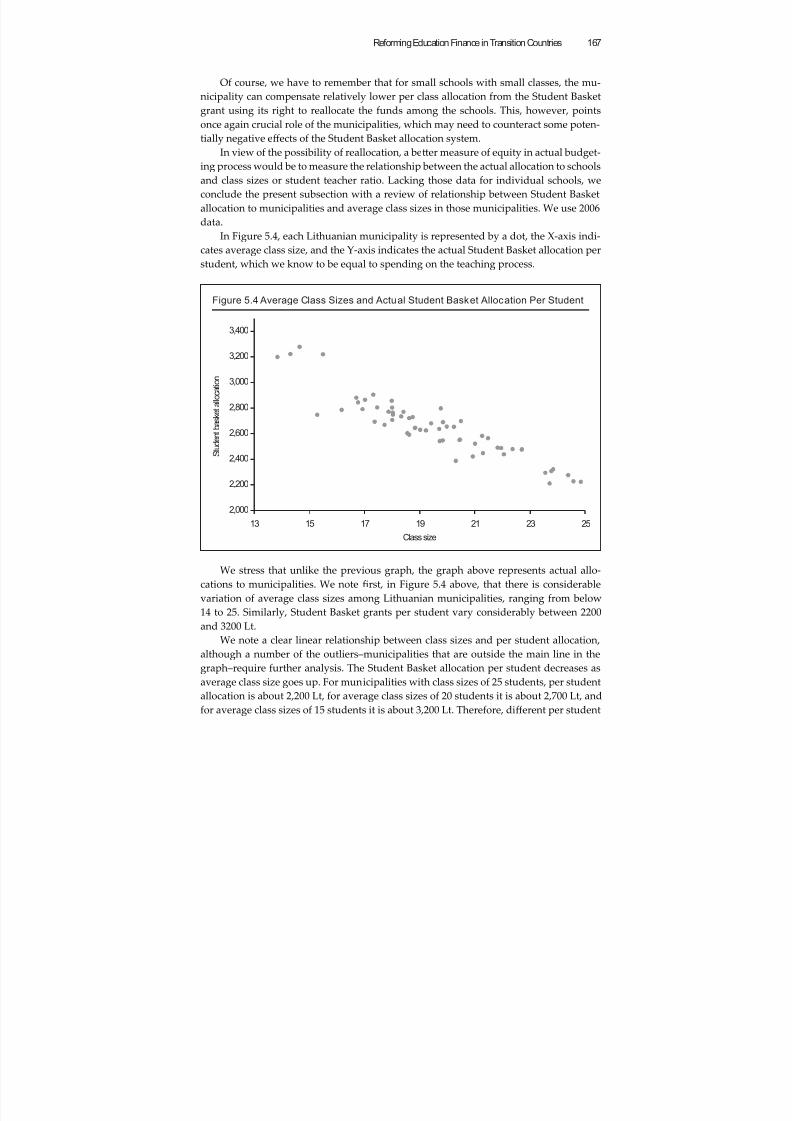
8/6/2019 Reforming Education Finance in Transition Countries
http://slidepdf.com/reader/full/reforming-education-finance-in-transition-countries 191/335
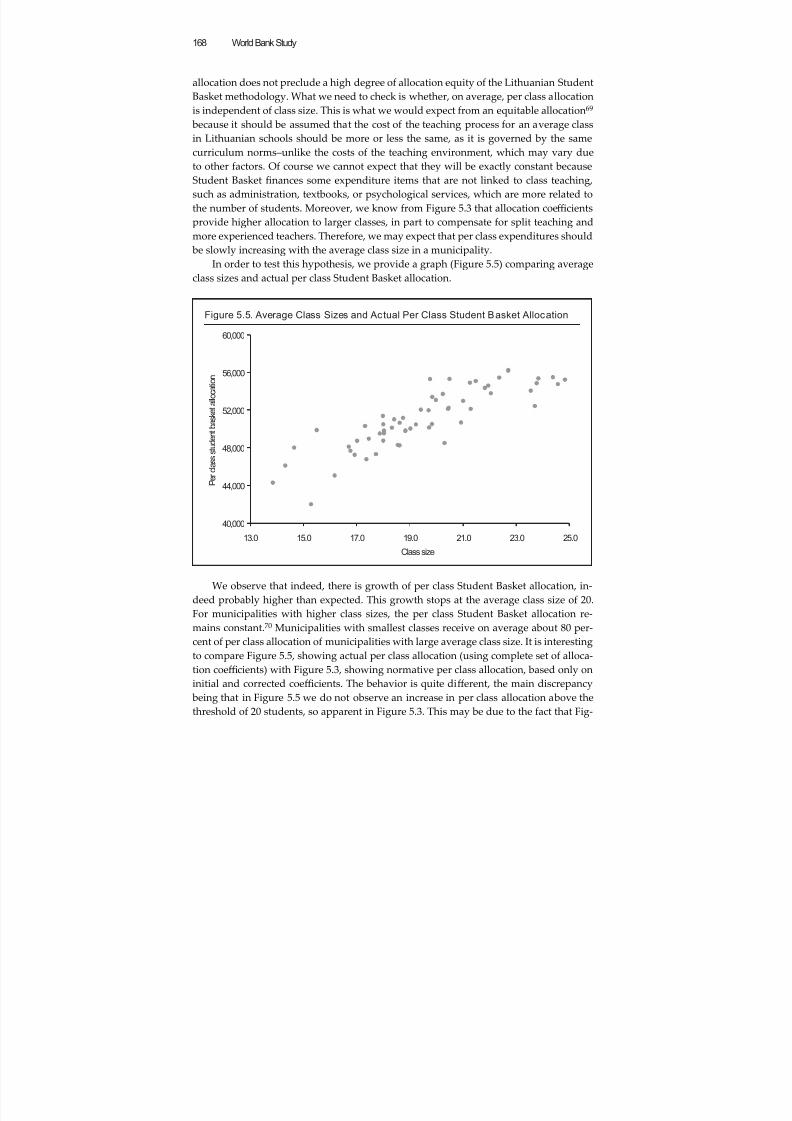
8/6/2019 Reforming Education Finance in Transition Countries
http://slidepdf.com/reader/full/reforming-education-finance-in-transition-countries 192/335
World Bank Study168
allocation does not preclude a high degree of allocation equity of the Lithuanian StudentBasket methodology. What we need to check is whether, on average, per class allocationis independent of class size. This is what we would expect from an equitable allocation69 because it should be assumed that the cost of the teaching process for an average class
in Lithuanian schools should be more or less the same, as it is governed by the samecurriculum norms–unlike the costs of the teaching environment, which may vary dueto other factors. Of course we cannot expect that they will be exactly constant becauseStudent Basket finances some expenditure items that are not linked to class teaching,such as administration, textbooks, or psychological services, which are more related tothe number of students. Moreover, we know from Figure 5.3 that allocation coeffi cientsprovide higher allocation to larger classes, in part to compensate for split teaching andmore experienced teachers. Therefore, we may expect that per class expenditures should be slowly increasing with the average class size in a municipality.
In order to test this hypothesis, we provide a graph (Figure 5.5) comparing average
class sizes and actual per class Student Basket allocation.
Figure 5.5. Average Class Sizes and Actual Per Class Student Basket Allocation
40,000
44,000
48,000
52,000
56,000
60,000
13.0 15.0 17.0 19.0 21.0 23.0 25.0
Class size
P e r c l a s s s t u d e n t b a s k e
t a l l o c a t i o n
We observe that indeed, there is growth of per class Student Basket allocation, in-deed probably higher than expected. This growth stops at the average class size of 20.For municipalities with higher class sizes, the per class Student Basket allocation re-mains constant.70 Municipalities with smallest classes receive on average about 80 per-cent of per class allocation of municipalities with large average class size. It is interestingto compare Figure 5.5, showing actual per class allocation (using complete set of alloca-tion coeffi cients) with Figure 5.3, showing normative per class allocation, based only on
initial and corrected coeffi cients. The behavior is quite different, the main discrepancy being that in Figure 5.5 we do not observe an increase in per class allocation above thethreshold of 20 students, so apparent in Figure 5.3. This may be due to the fact that Fig-
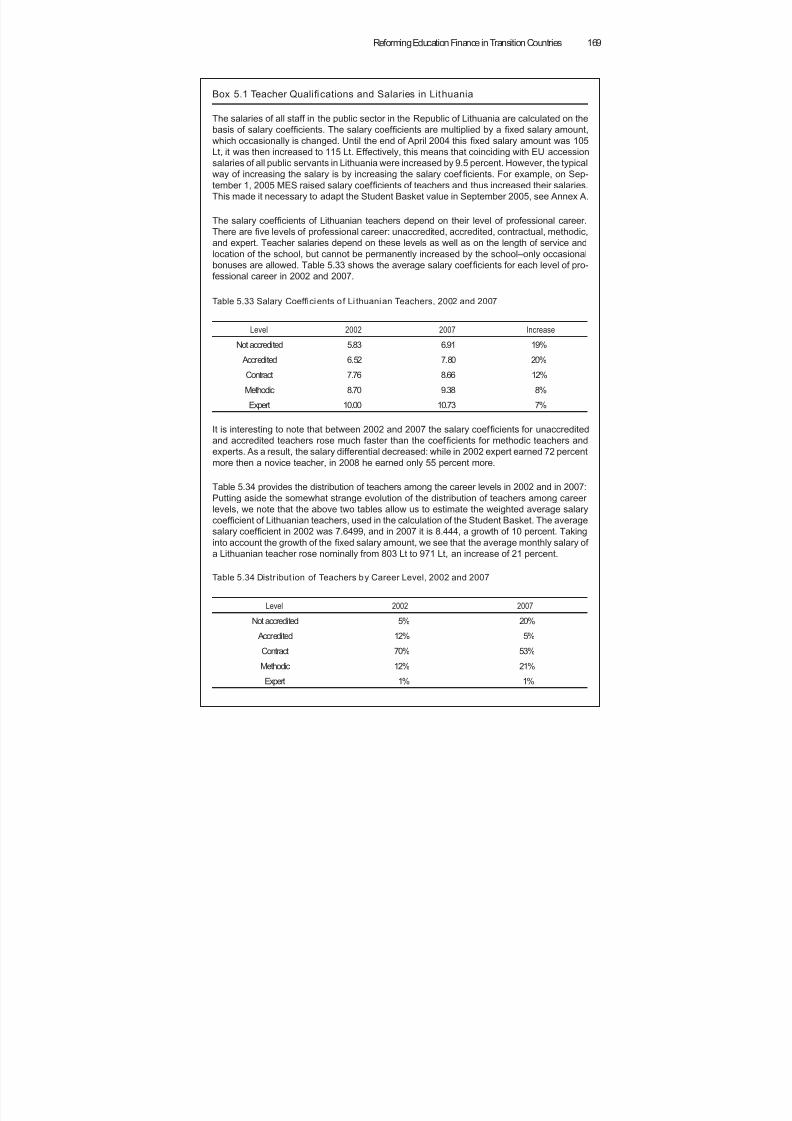
8/6/2019 Reforming Education Finance in Transition Countries
http://slidepdf.com/reader/full/reforming-education-finance-in-transition-countries 193/335
8/6/2019 Reforming Education Finance in Transition Countries
http://slidepdf.com/reader/full/reforming-education-finance-in-transition-countries 194/335
World Bank Study170
ure 5.5 exhibits in fact an average over different schools in each municipality, and evenin the municipalities with on average very large classes there are some schools withsmall classes too. This is also the reason, probably, why actual average per class alloca-tions are lower than normative allocations of Figure 5.3. Of course, those can be only
conjectures until a review of allocation for individual schools is undertaken.However, taking those two graphs into consideration, it seems that the Student Bas-
ket funding system in its practical application is more equitable than corrected coef-ficients—Table 5.32 and Figure 5.3—seem to imply. Indeed, we may conclude that thesystem is equitable for municipalities, whose average class size is over 19 students. Forrural municipalities with smaller class sizes, especially for those with average class be-low 16 students, the Student Basket system does not seem to provide suffi cient financingon a per class basis.
5.5. Assessment of Outcomes
The outcomes of the implementation of the Student Basket in Lithuania should be lookedat from two perspectives. On the one hand, it is important to analyze the impact of thereform on improvements in effi ciency, equity and transparency, all of which to somedegree are considered in the policy goals–and the expected results tied to them–statedat the beginning of the process. No less relevant is to review the other policy goals thatare less tied to these four broad themes and to assess whether they have been achieved,and to what extent.
We begin by recalling from section 5.2.1 the six results that were expected by MESfrom the Student Basket reform:
1. Greater effi ciency in the use of education funds through uniform principles oftheir allocation.
2. Improvement of education quality due to competition of schools for students.3. Increased enrollment rates due to care of schools for their students.4. Beer planning and management of education resources due to their transpar-
ency and predictability.5. Expansion of non-governmental schools and provision of choice of schools.6. Improvement of school networks.
We need to add also two policy objectives (numbers 7 and 9), as listed in section
5.2.1, as well as two more general objectives (numbers 8 and 10) typically accompanyingeducation finance reforms that are important for equity and transparency, respectively:
7. Equal opportunities to rural and urban students (goal 2 under section 5.2.1).8. Equity of education finance (general objective).9. Transparency of education finance (goal 6 under section 5.2.1).10. Accountability of public finance in education sector (general objective).
We now discuss these 10 points with subsections on effi ciency (point 1 and 6), equity(points 7 and 8) and transparency/accountability (points 4, 9 and 10), and then the otherexpected results (points 2, 3 and 5), which are either less directly related to these themes
or practically not at all.
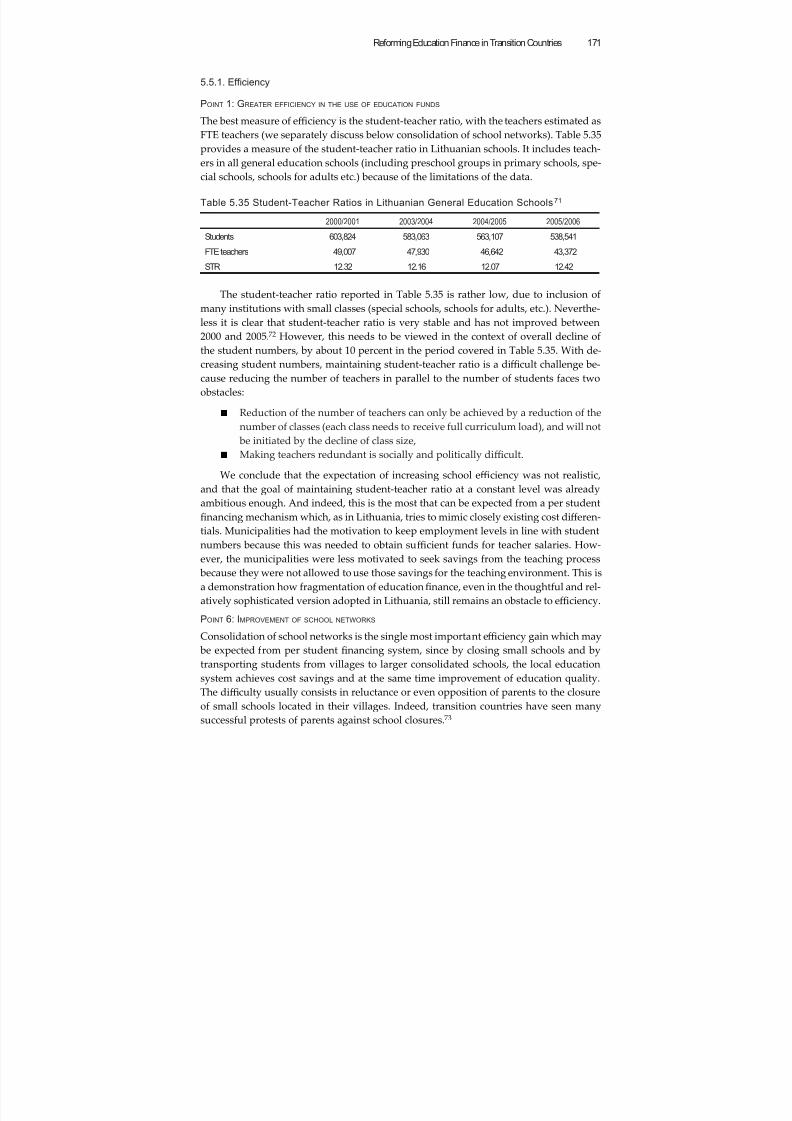
8/6/2019 Reforming Education Finance in Transition Countries
http://slidepdf.com/reader/full/reforming-education-finance-in-transition-countries 195/335
Reforming Education Finance in Transition Countries 171
5.5.1. Ef ficiency
POINT 1: GREATER EFFICIENCY IN THE USE OF EDUCATION FUNDS
The best measure of effi ciency is the student-teacher ratio, with the teachers estimated as
FTE teachers (we separately discuss below consolidation of school networks). Table 5.35provides a measure of the student-teacher ratio in Lithuanian schools. It includes teach-ers in all general education schools (including preschool groups in primary schools, spe-cial schools, schools for adults etc.) because of the limitations of the data.
Table 5.35 Student-Teacher Ratios in Lithuanian General Education Schools
71
2000/2001 2003/2004 2004/2005 2005/2006
Students 603,824 583,063 563,107 538,541
FTE teachers 49,007 47,930 46,642 43,372
STR 12.32 12.16 12.07 12.42
The student-teacher ratio reported in Table 5.35 is rather low, due to inclusion ofmany institutions with small classes (special schools, schools for adults, etc.). Neverthe-less it is clear that student-teacher ratio is very stable and has not improved between2000 and 2005.72 However, this needs to be viewed in the context of overall decline ofthe student numbers, by about 10 percent in the period covered in Table 5.35. With de-creasing student numbers, maintaining student-teacher ratio is a diffi cult challenge be-cause reducing the number of teachers in parallel to the number of students faces twoobstacles:
■ Reduction of the number of teachers can only be achieved by a reduction of thenumber of classes (each class needs to receive full curriculum load), and will not be initiated by the decline of class size,
■ Making teachers redundant is socially and politically diffi cult.
We conclude that the expectation of increasing school effi ciency was not realistic,and that the goal of maintaining student-teacher ratio at a constant level was alreadyambitious enough. And indeed, this is the most that can be expected from a per studentfinancing mechanism which, as in Lithuania, tries to mimic closely existing cost differen-tials. Municipalities had the motivation to keep employment levels in line with student
numbers because this was needed to obtain suffi cient funds for teacher salaries. How-ever, the municipalities were less motivated to seek savings from the teaching process because they were not allowed to use those savings for the teaching environment. This isa demonstration how fragmentation of education finance, even in the thoughtful and rel-atively sophisticated version adopted in Lithuania, still remains an obstacle to effi ciency.
POINT 6: IMPROVEMENT OF SCHOOL NETWORKS
Consolidation of school networks is the single most important effi ciency gain which may be expected from per student financing system, since by closing small schools and bytransporting students from villages to larger consolidated schools, the local educationsystem achieves cost savings and at the same time improvement of education quality.The diffi culty usually consists in reluctance or even opposition of parents to the closureof small schools located in their villages. Indeed, transition countries have seen manysuccessful protests of parents against school closures.73
8/6/2019 Reforming Education Finance in Transition Countries
http://slidepdf.com/reader/full/reforming-education-finance-in-transition-countries 196/335
8/6/2019 Reforming Education Finance in Transition Countries
http://slidepdf.com/reader/full/reforming-education-finance-in-transition-countries 197/335
8/6/2019 Reforming Education Finance in Transition Countries
http://slidepdf.com/reader/full/reforming-education-finance-in-transition-countries 198/335
8/6/2019 Reforming Education Finance in Transition Countries
http://slidepdf.com/reader/full/reforming-education-finance-in-transition-countries 199/335
Reforming Education Finance in Transition Countries 175
were allocated or used by various agents (central or local authorities, schools), they candemand explanations and clarifications, and through a democratic process may influ-ence future allocation or expenditure decisions. The required explanations will typically be arguments of what the agent tried to achieve, and what were the results obtained. In
some special cases accountability may also include holding decision makers responsiblefor misuse of funds or for corruption.
The limited budgetary autonomy of schools means that financial accountability ofschool directors to education stakeholders is not an important issue. The main elementof financial accountability of school directors is their obligation to the municipalities tomaintain budget discipline.
Municipalities are responsible for important budgetary decisions in the sector, soholding them accountable is needed. However, it seems that the main process of holdingthem accountable is local elections. School communities are too weak and don’t knowenough about education finance to engage in serious discussions with municipal offi -
cials over the allocation and use of funds. The school councils exist at some schools, buttheir role in seing or monitoring the budgetary process is minimal.
Three institutions may hold MES accountable for their allocative decisions in pre-university education: Ministry of Finance, State Audit and Accounting Offi ce, and theassociation of local governments. The primary focus of the Ministry of Finance is theproper use of funds and the budgetary discipline. It has no particular opinion or inter-est in the allocation issues of public funds for schools, although it remains very closelyinvolved in the discussions regarding the evolution of the Student Basket.
The State Audit and Accounting Offi ce is the national institution responsible forchecking the correctness of activities of other public bodies, both in the sphere of financeand of policymaking. In the implementation process of Student Basket reforms, AAT hasperformed an invaluable function by providing a comprehensive early critical report ofthe Student Basket in 2003. However, it has not returned to those issues since then. TheAAT point of view, even if at times rather strict (and not always accepted by MES, seediscussions of section 5.4), is useful because unlike MES of Finance and the Association,it was not involved in the process of preparing the reform and drafting of Student Basketmethodology. Therefore accountability will be much improved if the AAT would under-take more regular reviews of the functioning of the Student Basket.
This leaves us with the Association of Local Governments. In my view the Associa-
tion has a unique role to play in monitoring educationfi
nance, in particular the StudentBasket allocation methodology, to demand explanations and to propose amendments.Throughout the chapter we stressed the role and relevance of Lithuanian municipali-ties in education. They have become the most important education stakeholders besidesMES. And in fact the association is very active in this area. However, due in part to thespecific consensual nature of Lithuanian politics, these activities are performed more inclosed-door discussions than in public reports and in the media. The Association hasnot developed yet its own capacities to analyze the Student Basket methodology and toreview potential consequences of various amendments to it. Municipalities have benefit-ed, of course, from Student Basket reforms and naturally support them. However, they
are also more interested than anyone else to improve the system, to correct the mistakes,and to make it more transparent and predictable. They also are in the best position in thecountry to demand that MES explains clearly what it is doing.
8/6/2019 Reforming Education Finance in Transition Countries
http://slidepdf.com/reader/full/reforming-education-finance-in-transition-countries 200/335
8/6/2019 Reforming Education Finance in Transition Countries
http://slidepdf.com/reader/full/reforming-education-finance-in-transition-countries 201/335
8/6/2019 Reforming Education Finance in Transition Countries
http://slidepdf.com/reader/full/reforming-education-finance-in-transition-countries 202/335
World Bank Study178
for each school, but allocated to municipalities with the right to reallocate), de-tailed design of the formulas, changes in budget laws and in the laws regulat-ing the obligations of the municipalities. Those preparations created a group ofknowledgeable experts who have been able to monitor the system and provide
regular feedback, and allowed MES to manage the evolution of the system fromyear to year.
2. On the basis of the early preparations there was no need to introduce a pilotproject in a selected part of the country, or test selected elements of the new sys-tem. Instead, MES relied on good monitoring procedures and on the experienceacquired during the preparations to adjust the Student basket system as prob-lems arose. The use of an early critical report by the State Audit and AccountingOffi ce in 2003 was particularly important.
3. Nevertheless, there have been no public assessments of the Student Basket sys-tem undertaken since 2003. All the policy discussions are restricted to a group
of experts and have not become a maer of public debate.81 MES has not pub-lished publicly any assessment, either its own or prepared by independent con-sultants, of which goals of the reform were reached, which were not reached,and what it plans to do next. Such assessment may then invite needed publicdiscussions, for example the association of local governments or teacher tradeunions may have different perspectives on the achievements and problems ofthe reform.
4. The arithmetic complexity of the allocation formula had a clear negative im-pact on the implementation process. This is the case despite the fact that ba-sic principles of the Student Basket system are simple and easy to explain anddefend. These principles are, however, implemented in an excessively compli-cated and cumbersome manner, as the Student Basket coeffi cients of Table 5.45clearly show. The number of people who understand the details of the StudentBasket system and are aware of the possible consequences of various potentialincremental changes is very small. Even the authors of the offi cial audit havestruggled with the complexities of the formulas. Consequently, the changes inthe methodology of the Student Basket were not subject to policy discussions,and the system is becoming more and more complex every year.
5. The implementation process shows increasingly an active aitude of local gov-
ernments toward the management andfi
nancing of their schools. There seemsto be a learning phase of a few years that is necessary for local offi cials to getaccustomed to new tasks, understand the different needs of their schools, andadopt some form of local education strategy. However, the Lithuanian experi-ence shows that a real transfer of responsibilities, and not just a limited pilot, isnecessary for this learning process to be effective.
System design:
1. The Lithuanian education finance system is a very interesting aempt to definea middle road between what is usually called decentralization to schools anddecentralization to local governments.82 However, it seems that municipalities
become more assertive over time, and therefore that the future evolution of thesystem is likely to lead to more municipal involvement, financing, and respon-sibilities. The slow progress of increasing budgetary autonomy of schools is an
8/6/2019 Reforming Education Finance in Transition Countries
http://slidepdf.com/reader/full/reforming-education-finance-in-transition-countries 203/335
Reforming Education Finance in Transition Countries 179
important indication. The key decisions taken by Lithuanian reformers, namelythat it is municipalities that have the final responsibility for school networks–in-cluding school closures–and for seing the budgets of individual schools withinsome constraints, have defined the nature of education finance in Lithuania.
This underlines the importance of early adoption, prior to the reform start, notonly of publicly formulated policy goals, but also of a clear vision of future de-velopment of the system.
2. The prominent role of municipalities in education finance was not a foregoneconclusion and was not adopted without opposition. Godfrey (2004) reportsthat many education stakeholders complained that the Student Basket systemin Lithuania does not implement the principle money follows student , but a sup-posedly inferior version, money follows student to municipality. These stakehold-ers considered clarification of the position of municipalities, meaning reductionof their role, as a key challenge for MES. However, in our meetings and discus-
sions with education stakeholders in 2007 no such sentiment was visible, andthe present role of municipalities in education was not questioned. Moreover,the analysis in the preceding sections indicates that it would be impossible toreduce the role of municipalities without a major redesign of the system–andwithout losing some of its distinctive achievements.
3. MES knows very lile about how the municipalities manage the maintenanceof schools and finance material conditions for the pedagogical process. This is aresult of the early decision to accept fragmentation of education finance into theteaching process–through the Student Basket–and the teaching environment–from revenues of school founders. By design, MES left the teaching environmentas the sole responsibility of municipalities. Yet this precludes, at the same time,critical review of the functioning system and introduction of possible correctivemeasures. It seems that whatever the design of the management and financ-ing system, MES should collect complete information on education finance, in-cluding all sources of funds (state budget, local budgets, parental contributions,etc.). It also seems very reasonable to provide MES with some instruments foraddressing potential inequity in the area of teaching environment.
4. Interestingly, the Student Basket system has some paradoxical consequencesresulting from using normative class size as the basis for allocation coeffi cients,
with schools of quite diff
erent sizes receiving the same Student Basket alloca-tion.83 Those potentially serious consequences may not in practice harm theoperations of the system precisely because municipalities have the right to real-locate a limited part of the Student Basket grant among schools. However, wehave only limited data (e.g. Table 5.26) regarding this reallocation.
Results:
1. MES published the expected results of the reform of the financing system priorto the reform,84 but never assessed whether they were achieved and to what de-gree. Clearly, such a review from the authors of the reform would be most inter-esting. In the current section we have provided an external review of whetherthe expected results were achieved. This analysis is summarized below.
2. The following expected results seem to have been achieved: quality improve-ment, increased enrollment rates, beer planning and management of educa-
8/6/2019 Reforming Education Finance in Transition Countries
http://slidepdf.com/reader/full/reforming-education-finance-in-transition-countries 204/335
World Bank Study180
tion resources at the municipal level, and restructuring of school networks.We note, however, that quality improvements were not the result of increasedcompetition among schools, as originally planned, but probably more relatedto specific non-teaching components of the Student Basket.85 The World Bank-
funded EIP project has also contributed to some of those achievements.3. Regarding education finance equity, we have noticed that on the level of mu-
nicipalities the equity of allocation for the teaching process has been largelyachieved, at least for municipalities with suffi ciently large average class sizes. However we do not know to what extent this has happened in the individu-al schools, and even more importantly we do not have the data on horizontalequity of the teaching environment–namely whether the expenditures on theteaching environment do not depend on the wealth of municipalities. Detailedassessment of horizontal equity requires more subtle analysis using more dataon individual schools.86
4. Transparency of education finance needs to be considered on two levels. At thenational level, it has been greatly improved through the adoption of public pro-cedures and public formulas, accessible to all concerned. However, excessivecomplexity of the arithmetic approach adopted limits the practical impact ofthis transparency because despite simple basic principles, the actual formulasare too diffi cult to be a subject of wide public discussions. At the level of mu-nicipalities, however, there is very limited transparency and even the schooldirectors have limited knowledge and understanding of the allocation system.
5. Public accountability of the education systems is notoriously underdevelopedin post communist countries, and Lithuania is no exception. Schools do not haveto report how the funds they have been allocated have been used nor what re-sults have been achieved. Municipalities do not adopt local education strategiesthat may be monitored and be used to judge whether local governments havereached their stated measurable goals. It is probably fair to state that develop-ment of necessary public democratic procedures in this area requires more time.
6. The following expected results seem not to have been achieved: increased ef-ficiency of the education system, competition among schools, expansion ofprivate education, budgetary autonomy of schools. Here the greatest hope ofthe reformers, namely that, through increased competition, schools would be
forced to adopt more effi
cient plans and budgets, has not been realized. Indeed,as municipalities were very slow to consolidate their school networks, they hadto be forced by the Ministry to adopt their network consolidation strategies,which over time stopped the decline of the student teacher ratio. However, giv-en the demographic decline in the school age population, the maintenance ofthe student teacher ratio should be considered a major achievement.
7. It seems that the following unforeseen results have occurred: use of the StudentBasket as a tool to improve education through financing new school functions,and significantly strengthened position and role of Lithuanian municipalities ineducation. The first of these shows that the Ministry was quickly able to begin to
use the Student Basket system in a productive though unforeseen manner. Thelaer brings the hope that local school systems are in the hands of responsibleand predictable owners, who will be able to use their new powers in the sectorfor the benefit of students and teachers.
8/6/2019 Reforming Education Finance in Transition Countries
http://slidepdf.com/reader/full/reforming-education-finance-in-transition-countries 205/335
Reforming Education Finance in Transition Countries 181
References
AAT ( Audito ir Apskaitos Tarnyba) (2003); Ataskaitą Apie Igyvendinimo Mokinio Krepšelį (Re-
port into the Implementation of the Student Basket), State Audit and Accounting Offi ce,
Vilnius.AAT ( Audito ir Apskaitos Tarnyba) (2006); Ataskaitą Apie Mokyklų Tinklo Konsolidacija (Re-
port into the Consolidation of the Local School Networks), State Audit and AccountingOffi ce, Vilnius.
Bischoff C. (editor) (2009), Public Money for Public Schools , Local Government Initiative,Budapest.
ESP (2007); “ Monitoring School Dropouts,” Education Support Program (ESP) of the OpenSociety Institute (OSI), Budapest, Hungary.
Godfrey, M. (2004);, “Lithuania: Policy Note on Financing Education, with Particular Refer-
ence to Higher Education,” Vilnius, Lithuania: Unpublished Manuscript.
Herczyński, J. (2002); “Key Issues of Governance and Finance of Kyrgyz Education,”
CASEStudies and Analyzes 244, Warsaw.Herczyński, J. (2004); “Geing Ready for Take-O ff ? Current Issues of Education Decentraliza-
tion in Romania , processed text, CNFIPS, Bucharest.ITC (2007); (ITC), “ MK Palyginimas 2002-2007, savivaldybiu mokykloms) (Comparison of the
Student basket 2002-2007, municipal schools),” Information Technology Center, Min-istry of Education and Science, Vilnius, Lithuania.
LDS (2005); Svietimas 2004 (Education 2004) , Lithuanian Department of Statistics (LDS),Vilnius.
LDS (2006); Svietimas 2005 (Education 2005) , Lithuanian Department of Statistics (LDS),
Vilnius.LDS (2007a); Bendrojo Lavinimo Mokyklos 2006/2007 (General Education Schools 2006/2007) ,
Lithuanian Department of Statistics (LDS), Vilnius.LDS (2007b); Vartotojų kainų indeksų (Consumer Price Indices) , Lithuanian Depart-
ment of Statistics (LDS), Vilnius, available at hp://www.stat.gov.lt/en/pages/view/?id=1370.
Levitas, T. and Herczyński, J. (2002); “Decentralization, Local Governments and Educa-tion Reform in Post-communist Poland,” in K. Davey (ed.) Balancing National and
Local Responsibilities , LGI Budapest, pp. 114-190Lietuvos Bankas (2007); “Financial Stability Review 2006,” Lietuvos Bankas (National
Bank of Lithuania), Vilnius, Lithuania, available at hp://www.lbank.lt/eng/pub-lications/stability/fsa2006e.pdf.
MES (2006); Education in Lithuania: Facts and Figures 2006 , Ministry of Education and Sci-ence (MES),Vilnius.
Plukas, V. (2006a), Mokinio Krepselio Lesu Naudojimo Metodines Rekomendacijos (Student Bas-
ket, Methodological Review and Recommendations) , processed text, Vilnius , Lithuania.Plukas, V. (2006b), Mokinio Krepselio Papildymai Ir Pakeitimai 2006 Ir 2007 (Change of Stu-
dent Basket between 2006 and 2007) , processed text, Vilnius.Plikšnys, A. (2009), Education Funding and Payment System Reforms in Lithuania , in Plikšnys
A., Kopnicka S., Hrynevych L. and Palicarski C. (2009), Transparency in Education in
Eastern Europe , Institute for International Education and Planning. Paris: UNESCO.World Bank (2007), Implementation Completion and Results Report for Education Improve-
ment Project, Lithuania , Report No. ICR000091, Human Development Sector Unit,Europe and Central Asia Region. Washington, DC: The World Bank.
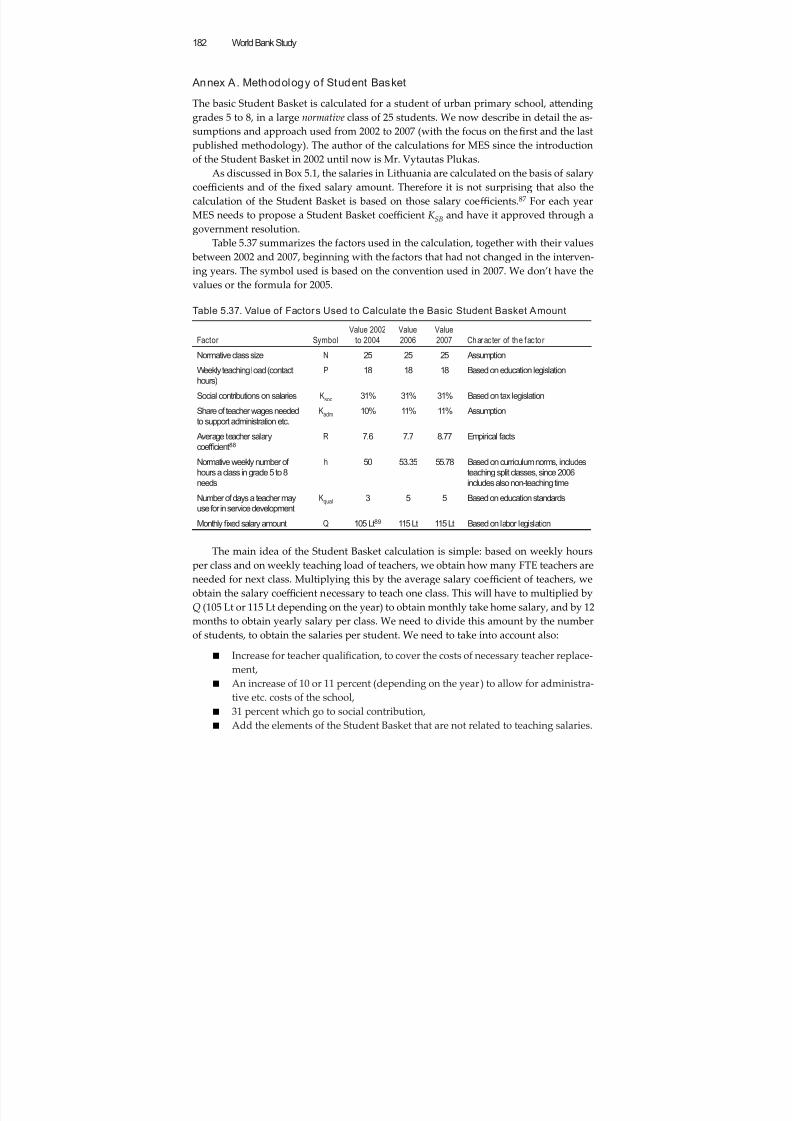
8/6/2019 Reforming Education Finance in Transition Countries
http://slidepdf.com/reader/full/reforming-education-finance-in-transition-countries 206/335
World Bank Study182
Annex A. Methodology of Student Basket
The basic Student Basket is calculated for a student of urban primary school, aendinggrades 5 to 8, in a large normative class of 25 students. We now describe in detail the as-
sumptions and approach used from 2002 to 2007 (with the focus on thefi
rst and the lastpublished methodology). The author of the calculations for MES since the introductionof the Student Basket in 2002 until now is Mr. Vytautas Plukas.
As discussed in Box 5.1, the salaries in Lithuania are calculated on the basis of salarycoeffi cients and of the fixed salary amount. Therefore it is not surprising that also thecalculation of the Student Basket is based on those salary coeffi cients.87 For each yearMES needs to propose a Student Basket coeffi cient K SB and have it approved through agovernment resolution.
Table 5.37 summarizes the factors used in the calculation, together with their values between 2002 and 2007, beginning with the factors that had not changed in the interven-
ing years. The symbol used is based on the convention used in 2007. We don’t have thevalues or the formula for 2005.
Table 5.37. Value of Factors Used to Calculate the Basic Student Basket Amount
Factor Symbol
Value 2002
to 2004
Value
2006
Value
2007 Charac ter of the fac tor
Normative class size N 25 25 25 Assumption
Weekly teaching load (contacthours)
P 18 18 18 Based on education legislation
Social contributions on salaries Ksoc 31% 31% 31% Based on tax legislation
Share of teacher wages neededto support administration etc.
Kadm 10% 11% 11% Assumption
Average teacher salarycoef ficient88
R 7.6 7.7 8.77 Empirical facts
Normative weekly number ofhours a class in grade 5 to 8needs
h 50 53.35 55.78 Based on curriculum norms, includesteaching split classes, since 2006includes also non-teaching time
Number of days a teacher mayuse for in service development
Kqual 3 5 5 Based on education standards
Monthly fixed salary amount Q 105 Lt89 115 Lt 115 Lt Based on labor legislation
The main idea of the Student Basket calculation is simple: based on weekly hoursper class and on weekly teaching load of teachers, we obtain how many FTE teachers areneeded for next class. Multiplying this by the average salary coeffi cient of teachers, weobtain the salary coeffi cient necessary to teach one class. This will have to multiplied byQ (105 Lt or 115 Lt depending on the year) to obtain monthly take home salary, and by 12months to obtain yearly salary per class. We need to divide this amount by the numberof students, to obtain the salaries per student. We need to take into account also:
■ Increase for teacher qualification, to cover the costs of necessary teacher replace-ment,
■ An increase of 10 or 11 percent (depending on the year) to allow for administra-tive etc. costs of the school,■ 31 percent which go to social contribution,■ Add the elements of the Student Basket that are not related to teaching salaries.
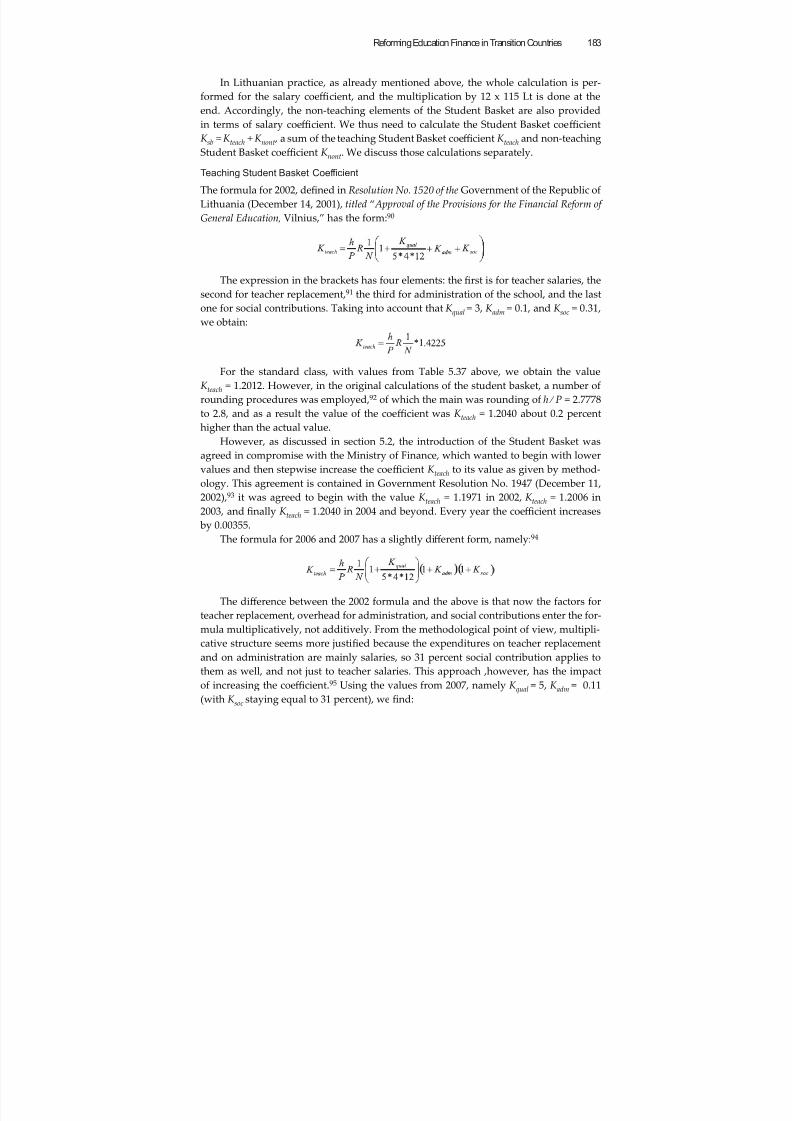
8/6/2019 Reforming Education Finance in Transition Countries
http://slidepdf.com/reader/full/reforming-education-finance-in-transition-countries 207/335
Reforming Education Finance in Transition Countries 183
In Lithuanian practice, as already mentioned above, the whole calculation is per-formed for the salary coeffi cient, and the multiplication by 12 x 115 Lt is done at theend. Accordingly, the non-teaching elements of the Student Basket are also providedin terms of salary coeffi cient. We thus need to calculate the Student Basket coeffi cient
K sb = K teach + K nont , a sum of the teaching Student Basket coeffi cient K teach and non-teachingStudent Basket coeffi cient K nont. We discuss those calculations separately.
Teaching Student Basket Coef ficient
The formula for 2002, defined in Resolution No. 1520 of the Government of the Republic ofLithuania (December 14, 2001), titled “ Approval of the Provisions for the Financial Reform of
General Education, Vilnius,” has the form:90
The expression in the brackets has four elements: the first is for teacher salaries, thesecond for teacher replacement,91 the third for administration of the school, and the lastone for social contributions. Taking into account that K qual = 3, K adm = 0.1, and K soc = 0.31,we obtain:
For the standard class, with values from Table 5.37 above, we obtain the valueK teach = 1.2012. However, in the original calculations of the student basket, a number ofrounding procedures was employed,92 of which the main was rounding of h ⁄ P = 2.7778
to 2.8, and as a result the value of the coeffi cient was K teach = 1.2040 about 0.2 percenthigher than the actual value.
However, as discussed in section 5.2, the introduction of the Student Basket wasagreed in compromise with the Ministry of Finance, which wanted to begin with lowervalues and then stepwise increase the coeffi cient K teach to its value as given by method-ology. This agreement is contained in Government Resolution No. 1947 (December 11,2002),93 it was agreed to begin with the value K teach = 1.1971 in 2002, K teach = 1.2006 in2003, and finally K teach = 1.2040 in 2004 and beyond. Every year the coeffi cient increases by 0.00355.
The formula for 2006 and 2007 has a slightly different form, namely:94
The difference between the 2002 formula and the above is that now the factors forteacher replacement, overhead for administration, and social contributions enter the for-mula multiplicatively, not additively. From the methodological point of view, multipli-cative structure seems more justified because the expenditures on teacher replacementand on administration are mainly salaries, so 31 percent social contribution applies tothem as well, and not just to teacher salaries. This approach ,however, has the impact
of increasing the coeffi cient.95 Using the values from 2007, namely K qual = 5, K adm = 0.11(with K soc staying equal to 31 percent), we find:
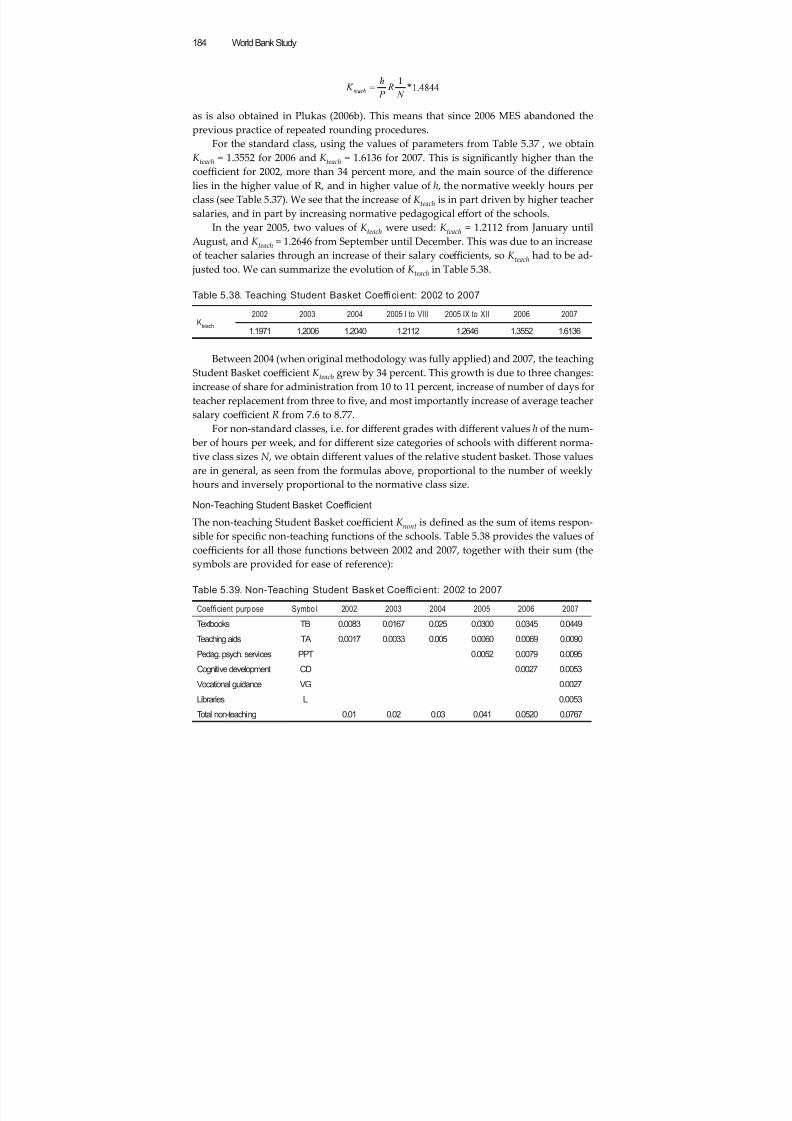
8/6/2019 Reforming Education Finance in Transition Countries
http://slidepdf.com/reader/full/reforming-education-finance-in-transition-countries 208/335
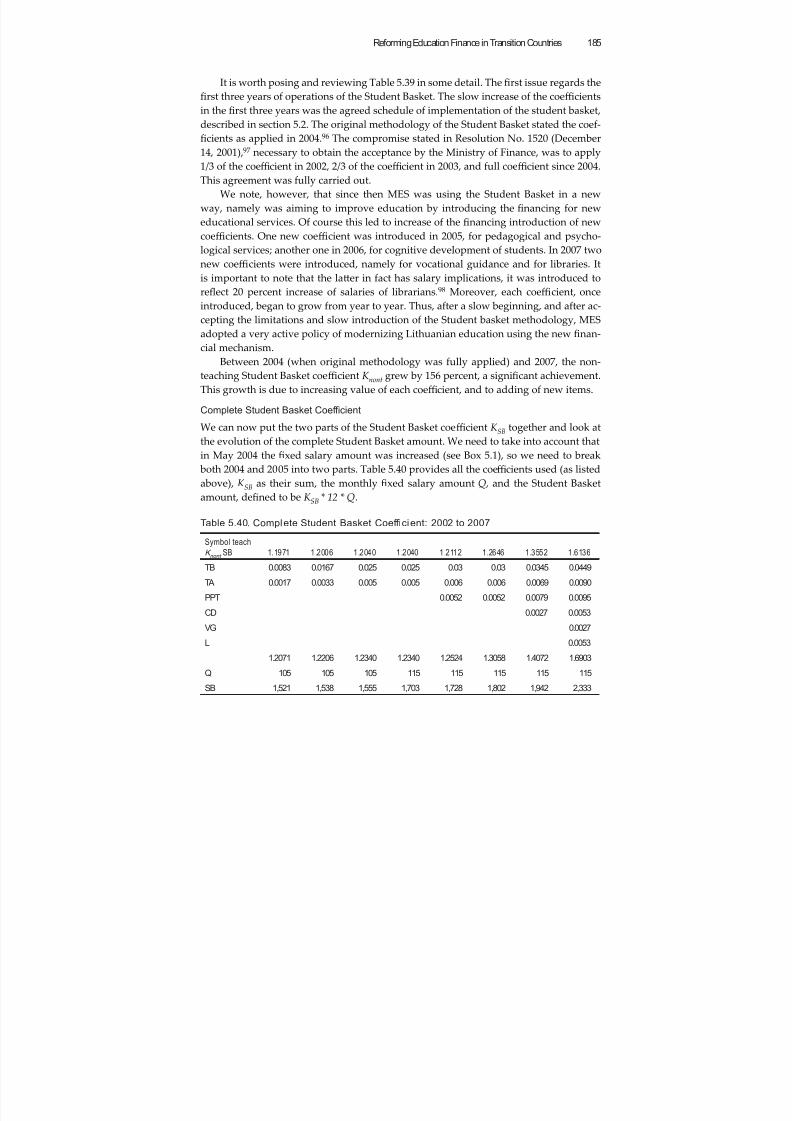
8/6/2019 Reforming Education Finance in Transition Countries
http://slidepdf.com/reader/full/reforming-education-finance-in-transition-countries 209/335
Reforming Education Finance in Transition Countries 185
It is worth posing and reviewing Table 5.39 in some detail. The first issue regards thefirst three years of operations of the Student Basket. The slow increase of the coeffi cientsin the first three years was the agreed schedule of implementation of the student basket,described in section 5.2. The original methodology of the Student Basket stated the coef-
ficients as applied in 2004.96 The compromise stated in Resolution No. 1520 (December14, 2001),97 necessary to obtain the acceptance by the Ministry of Finance, was to apply1/3 of the coeffi cient in 2002, 2/3 of the coeffi cient in 2003, and full coeffi cient since 2004.This agreement was fully carried out.
We note, however, that since then MES was using the Student Basket in a newway, namely was aiming to improve education by introducing the financing for neweducational services. Of course this led to increase of the financing introduction of newcoeffi cients. One new coeffi cient was introduced in 2005, for pedagogical and psycho-logical services; another one in 2006, for cognitive development of students. In 2007 twonew coeffi cients were introduced, namely for vocational guidance and for libraries. It
is important to note that the laer in fact has salary implications, it was introduced toreflect 20 percent increase of salaries of librarians.98 Moreover, each coeffi cient, onceintroduced, began to grow from year to year. Thus, after a slow beginning, and after ac-cepting the limitations and slow introduction of the Student basket methodology, MESadopted a very active policy of modernizing Lithuanian education using the new finan-cial mechanism.
Between 2004 (when original methodology was fully applied) and 2007, the non-teaching Student Basket coeffi cient K nont grew by 156 percent, a significant achievement.This growth is due to increasing value of each coeffi cient, and to adding of new items.
Complete Student Basket Coef ficient
We can now put the two parts of the Student Basket coeffi cient K SB together and look atthe evolution of the complete Student Basket amount. We need to take into account thatin May 2004 the fixed salary amount was increased (see Box 5.1), so we need to break both 2004 and 2005 into two parts. Table 5.40 provides all the coeffi cients used (as listedabove), K SB as their sum, the monthly fixed salary amount Q , and the Student Basketamount, defined to be K SB * 12 * Q.
Table 5.40. Complete Student Basket Coef fi cient: 2002 to 2007
Symbol teach
K nont
SB 1.1971 1.2006 1.2040 1.2040 1.2112 1.2646 1.3552 1.6136
TB 0.0083 0.0167 0.025 0.025 0.03 0.03 0.0345 0.0449
TA 0.0017 0.0033 0.005 0.005 0.006 0.006 0.0069 0.0090
PPT 0.0052 0.0052 0.0079 0.0095
CD 0.0027 0.0053
VG 0.0027
L 0.0053
1.2071 1.2206 1.2340 1.2340 1.2524 1.3058 1.4072 1.6903
Q 105 105 105 115 115 115 115 115
SB 1,521 1,538 1,555 1,703 1,728 1,802 1,942 2,333
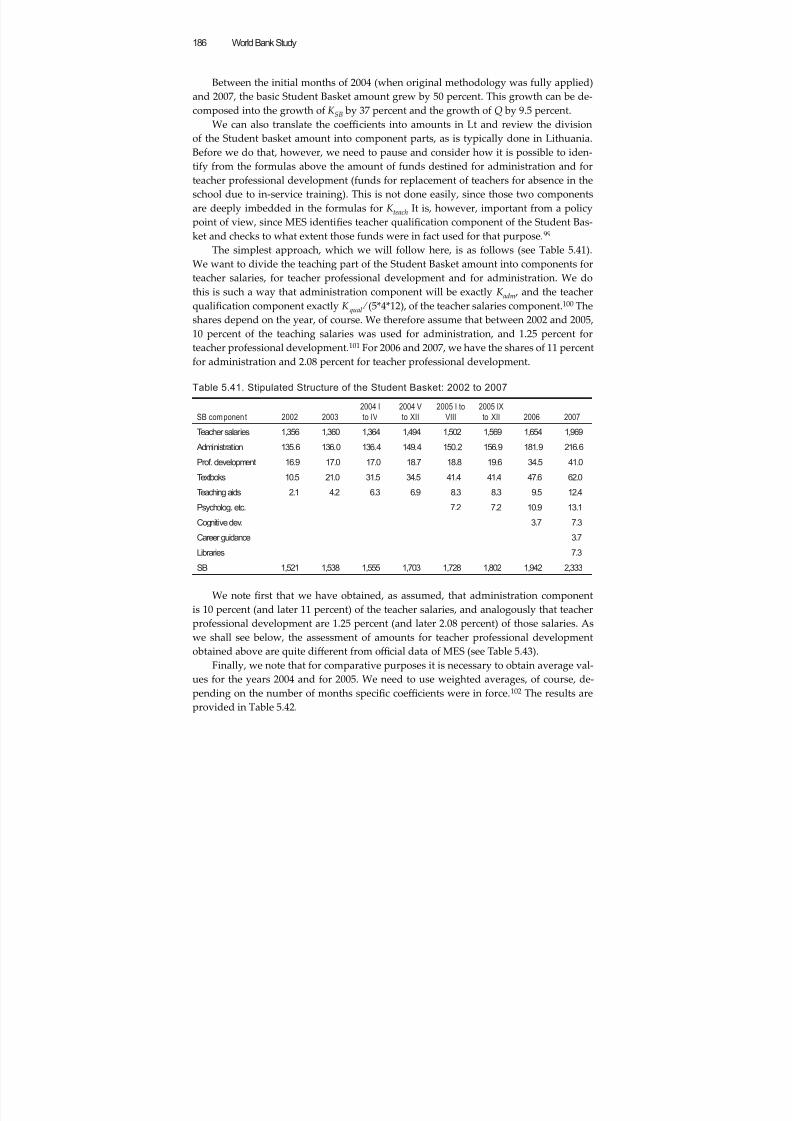
8/6/2019 Reforming Education Finance in Transition Countries
http://slidepdf.com/reader/full/reforming-education-finance-in-transition-countries 210/335
World Bank Study186
Between the initial months of 2004 (when original methodology was fully applied)and 2007, the basic Student Basket amount grew by 50 percent. This growth can be de-composed into the growth of K SB by 37 percent and the growth of Q by 9.5 percent.
We can also translate the coeffi cients into amounts in Lt and review the division
of the Student basket amount into component parts, as is typically done in Lithuania.Before we do that, however, we need to pause and consider how it is possible to iden-tify from the formulas above the amount of funds destined for administration and forteacher professional development (funds for replacement of teachers for absence in theschool due to in-service training). This is not done easily, since those two componentsare deeply imbedded in the formulas for K teach It is, however, important from a policypoint of view, since MES identifies teacher qualification component of the Student Bas-ket and checks to what extent those funds were in fact used for that purpose.99
The simplest approach, which we will follow here, is as follows (see Table 5.41).We want to divide the teaching part of the Student Basket amount into components for
teacher salaries, for teacher professional development and for administration. We dothis is such a way that administration component will be exactly K adm , and the teacherqualification component exactly Kqual ⁄ (5*4*12), of the teacher salaries component.100 Theshares depend on the year, of course. We therefore assume that between 2002 and 2005,10 percent of the teaching salaries was used for administration, and 1.25 percent forteacher professional development.101 For 2006 and 2007, we have the shares of 11 percentfor administration and 2.08 percent for teacher professional development.
Table 5.41. Stipulated Structure of the Student Basket: 2002 to 2007
SB component 2002 2003
2004 I
to IV
2004 V
to XII
2005 I to
VIII
2005 IX
to XII 2006 2007
Teacher salaries 1,356 1,360 1,364 1,494 1,502 1,569 1,654 1,969
Administration 135.6 136.0 136.4 149.4 150.2 156.9 181.9 216.6
Prof. development 16.9 17.0 17.0 18.7 18.8 19.6 34.5 41.0
Textboks 10.5 21.0 31.5 34.5 41.4 41.4 47.6 62.0
Teaching aids 2.1 4.2 6.3 6.9 8.3 8.3 9.5 12.4
Psycholog. etc. 7.2 7.2 10.9 13.1
Cognitive dev. 3.7 7.3
Career guidance 3.7
Libraries 7.3
SB 1,521 1,538 1,555 1,703 1,728 1,802 1,942 2,333
We note first that we have obtained, as assumed, that administration componentis 10 percent (and later 11 percent) of the teacher salaries, and analogously that teacherprofessional development are 1.25 percent (and later 2.08 percent) of those salaries. Aswe shall see below, the assessment of amounts for teacher professional developmentobtained above are quite different from offi cial data of MES (see Table 5.43).
Finally, we note that for comparative purposes it is necessary to obtain average val-ues for the years 2004 and for 2005. We need to use weighted averages, of course, de-pending on the number of months specific coeffi cients were in force.102 The results areprovided in Table 5.42.
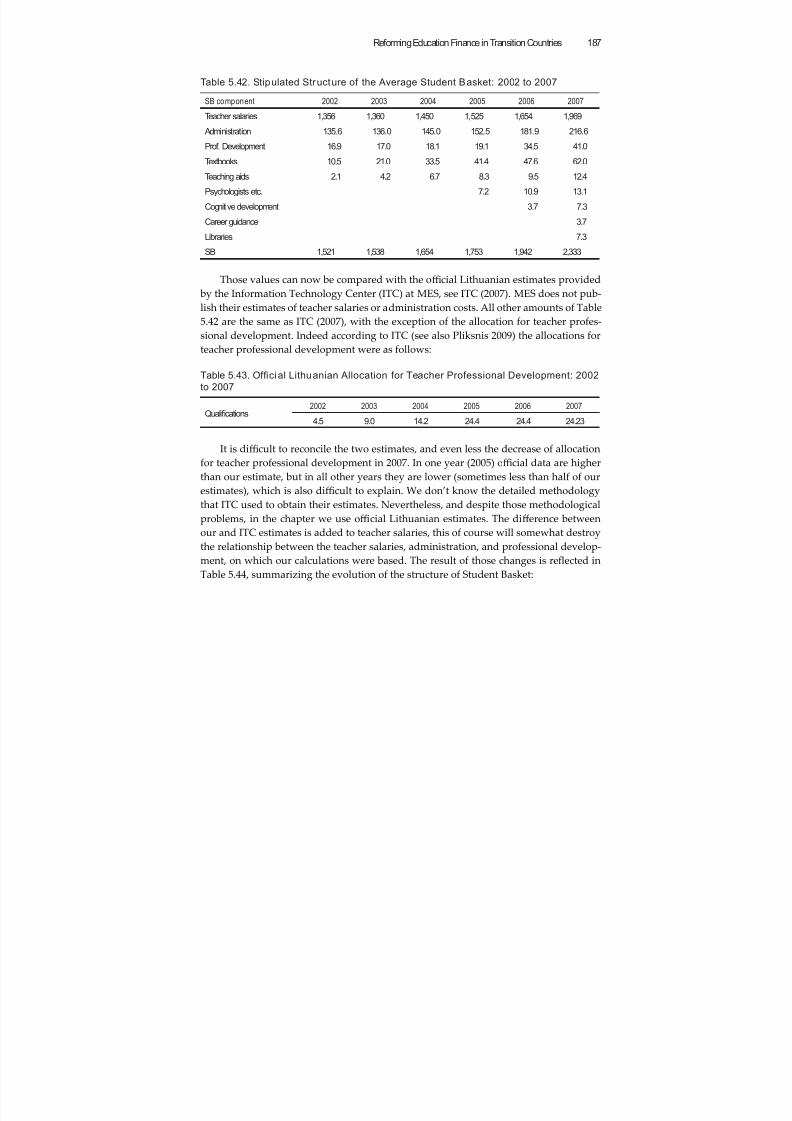
8/6/2019 Reforming Education Finance in Transition Countries
http://slidepdf.com/reader/full/reforming-education-finance-in-transition-countries 211/335
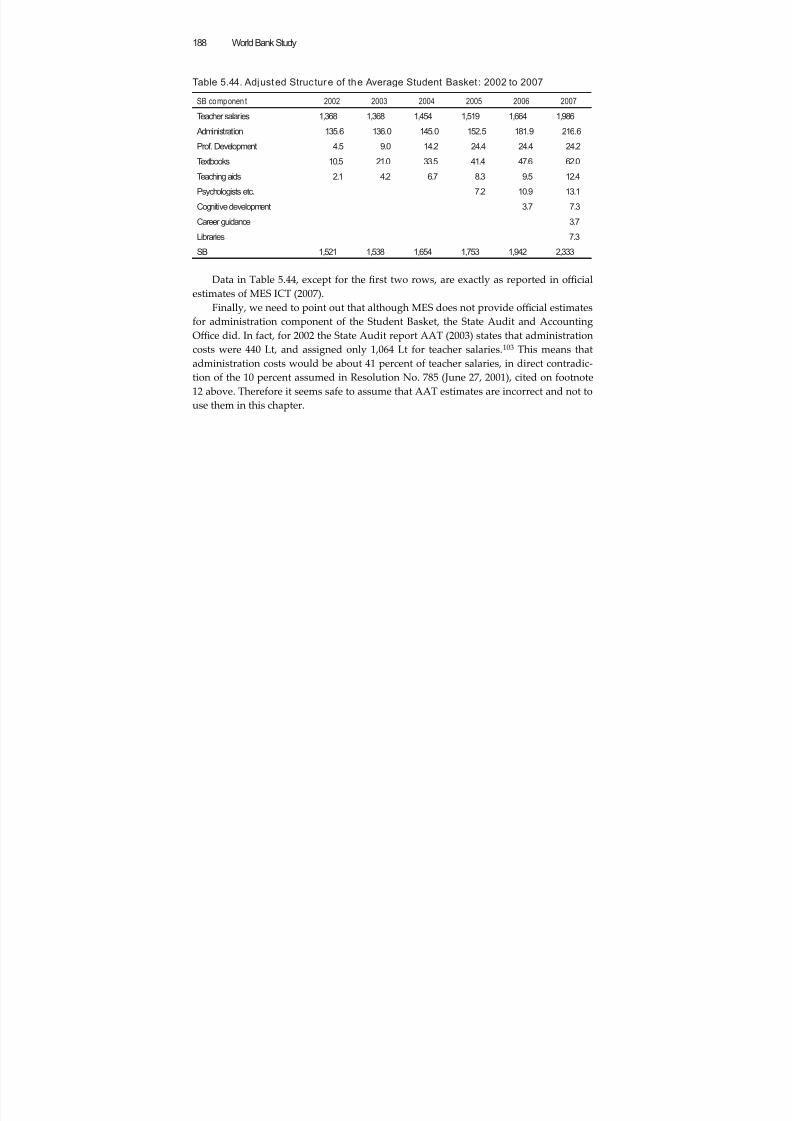
8/6/2019 Reforming Education Finance in Transition Countries
http://slidepdf.com/reader/full/reforming-education-finance-in-transition-countries 212/335
World Bank Study188
Table 5.44. Adjusted Structure of the Average Student Basket: 2002 to 2007
SB componen t 2002 2003 2004 2005 2006 2007
Teacher salaries 1,368 1,368 1,454 1,519 1,664 1,986
Administration 135.6 136.0 145.0 152.5 181.9 216.6
Prof. Development 4.5 9.0 14.2 24.4 24.4 24.2
Textbooks 10.5 21.0 33.5 41.4 47.6 62.0
Teaching aids 2.1 4.2 6.7 8.3 9.5 12.4
Psychologists etc. 7.2 10.9 13.1
Cognitive development 3.7 7.3
Career guidance 3.7
Libraries 7.3
SB 1,521 1,538 1,654 1,753 1,942 2,333
Data in Table 5.44, except for the first two rows, are exactly as reported in offi cialestimates of MES ICT (2007).
Finally, we need to point out that although MES does not provide offi cial estimatesfor administration component of the Student Basket, the State Audit and AccountingOffi ce did. In fact, for 2002 the State Audit report AAT (2003) states that administrationcosts were 440 Lt, and assigned only 1,064 Lt for teacher salaries.103 This means thatadministration costs would be about 41 percent of teacher salaries, in direct contradic-tion of the 10 percent assumed in Resolution No. 785 (June 27, 2001), cited on footnote12 above. Therefore it seems safe to assume that AAT estimates are incorrect and not touse them in this chapter.
8/6/2019 Reforming Education Finance in Transition Countries
http://slidepdf.com/reader/full/reforming-education-finance-in-transition-countries 213/335
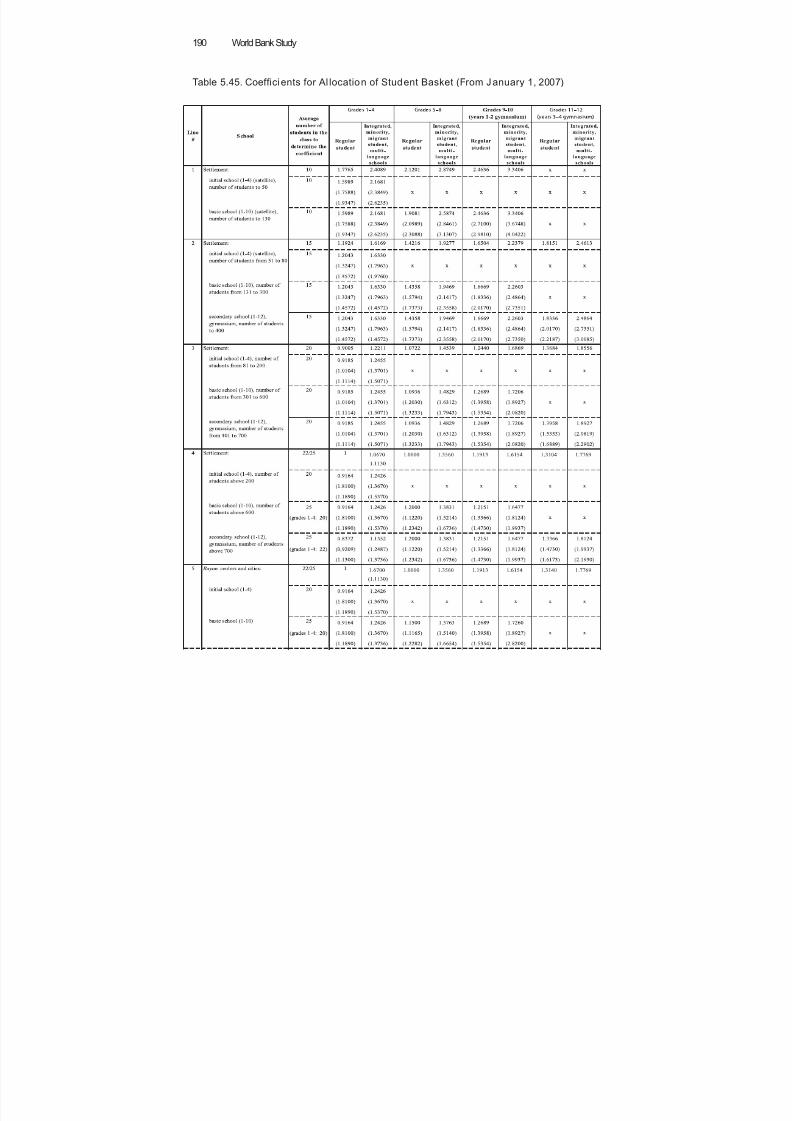
8/6/2019 Reforming Education Finance in Transition Countries
http://slidepdf.com/reader/full/reforming-education-finance-in-transition-countries 214/335
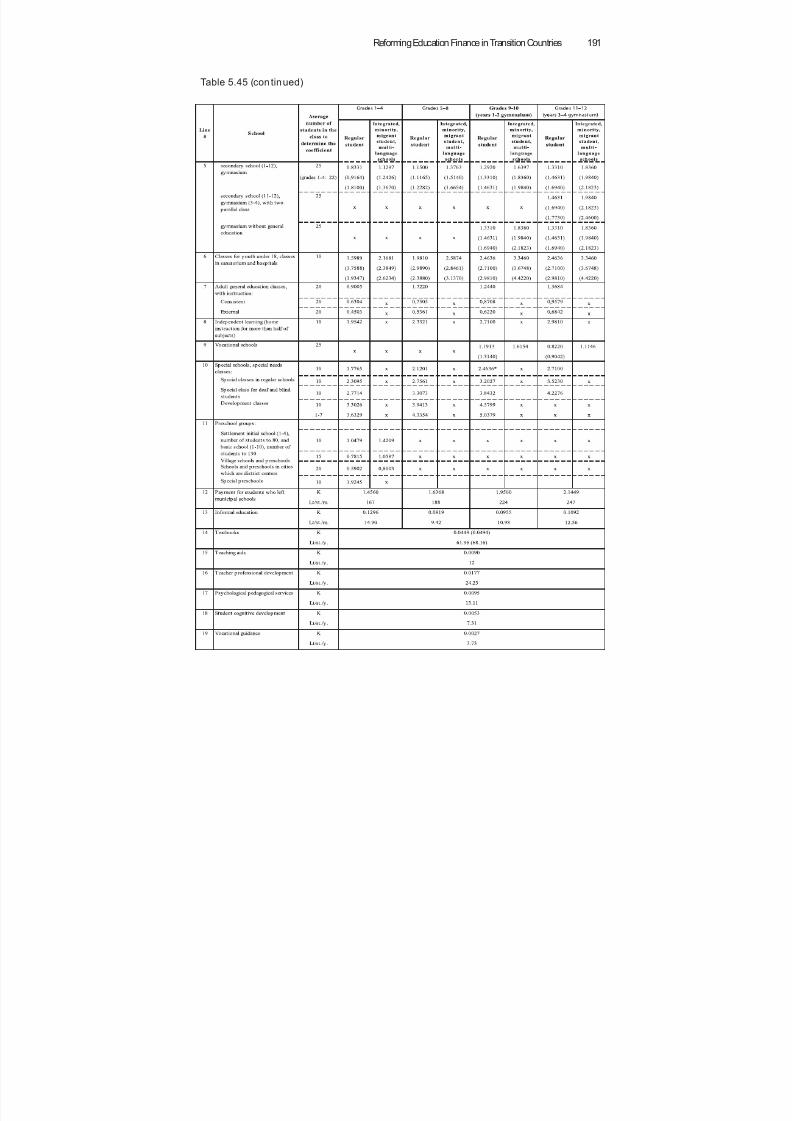
8/6/2019 Reforming Education Finance in Transition Countries
http://slidepdf.com/reader/full/reforming-education-finance-in-transition-countries 215/335
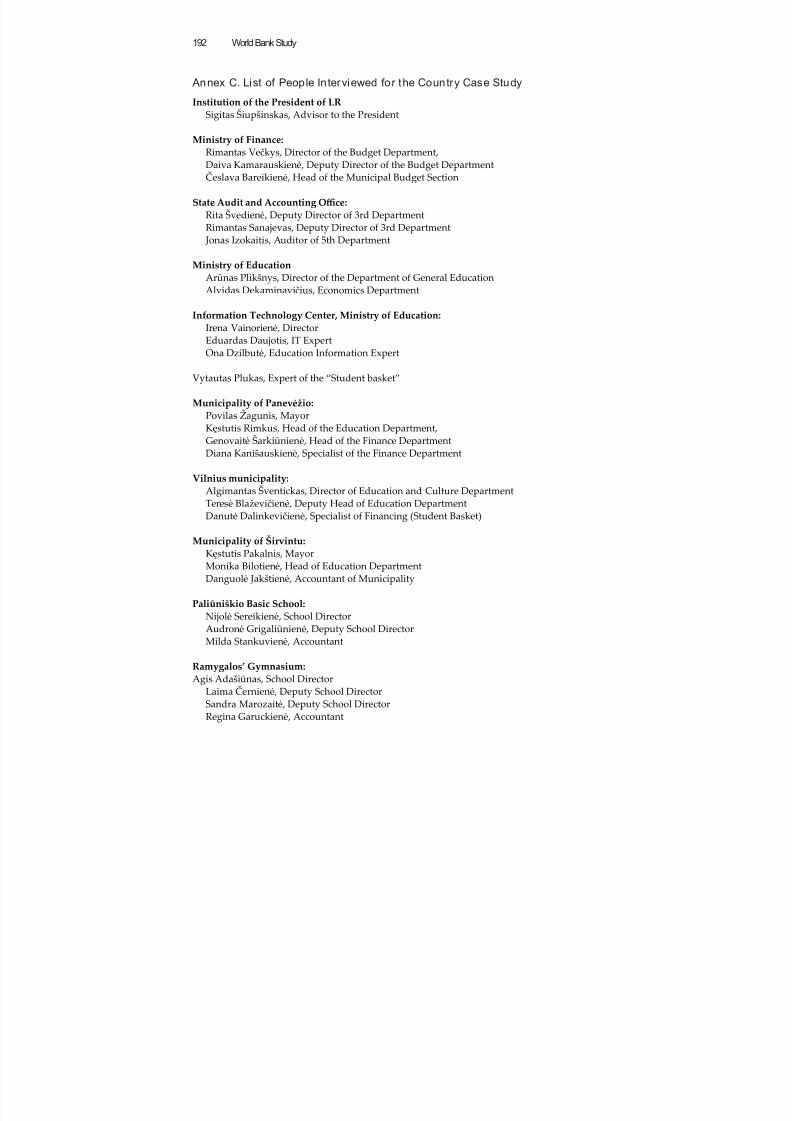
8/6/2019 Reforming Education Finance in Transition Countries
http://slidepdf.com/reader/full/reforming-education-finance-in-transition-countries 216/335
8/6/2019 Reforming Education Finance in Transition Countries
http://slidepdf.com/reader/full/reforming-education-finance-in-transition-countries 217/335
Reforming Education Finance in Transition Countries 193
Notes
1. Jonas Mickus was my guide to the complexities of Lithuanian education. I am truly grateful forhis patience with my inquisitive questions and for his constant display of goodwill. Jonas pro-vided all the documents and statistical data files I have used and also commented on early drafts
of my report. I have both enjoyed meeting and profited from the discussions with three personsmost crucially involved in the design and implementation of the Student Basket: Arunas Plikšnysfrom the Ministry of Education and Science, Rimantas Veckys from the Ministry of Finance, andVytautas Plukas from the Antano Vienuolio gymnasium in Anyksciu rayon , which had designedthe mathematical details of the Student Basket. A complete list of people interviewed for collectingevidence on this chapter can be found in Annex C.2. This effort was aided in part by donor-funded projects, including the World Bank-funded Educa-tion Improvement Project.3. Double reporting lines arise for example when a rayon education department reports both tothe rayon council and to the oblast education department or directly to the Ministry of Education.Separate reporting lines, which disappeared in 1989, operated within the party apparatus. For an
analysis in the context of education, see Herczyński (2002).4. There are 60 autonomous and democratically elected municipalities in Lithuania. They are tra-ditionally divided into cities and rayons (e.g. Vilnius rayon includes rural areas around the capital).However, the new municipalities created in the 2003 administrative reform have not been assignedthe denomination of either “city” or “rayon”. The sub-municipal level of elderates—there are about500 of them—has no responsibilities for education.5. See Table 5.7.6. This is the case, among others, in Romania and Macedonia, see Bischoff (2009).7. Because of the complexity of the formula and frequent errors in its calculation in the first years itwas introduced, MES now sends to municipalities a computer program that calculates the alloca-tion for each school–the program is a part of the student database. Some municipalities still cal-culate on their own what they should receive from the central government using an excel spread-
sheet, but those calculations may still have occasional errors.8. A voucher system assigns, through a national or regional level formula, the budget of eachschool (or a specific part of the budget of each school) proportionally to the number of students,with some variation possible on the per student amount. Among transition countries, Georgia hasa radical voucher system with three values, which depend on the location of the school–city, ruralor mountains.9. The reallocation threshold was initially 15 percent.10. An allocation formula to municipalities may be defined in such a way that it cannot be then ap-plied to determine the budgets of individual schools. It may be based, for example, on some char-acteristics of the municipality, such as population density, as in Macedonia, see Bischoff (2009).Another barrier to using the national formula for municipalities to define school budgets is the use
of buffers, as was the case for many years in Poland.11. The history of the Student Basket is also told in Pliksnys (2009). Lithuania is similar to Polandand Estonia in that the MES introduced the per student financing system and did not rely ondonor-funded Western experts.12. Resolution No. 785 of the Government of the Republic of Lithuania (June 27, 2001), titled “Im-plementation of the General Education Financial Reform Measures”.13. See the reflection of this schedule in the Student Basket methodology, Annex A.14. Resolution No. 1520 of the Government of the Republic of Lithuania (December 14, 2001), titled“Approval of the Provisions for the Financial Reform of General Education”.15. All values are provided in nominal values, without taking inflation into account. The Lithua-nian Litas has been pegged to the Euro at the exchange rate 1 = 3.45528 Lt since 2002 (it was peggedto US dollar before). Inflation in Lithuania in recent years was as follows: 1.4 percent in 2000, 2.0percent in 2001, -1.0 percent in 2002, -1.3 percent in 2003, 2.91 percent in 2004, 3.0 percent in 2005,4.6 in 2006, see LDS (2007b), and over six percent in 2007, see Lietuvos Bankas (2007).
8/6/2019 Reforming Education Finance in Transition Countries
http://slidepdf.com/reader/full/reforming-education-finance-in-transition-countries 218/335
World Bank Study194
16. All tables in the report are based on data files provided by the Information Technology Center(ITC) of MES unless a specific source for statistical data is cited. Table 5.2 and Table 5.3 above are based on data from the Lithuanian Department of Statistics; see LDS (2005, 2006).17. Data for the 2004/2005 school year is from MES (2006) and data for the 2006/2007 school yearfrom LDS (2007a).18. There are 10 counties in Lithuania. Those are administrative regions, with a county governorappointed by the central government. There is no elected local representation. Education depart-ment at the county level function as deconcentrated offi ces of MES, with school inspection as theirmain function.19. See Resolution No. 437 of the Government of the Republic of Lithuania (April 17, 2000), titled “ Ap-
proval of the Program “Yellow buses” as the Mode of Transport Provision for Rural Schools.”20. Data from Statistical Offi ce (2007).21. Cited on section 5.1 . See also Pliksnys (2009) for more details.22. This reflects a conflict between the local governments, which tried to increase internal effi ciencyof the schools, and the schools, which wanted to avoid firing teachers despite decreasing studentnumbers.
23. Under the inherited system, if a school director decided to merge a few classes and reduceteacher employment, the funding of the school would be accordingly decreased, with no overall benefit for the school. Conversely, any new employment in the school would be compensated withadditional funds for salaries. This created a serious disincentive to rationalize school resources.24. We continue to quote from Resolution No. 785 of the Government of the Republic of Lithuania(June 27, 2001), titled “Implementation of the General Education Financial Reform Measures”. See sec-tion 5.1 above.25. Issued on July 7, 1994, by the Sejmas of the Republic of Lithuania.26. See article eight in the Law on Local Self-Government (July 7,1994) for details on this issue onspecial grants, which in Lithuanian terminology are categorical–conditional–grants that can beused only for the purpose indicated, and are akin to earmarks.
27. Preschools remained independent function until 2004, when they were included in StudentBasket.28. Cognitive development includes funds for visits to theater and museum, for educational excur-sions, for going to historical places, etc.29. Most Lithuanian municipalities have outsourced provision of meals by turning their cooksand waiters into independent service providers and by introducing tenders and contract basedservices. Same is true of occasional school shops.30. This reflects a clear policy decision of MES that the teaching process will be equally funded forschools owned by any founding institution. For non-public schools, Student Basket is transferredto school owner. In some transition countries the policy was to differentiate on the basis of owner-ship, for example in Poland from 1996 to 2002 non-public schools were funded at the level of 50percent of their public counterparts (since 2003 the funding levels were equalized).
31. See section 5.1 above.32. See resolutions of the Government of the Republic of Lithuania No.1947 (December 11, 2002)and No.1617 (December 16, 2003) both titled “Amendments of Resolution No.785 of June 27, 2001,” but also Resolutions No. 1561 (December 3, 2004), titled “Basic Coeffi cient for the Student Basketin 2005 Amending Resolution No.785 of June 27, 2001,” No. 1428, (December 28,2005) titled “BasicCoeffi cient for the Student Basket in 2006 Amending Resolution No.785 of June 27, 2001,” and No.1332, (December 22,2006) titled “Basic Coeffi cient for the Student Basket in 2007 Amending Resolu-tion No.785 of June 27, 2001.”33. Recall from footnote 15 that we provide always nominal values.34. See subsection 5.3.4 for a review of the legal basis on which the allocation methodology de-scribed below is based.
35. Compare footnote 15.36. The derivation of those coeffi cients follows a boom-up approach to defining the standard perstudent amount, so the proportionality and inverse proportionality are not exact.37. See point 19 of the Aachment.
8/6/2019 Reforming Education Finance in Transition Countries
http://slidepdf.com/reader/full/reforming-education-finance-in-transition-countries 219/335
Reforming Education Finance in Transition Countries 195
38. With the exception of grade level 9 and 10 for size category XS, of grade levels 1 to 4, and 8 and 9for size category L, which may indicate arithmetical errors in moving from Table 5.18 to Table 5.19.However, three errors in a table of 15 coeffi cients seem to be many, and the size of those discrepan-cies is also significant (from 6 percent to 11 percent). MES should investigate this issue carefully.39. Those corrected coe ffi cients can be seen in Table 5.45 in rows 1 to 5, as the top coeffi cients ingroups of three (without the parenthesis). We introduce here a specific terminology, not used inLithuania, to distinguish initial (Table 5.18) and corrected (Table 5.19) coeffi cients to clarify thediscussion (similarly to our classification of size categories).40. Those are schools with more than one language of instruction.41. Preschools were included in the Student Basket methodology in 2004, but are not included inStudent Basket grants to municipalities.42. This means, the municipality who is the founder of the school in which that student was en-rolled in September of the previous year.43. The reason for stating this monthly amount directly is clear: without such guidance, munici-palities would at a loss at deciding how much money should be sent to another municipality whena student changes schools.
44. See Annex B.45. See also Table 5.21 and discussion of Table 5.25.46. Interestingly, the Lithuanian experience is here quite close to the Polish. For primary schools, al-though decentralization and corresponding financing reforms proceeded in stages, the per studentallocation formula was introduced, without a pilot, only in 1996 when all municipalities obligatori-ly took over their primary schools. For secondary schools Poland introduced a pilot, so called large
cities project , but it ended in problems and was discontinued, see Levitas and Herczyński (2002).47. The present subsection is based on that report.48. Reference student is a physical student multiplied by its allocation coeffi cient. A grade 5-8 stu-dent in an urban school has an allocation coeffi cient of 1, as discussed above, so is both a physicalstudent and a reference student.
49. Annex A describes the changes in the calculation of the basic Student Basket amount, section 5.3discuses changes in the overall formula.50. Such independent verification of application of allocation formula is crucial in democraticcountries. Moreover, it has many benefits for the education system as a whole. In Poland, for ex-ample, every year a number of local municipalities come to MES to claim their education grant isnot enough, and discuss specific numbers with MES offi cials. Sometimes the differences are dueto errors (of either side), sometimes to data inconsistencies, and the dialogue over the years hashelped to improve data collection as well as mutual understanding.51. We do not have the student numbers for 2002.52. Here we refer to the rural rayon surrounding the capital city of Vilnius.53. An alternative hypothesis would be that this reflects movement of students to schools withhigher coeffi cients. However, this is not likely since in general there is migration to the cities, where
the coeffi cients are lower.54. Since the Student Basket is a special grant which can be used only for the teaching process,some municipalities fail to use of all it, but the sums returned to the central budget are very small,see Table 5.21.55. In Table 5.21, the sixth row is the sum of first, second and fourth rows minus third and fifthrow. The values in the second and third rows should in theory be the same, their difference pointsto some inaccuracies of budget reporting.56. Strictly speaking funds for teacher professional development are meant for replacement teach-ing, so these may be considered salary. In Table 5.23 we limit ourselves to fiscal years 2003 to 2006,for which we have budget execution reports.57. This is a common problem when different policy driven allocation coeffi cients are multiplied by
each other. In this case, judging by the data in Table 5.20, we perhaps should multiply the per stu-dent allocation for non-salary components of the teaching process in 2006 by 1.203. We cannot dothis because this ratio is different for different municipalities, and moreover because every year the
8/6/2019 Reforming Education Finance in Transition Countries
http://slidepdf.com/reader/full/reforming-education-finance-in-transition-countries 220/335
World Bank Study196
municipalities obtain the information regarding the values of the components of the basic StudentBasket amount as stated in Table 5.19.58. Such municipalities are called doughnut municipalities in Poland.59. Overall expenditures of municipalities on the teaching process and the teaching environmentare available from the yearly budget reports submied to the Ministry of Finance. Those report donot discuss specific schools.60. MES has not up to now taken any action against the municipalities which break the legal limita-tion.61. Usually the preparation of budget documents requires support of the accountant. For autono-mous school, this is the school accountant, and for non-autonomous schools this is the accountantfrom municipality.62. The director may move the funds among months within a quarter.63. The movement in the other direction is prohibited because special grants such as the StudentBasket are categorical.64. Lithuania is a small country and specialized school equipment will usually be available inVilnius.
65. See discussion following Table 5.3.66. This is equivalent to a simplifying assumption that the number of students in each of 8 gradesis the same.67. Again, this means we assume that the number of students in each grade from 1 to 12 is the same.68. See discussion following Figure 5.5.69. The measure of equity used here assumes that all existing schools should be financed irrespec-tive of whether it is justified on internal effi ciency grounds. Of course on the basis of the data usedin the present report such an assumption cannot be verified.70. Although outliers may require more aention from MES.71. Table 5.35 is based on Lithuanian Department of Statistics LDS (2005), LDS (2006). Unfortu-nately, those sources do not provide breakdown of teachers by school type, so we cannot calculate
the student-teacher ratio for diff
erent types as in Table 5.2 and Table 5.3.72. This is in disagreement with the findings of World Bank (2007), which reports an increase ofthe student-teacher ratio between 2003 and 2007. In particular according to World Bank (2007),the student-teacher ratio in rural areas grew from 11.4 to 17.7. We cannot explain the reasons forthis disagreement and stress that Table 5.35 is based on offi cial data of Lithuanian Department ofStatistics.73. See for example Levitas and Herczyński (2002).74. Poland in early 2000s saw far reaching consolidation efforts by local governments withoutguidance from MES and without an obligation to adopt local strategies.75. All 60 Lithuanian municipalities belong to one such association.76. Errors in the first two years of operations of the Student Basket were analyzed by AAT (2003).A few errors are present even in the 2007 table of allocation coeffi cients.
77. For an example, see the Sirvintai policy for reallocation discussed in section 5.3.78. The study included Albania, Kazakhstan, Latvia, Mongolia, Slovakia, and Tajikistan.79. It is worth pointing out that still private schools receive, on a per student basis, less from pub-lic resources (from state or municipal budgets) than public schools. In Poland, for instance, allprimary and secondary non-public schools receive financial support equal to average per studentspending on analogous schools in the same community. This is of course more generous to privateschools than the Student Basket in Lithuania.80. Based on LDS (2005), LDS (2006). Table 5.36 includes initial, basic, full secondary schools andgymnasia. There is also one private kindergarten and one private special school, not included.81. This may be a result of the specific political culture of Lithuania, with a strong tendency forconsensus and mutual agreement. However, this has the effect of preventing open formulation and
discussion of opposing views.82. See Herczyński (2004) for a review of those approaches, together with implications for educa-tion finance.83. See the discussion of equity in Section 4.
8/6/2019 Reforming Education Finance in Transition Countries
http://slidepdf.com/reader/full/reforming-education-finance-in-transition-countries 221/335
8/6/2019 Reforming Education Finance in Transition Countries
http://slidepdf.com/reader/full/reforming-education-finance-in-transition-countries 222/335
198
C H A P T E R 6
Per Capita Financing of GeneralEducation in Poland: A Case Study
Rosalind Levač ić 1
6.1. IntroductionAfter the election of the first non-communist government in 1989, Poland underwent
profound economic, political, and social changes in the 1990s. Among them was the
decentralization of political power, seen by many as essential to breaking up the cen-
tralized communist state. In the communist period, several ministries had run different
kinds of educational establishments from primary schools through to a large variety
of vocational schools. In 1990 around 2500 democratically elected local governments,
called gminas , were created and assigned a wide range of local social services, includ-
ing pre-school and basic general education, for which they were assigned sources of tax
revenues and grants (Jakubowski & Topinska 2006). Further administrative reforms in
1999 reduced the number of regional governments—voivods—from 46 to 16 and created
a second tier of local government— powiats between gminas and voivods. Consequently,
there exist in Poland three nested levels of regional and local government—groups of
gminas are located within a single powiat , and each powiat is located in a voivod. The three
levels have separate functions and are not hierarchically subordinate (Bury and Swian-
niewicz 2002).
Having decentralized the administration of education, the government needed to
find a satisfactory method of supplementing the revenues of local governments (LGs)
so that they had suffi cient funding to operate their schools. Per capita (i.e. per student)
funding was introduced as a more equitable and effi cient way of financing LGs for dis-
charging their educational responsibilities than the previous input-based system. It took
a number of years from 1994 to 2000 to develop a genuine per capita funding system
centred on a funding formula whose basic structure has remained unchanged since then.
Political decentralization was the principal driving force behind the introduction of per
capital funding rather than a main focus on increased effi ciency or enhanced school
quality. School financial reforms were accompanied by comprehensive reforms of all
aspects of education. The school structure was changed, the curriculum reformed, new
externally assessed assessments introduced and teachers’ qualifications and pay struc-
ture altered.
This chapter focuses on the development of the per capitafi
nancing system in Po-land from the early 1990s to 2007 and aempts to assess its effects on the Polish educa-
tion system. Section 6.2 reviews the decentralization reforms, education reforms and the
8/6/2019 Reforming Education Finance in Transition Countries
http://slidepdf.com/reader/full/reforming-education-finance-in-transition-countries 223/335
Reforming Education Finance in Transition Countries 199
changes in the school finance system in the 1990s. It also examines the gradual evolution
of per student funding up to 2000 when the current formula was introduced. Sections 6.3
and 6.4 revolve around the design and implementation of the funding formula. Section
6.3 explains the formula in detail, using its 2007 version as an example. It also outlines
aspects of school management in Poland that affect school costs. Section 6.4 discussesthe implementation of the formula in two local governments: an urban one (the city of
Kwidzyn) and a rural one (the Czosnów rural gmina). Section 6.5 presents an assessment
of the impact of the formula on three key domains: effi ciency, equity, and transparency/
accountability. Section 6.6 concludes with key findings.
6.2. Background
In both the communist and pre-World War II period, education in Poland had been cen-
trally run. With the Act on Local Government, 1990, this began to change: gminas were
assigned responsibility for kindergartens and primary schools. All gminas were requiredto take over kindergartens straight away but the devolution of primary schools was ini-
tially on a voluntary basis and was to due to be made compulsory in 1994. The 1991 Edu-
cation Schools System Act did not initiate fundamental changes to the general education
system, which came later, but it did establish advisory school councils, which are made
up equally of elected parents, teachers, and students. It also included legal provisions for
the establishment of private schools. The decentralization of primary education was fur-
ther delayed. In 1993, Parliament, fearing gminas were not yet ready for these additional
responsibilities, postponed the compulsory devolution of primary schools to gminas un-
til 1996, though a gmina could take this on earlier if it wished (MEN 2001). Some cities in
the mid 1990s also took over the running of secondary schools. By 1995–the year before gminas had to take responsibility for primary education–35 percent of primary schools
had been voluntarily been transferred to gminas (Levitas and Herczyński 2002).
Gminas required adequate sources of revenues to undertake the major responsibili-
ties of the local services assigned to them. The Law on Gmina Incomes (1990) guaranteed
gminas a non-earmarked contribution from the state budget for recurrent expenditures
on education. The Law on Gmina Incomes was changed in 1993 to guarantee gminas a
grant for education of 6.6 percent of national budget revenues. As is detailed below,
from 1994 onwards the National Ministry of Education (MEN) was required to develop
a formula2—referred to in Poland as algorithm–for allocating a general purpose grant
to gminas to contribute towards the costs of running schools. This was revised in 1996,with a major redesign in 2000. Thus, fundamental reforms in local government were
intertwined with educational reforms and are diffi cult to summarize both briefly and
clearly–the key events are listed in chronological order in Table 6.1.
The main reason for decentralizing general education to local governments (LGs)
was to promote local democratic institutions and diffuse political power rather than to
use decentralisation as an instrument for improving the quality of education (Jakubows-
ki and Topinska, 2006:2). It was, however, hoped that local governments would be will-
ing to invest more in school facilities than central government and would have the incen-
tive to solve the problem that due to insuffi cient funding in the past many schools had
accumulated debts due to unpaid social insurance contributions and utility bills. Decen-tralization of education was initially challenged by ‘education centralizers’, who wanted
strong central control to push forward more fundamental reforms of the curriculum and
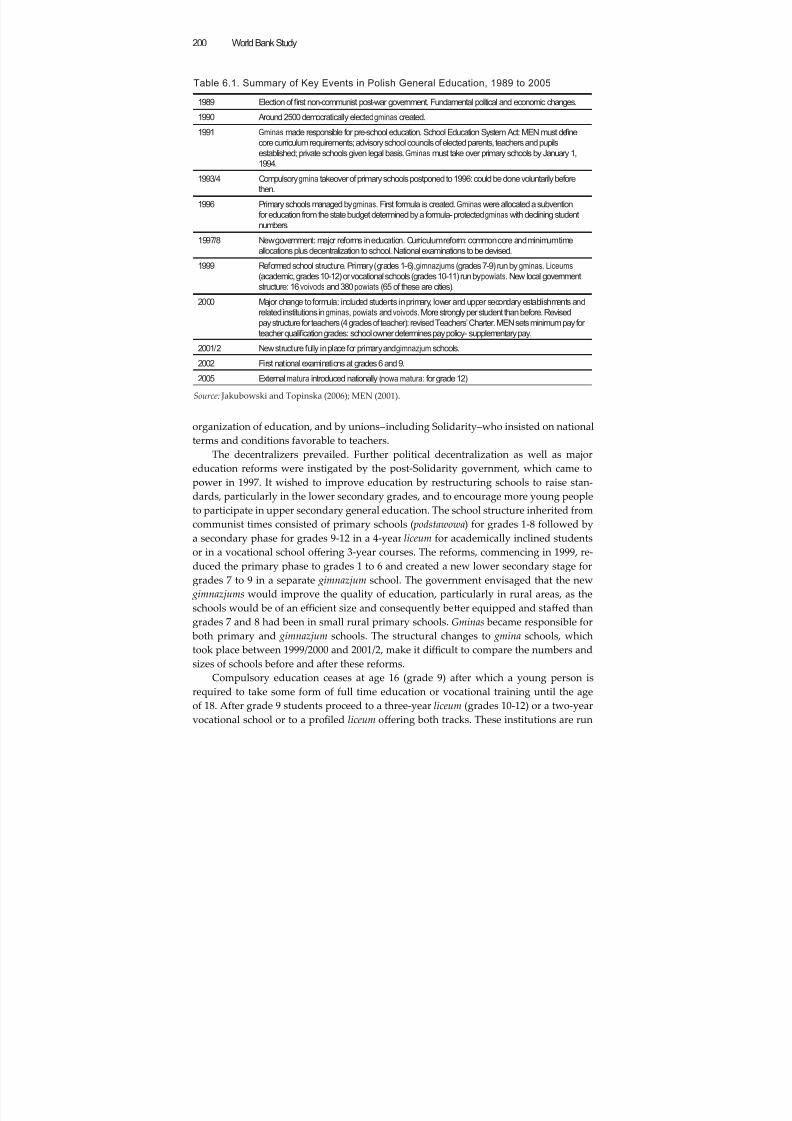
8/6/2019 Reforming Education Finance in Transition Countries
http://slidepdf.com/reader/full/reforming-education-finance-in-transition-countries 224/335
8/6/2019 Reforming Education Finance in Transition Countries
http://slidepdf.com/reader/full/reforming-education-finance-in-transition-countries 225/335
8/6/2019 Reforming Education Finance in Transition Countries
http://slidepdf.com/reader/full/reforming-education-finance-in-transition-countries 226/335
8/6/2019 Reforming Education Finance in Transition Countries
http://slidepdf.com/reader/full/reforming-education-finance-in-transition-countries 227/335
Reforming Education Finance in Transition Countries 203
The formula introduced in 2000 was more genuinely per student than the previous
one. It therefore ‘had a tremendous impact on many gminas because it was no longer
based on historical costs’ (Jakubowksi and Topinska, 2002:6). A disparate set of ad hoc
funding streams for upper secondary education was brought within a single formula
for allocating subvention to all types of general education institutions owned by localgovernments and non-public bodies owning schools eligible for state funding. The 1998
Law on Local Government Revenues specified that 12.4 percent of national budget rev-
enues was to be divided up between local governments for financing education. This
percentage has changed over time. In the new formula, the per student allocations for
urban primary schools and liceums were made equal, though subsequently a weight of
0.08 for post-primary students was introduced. The equalization of funding in favour of
secondary schools in effect shifted funding towards powiats. A significant improvement
in effi ciency incentives for powiats was to replace 27 different per student allocations for
different types of secondary schools by a weight of 1 for liceums and 1.15 for vocational
and professional schools. Some specific kinds of professional/vocational school and non-
school institutions and pupils with various types of special need had their own weights.
The actual per user costs of non-school institutions were used to derive weights applied
per user, thus encouraging powiats with more expensive provision to reduce costs while
enabling those with below average costs to increase per student spending if they so
chose. The additional weights for rural and small town gminas remained6 but an addi-
tional per student allocation was given in relation to the number of students transported
to school. This again gave an effi ciency incentive for local governments to rationalize
their school networks compared to the previous system, which had not funded school
transport in the formula. In total there were 41 categories of student or user defined
weights in the 2000 formula (some of the weights had the same value). The basic struc-
ture of the 2000 formula is still in place in 2007, though there are now 47 weights. These
weights are additive and local governments are allocated funding according to the num-
ber of weighted student units.
A further substantial improvement in effi ciency incentives in the 2000 formula was
that local governments were no longer guaranteed at least last year’s inflation adjusted
allocation. This was replaced by an alternative buffer, which ensured that the alloca-
tion per student could not be cut or be increased above given levels. This meant that
jurisdictions with declining student rolls could experience for the first time since 1996
a reduction year by year in total grant. This clearly put stronger pressure on such localgovernments to cut back on total spending and so slow down the increase in costs per
student as numbers fell.
Since 2000 the weights for rural and small town gminas have tended to change an-
nually, depending on the relative political influence of different gmina interests. Also,
some of the categories of students selected for special weighting have changed. For ex-
ample students transported to schools were dropped from the formula, more categories
of special need have been distinguished and the weight for day students non-public
schools increased to 1. A notable change was the removal of the buffer in 2004, so that
local governments now feel the full effect of declining student numbers on their alloca-
tion. The formula has never included allocations for student expenditure or pre-schoolprovision. Indeed, MEN has avoided being explicit about the types of current education
8/6/2019 Reforming Education Finance in Transition Countries
http://slidepdf.com/reader/full/reforming-education-finance-in-transition-countries 228/335
World Bank Study204
expenditures that the subvention is intended to cover or contribute to (for example, a
basic amount required for teacher salaries as in Estonia), which is a source of complaint
among some LGs.
The formula was created with the involvement of local government stakeholders
and is subject to annual revisions in the course of the negotiations in the Commissionfor Central and Local Governments between representatives of the local government
associations, the Ministry of Finance (MoF), MEN and the kuratoria. The different local
government associations represent rural gminas , metropolises, towns, large cities and
powiats , cities and voivods. These associations have different interests to promote in these
negotiations and do not present a united front. The Commission is concerned with both
the size of the total subvention and the formula distributes it. MEN negotiates with MoF
to reach agreement on teachers’ salaries (negotiated with the Union of Polish Teachers
(or ZNP, in its Polish acronym), the size of the subvention and some additional budget
allocations for education. MEN and the local governments tend to unite in puing pres-
sure on the MoF to increase the subvention, which is ultimately determined by the MoF
subject to the agreement of the Council of Ministers. MEN and the local government
associations negotiate about the various weights in the formula, which are not of much
interest to the MoF. Since the PiS7 led government took power in 2005 it was reported
by observers that MEN no longer had clear policy guidelines to help it steer the negotia-
tions and was mainly concerned with securing agreement between the LGs.
6.3. The Design of the Funding Formula
6.3.1. The Formula in 2007
The structure of the formula since its major re-design in 2000 has remained stable, withminor amendments, such as additional weights or changes in the value of a weight. The
details of the formula are now explained using the 2007 version. For the purposes of
calculating the total subvention it is divided into three parts, SOA, SOB and SOC, each
with its own set of weights.
SOA is for funding the basic educational provision for children in grades 1 to 12,
who aend primary ( podstawowa), gimnazjum and upper secondary schools of various
types and special schools. Kindergarten children from ages up to 6 are not included
in the subvention. The schools that qualify for funding are not only local government
schools but also non-public schools and private schools that have the status of public
schools conditional on teaching the national curriculum and employing qualified teach-ers. SOB is a supplement for more costly forms of educational provision, which have
various additional weights and are given below. SOC is an allocation for types of pro-
visions outside regular teaching activities. It covers care and boarding costs and extra-
curricular provision. This includes special-needs kindergartens, centers for offenders,
social therapy and boarding costs, as well as financial help for students.
Recurrent expenditures are supported by the subvention, not capital expenditures.
The amount of the subvention, SO, that is allocated to local governments by the formula
excludes 0.6 percent, which is retained by MEN as reserves and distributed according to
approved applications from local governments.
Thus the total subvention is SO = SOA + SOB + SOC.
8/6/2019 Reforming Education Finance in Transition Countries
http://slidepdf.com/reader/full/reforming-education-finance-in-transition-countries 229/335
Reforming Education Finance in Transition Countries 205
6.3.1.1. DEFINING THE FINANCIAL STANDARD
SO is the total amount available nationally for allocation to the local governments. It is
predetermined by the MoF and Cabinet of Ministers. The financial standard, A, is the
cash value of an unweighted student. It is derived by dividing SO by the total number
of weighted student units, Up , in the country as a whole. The number of student units
depends not only on the actual number of students in the system, but also on the various
weights aached to different types of student which are summed up to give Up.8 Thus
the financial standard, A = SO ⁄ U p.
The three parts of the subvention are calculated according to a particular set of stu-
dent weights, as given below.
where:
■ Ni is the ith local government. (In total in 2007 there were N=2873 gminas , powi-ats , cities with the rights of powiats and voivods.)
■ Uri is the weighted number of pupils enrolled in day schools and adult schools,
owned by local government i or non-public schools entitled to the subvention
in local government i’s area;
■ Di is teacher salary index for local government i, which will be explained further
below; its purpose is to correct for local government differences in the percent-
ages of teachers in each of the four teacher grades as they have differentiated
basic salaries.
The types of students included in Uri and their weights are shown below. The datawere supplied by the National Statistics Offi ce (GUS) and more recently by MEN’s Sta-
tistical Information System (SIO).
SOA includes:
a. students in public schools for children and youths and also in institutions for
teacher development and for training social workers: coeffi cient is 1;
b. adult students in public schools and students in related teacher and social
worker training institutions: coeffi cient is 0.7;
c. students in non-public schools for children and youths: coeffi cient is 1;
d. adult students in non-public schools: coeffi cient is 0.35.
The second part of the subvention is given below, where i = 1 to N is the same as forSOA.
where:
■ Uui is the weighted number of students in local government i for which there
are additional allocations because educational provision for these students is
expected to cost more than the basic amounts allocated in part SOA.
There are 27 weights in this part of the formula, as listed below from P1 to P27.
■ P1 = 0.38 for primary and gimnazjum students in rural local governments and
town with fewer than 5000 inhabitants
8/6/2019 Reforming Education Finance in Transition Countries
http://slidepdf.com/reader/full/reforming-education-finance-in-transition-countries 230/335
World Bank Study206
■ P2 = 1.40 for students with moderate learning diffi culties
■ P3 = 2.9 for students who are blind or partially sighted, who are disabled or who
have learning diffi culties
■ P4 = 3.6 for students who are deaf or partially deaf, or with severe learning dif-
ficulties,■ P5 = 9.5 for children and youths with very severe learning diffi culties who at-
tend special schools
■ P6 = 0.8 for handicapped students with motor problems who aend an inte-
grated class in a mainstream school
■ P7 = 0.08 for students in post-primary schools
■ P8 = 0.15 for students in vocational schools
■ P9 = 0.2 for students who are from national minorities and local students who
speak a regional dialect and need additional lessons in Polish
■ P10= 1.50 for the above students who receive additional lessons when there are
fewer than 84 of such students in primary grades and fewer than 42 in gim-
nazjum and upper secondary grades. If P10 is received then P9 is not included.
■ P11 = 0.2 for students in sports classes
■ P12 = 1.00 for students in master of sports classes
■ P13 = 1.00 for students taking vocational course for the health professions
■ P14 = 1.01 for students in music schools grade 1
■ P15 = 1.70 for students in music schools grade 2
■ P16 = 2.01 for students in general music schools grade 1
■ P17 = 3.36 for students in general music schools grade 2
■ P18
= 0.92 for students in art schools
■ P19 = 1.35 for students in general fine art schools
■ P20 = 3.42 for students in ballet schools
■ P21 = 1.00 for students in teacher training schools
■ P22 = 1.00 for students in various vocational schools for medical occupations
■ P23 = 1.84 for primary and post-primary students, taking part in out of school
classes organized in health institutes
■ P24 = 0.6 catch up classes for students falling behind
■ P25 = 0.17 for bilingual students
■ P26= 0.04 for students in gimnazjums
■
P27 = 3 for students taking maritime and inland waterways vocational courses.All the weights are additive. If a student belongs to more than one category the
weights for that student are added. The weights are derived from estimates of the dif-
ferences in the relative costs per student of the different types of provision. These rela-
tive cost differences have been studied by MEN’s experts, recommendations made and
debated in the Commission, which agreed to the weights. The number of weighted stu-
dents in local government i is summed over the 27 categories and is expressed as:
where:
■ Pk is the kth weight and Nki is the number of students with weight k in local
government i.
8/6/2019 Reforming Education Finance in Transition Countries
http://slidepdf.com/reader/full/reforming-education-finance-in-transition-countries 231/335
8/6/2019 Reforming Education Finance in Transition Countries
http://slidepdf.com/reader/full/reforming-education-finance-in-transition-countries 232/335
World Bank Study208
6.3.1.2. THE TEACHER SALARY INDEX
The teacher salary index is needed because there are four grades of teacher, each with a
different basic salary. Consequently, expenditure on teacher salaries in each local gov-
ernment depends on the proportion of teachers in each grade as well as on the total
number of teachers. The LG does not control the proportion of teachers in each grade,
which consideration is used to justify the inclusion of this index in the formula. Each LG
has its own index, Di.
The four salary grades and the percentage of their salary in relation to the average
salary base line established annually by law are:
■ Novice teacher: 82%
■ Contract teacher: 125%
■ Nominated teacher: 175%
■ Diploma teacher: 225%
■ Di is the index for correcting local governments according to the formula:
Di = W r + (1-W r)W ai
where:
■ Wr is the index of expenses for goods and for salaries of administrators in local
governments and its weight is 0.2;
■ Wai is the the index of the four grades of teacher.
The index of the four grades of teacher is made up of two parts. The first part is
the weighted average of teacher salaries for the local government and the second part
is an additional weight for rural local governments and for towns with less than 5000
inhabitants.
where:
■ Pks is the national average salary of novice teacher;
■ Pkk is the national average salary of contract teacher;
■ Pkm is the national average salary of nominated teacher;
■ Pkd
is the national average salary of diploma teacher;
■ Wsi is the number of novice teachers employed in local government i schools;
■ Wki is the number of contract teachers employed in local government i schools;
■ Wmi is the number of nominated teachers employed in local government i
schools;
■ Wsi is the number of diploma teachers employed in local government i schools;
■ Wsk is the number of novice teachers in the country as a whole;
■ Wkk is the number of contract teachers in the country as a whole;
■ Wmk is the number of nominated teachers in the country as a whole;
■ Wdk is the number of diploma teachers in the country as a whole;
■
R = 0.12 is an additional weight for the cost of teachers in rural gminas and townswith fewer than 5000 inhabitants; for the rest R= 0;
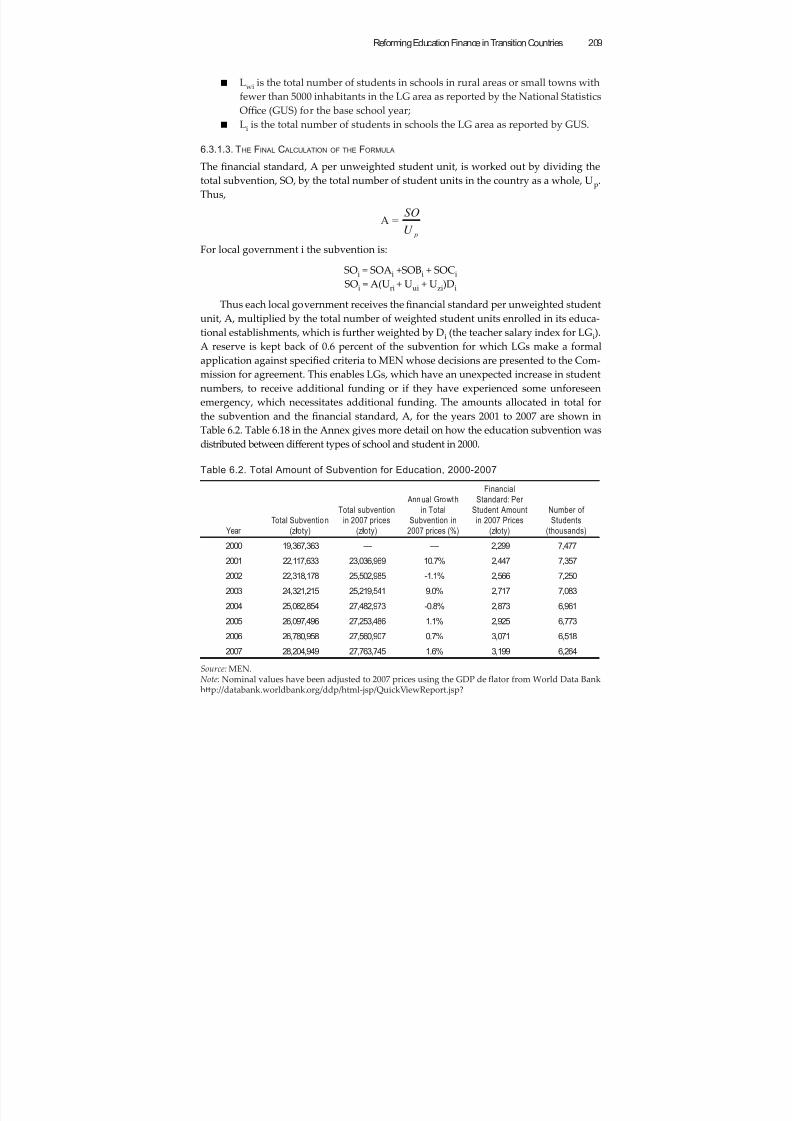
8/6/2019 Reforming Education Finance in Transition Countries
http://slidepdf.com/reader/full/reforming-education-finance-in-transition-countries 233/335
8/6/2019 Reforming Education Finance in Transition Countries
http://slidepdf.com/reader/full/reforming-education-finance-in-transition-countries 234/335
World Bank Study210
6.3.2. The Management of Schools in Poland
The subvention is not earmarked, so local governments can spend less than the subven-
tion on education or add more from their own revenue sources. The revenue sources
of gminas and powiats include a share of national personal and corporate income taxes,
which are decided by law and can vary year by year.10 In addition, gminas can collect
local taxes from agriculture, real estate, vehicles and stamp duty. Gminas also obtain rev-
enues from property, and charges for services. Property tax on average forms 15 to 17%
of the gminas’ revenues. Subventions in 2007 made up 36% of gmina revenues of which
24% was for education.
It is up to gminas and powiats to determine the amount they spend on education and
how they allocate this to schools. In making these decisions local governments are con-
strained by several key regulations.
■ The number of lessons per week that students must be taught the national cur-
riculum: this is expressed as a given number of lessons per subject over a threegrade range (1-3, 4-6, 7-9, and 10-12) and so provides some minor flexibility
within each grade. In addition, local governments (LGs) can add extra hours for
optional subjects and extra-curricular activities.
■ Teachers are required to teach only 18 (45 minute) lessons per week—this is
known as the pensum—and was enshrined in the Teachers’ Charter in 1982.11
■ Teacher salaries are set mainly according to criteria in the Teachers’ Charter.
This was revised in 2000 to create four levels of teacher: novice, contract, nomi-
nated and diploma, who receive respectively 82%, 125%, 175% and 225% of the
basic pay for the profession, which is defined annually.12 To reach nominated
and diploma grades teachers must submit an application, to the kuratoria witha portfolio of evidence about their activities as teachers.13 Most teachers who
apply for the two higher grades are successful. The Teachers’ Charter also con-
tains provisions for additional payments for extra responsibilities, such as form
tutoring, and ‘motivation’, which largely refers to undertaking extracurricular
activities with students or participating in and contributing to professional de-
velopment. A key point is that LGs have limited control over the teacher sala-
ries they have to pay to teachers once they are on the payroll, since the LG
has no say in teacher promotions to higher grades. LGs are required to set the
bonuses for additional teacher pay so that on average in their schools teachers
in each grade receive at least the basic salary for their grade (OECD 2006). LGs
complain that they are required to pay for increases in teacher salary costs, in
particular those which arose from promotions, which are not fully reflected in
the education subvention.
■ It is very diffi cult for LGs to dismiss surplus teachers: this can only be done
when a school is closed and even then the LG has an obligation to redeploy
teachers in another local school.14 LGs can dismiss a teacher for incompetence
if negatively evaluated by the school director, but these provisions are rarely
used.
■ A LG cannot close a school without the approval of the kuratorium , though the
laer has no means to offer financial support to the LG.15
8/6/2019 Reforming Education Finance in Transition Countries
http://slidepdf.com/reader/full/reforming-education-finance-in-transition-countries 235/335
Reforming Education Finance in Transition Countries 211
The areas of flexibility for LGs are that there are no maximum or minimum class siz-
es defined by MEN or nationally defined norms for non-teaching staff posts at schools.
There is also a role for the LG in defining the criteria for teachers’ additional pay, above
the average for each grade in the LG’s schools that must equal the salary norm set by
MEN. However, LGs regard themselves are severely constrained in their ability to influ-ence the number of teaching hours that schools employ. Regulations stipulate that for
the start of the school year, the school director prepares an organizational plan which
details the subject lessons and hours taught to each class and the teachers employed to
provide these lessons. The kuratorium , not the LG, approves the plan. LGs have freedom
in determining non-teaching staff positions, and expenditures on learning materials,
school maintenance and student expenditure, subject to adhering to health and safety
regulations.
6.3.2.1. RESOLVING TENSIONS BETWEEN DEMAND FOR AND SUPPLY OF SCHOOL FUNDING
In Poland the tensions between the financial needs of schools and the available fund-ing is resolved first in the Commission of Central and Local Governments, which tries
to influence the total subvention the MoF sets and has a strong say on the formula and
how it shares out the total cake. The final conflicts between the demand for and sup-
ply of resources are resolved by the gminas and powiats. Gminas either find additional
resources on out of their own revenues or put pressure on schools to increase class size
or close schools altogether. Powiats have fewer own resources and classes in liceums tend
to be large. One powiat education director maintained that vocational schools are under-
funded by the MEN formula with the result that he has had to close vocational courses.
Consequently, more training is done within companies with schools providing general
education courses to trainees.16 The conflicts between local and central government overthe volume and distribution of education funding are endemic in any system where cen-
tral and local governments share responsibility, especially one where local governments
are relatively strong compared to coalition based central governments, but these dis-
agreements are generally accepted as natural in a plural, democratic society. The most
pressing issue is the determination of teachers’ pay and how it is funded. LGs like to
argue that they cannot control teacher salary costs and therefore that central government
should ensure that all increases in salary costs are covered by increased subvention. One
instance indicates the power that LGs can exert. At the time of the creation of gimnazjums
many LGs increased the employment of teachers and some had to borrow to fund the
consequent salary costs because the subvention was insuffi cient. These loans were sub-sequently paid off by the state budget—with interest (MEN, 2001).
6.3.2.2. HOW LOCAL GOVERNMENTS FINANCE THEIR SCHOOLS
Most local governments use an input-based system for determining schools budgets.
This was the case in two small rural gminas visited, Czosnów and Lubicz (data were
collected on the former). Each school’s organizational plan, over which the gmina has
limited influence since it must meet MEN criteria and be approved by the kuratorium ,
determines the main part of the school budget. The school budget is agreed between the
school and the wójt (mayor) and approved by the council. In small gminas , with a hand-
ful of schools, the relationship between schools and the LG are close and school directorscan make personal cases for resources.
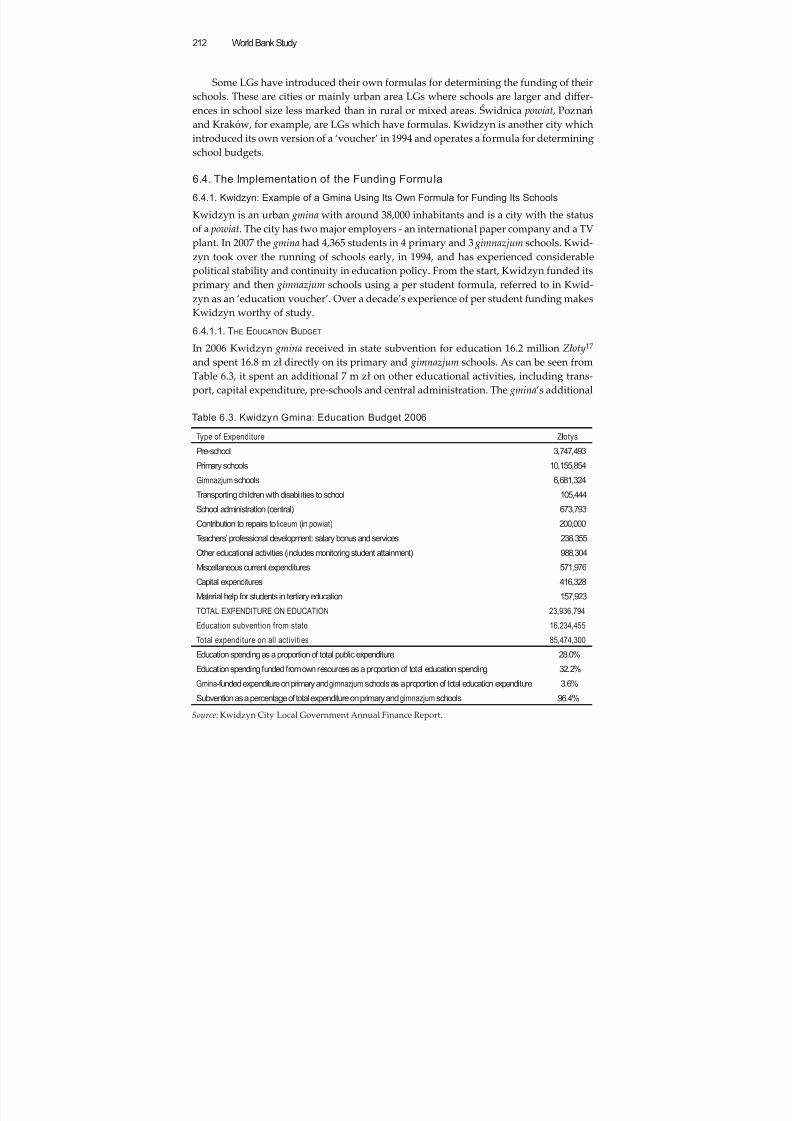
8/6/2019 Reforming Education Finance in Transition Countries
http://slidepdf.com/reader/full/reforming-education-finance-in-transition-countries 236/335
World Bank Study212
Some LGs have introduced their own formulas for determining the funding of their
schools. These are cities or mainly urban area LGs where schools are larger and differ-
ences in school size less marked than in rural or mixed areas. Świdnica powiat , Poznań
and Kraków, for example, are LGs which have formulas. Kwidzyn is another city which
introduced its own version of a ‘voucher’ in 1994 and operates a formula for determiningschool budgets.
6.4. The Implementation of the Funding Formula
6.4.1. Kwidzyn: Example of a Gmina Using Its Own Formula for Funding Its Schools
Kwidzyn is an urban gmina with around 38,000 inhabitants and is a city with the status
of a powiat. The city has two major employers - an international paper company and a TV
plant. In 2007 the gmina had 4,365 students in 4 primary and 3 gimnazjum schools. Kwid-
zyn took over the running of schools early, in 1994, and has experienced considerable
political stability and continuity in education policy. From the start, Kwidzyn funded itsprimary and then gimnazjum schools using a per student formula, referred to in Kwid-
zyn as an ‘education voucher’. Over a decade’s experience of per student funding makes
Kwidzyn worthy of study.
6.4.1.1. THE EDUCATION BUDGET
In 2006 Kwidzyn gmina received in state subvention for education 16.2 million Z ł oty17
and spent 16.8 m z ł directly on its primary and gimnazjum schools. As can be seen from
Table 6.3, it spent an additional 7 m z ł on other educational activities, including trans-
port, capital expenditure, pre-schools and central administration. The gmina’s additional
Table 6.3. Kwidzyn Gmina: Education Budget 2006
Type of Expenditure Złotys
Pre-school 3,747,493
Primary schools 10,155,854
Gimnazjum schools 6,681,324
Transporting children with disabilities to school 105,444
School administration (central) 673,793
Contribution to repairs to liceum (in powiat) 200,000
Teachers’ professional development: salary bonus and services 238,355
Other educational activities (includes monitoring student attainment) 988,304
Miscellaneous current expenditures 571,976
Capital expenditures 416,328
Material help for students in tertiary education 157,923
TOTAL EXPENDITURE ON EDUCATION 23,936,794
Education subvention from state 16,234,455
Total expenditure on all activities 85,474,300
Education spending as a proportion of total public expenditure 28.0%
Education spending funded from own resources as a proportion of total education spending 32.2%
Gmina-funded expenditure on primary andgimnazjum schools as a proportion of total education expenditure 3.6%Subvention as a percentage of total expenditure on primary and gimnazjum schools 96.4%
Source: Kwidzyn City Local Government Annual Finance Report.
8/6/2019 Reforming Education Finance in Transition Countries
http://slidepdf.com/reader/full/reforming-education-finance-in-transition-countries 237/335
Reforming Education Finance in Transition Countries 213
contribution to direct spending on primary and gimnazjum schools was only 3.7% of
the state subvention, but when all expenditures on education are considered, Kwidzyn
funded 32 percent from its own resources. In 2006 education accounted for 28 percent of
Kwidzyn’s total expenditure.
6.4.1.2. HOW SCHOOLS ARE FUNDED IN KWIDZYN
Kwidzyn adopted per student funding because the gmina council believes in the prin-
ciple of subsidiarity:
“At the center we do not believe we know beer than the school direc-
tors what their needs are. We tell them how much we can afford to
let them have and they decide how to manage it.” (R. Bera;18 Deputy
Mayor: interview).
Kwidzyn refers to its formula as determining the value of an education voucher,
therefore this term will be used. Although referred to as an ‘education voucher’, themoney for each student enrolled at a school goes directly to the school and not via par-
ents. One of the objectives of introducing vouchers was to foster more competition be-
tween schools in order to encourage them to improve their quality.19 School choice by
parents is governed by rules that are common throughout Poland. Each school has a
catchment or reserve area and pupils from this area are givenfirst preference for admis-
sion to the school. Parents can send their child to a school outside their catchment area if
it has a spare place. The school director can choose how many students to recruit, subject
to approval of the annual organizational plan by the local government.
Kwidzyn bases the per student value of the ‘voucher’ on an activity-led model of
its schools: it makes explicit the input standards it is funding. The calculation of thevoucher is divided into three parts: (A) teaching staff salaries (81%), (B) non- teaching
staff salaries (7%), and (C) non-staff expenditures (12%). Capital expenditure is allocated
separately. The breakdown of the three parts of the ‘voucher’ for the 7 schools and their
values are shown in Table 6.4. Parts B and C have the same value for all schools but Part
A varies in value to take account of teacher salary differences in schools (due to the four
teacher grades). Kwidzyn reckons that its schools need to have over 500 students to be
financially viable. However, the council has decided to retain the smallest gimnazjum
because it is needed on the city outskirts. It is therefore funded 15 percent more for Part
A to cover its higher unit costs.
The allocation per student for teacher salaries for each school is based on an ex-plicit input standard. The average class size funded for teaching is 26 pupils. This class
size, given the number of students at the school, determines the number of classes (in
fractions) needed in each grade. The number of classes is multiplied by the number of
lessons per week students in each grade receive (24 for primary grades 1 to 3, 32 for pri-
mary grades 4 and 5, 33 for primary grade 6, 34 for the first grade of gimnazjum and 35
for grades 2 and 3). This gives the number of lessons a week needed for each grade. This
is then divided by 18 lessons—the teaching load of a teacher—to derive the number of
teachers needed for each grade and the total for the school is then derived. Additional
teaching staff are added (see Annex A, Table 6.20) for director and deputies, educational
psychologist, child carers and librarians, the full time equivalent posts varying with size
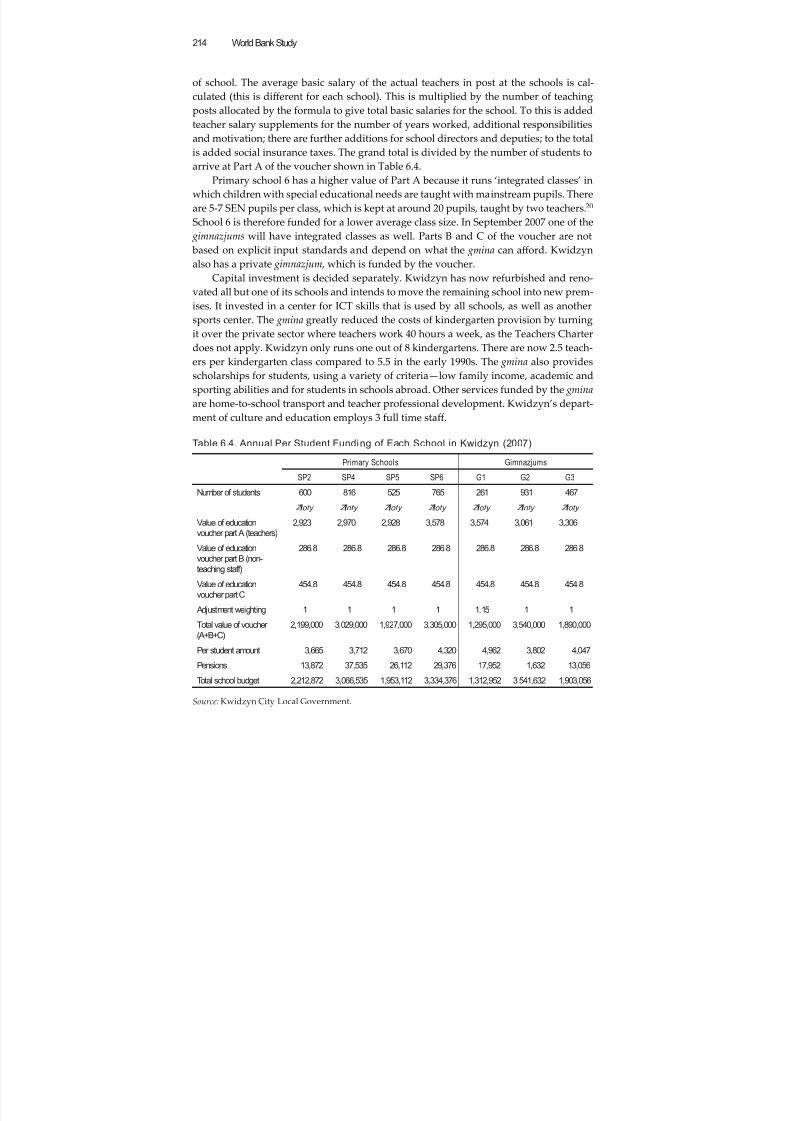
8/6/2019 Reforming Education Finance in Transition Countries
http://slidepdf.com/reader/full/reforming-education-finance-in-transition-countries 238/335
World Bank Study214
of school. The average basic salary of the actual teachers in post at the schools is cal-
culated (this is different for each school). This is multiplied by the number of teaching
posts allocated by the formula to give total basic salaries for the school. To this is added
teacher salary supplements for the number of years worked, additional responsibilities
and motivation; there are further additions for school directors and deputies; to the totalis added social insurance taxes. The grand total is divided by the number of students to
arrive at Part A of the voucher shown in Table 6.4.
Primary school 6 has a higher value of Part A because it runs ‘integrated classes’ in
which children with special educational needs are taught with mainstream pupils. There
are 5-7 SEN pupils per class, which is kept at around 20 pupils, taught by two teachers.20
School 6 is therefore funded for a lower average class size. In September 2007 one of the
gimnazjums will have integrated classes as well. Parts B and C of the voucher are not
based on explicit input standards and depend on what the gmina can afford. Kwidzyn
also has a private gimnazjum , which is funded by the voucher.
Capital investment is decided separately. Kwidzyn has now refurbished and reno-
vated all but one of its schools and intends to move the remaining school into new prem-
ises. It invested in a center for ICT skills that is used by all schools, as well as another
sports center. The gmina greatly reduced the costs of kindergarten provision by turning
it over the private sector where teachers work 40 hours a week, as the Teachers Charter
does not apply. Kwidzyn only runs one out of 8 kindergartens. There are now 2.5 teach-
ers per kindergarten class compared to 5.5 in the early 1990s. The gmina also provides
scholarships for students, using a variety of criteria—low family income, academic and
sporting abilities and for students in schools abroad. Other services funded by the gmina
are home-to-school transport and teacher professional development. Kwidzyn’s depart-
ment of culture and education employs 3 full time staff.
Table 6.4. Annual Per Student Funding of Each School in Kwidzyn (2007)
Primary Schools Gimnazjums
SP2 SP4 SP5 SP6 G1 G2 G3
Number of students 600 816 525 765 261 931 467
Z ł oty Z ł oty Z ł oty Z ł oty Z ł oty Z ł oty Z ł oty
Value of education
voucher part A (teachers)
2,923 2,970 2,928 3,578 3,574 3,061 3,306
Value of educationvoucher part B (non-
teaching staff)
286.8 286.8 286.8 286.8 286.8 286.8 286.8
Value of education
voucher part C
454.8 454.8 454.8 454.8 454.8 454.8 454.8
Adjustment weighting 1 1 1 1 1.15 1 1
Total value of voucher
(A+B+C)
2,199,000 3,029,000 1,927,000 3,305,000 1,295,000 3,540,000 1,890,000
Per student amount 3,665 3,712 3,670 4,320 4,962 3,802 4,047
Pensions 13,872 37,535 26,112 29,376 17,952 1,632 13,056
Total school budget 2,212,872 3,066,535 1,953,112 3,334,376 1,312,952 3,541,632 1,903,056
Source: Kwidzyn City Local Government.
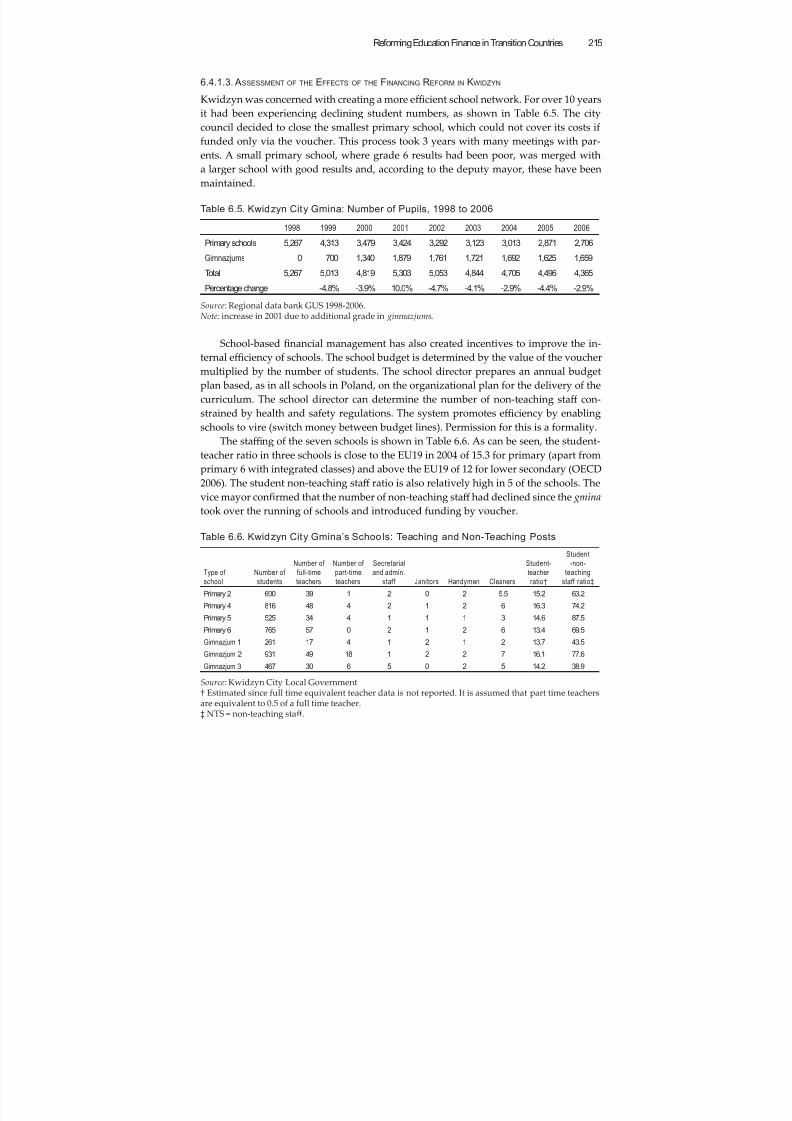
8/6/2019 Reforming Education Finance in Transition Countries
http://slidepdf.com/reader/full/reforming-education-finance-in-transition-countries 239/335
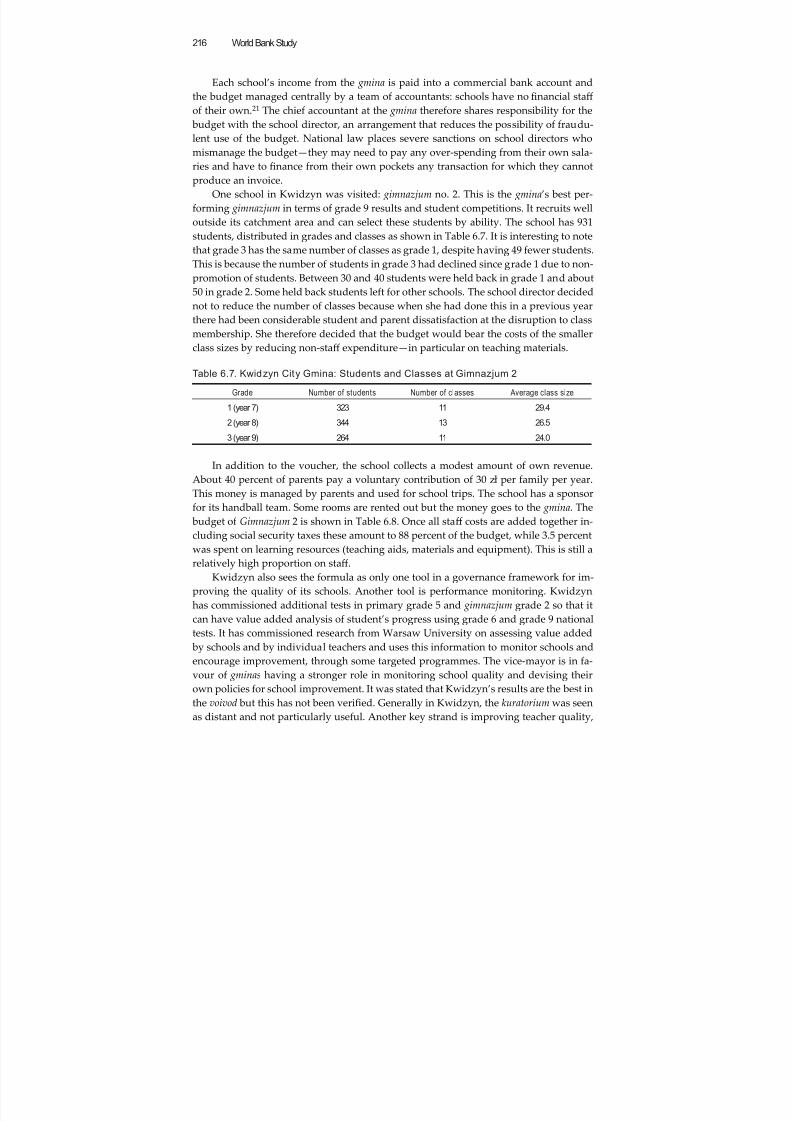
8/6/2019 Reforming Education Finance in Transition Countries
http://slidepdf.com/reader/full/reforming-education-finance-in-transition-countries 240/335
World Bank Study216
Each school’s income from the gmina is paid into a commercial bank account and
the budget managed centrally by a team of accountants: schools have no financial staff
of their own.21 The chief accountant at the gmina therefore shares responsibility for the
budget with the school director, an arrangement that reduces the possibility of fraudu-
lent use of the budget. National law places severe sanctions on school directors whomismanage the budget—they may need to pay any over-spending from their own sala-
ries and have to finance from their own pockets any transaction for which they cannot
produce an invoice.
One school in Kwidzyn was visited: gimnazjum no. 2. This is the gmina’s best per-
forming gimnazjum in terms of grade 9 results and student competitions. It recruits well
outside its catchment area and can select these students by ability. The school has 931
students, distributed in grades and classes as shown in Table 6.7. It is interesting to note
that grade 3 has the same number of classes as grade 1, despite having 49 fewer students.
This is because the number of students in grade 3 had declined since grade 1 due to non-
promotion of students. Between 30 and 40 students were held back in grade 1 and about
50 in grade 2. Some held back students left for other schools. The school director decided
not to reduce the number of classes because when she had done this in a previous year
there had been considerable student and parent dissatisfaction at the disruption to class
membership. She therefore decided that the budget would bear the costs of the smaller
class sizes by reducing non-staff expenditure—in particular on teaching materials.
Table 6.7. Kwidzyn City Gmina: Students and Classes at Gimnazjum 2
Grade Number of students Number of classes Average class size
1 (year 7) 323 11 29.42 (year 8) 344 13 26.5
3 (year 9) 264 11 24.0
In addition to the voucher, the school collects a modest amount of own revenue.
About 40 percent of parents pay a voluntary contribution of 30 z ł per family per year.
This money is managed by parents and used for school trips. The school has a sponsor
for its handball team. Some rooms are rented out but the money goes to the gmina. The
budget of Gimnazjum 2 is shown in Table 6.8. Once all staff costs are added together in-
cluding social security taxes these amount to 88 percent of the budget, while 3.5 percent
was spent on learning resources (teaching aids, materials and equipment). This is still arelatively high proportion on staff.
Kwidzyn also sees the formula as only one tool in a governance framework for im-
proving the quality of its schools. Another tool is performance monitoring. Kwidzyn
has commissioned additional tests in primary grade 5 and gimnazjum grade 2 so that it
can have value added analysis of student’s progress using grade 6 and grade 9 national
tests. It has commissioned research from Warsaw University on assessing value added
by schools and by individual teachers and uses this information to monitor schools and
encourage improvement, through some targeted programmes. The vice-mayor is in fa-
vour of gminas having a stronger role in monitoring school quality and devising their
own policies for school improvement. It was stated that Kwidzyn’s results are the best inthe voivod but this has not been verified. Generally in Kwidzyn, the kuratorium was seen
as distant and not particularly useful. Another key strand is improving teacher quality,
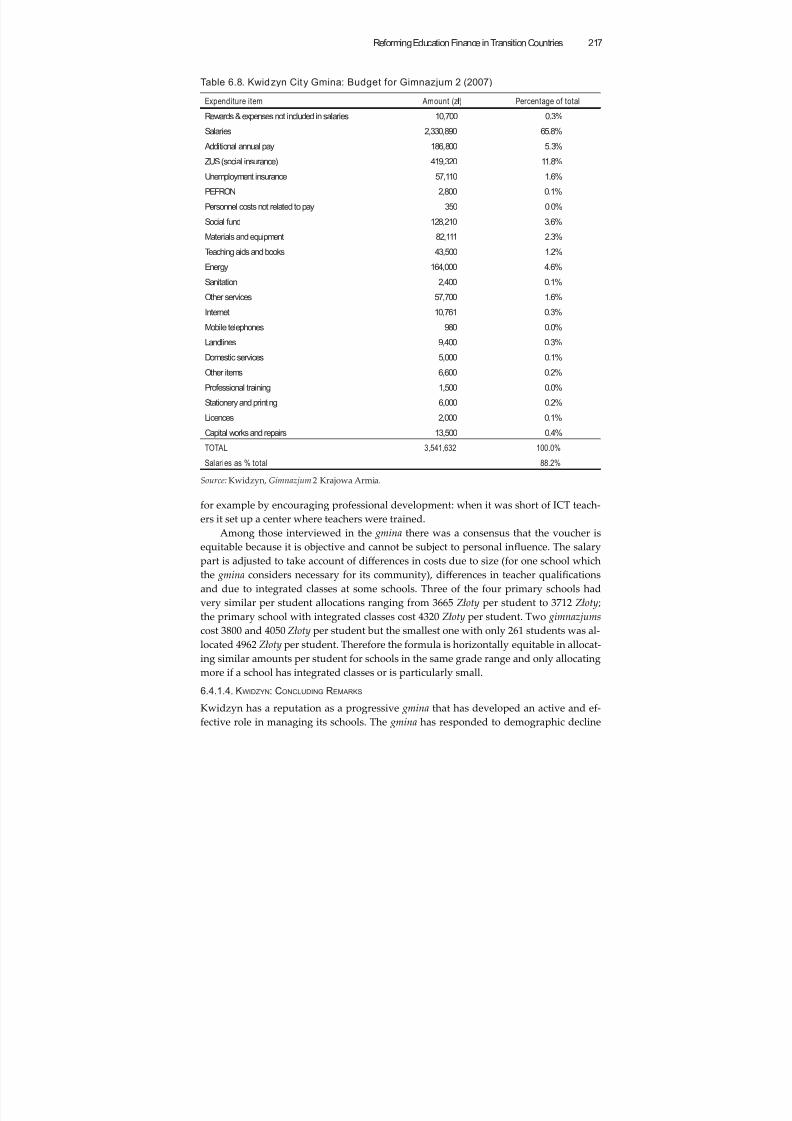
8/6/2019 Reforming Education Finance in Transition Countries
http://slidepdf.com/reader/full/reforming-education-finance-in-transition-countries 241/335
Reforming Education Finance in Transition Countries 217
for example by encouraging professional development: when it was short of ICT teach-
ers it set up a center where teachers were trained.
Among those interviewed in the gmina there was a consensus that the voucher is
equitable because it is objective and cannot be subject to personal influence. The salarypart is adjusted to take account of differences in costs due to size (for one school which
the gmina considers necessary for its community), differences in teacher qualifications
and due to integrated classes at some schools. Three of the four primary schools had
very similar per student allocations ranging from 3665 Z ł oty per student to 3712 Z ł oty;
the primary school with integrated classes cost 4320 Z ł oty per student. Two gimnazjums
cost 3800 and 4050 Z ł oty per student but the smallest one with only 261 students was al-
located 4962 Z ł oty per student. Therefore the formula is horizontally equitable in allocat-
ing similar amounts per student for schools in the same grade range and only allocating
more if a school has integrated classes or is particularly small.
6.4.1.4. KWIDZYN: CONCLUDING REMARKS
Kwidzyn has a reputation as a progressive gmina that has developed an active and ef-
fective role in managing its schools. The gmina has responded to demographic decline
Table 6.8. Kwidzyn City Gmina: Budget for Gimnazjum 2 (2007)
Expenditure item Amount (zł) Percentage of total
Rewards & expenses not included in salaries 10,700 0.3%
Salaries 2,330,890 65.8%
Additional annual pay 186,800 5.3%
ZUS (social insurance) 419,320 11.8%
Unemployment insurance 57,110 1.6%
PEFRON 2,800 0.1%
Personnel costs not related to pay 350 0.0%
Social fund 128,210 3.6%
Materials and equipment 82,111 2.3%
Teaching aids and books 43,500 1.2%
Energy 164,000 4.6%
Sanitation 2,400 0.1%
Other services 57,700 1.6%
Internet 10,761 0.3%
Mobile telephones 980 0.0%
Landlines 9,400 0.3%
Domestic services 5,000 0.1%
Other items 6,600 0.2%
Professional training 1,500 0.0%
Stationery and printing 6,000 0.2%
Licences 2,000 0.1%
Capital works and repairs 13,500 0.4%
TOTAL 3,541,632 100.0%
Salaries as % total 88.2%
Source: Kwidzyn, Gimnazjum 2 Krajowa Armia.
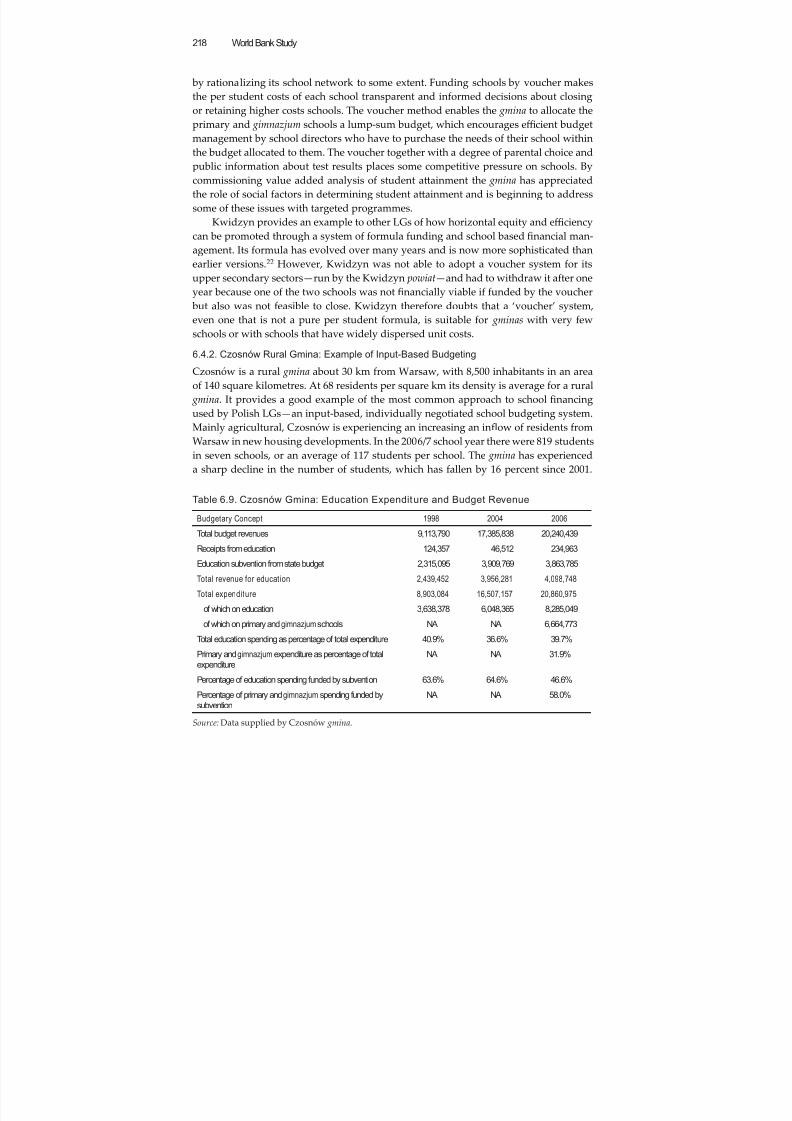
8/6/2019 Reforming Education Finance in Transition Countries
http://slidepdf.com/reader/full/reforming-education-finance-in-transition-countries 242/335
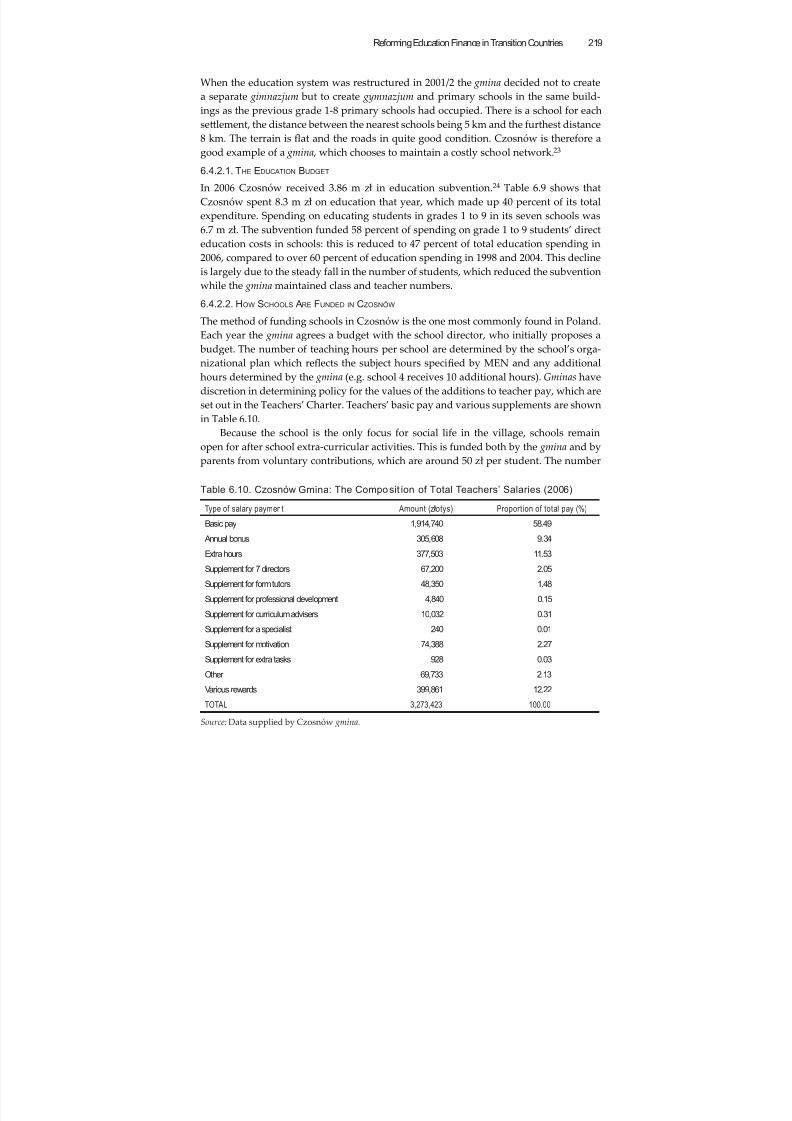
8/6/2019 Reforming Education Finance in Transition Countries
http://slidepdf.com/reader/full/reforming-education-finance-in-transition-countries 243/335
Reforming Education Finance in Transition Countries 219
When the education system was restructured in 2001/2 the gmina decided not to create
a separate gimnazjum but to create gymnazjum and primary schools in the same build-
ings as the previous grade 1-8 primary schools had occupied. There is a school for each
selement, the distance between the nearest schools being 5 km and the furthest distance
8 km. The terrain is flat and the roads in quite good condition. Czosnów is therefore agood example of a gmina , which chooses to maintain a costly school network.23
6.4.2.1. THE EDUCATION BUDGET
In 2006 Czosnów received 3.86 m z ł in education subvention.24 Table 6.9 shows that
Czosnów spent 8.3 m z ł on education that year, which made up 40 percent of its total
expenditure. Spending on educating students in grades 1 to 9 in its seven schools was
6.7 m z ł . The subvention funded 58 percent of spending on grade 1 to 9 students’ direct
education costs in schools: this is reduced to 47 percent of total education spending in
2006, compared to over 60 percent of education spending in 1998 and 2004. This decline
is largely due to the steady fall in the number of students, which reduced the subventionwhile the gmina maintained class and teacher numbers.
6.4.2.2. HOW SCHOOLS ARE FUNDED IN CZOSNÓW
The method of funding schools in Czosnów is the one most commonly found in Poland.
Each year the gmina agrees a budget with the school director, who initially proposes a
budget. The number of teaching hours per school are determined by the school’s orga-
nizational plan which reflects the subject hours specified by MEN and any additional
hours determined by the gmina (e.g. school 4 receives 10 additional hours). Gminas have
discretion in determining policy for the values of the additions to teacher pay, which are
set out in the Teachers’ Charter. Teachers’ basic pay and various supplements are shown
in Table 6.10.
Because the school is the only focus for social life in the village, schools remain
open for after school extra-curricular activities. This is funded both by the gmina and by
parents from voluntary contributions, which are around 50 z ł per student. The number
Table 6.10. Czosnów Gmina: The Composit ion of Total Teachers’ Salaries (2006)
Type of salary payment Amount (złotys) Proportion of total pay (%)
Basic pay 1,914,740 58.49
Annual bonus 305,608 9.34
Extra hours 377,503 11.53
Supplement for 7 directors 67,200 2.05
Supplement for form tutors 48,350 1.48
Supplement for professional development 4,840 0.15
Supplement for curriculum advisers 10,032 0.31
Supplement for a specialist 240 0.01
Supplement for motivation 74,388 2.27
Supplement for extra tasks 928 0.03
Other 69,733 2.13
Various rewards 399,861 12.22
TOTAL 3,273,423 100.00
Source: Data supplied by Czosnów gmina.
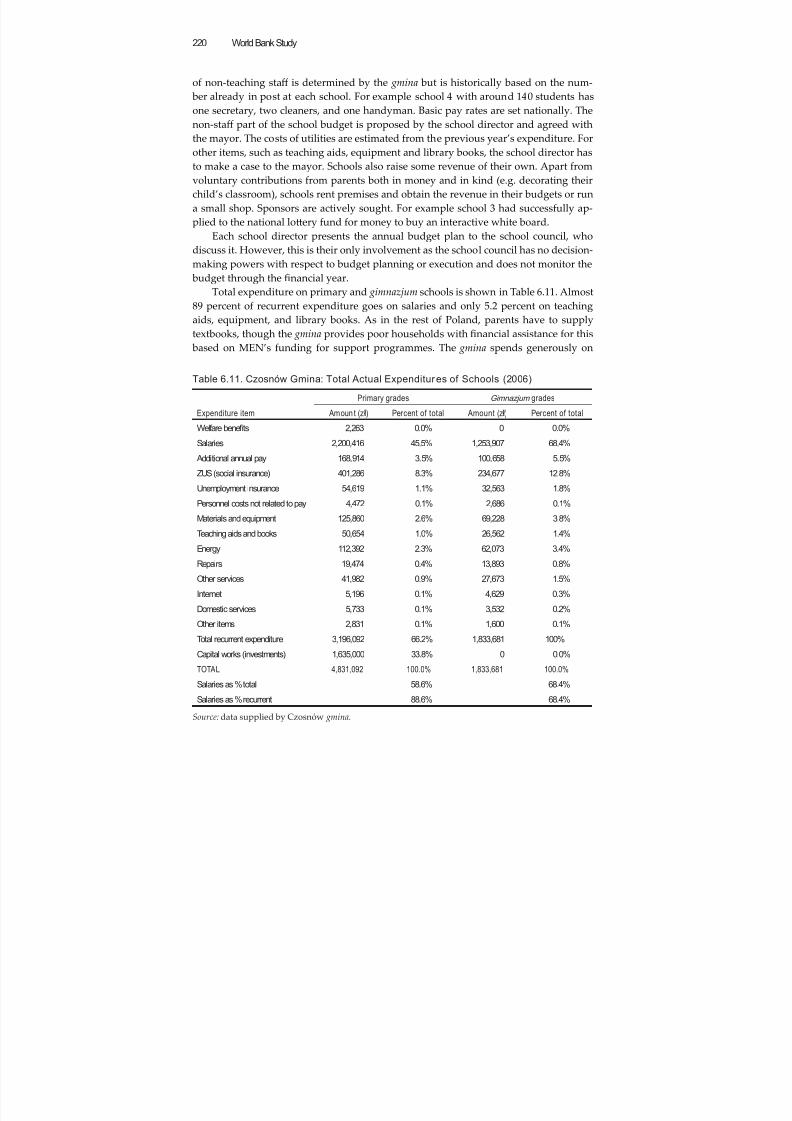
8/6/2019 Reforming Education Finance in Transition Countries
http://slidepdf.com/reader/full/reforming-education-finance-in-transition-countries 244/335
World Bank Study220
of non-teaching staff is determined by the gmina but is historically based on the num-
ber already in post at each school. For example school 4 with around 140 students has
one secretary, two cleaners, and one handyman. Basic pay rates are set nationally. The
non-staff part of the school budget is proposed by the school director and agreed with
the mayor. The costs of utilities are estimated from the previous year’s expenditure. Forother items, such as teaching aids, equipment and library books, the school director has
to make a case to the mayor. Schools also raise some revenue of their own. Apart from
voluntary contributions from parents both in money and in kind (e.g. decorating their
child’s classroom), schools rent premises and obtain the revenue in their budgets or run
a small shop. Sponsors are actively sought. For example school 3 had successfully ap-
plied to the national loery fund for money to buy an interactive white board.
Each school director presents the annual budget plan to the school council, who
discuss it. However, this is their only involvement as the school council has no decision-
making powers with respect to budget planning or execution and does not monitor the
budget through the financial year.
Total expenditure on primary and gimnazjum schools is shown in Table 6.11. Almost
89 percent of recurrent expenditure goes on salaries and only 5.2 percent on teaching
aids, equipment, and library books. As in the rest of Poland, parents have to supply
textbooks, though the gmina provides poor households with financial assistance for this
based on MEN’s funding for support programmes. The gmina spends generously on
Table 6.11. Czosnów Gmina: Total Actual Expenditures of Schools (2006)
Expenditure item
Primary grades Gimnazjum grades
Amoun t (zł) Percent of total Amount (zł) Percent of total
Welfare benefits 2,263 0.0% 0 0.0%
Salaries 2,200,416 45.5% 1,253,907 68.4%
Additional annual pay 168,914 3.5% 100,658 5.5%
ZUS (social insurance) 401,286 8.3% 234,677 12.8%
Unemployment insurance 54,619 1.1% 32,563 1.8%
Personnel costs not related to pay 4,472 0.1% 2,686 0.1%
Materials and equipment 125,860 2.6% 69,228 3.8%
Teaching aids and books 50,654 1.0% 26,562 1.4%
Energy 112,392 2.3% 62,073 3.4%
Repairs 19,474 0.4% 13,893 0.8%
Other services 41,982 0.9% 27,673 1.5%
Internet 5,196 0.1% 4,629 0.3%
Domestic services 5,733 0.1% 3,532 0.2%
Other items 2,831 0.1% 1,600 0.1%
Total recurrent expenditure 3,196,092 66.2% 1,833,681 100%
Capital works (investments) 1,635,000 33.8% 0 0.0%
TOTAL 4,831,092 100.0% 1,833,681 100.0%
Salaries as % total 58.6% 68.4%Salaries as % recurrent 88.6% 68.4%
Source: data supplied by Czosnów gmina.
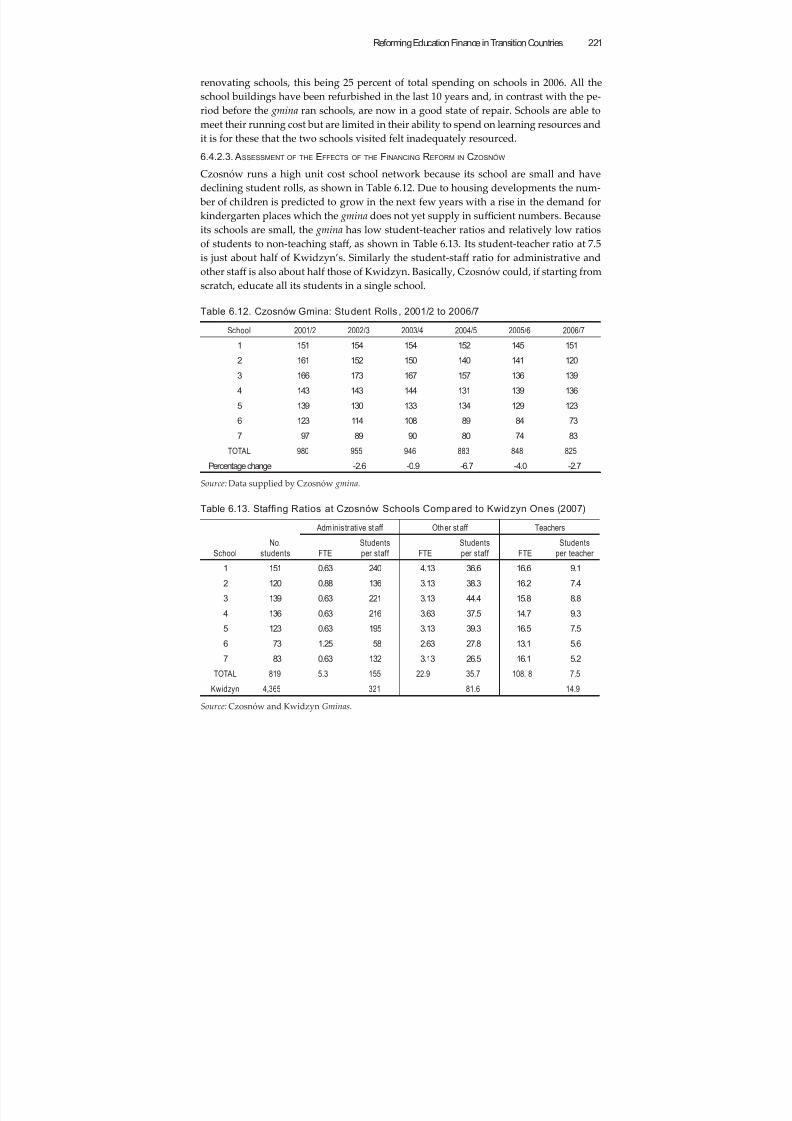
8/6/2019 Reforming Education Finance in Transition Countries
http://slidepdf.com/reader/full/reforming-education-finance-in-transition-countries 245/335
Reforming Education Finance in Transition Countries 221
renovating schools, this being 25 percent of total spending on schools in 2006. All the
school buildings have been refurbished in the last 10 years and, in contrast with the pe-
riod before the gmina ran schools, are now in a good state of repair. Schools are able to
meet their running cost but are limited in their ability to spend on learning resources and
it is for these that the two schools visited felt inadequately resourced.
6.4.2.3. ASSESSMENT OF THE EFFECTS OF THE FINANCING REFORM IN CZOSNÓW
Czosnów runs a high unit cost school network because its school are small and have
declining student rolls, as shown in Table 6.12. Due to housing developments the num-
ber of children is predicted to grow in the next few years with a rise in the demand for
kindergarten places which the gmina does not yet supply in suffi cient numbers. Because
its schools are small, the gmina has low student-teacher ratios and relatively low ratios
of students to non-teaching staff , as shown in Table 6.13. Its student-teacher ratio at 7.5
is just about half of Kwidzyn’s. Similarly the student-staff ratio for administrative and
other staff is also about half those of Kwidzyn. Basically, Czosnów could, if starting fromscratch, educate all its students in a single school.
Table 6.12. Czosnów Gmina: Student Rolls , 2001/2 to 2006/7
School 2001/2 2002/3 2003/4 2004/5 2005/6 2006/7
1 151 154 154 152 145 151
2 161 152 150 140 141 120
3 166 173 167 157 136 139
4 143 143 144 131 139 136
5 139 130 133 134 129 123
6 123 114 108 89 84 73
7 97 89 90 80 74 83
TOTAL 980 955 946 883 848 825
Percentage change -2.6 -0.9 -6.7 -4.0 -2.7
Source: Data supplied by Czosnów gmina.
Table 6.13. Staf fi ng Ratios at Czosnów Schools Compared to Kwidzyn Ones (2007)
School
No.
students
Adminis trative st aff Other st aff Teachers
FTE
Students
per staff FTE
Students
per staff FTE
Students
per teacher
1 151 0.63 240 4.13 36.6 16.6 9.1
2 120 0.88 136 3.13 38.3 16.2 7.4
3 139 0.63 221 3.13 44.4 15.8 8.8
4 136 0.63 216 3.63 37.5 14.7 9.3
5 123 0.63 195 3.13 39.3 16.5 7.5
6 73 1.25 58 2.63 27.8 13.1 5.6
7 83 0.63 132 3.13 26.5 16.1 5.2
TOTAL 819 5.3 155 22.9 35.7 108. 8 7.5
Kwidzyn 4,365 321 81.6 14.9
Source: Czosnów and Kwidzyn Gminas.
8/6/2019 Reforming Education Finance in Transition Countries
http://slidepdf.com/reader/full/reforming-education-finance-in-transition-countries 246/335
World Bank Study222
When Czosnów’s and Kwidzyn’s expenditures on primary and lower secondary
schools are compared—as in Table 6.14—Czosnów was spending 59 percent more per
student, while it received only 27 percent more per student in subvention.
Table 6.14. Comparison of Per Student Expenditure in Czosnów and Kwidzyn (2007)
Czosnów Kwidzyn
Ratio Czosnów
/Kwidzyn
Recurrent expenditure on primary and lower
secondary per student (see Table 6.9)
5930 zł 3719 zł 1.59
Education subvention per student 4556 zł 3586 zł 1.27
Source: Czosnów and Kwidzyn Gminas.
As already noted, Czosnów has experienced a reduction in the proportion of its
education spending funded from the subvention from 65 percent in 2004 to 47 percent in
2006. Consequently, the gmina decided to close the gimnazjum grades in the two small-
est schools which from 2007/6 will revert to being primary schools. This move had been
foreseen a number of years previously but the gmina had been waiting for a suffi cient
number of teachers to reach retirement age. The students will be bussed to one of the re-
maining gimnazjums , which will cost a lot less than maintaining two more gimnazjums. In
one of the affected schools there was lile parental protest, but the parents of the larger
school petitioned MEN and the kuratorium , which supported the gmina , even though
there are many instances when it does not agree to a school closure. The money saved
will be spent on a new kindergarten in the vacated space. According to the mayor no
more schools will be closed in the next 4 years, though he envisages having to close an-
other one in 6 years time.
6.4.2.4. CZOSNÓW: CONCLUDING REMARKS
It is evident from the Czosnów case that per student funding does exert pressure on
gminas to reduce unit costs by closing schools but this pressure is moderated by the diffi -
culty of firing teachers (due to the provisions of the Teachers’ Charter) and the resistance
of parents and residents to losing the school as the perceived focus of social life in the
village. Even in an area where distance between villages is relatively small and com-
munications by road quite good, the social pressures against achieving a more effi cient
school network are considerable. Local democratic choice is to spend a large share of
local revenues on providing a school in each village. Given this policy, the distributionof spending between schools and students is relatively equitable because each village
has a school, with similarly sized classes. This would not be the case if provision were
concentrated in two schools of minimum effi cient size.
6.5. Assessment of Outcomes
6.5.1. Ef ficiency
The introduction of per capita funding is expected to improve the effi ciency of a school
system which was previously funded on an input basis. An effi cient school system is
one where costs per pupil are as low as they can be for a given quantity and quality ofeducation. If schools are not effi cient then it is possible to reduce costs per pupil without
lowering pupil aainment. It is diffi cult to make the definition of effi ciency operational
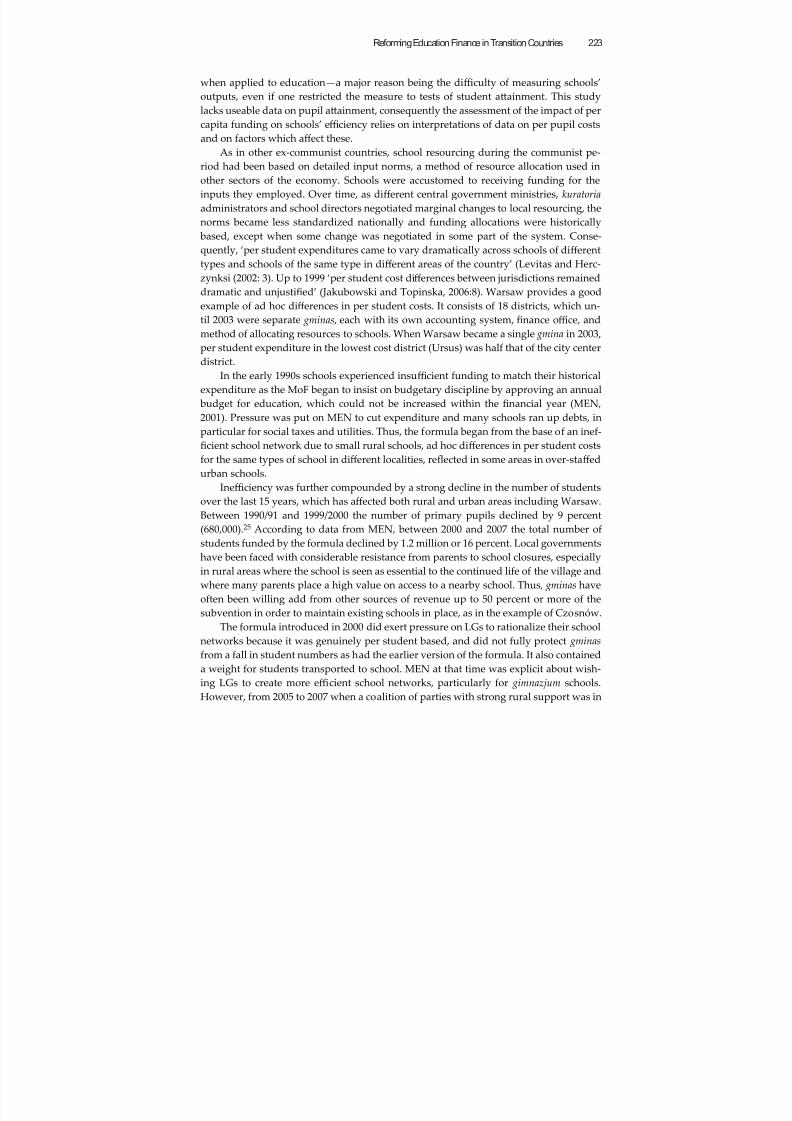
8/6/2019 Reforming Education Finance in Transition Countries
http://slidepdf.com/reader/full/reforming-education-finance-in-transition-countries 247/335
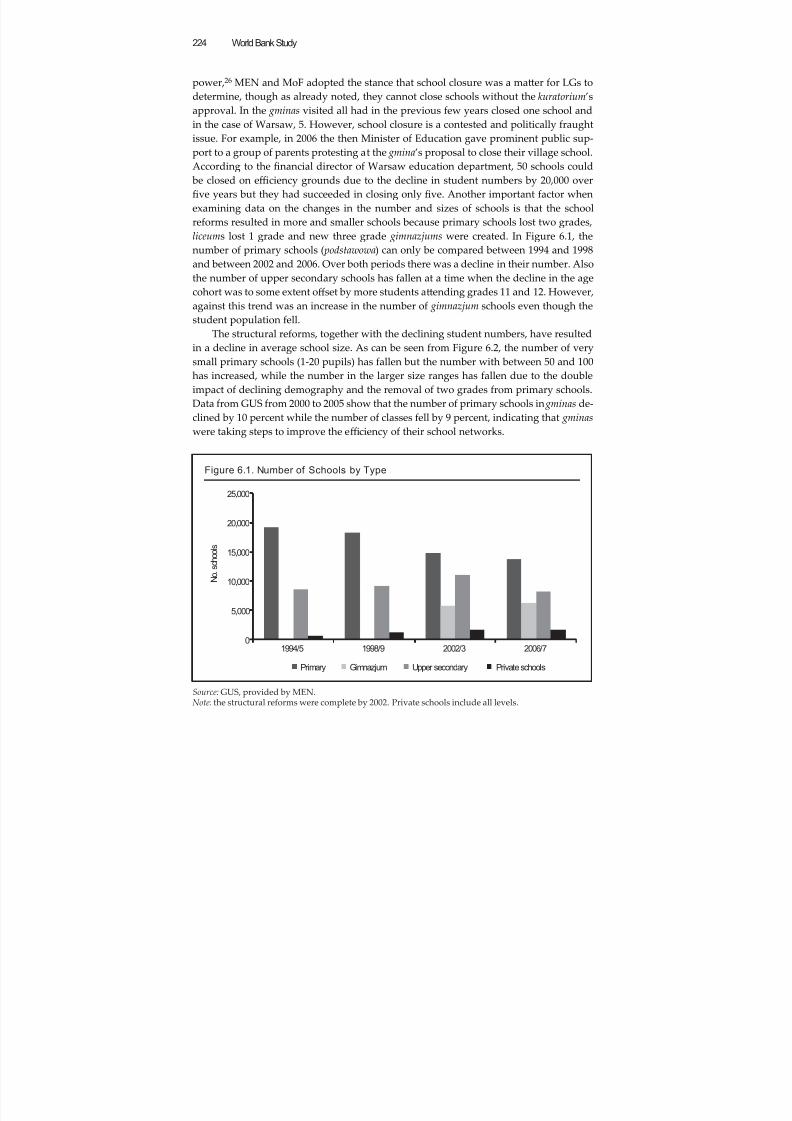
8/6/2019 Reforming Education Finance in Transition Countries
http://slidepdf.com/reader/full/reforming-education-finance-in-transition-countries 248/335
World Bank Study224
power,26 MEN and MoF adopted the stance that school closure was a maer for LGs to
determine, though as already noted, they cannot close schools without the kuratorium’s
approval. In the gminas visited all had in the previous few years closed one school and
in the case of Warsaw, 5. However, school closure is a contested and politically fraught
issue. For example, in 2006 the then Minister of Education gave prominent public sup-port to a group of parents protesting at the gmina’s proposal to close their village school.
According to the financial director of Warsaw education department, 50 schools could
be closed on effi ciency grounds due to the decline in student numbers by 20,000 over
five years but they had succeeded in closing only five. Another important factor when
examining data on the changes in the number and sizes of schools is that the school
reforms resulted in more and smaller schools because primary schools lost two grades,
liceums lost 1 grade and new three grade gimnazjums were created. In Figure 6.1, the
number of primary schools ( podstawowa) can only be compared between 1994 and 1998
and between 2002 and 2006. Over both periods there was a decline in their number. Also
the number of upper secondary schools has fallen at a time when the decline in the age
cohort was to some extent offset by more students aending grades 11 and 12. However,
against this trend was an increase in the number of gimnazjum schools even though the
student population fell.
The structural reforms, together with the declining student numbers, have resulted
in a decline in average school size. As can be seen from Figure 6.2, the number of very
small primary schools (1-20 pupils) has fallen but the number with between 50 and 100
has increased, while the number in the larger size ranges has fallen due to the double
impact of declining demography and the removal of two grades from primary schools.
Data from GUS from 2000 to 2005 show that the number of primary schools in gminas de-
clined by 10 percent while the number of classes fell by 9 percent, indicating that gminas
were taking steps to improve the effi ciency of their school networks.
Figure 6.1. Number of Schools by Type
Source: GUS, provided by MEN.Note: the structural reforms were complete by 2002. Private schools include all levels.
0
5,000
10,000
15,000
20,000
25,000
1994/5 1998/9 2002/3 2006/7
N o . s c h o o l s
Primary Gimnazjum Upper secondary Private schools
8/6/2019 Reforming Education Finance in Transition Countries
http://slidepdf.com/reader/full/reforming-education-finance-in-transition-countries 249/335
Reforming Education Finance in Transition Countries 225
Another factor that can promote effi ciency is that parents can choose a school out-
side their assigned area, provided it has a vacancy. This places competitive pressure on
schools, particularly at upper secondary level for liceums, for which there is selective
entry. National examination results at the end of primary, lower secondary and upper
secondary stages are now used by parents in forming judgments about school quality.
Given the small size of many LGs there is considerable cross border movement of stu-
dents, especially at secondary level.As previously indicated, the Teachers Charter has made it diffi cult for LGs to im-
prove the effi ciency with which teachers are deployed as student numbers fall (OECD,
2006). Surplus teachers are then absorbed by creating more teaching hours by spiing
classes. The data on teacher numbers are diffi cult to interpret because GUS (the national
statistics offi ce) has not collected data on full time equivalent teachers only on teachers
with full time jobs (who could be working in excess of 18 hours).27 MEN provided data
on the total number of students from 2000 to 2007 and the total number of full time
teachers but only for the current school year 2006/7. As can be seen from Figure 6.3, the
ratio of pupils to teachers has declined over the period by 14 percent, while average
class size over the system as a whole has remained at around 22 and has only fallen by 2percent. ‘Class’ here refers to a form group (i.e. the main class to which students are as-
signed and not the smaller teaching groups for some subjects into which the form group
may be split). These data suggest that the system has become less effi cient due to the
decline in the student-teacher ratio.
Overall, therefore, one can conclude that the formula, though influencing LG’s de-
cisions about school organization and resourcing, helped to counter other changes in
the system which were making it more ineffi cient in terms of school and average class
size and student- teacher ratios. However, the Teachers’ Charter is seen by most experts
as the main obstacle to making the Polish education system more effi cient. The OECD
(2006) report reflected the views of a number of experts interviewed for the study that:
“...current regulations make the market for teachers very rigid and
limit the room to manoeuvre of bodies running schools... Addition-
Figure 6.2. Primary Schools in Poland by Size
Source: MEN.
0
5
10
15
20
25
30
35
40
1–20 21–50 51–100 101–300 301–600 601–1000 > 1000
1998/9
2002/3
2006/7
P e r c e n t
Number of pupils
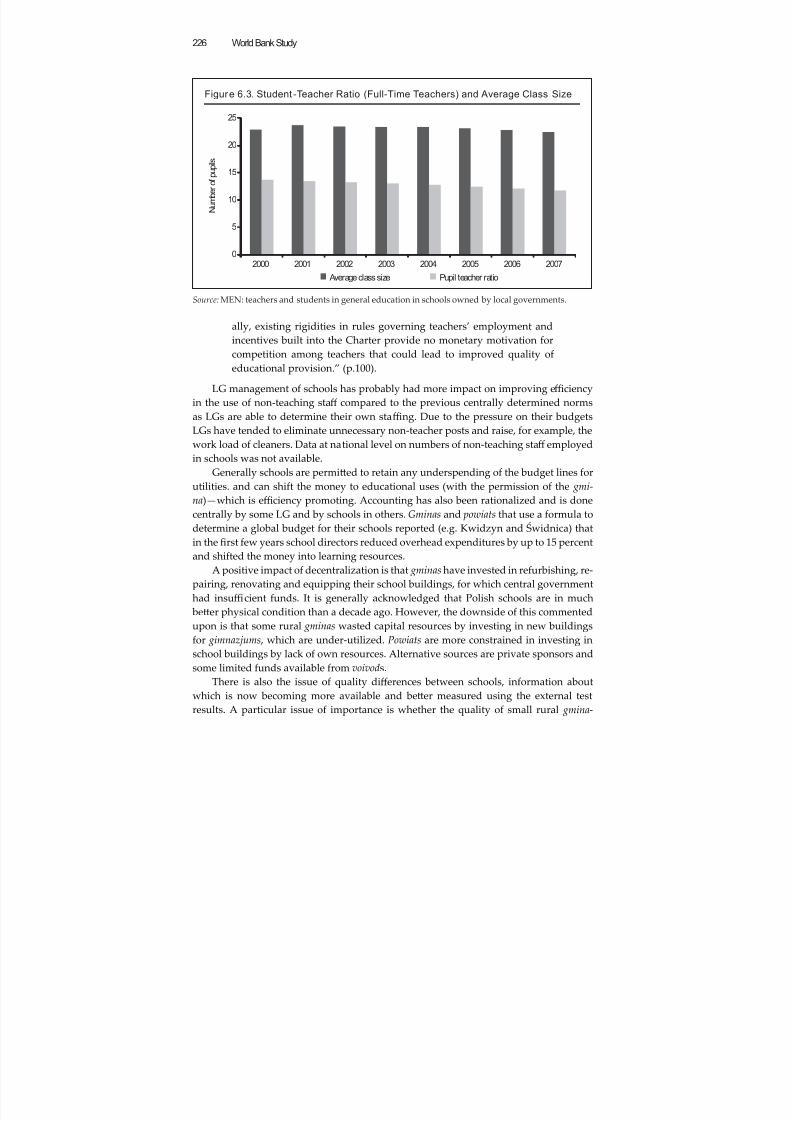
8/6/2019 Reforming Education Finance in Transition Countries
http://slidepdf.com/reader/full/reforming-education-finance-in-transition-countries 250/335
World Bank Study226
ally, existing rigidities in rules governing teachers’ employment and
incentives built into the Charter provide no monetary motivation for
competition among teachers that could lead to improved quality of
educational provision.” (p.100).
LG management of schools has probably had more impact on improving effi ciency
in the use of non-teaching staff compared to the previous centrally determined norms
as LGs are able to determine their own staffi ng. Due to the pressure on their budgets
LGs have tended to eliminate unnecessary non-teacher posts and raise, for example, the
work load of cleaners. Data at national level on numbers of non-teaching staff employed
in schools was not available.
Generally schools are permied to retain any underspending of the budget lines for
utilities. and can shift the money to educational uses (with the permission of the gmi-
na)—which is effi ciency promoting. Accounting has also been rationalized and is done
centrally by some LG and by schools in others. Gminas and powiats that use a formula to
determine a global budget for their schools reported (e.g. Kwidzyn and Świdnica) that
in the first few years school directors reduced overhead expenditures by up to 15 percent
and shifted the money into learning resources.
A positive impact of decentralization is that gminas have invested in refurbishing, re-
pairing, renovating and equipping their school buildings, for which central government
had insuffi cient funds. It is generally acknowledged that Polish schools are in much
beer physical condition than a decade ago. However, the downside of this commented
upon is that some rural gminas wasted capital resources by investing in new buildings
for gimnazjums , which are under-utilized. Powiats are more constrained in investing in
school buildings by lack of own resources. Alternative sources are private sponsors and
some limited funds available from voivods.
There is also the issue of quality differences between schools, information aboutwhich is now becoming more available and beer measured using the external test
results. A particular issue of importance is whether the quality of small rural gmina-
Figure 6.3. Student -Teacher Ratio (Full-Time Teachers) and Average Class Size
Source: MEN: teachers and students in general education in schools owned by local governments.
0
5
10
15
20
25
2000 2001 2002 2003 2004 2005 2006 2007
N u m b e r o f p u p i l s
Average class size Pupil teacher ratio
8/6/2019 Reforming Education Finance in Transition Countries
http://slidepdf.com/reader/full/reforming-education-finance-in-transition-countries 251/335
Reforming Education Finance in Transition Countries 227
administered schools is significantly lower than that of larger rural schools. This is a
diffi cult issue to research as it requires good data on the family background of students,
as studies from other developed countries show that these variables determine a much
higher proportion of the variance in student cognitive aainment than school level fac-
tors. Research on aainment in Poland in relation to school size has now begun with theavailability since 2002 of externally assessed and standardized aainment measures at
the school level and using data from international assessments, such as PISA, in which
Poland has participated. Using national test data, Herbst and Herczynksi (2004) investi-
gated the relationship between primary school size and aainment at the school level in
the grade 6 tests for schools in one voivod , Mazowsze. Family background was measured
by parental financial contributions to the school budget per student and percentage of
students in the school receiving social benefits. A non-linear relationship between school
size and aainment was found, with the optimal size of primary school being about 600
students or 120 students per grade. The optimal size was reduced to 590 for schools
in communities with below median average per student income, compared to 900 in
richer communities. An increase in the proportion of students bussed to school had a
negative association with aainment.28 The authors conclude that there is a trade-off
for aainment between the improved resources due to increasing school size on the one
hand and, on the other, the negative effects of dysfunctional social interactions between
members of larger and more disparate school communities and bussing more students
for longer distances. Furthermore, this trade-off is different in different socio-economic
contexts. However, as the average size of primary schools in Poland is around 200 stu-
dents and 45 percent of primary schools have a 100 or fewer students, the evidence sug-
gests considerable scope for further effi ciency gains by closing small schools and thereby
increasing the average size of school.
Clear evidence of improvements over time in the quality of education in Poland is
found in the latest analysis of PISA 2006 results (OECD 2007).29 Between 2000 and 2006
its average reading score increased by 29, with increases at all ability levels. Between
2003 and 2006 the maths score improved by 5 points and between 2000 and 2006 science
rose by 9 points. Poland also found to have a relatively equitable education system in
terms of PISA criteria.30 This cannot be aributed to the school finance reforms alone (or
at all) since, as summarized in the introduction, a whole set of major reforms to the cur-
riculum, assessment and school structure were launched in the late 1990s.
6.5.2. Equity
In assessing what has been the impact of the formula on the equity of the distribution of
resources, vertical and horizontal equity are considered separately.
6.5.2.1. VERTICAL EQUITY
Vertical equity is the ‘unequal treatment of unequals’ (Monk 1990). In particular, this
term refers to providing additional funding to students with greater learning needs. The
Polish formula aends to vertical equity by including a range of additional weights for
pupils with various forms of special needs. However, such students are only funded if
they aend special schools or centers or integrated classes in mainstream schools. Inte-
grated classes are kept at 22 pupils or less and contain 5 to 7 children with special needs(SEN) and are taught by two teachers. The UK model of providing additional funding
for individual SEN children in regular classes supported by a teaching assistant is not
8/6/2019 Reforming Education Finance in Transition Countries
http://slidepdf.com/reader/full/reforming-education-finance-in-transition-countries 252/335
World Bank Study228
practiced in Poland. The weights for SEN students in the formula were generally re-
garded as satisfactory. However, as the OECD (2006:95) points out, weighing pupils for
special needs only if they are in special schools or units encourages children to be placed
in such schools or units when this may not be the best provision for them.
Additional weighting is also given to children from ethnic minorities who requireadditional language classes. However, there is no additional weighting within the for-
mula for school students with learning diffi culties due to socio-economic factors.31 The
influences of these factors on students’ aainment are being recognized as the externally
assessed test results in grades 6, 9, and 12, available since 2002, are analysed by research-
ers. Such evidence is beginning to be used by some LGs (e.g. Warsaw and Kwidzyn) to
develop and fund special projects to improve the learning of lower aainers.
6.5.2.2. HORIZONTAL EQUITY
Horizontal equity is the principle that all students with equivalent educational needs
should have access to education of equal quality throughout the country (Monk, 1990).This principle is impossible to enforce when responsibility for managing and resourc-
ing schools is decentralized to local governments who have the democratic right to de-
termine their own level of resourcing of education, constrained by the requirement to
maintain defined minimum input standards (or less frequently minimum output stan-
dards). When subsidiarity is privileged over national uniformity then the principle of
horizontal equity requires that all local governments are resourced so that they are able
to finance a common standard of education. Defining this standard involves an estima-
tion of the normative need to spend on education in each LG unit, which takes into ac-
count differences in structural costs–these are costs that are beyond the control of the LG,
for example due to population density, size, quality of roads, and socioeconomic condi-tions. Then fiscal equalization requires that each LG is resourced so that it can finance
its needed expenditure. This creates a level playing field so that each LG can finance
the common standard of education while its residents have the same fiscal burden as
those in other areas but, in accordance with the principle of local democratic choice, can
choose to spend more or less than the assessed amount of needed expenditure. Hence,
when taxpayers’ welfare is taken into account as well as that of the service recipients, the
definition of horizontal equity is ‘access to services of the same quality for the same price
(tax) effort’ (Bury and Swaniewicz, 2002, p.132). Given the absence of a quantitative as-
sessment of LGs’ need to spend on education in Poland, other than that assumed by the
formula, a rigorous assessment of the horizontal equity of the formula is not possible.There is a process of fiscal equalization for local governments in Poland. LGs which
receive in tax revenues more than 120 percent of the national average tax revenue per
resident contribute to a fund which ensures that no LG receives less than 85 percent of
the national average. However, fiscal equalization is restricted to revenue equalization
so it is left to the formula for the education subvention to compensate for differences in
spending needs.
A major cause of differences in LG spending per student is differences in school
size and hence average class size between rural and urban areas. However, not all these
differences are due to structural cost factors beyond the control of LGs; some are due to
local choice, as with Czosnów. Therefore, one cannot use the existing school network
structure in a country to assess LGs’ need to spend as this makes no allowance for the
potential for the school network to be rationalized, which depends on the closeness
8/6/2019 Reforming Education Finance in Transition Countries
http://slidepdf.com/reader/full/reforming-education-finance-in-transition-countries 253/335
8/6/2019 Reforming Education Finance in Transition Countries
http://slidepdf.com/reader/full/reforming-education-finance-in-transition-countries 254/335
World Bank Study230
Box 6.1 (cont inued)
Dłużew School is an example of a small rural school, which was taken over by an associa-tion in 2000 in order to prevent its closure by the gmina.34 When the school was threatenedwith closure the Association of Friends of Dłużew School was established by a small group ofprofessional people in Warsaw, whose families had originated from the village. This includeddescendants of the local aristocratic family, Dłużewski, who lost their lands after WWII. TheAssociation now has about 100 members, many of whom give donations. The members electthe management committee of 11; this includes the village head—the soltis—who in Polandis directly elected by the village residents. At least 60 percent of the management commit-tee must be from the village. When the school transferred to the Association the gmina gavethem the school furniture and subsequently allowed the school to occupy the building rent-free. However, as the new school opened in September it received no state funding until thestart of the financial year in January. In this situation appointing a school director, which isundertaken by the Association, was dif ficult. The director appointed has been in post sincethe school was founded. She is a retired director of a school in the local town who offered her
services when it proved impossible to attract a suitable candidate through advertising. She isenthusiastic and dedicated to the school and its students. She spends very little of her timeon financial management—this is done by the management committee who employ a privateaccountant (who supplied a summary of the 2007 budget).
Initially, the gmina was unco-operative, but since the Association has shown that it can runthe school successfully the gmina has become supportive. It includes the school in localevents and inter-school competitions and provides some financial support to the school inkind, for example it spent 50,000 zł on replacing windows in 2007. The kuratorium inspectsthe school to ensure that it teaches the national curriculum and employs qualified teachers.
The school has 40 students from Dłużew village in grades 1 to 6 organized as 5 classes.There are 9.1 FTE teachers. In addition, two hourly paid part time staff are employed—a
handyman and a cook/cleaner. Parents also help in the kitchen. When the school was runby the gmina two more non-teaching staff were employed. Salary costs, at 2,526 zł per stu-dent, are considerably lower than in the gmina schools. As a comparison they are just underhalf of the 5,274 zł per primary student in Czosnów. Seventy six percent of Dłużew’s budgetis spent on salaries. Of the non-salary part, 13 percent goes on energy and 7 percent onmaintenance. Thus very little is spent on learning resources and equipment for which theschool relies on donations. The cost per student in 2007 was 3,332 zł. This compares withMEN’s financial standard in 2007 for an unweighted student of 3,199 zł. Dłużew is locatedin Siennica gmina which has a population of nearly 7000. Siennica’s subvention per studentin 2007 was 3,700 zł and its expenditure per primary student was 6,276 zł. Allowing for ad-ditional gmina expenditure on Dłużew School of 1,250 zł (window replacement), the schoolcosts around 4,580 per student, or about three quarters of the cost of a primary student inthe gmina’s schools.35
The school director and president of the management committee maintain that the quality ofteachers they employ is higher than in gmina schools, because they can dismiss an ineffec-tive teacher. The teachers are said to be caring and interested in each individual child. Thegrade 6 results of the school in 2006 were the highest (by a small margin) of all small schoolsin the voivod.36 Given the considerably lower cost per student at D łużew School comparedto the gmina’s schools and its ability to deliver good quality education, it is evidently moreef ficient than the local public schools. However, given the reliance on the enthusiasm anddedication of retired and part-time local teachers, who are paid less than those in publicschools, it is unlikely to be a model that could be replicated on a wide scale under the currentTeachers Charter.
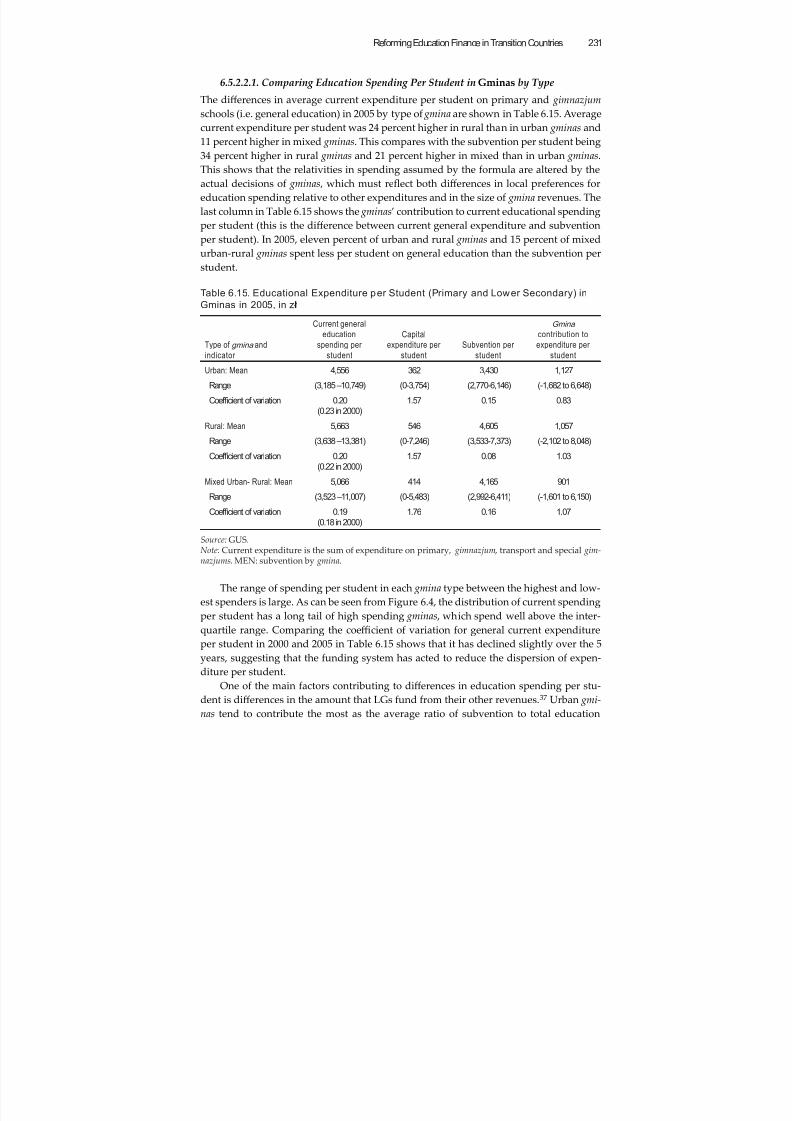
8/6/2019 Reforming Education Finance in Transition Countries
http://slidepdf.com/reader/full/reforming-education-finance-in-transition-countries 255/335
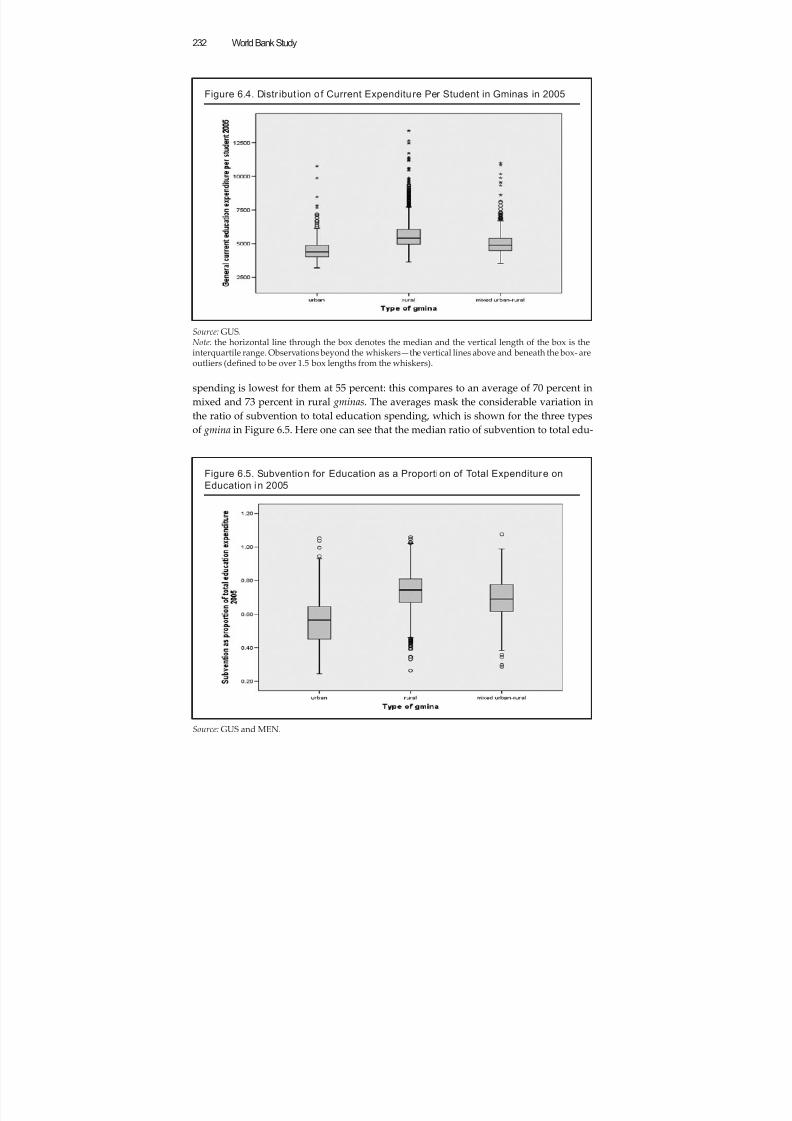
8/6/2019 Reforming Education Finance in Transition Countries
http://slidepdf.com/reader/full/reforming-education-finance-in-transition-countries 256/335
World Bank Study232
spending is lowest for them at 55 percent: this compares to an average of 70 percent in
mixed and 73 percent in rural gminas. The averages mask the considerable variation in
the ratio of subvention to total education spending, which is shown for the three types
of gmina in Figure 6.5. Here one can see that the median ratio of subvention to total edu-
Figure 6.4. Distr ibut ion of Current Expenditure Per Student in Gminas in 2005
Source: GUS.Note: the horizontal line through the box denotes the median and the vertical length of the box is theinterquartile range. Observations beyond the whiskers—the vertical lines above and beneath the box- areoutliers (defined to be over 1.5 box lengths from the whiskers).
Figure 6.5. Subvention for Education as a Proportion of Total Expenditure on
Education in 2005
Source: GUS and MEN.
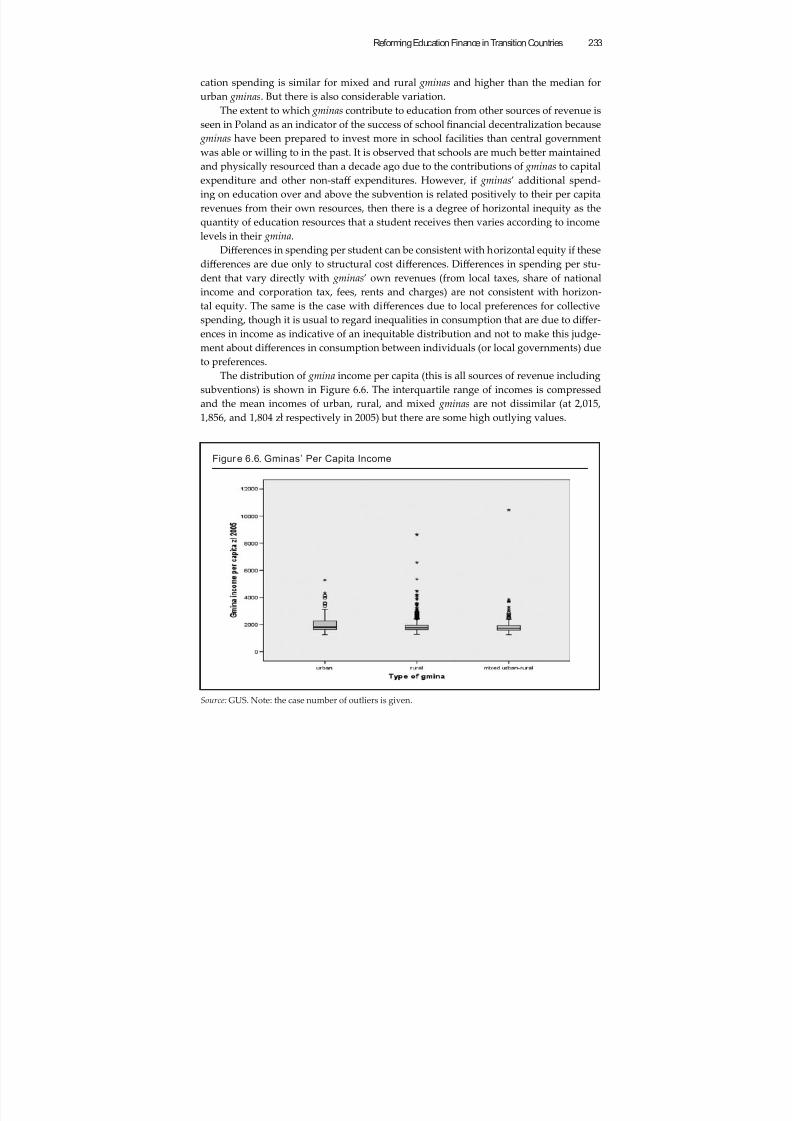
8/6/2019 Reforming Education Finance in Transition Countries
http://slidepdf.com/reader/full/reforming-education-finance-in-transition-countries 257/335
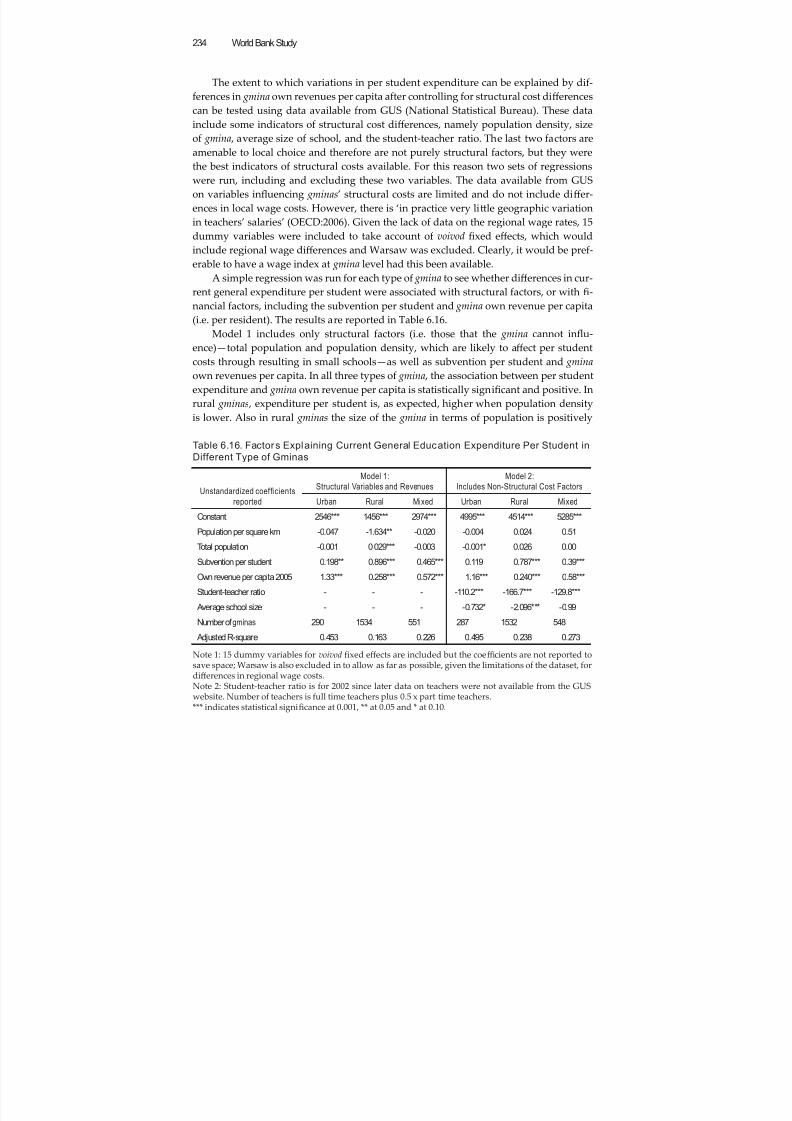
8/6/2019 Reforming Education Finance in Transition Countries
http://slidepdf.com/reader/full/reforming-education-finance-in-transition-countries 258/335
8/6/2019 Reforming Education Finance in Transition Countries
http://slidepdf.com/reader/full/reforming-education-finance-in-transition-countries 259/335
Reforming Education Finance in Transition Countries 235
associated with higher per student expenditure. Model 2 controls also for cost factors
that gminas are able to influence in the longer run: these are average school size and the
student-teacher ratio. In all types of gmina and as would be expected, a lower student-
teacher ratio is associated with higher costs. In rural and urban gminas differences in
average school size are also associated with differences in per student spending. Of par-ticular interest for assessing whether the funding system is horizontally equitable is the
result that, controlling for factors that influence costs and the subvention per student,
gminas’ revenue per capita still had a strong influence on expenditure per student. In
urban areas an increase in 1 z ł in per capita own revenue was associated with 1.16 z ł increase in spending per student. The size of the coeffi cient was smaller in mixed urban-
rural gminas where the additional spending rises by 0.58 z ł , but only by 0.24 z ł in rural
gminas. The smaller relative size of the coeffi cient in rural gminas compared to urban
could be explained by the fact that some rural gminas with high cost school networks but
comparatively low own revenues per capita, feel constrained to continue with relatively
high per student expenditure. Differences in subvention per student have no association
with spending per student in urban gminas , in contrast to mixed and rural gminas. In the
laer the association is quite large, with a 1 z ł increase in subvention being associated
with 0.79 z ł increase in expenditure per student. Running the same regressions for capi-
tal spending found it associated positively with own revenue per capita but not with the
subvention or any of the other variables.
The evidence indicates that the school funding system is not horizontally equitable,
since gminas’ own revenues per capita influence spending per student, particularly in ur-
ban gminas. Similar findings are reported by Jakubowski and Topinska, 2006. The posi-
tive relationship between gminas’ revenue per capita (fiscal capacity) and expenditure
per student is what would be expected when the formula itself does not include weights
for low income per capita or other indicators of social disadvantage.
6.5.2.2.2. Horizontal Equity within Local Governments
There is also the question of whether the funding mechanism has encouraged LGs to
reduce inequalities in expenditure per student within their school system. With respect
to upper secondary schools, the formula in 2000, rationalized funding by creating a more
uniform set of weights for vocational schools and thus encouraged powiats to reduce per
student funding differentials. The 2000 formula also reduced the differential between
primary and upper secondary funding and introduced a small additional weight for
post- gimnazjum students. Both the large urban gminas visited—Kwidzyn, by using a
funding formula, and Warsaw—had reduced per student funding differentials between
the same types of school.
Warsaw is an interesting case of a city seeking to equalize funding between schools.
In 2003 the separate gminas surrounding Warsaw central gmina were amalgamated into
one gmina with the status of a powiat. Since then Warsaw has around 250,000 students
in 18 districts which administer its 1200 schools and kindergartens and manage the
schools’ accounts. The districts Warsaw inherited had quite different administrative sys-
tems, while the highest cost central district spent twice as much as the lowest spending
outer district and even within the central district there were considerable differences in
per student costs for equivalent types of school. The education department is working to
reduce these differences year by year but it is quite diffi cult due to parental opposition
when schools are threatened. The financial director estimated that it would take 8 years
8/6/2019 Reforming Education Finance in Transition Countries
http://slidepdf.com/reader/full/reforming-education-finance-in-transition-countries 260/335
World Bank Study236
to even out spending between districts. At present Warsaw does not operate a formula
because the cost differentials between schools are too great.
So while horizontal equity is not fully aained by the school funding system in Po-
land, it has worked to reduce horizontal inequities in funding between similar schools
and has encouraged some LGs to do the same within their jurisdictions. Because ex-penditure data at the school level is not published nationally, but only reported in LG
budgets, it is not possible to asses in how many LGs there has been a narrowing of dif-
ferentials since the introduction of per student funding.
6.5.3. Transparency and Accountability
Another anticipated outcome of introducing per capita funding of education is beer
transparency and accountability. These are closely related. Transparency in this context
is the degree to which information about how much is spent on schools individually as
well as collectively, by whom and on the reasons for decisions about the amounts and
types of resources schools receive. Accountability refers to procedures by which personsresponsible for allocating and using school resources are required to justify their deci-
sions to to others. Transparency, by puing informationn in the public domain, makes it
easier to hold responsible persons to account. In examining transparency and account-
ability in the school finance system, first central govenment will be consdered and then
the financial flows followed to LGs and finally to school level.
The formula and the processes by which it is annually reviewed have consider-
ably improved the transparency of the allocation of finance from central governmment
to local administrative units. In the communist period a number of ministries, apart
from MEN, were involved in the administration of secondary education level institu-
tions offering various vocational specialisms and the decision process was internal tothe ministries and the kuratoria in the voivods. In contrast, the major developments of
the formula and its annual revisions are negotiated with the Commission for Central
and Local Government. The intensity of its work varies from year to year depending
on whether major changes are being considered. In 2005, for example, eleven different
propositions were considered by the Commission. There is considerable disagreement
within the Commission as the interests of the different types of local government differ38
and the resolution of these differences are reflected in the final agreement on the weights
in the formula. The Commission also decides on local governments’ applications for
additional funding from the reserve, which is 0.6 percent of the total subvention. The
analytical requirements of the process of designing and maintaining a funding formula
for education have led over the years to considerable improvements in the collection and
use of data on school inputs and costs. For instance, in the past MEN did not know how
many teachers were employed nationally or by each local government. MEN now has a
statistical information system (SIO) and is able to provide data for the most recent year
on full time equivalent teachers.
The total of the educational subvention is stated within the annual state budget and
approved by Parliament (Sejm). This amount cannot be increased during the financial
year unless this has been provided for in the annual budget law. MEN issues an an-
nual regulation detailing the formula. It also sends a long leer to the local govern-
ments explaining the changes in the formula and produces a document detailing the
subvention allocations. The Local Government website shows how the subvention for
a local governmetn is calculated. At the end of the finacial year MEN prepares a report
8/6/2019 Reforming Education Finance in Transition Countries
http://slidepdf.com/reader/full/reforming-education-finance-in-transition-countries 261/335
Reforming Education Finance in Transition Countries 237
to Parliament on the execution of its budget. However, the complexity of the formula,
with 46 weights in 2007, limits transparency as the formula is diffi cult to understand
for those not intimately involved in it. For example, a wójt in a rural gmina was under
the impression that rural areas did not receive an additional weighting. A further issue,
raised by a number of interviewees, is the lack of an ‘education standard’, by which ismeant a standard for the resources that a school of given type and size should receive.
This has been under discussion for some time and a standard was briefly legislated for
around 2001. It was found diffi cult to implement and was subsequently dropped. When
there is no agreed national standard and it is maintained that the principle of local self-
determination requires this to be determined locally and not set nationally, it is more
diffi cult to hold gminas to account for the quality of education they provide via their
financing decisions.
Transparency at local level is manifested through the local government budget set-
ting. All LGs discuss the annual school budgets in council where they are agreed as part
of the LGs annual budget. LGs that have their own formula, have a transparent method
of allocation. In LGs with only a few schools, the budget of each school is agreed be-
tween the school director and the mayor (wójt in rural areas), who therefore has close
knowledge of each school’s finances. The school budget is largely determined by the an-
nual organizational plan, which is a legal requirement and must conform to regulations
regarding the curriculum. School councils are presented with the school’s annual budget
plan and ratify it, but they have no executive authority over the school budget and do
not monitor it at regular intervals. This lack of involvement of school council members
therefore limits transparency at local level. Information about the budgets of individual
schools is therefore not widely publicly available and is not collected and published in
any systematic way.
Accountability for education is a complex issue that cannot be adequately examined
here. In Poland it is diffi cult to discern clear lines of accountability that link the quality
of education to the spending of the public funds allocated for that purpose. There is a
division of responsibility in that, in principle, MEN and the kuratoria are responsible for
the quality of education, and local governments for the financing of schools. Gminas are
held accountable for school resourcing by their electorates while the school and school
director are inspected and evaluated by the koratorium. As the OECD (2006:101) com-
ments “the position of kuratoria in the governance of education is ambiguous.” As far as
standard accountability forfi
nancial probity is concerned, LGs’ education spending isaudited along with other expenditures. Currently in Poland there is only internal audit-
ing of local governments conducted by a regional accounting chamber in each voivod.
An ICT system provides financial reports on LGs to the Ministry of Finance. LGs can
contract private accountants for an external audit but this is not obligatory.
Since the introduction of national tests at the end of primary (grade 6) and end of
lower secondary (grade 9) in 2002 and the nowamatura at grade 12 in 2005, and the pub-
lication of results at school level by the press, these measures are used to judge the rela-
tive quality of schools by parents and schools themselves.39 As is well known, raw test
results, which are not adjusted for prior aainment and/or home background factors,
which are the major determinants of students’ cognitive aainment’, are misleading in-dicators of schools’ effectiveness. Such value added analyses are beginning in Poland.40
Some have been commissioned by larger LGs - Kwidzyn and Warsaw for example.
8/6/2019 Reforming Education Finance in Transition Countries
http://slidepdf.com/reader/full/reforming-education-finance-in-transition-countries 262/335
World Bank Study238
Kwidzyn has started to use value added test results in assessing schools and school
directors. Both LGs are using value added evidence in order to inform the design of ad-
ditional educational programmes for students from more disadvantaged backgrounds.
Thus, the larger LGs are beginning to link educational and financial accountability and,
in doing this, are utilising information on student aainment created by central govern-ment assessment policies. These developments result in the questioning of the useful-
ness of the current role of the kuratoriain securing educational accountability and prompt
debates about how the current separation of financial and educational accountability can
be reformed.
6.6. Conclusions
Every per student school funding system has a set of constraints that are binding in the
sense that they determine certain costs or limit certain revenues at school level. Unless a
per student funding formula can perfectly refl
ect the amount of funding that each schoolneeds to be adequately funded, there has to be some flexibility that moderates the effects
of the per student funding formula by adjusting school costs or their revenues or both to
ensure that the school is financially viable. If there is not, the school either runs up debts
or has to cut back on resources below the adequate amount or is rescued by being fund-
ed outside the formula, which undermines the formula’s integrity. Some flexibilities are
crucial to ensure that a per student funding system delivers adequate funding to most
schools. If some schools do not receive adequate funding to cover their costs then these
should be schools the education authorities wish to close, merge or change in some way
to improve the effi ciency of the school network. Table 6.17 summarizes these constraints
and flexibilities for the Polish school finance system.The most important flexibility in the Polish per student funding system is that
gminas possess resources of their own, which they can choose to spend on education.41
Other flexibilities are that gminas can determine non-teaching staff and non-staff expen-
ditures. A further flexibility that has considerable potential for resolving the problem of
unaffordable high cost rural schools is turning them into public schools run by NGOs or
into non-public schools, which are funded from the formula.
Overall, one can conclude that per student funding has been generally successful in
Poland. While there are continual arguments about the relative amounts that central and
local governments contribute and how the weights favor different types of LGs, these
debates are well institutionalized and a normal part of a plural society. There is no gen-eral desire to drastically reform the formula, though ideas from different perspectives
about a voucher system or abolishing the subvention, or central government fully fund-
ing teachers are discussed. Per student funding was driven by the prior determination to
decentralize power to local government units and not by educational imperatives. Thus,
the main function of per student funding is to distribute a central pot of funding among
LGs according to a negotiated agreement about legitimate differences in relative costs of
different forms of educational provision. Though the formula has brought about greater
fairness in local government funding for education through the applications of a consis-
tent set of rules, the funding system remains horizontally inequitable due to a number
of factors. The formula does not distinguish between rural and small town gminas withdifferent structural cost characteristics, the local government finance system is not suffi -
ciently equalizing, and LGs have different preferences for the priority given to education.
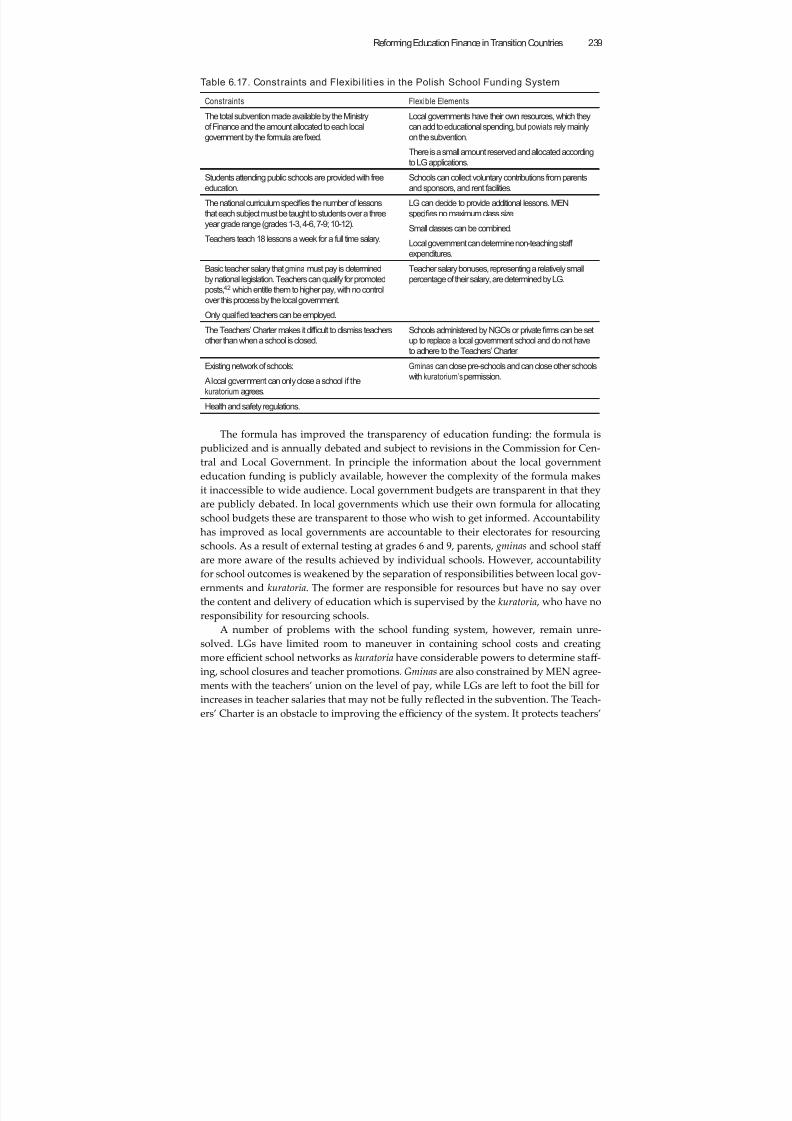
8/6/2019 Reforming Education Finance in Transition Countries
http://slidepdf.com/reader/full/reforming-education-finance-in-transition-countries 263/335
Reforming Education Finance in Transition Countries 239
Table 6.17. Constraints and Flexibi lities in the Polish School Funding System
Constraints Flexible Elements
The total subvention made available by the Ministry
of Finance and the amount allocated to each local
government by the formula arefixed.
Local governments have their own resources, which they
can add to educational spending, but powiats rely mainly
on the subvention.
There is a small amount reserved and allocated according
to LG applications.
Students attending public schools are provided with free
education.
Schools can collect voluntary contributions from parents
and sponsors, and rent facilities.
The national curriculum specifies the number of lessons
that each subject must be taught to students over a three
year grade range (grades 1-3, 4-6, 7-9; 10-12).
Teachers teach 18 lessons a week for a full time salary.
LG can decide to provide additional lessons. MEN
specifies no maximum class size.
Small classes can be combined.
Local government can determine non-teaching staff
expenditures.
Basic teacher salary that gmina must pay is determined
by national legislation. Teachers can qualify for promoted
posts,42 which entitle them to higher pay, with no control
over this process by the local government.
Only qualified teachers can be employed.
Teacher salary bonuses, representing a relatively small
percentage of their salary, are determined by LG.
The Teachers’ Charter makes it dif ficult to dismiss teachers
other than when a school is closed.
Schools administered by NGOs or private firms can be set
up to replace a local government school and do not have
to adhere to the Teachers’ Charter.
Existing network of schools:
A local government can only close a school if the
kuratorium agrees.
Gminas can close pre-schools and can close other schools
with kuratorium’s permission.
Health and safety regulations.
The formula has improved the transparency of education funding: the formula is
publicized and is annually debated and subject to revisions in the Commission for Cen-
tral and Local Government. In principle the information about the local government
education funding is publicly available, however the complexity of the formula makes
it inaccessible to wide audience. Local government budgets are transparent in that they
are publicly debated. In local governments which use their own formula for allocating
school budgets these are transparent to those who wish to get informed. Accountability
has improved as local governments are accountable to their electorates for resourcing
schools. As a result of external testing at grades 6 and 9, parents, gminas and school staff are more aware of the results achieved by individual schools. However, accountability
for school outcomes is weakened by the separation of responsibilities between local gov-
ernments and kuratoria. The former are responsible for resources but have no say over
the content and delivery of education which is supervised by the kuratoria , who have no
responsibility for resourcing schools.
A number of problems with the school funding system, however, remain unre-
solved. LGs have limited room to maneuver in containing school costs and creating
more effi cient school networks as kuratoria have considerable powers to determine staff-
ing, school closures and teacher promotions. Gminas are also constrained by MEN agree-
ments with the teachers’ union on the level of pay, while LGs are left to foot the bill forincreases in teacher salaries that may not be fully reflected in the subvention. The Teach-
ers’ Charter is an obstacle to improving the effi ciency of the system. It protects teachers’
8/6/2019 Reforming Education Finance in Transition Countries
http://slidepdf.com/reader/full/reforming-education-finance-in-transition-countries 264/335
World Bank Study240
jobs while teachers’ pay by international standards is relatively low compared to other
occupations and GDP per capita (OECD, 2006: 95), which means teaching is not an at-
tractive profession for many graduates.
Another source of tension is ambiguity about what the subvention is supposed to
cover. Unlike Estonia, there is not an explicit division of responsibilities for funding dif-ferent kinds of inputs, such as teacher salaries by the government and non-teaching staff
salaries and school buildings costs by the gmina. Local governments, therefore, complain
that the subvention does not guarantee the payment of teacher salary costs, over which
gminas and powiats have limited control because of the provisions of the Teachers’ Char-
ter and the need for kuratoria permission to close a school. There is also lack of clarity
about what MEN assumes should be the cost of educating a student in specific types and
sizes of schools. This ambiguity is advantageous for the central government as it does
not reveal if the financial standard is insuffi cient for funding schools of below a specific
a size because the government has not stated its view on the maximum size a school can
remain financially viable. LGs would prefer the transparency of such a standard since it
would assist them in making the case for school closures to local parents and laying the
blame on central government.
Rationalizing the complex and differentiated funding system, especially of upper
secondary schools, was a strong factor for MEN reforming the formula in 2000 so as to
ensure it was based on a certain amount per student. At that period MEN did see the
formula as a force for encouraging LGs to create more effi cient school networks, and
used the restructuring of the school system between 1999 and 2001 to reinforce this view.
However, while the formula does provide effi ciency incentives for LGs, especially since
the buffers were removed, it is a relatively weak force to counter the political pressures
from the rural lobbies for maintaining small rural schools and from the teachers’ union
interest in job security, which maintains higher staffi ng levels in urban schools. Conse-
quently, Poland has a relatively large and poorly paid teaching force rather than a beer
paid but smaller one. At present there appear to be insurmountable obstacles to achiev-
ing fewer but higher paid and higher quality teachers.
Two main messages emerge from the Polish experience. Per student funding is given
a strong impetus by the decentralization of the administration of schools to democrati-
cally elected local governments. When education becomes decentralized a new funding
system is required and per student funding provides a fair means of allocating central
government grants to local governments, into which can be built some effi
ciency incen-tives. The main role of per student funding is to function as a fair procedural rule for
allocating central government grants, which are relatively objective and less subject to
political-bias and non-transparent manipulation than discretionary and individually ne-
gotiated allocations. A per student funding formula can include weights for addressing
vertical equity issues but it is less able to create a horizontally equitable school funding
system as this depends on the rules for fiscal equalization, which govern the whole sys-
tem of local government finance. Once established, the funding formula remains subject
to continual change in the course of negotiations between different interests. It is to be
expected that a funding formula will undergo changes–minor annual revisions inter-
spersed by more substantive alterations.The second message is that while per student funding can provide a stimulus to
internal effi ciency, this is considerably blunted when, in the context of declining student
8/6/2019 Reforming Education Finance in Transition Countries
http://slidepdf.com/reader/full/reforming-education-finance-in-transition-countries 265/335
Reforming Education Finance in Transition Countries 241
numbers, effi ciency is inconsistent with other social objectives, in particular preserving
rural schools and placating a strong teachers’ union. The government in power at the
time the data for this study were collected had lile concern for the effi ciency of the
school system, as was indicated by ministry offi cials. A frequently expressed view in
Poland is that decentralization implies the right of local government to operate an inef-ficient school network, if this is what they choose to do. By itself per student funding is
a relatively weak tool for promoting effi ciency: to do this it has to be accompanied by
other measures which will not materialize unless there is a political will to pursue the
internal effi ciency of the school system at the expense of other objectives favoured by
specific political interests.
References
Bramley, G. (1990). Equalisation Grants and Local Expenditure Needs: Avebury.
Bury, P. and P. Swianniewicz (2002). “Grant transfers infi
nancing local governmentin Poland.” Paper presented at NISPAcee Annual Conference in Kraków, April 24-27,
2002. h p://unpan1.un.org/intradoc/groups/public/documents/nispacee/unpan004538.
pdf accessed 17/11/2007.
Herbst, M. and J. Herczyński (2004). “Is large more effective than small beautiful? Size
and performance of primary schools in Poland.” Warsaw University mimeo.
Herczyński, J. (2004). Formulae for allocation of funds to individual schools in Poland.
In R. Levacic and P. Downes, Eds. Formula funding of schools, decentralization and
corruption: a comparative analysis. Paris: IIEP-UNESCO.
Huber, G. P., and Glick, W. H., eds. (1993). Organisational change and redesign: ideas and
insights for improving performance: Oxford University Press. Jakubowski, M. and I. Topinska (2006). Impact of decentralisation on public service delivery
and equity: education and health sectors in Poland: 1998-2003. Warsaw: Centre for
Social and Economic Research.
King, D. S. (1984). Fiscal Tiers: the Economy of Multi-level Government. London: Allen and
Unwin.
Levitas, T. and J. Herczyński (2002). Decentralization, Local Governments and Educa-
tion Reform in Post Communist Poland,. In Davey, Eds. Balancing National and
Local Responsibilities. Education Management and Finance in Four Central European
Countries. Budapest: OSI/LGI: 113-189.
MEN (2001). Report on the Development of Education in Poland. Warsaw: Ministry of Na-tional Education.
Monk, D. (1990). Educational Finance: An Economic Approach. New York: McGraw-Hill.
OECD (2006). Education and Training: boosting and adapting human capital, Chapter 4 OECD
Economic Surveys: Poland pp. 91-119. Paris: OECD.
OECD (2006). Education at a Glance. Paris: OECD.
OECD (2007). PISA 2006: Science Competencies for Tomorrow’s World Vol 1. Paris: OECD.
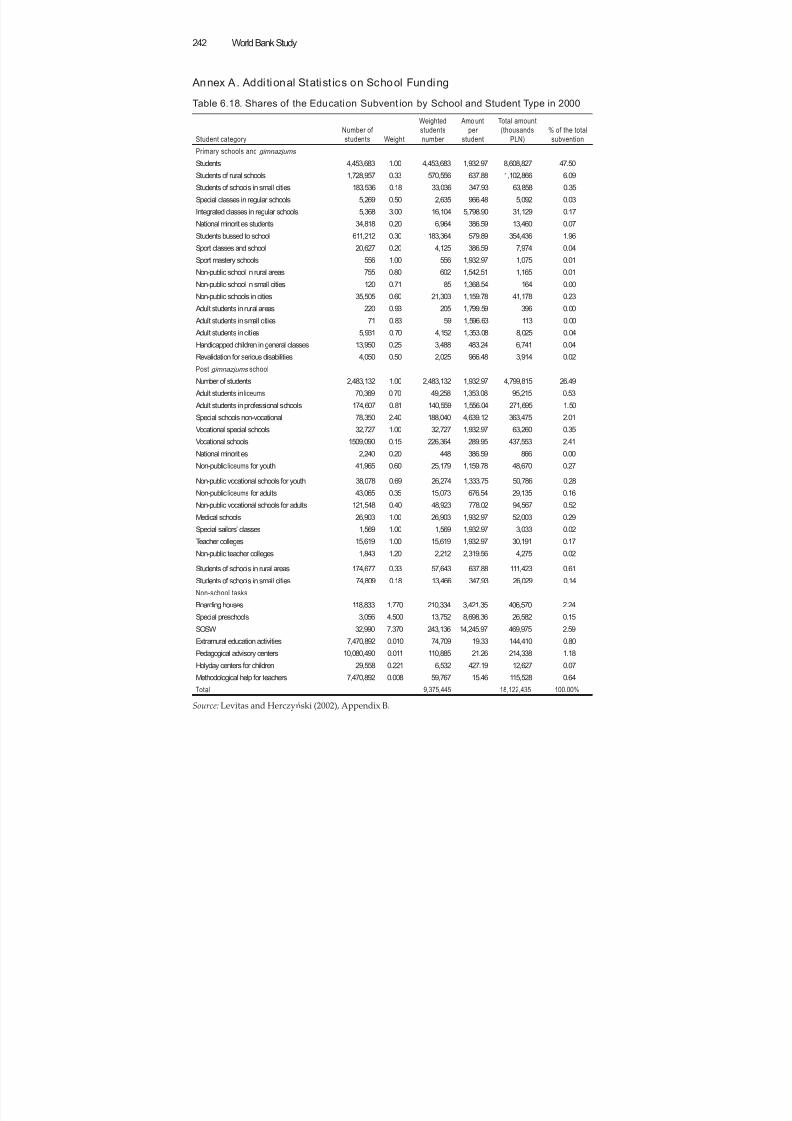
8/6/2019 Reforming Education Finance in Transition Countries
http://slidepdf.com/reader/full/reforming-education-finance-in-transition-countries 266/335
World Bank Study242
Annex A. Additional Statist ics on School Funding
Table 6.18. Shares of the Education Subvent ion by School and Student Type in 2000
Student category
Number of
students Weight
Weighted
students
number
Amo unt
per
student
Total amount
(thousands
PLN)
% of the total
subvention
Primary schools and gimnazjums
Students 4,453,683 1.00 4,453,683 1,932.97 8,608,827 47.50
Students of rural schools 1,728,957 0.33 570,556 637.88 1,102,866 6.09
Students of schools in small cities 183,536 0.18 33,036 347.93 63,858 0.35
Special classes in regular schools 5,269 0.50 2,635 966.48 5,092 0.03
Integrated classes in regular schools 5,368 3.00 16,104 5,798.90 31,129 0.17
National minorities students 34,818 0.20 6,964 386.59 13,460 0.07
Students bussed to school 611,212 0.30 183,364 579.89 354,436 1.96
Sport classes and school 20,627 0.20 4,125 386.59 7,974 0.04
Sport mastery schools 556 1.00 556 1,932.97 1,075 0.01
Non-public school in rural areas 755 0.80 602 1,542.51 1,165 0.01Non-public school in small cities 120 0.71 85 1,368.54 164 0.00
Non-public schools in cities 35,505 0.60 21,303 1,159.78 41,178 0.23
Adult students in rural areas 220 0.93 205 1,799.59 396 0.00
Adult students in small cities 71 0.83 59 1,596.63 113 0.00
Adult students in cities 5,931 0.70 4,152 1,353.08 8,025 0.04
Handicapped children in general classes 13,950 0.25 3,488 483.24 6,741 0.04
Revalidation for serious disabilities 4,050 0.50 2,025 966.48 3,914 0.02
Post gimnazjums school
Number of students 2,483,132 1.00 2,483,132 1,932.97 4,799,815 26.49
Adult students in liceums 70,369 0.70 49,258 1,353.08 95,215 0.53
Adult students in professional schools 174,607 0.81 140,559 1,556.04 271,695 1.50
Special schools non-vocational 78,350 2.40 188,040 4,639.12 363,475 2.01
Vocational special schools 32,727 1.00 32,727 1,932.97 63,260 0.35
Vocational schools 1509,090 0.15 226,364 289.95 437,553 2.41
National minorities 2,240 0.20 448 386.59 866 0.00
Non-public liceums for youth 41,965 0.60 25,179 1,159.78 48,670 0.27
Non-public vocational schools for youth 38,078 0.69 26,274 1,333.75 50,786 0.28
Non-public liceums for adults 43,065 0.35 15,073 676.54 29,135 0.16
Non-public vocational schools for adults 121,548 0.40 48,923 778.02 94,567 0.52
Medical schools 26,903 1.00 26,903 1,932.97 52,003 0.29
Special sailors’ classes 1,569 1.00 1,569 1,932.97 3,033 0.02
Teacher colleges 15,619 1.00 15,619 1,932.97 30,191 0.17
Non-public teacher colleges 1,843 1.20 2,212 2,319.56 4,275 0.02
Students of schools in rural areas 174,677 0.33 57,643 637.88 111,423 0.61
Students of schools in small cities 74,809 0.18 13,466 347.93 26,029 0.14
Non-school tasks
Boarding houses 118,833 1.770 210,334 3,421.35 406,570 2.24
Special preschools 3,056 4.500 13,752 8,698.36 26,582 0.15
SOSW 32,990 7.370 243,136 14,245.97 469,975 2.59
Extramural education activities 7,470,892 0.010 74,709 19.33 144,410 0.80
Pedagogical advisory centers 10,080,490 0.011 110,885 21.26 214,338 1.18
Holyday centers for children 29,558 0.221 6,532 427.19 12,627 0.07
Methodological help for teachers 7,470,892 0.008 59,767 15.46 115,528 0.64
Total 9,375,445 18,122,435 100.00%
Source: Levitas and Herczyński (2002), Appendix B.
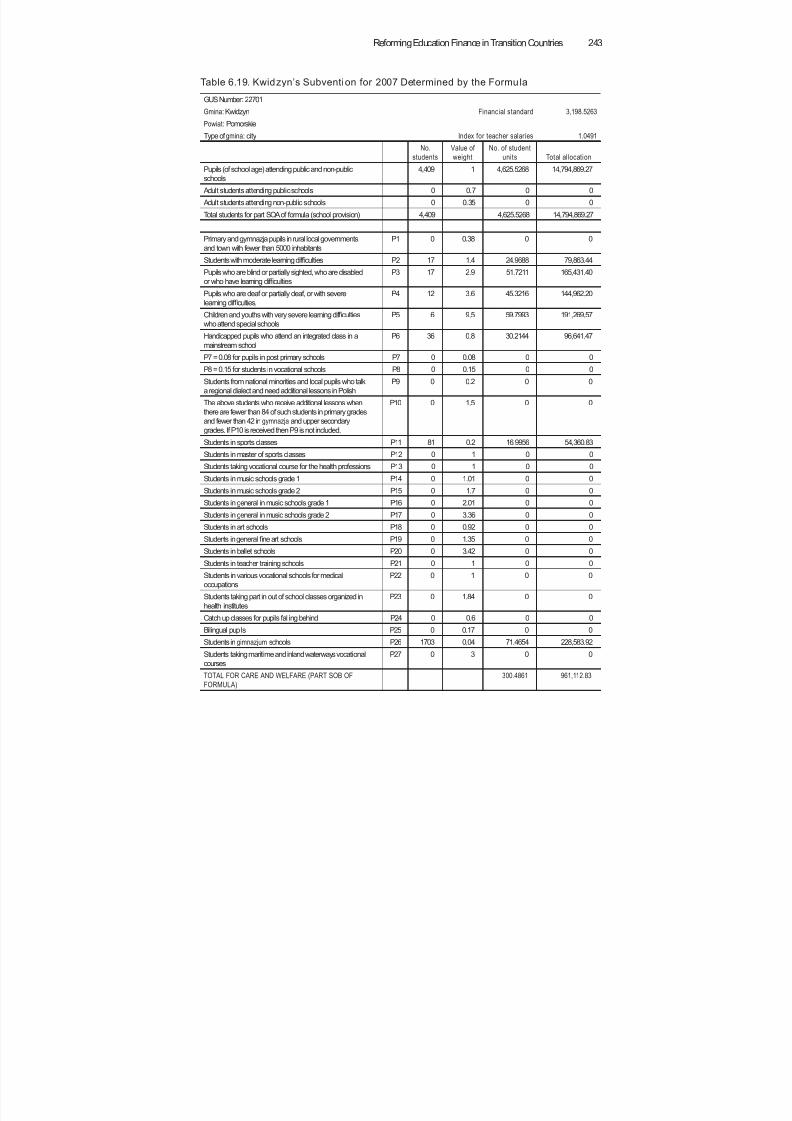
8/6/2019 Reforming Education Finance in Transition Countries
http://slidepdf.com/reader/full/reforming-education-finance-in-transition-countries 267/335
Reforming Education Finance in Transition Countries 243
Table 6.19. Kwidzyn’s Subvention for 2007 Determined by the Formula
GUS Number: 22701
Gmina: Kwidzyn Financial standard 3,198.5263
Powiat: Pomorskie
Type ofgmina: city Index for teacher salaries 1.0491 No.
students
Value of
weight
No. of student
units Total allocation
Pupils (of school age) attending public and non-public
schools
4,409 1 4,625.5268 14,794,869.27
Adult students attending public schools 0 0.7 0 0
Adult students attending non-public schools 0 0.35 0 0
Total students for part SOA of formula (school provision) 4,409 4,625.5268 14,794,869.27
Primary and gymnazja pupils in rural local governments
and town with fewer than 5000 inhabitants
P1 0 0.38 0 0
Students with moderate learning dif ficulties P2 17 1.4 24.9688 79,863.44
Pupils who are blind or partially sighted, who are disabledor who have learning dif ficulties
P3 17 2.9 51.7211 165,431.40
Pupils who are deaf or partially deaf, or with severe
learning dif ficulties,
P4 12 3.6 45.3216 144,962.20
Children and youths with very severe learning dif ficulties
who attend special schools
P5 6 9.5 59.7993 191,269.57
Handicapped pupils who attend an integrated class in a
mainstream school
P6 36 0.8 30.2144 96,641.47
P7 = 0.08 for pupils in post primary schools P7 0 0.08 0 0
P8 = 0.15 for students in vocational schools P8 0 0.15 0 0
Students from national minorities and local pupils who talk
a regional dialect and need additional lessons in Polish
P9 0 0.2 0 0
The above students who receive additional lessons when
there are fewer than 84 of such students in primary gradesand fewer than 42 in gymnazja and upper secondary
grades. If P10 is received then P9 is not included.
P10 0 1.5 0 0
Students in sports classes P11 81 0.2 16.9956 54,360.83
Students in master of sports classes P12 0 1 0 0
Students taking vocational course for the health professions P13 0 1 0 0
Students in music schools grade 1 P14 0 1.01 0 0
Students in music schools grade 2 P15 0 1.7 0 0
Students in general in music schools grade 1 P16 0 2.01 0 0
Students in general in music schools grade 2 P17 0 3.36 0 0
Students in art schools P18 0 0.92 0 0
Students in general fine art schools P19 0 1.35 0 0
Students in ballet schools P20 0 3.42 0 0
Students in teacher training schools P21 0 1 0 0
Students in various vocational schools for medical
occupations
P22 0 1 0 0
Students taking part in out of school classes organized in
health institutes
P23 0 1.84 0 0
Catch up classes for pupils falling behind P24 0 0.6 0 0
Bilingual pupils P25 0 0.17 0 0
Students in gimnazjum schools P26 1703 0.04 71.4654 228,583.92
Students taking maritime and inland waterways vocational
courses
P27 0 3 0 0
TOTAL FOR CARE AND WELFARE (PART SOB OF
FORMULA)
300.4861 961,112.83
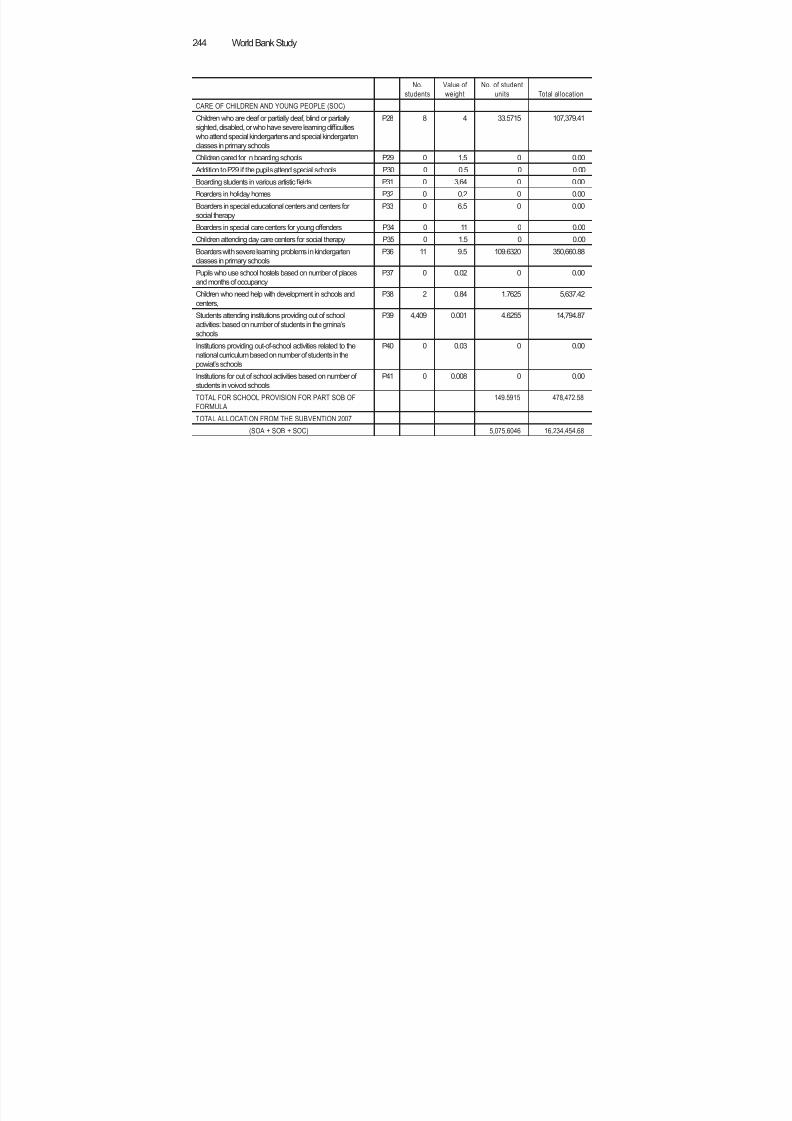
8/6/2019 Reforming Education Finance in Transition Countries
http://slidepdf.com/reader/full/reforming-education-finance-in-transition-countries 268/335
World Bank Study244
No.
students
Value of
weight
No. of student
units Total allocation
CARE OF CHILDREN AND YOUNG PEOPLE (SOC)
Children who are deaf or partially deaf, blind or partially
sighted, disabled, or who have severe learning dif ficulties
who attend special kindergartens and special kindergartenclasses in primary schools
P28 8 4 33.5715 107,379.41
Children cared for in boarding schools P29 0 1.5 0 0.00
Addition to P29 if the pupils attend special schools P30 0 0.5 0 0.00
Boarding students in various artistic fields P31 0 3.64 0 0.00
Boarders in holiday homes P32 0 0.2 0 0.00
Boarders in special educational centers and centers for
social therapy
P33 0 6.5 0 0.00
Boarders in special care centers for young offenders P34 0 11 0 0.00
Children attending day care centers for social therapy P35 0 1.5 0 0.00
Boarders with severe learning problems in kindergarten
classes in primary schools
P36 11 9.5 109.6320 350,660.88
Pupils who use school hostels based on number of placesand months of occupancy
P37 0 0.02 0 0.00
Children who need help with development in schools and
centers,
P38 2 0.84 1.7625 5,637.42
Students attending institutions providing out of school
activities: based on number of students in the gmina’s
schools
P39 4,409 0.001 4.6255 14,794.87
Institutions providing out-of-school activities related to the
national curriculum based on number of students in the
powiat’s schools
P40 0 0.03 0 0.00
Institutions for out of school activities based on number of
students in voivod schools
P41 0 0.008 0 0.00
TOTAL FOR SCHOOL PROVISION FOR PART SOB OF
FORMULA
149.5915 478,472.58
TOTAL ALLOCATION FROM THE SUBVENTION 2007
(SOA + SOB + SOC) 5,075.6046 16,234,454.68
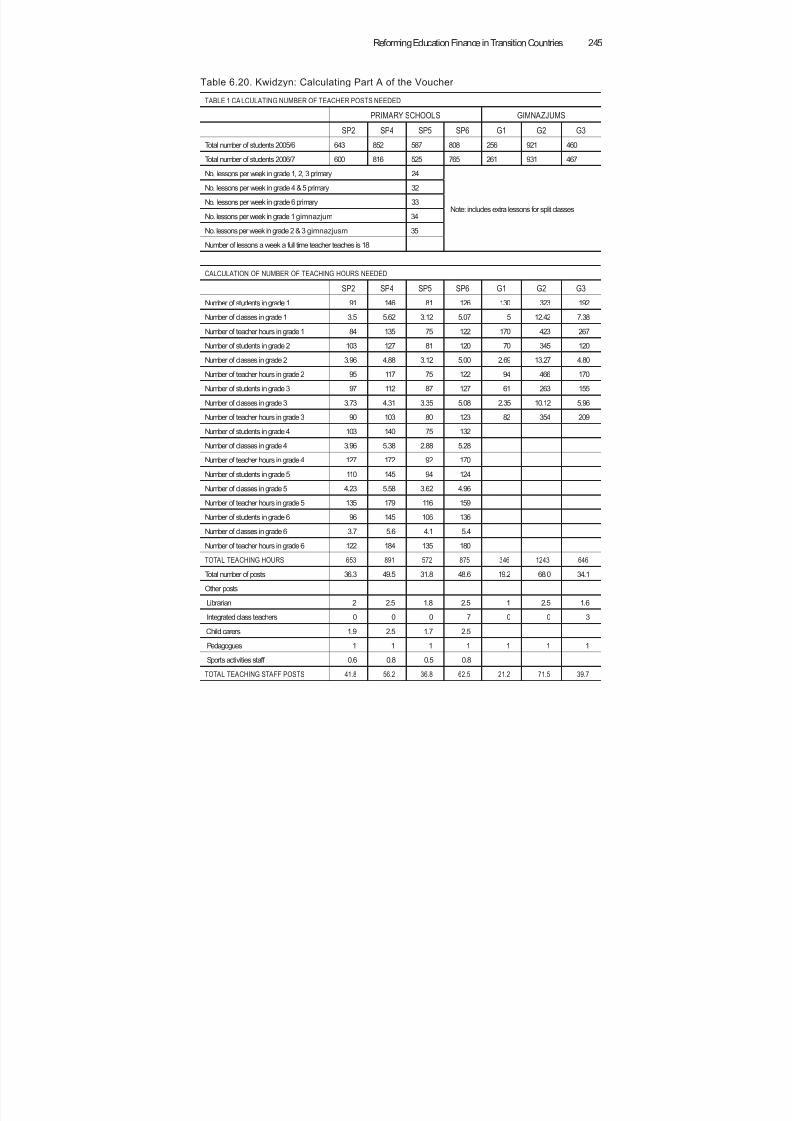
8/6/2019 Reforming Education Finance in Transition Countries
http://slidepdf.com/reader/full/reforming-education-finance-in-transition-countries 269/335
Reforming Education Finance in Transition Countries 245
Table 6.20. Kwidzyn: Calculating Part A of the Voucher
TABLE 1 CALCULATING NUMBER OF TEACHER POSTS NEEDED
PRIMARY SCHOOLS GIMNAZJUMS
SP2 SP4 SP5 SP6 G1 G2 G3
Total number of students 2005/6 643 852 587 808 256 921 460
Total number of students 2006/7 600 816 525 765 261 931 467
No. lessons per week in grade 1, 2, 3 primary 24
Note: includes extra lessons for split classes
No. lessons per week in grade 4 & 5 primary 32
No. lessons per week in grade 6 primary 33
No. lessons per week in grade 1 gimnazjum 34
No. lessons per week in grade 2 & 3 gimnazjusm 35
Number of lessons a week a full time teacher teaches is 18
CALCULATION OF NUMBER OF TEACHING HOURS NEEDED
SP2 SP4 SP5 SP6 G1 G2 G3
Number of students in grade 1 91 146 81 126 130 323 192
Number of classes in grade 1 3.5 5.62 3.12 5.07 5 12.42 7.38
Number of teacher hours in grade 1 84 135 75 122 170 423 267
Number of students in grade 2 103 127 81 120 70 345 120
Number of classes in grade 2 3.96 4.88 3.12 5.00 2.69 13.27 4.80
Number of teacher hours in grade 2 95 117 75 122 94 466 170
Number of students in grade 3 97 112 87 127 61 263 155
Number of classes in grade 3 3.73 4.31 3.35 5.08 2.35 10.12 5.96
Number of teacher hours in grade 3 90 103 80 123 82 354 209
Number of students in grade 4 103 140 75 132
Number of classes in grade 4 3.96 5.38 2.88 5.28
Number of teacher hours in grade 4 127 172 92 170
Number of students in grade 5 110 145 94 124
Number of classes in grade 5 4.23 5.58 3.62 4.96
Number of teacher hours in grade 5 135 179 116 159
Number of students in grade 6 96 145 106 136
Number of classes in grade 6 3.7 5.6 4.1 5.4
Number of teacher hours in grade 6 122 184 135 180TOTAL TEACHING HOURS 653 891 572 875 346 1243 646
Total number of posts 36.3 49.5 31.8 48.6 19.2 68.0 34.1
Other posts
Librarian 2 2.5 1.8 2.5 1 2.5 1.6
Integrated class teachers 0 0 0 7 0 0 3
Child carers 1.9 2.5 1.7 2.5
Pedagogues 1 1 1 1 1 1 1
Sports activities staff 0.6 0.8 0.5 0.8
TOTAL TEACHING STAFF POSTS 41.8 56.2 36.8 62.5 21.2 71.5 39.7
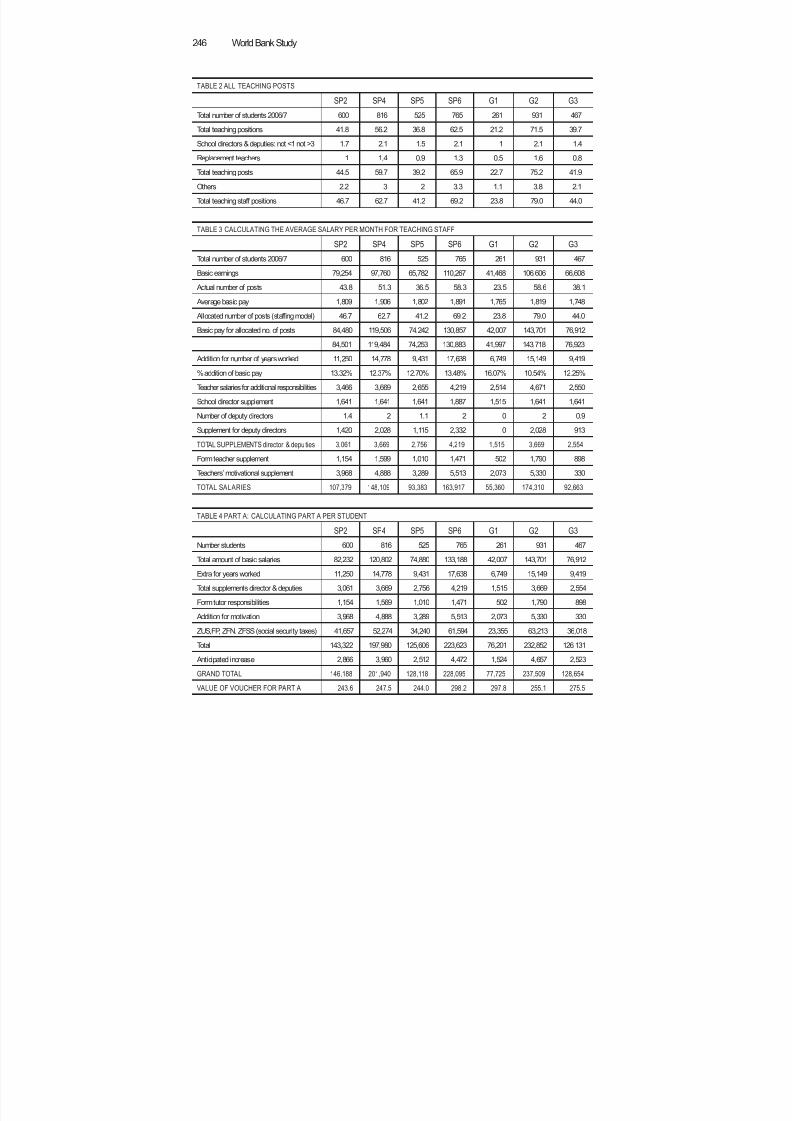
8/6/2019 Reforming Education Finance in Transition Countries
http://slidepdf.com/reader/full/reforming-education-finance-in-transition-countries 270/335
World Bank Study246
TABLE 2 ALL TEACHING POSTS
SP2 SP4 SP5 SP6 G1 G2 G3
Total number of students 2006/7 600 816 525 765 261 931 467
Total teaching positions 41.8 56.2 36.8 62.5 21.2 71.5 39.7
School directors & deputies: not <1 not >3 1.7 2.1 1.5 2.1 1 2.1 1.4
Replacement teachers 1 1.4 0.9 1.3 0.5 1.6 0.8
Total teaching posts 44.5 59.7 39.2 65.9 22.7 75.2 41.9
Others 2.2 3 2 3.3 1.1 3.8 2.1
Total teaching staff positions 46.7 62.7 41.2 69.2 23.8 79.0 44.0
TABLE 3 CALCULATING THE AVERAGE SALARY PER MONTH FOR TEACHING STAFF
SP2 SP4 SP5 SP6 G1 G2 G3
Total number of students 2006/7 600 816 525 765 261 931 467
Basic earnings 79,254 97,760 65,782 110,267 41,468 106,606 66,608
Actual number of posts 43.8 51.3 36.5 58.3 23.5 58.6 38.1
Average basic pay 1,809 1,906 1,802 1,891 1,765 1,819 1,748
Allocated number of posts (staf fing model) 46.7 62.7 41.2 69.2 23.8 79.0 44.0
Basic pay for allocated no. of posts 84,480 119,506 74,242 130,857 42,007 143,701 76,912
84,501 119,484 74,253 130,883 41,997 143,718 76,923
Addition for number of years worked 11,250 14,778 9,431 17,638 6,749 15,149 9,419
% addition of basic pay 13.32% 12.37% 12.70% 13.48% 16.07% 10.54% 12.25%
Teacher salaries for additional responsibilities 3,466 3,669 2,655 4,219 2,514 4,671 2,550
School director supplement 1,641 1,641 1,641 1,887 1,515 1,641 1,641
Number of deputy directors 1.4 2 1.1 2 0 2 0.9
Supplement for deputy directors 1,420 2,028 1,115 2,332 0 2,028 913
TOTAL SUPPLEMENTS director & deputies 3,061 3,669 2,756 4,219 1,515 3,669 2,554
Form teacher supplement 1,154 1,599 1,010 1,471 502 1,790 898
Teachers’ motivational supplement 3,968 4,888 3,289 5,513 2,073 5,330 330
TOTAL SALARIES 107,379 148,109 93,383 163,917 55,360 174,310 92,663
TABLE 4 PART A: CALCULATING PART A PER STUDENT
SP2 SP4 SP5 SP6 G1 G2 G3
Number students 600 816 525 765 261 931 467Total amount of basic salaries 82,232 120,802 74,880 133,188 42,007 143,701 76,912
Extra for years worked 11,250 14,778 9,431 17,638 6,749 15,149 9,419
Total supplements director & deputies 3,061 3,669 2,756 4,219 1,515 3,669 2,554
Form tutor responsibilities 1,154 1,569 1,010 1,471 502 1,790 898
Addition for motivation 3,968 4,888 3,289 5,513 2,073 5,330 330
ZUS,FP, ZFN. ZFSS (social security taxes) 41,657 52,274 34,240 61,594 23,355 63,213 36,018
Total 143,322 197,980 125,606 223,623 76,201 232,852 126,131
Anticipated increase 2,866 3,960 2,512 4,472 1,524 4,657 2,523
GRAND TOTAL 146,188 201,940 128,118 228,095 77,725 237,509 128,654
VALUE OF VOUCHER FOR PART A 243.6 247.5 244.0 298.2 297.8 255.1 275.5
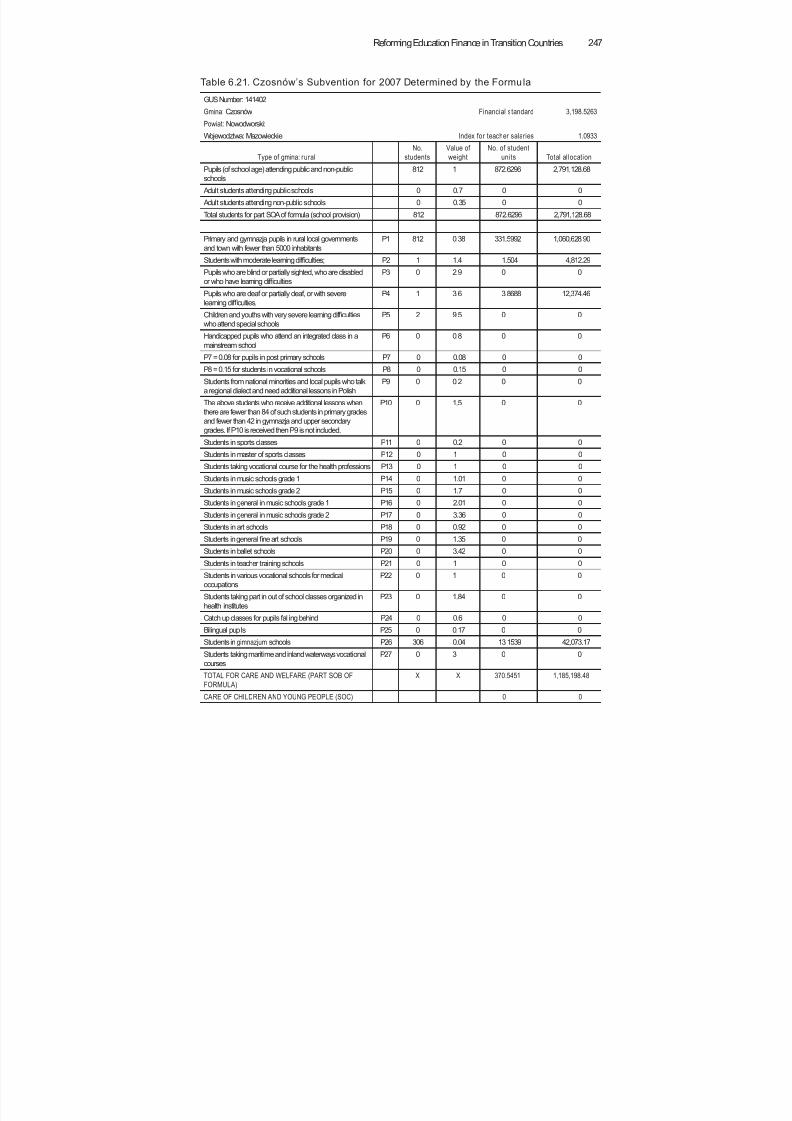
8/6/2019 Reforming Education Finance in Transition Countries
http://slidepdf.com/reader/full/reforming-education-finance-in-transition-countries 271/335
Reforming Education Finance in Transition Countries 247
Table 6.21. Czosnów’s Subvention for 2007 Determined by the Formula
GUS Number: 141402
Gmina: Czosnów Financial standard 3,198.5263
Powiat: Nowodworski:
Wojewodztwa: Mazowieckie Index for teacher salaries 1.0933
Type of gmina: rural
No.
students
Value of
weight
No. of student
units Total allocation
Pupils (of school age) attending public and non-public
schools
812 1 872.6296 2,791,128.68
Adult students attending public schools 0 0.7 0 0
Adult students attending non-public schools 0 0.35 0 0
Total students for part SOA of formula (school provision) 812 872.6296 2,791,128.68
Primary and gymnazja pupils in rural local governments
and town with fewer than 5000 inhabitants
P1 812 0.38 331.5992 1,060,628.90
Students with moderate learning dif ficulties; P2 1 1.4 1.504 4,812.29
Pupils who are blind or partially sighted, who are disabledor who have learning dif ficulties
P3 0 2.9 0 0
Pupils who are deaf or partially deaf, or with severe
learning dif ficulties,
P4 1 3.6 3.8688 12,374.46
Children and youths with very severe learning dif ficulties
who attend special schools
P5 2 9.5 0 0
Handicapped pupils who attend an integrated class in a
mainstream school
P6 0 0.8 0 0
P7 = 0.08 for pupils in post primary schools P7 0 0.08 0 0
P8 = 0.15 for students in vocational schools P8 0 0.15 0 0
Students from national minorities and local pupils who talk
a regional dialect and need additional lessons in Polish
P9 0 0.2 0 0
The above students who receive additional lessons when
there are fewer than 84 of such students in primary gradesand fewer than 42 in gymnazja and upper secondary
grades. If P10 is received then P9 is not included.
P10 0 1.5 0 0
Students in sports classes P11 0 0.2 0 0
Students in master of sports classes P12 0 1 0 0
Students taking vocational course for the health professions P13 0 1 0 0
Students in music schools grade 1 P14 0 1.01 0 0
Students in music schools grade 2 P15 0 1.7 0 0
Students in general in music schools grade 1 P16 0 2.01 0 0
Students in general in music schools grade 2 P17 0 3.36 0 0
Students in art schools P18 0 0.92 0 0
Students in general fine art schools P19 0 1.35 0 0
Students in ballet schools P20 0 3.42 0 0
Students in teacher training schools P21 0 1 0 0
Students in various vocational schools for medical
occupations
P22 0 1 0 0
Students taking part in out of school classes organized in
health institutes
P23 0 1.84 0 0
Catch up classes for pupils falling behind P24 0 0.6 0 0
Bilingual pupils P25 0 0.17 0 0
Students in gimnazjum schools P26 306 0.04 13.1539 42,073.17
Students taking maritime and inland waterways vocational
courses
P27 0 3 0 0
TOTAL FOR CARE AND WELFARE (PART SOB OF
FORMULA)
X X 370.5451 1,185,198.48
CARE OF CHILDREN AND YOUNG PEOPLE (SOC) 0 0
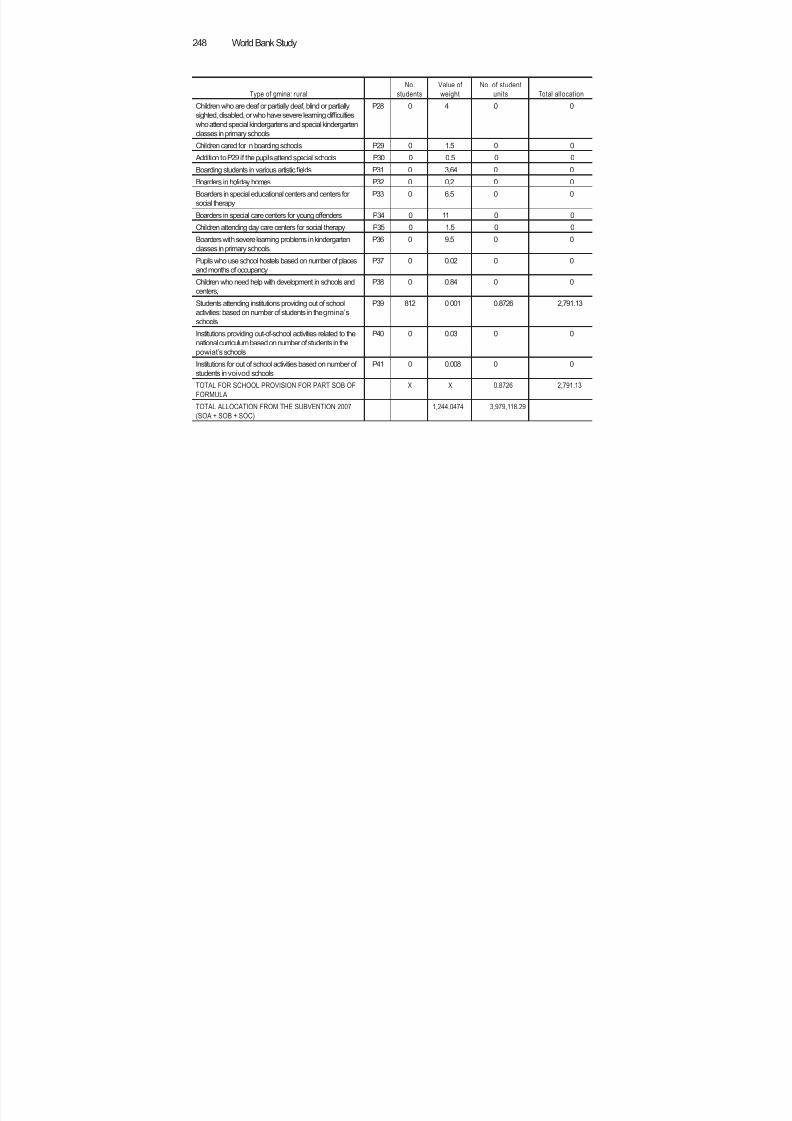
8/6/2019 Reforming Education Finance in Transition Countries
http://slidepdf.com/reader/full/reforming-education-finance-in-transition-countries 272/335
World Bank Study248
Type of gmina: rural
No.
students
Value of
weight
No. of student
units Total allocation
Children who are deaf or partially deaf, blind or partially
sighted, disabled, or who have severe learning dif ficulties
who attend special kindergartens and special kindergarten
classes in primary schools
P28 0 4 0 0
Children cared for in boarding schools P29 0 1.5 0 0
Addition to P29 if the pupils attend special schools P30 0 0.5 0 0
Boarding students in various artistic fields P31 0 3.64 0 0
Boarders in holiday homes P32 0 0.2 0 0
Boarders in special educational centers and centers for
social therapy
P33 0 6.5 0 0
Boarders in special care centers for young offenders P34 0 11 0 0
Children attending day care centers for social therapy P35 0 1.5 0 0
Boarders with severe learning problems in kindergarten
classes in primary schools
P36 0 9.5 0 0
Pupils who use school hostels based on number of places
and months of occupancy
P37 0 0.02 0 0
Children who need help with development in schools and
centers,
P38 0 0.84 0 0
Students attending institutions providing out of school
activities: based on number of students in the gmina’s
schools
P39 812 0.001 0.8726 2,791.13
Institutions providing out-of-school activities related to the
national curriculum based on number of students in the
powiat’s schools
P40 0 0.03 0 0
Institutions for out of school activities based on number of
students in voivod schools
P41 0 0.008 0 0
TOTAL FOR SCHOOL PROVISION FOR PART SOB OF
FORMULA
X X 0.8726 2,791.13
TOTAL ALLOCATION FROM THE SUBVENTION 2007
(SOA + SOB + SOC)
1,244.0474 3,979,118.29
8/6/2019 Reforming Education Finance in Transition Countries
http://slidepdf.com/reader/full/reforming-education-finance-in-transition-countries 273/335
Reforming Education Finance in Transition Countries 249
Annex B. Lis t of People Interv iewed for the Country Case Study
Ms. Grażyna Kida, Director of Economic Department, Ministry of Education
Ms. Zdzis ł awa Wasążnik, Director of Department of Financing of Local Governments,
Ministry of Finance
Ms. Alina Kozińska, Foundation for Education Initiatives
Mr.S ł awomir Broniarz, Head of ZNP (Union of Polish Teachers)
Mr. Antoni Krężlewicz, Mayor of Czosnów Gmina
Ms. Katarzyna Grabska, Head of Education Department of Czosnów Gmina
Mr. Roman Bera, Deputy Mayor of Kwidzyń Gmina
Mr. Marek Olszewski, Mayor of Lubicz Gmina and Vice President of Zwią zek Gmin
Wiejskich (ZGW or Association of Rural Gminas)
Mr. M. Sielatycki, Deputy Director of Department of Education, Warsaw Municipality
Ms. Ewa Piotrowska, Director of Finance, Kuratorium Oświaty in Warsaw
Ms. Anna Nagraba, Director of D ł użew School
Mr. Micha ł Rzewuski, Chairman of D ł użew School Association.
Mr. Miko ł aj Herbst, Expert on Economics of Education, Centre for Regional Studies,
Warsaw University
8/6/2019 Reforming Education Finance in Transition Countries
http://slidepdf.com/reader/full/reforming-education-finance-in-transition-countries 274/335
World Bank Study250
Notes
1. I would like to thank Jerzy Wiśniewski and Ma ł gosia Lepiech for organizing my study visit to
Poland from June 12 through June 22 of 2007 and for all the people who gave so generously of their
time to explain the Polish school funding system to me and show me around their schools. They
are too many to name here and they are listed in Annex B. I also thank Maciej Jakubowski and JanHerczyński for his comments. All mistakes and errors of interpretation are my responsibility.
2. In Poland, the formula is referred to as an algorithm. However, to be consistent with the other
chapters in this book, the word formula will be used.
3. Initially this was 50 percent of the state subvention per student in the LG area in which the school
is located and later became 100 percent.
4. The weights for pupils were for rural gminas: 1.86 for average class size <15, 1.44 for class size 15
to 18; 1.33 for class size >18 and 1.2 for urban gminas with average class size < 24; 1 for average class
size equal or greater than 24 (Levitas & Herczyński 2001, p. 25).
5. The thresholds changed over time: in 1999 the upper threshold was eliminated.
6. The weight was 0.33 for pupils in schools in rural areas and 0.18 for those in small towns.
7. PiS stands for Prawo i Sprawiedliwość
(Law and Justice Party). It was voted out of offi ce in October2007.
8. Up is the sum of the number of each type of student multiplied by its weight.
9. In the rest of the chapter monetary values are given in current year prices. Inflation in the period
2001 to 2007 was 2001: 3.2%; 2002: 2.0%; 2003: 0%; 2004: 4.0%; 2005: 2.9%; 2006: 1.9% and 2007: 3.7%.
10. In 2007 gminas were alloed 6.71% of national corporation tax and 39.34% of national per-
sonal income tax allocated as a national average according to the number of registered tax payers.
Powiats received 1.4% of corporation tax and 10.25% of personal tax and voivods 15.95% and 1.6%
respectively. (Source: interview at MoF.)
11. The Union of Polish Teachers (ZNP) is regarded as strong: MEN failed to obtain an increase in
the pensum in 2000 when the Teachers’ Charter was revised.
12. All public sector employees have a legally defined basic salary for their occupation and grade.
In the case of teachers there is further legislation, which permits the Minister of Education to definelower basic pay for teachers so that teachers’ salary costs can be afforded within the subvention
total agreed by the MoF. Teachers’ salaries account for about 90% of the subvention though this
varies substantially for individual LGs.
13. This evidence does not include evidence of effective teaching measured in terms of student
progress in external tests or other indicators of teacher performance (OECD, 2006).
14. Nominated and diploma teachers have permanent jobs. If made redundant long-serving teach-
ers get paid 6 months’ salary. Novice and contracted teachers get nothing. Redundancy pay is paid
by local government. After 30 years’ work, 20 of it in class, teachers have the right to retire. If retir-
ing and declared redundant, a teacher gets an additional 3 months’ salary.
15. A case was reported of a kurator refusing to allow the closure of a school in his own village.
16. This may well be a desirable development.17. The calculation of the formula for Kwidzyn is given in Table 6.19 in the Annex.
18. The Deputy Mayor, whose portfolio includes Education and Culture, used to be a teacher.
19. Interview with Mr Bera.
20. This is the way integrated special education is organized in Poland.
21. This is one of the two models of organizing school accounting practiced by local governments
in Poland. It would appear to be the more common one.
22. For example compared to an earlier version described by Herczyński (2004).
23. The information on Czosnów was provided by the mayor Antoni Krężlewicz and the inspector
of education, Katarzyna Grabska, as well as by the school directors and staff of the two schools,
which were visited.
24. Table 6.21 shows how the formula calculated Czosnów’s education subvention in 2007.
25. See Levitas and Herczyński (2002), Annex A.
26. This government failed to return to power in elections held in October 2007.
27. The GUS website accessed in June 2007 did not have data on teacher numbers after 2002.
8/6/2019 Reforming Education Finance in Transition Countries
http://slidepdf.com/reader/full/reforming-education-finance-in-transition-countries 275/335
Reforming Education Finance in Transition Countries 251
28. This is of course not the same as estimating the effect of bussing on the students who are bussed.
The variable used could be correlated with unobserved social factors, which lower aainment.
29. See OECD (2007), Tables 6.3a and 6.3b.
30. These are that the PISA index of the economic, social and cultural status of students explains
relatively lile of the variance in student aainment compared to other countries and that the be-
tween school variance in aainment is small relative to total variance.
31. Due to privacy laws schools cannot collect data on parents’ education, occupation, or employ-
ment. However, it would be possible, as in some other countries, to use area socio-economic data.
In 2001 the team of experts advising on the formula proposed replacing the weight for rural schools
by a measure of relative poverty at the gmina level but this was rejected by the Minister.
32. They cite as sources for this definition King (1984) and Bramley (1990).
33. Interview with Alina Kozińska, Foundation for Education Initiatives.
34. The school director and two members of the management commiee were interviewed.
35. Data on Siennica are from GUS tables and from MEN for the subvention. The GUS expenditure
on primary education does not include capital expenditure whereas the window replacement is
capital expenditure.
36. The voivod results by school were seen by the interviewer.37. I.e. gmina revenues from all sources minus the education subvention.
38. Interview with Marek Olszewski, Vice-President of Union of Rural Gminas.
39. During interviews, school directors and LG leaders, used test results to back up judgements
about the quality of a school.
40. Jakubowksi (2007) undertook value added analysis of gumnazjum test scores at year 9 for 2005,
2006 and 2007 with a random effects student-level model. As in many other studies, expenditure
per student was not statistically significantly related to aainment.
41. Gminas have limited powers to change local tax rates and fees, and their share of central govern-
ment tax revenues is fixed.
42. These are the posts of Nominated teacher and Diploma teacher which carry higher salaries (see
section 4).
8/6/2019 Reforming Education Finance in Transition Countries
http://slidepdf.com/reader/full/reforming-education-finance-in-transition-countries 276/335
252
C H A P T E R 7
Per Capita Financing ofGeneral Education in Russia:
An Assessment of the FinancingReform in the Chuvash
Republic and the Tver Oblast Sachiko Kataoka1
7.1. Introduction
In Russia, school directors historically were strict executors of federal regulations on ed-
ucation with lile, if any, management or financial autonomy at the school level. School
budgets were determined according to the budget allocations of previous years and
federal regulations on educational inputs. Each school formulated its budget estimate
by using the norms on inputs such as the number of classes (regardless of the number
of students per class), base salaries for the weekly teaching loads (stavka) and salary
supplements for additional work, and the size of buildings (square meters). Schools then
submied their budgets to the regional administration by line item. Budget items were
narrowly defined and tightly controlled by the government. Schools received their al-
lotment, which was often subject to nontransparent and unpredictable bargaining and
discretion, on a monthly basis by line item. School directors were not allowed to reallo-
cate among budget lines. For instance, savings on wages and salaries could not be used
on other budget items like teaching and learning materials. Hence, even though school
directors were given decision-making authority over personnel management, including
hiring and firing of staff , in reality, the input-based budget allocation method with tight
control over budget items has provided them with no financial autonomy or incentive to
economize on staffi ng or spending. On the contrary, there was an incentive for schools
to inflate their needs, for instance, by hiring and retaining as many teachers as possible.
Facing the severe fiscal environment, falling education budget and rapidly declin-
ing student population in the early 1990s, the government realized that the traditional
input-based financing method was no longer aff ordable and that it needed an alternative
scheme forfi
nancing the education sector—per capitafi
nancing (PCF). The federal gov-ernment set up the legal framework to introduce PCF in the early 1990s, but it was only
8/6/2019 Reforming Education Finance in Transition Countries
http://slidepdf.com/reader/full/reforming-education-finance-in-transition-countries 277/335
Reforming Education Finance in Transition Countries 253
in 2001 when the Federal Ministry of Education and Science (MOES) started introducing
the PCF mechanism on a pilot basis as part of the Education Modernization Program
(EMP).2 This chapter explores how the federal and regional governments started intro-
ducing PCF as an alternative financing method, focusing on the cases of the PCF experi-
ence in the Chuvash Republic (one of the three pilot regions) and the Tver Oblast (one ofthe 22 grant-recipient regions).3
The rest of this chapter is organized as follows: Section 7.2 provides a brief back-
ground summary on the education system and the development of the legal framework
for the PCF reform. Section 7.3 discusses the design of the PCF scheme in Russia, includ-
ing the policy objectives and methodologies. . Section 7.4 discusses the implementation
of the PCF system. It explains how the PCF scheme began on a pilot basis and was
gradually expanded, and then describes the historical background of introducing the
PCF scheme in the two case study regions and the methodologies adopted in the respec-
tive regions. Section 7.5 assesses the outcomes of the PCF implementation to date in
terms of effi ciency, equity, and transparency and accountability. The concluding section
summarizes lessons learned.
7.2. Background
7.2.1. Education System in Russia
Eleven-year general secondary education4 (GSE) in Russian is compulsory since Sep-
tember 1, 2007. The GSE school system of the Russian Federation consists of nine years
of basic general education and two years of upper secondary education, which leads to
the certification of complete GSE. In the school year 2007/08, there were 56,407 full-time
GSE schools (in addition, there were 1,585 GSE evening schools). Of these, 65 percentoff ered complete GSE (grades 1-11),5 19 percent off ered basic general education (grades
1-9), and 13 percent primary education (grades 1-4) only. Private schools accounted for
about 0.5 percent of GSE enrollment.6 Public GSE schools are financed by the regional
and municipal governments.
7.2.2. Legal Framework for Education Financing
The federal government set up the legal framework to introduce per capita financing
(PCF) in the early 1990s (see Table 7.1). As part of the overall education reforms and
educational decentralization to the regional level, the federal government introduced
the concept of PCF in the Education Law of 1992. The Article 41 of the Law stipulated thateducational institutions would be financed on a per student basis according to the feder-
ally and locally established norms for financing all types of educational establishments.
It was expected that the PCF scheme would bring greater effi ciency and accountability
to the education system by providing school directors with incentives to manage school
budgets effi ciently and improve the quality of education in order to aract more stu-
dents. Despite the urgent needs for the reforms, in the absence of detailed regulations to
implement the Law or strong political will, no serious aempts were made at the federal
level to introduce the new financing scheme during the 1990s. In the meantime, the Sa-
mara Oblast and Chuvash Republic went ahead and introduced the PCF mechanism at
the regional level in 1998.
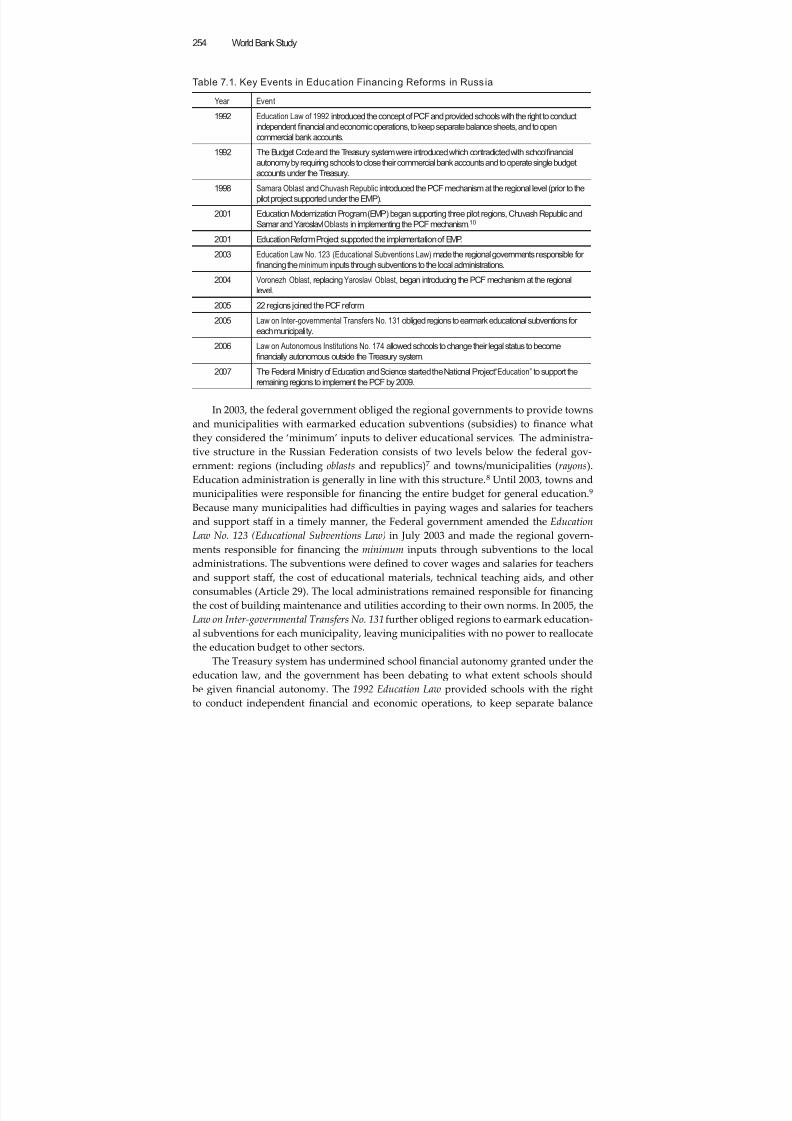
8/6/2019 Reforming Education Finance in Transition Countries
http://slidepdf.com/reader/full/reforming-education-finance-in-transition-countries 278/335
World Bank Study254
Table 7.1. Key Events in Education Financing Reforms in Russia
Year Event
1992 Education Law of 1992 introduced the concept of PCF and provided schools with the right to conduct
independent financial and economic operations, to keep separate balance sheets, and to open
commercial bank accounts.
1992 The Budget Code and the Treasury system were introduced which contradicted with schoolfinancial
autonomy by requiring schools to close their commercial bank accounts and to operate single budget
accounts under the Treasury.
1998 Samara Oblast andChuvash Republic introduced the PCF mechanism at the regional level (prior to the
pilot project supported under the EMP).
2001 Education Modernization Program (EMP) began supporting three pilot regions, Chuvash Republic and
Samar and Yaroslavl Oblasts in implementing the PCF mechanism.10
2001 Education Reform Project supported the implementation of EMP.
2003 Education Law No. 123 (Educational Subventions Law) made the regional governments responsible for
financing the minimum inputs through subventions to the local administrations.
2004 Voronezh Oblast, replacing Yaroslavl Oblast, began introducing the PCF mechanism at the regional
level.
2005 22 regions joined the PCF reform.
2005 Law on Inter-governmental Transfers No. 131 obliged regions to earmark educational subventions for
each municipality.
2006 Law on Autonomous Institutions No. 174 allowed schools to change their legal status to become
financially autonomous outside the Treasury system.
2007 The Federal Ministry of Education and Science started the National Project “Education” to support the
remaining regions to implement the PCF by 2009.
In 2003, the federal government obliged the regional governments to provide townsand municipalities with earmarked education subventions (subsidies) to finance what
they considered the ‘minimum’ inputs to deliver educational services. The administra-
tive structure in the Russian Federation consists of two levels below the federal gov-
ernment: regions (including oblasts and republics)7 and towns/municipalities (rayons).
Education administration is generally in line with this structure.8 Until 2003, towns and
municipalities were responsible for financing the entire budget for general education.9
Because many municipalities had diffi culties in paying wages and salaries for teachers
and support staff in a timely manner, the Federal government amended the Education
Law No. 123 (Educational Subventions Law) in July 2003 and made the regional govern-
ments responsible for financing the minimum inputs through subventions to the localadministrations. The subventions were defined to cover wages and salaries for teachers
and support staff , the cost of educational materials, technical teaching aids, and other
consumables (Article 29). The local administrations remained responsible for financing
the cost of building maintenance and utilities according to their own norms. In 2005, the
Law on Inter-governmental Transfers No. 131 further obliged regions to earmark education-
al subventions for each municipality, leaving municipalities with no power to reallocate
the education budget to other sectors.
The Treasury system has undermined school financial autonomy granted under the
education law, and the government has been debating to what extent schools should
be given financial autonomy. The 1992 Education Law provided schools with the rightto conduct independent financial and economic operations, to keep separate balance
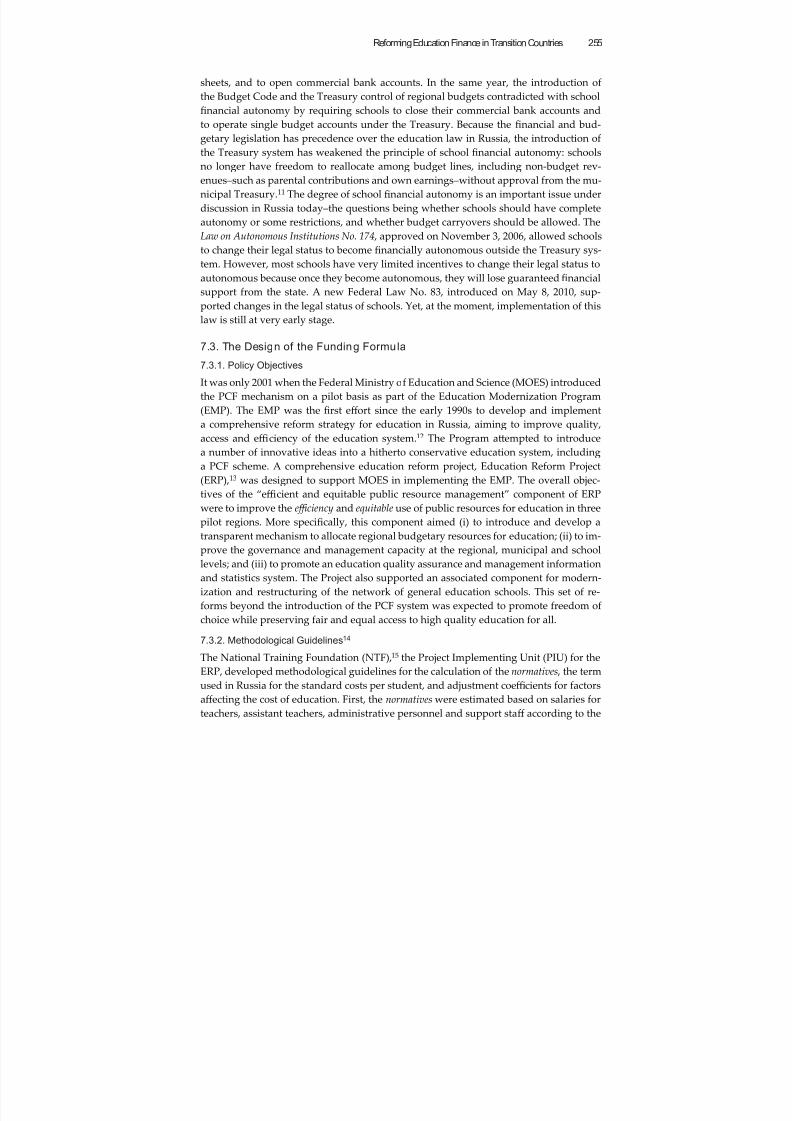
8/6/2019 Reforming Education Finance in Transition Countries
http://slidepdf.com/reader/full/reforming-education-finance-in-transition-countries 279/335
Reforming Education Finance in Transition Countries 255
sheets, and to open commercial bank accounts. In the same year, the introduction of
the Budget Code and the Treasury control of regional budgets contradicted with school
financial autonomy by requiring schools to close their commercial bank accounts and
to operate single budget accounts under the Treasury. Because the financial and bud-
getary legislation has precedence over the education law in Russia, the introduction ofthe Treasury system has weakened the principle of school financial autonomy: schools
no longer have freedom to reallocate among budget lines, including non-budget rev-
enues–such as parental contributions and own earnings–without approval from the mu-
nicipal Treasury.11 The degree of school financial autonomy is an important issue under
discussion in Russia today–the questions being whether schools should have complete
autonomy or some restrictions, and whether budget carryovers should be allowed. The
Law on Autonomous Institutions No. 174 , approved on November 3, 2006, allowed schools
to change their legal status to become financially autonomous outside the Treasury sys-
tem. However, most schools have very limited incentives to change their legal status to
autonomous because once they become autonomous, they will lose guaranteed financial
support from the state. A new Federal Law No. 83, introduced on May 8, 2010, sup-
ported changes in the legal status of schools. Yet, at the moment, implementation of this
law is still at very early stage.
7.3. The Design of the Funding Formula
7.3.1. Policy Objectives
It was only 2001 when the Federal Ministry of Education and Science (MOES) introduced
the PCF mechanism on a pilot basis as part of the Education Modernization Program
(EMP). The EMP was the first eff ort since the early 1990s to develop and implementa comprehensive reform strategy for education in Russia, aiming to improve quality,
access and effi ciency of the education system.12 The Program aempted to introduce
a number of innovative ideas into a hitherto conservative education system, including
a PCF scheme. A comprehensive education reform project, Education Reform Project
(ERP),13 was designed to support MOES in implementing the EMP. The overall objec-
tives of the “effi cient and equitable public resource management” component of ERP
were to improve the e ffi ciency and equitable use of public resources for education in three
pilot regions. More specifically, this component aimed (i) to introduce and develop a
transparent mechanism to allocate regional budgetary resources for education; (ii) to im-
prove the governance and management capacity at the regional, municipal and schoollevels; and (iii) to promote an education quality assurance and management information
and statistics system. The Project also supported an associated component for modern-
ization and restructuring of the network of general education schools. This set of re-
forms beyond the introduction of the PCF system was expected to promote freedom of
choice while preserving fair and equal access to high quality education for all.
7.3.2. Methodological Guidelines14
The National Training Foundation (NTF),15 the Project Implementing Unit (PIU) for the
ERP, developed methodological guidelines for the calculation of the normatives , the term
used in Russia for the standard costs per student, and adjustment coeffi cients for factorsaff ecting the cost of education. First, the normatives were estimated based on salaries for
teachers, assistant teachers, administrative personnel and support staff according to the
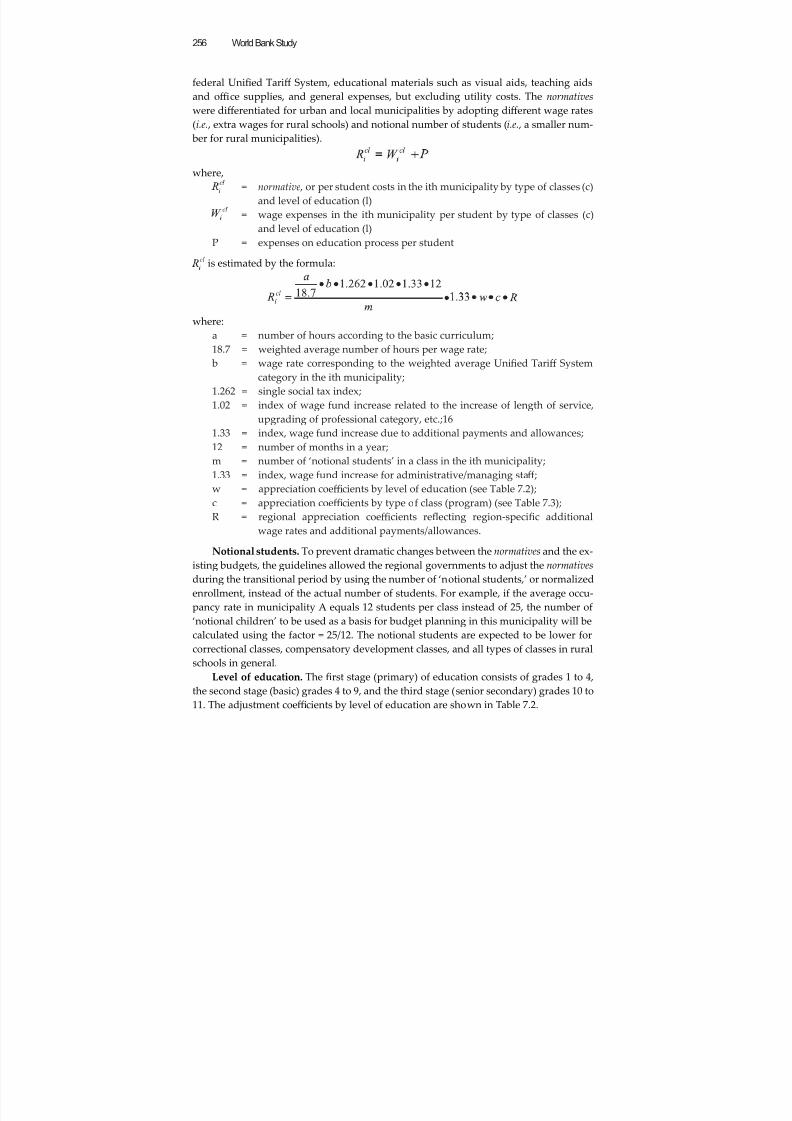
8/6/2019 Reforming Education Finance in Transition Countries
http://slidepdf.com/reader/full/reforming-education-finance-in-transition-countries 280/335
World Bank Study256
federal Unified Tariff System, educational materials such as visual aids, teaching aids
and offi ce supplies, and general expenses, but excluding utility costs. The normatives
were diff erentiated for urban and local municipalities by adopting diff erent wage rates
(i.e. , extra wages for rural schools) and notional number of students (i.e. , a smaller num-
ber for rural municipalities).
where,
= normative , or per student costs in the ith municipality by type of classes (c)
and level of education (l)
= wage expenses in the ith municipality per student by type of classes (c)
and level of education (l)
P = expenses on education process per student
is estimated by the formula:
where:
а = number of hours according to the basic curriculum;
18.7 = weighted average number of hours per wage rate;
b = wage rate corresponding to the weighted average Unified Tariff System
category in the ith municipality;
1.262 = single social tax index;
1.02 = index of wage fund increase related to the increase of length of service,
upgrading of professional category, etc.;16
1.33 = index, wage fund increase due to additional payments and allowances;
12 = number of months in a year;
m = number of ‘notional students’ in a class in the ith municipality;
1.33 = index, wage fund increase for administrative/managing staff ;
w = appreciation coeffi cients by level of education (see Table 7.2);
c = appreciation coeffi cients by type of class (program) (see Table 7.3);
R = regional appreciation coeffi cients reflecting region-specific additional
wage rates and additional payments/allowances.
Notional students. To prevent dramatic changes between the normatives and the ex-isting budgets, the guidelines allowed the regional governments to adjust the normatives
during the transitional period by using the number of ‘notional students,’ or normalized
enrollment, instead of the actual number of students. For example, if the average occu-
pancy rate in municipality А equals 12 students per class instead of 25, the number of
‘notional children’ to be used as a basis for budget planning in this municipality will be
calculated using the factor = 25/12. The notional students are expected to be lower for
correctional classes, compensatory development classes, and all types of classes in rural
schools in general.
Level of education. The first stage (primary) of education consists of grades 1 to 4,
the second stage (basic) grades 4 to 9, and the third stage (senior secondary) grades 10 to
11. The adjustment coeffi cients by level of education are shown in Table 7.2.
8/6/2019 Reforming Education Finance in Transition Countries
http://slidepdf.com/reader/full/reforming-education-finance-in-transition-countries 281/335
Reforming Education Finance in Transition Countries 257
Type of class (educational program). The formula includes appreciation factors by
type of class, as shown in Table 7.3.
Table 7.2. Adjustment Coef fi cients by Level of Education
Division of classes
into groups
After-school
groups
Club
activities
Total (‘w’ in the
formula)
(A) (B) (C) (A) x (B) x (C)
1st stage (primary) 1.04 1.4 1.03 1.50
2nd stage (basic) 1.12 1.0 1.03 1.15
3rd stage (senior) 1.22 1.0 1.03 1.26
Source: NTF (2002).
Table 7.3. Adjustment Coef fi cients by Type of Class (Educational Program)
Regular 1.00
Gymnasia and Lyceum 1.15
Special education 3.22
Compensatory development 2.27
Source: NTF (2002).
The regional governments were given some flexibility in adopting the guidelines.
First, regional governments were not required to adopt exactly the same variables
and coeffi cients as described in the guidelines, even though many regions followed
the guidelines only with small adjustments. Second, the guidelines allowed regions tosmooth the subvention to each municipality be within certain ceilings such as plus or
minus 10 percent difference from the expenditures in the previous year. The guidelines
did not specify how long the length of the ‘transitional period’ should be, and it seems
that regions could continue using the provisional measure for some years after the im-
plementation of the PCF scheme. Third, the guidelines were primarily prepared for re-
gional governments to determine the amount of educational subventions to municipali-
ties. Then, regional governments may or may not require municipal governments to use
the same formula with some further adjustments to determine school budgets.
7.4. The Implementation of the Funding Formula7.4.1. PCF Pilot Project and Its Expansion
In 2001, the Education Reform Project (ERP) began supporting three pilot regions—the
Samara Oblast , Chuvash Republic and Voronezh Oblast—in implementing the PCF as
well as other reform activities. The first two regions were selected because they had al-
ready started piloting the PCF at the regional level in 1998. The last one joined the pilot
at the end of 2004.17 As a condition for the participation in the ERP, the pilot regions
agreed that 90 percent of schools in their regions would become financially autonomous
and receive per capita allocations by June 2005.18 The NTF provided intensive support
for the pilot regions, including various training for education administrators and school
directors, study tours, the provision of accounting software, and materials and equip-
ment for school network restructuring and quality assessment.19
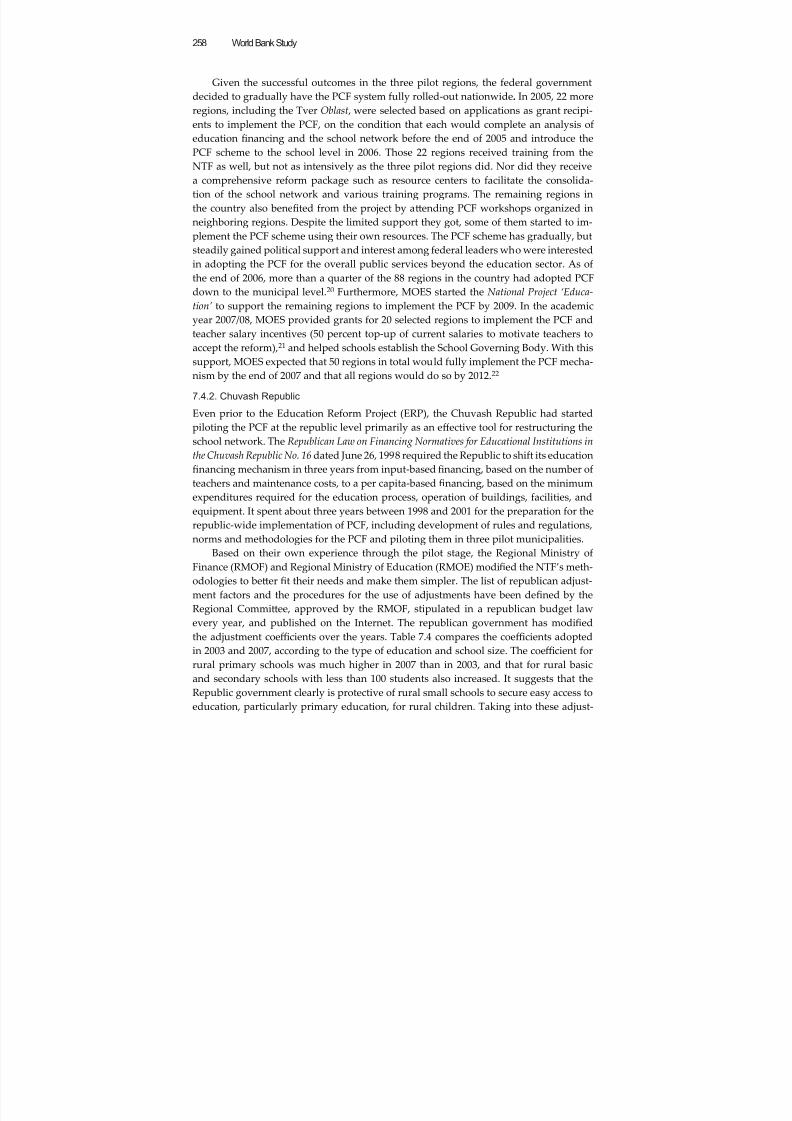
8/6/2019 Reforming Education Finance in Transition Countries
http://slidepdf.com/reader/full/reforming-education-finance-in-transition-countries 282/335
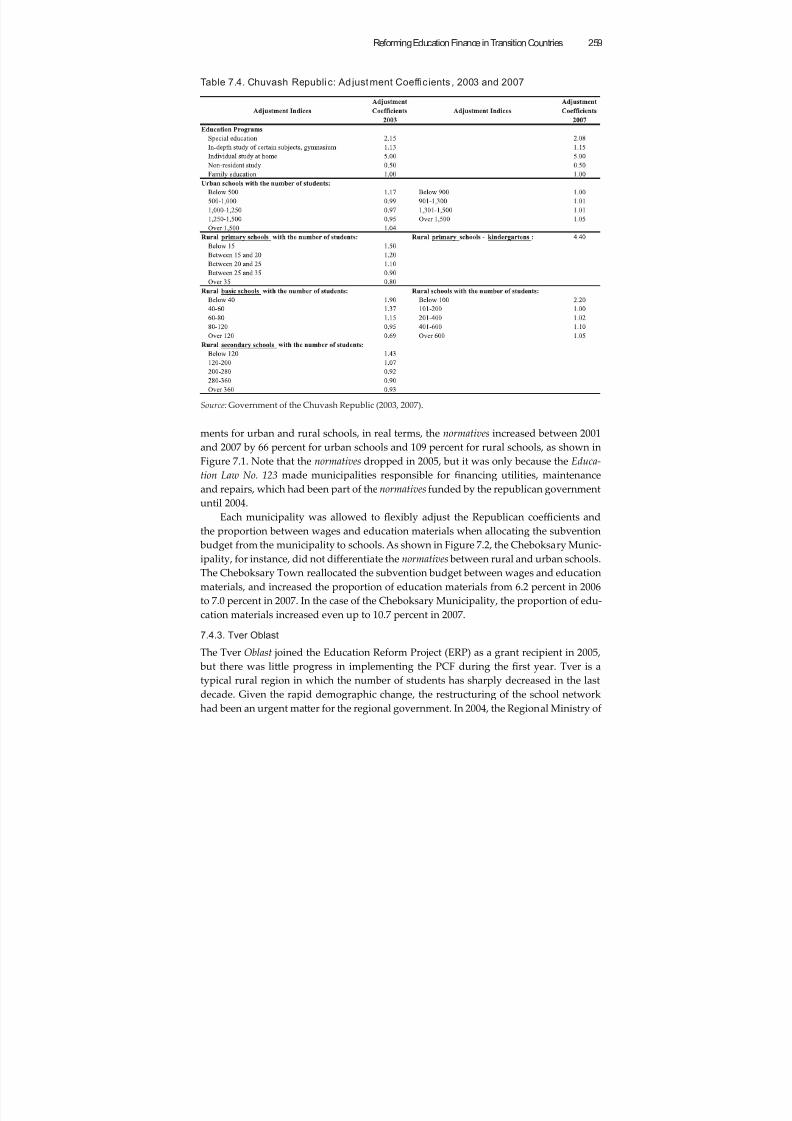
8/6/2019 Reforming Education Finance in Transition Countries
http://slidepdf.com/reader/full/reforming-education-finance-in-transition-countries 283/335
Reforming Education Finance in Transition Countries 259
ments for urban and rural schools, in real terms, the normatives increased between 2001
and 2007 by 66 percent for urban schools and 109 percent for rural schools, as shown in
Figure 7.1. Note that the normatives dropped in 2005, but it was only because the Educa-
tion Law No. 123 made municipalities responsible for financing utilities, maintenance
and repairs, which had been part of the normatives funded by the republican government
until 2004.
Each municipality was allowed to flexibly adjust the Republican coeffi cients and
the proportion between wages and education materials when allocating the subvention
budget from the municipality to schools. As shown in Figure 7.2, the Cheboksary Munic-ipality, for instance, did not diff erentiate the normatives between rural and urban schools.
The Cheboksary Town reallocated the subvention budget between wages and education
materials, and increased the proportion of education materials from 6.2 percent in 2006
to 7.0 percent in 2007. In the case of the Cheboksary Municipality, the proportion of edu-
cation materials increased even up to 10.7 percent in 2007.
7.4.3. Tver Oblast
The Tver Oblast joined the Education Reform Project (ERP) as a grant recipient in 2005,
but there was lile progress in implementing the PCF during the first year. Tver is a
typical rural region in which the number of students has sharply decreased in the lastdecade. Given the rapid demographic change, the restructuring of the school network
had been an urgent maer for the regional government. In 2004, the Regional Ministry of
Table 7.4. Chuvash Republic: Adjustment Coef fi c ients , 2003 and 2007
Source: Government of the Chuvash Republic (2003, 2007).
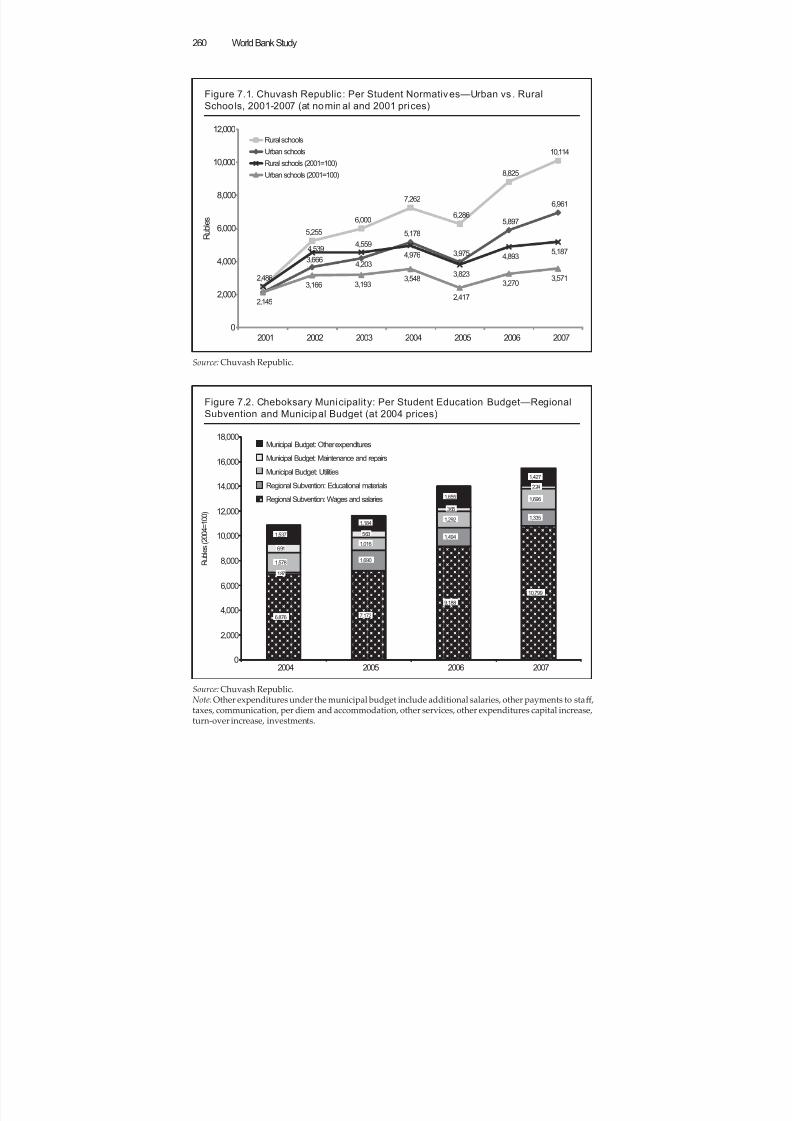
8/6/2019 Reforming Education Finance in Transition Countries
http://slidepdf.com/reader/full/reforming-education-finance-in-transition-countries 284/335
World Bank Study260
Figure 7.1. Chuvash Republic : Per Student Normatives—Urban vs . Rural
Schools, 2001-2007 (at nominal and 2001 prices)
Source: Chuvash Republic.
2,486
5,255
6,000
7,262
6,286
8,825
10,114
3,6664,203
5,178
3,975
5,897
6,961
4,539 4,559
4,976
3,823
4,893 5,187
2,145
3,166 3,1933,548
2,417
3,270 3,571
0
2,000
4,000
6,000
8,000
10,000
12,000
2001 2002 2003 2004 2005 2006 2007
R u
b l e s
Rural schools
Urban schools
Rural schools (2001=100)
Urban schools (2001=100)
Figure 7.2. Cheboksary Municipality: Per Student Education Budget—Regional
Subvention and Municipal Budget (at 2004 prices)
Source: Chuvash Republic.Note: Other expenditures under the municipal budget include additional salaries, other payments to staff ,taxes, communication, per diem and accommodation, other services, other expenditures capital increase,turn-over increase, investments.
6,876 7,172
9,188
10,799
187
1,690
1,494
1,335
1,578
1,016
1,292
1,696
691
563
365
224
1,537
1,184
1,655
1,427
0
2,000
4,000
6,000
8,000
10,000
12,000
14,000
16,000
18,000
2004 2005 2006 2007
Municipal Budget: Other expenditures
Municipal Budget: Maintenance and repairs
Municipal Budget: Utilities
Regional Subvention: Educational materials
Regional Subvention: Wages and salaries
R u
b l e s
( 2 0 0 4 =
1 0 0 )
8/6/2019 Reforming Education Finance in Transition Countries
http://slidepdf.com/reader/full/reforming-education-finance-in-transition-countries 285/335
Reforming Education Finance in Transition Countries 261
Education (RMOE)23 and Regional Ministry of Finance (RMOF) decided to apply for the
ERP grants and began analyzing education budget allocations to municipalities, as re-
quired as part of the application. Through this exercise, they discovered wide variations
in per capita allocations among municipalities. They also realized that developing one
unified formula for every municipality and every school is not easy and that municipaland school geographical characteristics such as low population density and isolation
from other schools needed to be taken into account when developing a formula. They
informed municipalities that education budgets would be allocated to them on a per
capita basis starting in 2005, but without clear guidance. Despite the commitment to the
PCF and awareness of the problem, the RMOE and RMOF ended up adopting a formula
with many coeffi cients and other adjustments in 2005, which made the municipal alloca-
tions almost the same as the historical ones. In much the same way, while some Heads of
the Municipal Departments of Education were already also aware of the wide variations
in the per student spending among schools in their jurisdiction (e.g. from 9,500 Rubles
(US$350) to 90,000 Rubles (US$3,300) in the Zubtsov Municipality), they adjusted the
formula so that the budget for each school did not deviate much from the historical al-
locations. There was lile, if any, progress in school network restructuring or equalizing
budget allocations among municipalities and among schools during the first year of the
PCF implementation.
The PCF implementation began in earnest in the Tver Oblast only in mid-2005 when
the First Deputy Head24 of RMOE started to build consensus among stakeholders. As the
Deputy Head of the RMOE observed inactions in implementing the PCF reform, he first
tried to build consensus among various stakeholders at regional, municipal and school
levels. The activities included awareness campaign for the Heads of municipalities and
school directors through seminars and training. Through this consensus-building pro-
cess, they came to share the same understanding of the objectives of PCF as an instru-
ment (i) to facilitate the school network restructuring process; (ii) to improve access to
good quality education and ultimately improve student academic performance (as as-
sessed in terms of the Unified State Exam25); and (iii) to create a competitive system of
education—schools compete for the best students and teachers, teachers compete for the
best schools and students, and students compete for the best schools and teachers.
Between 2004 and 2007, per student education budget in Tver Oblast, on average,
increased in real terms not only for salaries but also for teaching and learning materials.
Table 7.5 shows that the total per student expenditures increased by 21 percent at the2004 constant prices from 12,844 Rubles in 2004 to 15,537 Rubles in 2007, mostly owing
to the increase of the subvention budget to meet the higher costs of teacher salaries. The
non-budget revenues also sharply increased, even though the total amount is still small
compared to the budget funds. A higher percentage of the subvention budget was al-
located to teaching/learning materials (from 5.0 percent in 2004 to 11.2 percent in 2007),
which was reflected in the considerable increase in the per student expenditures on those
materials (from 315 Rubles in 2004 to 1,488 Rubles in 2007 at the 2004 constant prices).
In order to avoid the sharp budget cut for some municipalities, however, the Re-
gional government invented provisional ‘municipal coeffi cients’ during the transitional
period, taking a gradual approach to adopt formula-funding in a strict sense. The re-gional formula, which was designed based on the guidelines provided by the NTF, took
into account the following adjustment factors: geographical locations (urban and rural),

8/6/2019 Reforming Education Finance in Transition Countries
http://slidepdf.com/reader/full/reforming-education-finance-in-transition-countries 286/335
World Bank Study262
size of schools, types of classes, special education programs, individual education for
disabled children and advance teaching. In addition, the Regional government decided
to adopt a municipal coe ffi cient model with a diff erent but gradually converging coeffi cient
for each municipality during the transitional period. As shown in Figure 7.3, the per
student expenditures for municipalities ranged from 83 to 188 percent of the normatives
(formula-based allocations) in 2005 without much change from the previous years, but
Table 7.5. Tver Oblast: School Education Budget—Total for 43 Munic ipalities
2004 2005 2006 2007
Changes
2004-07
Total Education Budget (Rubles mil.) 1,876,001 2,068,261 2,442,027 2,825,357 50.6
Oblast Subvention 1,299,599 1,475,696 1,734,360 2,078,451 59.9
Wages and salaries 1,234,597 1,398,980 1,595,654 1,845,050 49.4
Wages and salaries (percent) 95.0 94.8 92.0 88.8
Teaching/learning materials 46,075 68,844 133,348 248,292 438.9
Municipality Budget 553,642 558,503 648,115 668,714 20.8
Utility 271,823 289,584 323,780 321,118 18.1
Maintenance 68,096 61,846 59,745 54,085 -20.6
Extra-budget Funds 22,760 34,063 59,552 78,193 243.6
Percentage
Oblast Subvention 69.3 71.3 71.0 73.6
Wages and salaries 65.8 67.6 65.3 65.3
Teaching/learning materials 2.5 3.3 5.5 8.8
Municipality Budget 29.5 27.0 26.5 23.7
Extra-budget Funds 1.2 1.6 2.4 2.8
Per student expenditures
(Rubles at current prices) 12,844 15,303 19,339 22,626 76.2
(Rubles at 2004 prices) 12,844 13,581 15,648 15,537 21.0
Source: Calculated by the author based on data collected by the Tver Ministry of Education.
Figure 7.3. Tver Oblast: Diversions from the Per Student Normatives, by Municipality
Source: Tver Oblast Department of Education (2010).
80
100
120
140
160
180
K i m r y
K a l i n i n s
k y T v
e r
L e s n o y
N e l i d
o v s k y
V y s h n y
V o l o c
h y o k
V y s h n e v o l o t
s k y R z h e
v
K o n a k o
v s k y
B o l o g
o v s k y
T o r z h
o k
K e s o v o g o r s k
y
O s t a s
h k o v s k y
S t a r i t s k y
B e z h e t s k y
L i k h o
s l a v l s k y
S p i r o
v s k y
S e l i z h
a r o v s k y
T o r z h
o k s k y
Z u b t s
o v s k y
Z a p a d n o v i n s
k y
K a l y a
z i n s k y
V e s y e g o n s k y
F i r o v s k y
U d o m
e l s k y
K a s h i n s
k y
M a k s
a t i k h i n s
k y
R z h e
v s k y
O l e n i n s
k y
K r a s
n o k h
o l m s k y
K u v s h i n
o v s k y
R a m e
s h k o
v s k y
K i m r s k
y
S o n k o v s k y B e l s k
y
M o l o k
o v s k y
P e n o v s k y
T o r o p
e t s k y
A n d r e
a p o l s k y
S a n d o v s k y
Z h a r k
o v s k y
200520062007
200820092010
Municipalities
D i v e r s i o n s f r o m t h e n o r m a t i v e s ( p
e r c e n t )
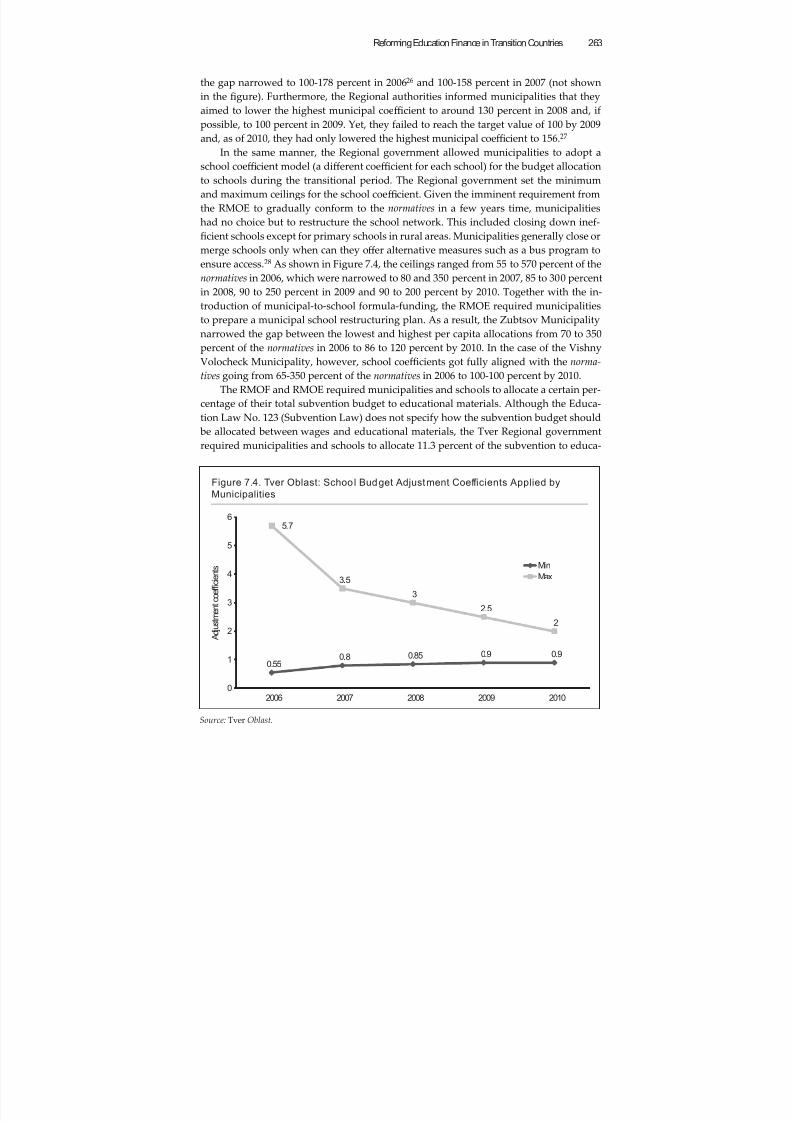
8/6/2019 Reforming Education Finance in Transition Countries
http://slidepdf.com/reader/full/reforming-education-finance-in-transition-countries 287/335
Reforming Education Finance in Transition Countries 263
the gap narrowed to 100-178 percent in 200626 and 100-158 percent in 2007 (not shown
in the figure). Furthermore, the Regional authorities informed municipalities that they
aimed to lower the highest municipal coeffi cient to around 130 percent in 2008 and, if
possible, to 100 percent in 2009. Yet, they failed to reach the target value of 100 by 2009
and, as of 2010, they had only lowered the highest municipal coeffi cient to 156.27 In the same manner, the Regional government allowed municipalities to adopt a
school coeffi cient model (a diff erent coeffi cient for each school) for the budget allocation
to schools during the transitional period. The Regional government set the minimum
and maximum ceilings for the school coeffi cient. Given the imminent requirement from
the RMOE to gradually conform to the normatives in a few years time, municipalities
had no choice but to restructure the school network. This included closing down inef-
ficient schools except for primary schools in rural areas. Municipalities generally close or
merge schools only when can they off er alternative measures such as a bus program to
ensure access.28 As shown in Figure 7.4, the ceilings ranged from 55 to 570 percent of the
normatives in 2006, which were narrowed to 80 and 350 percent in 2007, 85 to 300 percent
in 2008, 90 to 250 percent in 2009 and 90 to 200 percent by 2010. Together with the in-
troduction of municipal-to-school formula-funding, the RMOE required municipalities
to prepare a municipal school restructuring plan. As a result, the Zubtsov Municipality
narrowed the gap between the lowest and highest per capita allocations from 70 to 350
percent of the normatives in 2006 to 86 to 120 percent by 2010. In the case of the Vishny
Volocheck Municipality, however, school coeffi cients got fully aligned with the norma-
tives going from 65-350 percent of the normatives in 2006 to 100-100 percent by 2010.
The RMOF and RMOE required municipalities and schools to allocate a certain per-
centage of their total subvention budget to educational materials. Although the Educa-
tion Law No. 123 (Subvention Law) does not specify how the subvention budget should
be allocated between wages and educational materials, the Tver Regional government
required municipalities and schools to allocate 11.3 percent of the subvention to educa-
Figure 7.4. Tver Oblast: School Budget Adjustment Coef fi cients Applied by
Municipalities
Source: Tver Oblast.
0.550.8 0.85 0.9 0.9
5.7
3.5
3
2.5
2
0
1
2
3
4
5
6
2006 2007 2008 2009 2010
Min
Max
A d j u s t m e n t c o e f f i c i e n t s
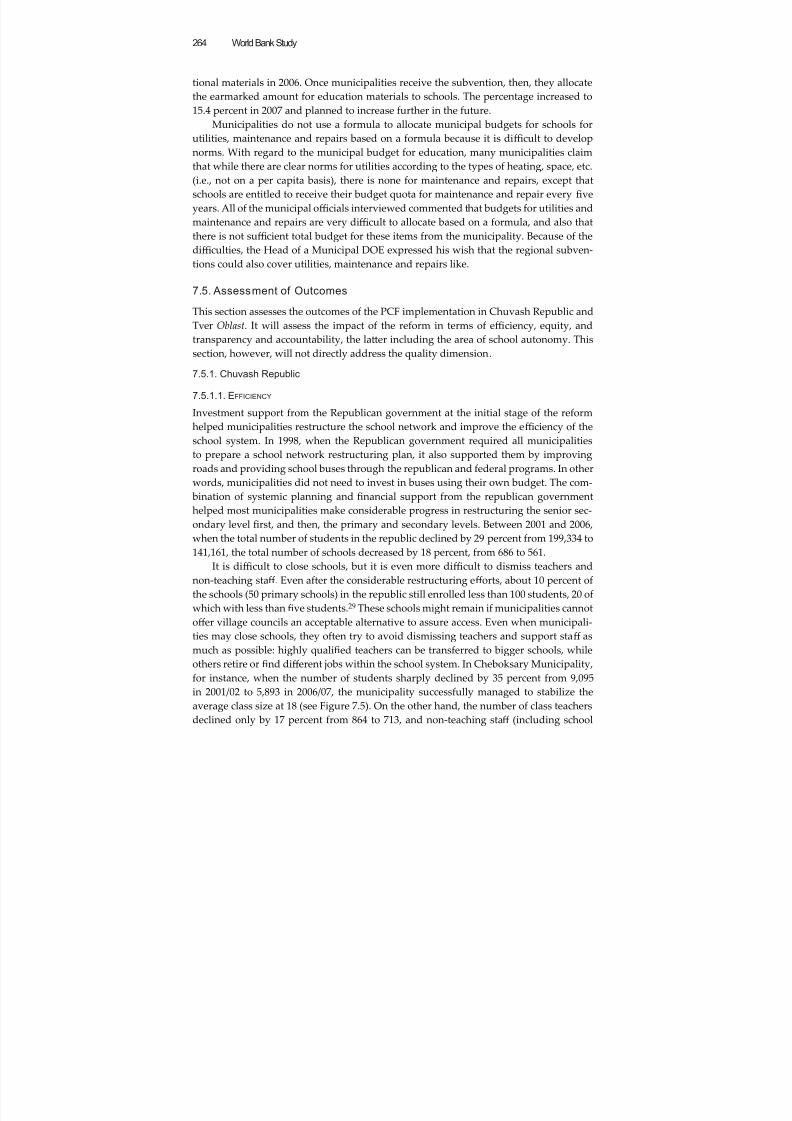
8/6/2019 Reforming Education Finance in Transition Countries
http://slidepdf.com/reader/full/reforming-education-finance-in-transition-countries 288/335
World Bank Study264
tional materials in 2006. Once municipalities receive the subvention, then, they allocate
the earmarked amount for education materials to schools. The percentage increased to
15.4 percent in 2007 and planned to increase further in the future.
Municipalities do not use a formula to allocate municipal budgets for schools for
utilities, maintenance and repairs based on a formula because it is diffi cult to developnorms. With regard to the municipal budget for education, many municipalities claim
that while there are clear norms for utilities according to the types of heating, space, etc.
(i.e., not on a per capita basis), there is none for maintenance and repairs, except that
schools are entitled to receive their budget quota for maintenance and repair every five
years. All of the municipal offi cials interviewed commented that budgets for utilities and
maintenance and repairs are very diffi cult to allocate based on a formula, and also that
there is not suffi cient total budget for these items from the municipality. Because of the
diffi culties, the Head of a Municipal DOE expressed his wish that the regional subven-
tions could also cover utilities, maintenance and repairs like.
7.5. Assessment of Outcomes
This section assesses the outcomes of the PCF implementation in Chuvash Republic and
Tver Oblast. It will assess the impact of the reform in terms of effi ciency, equity, and
transparency and accountability, the laer including the area of school autonomy. This
section, however, will not directly address the quality dimension.
7.5.1. Chuvash Republic
7.5.1.1. EFFICIENCY
Investment support from the Republican government at the initial stage of the reformhelped municipalities restructure the school network and improve the effi ciency of the
school system. In 1998, when the Republican government required all municipalities
to prepare a school network restructuring plan, it also supported them by improving
roads and providing school buses through the republican and federal programs. In other
words, municipalities did not need to invest in buses using their own budget. The com-
bination of systemic planning and financial support from the republican government
helped most municipalities make considerable progress in restructuring the senior sec-
ondary level first, and then, the primary and secondary levels. Between 2001 and 2006,
when the total number of students in the republic declined by 29 percent from 199,334 to
141,161, the total number of schools decreased by 18 percent, from 686 to 561.
It is diffi cult to close schools, but it is even more diffi cult to dismiss teachers and
non-teaching staff . Even after the considerable restructuring eff orts, about 10 percent of
the schools (50 primary schools) in the republic still enrolled less than 100 students, 20 of
which with less than five students.29 These schools might remain if municipalities cannot
off er village councils an acceptable alternative to assure access. Even when municipali-
ties may close schools, they often try to avoid dismissing teachers and support staff as
much as possible: highly qualified teachers can be transferred to bigger schools, while
others retire or find diff erent jobs within the school system. In Cheboksary Municipality,
for instance, when the number of students sharply declined by 35 percent from 9,095
in 2001/02 to 5,893 in 2006/07, the municipality successfully managed to stabilize the
average class size at 18 (see Figure 7.5). On the other hand, the number of class teachers
declined only by 17 percent from 864 to 713, and non-teaching staff (including school
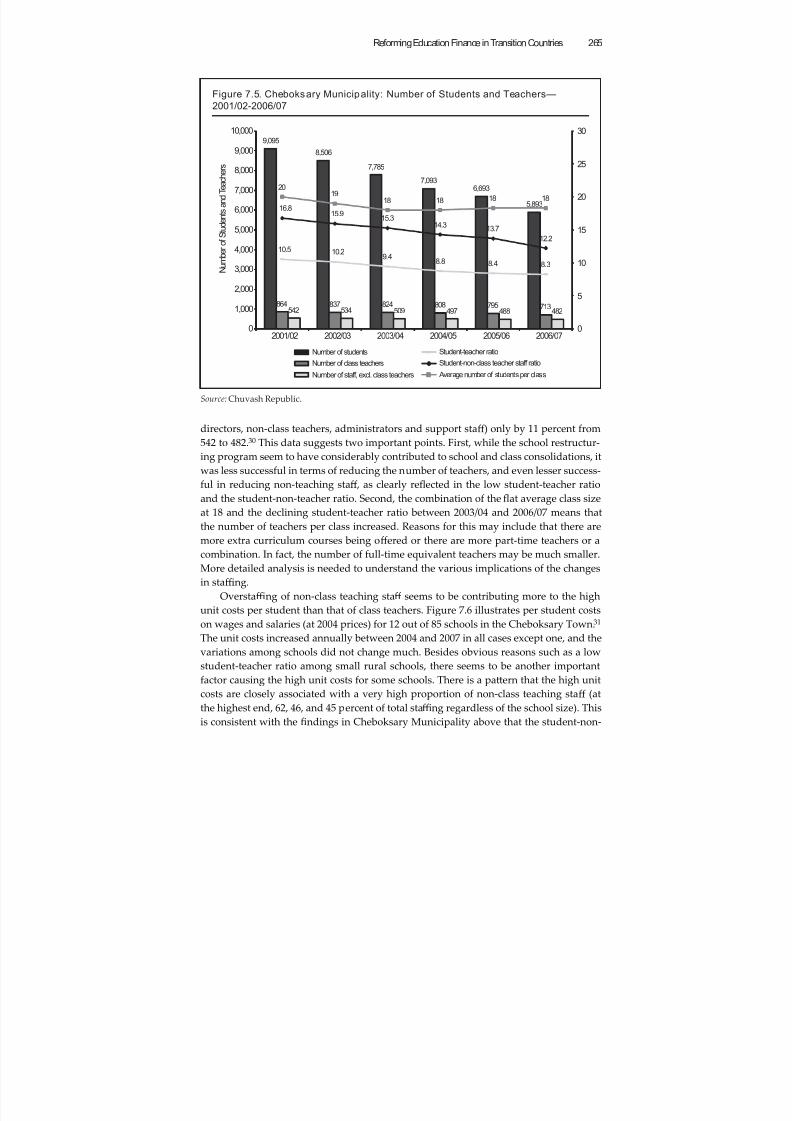
8/6/2019 Reforming Education Finance in Transition Countries
http://slidepdf.com/reader/full/reforming-education-finance-in-transition-countries 289/335
Reforming Education Finance in Transition Countries 265
directors, non-class teachers, administrators and support staff ) only by 11 percent from
542 to 482.30 This data suggests two important points. First, while the school restructur-
ing program seem to have considerably contributed to school and class consolidations, it
was less successful in terms of reducing the number of teachers, and even lesser success-
ful in reducing non-teaching staff , as clearly reflected in the low student-teacher ratio
and the student-non-teacher ratio. Second, the combination of the flat average class size
at 18 and the declining student-teacher ratio between 2003/04 and 2006/07 means that
the number of teachers per class increased. Reasons for this may include that there are
more extra curriculum courses being off ered or there are more part-time teachers or a
combination. In fact, the number of full-time equivalent teachers may be much smaller.
More detailed analysis is needed to understand the various implications of the changes
in staffi ng.
Overstaffi ng of non-class teaching staff seems to be contributing more to the high
unit costs per student than that of class teachers. Figure 7.6 illustrates per student costs
on wages and salaries (at 2004 prices) for 12 out of 85 schools in the Cheboksary Town.31
The unit costs increased annually between 2004 and 2007 in all cases except one, and the
variations among schools did not change much. Besides obvious reasons such as a low
student-teacher ratio among small rural schools, there seems to be another important
factor causing the high unit costs for some schools. There is a pa
ern that the high unitcosts are closely associated with a very high proportion of non-class teaching staff (at
the highest end, 62, 46, and 45 percent of total staffi ng regardless of the school size). This
is consistent with the findings in Cheboksary Municipality above that the student-non-
Figure 7.5. Cheboksary Municipality: Number of Students and Teachers—
2001/02-2006/07
Source: Chuvash Republic.
9,095
8,506
7,785
7,0936,693
5,893
864 837 824 808 795 713542 534 509 497 488 482
9.48.8 8.4 8.3
15.314.3
13.7
12.2
2019
18 18 18 18
10.210.5
15.916.8
0
1,000
2,000
3,000
4,000
5,000
6,000
7,000
8,000
9,000
10,000
2001/02 2002/03 2003/04 2004/05 2005/06 2006/070
5
10
15
20
25
30
Number of students
Number of class teachers
Number of staff, excl. class teachers
Student-teacher ratio
Student-non-class teacher staff ratio
Average number of students per class
N u m b e r o f S t u d e n t s a n d T e a c h e r s
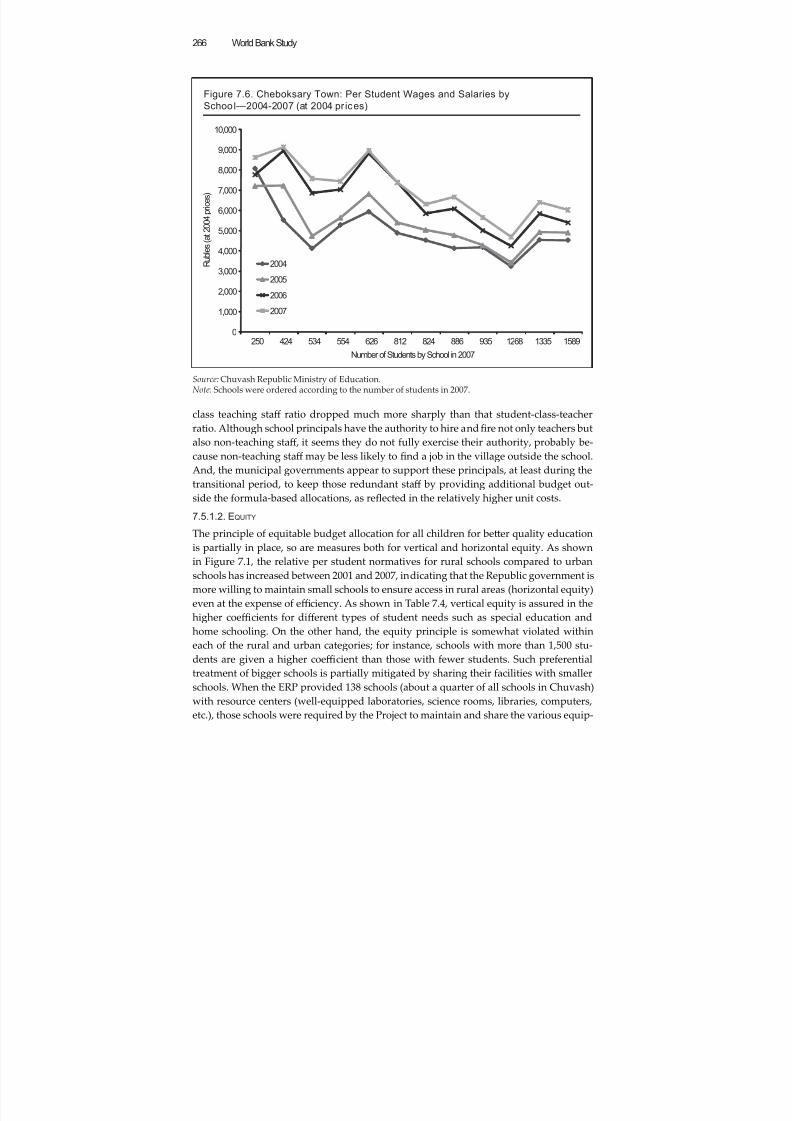
8/6/2019 Reforming Education Finance in Transition Countries
http://slidepdf.com/reader/full/reforming-education-finance-in-transition-countries 290/335
World Bank Study266
class teaching staff ratio dropped much more sharply than that student-class-teacherratio. Although school principals have the authority to hire andfire not only teachers but
also non-teaching staff , it seems they do not fully exercise their authority, probably be-
cause non-teaching staff may be less likely to find a job in the village outside the school.
And, the municipal governments appear to support these principals, at least during the
transitional period, to keep those redundant staff by providing additional budget out-
side the formula-based allocations, as reflected in the relatively higher unit costs.
7.5.1.2. EQUITY
The principle of equitable budget allocation for all children for beer quality education
is partially in place, so are measures both for vertical and horizontal equity. As shownin Figure 7.1, the relative per student normatives for rural schools compared to urban
schools has increased between 2001 and 2007, indicating that the Republic government is
more willing to maintain small schools to ensure access in rural areas (horizontal equity)
even at the expense of effi ciency. As shown in Table 7.4, vertical equity is assured in the
higher coeffi cients for diff erent types of student needs such as special education and
home schooling. On the other hand, the equity principle is somewhat violated within
each of the rural and urban categories; for instance, schools with more than 1,500 stu-
dents are given a higher coeffi cient than those with fewer students. Such preferential
treatment of bigger schools is partially mitigated by sharing their facilities with smaller
schools. When the ERP provided 138 schools (about a quarter of all schools in Chuvash)with resource centers (well-equipped laboratories, science rooms, libraries, computers,
etc.), those schools were required by the Project to maintain and share the various equip-
Figure 7.6. Cheboksary Town: Per Student Wages and Salaries by
School—2004-2007 (at 2004 pr ices)
Source: Chuvash Republic Ministry of Education.Note: Schools were ordered according to the number of students in 2007.
0
1,000
2,000
3,000
4,000
5,000
6,000
7,000
8,000
9,000
10,000
250 424 534 554 626 812 824 886 935 1268 1335 1589
R u b l e s ( a t 2 0 0 4 p r i c e s )
Number of Students by School in 2007
2004
2005
2006
2007
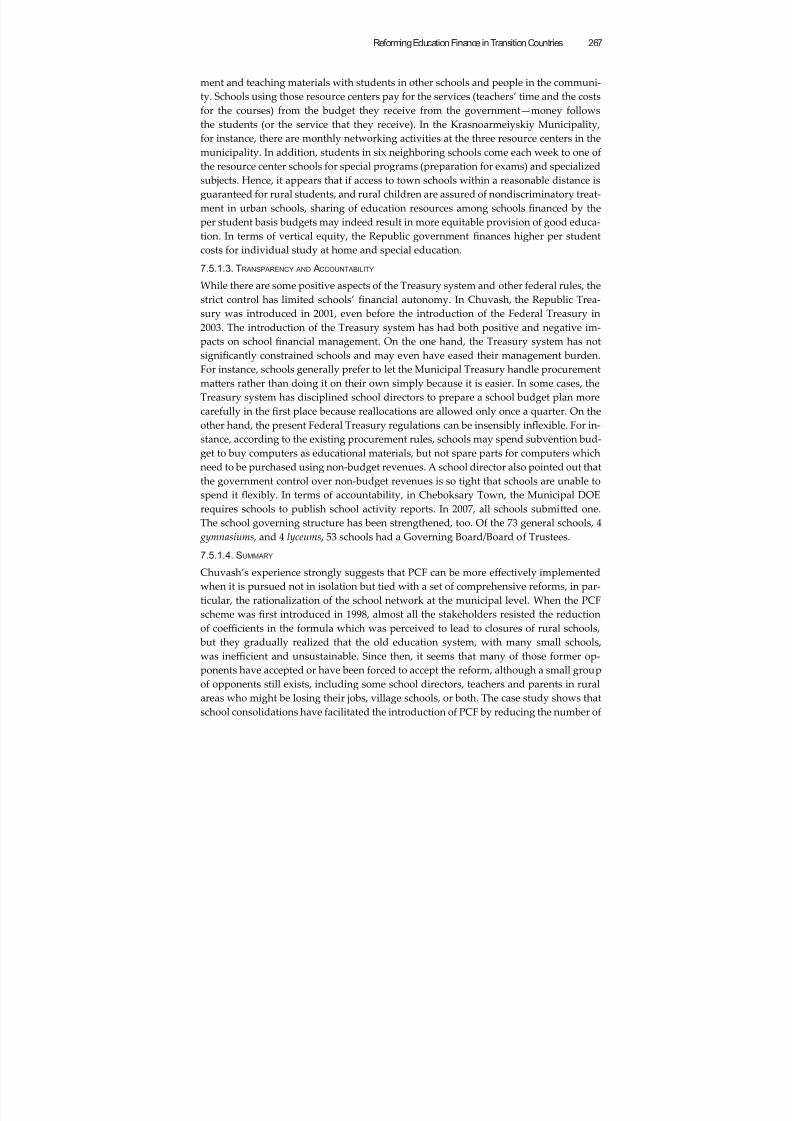
8/6/2019 Reforming Education Finance in Transition Countries
http://slidepdf.com/reader/full/reforming-education-finance-in-transition-countries 291/335
Reforming Education Finance in Transition Countries 267
ment and teaching materials with students in other schools and people in the communi-
ty. Schools using those resource centers pay for the services (teachers’ time and the costs
for the courses) from the budget they receive from the government—money follows
the students (or the service that they receive). In the Krasnoarmeiyskiy Municipality,
for instance, there are monthly networking activities at the three resource centers in themunicipality. In addition, students in six neighboring schools come each week to one of
the resource center schools for special programs (preparation for exams) and specialized
subjects. Hence, it appears that if access to town schools within a reasonable distance is
guaranteed for rural students, and rural children are assured of nondiscriminatory treat-
ment in urban schools, sharing of education resources among schools financed by the
per student basis budgets may indeed result in more equitable provision of good educa-
tion. In terms of vertical equity, the Republic government finances higher per student
costs for individual study at home and special education.
7.5.1.3. TRANSPARENCY AND ACCOUNTABILITY
While there are some positive aspects of the Treasury system and other federal rules, the
strict control has limited schools’ financial autonomy. In Chuvash, the Republic Trea-
sury was introduced in 2001, even before the introduction of the Federal Treasury in
2003. The introduction of the Treasury system has had both positive and negative im-
pacts on school financial management. On the one hand, the Treasury system has not
significantly constrained schools and may even have eased their management burden.
For instance, schools generally prefer to let the Municipal Treasury handle procurement
maers rather than doing it on their own simply because it is easier. In some cases, the
Treasury system has disciplined school directors to prepare a school budget plan more
carefully in the first place because reallocations are allowed only once a quarter. On theother hand, the present Federal Treasury regulations can be insensibly inflexible. For in-
stance, according to the existing procurement rules, schools may spend subvention bud-
get to buy computers as educational materials, but not spare parts for computers which
need to be purchased using non-budget revenues. A school director also pointed out that
the government control over non-budget revenues is so tight that schools are unable to
spend it flexibly. In terms of accountability, in Cheboksary Town, the Municipal DOE
requires schools to publish school activity reports. In 2007, all schools submied one.
The school governing structure has been strengthened, too. Of the 73 general schools, 4
gymnasiums , and 4 lyceums , 53 schools had a Governing Board/Board of Trustees.
7.5.1.4. SUMMARY
Chuvash’s experience strongly suggests that PCF can be more eff ectively implemented
when it is pursued not in isolation but tied with a set of comprehensive reforms, in par-
ticular, the rationalization of the school network at the municipal level. When the PCF
scheme was first introduced in 1998, almost all the stakeholders resisted the reduction
of coeffi cients in the formula which was perceived to lead to closures of rural schools,
but they gradually realized that the old education system, with many small schools,
was ineffi cient and unsustainable. Since then, it seems that many of those former op-
ponents have accepted or have been forced to accept the reform, although a small group
of opponents still exists, including some school directors, teachers and parents in ruralareas who might be losing their jobs, village schools, or both. The case study shows that
school consolidations have facilitated the introduction of PCF by reducing the number of
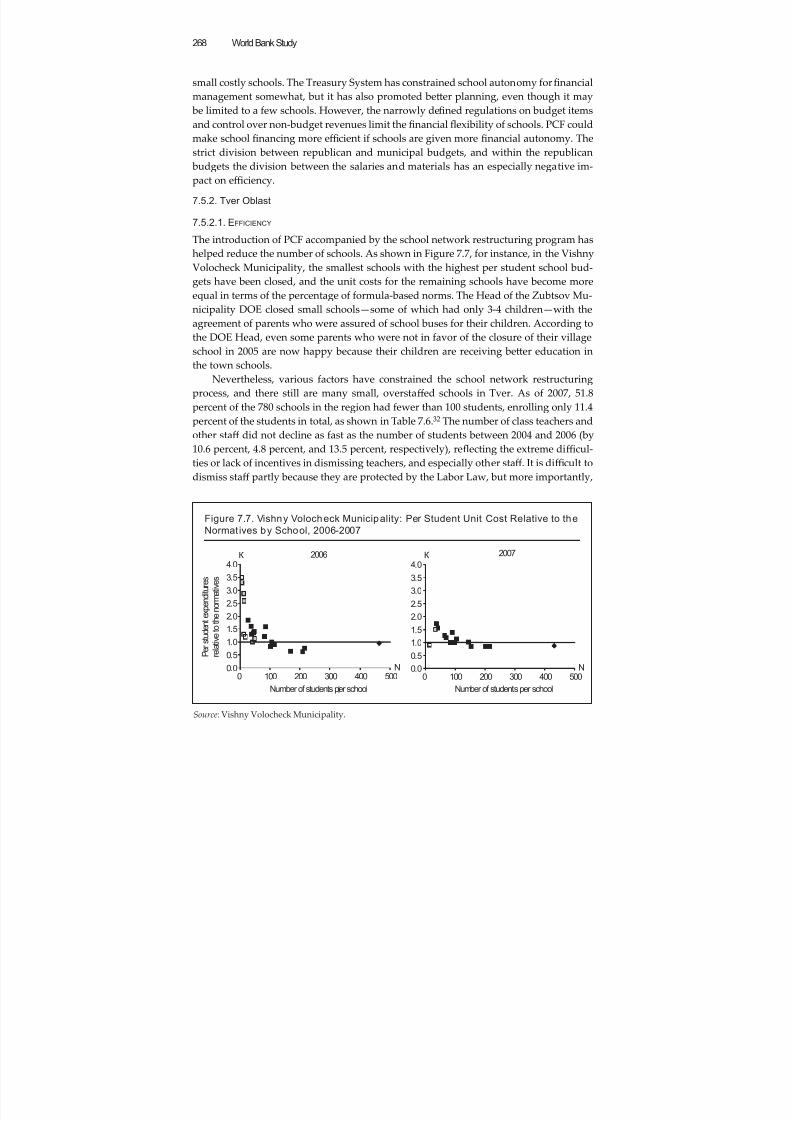
8/6/2019 Reforming Education Finance in Transition Countries
http://slidepdf.com/reader/full/reforming-education-finance-in-transition-countries 292/335
World Bank Study268
small costly schools. The Treasury System has constrained school autonomy forfinancial
management somewhat, but it has also promoted beer planning, even though it may
be limited to a few schools. However, the narrowly defined regulations on budget items
and control over non-budget revenues limit the financial flexibility of schools. PCF could
make school financing more effi cient if schools are given more financial autonomy. Thestrict division between republican and municipal budgets, and within the republican
budgets the division between the salaries and materials has an especially negative im-
pact on effi ciency.
7.5.2. Tver Oblast
7.5.2.1. EFFICIENCY
The introduction of PCF accompanied by the school network restructuring program has
helped reduce the number of schools. As shown in Figure 7.7, for instance, in the Vishny
Volocheck Municipality, the smallest schools with the highest per student school bud-
gets have been closed, and the unit costs for the remaining schools have become more
equal in terms of the percentage of formula-based norms. The Head of the Zubtsov Mu-
nicipality DOE closed small schools—some of which had only 3-4 children—with the
agreement of parents who were assured of school buses for their children. According to
the DOE Head, even some parents who were not in favor of the closure of their village
school in 2005 are now happy because their children are receiving beer education in
the town schools.
Nevertheless, various factors have constrained the school network restructuring
process, and there still are many small, overstaff ed schools in Tver. As of 2007, 51.8
percent of the 780 schools in the region had fewer than 100 students, enrolling only 11.4percent of the students in total, as shown in Table 7.6.32 The number of class teachers and
other staff did not decline as fast as the number of students between 2004 and 2006 (by
10.6 percent, 4.8 percent, and 13.5 percent, respectively), reflecting the extreme diffi cul-
ties or lack of incentives in dismissing teachers, and especially other staff . It is diffi cult to
dismiss staff partly because they are protected by the Labor Law, but more importantly,
Number of students per schooll Number of students per school
2006
0.0
0.5
1.0
1.5
2.0
2.5
3.0
3.5
4.0
0 100 200 300 400 500N
К К
P e r s t u d e n t e x p e n d i t u r e s
r e l a t i v e t o t h e n o r m a t i v e s
2007
0.0
0.5
1.0
1.5
2.0
2.5
3.0
3.5
4.0
0 100 200 300 400 500N
Figure 7.7. Vishny Volocheck Municipality: Per Student Unit Cost Relative to the
Normatives by School, 2006-2007
Source: Vishny Volocheck Municipality.
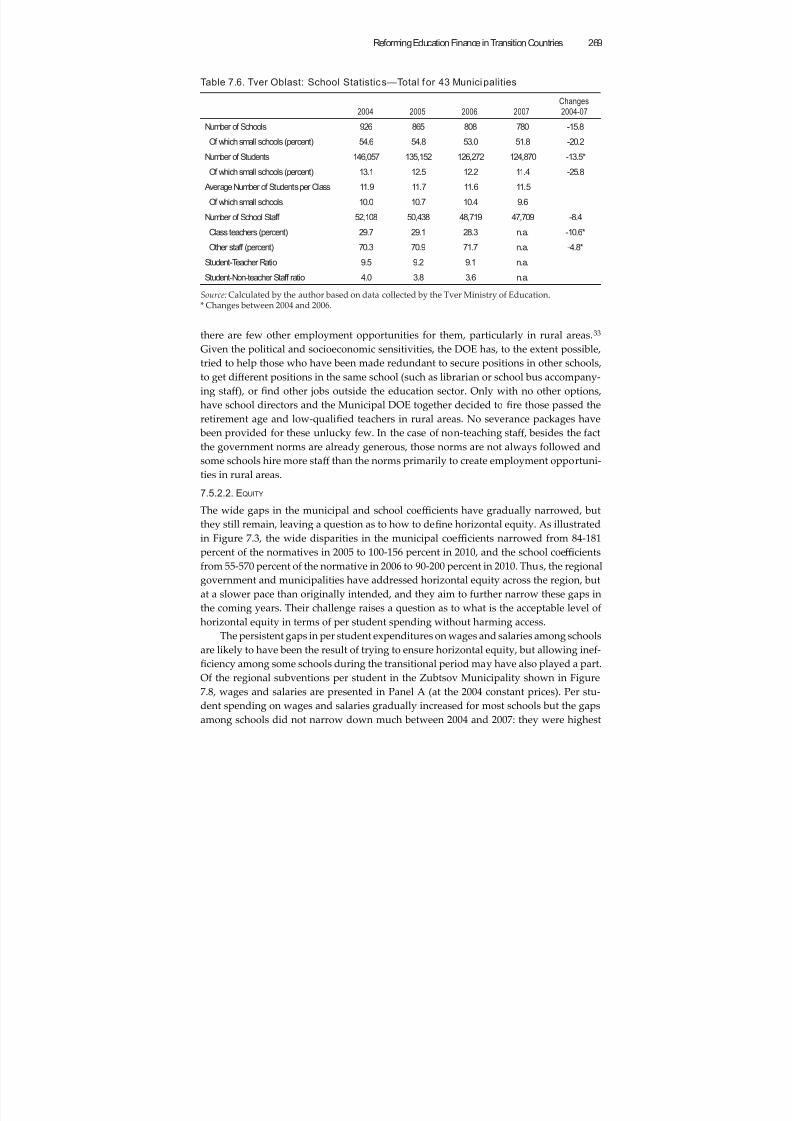
8/6/2019 Reforming Education Finance in Transition Countries
http://slidepdf.com/reader/full/reforming-education-finance-in-transition-countries 293/335
Reforming Education Finance in Transition Countries 269
there are few other employment opportunities for them, particularly in rural areas.33
Given the political and socioeconomic sensitivities, the DOE has, to the extent possible,
tried to help those who have been made redundant to secure positions in other schools,
to get diff erent positions in the same school (such as librarian or school bus accompany-
ing staff ), or find other jobs outside the education sector. Only with no other options,
have school directors and the Municipal DOE together decided to fire those passed the
retirement age and low-qualified teachers in rural areas. No severance packages have
been provided for these unlucky few. In the case of non-teaching staff , besides the fact
the government norms are already generous, those norms are not always followed and
some schools hire more staff than the norms primarily to create employment opportuni-
ties in rural areas.
7.5.2.2. EQUITY
The wide gaps in the municipal and school coeffi cients have gradually narrowed, but
they still remain, leaving a question as to how to define horizontal equity. As illustrated
in Figure 7.3, the wide disparities in the municipal coeffi cients narrowed from 84-181
percent of the normatives in 2005 to 100-156 percent in 2010, and the school coeffi cients
from 55-570 percent of the normative in 2006 to 90-200 percent in 2010. Thus, the regional
government and municipalities have addressed horizontal equity across the region, but
at a slower pace than originally intended, and they aim to further narrow these gaps in
the coming years. Their challenge raises a question as to what is the acceptable level of
horizontal equity in terms of per student spending without harming access.
The persistent gaps in per student expenditures on wages and salaries among schools
are likely to have been the result of trying to ensure horizontal equity, but allowing inef-
ficiency among some schools during the transitional period may have also played a part.
Of the regional subventions per student in the Zubtsov Municipality shown in Figure
7.8, wages and salaries are presented in Panel A (at the 2004 constant prices). Per stu-
dent spending on wages and salaries gradually increased for most schools but the gaps
among schools did not narrow down much between 2004 and 2007: they were highest
Table 7.6. Tver Oblast: School Statistics—Total for 43 Municipalities
2004 2005 2006 2007
Changes
2004-07
Number of Schools 926 865 808 780 -15.8
Of which small schools (percent) 54.6 54.8 53.0 51.8 -20.2
Number of Students 146,057 135,152 126,272 124,870 -13.5*
Of which small schools (percent) 13.1 12.5 12.2 11.4 -25.8
Average Number of Students per Class 11.9 11.7 11.6 11.5
Of which small schools 10.0 10.7 10.4 9.6
Number of School Staff 52,108 50,438 48,719 47,709 -8.4
Class teachers (percent) 29.7 29.1 28.3 n.a. -10.6*
Other staff (percent) 70.3 70.9 71.7 n.a. -4.8*
Student-Teacher Ratio 9.5 9.2 9.1 n.a.
Student-Non-teacher Staff ratio 4.0 3.8 3.6 n.a.
Source: Calculated by the author based on data collected by the Tver Ministry of Education.* Changes between 2004 and 2006.
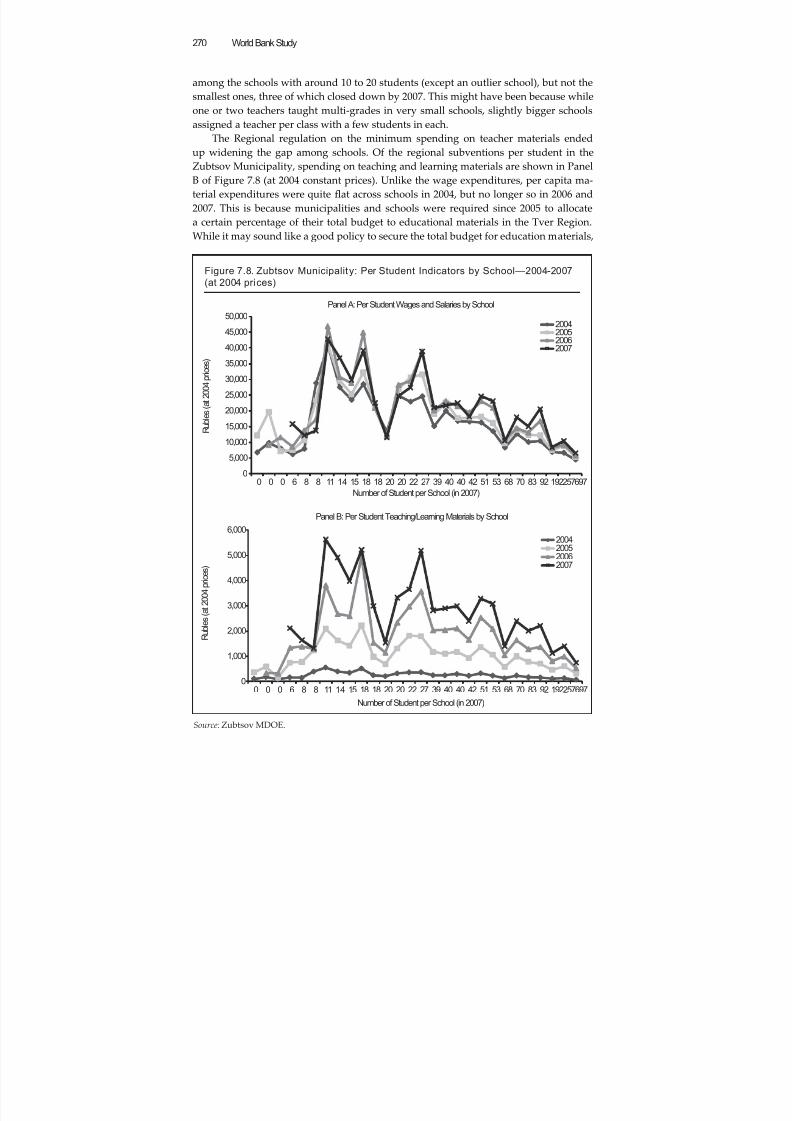
8/6/2019 Reforming Education Finance in Transition Countries
http://slidepdf.com/reader/full/reforming-education-finance-in-transition-countries 294/335
World Bank Study270
among the schools with around 10 to 20 students (except an outlier school), but not the
smallest ones, three of which closed down by 2007. This might have been because while
one or two teachers taught multi-grades in very small schools, slightly bigger schools
assigned a teacher per class with a few students in each.
The Regional regulation on the minimum spending on teacher materials endedup widening the gap among schools. Of the regional subventions per student in the
Zubtsov Municipality, spending on teaching and learning materials are shown in Panel
B of Figure 7.8 (at 2004 constant prices). Unlike the wage expenditures, per capita ma-
terial expenditures were quite flat across schools in 2004, but no longer so in 2006 and
2007. This is because municipalities and schools were required since 2005 to allocate
a certain percentage of their total budget to educational materials in the Tver Region.
While it may sound like a good policy to secure the total budget for education materials,
Figure 7.8. Zubtsov Municipality: Per Student Indicators by School—2004-2007(at 2004 prices)
Source: Zubtsov MDOE.
0
5,000
10,000
15,000
20,000
25,000
30,000
35,000
40,000
45,000
50,000
0 0 0 6 8 8 11 14 15 18 18 20 20 22 27 39 40 40 42 51 53 68 70 83 92 192257697
R u b l e s
( a t 2 0 0 4 p r i c e s )
Number of Student per School (in 2007)
2004200520062007
0
1,000
2,000
3,000
4,000
5,000
6,000
0 0 0 6 8 8 11 14 15 18 18 20 20 22 27 39 40 40 42 51 53 68 70 83 92 192257697
R u b l e s ( a t 2 0 0 4 p r i c e s )
Number of Student per School (in 2007)
2004
200520062007
Panel A: Per Student Wages and Salaries by School
Panel B: Per Student Teaching/Learning Materials by School
8/6/2019 Reforming Education Finance in Transition Countries
http://slidepdf.com/reader/full/reforming-education-finance-in-transition-countries 295/335
Reforming Education Finance in Transition Countries 271
the imposition of the fixed allocation has resulted in wide gaps in terms of per student
expenditures across schools.
7.5.2.3. TRANSPARENCY AND ACCOUNTABILITY
Schools are gradually developing budget planning and management capacities at theschool level. While some town schools, for instance, in Tver City, prepare school reports
as a public relation tool to aract students, most school directors still lack planning, fi-
nancial management, accounting, and computer skills, and they typically involve depu-
ty directors and accountants in the budgeting process. The role of accountants therefore
is very important. In the Vishny Volocheck Municipality, for instance, accountants used
to be staff of the centralized municipal accounting offi ce and to work on school account-
ing among other sectors, but since September 2006, two schools share an accountant
as their own staff member. Some accountants were transferred from the municipal ac-
counting offi ce, while others were newly recruited. The close communication between
the school director and his/her own accountant helps him/her manage the school budgetmore easily.
Even though schools prepare their own budget, their financial autonomy is still lim-
ited. Schools prepare their budget according to their needs and may reallocate among
and within salaries and educational materials with the RMOE’s approval, but in reality,
reallocation among these budget items rarely happens. The RMOF and RMOE want to
protect non-salary budgets by specifying the proportion of budget allocated to educa-
tional materials while the restructuring of school network is in process. This has certain-
ly contributed to the improvement of the teaching/learning process at the school level,
but contradicted the concept of decentralization of educationfinancing to municipalities
and schools and also created a wide range in terms of per student allocations. As of 2007,the RMOF and RMOE planned to allocate the total subvention budgets as one envelope
and let the municipalities decide how to allocate across budget items, once the restruc-
turing process is more or less completed. This plan was yet to be seen.
The introduction of the Treasury system in 2003 made school budget more trans-
parent than before, but might have had mixed impacts on management of non-budget
resources. Unlike those in the three pilot regions, schools in the Tver Oblast did not have
their own bank account prior to the introduction of the Treasury system in 2003, and
most of them did not even know exactly how much budget they received from the mu-
nicipality. Hence, schools did not feel particularly constrained when the Federal Trea-
sury system was introduced. Rather, schools now know how their budgets are calculatedand allocated to them and appreciate having more funds for educational materials. The
federal law allows schools to procure goods and services up to 60,000 Rubles (US$5,300)
without quotations, and for those over 60,000 Rubles, with three quotations. Schools
usually submit procurement receipts to the Municipal Treasury for payment and rarely
withdraw cash to make payments on their own, except for small pey purchases. On
the other hand, even though a few school directors interviewed in the Vishny Volo-
check Municipality explained that they do not collect cash from parents, it seems that
many school directors might not be disclosing actual cash contributions because they
would have to deposit them in a non-budget account under the Treasury. The suppos-
edly transparent Treasury System may be making management of non-budget resources
less transparent.
8/6/2019 Reforming Education Finance in Transition Countries
http://slidepdf.com/reader/full/reforming-education-finance-in-transition-countries 296/335
8/6/2019 Reforming Education Finance in Transition Countries
http://slidepdf.com/reader/full/reforming-education-finance-in-transition-countries 297/335
Reforming Education Finance in Transition Countries 273
network restructuring at the municipal level and class consolidations at the school level,
and vice versa, but there is no way to evaluate the impacts of these reforms separately.
PCF not only from the region to municipalities, but also down from municipali-
ties to the school level: The PCF scheme is not just about budget allocations from the
region to municipalities, but also from municipalities to schools. As long as municipali-ties allocate budget to schools according to the input-based norms, effi ciency gains at
the municipal level will be very limited. Also, even though schools are given the author-
ity to plan their budget according to their needs, the fragmented financing mechanism
between regional subventions and municipal budgets and the Treasury system have
constrained school’s financial autonomy. Capacity building of school principals and ac-
countants in school financial management is crucial to implement the PCF at the school
level.
No rigorous evidence to prove that the PCF is effective to improve academic per-
formance: Anecdotal evidence suggests that PCF has been an eff ective tool for motivat-
ing schools to improve the quality of education and student academic performance to
compete for students, particularly in urban areas, but there is no quantitative data which
can rigorously prove that the PCF scheme alone has exclusively contributed to such im-
provement, or indeed that such improvement has taken place at all.
Long-term perspectives: The implementation of a project takes time, at least a few
years, starting from legal reforms, consensus building among various stakeholders, and
technical capacity building for administrators and school directors. Therefore, mitigat-
ing measures such as municipal coeffi cients in Tver may be necessary and appropriate
during the transitional period. However, the region and municipalities need to have
a clear strategy and timetable for the transitional and post-transitional periods so that
municipalities and schools can have suffi cient time for adjustment with clear targets.
Monitoring and evaluation: The Federal MOES has not played to date a significant
role in monitoring and evaluation of the PCF implementation. It is crucial to strengthen
the role of MOES in monitoring and evaluation at the federal level, accumulating knowl-
edge and experiences from various regions, and providing regions with technical skills
and with opportunities for sharing experiences with one another.
References
Babko, N. and Klimanov, V. (2007), Review of Regional Experience in Introducing Per Capita
Funding Principles in General Secondary Education, Moscow. Seventy-two out of 88regions responded to the study. Unoffi cial translation is available for pp. 55-58 and
pp. 185-190.
Canning, M (2004), The Modernization of Education in Russia , unpublished World Bank
Policy Note.
Government of the Chuvash Republic (2003); List of Threshold Adjustment Indexes Re flect-
ing Ungraded Schools and Speci fic Characteristics of Special Education Schools, Gymna-
siums for 2004 , approved by the Resolution of the Cabinet of Ministers of Chuvash
Republic #336 date December 25, 2003.
Government of the Chuvash Republic (2007); List of Adjustment Coe ffi cients for 2007 , ap-
proved by the Resolution of the Cabinet of Ministers of Chuvash Republic #321dated December 20, 2006.
8/6/2019 Reforming Education Finance in Transition Countries
http://slidepdf.com/reader/full/reforming-education-finance-in-transition-countries 298/335
World Bank Study274
Government of the Russian Federation (2001); Concept of Modernization of Russian Educa-
tion for the period up to 2010 (Protocol # 44, 25.10.2001).
Higher School of Economics (2010); “Education in the Russian Federation 2010 - Year-
book of Statistics”, Moscow: Higher School of Economics.
NTF (2002); Methodological Guidelines: Calculation and Implementation of Per Capita Budget-ary Financing of General Education Schools , Center for Social Consulting ‘Stratos-
fera,’ National Training Foundation, Moscow.
Tver Oblast Department of Education (2010); “Monitoring of Indicators of Transfer to Per
Capita Financing of Municipal Educational Systems of Tver oblast in 2010”, Tver
Oblast , Russian Federation.
World Bank (2001a); Agreed Minutes of the Negotiations between the delegations of the Rus-
sian Federation and the International Bank for Reconstruction and Development regard-
ing Education Reform Project’, March 22, 2001.
World Bank (2001b); Project Appraisal Document on a Proposed Loan in the Amount of US$50
million to the Russian Federation for an Education Reform Project, April 30, 2001.
World Bank (2004); Per Capita Financing of Education: Experience and Issues , Report No.
29943, Moscow.
World Bank (2005); Section II Methodological Guidelines: Calculation and Implementation of
Budgetary Financing Normative for General Education Institutions , Moscow (original
in Russian, unoffi cial translation).
World Bank (2007); “Implementation Completion and Results Report (IBRD-46050) on
a Loan No.:4605-RU in the Amount of US$50 Million to the Russian Federation
for an Education Reform Project”, Report No. ICR0000393, Human Development
Sector Unit, Europe and Central Asia Region. Washington, DC: The World Bank.
8/6/2019 Reforming Education Finance in Transition Countries
http://slidepdf.com/reader/full/reforming-education-finance-in-transition-countries 299/335
Reforming Education Finance in Transition Countries 275
Annex A. Factors Infl uencing the Implementation of PCF in 72 Regions
The progress of the PCF implementation varies between the three pilot project regions,
22 grant recipient regions, some other regions implementing the PCF without the ERP
support, and the remaining regions which are yet to implement it. A study of the PCFimplementation in 72 regions34 has identified the following common factors that have
aff ected the implementation process:
Positive Factors
■ Legal framework: Appropriate legislation at the regional level, including bud-
get laws.
■ Leadership: Strong leadership at the RMOE, which was typically observed in
the pilot and grant-recipient regions.
■ Regional strategies: A clear regional strategy for stimulating municipalities to
use PCF for allocations to schools, including a school network restructuring.
■ Strategies for the transitional period: Gradual implementation of the PCF with
clearly specified annual targets.
■ Dialogue among stakeholders: Active dialogue and cooperation between the
MOE and MOF at the regional and municipal levels, between the Region and
municipalities, and between the municipality and schools.
■ Preparatory work: Analysis on school mapping and restructuring of school net-
work and analysis on school mapping.
■ School financial management capacity: Capacities of school principals, ac-
countants, and School Board members in managing school finance.
Negative Factors
■ Lack of clearly defined objectives and outcomes in the federal legislation: Be-
cause the PCF was initially supported by a project without federal government’s
legal endorsement, many non-pilot project regions could not understand the
objectives and methodology of the new financing mechanism at the initial stage.
■ Perceived loss of power and budget: Some regional and municipal educa-
tion and financial authorities resisted the introduction of PCF because a more
transparent financing system reduced their control over education institutions.
School directors who expected to receive smaller budgets also resisted it.
■ Expected negative outcomes of school network restructuring: Municipal au-
thorities resisted the restructuring of school networks because (i) schools are the
center of life in many rural selements; (ii) children must be assured of access
to alternative schools, (iii) a school closure will create employment problems for
the redundant staff , and (iv) the vacant premises need to be maintained.
■ Expected diffi culties of more financial autonomy for schools: Headmasters,
especially in rural areas, resisted increased autonomy in school financial man-
agement because (i) they lack professional skills in budgeting and accounting
or experience in mobilizing and managing non-budget revenues or both; and
(ii) not all teachers understand the benefits of new opportunities provided by
increased independence of the headmaster, and many of them tend to treat itonly as an additional load.
■ Limited infrastructure: In rural areas, access to financial infrastructure (banks,
roads, cash collectors’ vehicles, etc.) is limited.
8/6/2019 Reforming Education Finance in Transition Countries
http://slidepdf.com/reader/full/reforming-education-finance-in-transition-countries 300/335
World Bank Study276
Based on the experiences and evaluation findings to date, the MOES intends to de-
fine general principles and issue new recommendations on: (i) budget allocation meth-
ods from municipalities to schools; (ii) school financial autonomy; and (iii) methodology
on PCF for pre-school education, disabled schools, stipend, and utilities35
8/6/2019 Reforming Education Finance in Transition Countries
http://slidepdf.com/reader/full/reforming-education-finance-in-transition-countries 301/335
Reforming Education Finance in Transition Countries 277
Annex B. Lis t of People Interv iewed for the Country Case Study
Federal Level
Mr. Igor Remoienko, Deputy State Policy on Education Restructuring and Education
Reform
Ms. Natalia Kondrashova, Deputy Executive Director, National Training Foundation
Ms. Tatyana Trofimova, ERP PIU Project Director, National Training Fundation (NTF)
Ms. Natalia Kondrashova, Deputy Executive Director, NTF
Ms. Aleksandra Velikanova, Financial Offi cer, NTF
Ms. Nadia Babko, Consultant (author of the 72 region study on per capita financing)
Chuvash Republic
Ms. Chernova Galina Petrovna, Minister of Education, Chuvash Republic
Ms. Petrova Svetlana, Deputy Minister, Pre-school and School Dept., Rep. MOE
Ms. Vanerkina Rimma, Head of Financial Dept., Rep. MOEMs. Gerdo Natalia, Project Coordinator, ERP (until December 2006)
Ms. Tsherbatkina Tatyana, Head of Department of Finance, Republic
CHEBOKSARY TOWN
Mr. Kudryashov Sergey, Head of DOE
Mrs. Chadkova Elena, Deputy Director
School Director and Chief Accountant
CHEBOKSARSKIY R AYON
Mr. Phomin Vickenti Genadyevich, School Director, Trenkassy Secondary School
(Resource Center)
Fadeeva Galina, School Director, Opitniy Secondary School
Stepanova Lilia, Accountant
Krasnoarmeiskiy Rayon
Head of Municipal DOE, Krasnoarmeiskiy Municipality
Ms. Galina Yulmassova, School Director
Mr. Nikolay Antonov, Deputy Head of Municipal Administration
Tver Oblast
Ms. Irina Ivanova, Regional Department of Education
Ms. Marianna Shlinchyak, Regional Department of Education
Ms. Irina Maksimenkova, Deputy Minister, Department of Finance
Mr. Dmitoy Kulikov, Deputy Head, Unit of Education, Department of Finance
ZUBTSOV MUNICIPALITY
Mr. Anton Melnik, Head, Municipal Department of Education
Ms. Natalya Prokofyeva, School Director, Pogorelskaya School
Accountant, Pogorelskaya School
School Principal and Accountant, Staro-Ustinovskaya School
VISHNY VOLOCHECK R AYON
Mr. Anatoliy Irgistkin, Head, Municipal Department of Education
School Principal and Accountant, Solnechnaya School
School Principal and Accountant, Krasnoholmaskaya School
8/6/2019 Reforming Education Finance in Transition Countries
http://slidepdf.com/reader/full/reforming-education-finance-in-transition-countries 302/335
World Bank Study278
Notes
1. I gratefully acknowledge the research support of Kirill Vasiliev (Research Analyst, Human De-
velopment Unit, Europe and Central Asia Region, World Bank) and Natalia Tipenko (Consultant),
who were part of the team that conducted this research, and of Dmitry Chugunov (Consultant),
who provided me with the information to update some key sections. I would also like to thank thefederal, regional and municipal offi cers, school principals and teachers, and members of the Project
Management Unit for their generous cooperation during the field visits to the Chuvash Republic
and the Tver Oblast in March 2007.
2. See Government of the Russian Federation (2001).
3. Research instruments include an analysis of government policy documents and materials pro-
duced under the Education Reform Project (ERP), interviews with offi cials of the Federal Ministry
of Education and Science and staff of the central Project Implementation Unit for the ERP, and
field visits to the Tver Oblast and Chuvash Republic in March 2007. The two regions were selected
because they were considered ‘successful’ regions in implementing the PCF. In each of the two
regions, the team visited two to three municipalities and two to three schools for interviews.
4. The term general secondary education (GSE) is a literal translation from a Russian expressionthat prevailed from former Soviet times. GSE refers collectively to the cycle encompassing both pri-
mary and secondary education. For purposes of consistency with the usage in Russian, however,
the GSE expression is retained here.
5. About 4 percent of the GSE schools were either of gymnasium or lyceum type, specializing in
certain subjects.
6. See Higher School of Economics (2010).
7. There are other types of political jurisdictions of the Federation: krai , autonomous territory (ok-
rug) and two cities–Moscow and St. Petersburg. These are all treated as regions in this report.
8. Except for special education and special program schools, for which regions were responsible.
9. The Samara Oblast adopts an exceptional structure: it has established education districts between
the oblast and municipalities, and shifted the municipal responsibilities to the education districts
under direct control by the oblast. In other words, this structure made it easier for Samara to imple-ment the PCF scheme up to the school level without another layer at the municipal level, but it is
unclear whether Samara can maintain this structure even after the pilot project, or whether this
structure may be expanded to other regions or both.
10. Initially, the Samara and Yaroslavl Oblasts and the Chuvash Republic were selected as the pilot
regions, but the Voronezh Oblast replaced Yaroslavl at a much later stage at the end of 2004 because
the laer could not reach a sub-loan agreement with the Federal government.
11. Since 2003, all schools in the Russian Federation have at least two separate accounts under the
Municipal Treasury—one for the regional budget and the other for the municipal budget. Each
school may have up to six accounts, including non-government revenues.
12. Canning (2004).
13. The ERP was funded by the World Bank and implemented from mid-2001 to December 2006.The ERP aimed: (i) to improve quality and standards; (ii) to promote the effi cient and equitable use
of scarce public resources for education; (iii) to modernize the education system (structure of net-
work and institutions); and (iv) to improve the flexibility and market-relevance of initial vocational
education. See World Bank (2001b) for a detailed project description.
14. This section largely draws from National Training Foundation (2002). Note that the methodolo-
gies were not formally adopted as MOES’ offi cial methodologies.
15. The federal government established the NTF in 1994 as a commercial organization to admin-
ister market oriented training programs and to act as a Project Implementation Unit (PIU) for the
World Bank-funded Management and Financial Training Project (1994-2000). It served as a PIU for
another Bank-funded Education Innovation Project (1997-2004) as well.
16. The index was obtained empirically based on the actual costs in several regions. When calculat-
ing the normative, regions are recommended to clarify these values according to the region-specific
features.
8/6/2019 Reforming Education Finance in Transition Countries
http://slidepdf.com/reader/full/reforming-education-finance-in-transition-countries 303/335
Reforming Education Finance in Transition Countries 279
17. Initially, the Samara and Yaroslavl Oblasts and the Chuvash Republic were selected as the pilot
regions, but the Voronezh Oblast replaced Yaroslavl at a much later stage at the end of 2004 because
the laer could not reach a sub-loan agreement with the Federal government.
18. World Bank (2001a).
19. World Bank (2004, 2005).
20. See Annex 1 for a summary of a study on the implementation of the PCF in 72 regions, some of
which implemented the PCF without the ERP support (Babko & Klimanov, 2007).
21. The National Project began financing supplementary salaries for teachers from the Federal bud-
get based on the number of students. In addition, regions are currently allowed to introduce a
regional teacher salary scheme for top-ups, but only a limited number of regions have introduced
it. In 2005, the Leningrad and Tumen Oblasts introduced such a scheme, and some others joined
in 2006. The Tver Oblast also plans to introduce the regional salary scheme (10 percent top-up) in
2008. The MOES expects that all top-ups provided through the National Project will be replaced
with regional governments’ budgets in a few years.
22. As of 2007, the Federal MOES expected to complete the nationwide implementation by 2009,
but MOES has delayed the deadline to 2012.
23. Regional-level Education Authority Bodies have diff erent names in Russia, although their func-tions and responsibilities are very similar. In Tver, it is called the Department of Education, but for
consistency and simplicity, in this paper we call all regional level education authorities Regional
Ministry of Education (RMOE). Similarly, in Tver, each municipality has a department of educa-
tion.
24. He was a staff member of the central Project Implementing Unit (PIU) for the ERP until mid-
2005. After the case study was conducted, he was promoted to the Minister of Education and Sci-
ence in August 2007.
25. In 2003, the Russian Federation combined the end-of-school exams and university admissions
into a single Unified State Exam. Each candidate must take tests in mathematics and Russian Lan-
guage as well as at least two other subjects relating to the courses they plan to take at university.
Each test has three parts: a multiple-choice section, short-answer questions covering factual knowl-edge, and longer essays on more challenging questions. Marks are given out of 100. The highest
level is so diffi cult that only one student in 10,000 will achieve the maximum score (Source: hp://
news.bbc.co.uk/nolpda/ukfs_news/hi/newsid_3485000/3485939.stm).
26. It should be noted, however, that the regional MOES/MOF ended up providing additional
funds on top of the budget reflecting municipal coeffi cients for aboutfive municipalities with small
remote schools toward the end of the fiscal year as a transitional measure limited to one year.
27. See Tver Oblast Department of Education (2010).
28. Municipalities co-finance the bus program with the regional government, and the cost sharing
proportion is decided based on the negotiations between the two levels of government.
29. Schools with less than 20 students are not legal entities, but branch schools of bigger schools.
30. The Head of the Municipal DOE and school directors together helped those made redundant
find other opportunities: thirty were transferred to similar positions in other schools; two werepensioners; nine retired; eight looked for jobs with an employment agency. The fate of the rest is
unknown.
31. The 12 sample schools are not necessarily representative of the entire population in the Che-
boksary Town.
32. Generally, schools less than 100 students are categorized as small schools, but it could vary
across municipalities because each municipality defines the size of ‘small schools.’ The Region
defines small schools as those with less than 100 students.
33. In order to aract young teachers in rural areas, the regional and municipal education authori-
ties provide scholarships for pedagogical universities for those who want to work in rural schools.
34. See Babko and Klimanov (2007). Because the study relies primarily on questionnaires, with
in-depth interviews having been conducted in 12 regions only, it could not capture the completepicture of the implementation status of each region.
35. According to an interview with the MOES offi cers in March 2007.
8/6/2019 Reforming Education Finance in Transition Countries
http://slidepdf.com/reader/full/reforming-education-finance-in-transition-countries 304/335
280
C H A P T E R 8
Per Capita Financing of GeneralEducation in Europe and
Central Asia: Has It Deliveredon Its Promise? An Overview
of Six Country Case StudiesDina Abu-Ghaida1
8.1. Introduction
The recent introduction of systems of per capita financing (PCF) in the Europe and Cen-
tral Asia (ECA) region entailed a significant departure from the way most of the educa-
tional systems across the region had been financed for ages. The six country case studies
(Armenia, Estonia, Georgia, Lithuania, Poland, and Russia) that make up this book have
aempted to present a summary of the challenges that these countries faced in design-
ing and implementing such schemes and an assessment of the main achievements in the
form of concrete outcomes around three main areas: effi ciency, equity and transparency/
accountability. This final chapter collapses all this wealth of information in an eff ort to
contrast the experiences of each of them and derive a series of lessons learned over time.
The rest of the chapter is organized as follows: Section 8.2 covers the various objec-
tives of the reform within the context of decentralization in each of the countries. Section
8.3 discusses variations in design, funding and coverage of these new finance mecha-
nisms. Section 8.4 evaluates the impact of these reforms in terms of the set of outcomes
mentioned above (effi ciency, equity and transparency/accountability), also taking a brief
look at what happened to the core goal of any educational system: improving the quality
of education. Section 8.5 concludes by summarizing the main lessons learned for each
of these countries.
8.2. Different Objectives of Per Capita Finance Reform
in ECA—But in the Context of Decentralization
The case studies demonstrate the importance of decentralization reforms in ECA coun-
tries as drivers for implementation of per capita financing in these countries and forthe reach of the per capita formula, i.e. whether it allocates funding to the local gov-
ernment or all the way down to the school. In addition, the case studies document a
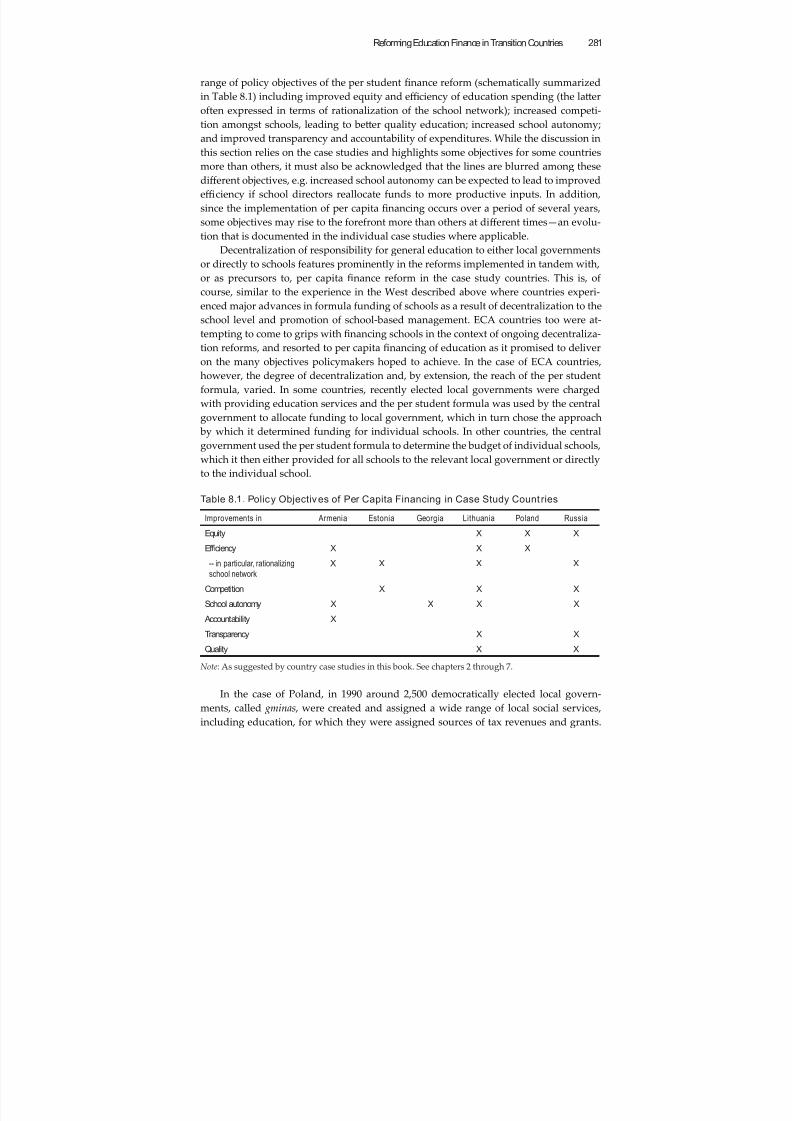
8/6/2019 Reforming Education Finance in Transition Countries
http://slidepdf.com/reader/full/reforming-education-finance-in-transition-countries 305/335
Reforming Education Finance in Transition Countries 281
range of policy objectives of the per student finance reform (schematically summarized
in Table 8.1) including improved equity and effi ciency of education spending (the laer
often expressed in terms of rationalization of the school network); increased competi-
tion amongst schools, leading to beer quality education; increased school autonomy;
and improved transparency and accountability of expenditures. While the discussion inthis section relies on the case studies and highlights some objectives for some countries
more than others, it must also be acknowledged that the lines are blurred among these
diff erent objectives, e.g. increased school autonomy can be expected to lead to improved
effi ciency if school directors reallocate funds to more productive inputs. In addition,
since the implementation of per capita financing occurs over a period of several years,
some objectives may rise to the forefront more than others at diff erent times—an evolu-
tion that is documented in the individual case studies where applicable.
Decentralization of responsibility for general education to either local governments
or directly to schools features prominently in the reforms implemented in tandem with,
or as precursors to, per capita finance reform in the case study countries. This is, of
course, similar to the experience in the West described above where countries experi-
enced major advances in formula funding of schools as a result of decentralization to the
school level and promotion of school-based management. ECA countries too were at-
tempting to come to grips with financing schools in the context of ongoing decentraliza-
tion reforms, and resorted to per capita financing of education as it promised to deliver
on the many objectives policymakers hoped to achieve. In the case of ECA countries,
however, the degree of decentralization and, by extension, the reach of the per student
formula, varied. In some countries, recently elected local governments were charged
with providing education services and the per student formula was used by the central
government to allocate funding to local government, which in turn chose the approach
by which it determined funding for individual schools. In other countries, the central
government used the per student formula to determine the budget of individual schools,
which it then either provided for all schools to the relevant local government or directly
to the individual school.
Table 8.1. Policy Objectives of Per Capita Financing in Case Study Count ries
Improvements in Armenia Estonia Georgia Lithuania Poland Russia
Equity X X X
Ef ficiency X X X
-- in particular, rationalizing
school network
X X X X
Competition X X X
School autonomy X X X X
Accountability X
Transparency X X
Quality X X
Note: As suggested by country case studies in this book. See chapters 2 through 7.
In the case of Poland, in 1990 around 2,500 democratically elected local govern-
ments, called gminas , were created and assigned a wide range of local social services,
including education, for which they were assigned sources of tax revenues and grants.
8/6/2019 Reforming Education Finance in Transition Countries
http://slidepdf.com/reader/full/reforming-education-finance-in-transition-countries 306/335
World Bank Study282
This occurred after the election of the first non-communist government in 1989, leading
to profound economic, political, and social changes for the country in the 1990s. Among
them was the decentralization of political power, seen by many as essential to break-
ing up the centralized communist state (Levitas and Herczyński 2002). Thus, the main
reason for decentralizing general education to local government was to promote localdemocratic institutions and diff use political power rather than to use decentralization as
an instrument for improving the quality of education. It was, however, hoped that local
governments would be willing to invest more in school facilities than the central govern-
ment and would have the incentive to reduce school debts.
Responsibility for primary schools was to be devolved to gminas from 1994 onwards,
so the 1993 Law on Gmina Revenues introduced a new method of funding primary edu-
cation: a general purpose education grant, or “subvention” as it is referred to in Poland,
is allocated to gminas according to a per student formula to be developed by the National
Ministry of Education as a contribution to the financing of their recurrent educational
expenditures. The Ministry was faced with the problem of considerable diff erences in
per pupil costs between rural and urban gminas , costs in the former often being three or
four times those in the laer. Furthermore, the much higher per student costs in rural
schools were in many cases not explainable based on external factors, such as a sparse
population or poor road infrastructure. And finally, Poland is unique among the coun-
tries covered in this book in having very strong and active teacher unions that defend the
Teachers’ Charter (legislation that protected teachers under the previous regime). Thus,
the Ministry had to grapple with two conflicting objectives for the formula: creating a
funding system that was more horizontally equitable and effi cient, on the one hand, and,
on the other, a system that was politically acceptable to teacher and rural interests.
Since independence, Estonia has experienced rapid political and economic change
under a post-independence government that has been liberal, pro-market and keen to
foster decentralization. It revived the pre-war municipalities as units of local govern-
ment so that today, Estonia has 227 municipalities, and although almost 70 percent of
the population lives in urban municipalities, over 80 percent of local governments are
rural. The Basic Schools and Upper Secondary Schools Act of 1993 assigned responsi-
bility for general education to local governments. The new municipalities were keen
to open schools, which they were able to do with lile capital expenditure by bringing
empty pre-war school buildings back into use. The Act specifies that a school shall have
its own budget, may have its own bank account, and that grants for education, based onthe number of students, shall be allocated to local governments from the state budget
each year. The government in power in 1993 was led by politicians to whom per student
funding of general education appealed for a number of reasons, primary amongst which
was the desire to promote competition both among public schools and between public
and private schools, whose growth would be encouraged by a per student state subsidy.
There was, in addition, a desire to promote internal effi ciency by inducing municipalities
to reduce the number of schools, which had burgeoned since 1991.
The new Georgian government that took power following the “Rose Revolution” of
2004 undertook a systematic eff ort to improve governance in the country by minimiz-
ing the role of local governments, especially in the area of public finance. Thus, localgovernments were not only deemed to be administratively incompetent but also non-
transparent and the Government took away most of their responsibilities, including
8/6/2019 Reforming Education Finance in Transition Countries
http://slidepdf.com/reader/full/reforming-education-finance-in-transition-countries 307/335
Reforming Education Finance in Transition Countries 283
health, social protection, and local transportation. Some functions were decentralized
to the level of service providers, some were centralized, accompanied by a serious eff ort
to privatize providers of social services. With respect to general education, the Ministry
of Education agreed with the Ministry of Finance to take funds earmarked for schools
away from the local government level and to allocate them directly to schools in theform of school vouchers. Therefore, in the area of school finance, decentralization was
introduced down to the school level while other functions in the sector were centralized,
e.g. opening and closure of schools was the responsibility of the Ministry. In addition
to the introduction of per student funding, other important reform elements included
enhanced school autonomy, including budgetary autonomy, and introduction of state
exams for candidate school directors as well as introduction of a school accreditation
process and teacher licensing system. Georgian reformers did not trust that vouchers
will lead to school network consolidation, so they undertook major rationalization of
schools just prior to implementing the vouchers.
In Armenia, promotion of school autonomy featured prominently too in the Min-
istry of Education and Science’s adopted Strategy for Reform of the General Education
System in 1997. In addition to promoting school autonomy, the Strategy proposed intro-
duction of per capita financing for general secondary education as a tool for improving
cost eff ectiveness (mainly by means of school consolidation), and reducing over-staffi ng.
Thus, the Government’s major objectives in introducing per student finance, as stipu-
lated in the Government Decree No. 377 and Education Law of 1999, include: (i) estab-
lishment of favorable and promotional conditions by rationalizing and increasing the
effi ciency of the education system; (ii) implementation of education reform innovations,
particularly decentralization of management and financing autonomy to schools and
promotion of effi cient and sustainable mechanisms for self-dependent schools; and (iii)
establishment of the school board as an accountability mechanism by involving com-
munities in school management.
In Lithuania, a working group was set up by the Ministry of Education in 2000-
01 with the goal of assessing the inherited system of education finance, identifying the
main problems and proposing reform measures. The report of the working group listed
the main problems of the previous financing system as (i) education spending varies
greatly in diff erent regions or municipalities, although the education standards for pu-
pil achievement are the same; (ii) network of schools of general education is not at its
optimum, hence funds are used ineffi
ciently; (iii) the largest share of funding is spent onrunning the schools and paying teacher salaries while the part for modernization of the
teaching process or purchase of teaching materials is in decline; (iv) when distributing
funds for implementing the teaching plans for a certain academic year among general
education schools, the money is allocated per number of class sets, not per number of
students, which leads to the funding of a large number of vacancies in classes; (v) schools
have neither independence in planning their spending nor incentives to use the funds al-
located effi ciently and economically. Accordingly, the goals of the new system were de-
fined as follows: (i) through more effi cient use of education funds, to improve the qual-
ity of education services; (ii) to optimize the network of general education schools and
to ensure equal opportunities to rural and urban students regarding access to qualityeducation; (iii) to create conditions for the network of non-governmental general educa-
tion schools to develop; (iv) to reduce the number of children who do not aend school;
8/6/2019 Reforming Education Finance in Transition Countries
http://slidepdf.com/reader/full/reforming-education-finance-in-transition-countries 308/335
World Bank Study284
(v) to strengthen the financial independence of schools; and (vi) to create a transparent
education funding arrangement. Therefore, three key areas for reform may be outlined:
quality, effi ciency, and autonomy.
The Russian Federation (Russia) is a federal country with diff erent institutional and
financial solutions adopted by regional governments. The administrative structure inRussia consists of two levels below the federal government—regions (including oblasts
and republics) and towns/municipalities (rayons) and education administration gener-
ally follows this structure. Until 2003, towns and municipalities were responsible for fi-
nancing the entire budget for general education. Because many municipalities have had
diffi culties in paying wages and salaries for teachers and support staff in a timely man-
ner, the Federal government amended the Educational Subventions Law in 2003 and
made the regional governments responsible for financing the minimum level of educa-
tion budgets through subventions to the local administrations (towns and municipali-
ties). The minimum level of education budgets was defined to cover wages and salaries
for teachers and support staff , the cost of educational materials, technical teaching aids,
and other consumables. The local administrations remained responsible for financing
the cost of building maintenance and utilities according to their own norms. Per capita
financing in Russia had a wide range of objectives, including providing state guarantees
of accessibility and equity to ensure complete education for all children; restructuring of
the network of educational institutions to raise effi ciency of spending; improving quality
of education through competition for students; developing financial autonomy of insti-
tutions; and enhancing management of educational institutions by, inter alia, improving
the transparency of budgetary and non-budgetary funds. An essential element of per
capita financing was the decentralization of budget management to the school direc-
tor, who was to receive a block grant, open and operate a bank account for the school,
and flexibly manage a school budget (including funds obtained from non-state sources)
without rigid budget headings. In all this, the school director would be accountable to
a Board of Trustees at school level and there would be similar Boards at municipal and
republican levels.
8.3. Great Variation in Design, Structure, Coverage
and Reach of Funding Formulae
The case studies include countries that derived the per student amount in the fund-
ing formula using a boom-up activity-led approach while others employed a moretop-down approach based on historical actual expenditures. The funding formulae vary
widely in their complexity, with the Armenian and Georgian formulae exhibiting the
smallest number of adjustment factors to the per student amount based on school and
student characteristics, and the Polish and Lithuanian formulae the greatest number.
These school and student characteristics include geographic location, school size, school
type, school language of instruction, student grade level, type of student, and type of
special needs. The funding formulae also vary in their coverage of the school budget,
with the majority excluding capital expenditures and some excluding certain types of
recurrent expenditures. Finally, the funding formulae vary in their reach, i.e. whether
the formula allocates general education funding on a per student basis to the local gov-ernment or all the way down to the individual school.
8/6/2019 Reforming Education Finance in Transition Countries
http://slidepdf.com/reader/full/reforming-education-finance-in-transition-countries 309/335
Reforming Education Finance in Transition Countries 285
Caldwell et al. (1999) write about phases in the evolution of formula funding based
on the experience in Western countries. Accordingly, the first generation of funding for-
mulae was simple pupil/teacher and staffi ng ratios and small per pupil allowances for
consumable items. These formulae assumed that all pupils at a given grade level in a
school have the same educational needs and hence cost the same to educate. The secondgeneration of funding formulae was developed precisely in order to take account of
diff erences in learning needs of students, i.e. some students cost more to educate than
others. These funding formulae, e.g. the Ross Index in Australia, are indices made up of
variables that reflect characteristics, such as economic disadvantage or lack of fluency
in the language of instruction, which correlate well with student levels of educational
aainment. The additional money per student delivered by these second generation for-
mulae for supplementary educational need was not based on any analysis of the costs of
educating students with particular learning needs to a given level of aainment. Rather,
the formulae were used to distribute a politically determined sum of money to schools
according to their concentration of educationally disadvantaged students. These second
generation formulae have now been adapted and incorporated into the more compre-
hensive third generation formulae, which ideally have the following characteristics:
■ comprehensiveness: includes all costs of educating students incurred at school
level;
■ cost-based: formula is derived from an analysis of costs of providing students
with a specified educational program, diff erentiated according to student sup-
plementary educational needs and specific costs of school they aend;
■ incentive appropriate: formula encourages schools to act in ways which are con-
sistent with agreed educational policy objectives.
The per student formulae encountered in the ECA country case studies arguably fall
between the first and second generations of formulae described above, with consider-
able variation in their complexity and hence desire to accommodate the diff erent cost
structures of schools. In general, the per student funding formulae observed in the case
studies begin with an amount apportioned for each student enrolled and subsequently
incorporate adjustment factors, either based on school or student characteristics–see
Table 8.2 and Table 8.3. Examples of school characteristics that feature in the diff erent
formulae include geographic location, e.g. mountainous, rural, urban, or island; school
size; school type, e.g. primary, basic, or boarding school; whether a minority school or
one with migrant students; and whether a school with multiple languages of instruction
or integrated teaching. Examples of student characteristics that feature in the country
case study formulae include the grade level; type of special needs, if any, e.g. students
with learning diffi culties, mental disorders, or sensory or physical disabilities; adult,
evening, or distance learning student; and specialized student, e.g. sports, music, ballet,
or art student. As Annex 1 shows, the funding formulae in Armenia and Georgia include
the lowest number of adjustment factors based on school and student characteristics,
whereas the formulae in Lithuania and Poland contain the greatest number–we will re-
turn to this distinction shortly.
The per student amount in the formula can be derived by relying on actual expen-ditures—a “top-down” approach—or using an activity-based model (Abu-Duhou et al.
1999)—a more “boom-up” approach. The laer is a methodology for determining the
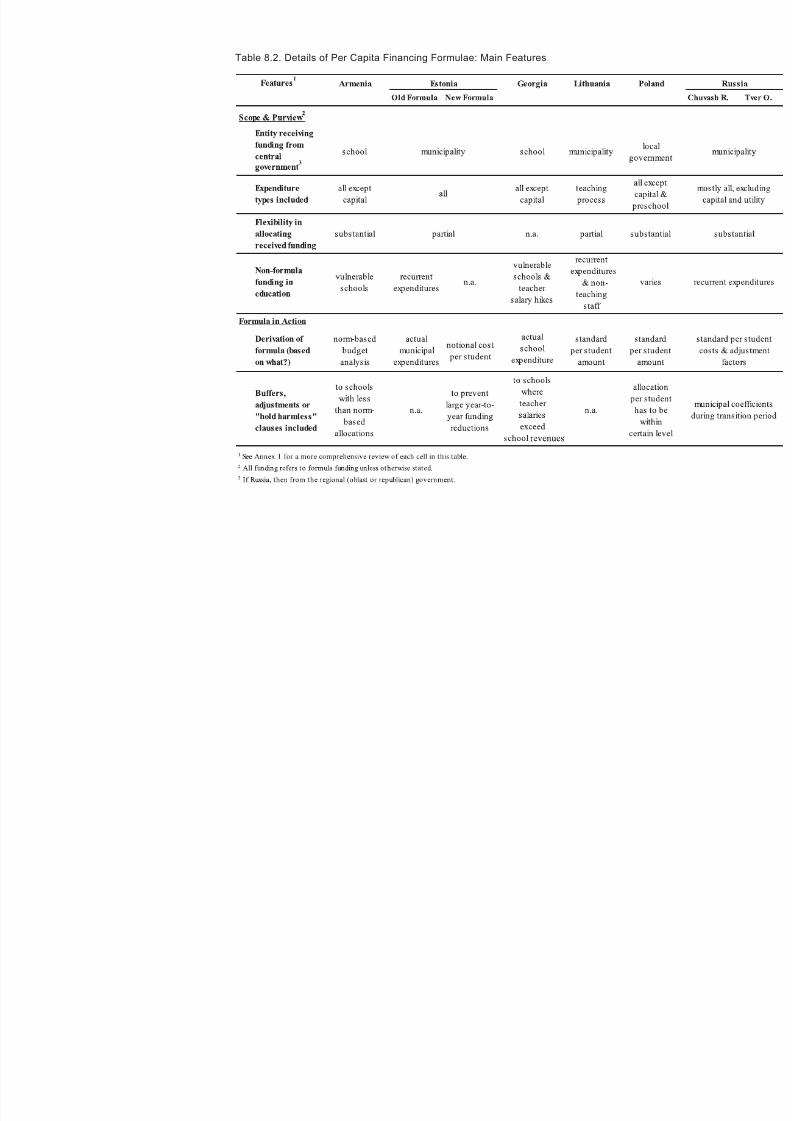
8/6/2019 Reforming Education Finance in Transition Countries
http://slidepdf.com/reader/full/reforming-education-finance-in-transition-countries 310/335
Table 8.2. Details of Per Capita Financing Formulae: Main Features
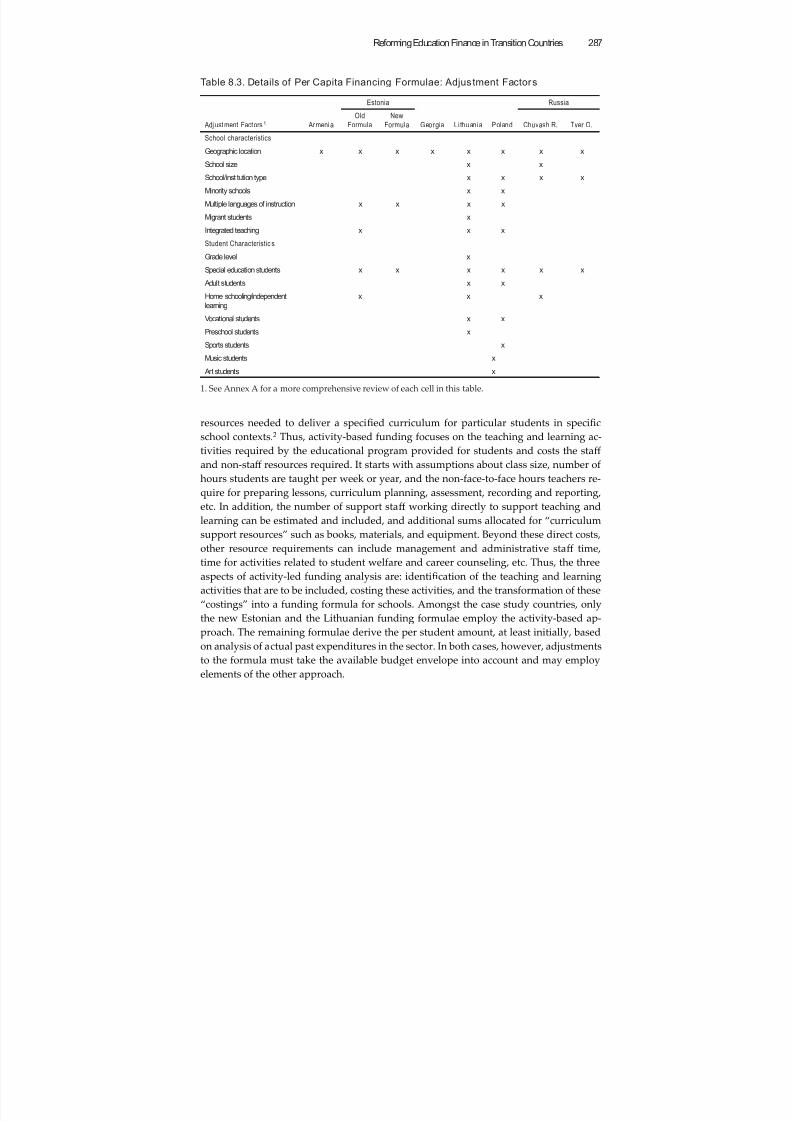
8/6/2019 Reforming Education Finance in Transition Countries
http://slidepdf.com/reader/full/reforming-education-finance-in-transition-countries 311/335
Reforming Education Finance in Transition Countries 287
resources needed to deliver a specified curriculum for particular students in specific
school contexts.2 Thus, activity-based funding focuses on the teaching and learning ac-
tivities required by the educational program provided for students and costs the staff
and non-staff resources required. It starts with assumptions about class size, number of
hours students are taught per week or year, and the non-face-to-face hours teachers re-
quire for preparing lessons, curriculum planning, assessment, recording and reporting,
etc. In addition, the number of support staff working directly to support teaching and
learning can be estimated and included, and additional sums allocated for “curriculum
support resources” such as books, materials, and equipment. Beyond these direct costs,
other resource requirements can include management and administrative staff time,time for activities related to student welfare and career counseling, etc. Thus, the three
aspects of activity-led funding analysis are: identification of the teaching and learning
activities that are to be included, costing these activities, and the transformation of these
“costings” into a funding formula for schools. Amongst the case study countries, only
the new Estonian and the Lithuanian funding formulae employ the activity-based ap-
proach. The remaining formulae derive the per student amount, at least initially, based
on analysis of actual past expenditures in the sector. In both cases, however, adjustments
to the formula must take the available budget envelope into account and may employ
elements of the other approach.
Table 8.3. Details of Per Capita Financing Formulae: Adjustment Factors
Adj ust ment Factors 1 Armeni a
Estonia
Georgia L ithuania Poland
Russia
Old
Formula
New
Formula Chuvash R. Tver O.
School characteristics
Geographic location x x x x x x x x
School size x x
School/institution type x x x x
Minority schools x x
Multiple languages of instruction x x x x
Migrant students x
Integrated teaching x x x
Student Characteristic s
Grade level x
Special education students x x x x x x
Adult students x x
Home schooling/independent
learning
x x x
Vocational students x x
Preschool students x
Sports students x
Music students x
Art students x
1. See Annex A for a more comprehensive review of each cell in this table.
8/6/2019 Reforming Education Finance in Transition Countries
http://slidepdf.com/reader/full/reforming-education-finance-in-transition-countries 312/335
World Bank Study288
The funding formulae vary in the degree to which they cover the entire school bud-
get, i.e. whether they include capital expenditures in addition to recurrent expenditures,
and which elements of the laer. Thus, the formulae in Armenia and Georgia cover all
recurrent costs–but not capital expenditures. Indeed, the Estonian funding formula alone
includes a per student allocation for capital expenditures, though only as of 2005, havingpreviously covered only teacher salaries and textbooks. Formula funding is arguably
not suitable for allocating all types of public expenditure on schools, e.g. expenditures
that have an uneven incidence over time, such as major capital projects, are not usually
suited to allocation by formula to individual schools (Levačić and Ross 1999), as making
adjustments that will complicate funding for temporary and often changing expenses re-
mains impractical. Despite the inclusion of capital expenditures in the Estonian formula,
not all recurrent costs are included, and municipalities are expected to pay for school op-
erational costs and non-teaching staff out of own budgets. The situation is similar in Rus-
sia where municipalities are expected to cover utilities, maintenance, and repairs out of
their own resources. Lithuania, on the other hand, distinguishes between expenditures
on the teaching process versus the teaching environment, with only the first covered by
the funding formula. The teaching process includes salaries of teachers, administrators,
and professional staff , teacher in-service training, textbooks, library books, and teaching
aids, while the “teaching environment” covers the salaries of technical staff (e.g. clean-
ers, drivers, gardeners, and cooks), and utilities and communications (telephone and
Internet). Finally, Poland’s formula is exceptional in that it does not stipulate what as-
pects of the school budget it is meant to cover, which may be interpreted as the formula
covering the entire school budget in theory, but in practice municipalities supplement
the formula allocation from their own resources (see more below).
A key distinction concerns whether, having calculated the general education alloca-
tion on a per student basis, the resources are transferred from higher-level government
to municipalities or to schools directly. Here, only Armenia and Georgia have funding
formulae that allocate funds to schools, which were transformed from budgetary insti-
tutions to autonomous legal entities.3 For all other countries, municipalities receive the
funds—in the case of Estonia, the funds received are earmarked for education, while in
Poland they are not, and in Lithuania, although municipalities receive the funds, they
also have prescribed to them by the central government the allocations for individual
schools (with the caveat that municipalities may reallocate up to 5 percent of the total
budget among schools). The fact that Armenia and Georgia also have the simplest fund-ing formulae may therefore be a corollary of central government disbursing to schools
with no involvement of local government and hence no discussion and dialogue be-
tween central and local government on the formula and its aributes. By contrast, in
both Poland and Lithuania (the two countries with the most complex formulae) there is
an annual review process that involves both central and local government where issues
are raised and specific factors are taken into account. Whether schools receive directly
their budgetary allocations from the central government or intermediated through mu-
nicipalities is not merely a technical question aff ecting the design of the formula - it
has instead important repercussions on the incentives for improvements in effi ciency of
spending in the system.
8/6/2019 Reforming Education Finance in Transition Countries
http://slidepdf.com/reader/full/reforming-education-finance-in-transition-countries 313/335
Reforming Education Finance in Transition Countries 289
8.4. Assessing the Reform: What is the Evidence?
8.4.1. Assessment of Improvements in Ef ficiency
8.4.1.1. IMPROVING THE EFFICIENCY OF SPENDING: LOCAL GOVERNMENTS
ARE KEY TO R ATIONALIZING SCHOOL NETWORKS
In their school-consolidation decisions, governments balance considerations of effi ciency
of the school network with considerations over the value and function that schools have
in their respective communities. The case studies document a range of approaches to
rationalizing school networks as a result of, in tandem with, or even as a precursor to im-
plementing per capita finance. Thus, Georgia conducted a massive school network con-
solidation process in preparation for the implementation of per student finance reform.
Lithuania and the Russian Chuvash Republic, on the other hand, succeeded in rational-
izing the school network by a combination of the incentives inherent in their funding
formulae and the obligation imposed on local government by the central and Republican
government, respectively, to implement network consolidation plans. Poland stands outperhaps in having relied exclusively on the funding formula to achieve network consoli-
dation, including introducing an adjustment factor into the formula to account for the
cost of transporting students to school. Estonia’s experience is noteworthy as well, in
that the pressure felt by municipalities to close small schools led to a backlash and the
adoption of a new formula that relieve much of this pressure. Finally, the Armenian cen-
tral government priority to initially exclude small schools from the per student funding
reform and the lack of budgetary authority over schools by regional governments meant
the country has not been able to rationalize its school network. For considerable school
consolidation to occur, there must be proper distribution of financial management author-
ity among the various levels of government, as well as adjustments built into the reform,such as earmarked financing or bonuses, that facilitate school closings.
The country case studies demonstrate that closure of under-enrolled schools is by
no means an automatic corollary of puing in place per capita financing. The 2000 ECA
education sector strategy (Berryman 2000) highlights the problems of ineffi cient and in-
equitable education spending and goes on to state that “[i]t is almost universally accept-
ed now that ‘money follows student’ is the preferred alternative” (p.48), where “money
follows student” means that funding for education is a function primarily of the number
of students. In theory, per capita financing permits local governments to find the most
effi cient means of providing education within the overall spending envelope provided
by higher-level government. In particular, per capita financing imposes effi ciency mea-
sures on jurisdictions with under-enrolled schools. Furthermore, under a per student
formula, falling enrollment will cause a drop in school funding, forcing local govern-
ment to close schools they can no longer aff ord. In practice, however, falling enrolments
may not trigger a drop in funding, and local governments may lack the legal authority
or political will to close schools, particularly if these function as an important center of
village or community life.
The case of Poland demonstrates a gradual alignment of the incentives resulting
from the funding formula as one way of achieving rationalization of the school network.
In the initial 1994 design of the Polish per student formula, the commensurate legislation
specified that any individual gmina must not receive less than 100 percent of its inflation-
adjusted allocation in the previous year. This approach is of course more reminiscent of
historical than per student funding. Consequently, in gminas where student numbers fell,
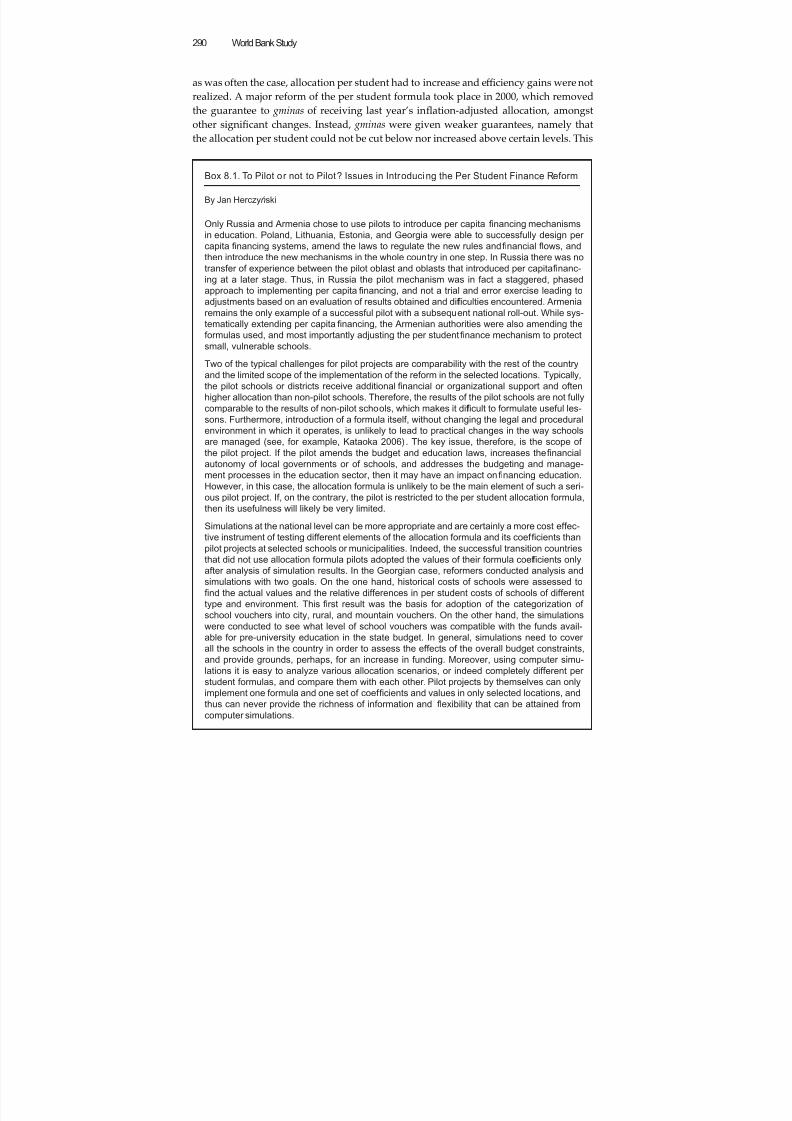
8/6/2019 Reforming Education Finance in Transition Countries
http://slidepdf.com/reader/full/reforming-education-finance-in-transition-countries 314/335
World Bank Study290
as was often the case, allocation per student had to increase and effi ciency gains were not
realized. A major reform of the per student formula took place in 2000, which removed
the guarantee to gminas of receiving last year’s inflation-adjusted allocation, amongst
other significant changes. Instead, gminas were given weaker guarantees, namely that
the allocation per student could not be cut below nor increased above certain levels. This
Box 8.1. To Pilot or not to Pilot? Issues in Introducing the Per Student Finance Reform
By Jan Herczyński
Only Russia and Armenia chose to use pilots to introduce per capita financing mechanisms
in education. Poland, Lithuania, Estonia, and Georgia were able to successfully design per
capita financing systems, amend the laws to regulate the new rules and financial flows, and
then introduce the new mechanisms in the whole country in one step. In Russia there was no
transfer of experience between the pilot oblast and oblasts that introduced per capita financ-
ing at a later stage. Thus, in Russia the pilot mechanism was in fact a staggered, phased
approach to implementing per capita financing, and not a trial and error exercise leading to
adjustments based on an evaluation of results obtained and dif ficulties encountered. Armenia
remains the only example of a successful pilot with a subsequent national roll-out. While sys-
tematically extending per capita financing, the Armenian authorities were also amending the
formulas used, and most importantly adjusting the per student finance mechanism to protect
small, vulnerable schools.
Two of the typical challenges for pilot projects are comparability with the rest of the country
and the limited scope of the implementation of the reform in the selected locations. Typically,
the pilot schools or districts receive additional financial or organizational support and often
higher allocation than non-pilot schools. Therefore, the results of the pilot schools are not fully
comparable to the results of non-pilot schools, which makes it dif ficult to formulate useful les-
sons. Furthermore, introduction of a formula itself, without changing the legal and procedural
environment in which it operates, is unlikely to lead to practical changes in the way schools
are managed (see, for example, Kataoka 2006) . The key issue, therefore, is the scope of
the pilot project. If the pilot amends the budget and education laws, increases the financial
autonomy of local governments or of schools, and addresses the budgeting and manage-
ment processes in the education sector, then it may have an impact on financing education.
However, in this case, the allocation formula is unlikely to be the main element of such a seri-
ous pilot project. If, on the contrary, the pilot is restricted to the per student allocation formula,
then its usefulness will likely be very limited.
Simulations at the national level can be more appropriate and are certainly a more cost effec-
tive instrument of testing different elements of the allocation formula and its coef ficients than
pilot projects at selected schools or municipalities. Indeed, the successful transition countriesthat did not use allocation formula pilots adopted the values of their formula coef ficients only
after analysis of simulation results. In the Georgian case, reformers conducted analysis and
simulations with two goals. On the one hand, historical costs of schools were assessed to
find the actual values and the relative differences in per student costs of schools of different
type and environment. This first result was the basis for adoption of the categorization of
school vouchers into city, rural, and mountain vouchers. On the other hand, the simulations
were conducted to see what level of school vouchers was compatible with the funds avail-
able for pre-university education in the state budget. In general, simulations need to cover
all the schools in the country in order to assess the effects of the overall budget constraints,
and provide grounds, perhaps, for an increase in funding. Moreover, using computer simu-
lations it is easy to analyze various allocation scenarios, or indeed completely different per
student formulas, and compare them with each other. Pilot projects by themselves can onlyimplement one formula and one set of coef ficients and values in only selected locations, and
thus can never provide the richness of information and flexibility that can be attained from
computer simulations.
8/6/2019 Reforming Education Finance in Transition Countries
http://slidepdf.com/reader/full/reforming-education-finance-in-transition-countries 315/335
8/6/2019 Reforming Education Finance in Transition Countries
http://slidepdf.com/reader/full/reforming-education-finance-in-transition-countries 316/335
World Bank Study292
in the Chuvash Republic, several other factors, including a school restructuring plan and
provision of transportation, contributed to its success.
Georgia, on the other hand, conducted a massive school network consolidation pro-
cess in preparation for and as a precursor to implementation of per capita financing.
Thus, in conjunction with decentralizing several aspects of school management down tothe school, the closure and opening of schools was defined as one of the functions of the
Ministry of Education. Therefore, prior to introducing per capita financing in the coun-
try, the Ministry began a process of reducing the number of schools from 3,153 in 2005
to a target of 1,800 schools (the number of schools in 2007 was down to 2,227). The target
total number of schools was established based on a combination of a school mapping ex-
ercise and the introduction of some criteria for network optimization. Examples of these
criteria include proximity to a large school (especially in the cities), unsustainable small
schools with possibility to transport students to a larger school (in particular, availabil-
ity of roads in the mountains and countryside), and small primary schools (which were
transformed into affi liated schools subordinated to a larger full secondary institution).
In this regard, the Ministry purchased a number of buses for transportation of children
to consolidated schools.
Estonia is in the interesting position of having implemented a per student formula
that put pressure on municipalities to close small schools and then deciding to design a
new formula (as of 2008) that instead favors municipalities with 1,600 students or less.
In other words, a particular concern in Estonia is that per student funding has put too
much pressure on the financial viability of small schools during a period of marked de-
mographic decline. Rural areas exhibit a great desire to preserve even very small rural
schools. In addition, despite the concerns of some educationalists about the quality of
education in small rural schools, they remain popular with many rural parents, and as a
result, several of the political parties support the maintenance of small schools. The new
formula therefore makes explicit the minimum school size that the government consid-
ers is to be maintained, and municipalities are free to sustain even smaller schools if they
choose to allocate their own funds to that end.
Finally, Armenia, where local governments did not play a role in education, has not
rationalized its school network because the central government opted to protect small
schools and regional governments were not positioned to conduct or foster an effi cient
school reorganization. Despite the substantial reduction in the number of students in the
period 2000-07, the total number of schools has declined very li
le (from 1,389 in 2000 to1,362 in 2007). Most of the decline was the result of school consolidation in urban areas
during 2003-05. In fact, as the central government excluded small, remote, and border
schools4 from the application of the per student formula, the proportion of schools with
fewer than 300 students remained high at 55 percent in 2005. After the government pi-
loted school management capacities at the local (hamaink) level and judged them to be
inadequate, regions regained the management of those schools. Moreover, the regional
governments–with deconcentrated offi ces of the Ministry of Education and Science–
have no authority to reallocate budgets among schools or to arrange for transportation
for students to schools. Thus, they have neither the incentives nor the tools to promote
school consolidation.
8/6/2019 Reforming Education Finance in Transition Countries
http://slidepdf.com/reader/full/reforming-education-finance-in-transition-countries 317/335
Reforming Education Finance in Transition Countries 293
8.4.1.2. IMPROVING THE EFFICIENCY OF SPENDING: INCREASING STUDENT-TEACHER
R ATIOS C ANNOT BE ACCOMPLISHED BY PER STUDENT FUNDING ALONE
The case studies demonstrate the importance of having the correct incentives emanate
from the funding formula (as in the case of Lithuania) but also of taking into account
political economy considerations, e.g. assuring teacher welfare through provision of theright redundancy packages where necessary (as in the case of Armenia).
Armenia succeeded in increasing the student-teacher ratio primarily by making
teachers redundant and providing a teacher redundancy package under the Education
Sector Reform Program.5 The package off ered the following options: (i) professional
training for new jobs; (ii) relocation grants for those who wished to move from urban to
rural schools; (iii) small business start-up support; and (iv) a cash payment equal to six
months’ salary for teachers within five years of the offi cial retirement age of 62 years. As
a result, 7,200 teachers were made redundant during 2004-06, which fell short of the orig-
inal 2003 target of 15,000 teachers, as a result of growing political opposition, amongst
other issues. Nonetheless, Armenia achieved substantial internal effi ciency gains during
2001-07: as the number of students, driven by demographic changes, declined by over 20
percent, the number of classes was reduced by 24 percent, teaching staff positions by 35
percent and non-teaching staff positions by 34 percent. As a result, the student-teacher
ratio increased from 10.8 in 2003 to 13.9 in 2006 and the average teaching load increased
from 18 to 22 hours per week.
Poland, on the other hand, has experienced a 14 percent decline in the student-teach-
er ratio over the period 2000-07, primarily as a result of the Teachers’ Charter, which
made it diffi cult to improve the effi ciency with which teachers are deployed as student
numbers fell by 16 percent over the same period. Initially in 1994, the design of the
formula in Poland ensured that per pupil allocations were higher for gminas with low
student-teacher ratios, with initial adjustment factors for gminas based on average class
size. This arrangement gave perverse effi ciency incentives, which were removed in 1996
when the class size criteria were abandoned. In response to the decline in student num-
bers, surplus teachers were absorbed by the system by creating more teaching hours by
spliing classes. The Teachers’ Charter includes regulations that make the market for
teachers very rigid. On the other hand, local governments have had more impact on im-
proving effi ciency in the use of non-teaching staff compared to the previous normative
approach since local governments are able to determine their own staffi ng. As a result
of the pressure they felt on their budgets, local governments have tended to eliminateunnecessary non-teaching positions and raise, for example, the work load of cleaners.
Finally, the formula itself plays a role in puing in place the right incentives for
declaring teachers redundant, as the case of Lithuania demonstrates. At 12 students per
teacher, the student-teacher ratio was low and stable over the period 2000-05. Admit-
tedly, this needs to be viewed in the context of the overall decline of student numbers
by approximately 10 percent in the same period. At the same time, given the division of
funding in Lithuania by teaching process (which includes teacher salaries and is central-
ly provided) and teaching environment (which is the responsibility of municipalities)
and the fact that savings obtained under the teaching process cannot be used toward the
teaching environment, it is clear that municipalities had no incentive to achieve savingsunder the teaching process, certainly not at the cost of entering the politically diffi cult
terrain of teacher redundancy.
8/6/2019 Reforming Education Finance in Transition Countries
http://slidepdf.com/reader/full/reforming-education-finance-in-transition-countries 318/335
World Bank Study294
8.4.2. Assessment of Improvements in Equity
8.4.2.1. IMPROVING THE EQUITY OF SPENDING: FUNDING FORMULA PROVIDES
THE INCENTIVES BUT THE ROLE OF LOCAL GOVERNMENT IS AGAIN KEY
The case studies document the myriad of ways that funding formulae aempt to address
vertical equity by adjusting for student characteristics, such as special learning needs, or
horizontal equity by adjusting for structural diff erences, such as school geographic loca-
tion. However, none of the formulae studied adjust explicitly for student socioeconomic
status—an important input into improving vertical equity. In addition, those formu-
lae with the greatest number of adjustment factors allocate general education funding
from central (or regional) to local government, leaving the decision up to local govern-
ment (within boundaries) as to how funding is divided amongst individual schools.
Thus, in Estonia and Poland not only do local governments, which have considerable
authority as a result of decentralization reforms, often resort to input-based funding
to allocate funds to schools, but they also often supplement the central allocation withtheir own revenues. In Poland, for example, the result is a wide variation in per student
funding across gminas , which analysis shows are positively correlated with gminas’ own
revenues, above and beyond any schooling structural diff erences across gminas. This
situation implies that per capita financing in Poland has not led to improved horizontal
equity at the local government level. The result also illustrates the diffi culty in achieving
horizontal equity at the local government level when faced with a highly decentralized
system where local entities have considerable jurisdiction and funding flexibility. None-
theless, there is evidence of increased horizontal equity among the schools in Warsaw
and Kwidzyn (i.e. equity among similar schools within these local governments), both
large urban gminas where the local authorities have sought to equalize funding at theschool level.
In general, per student formulae in the countries studied take into account student
special educational needs and geographic location, but not their actual socioeconomic
status. Thus, the per student formulae in almost all country case studies include adjust-
ment factors based on whether schools are located in urban or rural areas, and some
include other geographic criteria, such as mountainous or island regions (see Annex A).
The principle here is that there are structural diff erences in education provision in diff er-
ent geographic locations that have cost repercussions that need to be taken into account,
e.g. the smaller average size of rural schools, the extra cost of heating mountainous
schools, etc. This is, of course, an aempt at ensuring horizontal equity of expenditures–defined above. In addition, several of the formulae take into account student special
learning needs and disabilities, since such students require additional inputs, whether
in terms of human resources or equipment. The Polish and Lithuanian formulae addi-
tionally provide adjustment factors for minority students, and Lithuania further takes
into account migrant students. This “unequal treatment of unequals” (Monk 1990) is an
aempt at achieving vertical equity of expenditures. Accounting for the minority or mi-
grant status of students is probably the closest that any of the formulae comes to actually
considering student welfare level. Of course, many of the above student and school char-
acteristics may be correlated with student welfare level, but it remains the case that none
of the formulae reviewed explicitly accounts for student socioeconomic status. From avertical equity point of view, this is an important shortcoming.
8/6/2019 Reforming Education Finance in Transition Countries
http://slidepdf.com/reader/full/reforming-education-finance-in-transition-countries 319/335
Reforming Education Finance in Transition Countries 295
Beyond the actual formula, a key issue in evaluating the horizontal equity impact of
per capita financing is the role played by local government. On the one hand, it is argu-
ably the case that per student funding allows the central government to ensure a mini-
mum level of education financing in all jurisdictions (Berryman 2000). On the other hand,
it is probably not realistic to expect the central government to take into account the dif-ferent characteristics and needs of students in the allocations it makes. This fact seems to
have been recognized by central governments in the countries studied, for the formulae
for Armenia and Georgia—the only two countries where allocations are made from the
central government to schools—include only geographic adjustment factors and none
based on other student or school characteristics. In all other case studies, the central–or
regional, in the case of Russia–government allocates funding based on the per student
formula but dispenses it to the municipality. Once at the municipal level, diff erent ap-
proaches are employed to allocating funding to schools, but even in the most restrictive
scenario, i.e. Lithuania, where allocations to individual schools are determined by the
central government, municipalities may reallocate up to 5 percent of the total received
budget across their schools.
The leeway available to municipalities in allocating funds to schools varies greatly.
The case of Lithuania is mentioned above. In Russia, the Chuvash Republic does not
instruct its municipalities to apply the same adjustment factors that it has applied in
calculating the municipal total allocation, and even the Republic’s own adjustment coef-
ficients are modified from those prescribed by the Federal level. And in the Tver Oblast,
each municipality was allowed during the transition to per capita financing to adopt a
school coeffi cient within minimum and maximum levels prescribed by the Oblast. In
Poland, local government funding for education is not earmarked, and so municipalities
are in principle free to reallocate to other sectors, as well as being able to add from their
own revenues. In making the decisions as to the allocation to individual schools, gminas
are constrained by several key regulations on, for example, the number of hours per
week that students must be taught the national curriculum, and teacher working load
and salary categories as stipulated in the Teachers’ Charter. In Estonia, the central gov-
ernment education allocation to municipalities is intended to support recurrent spend-
ing on teaching costs, textbooks, and workbooks only, leaving municipalities to fund, at
a minimum, non-teaching staff and non-staff costs. Several regulations set by the central
government constrain municipal funding decisions, including, for example, provision
of free education for all students in grades 1 to 9, the number of hours per week thatstudents must be taught the national curriculum, and maximum class size. At the same
time, municipalities have considerable flexibility in making resourcing decisions about
their schools, including the power to establish, reorganize and close schools, discretion
in determining the number and types of non-teaching posts at schools, and, perhaps
most importantly, determining local policies for teacher pay above the statutory basic
amount stipulated by the central government.
Municipalities that are free to do so choose a range of methods to allocate funding
to individual schools, including input-based funding or what amounts to their own per
student formula. In Estonia, most municipalities do not employ a per student formula,
although the capital city Tallinn has developed not just one but two per student formu-lae: one for allocating central government funding to schools, which closely follows state
guidelines, and one for distributing the city’s own budget. In Poland, the majority of lo-
8/6/2019 Reforming Education Finance in Transition Countries
http://slidepdf.com/reader/full/reforming-education-finance-in-transition-countries 320/335
World Bank Study296
cal governments use an input-based approach to determining school budgets, although
an increasing number of cities are now experimenting with their own per student formu-
lae for schools. One of the earliest such gminas is Kwidzyn, a city of 38,000 inhabitants
that has over a decade’s experience with per capita financing and designed a three-part
formula for determining per student funding to its schools: (i) teaching staff salaries (81percent); (ii) non-teaching staff salaries (7 percent); and (iii) non-staff expenditures (12
percent).
In Poland and Estonia, where municipalities supplement the central education al-
location, there is a wide variation in the resulting per student allocation at the municipal
level. In both countries, the central government undertakes a certain level offiscal equal-
ization across municipalities. For instance, in Poland, local governments that receive in
tax revenues more than 120 percent of the national average tax revenue per resident con-
tribute to a fund that ensures that no local government receives less than 85 percent of
the national average. However, fiscal equalization is restricted to revenue equalization,
so that actual education spending per student is not subject to any such equalization.
Thus, in 2005, average current expenditure per student was 24 percent higher in rural
than in urban gminas and 11 percent higher in mixed gminas. This compares with the cen-
tral allocation per student being 34 percent higher in rural gminas and 21 percent higher
in mixed than in urban gminas. This shows that the relativities in spending assumed by
the formula are altered by the actual decisions of gminas , which must reflect both the dif-
ferences in local preferences for education spending relative to other expenditures and
the size of gmina revenues. Indeed, one of the main factors contributing to diff erences in
education spending per student is diff erences in the amount that gminas fund from their
own revenues, with urban gminas tending to contribute the most.
While diff erences in per student spending resulting from structural costs can be con-
sistent with horizontal equity, in Poland the diff erences in spending vary directly with
the gminas’ own revenues. Relevant structural cost diff erences here may include popu-
lation density, size of the gmina , average size of school, and the student-teacher ratio,
although the last two are clearly amenable to local choice and not strictly purely struc-
tural. Using regressions that control for all four structural factors, the extent to which
variations in per student expenditure can be explained by diff erences in the gminas’ own
revenues per capita was found to be statistically significant. The evidence therefore in-
dicates that the Polish per student funding system has not achieved horizontal equity,
as the gminas’ own revenue per capita infl
uences spending per student, particularly inurban gminas.6 This result illustrates how it can be diffi cult to make gains in horizon-
tal equity at the local government level because of the high degree of decentralization,
which gives considerable rights and jurisdiction to local entities.
There is some evidence, however, of improved equity of per student spending with-
in a few municipalities in Poland, although this result relies on strong local government
leadership and does not originate from formula funding reforms. Warsaw is seeking to
equalize funding among schools, and the trend toward the use of per student formulae
in other Polish cities is inspired by their desire to equalize per student spending across
their schools. The districts of Warsaw–until recently separate gminas–have quite diff er-
ent administrative systems, with the highest cost central district spending twice as muchas the lowest spending outer district and even within the central district there are con-
siderable diff erences in per student costs for equivalent types of schools. The Warsaw
8/6/2019 Reforming Education Finance in Transition Countries
http://slidepdf.com/reader/full/reforming-education-finance-in-transition-countries 321/335
Reforming Education Finance in Transition Countries 297
education department is working to reduce these diff erences year by year in the face
of parental opposition–without the use of a formula since the cost diff erentials among
schools are too great. The move to reduce inter-school per student cost diff erences is a
step in the direction of improved horizontal equity since there are no apparent structural
diff erences amongst the schools in question that would warrant the existing diff erencesin per student expenditures. In addition, Warsaw educators are increasingly recogniz-
ing the evidence on the influence of socioeconomic factors on student achievement and
see a correlation between the lower-funded schools and the socioeconomic background
of their student bodies. As such, the move to equalize per student funding across War-
saw schools will also constitute a move in the direction of improved vertical equity of
expenditures.
8.4.3. Assessment of Improvements in Transparency and Accountability
8.4.3.1. IMPROVING THE TRANSPARENCY AND ACCOUNTABILITY OF SPENDING: PER C APITA FINANCING
H AS M ADE POSITIVE CONTRIBUTIONS BUT THERE IS FURTHER ROOM FOR IMPROVEMENT
The case studies document the improvement in transparency and accountability of
budgetary allocation to local governments and schools as a result of the use of funding
formulae (especially when they are simple), public availability of school budgets, and
increased stakeholder participation and oversight. There remains, nonetheless, room
for further improvement in transparency and accountability, for example by building
capacity in budgeting, planning, and school management, expanding the role of school
councils, and establishing linkages between financial and schooling outcomes data.
Simplicity of the per student formula contributes to its transparency, while its grow-
ing complexity deters technical debate and therefore public oversight. In the case of
Estonia, strong features of the old funding formula were its simplicity and the stability
over time of the adjustment factors in it. While the process for designing the new for-
mula was transparent, with wide involvement of stakeholders and consultations with
local governments and school directors, so that the general principles underlying the
formula are understood, it is doubtful that the complex calculations entailed are equally
comprehended. Such is the experience in Lithuania, where the complexity of the formu-
la has meant that very few municipalities are able to conduct on their own the necessary
calculations to check whether funds allocated to them reflect the results of the formula.
In fact, all the main stakeholders, i.e. the Ministries of Education and Finance as well
as the association of local governments, rely on the same experts for their information.
In this manner, the country loses a vital element of transparency, i.e. the mutual check-
ing and verification, leading to errors, as determined by the State Accounting Offi ce for
the first two years of formula implementation. Nonetheless, in Lithuania there is wide-
spread, if incomplete, understanding of the main components of the formula and each
year a consensus is reached regarding its amendments. Finally, in Poland the formula
is hotly debated at the national level during sessions of a special commission consisting
of representatives of central and local governments, despite the fact that the increasing
complexity of the adjustment factors renders these discussions more and more diffi cult.
Accountability and transparency at the local level depend on the process by which
the local government determines school budgets and
the availability and publicizingof the relevant data. Thus, in Poland, all local governments discuss the annual school
budget with school councils. Local governments that employ their own per student
formula have a more transparent method of allocation, although this does not always
8/6/2019 Reforming Education Finance in Transition Countries
http://slidepdf.com/reader/full/reforming-education-finance-in-transition-countries 322/335
World Bank Study298
translate into public availability of school budget data. More generally, school budgets
are largely determined by the annual organizational plan, a school-level document de-
tailing planned school activities and staffi ng levels that must conform to regulations re-
garding the curriculum. School pedagogical councils consisting of all school teachers are
presented with the school’s annual budget plan, but it is ratified by the local government.Only the school director has very limited executive authority over the school budget and
can monitor it at regular intervals. A similar situation occurs in Estonia. In Georgia, school
directors present the budget to school boards for discussion and approval; however, the
real decision-making power within the school rests with the director. In Lithuania, some
schools also have school councils, but their role appears to be even smaller with regards to
budget decision-making. Overall, transition countries were arguably not able to develop
strong and active school boards, and this clearly limits accountability at the local level.
While, generally speaking, schools and localities have greater financial authority
and there is more availability of school-level information since the implementation of
recent education finance reforms, the ability of stakeholders to fully exercise either their
authority or oversight duties remains elusive because of their limited capacity or infor-
mation. In Georgia, the budgeting and planning skills of school administrators are in-
suffi cient, which has led them to not take advantage of such opportunities as additional
funding from donations or participation in projects (Shapiro 2007). School boards also
do not have the necessary skills to be active participants and full partners in school man-
agement, which makes them rely heavily on school directors and limits accountability.
Finally, parents not in the school board have a very poor grasp of school management
and budget procedures (Shapiro 2007).
Beyond availability of relevant financial and educational data, accountability is en-
hanced by direct linkages between education spending and quality of education. Thus,
in Poland, while local governments are responsible for financing education, the Ministry
of Education and the kuratoria7 are responsible for the quality of education. In other
words, gminas are held accountable for school resourcing by their electorates while the
school and school director are inspected and evaluated by the kuratorium. This arrange-
ment does not foster accountability of either local governments or school-level offi cials
for providing the population with high quality education effi ciently. However, since the
introduction of national tests at the end of primary (grade 6) and lower secondary (grade
9) in 2002, and the matura at grade 12 in 2005, as well as the publication of results at the
school level by the press, parents and schools are using these measures to make theirown judgments about school quality of education. In this manner, both the financial as
well as learning outcomes information is available to the school-level actors. Further-
more, larger local governments, including Warsaw, are themselves beginning to link the
available financial and education quality data in order to foster school accountability.
8.4.4. Assessment of Improvements in Other Key Areas
8.4.4.1. IMPROVING THE QUALITY OF EDUCATION: DIFFERENT INCENTIVES C AN RESULT FROM
THE FUNDING FORMULA WITH DIFFERENT IMPACT ON THE QUALITY OF EDUCATION
The case studies include the experience of Lithuania, which designed a funding formula
primarily focused on improving the quality of general education and, based on avail-able data on student learning, seems to have succeeded in accomplishing this objective.
Lithuania also sought to foster competition for students between its public schools and
its expanding private school network, all of which may have contributed to the observed
8/6/2019 Reforming Education Finance in Transition Countries
http://slidepdf.com/reader/full/reforming-education-finance-in-transition-countries 323/335
Reforming Education Finance in Transition Countries 299
improvement in education quality. At the same time, the effi ciency objective of per capita
financing, insofar as it leads to increased student-teacher ratios, for example, could be at
odds with improving quality of education if the implementation of per capita financing
is not properly monitored. In the case of Armenia, the effi ciency objective has encour-
aged a form of multi-grade teaching that may not be conducive to imparting a qualityeducation to students. At the same time, however, Armenia has not monitored student
learning outcomes so any judgment on the impact of per capita financing on education
quality remains conjecture at this stage.
Armenia has increased class size and the student-teacher ratio and fostered multi-
grade teaching to reap effi ciency gains from per capita financing without collecting, in
parallel, data on student learning. While regional education departments monitor teach-
er and student performance according to the state educational standards for curricu-
lum and teaching and learning methodologies, no data have been collected to examine
whether per capita financing has resulted in any changes in student performance. Such
changes may have potentially resulted from the increase in class size and student-teach-
er ratio, as well as the increase in multi-grade teaching, possibly negatively impacting
student learning. For example, more than 40 percent of the 51 schools in the Vayots Dzor
region make use of multi-grade teaching, which is often interpreted as the teacher divid-
ing one lesson hour by half and spending each half with a diff erent grade.
Lithuania does demonstrate improved education quality between 2002 and 2006,
probably in no small measure as a result of its pro-quality per student formula. Thus,
the funding formula expressly focuses on the teaching process, and apart from the basic
amount for teacher salaries includes a number of components that contribute to the qual-
ity of the pedagogical process, including textbooks, teaching aids, teacher professional
development, pedagogical and psychological services, career guidance, and cognitive
development of students. Furthermore, the non-wage items’ share of the per student
amount increased over time, indicating a substitution away from pure teaching wages to
the above-mentioned quality-enhancing inputs. Lithuania has collected data on student
learning, which indicate that the percentage of grade 8 students achieving basic and high
standards in Lithuanian, mathematics, science, and social studies rose by two to four
percentage points over the period 2002 to 2006.
The promotion of competition for students among governmental schools as well as
the expansion of the network of private schools is expected to contribute to improved
quality of general education. Thus, the per capitafi
nancing approach, insofar as it re-wards schools with greater enrolment, is assumed to lead to healthy competition among
schools for students with a positive impact on the overall quality of general education.
However, the other side of the coin was expressed by teachers and school directors in
Georgia who spoke of a “vicious circle” (Shapiro 2007) in which schools in less com-
petitive situations (e.g. poorer conditions of buildings and equipment or poorer student
body served) may find themselves losing both students and funding, thus compromis-
ing education quality and leading to a further exodus of students and reduced funding.
In the case of Estonia, Poland, and Lithuania, funding of private schools is included in
the purview of the funding formula, again with an eye to promoting beer quality of
education. In Estonia, at 3 percent of total student enrolment, private schools remaina budding sector but seem to be carving out a niche for themselves in serving children
with special needs as well as providing a second chance for graduates of academic upper
secondary education who failed to qualify for higher education.
8/6/2019 Reforming Education Finance in Transition Countries
http://slidepdf.com/reader/full/reforming-education-finance-in-transition-countries 324/335
World Bank Study300
8.5. Main Lessons Learned
The aim of this overview chapter is to provide the lessons learned from the implementa-
tion of per capita financing of general education in six ECA countries from the point of
view of achieving certain outcomes. The results achieved for the individual countriesstudied are documented in detail in the case studies and will not be repeated here. Instead,
some broad lessons learned from the experience of these countries are summarized here
in an aempt to inform future implementation of per student finance in the ECA region.
Regarding rationalization of school networks, the country case studies demonstrate
that closure of under-enrolled schools is by no means an automatic corollary of put-
ting in place per capita financing and that local governments play a key role. Given the
fact that the diff erent countries studied adopted diff erent approaches to decentralization
that led to a diff erent role for local governments in implementing per capita finance, this
lesson emerges quite clearly. Those countries that completely removed the local govern-
ment level from thefl
ow of funds from the center to the school either did not rationalizethe school network (Armenia) or had to accomplish that task separately from and prior
to implementing per capita finance (Georgia). Other countries that allocated funding
for general education based on a per capita funding formula from the center to the local
government were able to either rely exclusively on the incentives inherent in per capita
funding to achieve network consolidation (Poland) or a combination of those incentives
with other centrally mandated obligations (Lithuania). In sum, for considerable school
consolidation to occur, financial management authority between the center, communi-
ties, and schools must be properly distributed, and the per capita financing arrange-
ments must include earmarked financing, bonuses, or other adjustments that facilitate
school closings.Raising student-teacher ratios in an eff ort to improve effi ciency of expenditures has
proven particularly diffi cult to accomplish, especially given the decline in the school-
age population in some of the countries studied. First, obviously, the funding formula
needs to be designed to provide the right incentives to the relevant actors, which was
not the case in Lithuania, for example, where local governments could not benefit from
any savings achieved by leing redundant teachers go. However, the incentives put in
place by the funding formula may be no match to the political economy pressures of
simply keeping teachers on the payroll, transferring them to bigger schools, or finding
alternative employment for them within the school system. The success of Armenia in
increasing the student-teacher ratio hinged to some degree on the availability of WorldBank funding for the teacher redundancy packages and to a large degree on strong po-
litical commitment.
The goal of improving the equity of education expenditures has also been diffi cult
to achieve. In terms of vertical equity, while funding formulae adjust for such student
characteristics as special education needs, minority or migration status, they do not ac-
count for student socioeconomic level. Regarding horizontal equity, the fact that imple-
mentation of per capita financing is inextricably linked with decentralization reforms
has meant that gminas in Poland, for example, are at liberty to express local preferences
and top up available funding for education, resulting in inequitable per capita funding
across gminas. Nonetheless, this same leeway in funding, which resulted from strong de-
centralization eff orts, has led to a process leading to improved equity within a few gmina
in Poland that have chosen to adjust their per capita funding across their own schools.
8/6/2019 Reforming Education Finance in Transition Countries
http://slidepdf.com/reader/full/reforming-education-finance-in-transition-countries 325/335
Reforming Education Finance in Transition Countries 301
As Lithuania’s experience demonstrates, per capita funding formulae can be de-
signed in such a way as to provide incentives that lead to desired outcomes: in this case,
the focus of the funding formula on the teaching process has presumably contributed to
observed improvement in learning outcomes. At the same time, however, if not properly
monitored, it is possible for diff erent objectives of per capita financing to be at odds witheach other. For example, improving effi ciency through multi-grade teaching in Armenia
could have a negative impact on education quality, and it is imperative that the relevant
learning outcomes data be collected and the trends monitored.
Per capita financing has led to improvements in transparency and accountability of
general education expenditures, regardless of whether the funding formula is simple or
complex. Arguably, however, a simple funding formula is more conducive to height-
ened transparency and accountability. A potential trade-off emerges here, nonetheless,
in terms of improving equity, in that complex funding formulae are generally those at-
tempting to make important adjustments for student and school characteristics. Among
important further transparency and accountability improvements are building stake-
holder capacity in budgeting, planning, and school management, expanding the role of
school councils, and establishing linkages between financial and schooling outcomes data.
References
Abu-Duhou, I., Downes, P., and Levačić , R. (1999); “Component 1: Basic student alloca-
tion” in Kenneth N. Ross and Rosalind Levačić (editors) Needs-based Resource Al-
location in Education via Formula Funding of Schools , Paris: UNESCO International
Institute for Educational Planning.
Berryman, S. (2000); Hidden Challenges to Education Systems in Transition Economies , WorldBank, Washington, DC.
Caldwell, B., Levačić , R. and Ross, K. (1999); “The role of formula funding of schools in
diff erent educational policy contexts”, in Kenneth N. Ross and Rosalind Levačić
(editors) Needs-based Resource Allocation in Education via Formula Funding of Schools ,
Paris: UNESCO International Institute for Educational Planning.
Kataoka, S.(2006); Report on Implementation of Per Capita Formula Funding Projects in Tajiki-
stan , World Bank: Washington, DC.
Levačić , R. and Ross,K. (1999); “Principles for designing needs-based school funding
formulae” in Kenneth N. Ross and Rosalind Levačić (editors) Needs-based Resource
Allocation in Education via Formula Funding of Schools , Paris: UNESCO InternationalInstitute for Educational Planning.
Levitas, T. and Herczyński, J. (2002); “Decentralization, Local Governments and Educa-
tion Reform in Post-Communist Poland,” in Balancing National and Local Responsi-
bilities. Education Management and Finance in Four Central European Countries , K. J.
Davey (ed.), Local Government and Public Service Reform Initiative, Open Soci-
ety Initiative, Budapest.
Monk, D. (1990); Educational Finance: An Economic Approach , New York: McGraw-Hill.
Shapiro, M. (2007); Evaluation of the Ilia Chavachavadze Program in Reforming and Strength-
ening Georgia’s Schools , Padeco Co. Ltd.
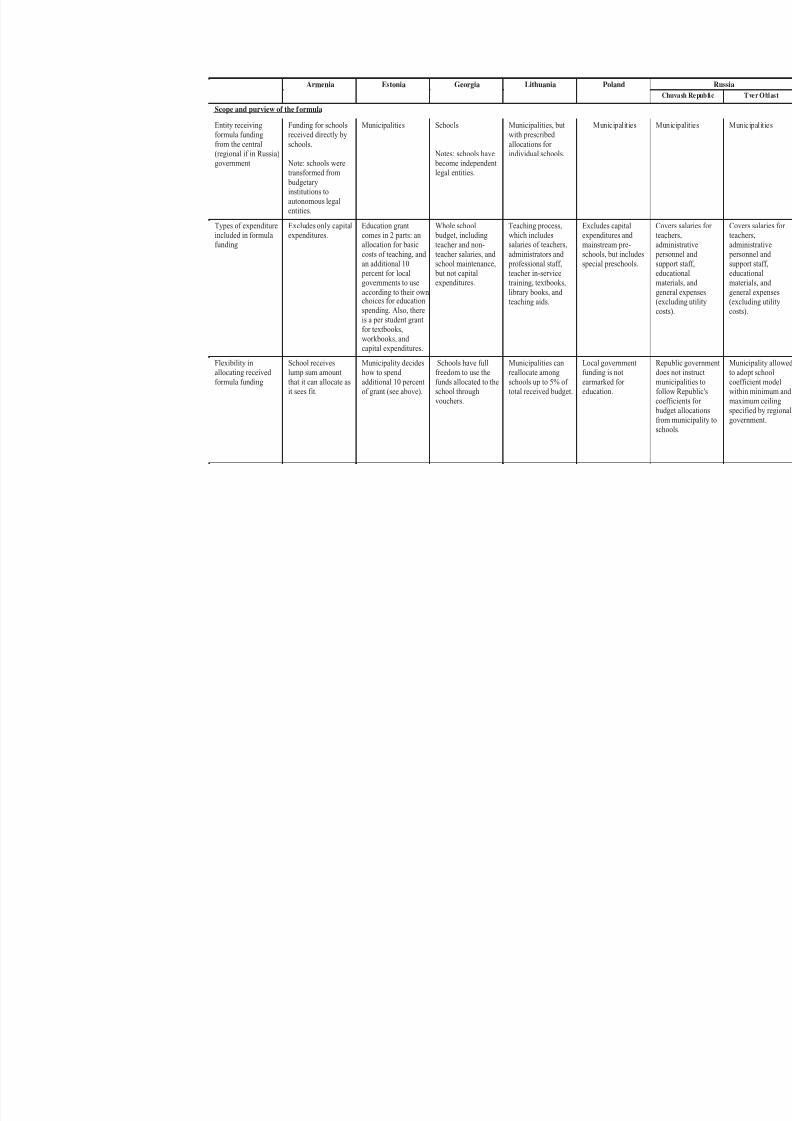
8/6/2019 Reforming Education Finance in Transition Countries
http://slidepdf.com/reader/full/reforming-education-finance-in-transition-countries 326/335
Armenia Estonia Georgia Lithuania Poland
Chu
Scope and purview of the formula
Entity receiving
formula fundingfrom the central
(regional if in Russia)
government
Funding for schools
received directly byschools.
Note: schools were
transformed from
budgetaryinstitutions to
autonomous legal
entities.
Municipalities Schools
Notes: schools have
become independent
legal entities.
Municipalities, but
with prescribedallocations forindividual schools.
Municipalities Muni
Types of expenditure
included in formulafunding
Excludes only capital
expenditures.
Education grant
comes in 2 parts: anallocation for basic
costs of teaching, and
an additional 10
percent for localgovernments to use
according to their ownchoices for education
spending. Also, there
is a per student grant
for textbooks,
workbooks, and
capital expenditures.
Whole school
budget, including
teacher and non-
teacher salaries, and
school maintenance,
but not capitalexpenditures.
Teaching process,
which includessalaries of teachers,
administrators and
professional staff,
teacher in-servicetraining, textbooks,
library books, and
teaching aids.
Excludes capital
expenditures and
mainstream pre-
schools, but includes
special preschools.
Cove
teach
admin
perso
suppo
educamater
gener
(exclu
costs)
Flexibility in
allocating received
formula funding
School receives
lump sum amount
that it can allocate as
it sees fit.
Municipality decides
how to spend
additional 10 percent
of grant (see above).
Schools have full
freedom to use the
funds allocated to the
school through
vouchers.
Municipalities can
reallocate among
schools up to 5% of
total received budget.
Local government
funding is not
earmarked for
education.
Repu
does
muni
follow
coeffi
budgefrom
schoo
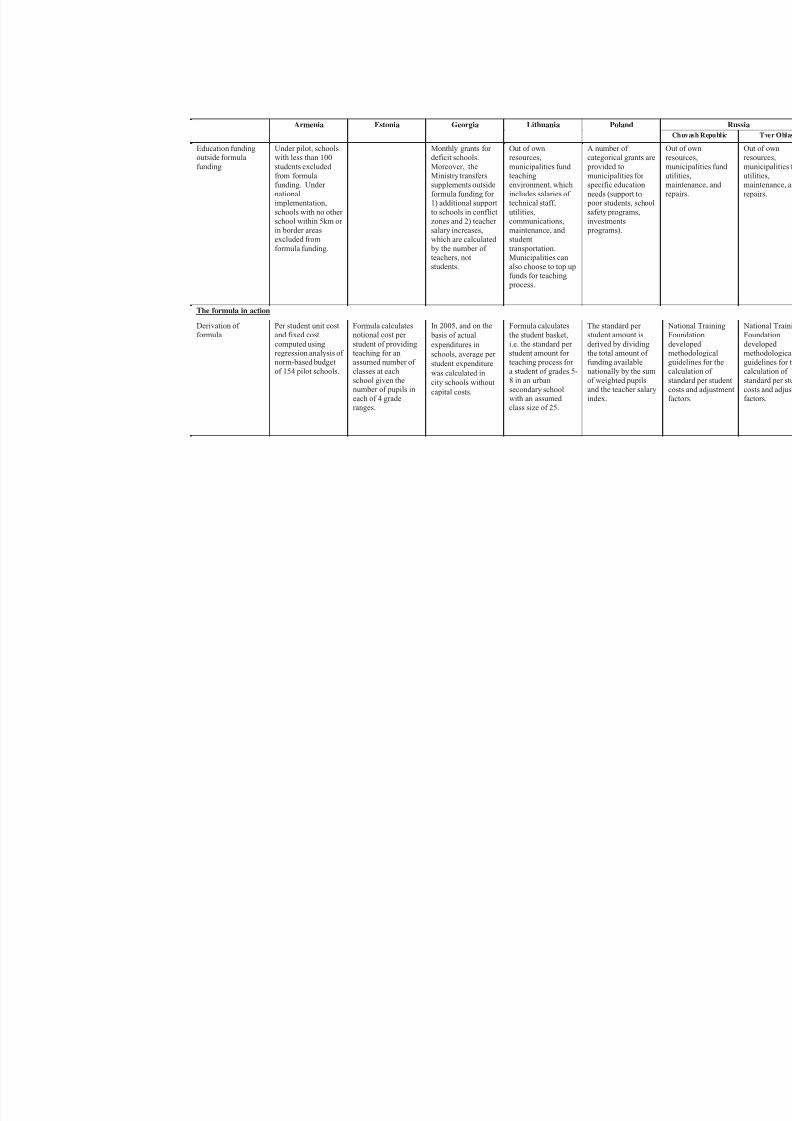
8/6/2019 Reforming Education Finance in Transition Countries
http://slidepdf.com/reader/full/reforming-education-finance-in-transition-countries 327/335
Armenia Estonia Georgia Lithuania Poland
Education fundingoutside formula
funding
Under pilot, schoolswith less than 100
students excluded
from formulafunding. Under
nationalimplementation,
schools with no other
school within 5km orin border areasexcluded from
formula funding.
Monthly grants fordeficit schools.
Moreover, the
Ministry transferssupplements outside
formula funding for1) additional support
to schools in conflict
zones and 2) teachersalary increases,
which are calculated
by the number ofteachers, notstudents.
Out of ownresources,
municipalities fund
teachingenvironment, which
includes salaries oftechnical staff,
utilities,communications,
maintenance, andstudent
transportation.Municipalities canalso choose to top up
funds for teaching process.
A number ofcategorical grants are
provided to
municipalities forspecific education
needs (support to poor students, school
safety programs,
investments programs).
O
rem
utmre
The formula in action
Derivation offormula
Per student unit costand fixed cost
computed usingregression analysis ofnorm-based budget
of 154 pilot schools.
Formula calculatesnotional cost per
student of providingteaching for anassumed number of
classes at each
school given thenumber of pupils in
each of 4 grade
ranges.
Formula calculates
the student basket,
i.e. the standard perstudent amount forteaching process for
a student of grades 5-
8 in an urban
secondary schoolwith an assumed
class size of 25.
The standard perstudent amount is
derived by dividingthe total amount offunding available
nationally by the sum
of weighted pupilsand the teacher salary
index.
N
F
dmg
c
s
cfa
In 2005, and on the
basis of actual
expenditures in
schools, average per
student expenditure
was calculated in
city schools without
capital costs.
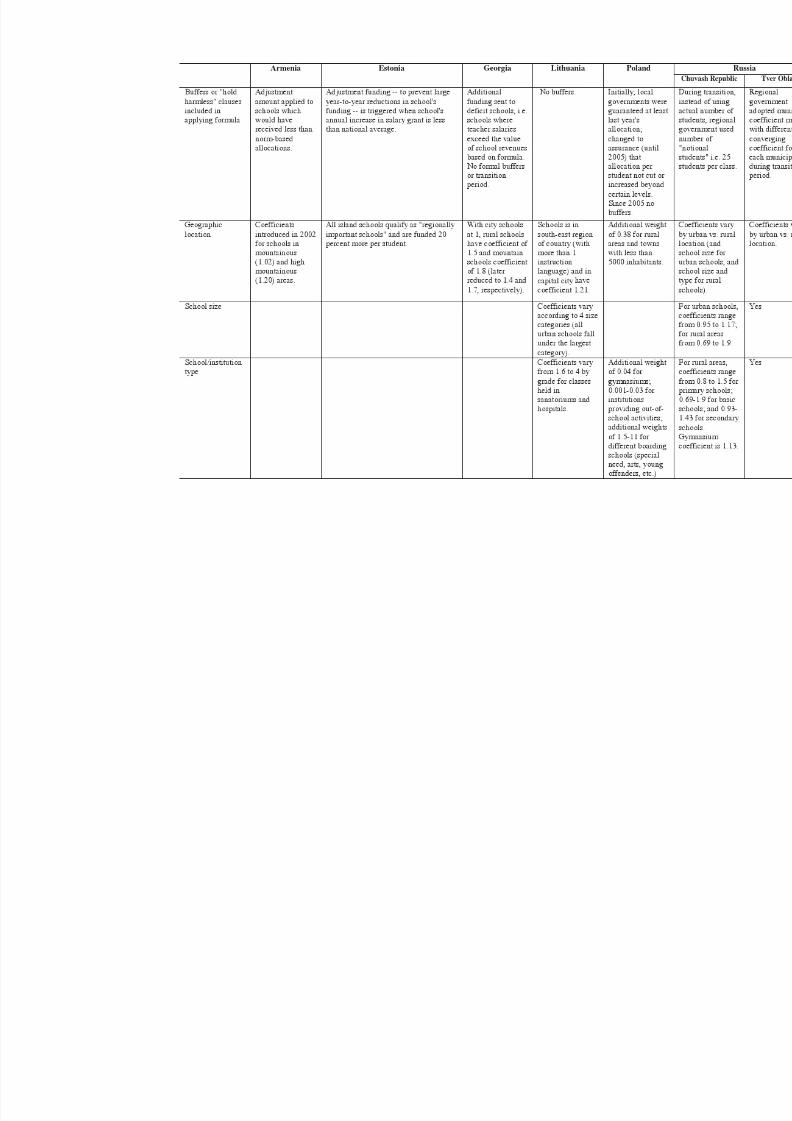
8/6/2019 Reforming Education Finance in Transition Countries
http://slidepdf.com/reader/full/reforming-education-finance-in-transition-countries 328/335
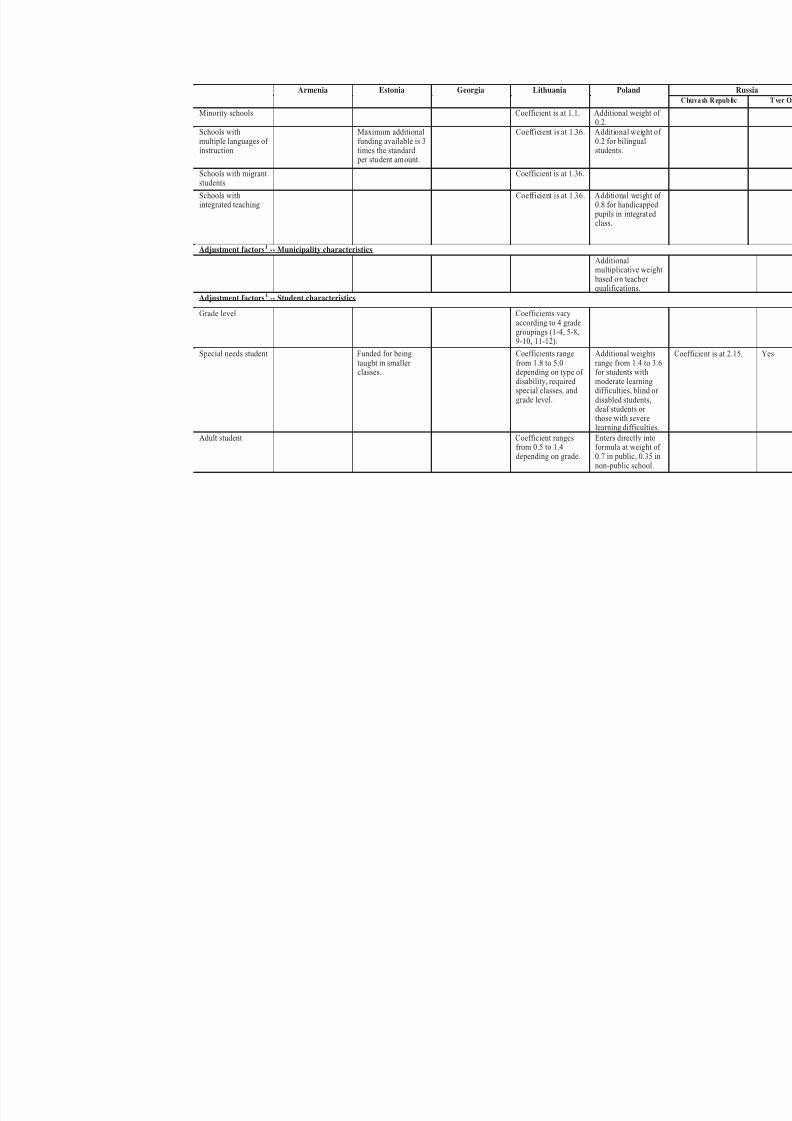
8/6/2019 Reforming Education Finance in Transition Countries
http://slidepdf.com/reader/full/reforming-education-finance-in-transition-countries 329/335
Armenia Estonia Georgia Lithuania Poland
Minority schools Coefficient is at 1.1. Additional weight of0.2.
Schools withmultiple languages ofinstruction
Maximum additionalfunding available is 3times the standard
per student amount.
Coefficient is at 1.36. Additional weight of0.2 for bilingualstudents.
Schools with migrantstudents
Coefficient is at 1.36.
Schools withintegrated teaching
Coefficient is at 1.36. Additional weight of0.8 for handicapped
pupils in integratedclass.
Adjustment factors1 -- Municipality characteristics
Additional
multiplicative weight based on teacherqualifications.
Adjustment factors1 -- Student characteristics
Grade level Coefficients varyaccording to 4 gradegroupings (1-4, 5-8,9-10, 11-12).
Special needs student Funded for beingtaught in smallerclasses.
Coefficients rangefrom 1.8 to 5.0depending on type ofdisability, requiredspecial classes, andgrade level.
Additional weightsrange from 1.4 to 3.6for students withmoderate learningdifficulties, blind ordisabled students,
deaf students orthose with severelearning difficulties.
Adult student Coefficient rangesfrom 0.5 to 1.4depending on grade.
Enters directly intoformula at weight of0.7 in public, 0.35 innon-public school.
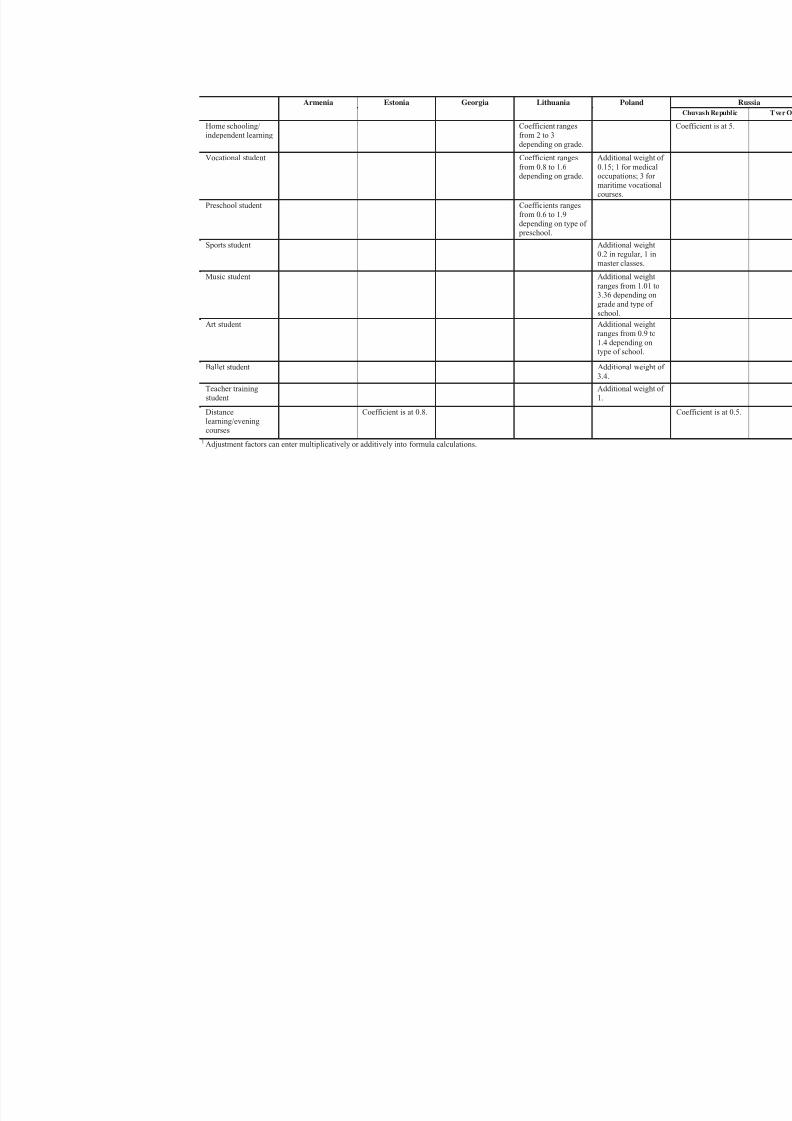
8/6/2019 Reforming Education Finance in Transition Countries
http://slidepdf.com/reader/full/reforming-education-finance-in-transition-countries 330/335
Armenia Estonia Georgia Lithuania Poland
Home schooling/
independent learning
Coefficient ranges
from 2 to 3depending on grade.
Vocational student Coefficient ranges
from 0.8 to 1.6depending on grade.
Additional weight of
0.15; 1 for medicaloccupations; 3 for
maritime vocationalcourses.
Preschool student Coefficients ranges
from 0.6 to 1.9
depending on type of preschool.
Sports student Additional weight
0.2 in regular, 1 in
master classes.
Music student Additional weight
ranges from 1.01 to3.36 depending on
grade and type of
school.
Art student Additional weight
ranges from 0.9 to
1.4 depending ontype of school.
Ballet student Additional weight of
3.4.
Teacher training
student
Additional weight of
1.
Distancelearning/eveningcourses
Coefficient is at 0.8.
1Adjustment factors can enter multiplicatively or additively into formula calculations.
8/6/2019 Reforming Education Finance in Transition Countries
http://slidepdf.com/reader/full/reforming-education-finance-in-transition-countries 331/335
Reforming Education Finance in Transition Countries 307
Notes
1. I have benefied from many exchanges and conversations with the authors of each of the coun-
try case studies during the period I led this project. Special thanks go also to Juan Diego Alonso
and Alonso Sánchez for having taken over the project of the book and for thoroughly reviewing
this chapter in order to help me sharpen some of the key arguments and conclusions, includingthe addition of some tables that were useful to make the chapter visually friendlier. A final thanks
should also go to Jan Herczyński for substantially commenting on a first draft of this report and for
contributing the box on piloting the reform. Needless to say, all mistakes, errors of interpretation
and judgment are my sole responsibility.
2. In ECA parlance, the notion of “minimum standards,” often referring to subjects and hours of
teaching as well as other inputs, bears close resemblance to the activity-based model being de-
scribed.
3. It should be noted here that in the case of Armenia, school budgets flow through regional decon-
centrated offi ces of the Ministry of Education and Science.
4. Initially, during the pilot phase, this group of protected schools applied to those with less than
100 students enrolled. Later, as the PCF reform was rolled out nationwide, remote and border areaschools, which tend to have low enrolment, were also considered protected.
5. The first phase of the Education Sector Reform Program was supported by the World Bank-
financed Education Quality and Relevance Project. In parallel, conditionalities under a series of
structural adjustment and poverty reduction support credits facilitated the implementation of
teacher redundancy.
6. Diff erences in cost of living in diff erent gminas were not taken into account due to lack of data
and this would probably explain part of the diff erences in expenditure per student that are related
to gminas’ revenues.
7. Prior to the implementation of the decentralization reform, kuratoria were regional entities re-
sponsible both for financing as well as quality of education.

8/6/2019 Reforming Education Finance in Transition Countries
http://slidepdf.com/reader/full/reforming-education-finance-in-transition-countries 332/335

8/6/2019 Reforming Education Finance in Transition Countries
http://slidepdf.com/reader/full/reforming-education-finance-in-transition-countries 333/335
8/6/2019 Reforming Education Finance in Transition Countries
http://slidepdf.com/reader/full/reforming-education-finance-in-transition-countries 334/335
ECO-AUDITEnvironmental Bene fi ts Statement
The World Bank is commied to preserving
endangered forests and natural resources.
The Offi ce of the Publisher has chosen to
print World Bank Studies and Working
Papers on recycled paper with 30 percent
postconsumer fi ber in accordance with the
recommended standards for paper usage
set by the Green Press Initiative, a non-
profit program supporting publishers in
using fi ber that is not sourced from endan-
gered forests. For more information, visit
www.greenpressinitiative.org.
In 2010, the printing of
this book on recycled paper
saved the following:
• 11 trees*
• 3 million Btu of total
energy
• 1,045 lb. of net greenhouse
gases
• 5,035 gal. of waste water
• 306 lb. of solid waste
* 40 feet in height and 6–8
inches in diameter

8/6/2019 Reforming Education Finance in Transition Countries
http://slidepdf.com/reader/full/reforming-education-finance-in-transition-countries 335/335