Embed Size (px)
Citation preview

University of Central Florida University of Central Florida
STARS STARS
Electronic Theses and Dissertations, 2004-2019
2005
Refractive Indices Of Liquid Crystals And Their Applications In Refractive Indices Of Liquid Crystals And Their Applications In
Display And Photonic Devices Display And Photonic Devices
Jun Li University of Central Florida
Part of the Electromagnetics and Photonics Commons, and the Optics Commons
Find similar works at: https://stars.library.ucf.edu/etd
University of Central Florida Libraries http://library.ucf.edu
This Doctoral Dissertation (Open Access) is brought to you for free and open access by STARS. It has been accepted
for inclusion in Electronic Theses and Dissertations, 2004-2019 by an authorized administrator of STARS. For more
information, please contact [email protected].
STARS Citation STARS Citation Li, Jun, "Refractive Indices Of Liquid Crystals And Their Applications In Display And Photonic Devices" (2005). Electronic Theses and Dissertations, 2004-2019. 4460. https://stars.library.ucf.edu/etd/4460

REFRACTIVE INDICES OF LIQUID CRYSTALS AND THEIR APPLICATIONS IN DISPLAY AND PHOTONIC DEVICES
by
JUN LI BS in Mechanical Engineering, Tsinghua University, 1997
MS in Control Engineering, Tsinghua University, 2001
A dissertation submitted in partial fulfillment of the requirements
for the degree of Doctor of Philosophy in the College of Optics and Photonics
at the University of Central Florida Orlando, Florida
Fall Term 2005
Major Professor: Shin-Tson Wu

ii
© 2005 Jun Li

iii
ABSTRACT
Liquid crystals (LCs) are important materials for flat panel display and photonic
devices. Most LC devices use electrical field-, magnetic field-, or temperature-induced
refractive index change to modulate the incident light. Molecular constituents,
wavelength, and temperature are the three primary factors determining the liquid crystal
refractive indices: en and on for the extraordinary and ordinary rays, respectively. In this
dissertation, we derive several physical models for describing the wavelength and
temperature effects on liquid crystal refractive indices, average refractive index, and
birefringence. Based on these models, we develop some high temperature gradient
refractive index LC mixtures for photonic applications, such as thermal tunable liquid
crystal photonic crystal fibers and thermal solitons.
Liquid crystal refractive indices decrease as the wavelength increase. Both en and
on saturate in the infrared region. Wavelength effect on LC refractive indices is
important for the design of direct-view displays. In Chapter 2, we derive the extended
Cauchy models for describing the wavelength effect on liquid crystal refractive indices in
the visible and infrared spectral regions based on the three-band model. The three-
coefficient Cauchy model could be used for describing the refractive indices of liquid
crystals with low, medium, and high birefringence, whereas the two-coefficient Cauchy
model is more suitable for low birefringence liquid crystals. The critical value of the
birefringence is 12.0≈∆n .

iv
Temperature is another important factor affecting the LC refractive indices. The
thermal effect originated from the lamp of projection display would affect the
performance of the employed liquid crystal. In Chapter 3, we derive the four-parameter
and three-parameter parabolic models for describing the temperature effect on the LC
refractive indices based on Vuks model and Haller equation. We validate the empirical
Haller equation quantitatively. We also validate that the average refractive index of liquid
crystal >< n decreases linearly as the temperature increases. Liquid crystals exhibit a
large thermal nonlinearity which is attractive for new photonic applications using
photonic crystal fibers. We derive the physical models for describing the temperature
gradient of the LC refractive indices, dTdne / and dTdno / , based on the four-parameter
model. We find that LC exhibits a crossover temperature oT at which dTdno / is equal to
zero. The physical models of the temperature gradient indicate that en , the extraordinary
refractive index, always decreases as the temperature increases since dTdne / is always
negative, whereas on , the ordinary refractive index, decreases as the temperature
increases when the temperature is lower than the crossover temperature ( 0/ <dTdno
when the temperature is lower than oT ) and increases as the temperature increases when
the temperature is higher than the crossover temperature ( 0/ >dTdno when the
temperature is higher than oT ).
Measurements of LC refractive indices play an important role for validating the
physical models and the device design. Liquid crystal is anisotropic and the incident
linearly polarized light encounters two different refractive indices when the polarization
is parallel or perpendicular to the optic axis. The measurement is more complicated than

v
that for an isotropic medium. In Chapter 4, we use a multi-wavelength Abbe
refractometer to measure the LC refractive indices in the visible light region. We
measured the LC refractive indices at six wavelengths, λ=450, 486, 546, 589, 633 and
656 nm by changing the filters. We use a circulating constant temperature bath to control
the temperature of the sample. The temperature range is from 10 to 55 oC. The refractive
index data measured include five low-birefringence liquid crystals, MLC-9200-000,
MLC-9200-100, MLC-6608 ( 2.4−=∆ε ), MLC-6241-000, and UCF-280 ( 4−=∆ε );
four middle-birefringence liquid crystals, 5CB, 5PCH, E7, E48 and BL003; four high-
birefringence liquid crystals, BL006, BL038, E44 and UCF-35, and two liquid crystals
with high dTdno / at room temperature, UCF-1 and UCF-2. The refractive indices of E7
at two infrared wavelengths λ=1.55 and 10.6 µm are measured by the wedged-cell
refractometer method. The UV absorption spectra of several liquid crystals, MLC-9200-
000, MLC-9200-100, MLC-6608 and TL-216 are measured, too. In section 6.5, we also
measure the refractive index of cured optical films of NOA65 and NOA 81 using the
multi-wavelength Abbe refractometer.
In Chapter 5, we use the experimental data measured in Chapter 4 to validate the
physical models we derived, the extended three-coefficient and two-coefficient Cauchy
models, the four-parameter and three-parameter parabolic models. For the first time, we
validate the Vuks model using the experimental data of liquid crystals directly. We also
validate the empirical Haller equation for the LC birefringence n∆ and the linear
equation for the LC average refractive index >< n .
The study of the LC refractive indices explores several new photonic applications
for liquid crystals such as high temperature gradient liquid crystals, high thermal tunable
vi
liquid crystal photonic crystal fibers, the laser induced 2D+1 thermal solitons in nematic
crystals, determination for the infrared refractive indices of liquid crystals, comparative
study for refractive index between liquid crystals and photopolymers for polymer
dispersed liquid crystal (PDLC) applications, and so on. In Chapter 6, we introduce these
applications one by one. First, we formulate two novel liquid crystals, UCF-1 and UCF-2,
with high dTdno / at room temperature. The dTdno / of UCF-1 is about 4X higher than
that of 5CB at room temperature. Second, we infiltrate UCF-1 into the micro holes
around the silica core of a section of three-rod core PCF and set up a highly thermal
tunable liquid crystal photonic crystal fiber. The guided mode has an effective area of
440 µm2 with an insertion loss of less than 0.5dB. The loss is mainly attributed to
coupling losses between the index-guided section and the bandgap-guided section. The
thermal tuning sensitivity of the spectral position of the bandgap was measured to be 27
nm/°C around room temperature, which is 4.6 times higher than that using the
commercial E7 LC mixture operated at a temperature above 50 oC. Third, the novel liquid
crystals UCF-1 and UCF-2 are preferred to trigger the laser-induced thermal solitons in
nematic liquid crystal confined in a capillary because of the high positive temperature
gradient at room temperature. Fourth, we extrapolate the refractive index data measured
at the visible light region to the near and far infrared region basing on the extended
Cauchy model and four-parameter model. The extrapolation method is validated by the
experimental data measured at the visible light and infrared light regions. Knowing the
LC refractive indices at the infrared region is important for some photonic devices
operated in this light region. Finally, we make a completely comparative study for
refractive index between two photocurable polymers (NOA65 and NOA81) and two

vii
series of Merck liquid crystals, E-series (E44, E48, and E7) and BL-series (BL038,
BL003 and BL006) in order to optimize the performance of polymer dispersed liquid
crystals (PDLC). Among the LC materials we studied, BL038 and E48 are good
candidates for making PDLC system incorporating NOA65. The BL038 PDLC cell
shows a higher contrast ratio than the E48 cell because BL038 has a better matched
ordinary refractive index, higher birefringence, and similar miscibility as compared to
E48. Liquid crystals having a good miscibility with polymer, matched ordinary refractive
index, and higher birefringence help to improve the PDLC contrast ratio for display
applications.
In Chapter 7, we give a general summary for the dissertation.

viii
To my beloved parents and sister

ix
ACKNOWLEDGMENTS
I would like to express my great thanks for those who contributed and supported
throughout my graduate studies at the College of Optics and Photonics/CREOL & FPCE
before I complete my thesis. First of all, great thanks go to my thesis advisor, Professor
Shin-Tson Wu who gives me wise guidance and careful instructions during the four years
pasted. From him, I learn how to solve the difficulties and accomplish challenging
research subjects. He instructs me how to think independently and creatively. From him, I
also learned how to be a righteous person and how to treat other people well aside from
science. Dr. Wu gave me meticulous care and love in my life. Without his help, the
dissertation could not be fulfilled.
I am indebted to my beloved parents and elder sister for their love and support all
along. Without their love, the thesis could not be fulfilled too.
I would like to thank for my dissertation committee members, Professors Guifang
Li, George Stegeman and Thomas Wu, for their kindly help and invaluable suggestions
during my PhD study.
I am indebted to Mrs. Choyan Wu for her meticulous care and love during my
four year PhD study in Orlando.
I appreciate very much for the kindly help from Drs. Sebastian Gauza, Hongwen
Ren, Robert Lu, Kit Choi, Qionghua Wang, Marenori Kawamura, Haiqing Xianyu,
Yuhua Huang and Ju-Hyun Lee.

x
I would like to thank my cooperators, Dr. Thomas Tanggaard Alkeskjold in COM
center, Technical University of Danmark, Lyngby Denmark and Dr. Stefano Brugioni in
Istituto Nazionale di Ottica Applicata, Firenze Italy for the nice cooperations during my
PhD study.
Finally, I would like to express my appreciations to all other colleagues in the
Photonics and Display group in Orlando.

xi
TABLE OF CONTENTS
LIST OF FIGURES ......................................................................................................... xiv
LIST OF TABLES......................................................................................................... xxiii
LIST OF ABBREVIATIONS....................................................................................... xxvii
LIST OF PUBLICATIONS ......................................................................................... xxviii
CHAPTER 1: INTRODUCTION....................................................................................... 1
1.1 Motivation................................................................................................................. 1
1.2 Liquid crystals........................................................................................................... 6
1.3 Refractive indices of liquid crystals........................................................................ 11
1.4 Photonic crystal fibers............................................................................................. 16
CHAPTER 2: WAVELENGTH EFFECT ON LIQUID CRYSTAL REFRACTIVE
INDICES........................................................................................................................... 20
2.1 Introduction............................................................................................................. 20
2.2 Three-band Model................................................................................................... 22
2.3 Extended Cauchy Model......................................................................................... 24
2.4 Two-coefficient Cauchy Model .............................................................................. 28
2.5 Conclusion .............................................................................................................. 30
CHAPTER 3: TEMPERATURE EFFECT ON LIQUID CRYSTAL REFRACTIVE
INDICES........................................................................................................................... 31
3.1 Introduction............................................................................................................. 31
3.2 Vuks Equation and the Expansioins ....................................................................... 34

xii
3.3 Validation of Vuks Equation .................................................................................. 43
3.4 Four-parameter Model ............................................................................................ 45
3.5 Three-parameter Parabolic Model .......................................................................... 46
3.6 Temperature Gradient dno/dT and dne/dT ............................................................... 46
3.7 Conclusion .............................................................................................................. 49
CHAPTER 4: MEASUREMENTS................................................................................... 50
4.1 Introduction............................................................................................................. 50
4.2 Measurement of liquid crystal refractive indices at visible light spectrum ............ 52
4.3 Measurement of liquid crystal refractive indices at infrared light spectrum .......... 60
4.4 Measurement of UV absorption spectra ................................................................. 64
4.5 Summary ................................................................................................................. 66
CHAPTER 5: EXPERIMENTAL VALIDATIONS OF THE DERIVED
THEORETICAL MODEL................................................................................................ 67
5.1 Extended and two-coefficient Cauchy models ....................................................... 67
5.2 Valication of Vuks Model....................................................................................... 75
5.3 Valication of Four-parameter Model and Three-parameter Parabolic Model ........ 83
5.3.1 Validation of the Four-parameter Model ......................................................... 83
5.3.2 Validation of the Three-parameter parabolic Model ....................................... 91
5.4 Summary ................................................................................................................. 93
CHAPTER 6: APPLICATIONS IN DISPLAY AND PHOTONIC DEVICES............... 94
6.1 High Temperature-gradient Refractive Index Liquid Crystals ............................... 95
6.2 Highly Thermal Tunable Liquid Crystal Photonic Crystal Fibers........................ 104
6.3 Thremal Solitons in nematic Liquid Crystals ....................................................... 114

xiii
6.4 Infrared Refractive Indices of Liquid Crystals ..................................................... 115
6.5 Refractive Index Matching between Liquid Crystal and Photopolymers for
Polymer Dispersed Liquid Crystal (PDLC) Application............................................ 126
6.5.1 Introduction.................................................................................................... 126
6.5.2 Refractive Index Measurements for Photopolymers and Liquid Crystals ..... 127
6.5.3 Refractive Index Comparison ........................................................................ 137
6.5.4 PDLC Cell Fabrication and Measurements ................................................... 142
6.5.5 Results and Discussions................................................................................. 144
6.5.6 Conclusion ..................................................................................................... 149
CHAPTER 7: GENERAL SUMMARY......................................................................... 150
7.1 Development of Physical Models for Explaining the Wavelength Effect on Liquid
Crystal Refractive Indices........................................................................................... 150
7.2 Development of Physical Models for Explaining the Temperature Effect on Liquid
Crystal Refractive Indices........................................................................................... 151
7.3 Validation of Vuks Model .................................................................................... 152
7.4 Developments of Physical Models for the Temperature Gradient of LC refractive
indices and Guidelines for Formulating High dno/dT Liquid Crystals ....................... 152
7.5 High Thermally Tunable Liquid Crystal Photonic Crystal Fibers and Thermal
Solitons in Nematic Liquid Crystals ........................................................................... 154
7.6 Infrared Refractive Indices of Liquid Crystal....................................................... 155
7.7 Index-matched Polymer-dispersed Liquid Crystals (PDLC)................................ 155
LIST OF REFERENCES................................................................................................ 157

xiv
LIST OF FIGURES
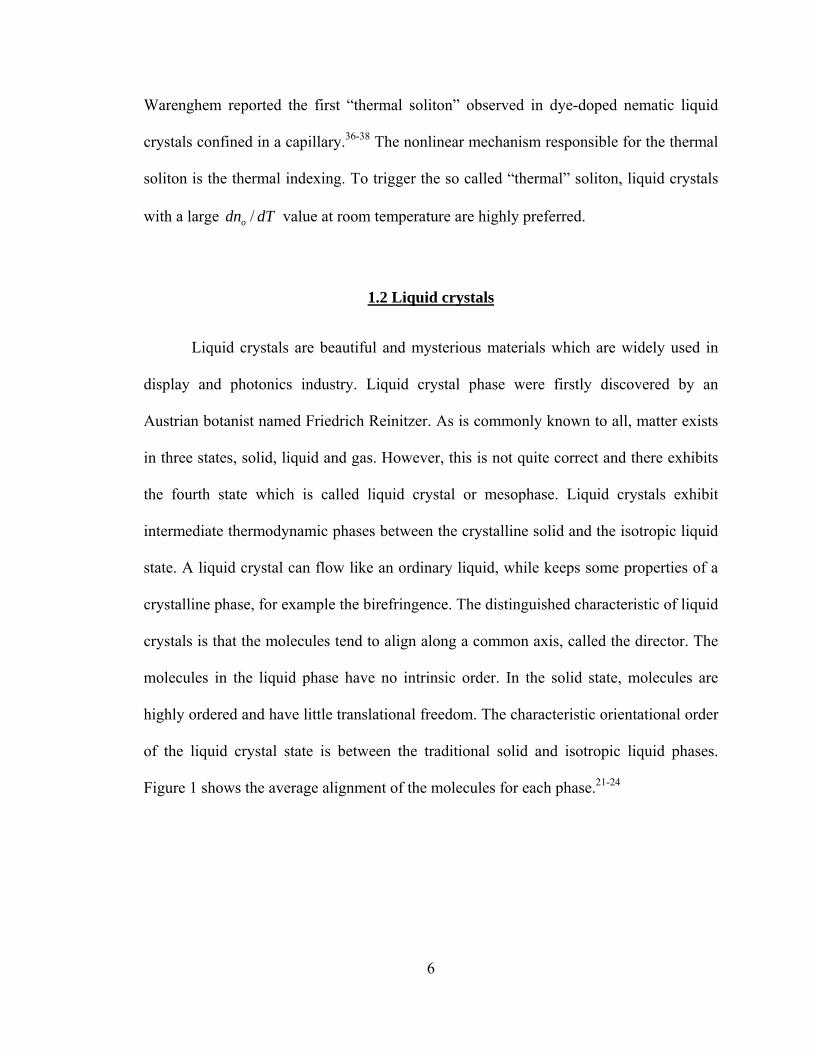
Figure 1: The average alignment of the molecules for solid, anisotropic liquid crystal and
isotropic liquid phases................................................................................................. 7
Figure 2: Three thermotropic liquid crystals: nematic, smectic and chlesteric. ................. 8
Figure 3: The structure of a high-index photonic crystal fiber. ........................................ 17
Figure 4: The multiwavelength Abbe refractometer (Atago: DR-M4) including a
circulating constant bath and six interference color filters. ...................................... 53
Figure 5: The experimental apparatus for measuring the refractive indexes at IR laser
wavelengths. 1) Laser source. 2) Optical fiber. 3) Beam collimator. 4) Polarizer. 5)
Thermostat containing the wedged LC cell. 6) Extraordinary beam. 7) Ordinary
beam. 8) Micrometric track. 9) Point-like detector. 10) Digital oscilloscope. 11)
Temperature controller. L1 and L2 are two con-focal lenses acting as a beam
condenser. ................................................................................................................. 61
Figure 6: UV absorption spectrum of 1 wt % MLC-9200-000, MLC-9200-000, MLC-
6608, and TL-216 dissolved in a UV transparent MLC-6815 mixture. Measurement
was made at T=23 oC. The dashed, dashed-dot, black solid, and grey solid lines are
UV absorption spectra of MLC-9200-000, MLC-9200-100, MLC-6608, and TL-216,
respectively. Cell gap d=6 µm. ................................................................................. 65
Figure 7: Wavelength-dependent refractive indices of MLC-9200-000 and MLC-9200-
100 at T= 25 oC. Open and filled circles and triangles, respectively, represent the
experimental data for ne and no of MLC-9200-000 and MLC-9200-100. Solid and

xv
dashed lines are fittings by using the three-coefficient, Eqs. (2-7) and (2-8) and the
two-coefficient, Eqs. (2-21) and (2-22) Cauchy models, respectively. The fitting
parameters are listed in Table 11. ............................................................................. 68
Figure 8: Wavelength-dependent refractive indices of MLC-9200-000 and MLC-9200-
100 at T= 25 oC. Open and filled circles and triangles, respectively, represent the
experimental data for ne and no of MLC-9200-000 and MLC-9200-100. Solid and
dashed lines are fittings by using the three-coefficient, Eqs. (2-7) and (2-8) and the
two- coefficient, Eqs. (2-21) and (2-22) Cauchy models, respectively. The fitting
parameters are listed in Table 11. ............................................................................. 71
Figure 9: Wavelength-dependent refractive indices of E44, E7, 5CB, 5PCH and MLC-
6241-000 at T=25 oC. The open and filled pentagons, circles, triangles, upward- and
downward-triangles represent the experimental data of ne and no for E44, E7, 5CB,
5PCH, and MLC-6241-000, respectively. While solid and dashed lines are fittings
using the three-coefficient Eqs. (2-18) and (2-19) and two-coefficient Eqs. (2-21)
and (2-22) Cauchy models, respectively. The fitting parameters are listed in Table
11............................................................................................................................... 73
Figure 10: Temperature-dependent birefringence (∆n) of UCF-35 (filled circles), 5CB
(open squares), 5PCH (open circles), MLC-6241-000 (filled downward-triangles)
and UCF-280 (open upward-triangles) at λ=589 nm. The five solid lines are fitting
curves using β)/1()( co TTnn −∆=∆ , where Tc is the clearing point. ...................... 76
Figure 11: Validation of Eq. (3-50) using the experimental data of 5CB and 5PCH. Filled
squares, circles and upward-triangles are the calculated values of 22 +>< n at
λ=546, 589 and 633 nm, respectively. Open squares, circles and upward-triangles

xvi
are the corresponding values of 5.010 −>< n . Solid lines are fitting results using
Eq. (5-1). ................................................................................................................... 78
Figure 12: Validation of Eq. (3-50) using the experimental data of UCF-35, UCF-280,
and MLC-6241-000. Filled squares, circles and upward-triangles are the calculated
values of 22 +>< n at λ=656 nm for UCF-35, MLC-6241-000 and UCF-280,
respectively. Open squares, circles and upward-triangles are the calculated values of
the corresponding values of 5.010 −>< n . Solid lines are fitting results using Eq.
(5-1)........................................................................................................................... 79
Figure 13: Temperature-dependent molecular polarizabilites, αe and αo, of 5CB at λ=589
nm. Open and filled circles are the results for αe and αo, respectively. Triangles
represent the average polarizability <α>. In the isotropic phase, αe= αo. ............... 82
Figure 14: Temperature-dependent average refractive index <n> of 5CB, 5PCH, MLC-
6241-000 and UCF-35 at λ=589 nm. Open circles, upward-triangles, squares and
downward-triangles are average refractive index <n> of 5CB, 5PCH, MLC-6241-
000 and UCF-35, respectively. Solid lines are fittings by using Eq. (3-36). The
fitting parameters are listed in Table 12. The filled circles and triangles are isotropic
refractive index for 5CB and 5PCH, respectively. .................................................. 85
Figure 15: Temperature-dependent refractive indices of 5CB at λ= 546, 589 and 633 nm.
Squares, circles and triangles are experimental data for refractive indices measured
at λ=546, 589 and 633 nm, respectively. Solid lines are fittings using the 4-
parameter model Eqs., (3-51) and (3-52). The fitting parameters are listed in Table
13............................................................................................................................... 87

xvii
Figure 16: Temperature-dependent refractive indices of 5PCH at λ= 546, 589 and 633
nm. Squares, circles and triangles are experimental data for refractive indices
measured at λ= 546, 589 and 633 nm, respectively. Solid lines are fittings using the
4-parameter model, Eqs. (3-51) and (3-52). The fitting parameters are listed in Table
14............................................................................................................................... 88
Figure 17: Temperature-dependent refractive indices of UCF-35 and MLC-6241-000 at
λ= 589 nm. Squares and circles are experimental data for refractive indices of UCF-
35 and MLC-6241-000, respectively. Solid lines are fittings using the four-
parameter model, Eqs. (3-51) and (3-52). Dashed lines are fittings using the three-
parameter parabolic model, Eqs. (3-53) and (3-54). The fitting parameters for the
two models are listed in Tables 12 and 15, respectively.......................................... 90
Figure 18: Temperature-dependent refractive indices of UCF-1 and 6CB at λ=589 nm.
Red circles and black triangles are refractive indices of UCF-1 and 6CB,
respectively. Solid lines are fittings using Eqs. (3-51) and (3-52). The fitting
parameters are listed in Table 18. ............................................................................. 97
Figure 19: Temperature-dependent refractive indices of UCF-2 and 5CB at λ=589 nm.
Magenta circles and blue triangles are refractive indices of UCF-2 and 5CB,
respectively, and solid lines are fitting results using Eqs. (3-51) and (3-52). The
fitting parameters are listed in Table 18. ................................................................. 99
Figure 20: Temperature-dependent average refractive index of UCF-1, UCF-2, 6CB and
5CB at λ=589 nm. Circles represent experimental data and solid lines are fitting
results using Eq. (3-36). The fitting parameters A and B for these four materials are
listed in Table 18..................................................................................................... 100

xviii
Figure 21: Temperature-dependent birefringence of UCF-1, UCF-2, 6CB and 5CB at
λ=589 nm. Red, Magenta, black and blue circles represent experimental data while
solid lines are fitting results using Eq. (3-43). The fitting parameters 0)( n∆ and β
are listed in Table 18.............................................................................................. 101
Figure 22: Temperature-dependent dTdno / of UCF-1, UCF-2, 6CB, 5CB, and 5PCH at
λ=589 nm. Red, magenta, black, blue and green solid lines represent the calculated
dTdno / curves for UCF-1, UCF-2, 6CB, 5CB, and 5PCH, respectively, while the
dashed lines represent the calculated dTdne /− curves. The parameters B, 0)( n∆
and β used in the calculations are listed in Table 18............................................ 102
Figure 23: Transmission spectrum for the three-rod core PCF, where the air holes has
been filled for 10mm of the length with the nematic liquid crystal E7 (Merck,
Darmstadt, Germany). Inset shows an optical micrograph of the PCF end facet.
Hole diameter and inter hole distance is 2.9µm and 11.2µm, respectively. .......... 107
Figure 24: Temperature dependent transmission spectra for the three-rod core PCF, where
the air holes have been filled for 10mm of the length with UCF-1. ....................... 109
Figure 25: Wavelength- and temperature-dependent refractive indices en and on of UCF-
1 at T=25 oC and 27.5 oC. Circles and rectangles are measured refractive indices at
λ=450, 486, 546, 589, 633, and 656 nm and at T=25 oC and 27.5 oC, respectively.
Solid and dashed curves are fitting curves using the extended Cauchy equation, Eqs.
(2-7) and (2-8).The fitting curves are extrapolated to the infrared region based on the
experimental data measured in the visible spectral region. .................................... 110
xix
Figure 26: Transmission spectrum of the UCF-1 filled PCF (solid line) and simulated
coupling loss (dotted line) from the index-guiding to the bandgap-guiding part of the
PCF. Insets show an index-guided mode and PBG guided modes at the bandgap
center and edge. ..................................................................................................... 111
Figure 27: dTdno / and dTdne /− for E7 and UCF-1 calculated at λ=589nm............. 113
Figure 28: Temperature-dependent refractive indices of E7 at λ= 589 nm. The open
squares and circles represent the en and on measured at λ=589 nm using the multi-
wavelength Abbe refractometer. The open upward triangles are average refractive
index n calculated by the experimental data. The solid curves are the fittings using
the four- parameter model [Eqs. (3-51) and (3-52)]. The fitting parameters
[ A , B , 0)( n∆ , β ] are [1.7546, 5.36x10⁻⁴, 0.3768, 0.2391]. The solid straight line is
the fitting using Eq. (3-36). The fitting parameters [ A , B ] are [1.7546, 5.36x10⁻⁴].
................................................................................................................................. 117
Figure 29: Wavelength-dependent refractive indices of E7 at T = 25 oC. The open squares
and circles are the en and on of E7 measured in the visible spectrum. The solid
curves are the fittings to the experimental data using the extended Cauchy model
[Eqs. (2-7) and (2-8)]. The fitting parameters are listed in Table 19. The downward
and upward triangles are en and on of E7 measured at T =25 oC and λ=1.55 and
10.6 µm, respectively.............................................................................................. 120
Figure 30: Temperature-dependent refractive indices of E7 at λ=1.55 µm. The filled
circles are the refractive indices en and on measured by the wedged LC cell
method. The filled-triangles are the average refractive index <n> calculated by the

xx
experimental data. The open circles are the en and on extrapolated from the
experimental data measured at visible spectrum using the extended Cauchy model.
The open triangles are average refractive index <n> calculated by the extrapolated
en and on . The solid curves are the fittings using Eqs. (3-51) and (3-52). The solid
straight line is the fitting using Eq. (3-36). The fitting parameters are listed in Table
20............................................................................................................................. 122
Figure 31: Temperature-dependent refractive indices of E7 at λ=10.6 µm. The filled
circles are the refractive indices en and on measured by the wedged LC cell
refractometer method. The filled-triangles are the average refractive index n
calculated by the experimental data. The open circles represent the en and on
extrapolated from the experimental data measured at visible spectrum using the
extended Cauchy model. The open triangles are the average refractive index n
calculated by the extrapolated en and on . The solid curves are the fittings using
Eqs. (3-51) and (3-52). The solid straight line is the fitting using Eq. (3-36). The
fitting parameters are listed in Table 20. ................................................................ 124
Figure 32: The experimental setup for measuring the refractive index of cured polymer
films: NOA65 and NOA81. .................................................................................... 129
Figure 33: Wavelength- and temperature-dependent refractive index of cured NOA65.
The squares, circles, upward-triangles, downward-triangles, diamonds, and
pentagons represent the measured refractive index of NOA65 at λ=450, 486, 546,
589, 633 and 656 nm, respectively. Solid lines are fittings using Eq. (3-36) and the
fitting parameters are listed in Table 22. ............................................................... 131

xxi
Figure 34: Wavelength- and temperature-dependent refractive index of cured NOA81.
The squares, circles, upward-triangles, downward-triangles, diamonds, and
pentagons represent the measured refractive index of NOA81 at λ=450, 486, 546,
589, 633 and 656 nm, respectively. Solid lines are fittings using Eq. (3-36) and the
fitting parameters are listed in Table 22. ............................................................... 134
Figure 35: Wavelength dependent refractive index of NOA65 and the ordinary refractive
index of E48, E44 and E7 at T=20 oC. The open squares, upward-triangles and filled
circles, downward-triangles are the measured refractive index of E48, E44, NOA65
and E7, respectively. The solid lines represent the fittings using the extended
Cauchy model [Eqs. (2-7) and (2-8)]. The fitting parameters are listed in Table 28.
................................................................................................................................. 139
Figure 36: Wavelength dependent refractive index of NOA65 and the ordinary refractive
index of BL038, BL006, and BL003 at T=20 oC. The open squares, upward-
triangles and filled circles, downward-triangles are the measured refractive index of
BL038, BL006, NOA65 and BL003, respectively. The solid lines represent the
fittings using the extended Cauchy model [Eqs. (2-7) and (2-8)]. The fitting
parameters are listed in Table 28. ........................................................................... 140
Figure 37: Wavelength dependent refractive index of NOA81 and the ordinary refractive
index of UCF-1 and UCF-2 at T=20 oC. The filled circles, open squares and upward-
triangles are the measured refractive index of NOA81, UCF-1 and UCF-2,
respectively. The solid lines represent the fittings using the extended Cauchy model
[Eqs. (2-7) and (2-8)]. The fitting parameters are listed in Table 28...................... 141
Figure 38: The experimental setup for measuring the transmittance of the PDLC cells.143

xxii
Figure 39: Voltage-dependent normalized transmittance of the BL038 and E48 PDLC
cells at λ=633 nm. For both cells, the LC:NOA65 ratio is 70:30. The two cells have
same thickness (d=8µm) and have no polyimide layer on the glass substrates...... 145
Figure 40: Wavelength dependent refractive index of NOA65 (circles) and the ordinary
refractive index of BL038 (squares) and E48 (triangles) at T=20 oC. The solid lines
represent the fittings using the extended Cauchy model [Eqs. (2-7) and (2-8)]. The
fitting parameters are listed in Table 28. ............................................................... 146
Figure 41: Wavelength dependent birefringence of BL038 (squares) and E48 (triangles)
at T=20 oC. The solid lines are fittings using the single-band model [Eq. (6-1)]. The
fitting parameters [G(µm-2), λ*(µm)] for BL038 and E48 are [3.509, 0.252] and
[3.210, 0.244], respectively..................................................................................... 148

xxiii
LIST OF TABLES
Table 1: The measured refractive indices (ne and no) of MLC-9200-000 at λ=450, 486,
546, 589, 633, and 656 nm at different temperatures. The data with an asterisk are
fitting values using the extended Cauchy equation, Eqs. (2-18) and (2-19) because
these values are too small to measure from our Abbe refractometer....................... 53
Table 2: The measured refractive indices (ne and no) of MLC-9200-100 at λ=450, 486,
546, 589, 633, and 656 nm at different temperatures. The data with an asterisk are
fitting values using the extended Cauchy equation, Eqs. (2-18) and (2-19) because
these values are too small to measure from our Abbe refractometer....................... 54
Table 3: The measured refractive indices (ne and no) of MLC-6608 at λ=450, 486, 546,
589, 633, and 656 nm at different temperatures. The data with an asterisk are fitting
values using the extended Cauchy equation, Eqs. (2-18) and (2-19) because these
values are too small to measure from our Abbe refractometer. ............................... 54
Table 4: The measured refractive indices (ne and no) of TL-216 at λ=450, 486, 546, 589,
633, and 656 nm at different temperature................................................................. 55
Table 5: The measured refractive indices (ne and no) of E44 at λ=450, 486, 546, 589, 633,
and 656 nm at different temperatures. ...................................................................... 55
Table 6: The measured refractive indices (ne and no) of E7 at λ=450, 486, 546, 589, 633,
and 656 nm at different temperature......................................................................... 56

xxiv
Table 7: Measured refractive indices ( en and on ) of 5CB at λ=546, 589, and 633 nm,
and at different temperatures. ................................................................................... 57
Table 8: Measured refractive indices ( en and on ) of 5PCH at λ=546, 589, and 633 nm,
and at different temperatures. ................................................................................... 58
Table 9: Measured refractive indices ( en and on ) of MLC-6241-000 at λ=589, 633 and
656 nm, and at different temperatures. ..................................................................... 59
Table 10: Measured refractive indices ( en and on ) of E7 at λ=1.55 and 10.6 µm, at
different temperatures. .............................................................................................. 63
Table 11: The fitting parameters of MLC-9200-000, MLC-9200-100, MLC-6608, TL-216,
E44, E7, 5CB, 5PCH, and MLC-6241-000 for the three- and two-coefficient Cauchy
models. T=25 oC. The Cauchy coefficients B and C are in units of µm2 and µm4,
respectively. .............................................................................................................. 70
Table 12: Fitting parameters for the average refractive index >< n and
birefringence )( n∆ of four LCs at λ=589 nm........................................................... 86
Table 13: Fitting parameters for the average refractive index >< n and
birefringence )( n∆ of 5CB at λ=546, 589 and 633 nm. ........................................... 88
Table 14: Fitting parameters for the average refractive index >< n and
birefringence )( n∆ of 5PCH at λ=546, 589 and 633 nm......................................... 89
Table 15: Fitting parameters for the 3-parameter parabolic model, Eqs.(3-53) and (3-54).
................................................................................................................................... 92

xxv
Table 16: Molecular structures and phase transition temperatures (PTT) of the
compounds used for formulating mixtures. Here, Cr, N, S and I stand for crystalline,
nematic, smectic, and isotropic phase, respectively. ................................................ 96
Table 17: Physical properties of UCF-1 and UCF-2. n∆ was measured at λ = 589 nm
and T =23 oC............................................................................................................. 96
Table 18: Fitting parameters for the average refractive index <n> and birefringence (∆n)
of the five LCs studied: UCF-1, 6CB, UCF-2, 5CB and 5PCH at λ=589 nm.......... 98
Table 19: Fitting parameters for the extended Cauchy model [(Eqs. (2-7) and (2-8)] at
different temperatures (in oC) by using the experimental data measured at visible
wavelengths (in µm). .............................................................................................. 118
Table 20: Fitting parameters for the average refractive index n and birefringence )( n∆
of E7 at λ=1.55 and 10.6 µm calculated by the extrapolated refractive indices from
the visible spectrum. .............................................................................................. 123
Table 21: The measured refractive index of cured NOA65 film at λ=450, 486, 546, 589,
633, and 656 nm at different temperatures. ............................................................ 132
Table 22: The fitting parameters for the refractive index [Eq. (3-36)] of NOA65 and
NOA81 at λ=450, 486, 546, 589, 633 and 656nm.................................................. 132
Table 23: The measured refractive index of cured NOA81 film at λ=450, 486, 546, 589,
633, and 656 nm at different temperatures. ............................................................ 133
Table 24: The measured refractive indices (ne and no) of E48 at λ = 450, 486, 546, 589,
633, and 656 nm at different temperatures. ............................................................ 135
Table 25: The measured refractive indices (ne and no) of BL038 at λ=450, 486, 546, 589,
633, and 656 nm at different temperature............................................................... 136

xxvi
Table 26: The measured refractive indices (ne and no) of BL006 at λ=450, 486, 546, 589,
633, and 656 nm at different temperature............................................................... 136
Table 27: The measured refractive indices (ne and no) of BL003 at λ=450, 486, 546, 589,
633, and 656 nm at different temperature............................................................... 137
Table 28: The fitting parameters for the refractive index [Eqs. (2-7) and (2-8)] of NOA65
and NOA81 and the ordinary refractive index of E48, E44, E7, BL038, BL006,
BL003, UCF-1 and UCF-2 at Τ= 20 oC.................................................................. 139

xxvii
LIST OF ABBREVIATIONS
LC liquid crystal
en extraordinary refractive index
on ordinary refractive index
RGB red, green and blue
LCPBGs liquid crystal photonic bandgap fibers
PDA personal digital assistant
LCoS liquid crystal on silicon
PCFs photonic crystal fibers
LCPCF liquid crystal filled photonic crystal fiber
M-TIR modified total internal refrlection
PBG photonic bandgap
PDLC polymer dispersed liquid crystal
ITO thin indium-tin-oxide
UV ultraviolet
IR infrared
HDTV high definition television
VOA variable optical attenuator
CRT cathode-ray tube
NCS Isothiocyanato

xxviii
LIST OF PUBLICATIONS
1. J. Li and S. T. Wu, “Extended Cauchy equations for the refractive indices of liquid
crystals”, J. Appl. Phys. 95, 896-901 (2004).
2. J. Li, S. Gauza and S. T. Wu, “High temperature-gradient refractive index liquid
crystals” Opt. Express 12, 2002-2010 (2004).
3. J. Li, S. Gauza, and S. T. Wu, “Temperature effect on liquid crystal refractive
indices”, J. Appl. Phys. 96, 19-24 (2004).
4. J. Li, and S. T. Wu, “Two-coefficient Cauchy model for low birefringence liquid
crystals”, J. Appl. Phys. 96, 170-174 (2004).
5. J. Li, and S. T. Wu, “Self-consistency of Vuks equations for liquid-crystal
refractive indices”, J. Appl. Phys. 96, 6253-6258 (2004).
6. T. T. Alkeskjold, J. L aegsgaard, A. Bjarklev, D. S. Hermann, J. Broeng, Jun Li,
and S. T. Wu, “All-optical modulation in dye-doped nematic liquid crystal photonic
bandgap fibers”, Opt. Express 12, 5857-5871 (2004)
7. J. Li, S. T. Wu, S. Brugioni, S. Faetti and R. Meucci “Infrared refractive indices of
liquid crystals”, J. Appl. Phys. 97, 073501 (2005).
8. C. H. Wen, S. Gauza, J. Li, H. Wang and S. T. Wu, “High-contrast homeotropic
alignment of difluoro-tolane liquid crystals”, Liquid crystals 32, 643-649 (2005).
9. J. Li, C. H. Wen, S.Gauza, R. Lu and S. T. Wu, “Refractive indices of liquid
crystals for display applications”, (Invited paper) IEEE Journal of Display
Technology 1, 51-61 (2005).

xxix
10. S. Gauza, J. Li, S. T. Wu, A. Spadlo, R. Dabrowski and Y. N. Tzeng, “High
birefringence and high resistivity isothiocyanates based nematic liquid crystal
mixtures”, Liquid crystals 32, 1077-1085 (August, 2005).
11. J. Li, G. Baird, Y. H. Lin, H. W. Ren and S. T. Wu, “Refractive index matching
between liquid crystals and photopolymers”, J. Society for Information Display 13,
(being published on November, 2005)
12. T. T. Alkeskjold, J. Laegsgaard, A. Bjarklev, D. S. Hermann, A. Anawati, J.
Broeng, J. Li, and S. T. Wu, “Optically tunable photonic bandgap fiber”, Optics
and photonics news 16, (Dec. 2005).
13. T. T. Alkeskjold, J. Laegsgaard, A. Bjarklev, D. S. Hermann, J. Broeng, Jun Li, S.
Gauza and S. T. Wu, “Highly tunable large-core single-mode liquid crystal
photonic bandgap fiber”, Applied Optics, (Accepted, Sep. 2005).
CONFERENCE AND PRESENTATIONS
1. Jun Li and Shin-Tson Wu, “Wavelength and temperature effects on liquid crystal
refractive indices”, Material Research Society meeting (MRS, Fall 2004), Nov. 28 -
Dec. 3, 2004, Boston MA.
2. T. T. Alkeskjold, A. Bjarklev, D. S. Hermann, J. Broeng, Jun Li and S. T. Wu,
“Optical tuning of photonic bandgaps in dye-doped nematic liquid crystal photonic
crystal fibers”, Optical Fiber Communication (OFC) 2005 conference, March 6-11,
2005, Los Angeles, CA.
3. C. H. Wen, S. Gauza , Jun Li, H. Wang, S. T. Wu and X. Liang, “High contrast

xxx
homeotropic alignment of difluoro-tolane liquid crystals”, SID Tech. Digest 45.1,
1466-9 , May 22-27, 2005, Boston MA.
4. Jun Li, S. Gauza, S. T. Wu, T. T. Alkeskjold, J. Lægsgaard and A. Biarklev “High
temperature-gradient refractive index liquid crystals and their applications in a highly
thermal tunable photonic bandgap fiber”, The 11th International Topic Meeting on
Optics of liquid crystal conference (OLC), Oct. 2-7, 2005, Tampa, Florida USA.
5. Jun Li, Sebastian Gauza, Yi-Hsin Lin and S. T. Wu, “Origins of liquid crystal
refractive indices”, (Invited lecture) Proc. of the 3rd student-organizing international
mini-conference on information electronics system (SOIM-COE05), 103-106, Sendai,
Japan (Oct. 6-7, 2005).

1
CHAPTER 1: INTRODUCTION
1.1 Motivation
Liquid crystals are widely used in display and photonics industries due to their
unique electro-optic properties.1 In display areas, LC has been widely used in desktop
monitors, laptop computer, cell phones, personal digital assistant (PDA), digital watches,
front and rear projection displays, microdisplay, and so on.2-6 Recently, much more
attentions are paid to the study of high definition televisions (HDTVs).7,8 Penetrating into
the television market is so called the third wave of liquid crystal display (LCD). In
photonic devices, LC could be used in phase modulators, optical phased array (OPA),
variable optical attenuator (VOA), optical switching, optical interconnections, tunable
photonic crystal fibers (PCF), and so on.9-20
A liquid crystal display consists of an array of tiny segments (called pixels) that
can be manipulated to present information. This basic idea is common to all displays,
ranging from simple calculators to a full color LCD television. An LCD consists
primarily of two glass plates separated by a thin (~5 mµ ) gap. The first glass plate is
deposited with arrays of thin-film transistors (TFTs), and the second plate is with color
filters. The LC sandwiched between the glass substrates functions as a light modulator.
There is no bulky picture tube. This makes LCDs practical for applications where size (as

2
well as weight) is important. In general, LCDs consume much less power than their
cathode-ray tube (CRT) counterparts.
Nematic liquid crystal materials generally have several common characteristics,
rod-like molecular structure, and rigidness of the long axis. The unique characteristic of
nematic liquid crystalline state is the tendency of the molecules (mesogens) to point
along a common axis, called the director. Liquid crystal is a kind of anisotropic medium
due to the rod-like molecular shape and the alignment along the director. The polarized
light encounters different refractive index due to the different polarization of the incident
light. The polarized light encounters the extraordinary refractive index en when the light
polarization is along the director, while it encounters the ordinary refractive index on
when the light polarization is perpendicular to the director. Birefringence n∆ is defined
as the difference between en and on , i.e., oe nnn −=∆ . Liquid crystal molecules can be
reorientated by the electric field or magnetic field and their effective birefringence
changes accordingly. Thus, the incident light experiences different phase retardation as
the electric field or magnetic field changes. 21-24
In order to realize a full color display, three main colors RGB (red, green blue)
are required. Both the extraordinary and ordinary refractive indices decrease as the
wavelength increases. As a result, birefringence decreases with wavelength in the visible
spectral region. For isotropic media, the wavelength dependent refractive index can be
described by Cauchy equation, i.e., the refractive index of an isotropic medium decreases
as the wavelength increases. To optimize the cell design of LCD panel, we must know
the refractive indices of the LC employed. We can measure the refractive indices of an
LC at discrete wavelengths, but it is difficult to measure them continuously in the whole

3
visible light spectrum. It is necessary to find a physical model to understand the origins of
LC refractive indices and their dependency on the wavelength. Based on Vuks equation
or the three-band model, we derived the extended Cauchy model for describing the
wavelength dependent refractive indices of liquid crystals. According to the extended
Cauchy model, both en and on decrease as wavelength increases and saturate in the
infrared region. The extended Cauchy model was validated by the experimental data
measured using a multi-wavelength Abbe refractometer (Atago: DR-M4) in our lab.
Some liquid crystals still hold a large birefringence in the infrared spectrum. Thus, LCs
are also useful in some photonic devices such as optical switch, variable optical
attenuator for optical communication application, IR dynamic scene projector, and so on.
However, refractive indices measurement at an infrared wavelength is less convenient
than that in the visible region. The absorption strengths in the infrared region are about
two orders of magnitude weaker than that in the UV light region. Thus, the resonant
enhancement of these bands to the LC refractive indices and birefringence is small and
localized.21, 25 We can extrapolate the experimental data obtained from the visible spectral
region to a specific IR wavelength. This extrapolation method was validated based on the
refractive indices measured at two IR laser wavelengths using the so called wedged-cell
refractometer.
Temperature effect on liquid crystal refractive indices also plays an important role
in display applications, especially for projection displays, and liquid crystal on silicon
(LCoS) for microdisplay. Due to the thermal effect of the lamp, liquid crystal panel of
projection display could reach 50~60 oC. It is important and necessary to know the LC
properties at the anticipated operation temperature beforehand. To measure the refractive

4
indices at one temperature point is easy, however, to measure the refractive indices in the
whole nematic range is not easy, especially, when the temperature exceeds the
instrument’s limit. For instance, the commercial Abbe refractometer has a temperature
range from 5 to 55 oC. Finding a physical model to describe the temperature effect on
liquid crystal refractive indices becomes necessary. Based on Vuks equation, Haller
equation and density function of liquid crystals, we derive the four-parameter model for
describing the temperature effect on liquid crystal refractive indices.26-34 We further
simplify the four-parameter model to the three-parameter parabolic model when an LC
with high melting point and low birefringence is considered. By connecting a circulating
constant temperature bath (Atago: 60-C3) to the Abbe refractometer, we can measure the
LC refractive indices at different temperature points in the range from 10 to 55 oC. The
measured experimental data are used to validate the two models. Experiments agree well
with the models.
Liquid crystals exhibit a large optical nonlinearity arising from the optically
induced reorientation of the LC director. On the other hand, liquid crystals naturally
possess a large temperature nonlinearity. In chapter 3, we derive the physical models for
temperature gradient, dTdno / and dTdne / , based on the four-parameter model. Liquid
crystals with high temperature gradient are useful for the laser-induced thermal grating in
nematic liquid crystal films.35 Recently, novel photonic applications, tunable photonic
crystal fiber, and laser induced thermal solitons in the nematic liquid crystals require a
kind of liquid crystal with high temperature gradient at room temperature for the ordinary
refractive index, dTdno / . The factors which determine the dTdno / value are analyzed
based on the physical model we derived. Guidelines are found to formulate new liquid

5
crystals to meet the demands. Two liquid crystal mixtures, named UCF-1 and UCF-2
which have a large dTdno / value at room temperature, are formulated in our lab.
Photonic crystal fibers (PCFs) have attracted significant attention these years and
much research has been devoted to design fibers for various applications, such as
supercontinuum generation, high power double-clad fiber lasers, air core fibers for high
power laser delivery, and so on. However, these applications all depend on the static
properties of the fiber. It is desirable to dynamically change the transmission properties of
the fiber and, thereby, tune or trim them. Photonic Crystal Fibers (PCFs) have a specific
arrangement of air holes running along the length of the fiber. The microstructure gives a
high degree of design flexibility and many interesting designs have been demonstrated.
By infiltrating the high-index liquid, oil, or liquid crystals into the microscope holes, the
fiber devices with tunable transmission properties are fabricated. The photonic bandgaps
in the LC filled section could be electrically tuned by placing the LCPCF (liquid crystal
photonic crystal fiber) between electrodes. Recently, LC infiltrated photonic crystal fibers
with thermal tunable and switchable bandgaps were demonstrated. To acquire a highly
thermal tunable bandgaps for LCPCF, special liquid crystals with high dTdno / values at
room temperature are needed. By infiltrating UCF-1, an LC mixture with a large dTdno /
at room temperature, into a three-rod core PCF, a bandgap tuning sensitivity of 27 nm/oC
is achieved in the vicinity of the room temperature.
The study of solitons in liquid crystals is an important branch in the science of
nonlinear optics and materials science. Solitons are localized waves that travel without
much change in shape. In the mathematic literature the word “soliton” refers to solitary
traveling waves which preserve their identities after a pairwise collision. In 2001,
6
Warenghem reported the first “thermal soliton” observed in dye-doped nematic liquid
crystals confined in a capillary.36-38 The nonlinear mechanism responsible for the thermal
soliton is the thermal indexing. To trigger the so called “thermal” soliton, liquid crystals
with a large dTdno / value at room temperature are highly preferred.
1.2 Liquid crystals
Liquid crystals are beautiful and mysterious materials which are widely used in
display and photonics industry. Liquid crystal phase were firstly discovered by an
Austrian botanist named Friedrich Reinitzer. As is commonly known to all, matter exists
in three states, solid, liquid and gas. However, this is not quite correct and there exhibits
the fourth state which is called liquid crystal or mesophase. Liquid crystals exhibit
intermediate thermodynamic phases between the crystalline solid and the isotropic liquid
state. A liquid crystal can flow like an ordinary liquid, while keeps some properties of a
crystalline phase, for example the birefringence. The distinguished characteristic of liquid
crystals is that the molecules tend to align along a common axis, called the director. The
molecules in the liquid phase have no intrinsic order. In the solid state, molecules are
highly ordered and have little translational freedom. The characteristic orientational order
of the liquid crystal state is between the traditional solid and isotropic liquid phases.
Figure 1 shows the average alignment of the molecules for each phase.21-24

7
Solid Liquid crystal LiquidSolid Liquid crystal Liquid
Figure 1: The average alignment of the molecules for solid, anisotropic liquid crystal and isotropic liquid phases.
Three types of liquid crystals have been discovered so far, thermotropic, lyotropic
and polymeric. Among these three, the thermotropic liquid crystals have been studied
extensively and their applications have reached a mature stage. The mesophase is formed
by heating a solid or cooling an isotorpic liquid; it exists in certain temperature range.
Lytropic liquid crystal are receiving increasing scientific and technological attention
because of the way they reflect the unique properties of their constitunent molecules.
This kind of mesophase is formed by dissolving an amphiphilic mesogen in a suitable
solvent, under appropriate conditions of concentration, temperature, and pressure.
Molecular aggregates or micelles are often formed. Polymeric liquid crystals are potential
candidates for electronic devices and ultra-high-strength materials. Some polymers exist
as an LC mesophase under suitable conditions of temperature, pressure, and
concentration.
Thermotropic liquid crystals go through a series of phase transitions, from solid
to liquid crystal, from liquid crystal to isotropic liquid and finally change to gas phase, as

8
the temperature increases. Thermotropic liquid crystal can exist in three phases, nematic
smectic, and cholesteric, which are shown in figure 2.
Smectic A Smectic B Smectic C
Nematic Cholesteric
Smectic A Smectic B Smectic C
Nematic Cholesteric
Figure 2: Three thermotropic liquid crystals: nematic, smectic and chlesteric.
In Greek, the word nematic means thread. The nematic liquid crystal phase is
characterized by molecules that have no positional order but tend to point in the same
direction, i.e., along the director. The liquid crystal molecules can be reoriented by an
electric field or a maganetic field when the field strength exceeds the Freedericksz
transition threshold.38 The orientation of the director is also imposed by the boundary
conditions. There is no long-range correlation between the centers of mass of the
molecules, which can translate freely. This property determines the fluid character of the

9
nematic phase. The axis of uniaxial symmetry has no polarity. Although the constituent
molecules may be polar, it does not lead to a macoscopic effect.22
Cholesteric liquid crystal is equivalent to a nematic except for the chiral-induced
twist in the directors. Similar to the nematic phase, however, in the cholesteric phase,
molecules in the different layers orient at a slight angle relative to each other (rather than
parallel as in the nematic). Each consecutive molecule is rotated slightly relative to the
one before it. Therefore, instead of the constant director of the nematic, the cholesteric
director rotates helically throughout the sample. Many cholesterol esters exhibit this
phase, hence name of cholesteric is used. An important feature of the cholesteric
mesophase is the pitch. The pitch, p, is defined as the distance it takes for the director to
rotate one full turn in the helix. The helical structure results in selective reflection in
wavelength and circular polarization. The polarization state of the reflected and
transmitted waves depend on the pitch length of the cholesteric. Firstlly, if the helical
pitch is much larger than the incident wavelength, both reflected and transmitted waves
are plane-polarized and periodically modulated by the pitch of the liquid crystal structure.
Secondly, if the helical pitch is much smaller than the wavelength, there are two
circularly polarized waves in the medium. Thirdly, if the incident wavelength is
comparable to the helical pitch, the reflected light is strongly circularly polarized. One
circular component is almost totally reflected while the other passes through practically
unchanged. The reflected wave preserves its sense of circular polarization.21
There are at least nine distinct smectic phase bearing the designations: Smectic A,
B, C, ……, I, with the phase being labeled not according to any microscopic properties,
but rather by the chronological order of their discovery. X-ray diffraction studies showed

10
that in the smectic A phase, the long molecular axes are arranged perpendicular to the
planes of the layers. However, the lateral distribution of the molecules within each layer
is nearly random. The molecules in the smectic A layers can rotate freely along their long
axes. Molecules in smectic B phase are arranged in layers with the molecular centers
positioned in a hexagonally close-packed array. The molecular long axes are orthogonal
to the layer planes. No interdigitation or tilting within the layers occurs as for the smectic
A. The layer spacing of the smectic B is found to be approximately equal to the
molecular length according to the X-ray analysis. The molecules in each layer are tilted at
an angle to the layer normal for the smectic C. This tilt varies with temperature and often
increases with decreasing temperature. The smectic C phase has a higher entropy than
that of the smectic B, but lower than the smectic A. Thus, the phase transition
temperature of the smectic B is often the lowest, followed by the smectic C and smectic
A. Chiral smectic C, or Sm-C*, is an interesting class of liquid crystal materials. The
structure of Sm-C* is similar to that of smectic C except for a helical tilt distributions
from layer to layer. The helical pitch is dependent on the temperature. The tilt angle
decreases resulting in an increasing helical pitch length as temperature increases.
Therefore, the optical properties of the Sm-C* are sensitive to temperature and can be
used as temperature sensor. Another exciting feature of the Sm-C* phase is the
ferroelectricity.21 Ferroelectric LCs have been found useful for display and light switches
because of their fast response time and bistability.

11
1.3 Refractive indices of liquid crystals
Refractive indices of a liquid crystal (LC) are fundamentally interesting and
practically useful parameters. Liquid crystal is uniaxial and anisotropic. It has two
principle refractive indices, en and on . The extraordinary refractive index, en , is
observed for an extraordinary wave associated with a light wave where the electric vector
vibrates parallel to the optical axis. The ordinary refractive index, on , is observed for a
linearly polarized light wave where the electric vector is perpendicular to the optical axis.
The values of en are usually larger than those of on . The birefringence is defined by the
difference between en and on . Most liquid crystals have a positive birefringence, i.e.
∆n>0.
Most liquid crystal light modulators, e.g., flat panel display devices, utilize the
electric-field-induced refractive index change to modulate light.1 In addition to the
molecular constituents, wavelength and temperature are the two most important factors
affecting the LC refractive indices. For instance, to achieve a full-color display three
primary colors [red, green, and blue (RGB)] are used. It is essential to know the
wavelength-dependent refractive indices of the LC mixture employed in order to
optimize the cell design. As the operating temperature changes, the refractive indices
change accordingly. The temperature effect is particularly important for projection
displays and liquid crystal on silicon (LCoS) for microdisplay applications.2-6 Due to the
thermal effect of the lamp, the temperature of the display panel could reach 50-60 oC. It is
important to know the LC properties at the anticipated operating temperature beforehand.
Furthermore, the thermal nonlinearity of liquid crystal refractive indices is also very

12
important for some new photonic applications, such as the tunable liquid crystal photonic
bandgap fibers (LCPBGs)16-20 and thermal soliton in nematic liquid crystals confined in
capillaries.36,37 Both prefer a liquid crystal with a large temperature gradient of ordinary
refractive index ( dTdno / ) at room temperature. For liquid crystal photonic bandgap
fibers, the tuning sensitivity of the photonic bandgaps could be greatly increased by
infiltrating this kind of liquid crystals into the periodically arranged microscopic air holes
around the core in photonic crystal fibers. To successfully trigger the thermal solitons in
liquid crystal confined in a capillary with a lower power laser, it also requires this kind of
liquid crystals with high dTdno / values at room temperature. Thus, there is a need to
find a physical model to describe the temperature gradient of liquid crystals. Further, the
developed guidelines could be useful for designing the desired liquid crystals.
In an isotropic fluid or gas, the refractive index is described by the well-known
Lonrentz-Lorenz equation. It relates the macroscopic refractive index to microscopic
molecular polarizability. The wavelength effect on the refractive index of an isotropic
media could be described by the famous Cauchy dispersion.40 However, liquid crystal is
an media and a complex molecular system involving short and long range molecular
interactions. It gives contrary results if directly applying the Lonrentz-Lorenz equation to
liquid crystals. Several models have attempted to address the wavelength and temperature
dependencies of the LC refractive indices.21-34 Each approach has its own merits and
demerits. In 1966, Vuks made a bold assumption that the internal field in a crystal is
isotropic in all directions and brought forward a model for describing the refractive
indices of anisotropic media. The Vuks model26 is analogous to the classical Clausius-
Mossotti and Lonrentz-Lorenz equation for correlating the microscopic LC molecular

13
polarizabilities to the macroscopic refractive indices. The differences between the Vuks
model and the Lonrentz-Lorenz equation are in two folds: 1) 2n is replaced by >< 2n in
the denominator and 2) α is replaced by eα or oα . Vuks validated his model based on
the experimental data of several crystals. However, the wavelength and temperature
effects are not described explicitly in Vuks model. Wu brought forward the three-band
model and single-band model for describing the wavelength effect on liquid crystal
refractive indices based on the LC’s electronic absorption bands in the UV spectrum. The
single-band model21,27 gives an explicit expression on the wavelength and temperature
dependence for birefringence, but not for the individual refractive indices. On the other
hand, the three-band model21,28,30 describes the origins of the LC refractive indices for
single LC compounds. Unfortunately, the three-band model needs three fitting parameters
for each LC compound. In order to calculate the refractive indices at a given wavelength,
we must measure the three absorption wavelengths ( iλ , i=0,1,2) corresponding to the
three bands. If a LC mixture consists of 5-10 distinct molecular structures, it would be
too complicated for the three-band model to quantitatively describe the LC refractive
indices of the mixture.
Haller brought forward an empirical equation for describing the temperature
dependent order parameter S when the temperature is not too close to the clearing point.
Further, he gave an empirical equation for describing the temperature effect on the
birefringence of liquid crystals when the temperature is not near the clearing point.
However, the relationship between the individual liquid crystal refractive index and
temperature are still not disclosed. De Jeu, Blinov, Warenghem, Abdulhalim and so on all
made some contributions to the development of liquid crystal refractive indices in

14
literature.22-24,29 However, the more complete, accurate and practical physical models for
describing the wavelength and temperature effects on the liquid crystal refractive indices
are still needed for display and photonic applications.
Although the original Cauchy equation40 was intended for the isotropic gases and
liquids, it has been attempted to fit the wavelength-dependent refractive indices of some
anisotropic liquid crystals.43,44 The fitting results are reasonably good except that the
physical origins of the Cauchy coefficients are not clear. Recently, we derived the
extended Cauchy equations45-47 based on the three-band model28,30 or Vuks equation,
respectively, for describing the wavelength effect on the refractive indices of anisotropic
liquid crystals. The extended Cauchy equations are applicable not only to single
compounds but also to LC mixtures. Good fittings are found in the off-resonance region.
If the LC birefringence is low, then the three coefficients in the extended Cauchy model
can be reduced to two and the fitting process becomes simpler.
Since a LC is a complex molecular system involving short and long range
molecular interactions, its refractive indices are quite different from an isotropic liquid. In
Vuks model, the internal field was assumed to be isotropic. Vuks validated the model by
using the experimental data of several anisotropic crystals such as naphthalene, diphenyl,
anthracene, and phenanthrene.26 Since Vuks model has been used widely to describe the
LC refractive indices, it is necessary to validate the model directly by using the
experimental data of liquid crystal materials. To validate Vuks equations for the LC
molecular system is a challenging task because the LC molecular polarizabilities involve
short range and long range interactions. We derive the Vuks equations in different forms

15
so that their validity can be easily examined by measuring the wavelength and
temperature dependent refractive indices. We find the Vuks equation is self-consistent.48
Based on the Vuks equation, we derive two novel equations for liquid crystal
refractive indices, en and on , which correspond to the extraordinary and ordinary light,
respectively.45-47 The equations relate average microscopic polarizability >< α , pack
density N , differential molecular polarizability oe γγ − and order parameter S of LC
molecules to the refractive indices en and on , respectively. The two equations decouple
en from on which are coupled together by >< 2n in Vuks equation. Then, we derive a
four-parameter model for describing the temperature effect on the LC refractive indices.
The four-parameter model is further simplified to the three-parameter parabolic model for
low birefringence LCs with a high clearing temperture.47,49
Further, we derive the expressions for the temperature gradient, dTdne / and
dTdno / , based on the four-parameter model.50 Afterwards, we discuss and analyze the
factors affecting the temperature gradient of the LC refractive indices. We propose a new
physical concept, the crossover temperature, based on the physical model of dTdno / .
The crossover temperature is defined as the temperature at which dTdno / =0. The
dTdno / values are smaller than zero when the temperature is lower than the crossover
temperature and on decreases as the temperature increases. On the contrary, the dTdno /
value is larger than zero when the temperature is higher than the crossover temperature
and on increases as the temperature increases. The dTdne / values are equal to the sum
of two negative terms, i.e. dTdne / value is always negative throughout the nematic

16
range. Thus, we can explain why en always decreases as temperature increases and on
decreases at the beginning then increase as temperature increases in the nematic range.
The guidelines are found useful for designing LC mixtures with a large positive dTdno / .
Two new LC mixtures, UCF-1 and UCF-2, were formulated based on these guidelines.50
The dTdno / of UCF-1 is ~ 4X higher than that of 5CB compound at the room
temperature.
1.4 Photonic crystal fibers
Photonic crystal fibers (PCFs) were first demonstrated in 1996 and have
generated much attention since then. PCFs are optical fibers that employ a
microstructured arrangement of low-index material in a background material of higher
refractive index. The background material is often undoped silica and the low index
region is typically provided by air voids running along the length of the fiber.51-57
PCFs may be divided into two categories, high index guiding fibers and low index
guiding fibers. Similar to conventional fibers, high index guiding fibers are guiding light
in a solid core by the modified total internal reflection (M-TIR) principle. The total
internal reflection is caused by the lower effective index in the microstructured air-filled
region. Low index guiding fibers guide light by the photonic bandgap (PBG) effect. The
light is confined to the low index core as the PBG effect makes propagation in the
microstructured cladding region impossible.

17
The strong wavelength dependency of the effective refractive index and the
inherently large design flexibility of the PCFs allows for a whole new range of novel
properties. Such properties include endlessly single-moded fibers, extremely nonlinear
fibers and fibers with anomalous dispersion in the visible wavelength region.
M-TIR is analogous to the total internal reflection know from standard optical
fibers. It relies on a high index core region, typically pure silica, surrounded by a lower
effective index provided by the microstructured region. Figuer 3 shows a section of
photonic crystal fiber and we can see clearly the periodic microstructure from the cross
section.
LOW INDEX CLADDINGACRYLATECOATING
HIGH INDEX SILICA CORE
LOW INDEX CLADDINGACRYLATECOATING
HIGH INDEX SILICA CORE
Figure 3: The structure of a high-index photonic crystal fiber.
The effective index of such a fiber can be approximated by a standard step index
fiber with a high index core and a low index cladding. However, the refractive index of

18
the microstructured cladding in PCFs exhibits a wavelength dependency very differently
from that of pure silica, an effect which allows PCFs to be designed with a complete new
set of properties not possible with standard technology. For example, the strong
wavelength dependence of the refractive index allows design of endlessly single-moded
fibers where only a single mode is supported regardless of optical wavelength.
Furthermore, it is possible to alter the dispersion properties of the fibers, thereby making
it possible to design fibers with an anomalous dispersion at visible wavelengths. More
complex index structure can also be constructed by utilizing arrangements of holes of
different size in various periodic or nonperiodic structures.
Photonic crystal fibers (PCFs) belong to the category of devices as they exhibit a
microstructured refractive index profile in the fiber cross section. Many devices have
been demonstrated, ranging from disersion controllers to fiber lasers and nonlinear
devices. The optical properties of PCFs could be modified by filling the air holes with
liquids, oils, fluids, polymers, or liquid crystals and the tunability of PCFs could be
achieved using the properties of these materials. This was achieved by taking advantage
of the thermo-optic effect in the infused materials to induce index changes either using an
external heater or the absorption of a guided pump beam in dye-doped LCs. The
exploitation of the thermo-optic effect allows thermally actuated devices to be
continuously tuned, except at phase transition in the LC devices, which can yield
threshold-like response. Electrical control of a LC-filled PCF (LCPCF) has also been
proposed and demonstrated. The fiber was transformed from an M-TIR to a PBG fiber
type by infiltrating the high-index liquid crystal into the microscopic holes. Then, the
LCPCF was placed between two electrodes. The LC molecules are reoriented accordingly

19
to the field which induced a change in the refractive index of the LC when an electrical
field was applied. This device could be used as an optical switch.16-18
To achieve a highly thermal tunable photonic crystal fiber, we infiltrated a kind of
novel liquid crystal with a high temperature gradient at temperature, i.e. high dTdno / at
room temperature, into the microscopic holes around the core of a three-rod core PCF.
The bandgaps of the LCPCF shift toward the red light side as the temperature increases.
The thermal tuning sensitivity of the spectral position of the bandgap is about 27 nm/oC,
which is 4.6X higher than that of a commercial available LC (E7). This type of device
could be used to switch the laser beam from the pump laser to the probe laser and further
modulate the amplitude of the probe laser by setting the probing laser wavelength on the
red side edge of the bandgap while heating the LCPCF.19,20

20
CHAPTER 2: WAVELENGTH EFFECT ON LIQUID CRYSTAL REFRACTIVE INDICES
2.1 Introduction
Liquid crystal refractive indices are fundamentally important and practically
useful parameters. Most LC-based devices use the electric, magnetic and thermal-induced
refractive index change to modulate the light for information display, light switching,
laser beam steering, etc.
Several models have been developed for describing the wavelength effects on
liquid crystal refractive indices.21-34 The three-coefficient Cauchy equation is found to fit
well the wavelength dependent refractive index of isotropic media. Although it also fits
well with the anisotropic LCs, the physical meaning is vague.40 Vuks model was
proposed and validated based on the isotropic field in crystals and the experimental data
of several crystals such as naphthalene, diphenyl, anthracene and phenanthrene.26
However, it only correlates the relationship between the refractive indices and the
microscopic polarizabilities, but shows no detailed relationship between the wavelength
and the refractive index. The major absorption bands of a LC compound occurs in two
spectral regions: ultraviolet (UV) and infrared (IR). For a conjugated LC molecule, three
electronic absorption bands ( iλ , i =1-3) exist in the UV region. There are three kinds of
electronic transitions in the UV spectrum. In the near IR region, some overtone molecular

21
vibration bands begin appear. In the mid (3-5 µm) and long IR (7-14 µm) regions, there
are many fundamental molecular vibration bands. However, the oscillator strength of
vibrational absorption is typically two orders weaker than the electronic transitions.21,25 In
the visible region, the absorption is usually quite small. The major optical loss originates
from light scattering due to the LC director fluctuantions, rather than absorption. The
resonant enhancement of the vibrational bands to the refractive indices or birefringence is
localized to the vicinities of the bands. So the resonant enhancement of the electronic
absorption bands makes much more contributions to the LC refractive indices or
birefringence than that from the vibration bands. Wu brought forward the three-band
model and single-band model for describing the wavelength effect on the LC refractive
indices and birefringence, respectively, based on these absorption bands in the UV
spectrum.27,28,30 The three-band model shows clearly the origin of LC refractive indices.
However, it is more suitable for describing the refractive indices of a LC compound.
Liquid crystals used in practice are the eutectic mixtures that consist of a dozen LC
compounds. Each of the LC compounds may have different absorption bands and it
would be too complicated for the three-band model to quantitatively describe the LC
refractive indices of the mixture.21
In this work, we derived the extended Cauchy equation for describing the
wavelength effect on liquid crystal refractive indices based on the three-band model.46 In
fact, we could also derive the extended Cauchy equation based on the Vuks equation.45
The refractive indices of dozens of liquid crystals are measured using a multi-wavelength
Abbe refractometer or a wedged-cell refractometer.58,59 The experimental data are used to

22
validate the extended Cauchy model. The validation will be presented in Chapter 5.
Excellent agreement between theory and experiment is achieved.
2.2 Three-band Model
The major absorption of a LC compound occurs in two spectral regions:
ultraviolet (UV) and infrared (IR).14,27 The *σσ → electronic transitions (the band−0λ )
take place in the vacuum UV (100-180 nm) region whereas the *ππ → electronic
transitions (the −1λ and −2λ bands) occur in the UV (180-400 nm) region. It should be
mentioned that the band−0λ appears in the vacuum region (its actual wavelength has
not been measured, but we know the central wavelength is somewhere around 120-150
nm). The transition intensity of the band−0λ is very strong since there are many σ -
electrons available in a liquid crystal molecule. The band−1λ of several conjugated LC
molecules occurs at about 200 nm; it consists of two closely overlapping bands ( a1λ and
b1λ with ab 11 λλ > ). The banda −1λ exhibits a strong transition intensity and a large
absorption anisotropy and its wavelength is not too sensitive to the molecular conjugation
length. However, the bandb −1λ shifts toward the longer wavelength for a more
conjugated LC molecules. Its transition intensity and absorption anisotropy may be much
lower than the banda −1λ ’s, depending on the conjugation length. For simplicity, we
could use the average value of the band−1λ . The wavelength, the transition intensity and
absorption anisotropy increase as the conjugation increase. If a LC molecule has a longer
conjugation, its electronic transition wavelength would extend to a longer UV wavelength.

23
In the near IR region, some overtone molecular vibration bands appear.21,25 The
fundamental molecular vibration bands, such as CH, CN, and C=C, occur in the mid and
long IR regions. Typically, the oscillator strength of these vibration bands is about two
orders of magnitude weaker than that of the electronic transitions. Thus, the resonant
enhancement of these bands to the LC refractive indices and birefringence is
localized.21,28,30
22
2
22
2
221
2
21
2
120
2
20
2
01λλ
λλλλ
λλλλ
λλ−
+−
+−
+≅ eeee gggn , (2-1)
22
2
22
2
221
2
21
2
120
2
20
2
01λλ
λλλλ
λλλλ
λλ−
+−
+−
+≅ oooo gggn . (2-2)
where iii fNZg ~ are proportionality constants, 0Z is the number of responsible
−σ electrons and 21 ZZ = is the number of −π electrons in a LC compound. These ig ’s
determine the temperature effect of the refractive indices. The three-band model
describes the origins of refractive indices of LC compounds. However, a commercial
mixture usually consists of several compounds with different molecular structures in
order to obtain a wide nematic range. The individual si 'λ are therefore different so that
Eqs. (2-1) and (2-2) would have too many unknowns to describe the refractive indices of
a LC mixture.
The band−0λ makes a greater contribution to en and on than the sum of the
band−1λ and band−2λ since there are so many σ electrons. The contribution of the
band−1λ to both en and on remains more or less a constant. However, the band−2λ
makes a greater contribution to en than on . This is because the oscillator strength of the
band−2λ is larger for the e-ray than the o-ray. The oscillator strength of the e-ray for the

24
band−1λ is about the same as the band−2λ . However, owing to the longer wavelength
of the band−2λ , its contribution to en is greater than that of the band−1λ . For the
contributions of each band to the birefringence, the band−2λ makes the primary
contribution, followed by the 1λ and then the 0λ bands. This is because the band−2λ
has the largest absorption anisotropy and longest wavelength. The total contribution of
the two *ππ → transitions accounts for about 80% and the *σσ − transition for 20% to
overall birefringence at off-resonance region.
Generally, the *σσ − transitions have very high optical density, but their
absorption is nearly isotropic. So these transitions make the primary contribution to
refractive indices and a secondary contribution to birefringence in the visible region. The
*ππ → transition occur at long wavelength and exhibit relatively large anisotropy. These
delocalized π electrons greatly enhance the differential molecular polarizability. As a
result, their contribution to birefringence is dominant. However, due to the limited
number of π electrons in a LC, the *ππ → transition intensities are about one order of
magnitude lower than those of *σσ − transition, resulting in a lower contribution to the
refractive indices.
2.3 Extended Cauchy Model
Based on the three-band model, we derived the extended Cauchy model for
describing the wavelength effect on the refractive indices of liquid crystals. Originally,
Cauchy equation was used to describe the wavelength effect on the refractive index of

25
isotropic media. Here, we extend the Cauchy equation to describing the refractive indices
of anisotropic liquid crystals. In the following paragraphs, I show the theoretical
derivations for the extended Cauchy model.
The three-band model, Equations (2-1) and (2-2), can be rewritten as follows:46
22
22
221
21
120
20
0
)(1)(1)(11
λλ
λ
λλ
λ
λλ
λ
−+
−+
−+≅ eeee gggn , (2-3)
22
22
221
21
120
20
0
)(1)(1)(11
λλ
λ
λλ
λ
λλ
λ
−+
−+
−+≅ oooo gggn . (2-4)
Here, 0λ , 1λ and 2λ (with 2λ > 1λ ) denote the resonance wavelengths of the
*σσ − and two *ππ → transitions, and 0g , 1g and 2g are the corresponding
proportionality constants which depend on the oscillator strength and temperature. For a
conjugated LC molecule, its 0λ band is located in the vacuum UV region ( 0λ ~120 nm),
1λ is around 190-210 nm; not too sensitive to the LC structure, and 2λ increases
substantially as the molecular conjugation increases. For example, for the 4-cyano-4-n-
pentyle-cyclohexane-phenyl (5PCH) LC compound, its 1λ ~200 nm and 2λ ~235 nm while
for the 4-cyano-4-n-pentylbiphenyl (5CB) its 1λ shifts to 210 nm and 2λ shifts to 282
nm.7
In the off-resonance region, λ > λi, i=0, 1, 2, the terms 22 / λλi (i=0, 1, 2) in the
denominator are much smaller than 1 and Eqs. (2-3) and (2-4) can be expanded into
power series. Keeping the first three terms, we obtain

26
)1()1()1(1 4
42
2
222
224
41
2
212
114
40
2
202
00 λλ
λλλ
λλ
λλλ
λλ
λλλ +++++++++≅ eeee gggn , (2-5)
)1()1()1(1 4
42
2
222
224
41
2
212
114
40
2
202
00 λλ
λλλ
λλ
λλλ
λλ
λλλ +++++++++≅ oooo gggn . (2-6)
Grouping the similar terms together, we obtain the extended Cauchy equations
42 λλee
eeCBAn ++≅ , (2-7)
42 λλoo
ooCBAn ++≅ , (2-8)
where
222
211
2001 λλλ eeee gggA +++= , (2-9)
422
411
400 λλλ eeee gggB ++= , (2-10)
622
611
600 λλλ eeee gggC ++= , (2-11)
And
222
211
2001 λλλ oooo gggA +++= , (2-12)
422
411
400 λλλ oooo gggB ++= , (2-13)
622
611
600 λλλ oooe gggC ++= . (2-14)
Therefore, the 3-coefficient Cauchy equations are derived from the three-band
model and are applicable to the anisotropic media. Each Cauchy coefficient is related to
the resonance wavelengths ( iλ ) and transition intensity ( ig ) as shown from Eq. (2-9) to
(2-14). For instance, if a LC compound contains only σ electrons (e.g., cyclohexane
rings), then 1λ and 2λ do not exist. The en and on are determined solely by the 0λ terms.

27
As a result, the ABC coefficients would be small and the refractive indices in the visible
region would be relatively small and insensitive to the wavelength. On the other hand, a
linearly conjugated LC would exhibit a longer λ2 and larger 2g so that its refractive
indices, especially birefringence ( oe nnn −=∆ ), would be greatly enhanced. From Eqs.
(2-7) and (2-8), both en and on decrease as the wavelength increases. In the long
wavelength regime where 2λλ >> , en and on are reduced to eA and oA , respectively, and
are insensitive to the wavelength. Hence, birefringence ( n∆ = eA - oA ) is also insensitive
to the wavelength. This result is consistent with the prediction of the single band model.27
A LC mixture usually consists of several single compounds in order to widen the
nematic range. Let us assume there are m compounds in the LC mixture and each
compound contributes a molar fraction Xi (i=1, 2, … m) to the refractive indices of the
mixture. The refractive indices ( ein and oin ) of the thi component are expressed by Eq.
(4). The refractive index of the mixture is a superposition of the individual components:46
)( 421 λλeiei
eim
iie
CBAXn ++∑≅
=, (2-15)
)( 421 λλoioi
oim
iio
CBAXn ++∑≅
=, (2-16)
1......21 =+++ mXXX . (2-17)
Let ioem
iioe AXA )( ,
1
', ∑=
=, ioe
m
iioe BXB )( ,
1
', ∑=
=, and ioe
m
iioe CXC )( ,
1
', ∑=
=, Eqs. (2-15) and (2-
16) are reduced to:
4
'
2
''
λλee
eeCB
An ++≅ , (2-18)

28
4
'
2
''
λλoo
ooCB
An ++≅ . (2-19)
Eqs. (2-18) and (2-19) represents the refractive indices of a LC mixture and has the same
form as Eqs. (2-7) and (2-8) which is for LC compounds, except for different Cauchy
coefficients.
The three-coefficient Cauchy equations have been used to fit experimental results
of LC mixtures. Good agreement is found in the off-resonance region.46 An undesirable
feature is that it involves three fitting parameters. To reduce the fitting parameters to two,
we need to prove that the third terms, i.e. the 4−λ terms, in Eqs. (2-18) and (2-19) can be
ignored under certain conditions.
Once the ABC coefficients are determined, the refractive indices of the LC at any
wavelength can be extrapolated. Knowing the refractive index data as a continuous
function of wavelength spanning from visible to infrared region is very important for the
simulation study of display and photonic device design.
2.4 Two-coefficient Cauchy Model
The fluorinated liquid crystals60,61 exhibit a high resistivity, low viscosity, and
excellent material stability, and have become the mainstream for direct-view and
projection displays. For a 90o twisted nematic cell, to satisfy the Gooch-Tarry first
minimum condition30 the required λ/nd∆ is equal to 2/3 . A cell gap d~ 4-5 µm is
commonly chosen in order to achieve high manufacturing yield. For the green band
centered at λ=550 nm, the LC birefringence should around 0.1. The fluorinated
cyclohexane phenyl has ∆n in this range. The 2λ -band of such a LC structure occurs at

29
~210 nm which is far from the visible (i.e. λλ <<2 ) and, moreover, its transition
oscillator strength is weak, which means the oeg ,2 coefficients are small.
From Eqs. (2-7) and (2-11), the 4/ λeC term of the single LC compound can be
rewritten as:
42222
41211
402004 )()()(
λλ
λλλ
λλλ
λλ eee
e gggC
++= . (2-20)
For a low birefringence LC compound in the off-resonance region, all the 4)/( λλi terms
(where i=0, 1 and 2) in Eq. (2-20) are relatively small so that the 4/ λeC term is much
smaller than the first two terms in Eq. (2-7) and can be ignored. Similarly, the third term
for on as shown in Eq. (2-8) can be neglected, too. As a consequence, the refractive
indices of a low birefringence LC compound are reduced to
2λe
eeBAn +≅ , (2-21)
2λo
ooBAn +≅ . (2-22)
Based on the same arguments shown from Eq. (2-15) to Eq. (2-19), Eqs. (2-21)
and (2-22) hold equally well for low birefringence LC mixtures. From equation (2-21)
and (2-22), there are only two Cauchy coefficients for each refractive index. If we
measure the refractive index at two wavelengths, then the two Cauchy coefficients (A and
B) can be obtained and the refractive indices at any wavelength can then be calculated.
The A and B coefficients are related to each band through equations derived before. Their
physical meanings are clear.

30
2.5 Conclusion
In this chapter, we have reviewed the physical models for describing the
wavelength effect on liquid crystal refractive indices. Each model has its own merits and
shortcomings. Vuks model relates the macroscopic refractive indices to the microscopic
molecular polarizabilitis. Three-band model shows the origin of the LC refractive indices,
but it is more suitable for a LC compound. Single band model gives the LC birefringence
as a function of the wavelength, however, it does not correlate the individual refractive
index changes to the wavelength. We derived the extended Cauchy model for describing
the wavelength effect on the LC refractive indices in the visible and infrared regions
based on the three-band model. For a low-birefringence TFT liquid crystal, the extended
Cauchy model could be further simplified to the two-coefficient Cauchy model by
neglecting the third terms. The derived models are validated by the refractive index data
measured in our lab. The detailed validations will be shown in Chapter 5.

31
CHAPTER 3: TEMPERATURE EFFECT ON LIQUID CRYSTAL REFRACTIVE INDICES
3.1 Introduction
Thermal effect on liquid crystals is very important for projection displays. The
display panels could reach 50 to 60 oC due to thermal effect of the lamp. The
birefringence decreases as temperature increases, leading to a smaller phase retardation.
However, the viscosities of liquid crystals decrease greatly as temperature increases,
leading to a faster response time. It is necessary and very important to know the LC
properties at the operation temperature beforehand in order to make accurate designs.
Most LC based devices use thermotropic liquid crystals. The electro-optic
properties of thermotropic liquid crystals depend on the temperature. The refractive
indices are also sensitive to the temperature, especially the extraordinary refractive index,
en . There are few physical models describing the temperature effect on LC refractive
indices in the literature. Haller’s equation discloses the relationship between the
birefringence and temperature, but not for the individual refractive indices.32 At a given
wavelength, the refractive index of isotropic media decreases linearly as the temperature
increases. Thus, it is reasonable to predict that the LC refractive index in the isotropic
phase decreases linearly as the temperature increases. This prediction was validated by
the experimental data. Next question is: will the individual refractive indices in the

32
nematic phase also decrease linearly as the temperature increases too? Apparently, the
answer is no. There are no linearly relationship between en and the temperature, or
between on and the temperature. We defined the average refractive index >< n
as 3/)2( oe nnn +>=< and found there is a linearly relationship between >< n and the
temperature. Same as the refractive index of isotropic medium, >< n decreases linearly
as temperature increases in the nematic phase. However, the decreasing slope in the
nematic phase is a little larger than that in the isotropic phase.33,49 It is due to the abrupt
drop of LC density at the clearing point.62.63
We derived the four-parameter model for describing the temperature effect on the
LC refractive indices based on the Haller’s equation, Vuks equation and the linear
relationship between >< n and the temperature.49 The four-parameter model discloses
clearly how the temperature affects the LC refractive indices. We further simplified the
four-parameter model to the three-parameter parabolic model when the temperature is far
from the clearing point. The three-parameter parabolic model indicates that there is a
parabolic relationship between the LC refractive indices and the temperature when the
temperature under consideration is far from the clearing point. The three-parameter
parabolic model is more suitable for liquid crystals with a low birefringence. We will
validate the four-parameter model and the three-parameter parabolic model in Chapter 5.
The thermal nonlinearity of liquid crystals is very important for some photonic
applications, such as the thermal grating in nematic liquid crystal films, tunable liquid
crystal photonic crystal fibers, thermal solitons in nematic liquid crystal confined in a
capillary, and so on. We built the physical models for the thermal gradient, dTdno / and
dTdne / , of liquid crystals basing on the four-parameter model. By analyzing the

33
physical models of dTdno / and dTdne / , we identified the parameters that affect the
dTdno / and dTdne / values. Thus, guidelines are found to formulate novel liquid
crystals with high dTdno / values at room temperature. Two new liquid crystals, UCF-1
and UCF-2, with high dTdno / value at room temperature are formulated.50
By analyzing the physical models of dTdno / and dTdne / , we found the value of
dTdne / is always negative, however, the value of dTdno / could be negative or positive
and depending on the sum of two terms with contrary signs. We first brought forward the
conception, the crossover temperature, for nematic liquid crystals. The cross-over
temperature is defined as the temperature at which dTdno / equal to zero. The physical
models of dTdno / and dTdne / could also be used to explain the varying tendency of en
and on following with the temperature. The extraordinary refractive index, en , always
decreases as the temperature increases since the dTdne / is always negative. However,
the ordinary refractive index, on , decreases first and then increases as the temperature
goes beyond the cross-over temperature. It is because the dTdno / is smaller than zero
when the temperature is lower than the crossover temperature, whereas it is larger than
zero when the temperature is beyond the crossover temperature. Both dTdne / and
dTdno / increase dramatically as the temperature is approaching the clearing point. As a
result, both en and on change very fast. en is equal to on and anisotropy disappears when
the temperature reaches the clearing point.

34
3.2 Vuks Equation and the Expansioins
In the literature, there are several models attempting to describe the temperature
effect of LC refractive index. The classical Clausius-Mossotti equation correlates the
dielectric constant ε at low frequences of an isotropic media with molecular
polarizability (α ) as follows41:
απεε N
34
21
=+− . (3-1)
In Eq. (3-1), N is the molecular packing density, or number of molecules per unit
volume. In the optical frequency regime, we substitute 2n=ε and obtain the Lorentz-
Lorenz equation 41:
απ Nnn
34
21
2
2
=+− . (3-2)
For an anisotropic LC, there are two principal refractive indices, en and on ,
where ne and no are refractive indices for the extraordinary ray and ordinary ray,
respectively. In principle, each refractive index should be related to the corresponding
molecular polarizabilities, eα and oα . An early approach replaces both 2n in Eq. (3-2) by
2,oen and α by oe,α .64,65 However, this model does not fit the experimental results well.
Vuks made a bold assumption that the internal field in a crystal is the same in all
directions:26
EnEi 322 +><
= , (3-3)
35
where iE is the internal field, the average field that acts on a molecule, and E is the
macroscopic electric field. This assumption is later validated experimentally.24,26,48 With
this assumption, Vuks derived the following equation for anisotropic media:24
oeoe N
nn
,2
2,
34
21
απ=
+><
−. (3-4)
where
3/)2( 222oe nnn += , (3-5)
MN
N Aρ= , (3-6)
where ρ is the LC density, M is the molecular weight, and AN is the Avogadro’s
number.
Equation (3-4) is different from Eq. (3-2) in two aspects: 1) the 2n term in the
denominator of Eq. (3-2) is replaced by 3/)2( 222oe nnn += while the 2n term in the
numerator is replaced by 2,oen , and 2) the α is replaced by oe,α .
In Eq. (3-4), en and on are coupled together so that the relationship between the
refractive indices and the corresponding molecular polarizabilities is not clear. To reveal
this relationship, we should decouple en from on by solving Eq. (3-4). Substituting Eq.
(3-5) to Eq. (3-4) and separating en and on , we obtain45
21
341
41
⎥⎥⎥⎥
⎦
⎤
⎢⎢⎢⎢
⎣
⎡
><−+=
απ
απ
N
Nn e
e , (3-7)

36
21
341
41
⎥⎥⎥⎥
⎦
⎤
⎢⎢⎢⎢
⎣
⎡
><−+=
απ
απ
N
Nn o
o , (3-8)
Where >< α is the average polarizability of the LC molecule and is defined as42
32 oe ααα +
>=< . (3-9)
When oeN ,α is small, the term )341(4 , ><− απαπ NN oe is small and Eqs. (3-7) and (3-
8) can be expanded into power series:48
><−+≈
απ
απ
N
Nn oe
oe
341
21 ,
, . (3-10)
In the extreme case that 0→iNα , the original Vuks equation [Eq. (3-4)] leads to
1~oe nn = . These results are consistent with Eq. (3-10). However, for most liquid
crystals developed so far, their refractive indices are around 1.45-1.75. Therefore, the
second terms in the square root of Eqs. (3-7) and (3-8) is larger than 1, but less than 2.1;
the middle point is ~1.5. Under such a circumstance, Eqs. (3-7) and (3-8) cannot be
expanded into power series directly. In order to make a series expansion, we rewrite Eqs.
(3-7) and (3-8) as48
( ) 21
5.25.1
15.2 ⎥⎦⎤
⎢⎣⎡ −
+= ee
xn , (3-11)
( ) 21
5.25.115.2 ⎥⎦
⎤⎢⎣⎡ −
+= oo
xn , (3-12)
37
><−=
απ
απ
N
Nx oe
oe
341
4 ,, . (3-13)
The absolute value of 5.2)5.1( , −oex in Eqs. (3-11) and (3-12) is smaller than
~0.2. By expanding Eqs. (3-11) and (3-12) into power series and keeping the first two
terms, we obtain48
απ
απ
N
Nn
e
e
341
5102
1027
−+≈ , (3-14)
απ
απ
N
Nn
o
o
341
5102
1027
−+≈ . (3-15)
During the series expansion, the second order terms 2
,
5.25.1
85.2
⎟⎟⎠
⎞⎜⎜⎝
⎛ −oex in Eqs. (3-
14) and (3-15) are neglected because they contribute less than 0.57% to the entire
refractive index values. The expressions (3-14) and (3-15) presented here are more
accurate than those we derived earlier.45
From above equations, the wavelength and temperature dependent refractive
indices of liquid crystals are determined by eα , oα , >< α and N. We need to find how
eα and oα vary with wavelength and temperature. Liquid crystal is a state of matter with
physical properties lying between an isotropic liquid and a perfect crystal. Thus, its
molecular differential polarizability oe αα − is related to the crystalline state oe γγ − by
the order parameter S as: 42
)( oeoe S γγαα −=− . (3-16)

38
The average molecular polarizability >< α and >< γ are related to their
individual molecular polarizability as:42
)2(31
0 eααα += , (3-17)
)2(31
0 eγγγ += . (3-18)
Based on Eqs. (3-16), (3-17) and (3-18), the individual molecular polarizability
can be expressed as:45
Soe
e 3)(2 αα
αγ−
+= , (3-19)
Soe
o 3αα
αγ−
−= , (3-20)
)(3 oeoS γγγα −−= , (3-21)
)(3
2oee
S γγγα −+= , (3-22)
Substituting Eqs. (3-21) and (3-22) back to (3-17), we prove that:42,45
αγ = . (3-23)
That means the average molecular polarizability in the liquid crystal state and
crystalline state is essentially equal. Plug Eqs. (3-21)-(3-23) back to Eqs. (3-14) and (3-
15), we obtain:48
απ
γγπ
απ
απ
N
NS
N
Nn
oe
e
341
)(15
104
341
5102
1027
−
−+
−+≈ , (3-24)

39
απ
γγπ
απ
απ
N
NS
N
Nn
oe
o
341
)(15
102
341
5102
1027
−
−−
−+≈ . (3-25)
Here, oe γγ − is the differential molecular polarizability in the crystalline
state,42,66 and S is the order parameter. In a temperature not too close to the clearing
temperature, cT , the order parameter can be approximated as follows:32
β)/1( cTTS −= . (3-26)
In Eq. (3-26), the exponent β is a material constant. For many LC compounds, β
~0.2 is not too sensitive to the LC molecular structures.
Based on Eqs. (3-24) and (3-25), we can calculate the average refractive index,
which is defined as 3/)2( oe nnn +>=< , and obtain the following equation:48
απ
απ
N
Nn
341
5102
1027
−+>≈< . (3-27)
Birefringence, which is defined as the difference between en and on , can be
expressed as following equation:
απ
γγπ
N
NSn
oe
341
)(5102
−
−=∆ . (3-28)
By plugging Eqs. (3-27) and (3-28) into Eqs. (3-24) and (3-25), we can derive en
and on into the following simple forms:49,50
nnne ∆+>=<32 , (3-29)

40
nnno ∆−>=<31 . (3-30)
Eq. (3-27) indicates the average refractive index >< n is decided by the average
polarizability >< α and packing density N . From Eq. (3-28), we can see that the LC
birefringence is decided by the order parameter S , packing density N, the average
polarizability >< α and the differential molecular polarizability in the crystalline state,
oe γγ − . However, Eq. (3-27) does not disclose clearly the relationship between >< n
and temperature and Eq. (3-28) does not disclose clearly the relationship between n∆ and
temperature, too. Here, N is the molecular pack density, or number of molecular per unit
volume which is equal to MN Aρ . The term 3/4 απN in the denominator of Eqs. (3-27)
and (3-28) is much smaller than one and the average polarizability α is not sensitive to
temperature.42,48,67 Thus, the average refractive index >< n is mainly determined by the
density of liquid crystals and the birefringence n∆ is mainly determined by order
parameter S and density at a given wavelength.
Eq. (3-27) could be simplified as
2)34(
103
5102
1027 απαπ NNn ++>≈< (3-31)
Eq. (3-31) could be further simplified by neglecting the third term since term
απN34 is much smaller than one. Then, we get
απNn5102
1027
+>≈< . (3-32)
By plugging Eq. (3-6) into Eq. (3-32), we get

41
ραπ
MN
n A
5102
1027
+>≈< . (3-33)
The density of liquid crystals has a quasi linear relationship with temperature
which could be expressed as
TBA ′−′=ρ . (3-34)
where A′ and B′are constant for a given liquid crystal.
Plugging Eq. (3-34) into (3-33), we derived
TM
BNM
ANn AA ′
−′
+>≈<απαπ
5102
5102
1027 . (3-35)
In Eq. (3-35), M is the molecular weight which is constant for a given LC, AN is the
Avogadro’s number, and α is not sensitive to temperature at a given wavelength. So
Eq. (3-35) can be expressed as
BTAn −>=< , (3-36)
where A and B are constant and have the form below:
MAN
A A ′+=
απ5102
1027 , (3-37)
MBN
B A ′=
απ5102 . (3-38)
From Eq. (3-36), we can see the average refractive index of liquid crystals has a
quasi linear relationship with temperature. The theory agrees well with the experimental
result.
We can also understand it as following analysis. An isotropic medium has only
one refractive index which has a linear relationship with temperature at a certain

42
wavelength. The anisotropy disappears ( 0=S )when the temperature is beyond the
clearing point Eqs. ( 3-24) and (3-25) are reduce to the same form shown as below:
απ
απ
N
Nniso
341
5102
1027
−+≈ . (3-39)
where ison represents the LC refractive index at the isotropic state. Comparing Eq. (3-39)
and (3-27), we find >< n and ison have the same form except that term αN in the two
equations represents the value at different phase state, nematic and isotropic, respectively.
So we have reason to believe the average refractive index also has a linear relationship
with temperature since >< n and ison have the same form.
The average polarizability >< α and the differential molecular polarizability in
the crystalline state, oe γγ − are insensitive to temperature given a wavelength. The order
parameter S is much more sensitive to the temperature than the packing density N . So
Eq. (3-28) can be further simplified as
Snn o)(∆=∆ , (3-40)
απ
γγπ
N
Nn
oe
o
341
)(5102
)(−
−=∆ . (3-41)
The order parameter S can be expressed as
β)1(cT
TS −= . (3-42)
Plugging Eq. (3-42) into (3-40), we get
β)1()(c
o TTnn −∆=∆ . (3-43)

43
Eq. (3-43) has the same form as the Haller equation, but is derived in another way. Eqs.
(3-36) and (3-43) will be validated by the experiment discussed in Chapter 5.
3.3 Validation of Vuks Equation
Vuks equation correlates the refractive indices of anisotropic media to their
molecular polarizabilities and assumes that the internal field in crystals is isotropic in all
directions. It has validated by the experimental data of several crystals such as
naphthalene, diphenyl, anthracene and phenanthrene. In this chapter, we validate the
Vuks equation using the refractive index data of liquid crystals directly. In the following
paragraphs, we expand the Vuks model into different forms which make the experimental
validation easier.
In Eq. (3-4), the macroscopic LC refractive indices en and on can be measured
easily, however, the microscopic molecular polarizabilities eα and oα are difficult to
determine directly. To validate Vuks equations, we rewrite Eq. (3-4) as follows:
ee N
nn απ
34
21
2
2
=+><
− , (3-44)
oo N
nn απ
34
21
2
2
=+><
− . (3-45)
Multiplying both sides of Eq. (3-45) by 2 and then add the corresponding terms with Eq.
(3-44), we obtain the following equation48
)2(3
42
3)2(2
22
oeoe N
nnn ααπ
+=+><
−+ . (3-46)
Equation (3-46) can be rewritten as

44
><=+><−>< απ N
nn
34
21
2
2, (3-47)
where the average molecular polarizability is defined as 3/)2( oe ααα +>=< . To
evaluate Eq. (3-47) experimentally, we need to correlate >< αN with another
measurable macroscopic parameter, such as the average refractive index.
In order to realize the goal, we rewrite Eq. (3-27) as follows:48
απNn 3
45.010
31 ≈−><
− . (3-48)
Equation (3-48) correlates αN to the average refractive index n . This is an important
step as the microscopic quantity αN can be determined experimentally by measuring
the LC refractive indices. In order to compare with Eq. (3-48), we rewrite Eq. (3-47) as
απNn 3
42
31 2 =+><
− . (3-49)
By comparing Eq. (3-48) with Eq. (3-49), we find
5.01022 −≈+>< nn . (3-50)
The significance of Eq. (3-50) is that the sophisticated microscopic Vuks equation
can now be validated by two simple macroscopic parameters >< 2n and >< n . These two
parameters can be obtained by measuring the individual refractive indices ( en and on ) of
the liquid crystal. In Chapter 5, we will use the experimental data of five LC materials
with birefringence ranging from 0.08 to 0.35 to validate Eq. (3-50).

45
3.4 Four-parameter Model
In Eqs. (3-29) and (3-30), >< n is the average refractive index and n∆ is the
birefringence. Meanwhile, birefringence is dependent on the order parameter S. Based on
Haller’s equation and our derivations above, the temperature-dependent birefringence has
the form shown in Eq. (3-43).32
In Eq. (3-43), on)(∆ is the LC birefringence in the crystalline state (or T=0 K),
the exponent β is a material constant, and Tc is the clearing temperature of the LC
material under investigation. The average refractive index decreases linearly with
increasing temperature as shown in Eq. (3-36).49
Substituting Eqs. (3-43) and (3-36) back to Eqs. (3-29) and (3-30), we derive the
four-parameter model for describing the temperature dependence of the LC refractive
indices:49
β)1(3
)(2)(
c
oe T
TnBTATn −
∆+−= , (3-51)
β)1(3
)()(
c
oo T
TnBTATn −
∆−−= . (3-52)
At the first glance, Eqs. (3-51) and (3-52) seem to have four fitting parameters. As
a matter of fact, parameters A and B can be obtained from fitting the temperature-
dependent >< )(Tn data at a given wavelength, and parameters on)(∆ and β can be
obtained by fitting the temperature-dependent n∆ data. Thus, once we have measured the
temperature-dependent en and on , we rearrange the data into >< )(Tn and )(Tn∆ so that
the parameters [A, B] and [ on)(∆ , β ] can be obtained fairly straightforwardly.

46
The four-parameter model clearly describes describes the detailed relationship
between the refractive indices and temperature in the whole nematic range.
3.5 Three-parameter Parabolic Model
For direct-view and projection liquid crystal displays, the LC mixture employed
usually exhibits a low birefringence and high clearing temperature (Tc>90 oC). Under the
condition that cTT << , the β)/1( cTT− term in Eqs. (3-51) and (3-52) can be expanded
into power series. Keeping the first three terms, we obtain:49
2)( TCTBATn eeee −−= , (3-53)
2)( TCTBATn oooo +−= , (3-54)
where3
)(2 oe
nAA
∆+= ,
c
oe T
nBB
3)(2 β∆
+= , 23
)1()(
c
oe
T
nC
ββ −∆= ,
3)( o
on
AA∆
−= ,
c
oo T
nBB
3)( β∆
−= , and 26
)1()(
c
oo
T
nC
ββ −∆= . Equations (3-53) and (3-54) indicate that
the LC refractive indices have a parabolic relationship with temperature for the low
birefringence and high clearing point LC material when the operating temperature is not
very close to the clearing point. For en , the placket of the parabola is downward and,
however, for on the placket is upward.
3.6 Temperature Gradient dno/dT and dne/dT
Based on Eqs. (3-51) and (3-52), we derive the dTdne / and dTdno / as
follows:50

47
dTnd
dTnd
dTdne ∆
+><
=32
, (3-55)
dTnd
dTnd
dTdno ∆
−><
=31
. (3-56)
Furthermore, we derive the dTdne / and dTdno / as follows based on the Eqs. (3-
55) and (3-56):
β
β−−
∆−−=
1)1(3
)(2
cc
oe
TTT
nBdTdn
, (3-57)
β
β−−
∆+−=
1)1(3
)(
cc
oo
TTT
nB
dTdn
. (3-58)
In Eq. (3-57), both terms in the right-hand side are negative, independent of
temperature. This implies that ne decreases as the temperature increases throughout the
entire nematic range. However, Eq. (3-58) consists of a negative term ( B− ) and a positive
term which depends on the temperature. In the low temperature regime ( cTT << ), the
positive term could be smaller than the negative term resulting in a negative dTdno / . As
the temperature increases, the positive term also increases. As T approaches cT ,
dTdno / jumps to a large positive number. In the intermediate, there exists a transition
temperature where dTdno / =0. We define this temperature as the cross-over temperature
oT for on . To find oT , we simply solve dTdno / =0 from Eq. (3-58).50
From Eq. (3-58), dTdno / is determined by five parameters ( B , β , on)(∆ ,T and
cT ). Among these five, β and T can be treated as constants: β ~0.2 and T ~295K (room

48
temperature). Therefore, we only need to consider the remaining three parameters. A
smaller B helps to boost the dTdno / value. Among the LC materials investigated, we
found that the compounds containing isothiocyannato (NCS) polar group possess a
slightly smaller B coefficient and higher birefringence than the cyano (CN) compounds.
Therefore, the remaining two parameters, high birefringence and low clearing
temperature, play crucial roles in determining the dTdno / and cross-over temperature.
However, these two requirements are often contradicting to each other. Most of the high
birefringence LC compounds are associated with high melting and clearing temperatures
due to their long molecular conjugation. From Eq. (3-58), the cT effect is particularly
significant. If the cT of a LC material is much higher than room temperature, then its
cross-over temperature would be relatively high and 0/ <dTdno at room temperature.
Mixture E7 is such an example; its cT is ~60 oC and its dTdno / is negative at room
temperature.68
Although a large positive dTdno / can always be obtained by raising the operating
temperature to clearing point, in practice this is undesirable for two reasons. First, in this
regime a small temperature fluctuation would cause a large dTdno / change. Second,
light scattering due to LC director fluctuations is strong near the phase transition35. Many
devices are preferred to operate at room temperature. Thus, it is highly desirable to design
a LC mixture exhibiting a large dTdno / at room temperature.

49
3.7 Conclusion
In this chapter, we have reviewed the physical models for describing the
temperature effect on liquid crystal refractive indices. Each model has its merits and
shortcomings. Vuks model does not give a explict relationship between the temperature
and the LC refractive indices. Haller equation is an empirical equation which discloses
the detailed relationship between the LC birefringence and the temperature. The average
LC refractive index has a linear relationship with temperature. Based on Vuks model, we
derived the expressions for the average refractive index >< n and birefringence n∆ ,
respectively, by making some reasonable approximations. The four-parameter model was
obtained for describing the temperature effect on the liquid crystal refractive indices. The
temperature gradients of the extraordinary refractive index ( dTdne / ) and the ordinary
refractive index ( dTdno / ) were derived based on the four-parameter model. The concept
of the crossover temperature oT was proposed for the first time. Guidelines for
formulating liquid crystal mixtures with a high dTdno / value at room temperature are
established. High birefringence, lower clearing point and smaller B coefficient help to
boost dTdno / at room temperature. Based on these simple guidelines, we formulated
two exemplary liquid crystal mixtures, designated as UCF-1 and UCF-2, and compared
their physical properties with a commonly used commercial liquid crystal compound
5CB. The dTdno / of UCF-1 is ~4X higher than that of 5CB at room temperature.

50
CHAPTER 4: MEASUREMENTS
4.1 Introduction
In this chapter, we will describe our experimental methods for measuring the
refractive indices of liquid crystals. Both wavelength and temperature effects are
investigated. Several measurement methods have been reported for measuring the LC
refractive indices and birefringence, e.g., Abbe refractometer,45-50 wedeged-cell
refractometer method,58,59 phase retardation method,21,69,70,71 Talbot-Rayleigh
refractometer34, extension of phase modulation Ellipsometry method,72 Jelley-Leitz
Refractometer method,73 and spectroscopic ellipsometer method.74 Each measurement
method has its own merit and shortcomings.
Originally, Abbe refractometer was designed for measuring the refractive index of
isotropic media. To measure the anisotropic LC refractive indices, we must coat a
surfactant layer onto the surfaces of the two prisms in order to align the liquid crystals.
The surfactant could be lecithin or 0.294%wt HMAB + methanol solution. The LC
molecules are aligned perpendicular to the prism surfaces. Thus, we can measure both the
ordinary refractive index and extraordinary refractive index using a polarizing eyepiece.
However, the current Abbe refractometer could not be used to measure the LC refractive
indices at the infrared light spectrum since it is too faint to see the boundary line even we

51
install a infrared viewer. The wedged-cell refractometer method was used to measure the
index in the infrared region. By measuring the distance between the LC cell and the
screen, and the distance between the intersection points of refracted light beam with the
screen, we could get the refractive index data after some simple arithmetic calculations.
The phase retardation method can be used to measure the LC birefringence, but not for
the individual refractive indices. At this time, the spectroscopic ellipsometer method can
only be used to measure the index at room temprature. Though the Talbot-Rayleigh
refractometer can measure the index quickly, the measurement are not as accurate as the
Abbe refratometer.
In our lab, we use a multi-wavelength Abbe refractometer to measure the LC
refractive indices. We have six interference color filters with =λ 450, 486, 546, 589, 633,
and 656 nm. By changing the color filters, we can measure the LC refractive indices at
six different wavelengths. We use a circulating constant temperature bath to control the
temperature of the sample. The temperature range is from 10 to 55 oC. We use the
0.294% HMAB+methanol solution to align the LC molecules. The LC molecules are
aligned perpendicular to the surfaces of the prisms. The refractive index data are
measured by the wedged-cell refractometer method at =λ 1.55 and 10.6 mµ ,
respectively. The measured data at the visible and infrared regions are used to validate
the physical models we derived. The UV absorption spectra affect the material’s
photostability and birefringence. The UV absorption spectra of several liquid crystals are
also measured and analyzed.

52
4.2 Measurement of liquid crystal refractive indices at visible light spectrum
We measured the refractive indices of dozens of liquid crystals using a Multi-
wavelength Abbe refractometer (Atago DR-M4) at λ=450, 486, 546, 589, 633, and 656
nm. The light source employed in the experiment is a unpolarized halogen lamp. The
accuracy of the Abbe refractometer is up to the fourth decimal. For a given wavelength,
we measured the refractive indices from 15 to 55 oC at 5 oC intervals. The temperature of
the Abbe refractometer is controlled by a circulating constant temperature bath (Atago
Model 60-C3). The temperature accuracy is 2.0± oC. The LC molecules are aligned
perpendicular to the main and secondary prism surfaces of the Abbe refractometer by
coating these two surfaces with a surfactant comprising of 0.294 wt% hexadecyletri-
methyle-ammonium bromide (HMAB) in methanol solution. Both en and on are
obtained through a polarizing eyepiece. Figure 4 shows the multiwavlength Abbe
refractometer with a circulating temperature bath in our lab.

53
Figure 4: The multiwavelength Abbe refractometer (Atago: DR-M4) including a circulating constant bath and six interference color filters.
The measured refractive index data of liquid crystals at the visible light spectrum
are listed in the tables below:
Table 1: The measured refractive indices (ne and no) of MLC-9200-000 at λ=450, 486, 546, 589, 633, and 656 nm at different temperatures. The data with an asterisk are fitting values using the extended Cauchy equation, Eqs. (2-18) and (2-19) because these values are too small to measure from our Abbe refractometer.
λ (nm)
T 450 486 546 589 633 656
(oC ) ne no ne no ne no ne no ne no ne no
15
20
25
30
35
40
45
50
55
1.5821
1.5788
1.5755
1.5729
1.5683
1.5673
1.5616
1.5594
1.5544
1.4932
1.4901
1.4885
1.4882*
1.4844*
1.4820*
1.4786*
1.4791*
1.4768*
1.5764
1.5730
1.5698
1.5669
1.5637
1.5601
1.5565
1.5534
1.5494
1.4884
1.4861
1.4845
1.4838*
1.4807*
1.4784*
1.4756*
1.4757*
1.4736*
1.5689
1.5662
1.5634
1.5602
1.5571
1.5536
1.5505
1.5468
1.5430
1.4824
1.4812
1.4793
1.4782
1.4762
1.4741
1.4721
1.4715
1.4697
1.5657
1.5625
1.5596
1.5565
1.5533
1.5501
1.5466
1.5430
1.5396
1.4794
1.478
1.4767
1.4752
1.4737
1.4716
1.4701
1.4692
1.4675
1.5626
1.5598
1.5569
1.5532
1.5507
1.5472
1.5440
1.5407
1.5368
1.4771
1.4762
1.4746
1.4727
1.4717
1.4695
1.4680
1.4674
1.4661
1.5613
1.5584
1.5553
1.5518
1.5497
1.5458
1.5430
1.5396
1.5352
1.4752
1.4752
1.4732
1.4717
1.4708
1.4688
1.4679
1.4665
1.4649

54
Table 2: The measured refractive indices (ne and no) of MLC-9200-100 at λ=450, 486, 546, 589, 633, and 656 nm at different temperatures. The data with an asterisk are fitting values using the extended Cauchy equation, Eqs. (2-18) and (2-19) because these values are too small to measure from our Abbe refractometer.
Table 3: The measured refractive indices (ne and no) of MLC-6608 at λ=450, 486, 546, 589, 633, and 656 nm at different temperatures. The data with an asterisk are fitting values using the extended Cauchy equation, Eqs. (2-18) and (2-19) because these values are too small to measure from our Abbe refractometer.
λ (nm)
T 450 486 546 589 633 656
(oC ) ne no ne no ne no ne no ne no ne no
15
20
25
30
35
40
45
50
55
1.6343
1.6312
1.6276
1.6251
1.6209
1.6156
1.6116
1.6072
1.6024
1.5081*
1.5057*
1.5050*
1.5037*
1.5015*
1.5015*
1.5002*
1.4994*
1.4974*
1.6272
1.6233
1.6203
1.6164
1.6126
1.6085
1.6052
1.6006
1.5961
1.5038
1.5022
1.5005
1.4993
1.4974
1.4969*
1.4954*
1.4945*
1.4929*
1.6169
1.6131
1.6095
1.6059
1.6025
1.5988
1.5948
1.5905
1.5861
1.4977
1.4962
1.4954
1.4938
1.4924
1.4913
1.4894
1.4884
1.4872
1.6112
1.6078
1.6041
1.6010
1.5970
1.5934
1.5897
1.5854
1.5811
1.4949
1.4934
1.4919
1.4908
1.4890
1.4879
1.4864
1.4853
1.4842
1.607
1.6039
1.5998
1.5967
1.5931
1.5891
1.5854
1.5815
1.5770
1.4926
1.4908
1.4895
1.4884
1.4871
1.4855
1.4836
1.4825
1.4816
1.6056
1.6013
1.5984
1.5951
1.5914
1.5878
1.5838
1.5797
1.5756
1.4916
1.4900
1.4887
1.4875
1.4858
1.4846
1.4825
1.4813
1.4806
λ (nm)
T 450 486 546 589 633 656
(oC ) ne no ne no ne no ne no ne no ne no
15
20
25
30
35
40
45
50
55
1.5766
1.5733
1.5704
1.5678
1.5645
1.5612
1.5577
1.5543
1.5498
1.4887*
1.4859*
1.4854*
1.4826*
1.4823*
1.4782*
1.4783*
1.4755*
1.4734*
1.5717
1.5687
1.5655
1.5628
1.5598
1.5558
1.553
1.5494
1.5453
1.4852*
1.4828*
1.4819*
1.4794*
1.4787*
1.4753*
1.4749*
1.4725*
1.4706*
1.5654
1.5622
1.5595
1.5564
1.5534
1.5500
1.5467
1.5432
1.5396
1.4808
1.4789
1.4775
1.4754
1.4742
1.4718
1.4707
1.4688
1.4672
1.5621
1.5595
1.5562
1.553
1.5500
1.5468
1.5436
1.5399
1.5361
1.4785
1.4768
1.4753
1.4733
1.4718
1.4699
1.4685
1.4668
1.4653
1.5592
1.5565
1.5531
1.5504
1.5473
1.5441
1.5407
1.5375
1.5338
1.4763
1.4751
1.4731
1.4714
1.4696
1.4681
1.4664
1.4653
1.4637
1.5581
1.5554
1.5522
1.5495
1.5466
1.5433
1.5399
1.5362
1.533
1.4758
1.4745
1.4725
1.4708
1.469
1.4677
1.4659
1.4644
1.4631

55
Table 4: The measured refractive indices (ne and no) of TL-216 at λ=450, 486, 546, 589, 633, and 656 nm at different temperature.
λ (nm)
T 450 486 546 589 633 656
(oC ) ne no ne no ne no ne no ne no ne no
15
20
25
30
35
40
45
50
55
1.7910
1.7851
1.7806
1.7753
1.7696
1.7640
1.7566
1.7497
1.7413
1.5430
1.5408
1.5403
1.5400
1.5401
1.5381
1.5368
1.5375
1.5379
1.7730
1.7677
1.7623
1.7570
1.7506
1.7448
1.7388
1.7321
1.7247
1.5365
1.5349
1.5340
1.5334
1.5332
1.5318
1.5309
1.5310
1.5314
1.7520
1.7472
1.7412
1.7361
1.7312
1.7251
1.7190
1.7127
1.7048
1.5290
1.5276
1.5268
1.5254
1.525
1.5242
1.5238
1.5234
1.5232
1.7408
1.7365
1.7315
1.7259
1.7211
1.7156
1.7093
1.7030
1.6957
1.5246
1.5240
1.5228
1.5218
1.5209
1.5204
1.5198
1.5193
1.5196
1.7328
1.7288
1.7235
1.7186
1.7136
1.7081
1.7021
1.6959
1.6891
1.5212
1.5203
1.5192
1.5185
1.5175
1.5170
1.5163
1.5158
1.5159
1.7292
1.7245
1.7184
1.7145
1.7094
1.7045
1.6987
1.6925
1.6861
1.5204
1.5190
1.5174
1.5170
1.5161
1.5158
1.5155
1.5149
1.5143
Table 5: The measured refractive indices (ne and no) of E44 at λ=450, 486, 546, 589, 633, and 656 nm at different temperatures.
λ (nm)
T 450 486 546 589 633 656
(oC ) ne no ne no ne no ne no ne no ne no
15
20
25
30
35
40
45
50
55
1.8652
1.8607
1.8539
1.848
1.8408
1.8338
1.8262
1.8192
1.8111
1.5509
1.5485
1.5478
1.5491
1.5464
1.5474
1.5464
1.5468
1.5464
1.8393
1.8339
1.8279
1.8221
1.8155
1.8089
1.8018
1.7948
1.7871
1.5429
1.5415
1.5408
1.5407
1.5393
1.5391
1.5389
1.5384
1.5384
1.8102
1.8048
1.7993
1.7934
1.7874
1.7809
1.7747
1.7679
1.7604
1.5338
1.5330
1.5322
1.5315
1.5308
1.5296
1.5298
1.5291
1.5289
1.7960
1.7906
1.7855
1.7800
1.7742
1.7679
1.7614
1.7547
1.7480
1.5295
1.5285
1.5275
1.5269
1.5262
1.5251
1.5250
1.5246
1.5244
1.7856
1.7806
1.7754
1.7699
1.7643
1.7579
1.7516
1.7454
1.7384
1.5259
1.5245
1.5242
1.5233
1.5226
1.5217
1.5208
1.5211
1.5202
1.7807
1.7760
1.7709
1.7653
1.7595
1.7533
1.7473
1.7410
1.7343
1.5245
1.5233
1.5221
1.5222
1.5213
1.5198
1.5196
1.5198
1.5189

56
Table 6: The measured refractive indices (ne and no) of E7 at λ=450, 486, 546, 589, 633,
and 656 nm at different temperature.
λ (nm)
T 450 486 546 589 633 656
(oC ) ne no ne no ne no ne no ne no ne no
15
20
25
30
35
40
45
50
55
1.817
1.8084
1.8005
1.7909
1.7811
1.7695
1.7549
1.7355
1.6936
1.5435
1.5431
1.5424
1.543
1.5448
1.547
1.5491
1.5538
1.569
1.7921
1.7847
1.7763
1.7679
1.7581
1.7472
1.7333
1.7154
1.6779
1.536
1.5357
1.5353
1.5357
1.5369
1.5383
1.5406
1.5449
1.5588
1.7664
1.7589
1.7512
1.7433
1.7344
1.7237
1.7109
1.6941
1.6601
1.5273
1.5269
1.5268
1.5271
1.5277
1.5287
1.5308
1.535
1.5479
1.7542
1.7466
1.7394
1.7317
1.7231
1.7124
1.7001
1.6837
1.6511
1.523
1.5227
1.5225
1.5226
1.5231
1.5239
1.5261
1.5299
1.5428
1.7446
1.7378
1.7305
1.7229
1.7142
1.7037
1.6919
1.6761
1.644
1.5197
1.5188
1.5189
1.5189
1.5191
1.5205
1.5221
1.526
1.5377
1.7407
1.7338
1.7263
1.719
1.7102
1.7001
1.6882
1.6721
1.6405
1.5179
1.5177
1.5176
1.5177
1.5179
1.5189
1.5206
1.5246
1.5353

57
Table 7: Measured refractive indices ( en and on ) of 5CB at λ=546, 589, and 633 nm, and at different temperatures.
λ (nm)
T ( oC ) 546 589 633
ne no ne no ne no
11.4
12.3
13.2
14.2
15.1
16.1
17.0
18.4
20.3
22.5
25.4
27.2
29.6
32.6
33.4
34.7
36.1
38.0
40.0
42.0
44.1
46.1
48.0
49.0
50.0
51.9
54.0
1.7566
1.7549
1.7531
1.7511
1.7493
1.7475
1.7454
1.7421
1.7378
1.7316
1.7232
1.7165
1.7056
1.6819
1.5940
1.5938
1.5927
1.5919
1.5907
1.5899
1.5887
1.5876
1.5868
1.5865
1.5859
1.5850
1.5838
1.5361
1.5362
1.5364
1.5364
1.5365
1.5370
1.5373
1.5374
1.5380
1.5394
1.5411
1.5429
1.5460
1.5544
1.5940
1.5938
1.5927
1.5919
1.5907
1.5899
1.5887
1.5876
1.5868
1.5865
1.5859
1.5850
1.5838
1.7448
1.7431
1.7414
1.7396
1.7378
1.736
1.734
1.7309
1.7264
1.7205
1.7124
1.7059
1.6954
1.6724
1.5872
1.5868
1.5859
1.5849
1.5840
1.5831
1.5820
1.5810
1.5801
1.5797
1.5793
1.5783
1.5771
1.5317
1.5316
1.5317
1.5317
1.5320
1.5323
1.5324
1.5327
1.5334
1.5343
1.5361
1.5380
1.5408
1.5487
1.5872
1.5868
1.5859
1.5849
1.5840
1.5831
1.5820
1.5810
1.5801
1.5797
1.5793
1.5783
1.5771
1.7361
1.7342
1.7328
1.7309
1.7289
1.7271
1.7253
1.7222
1.7181
1.7123
1.7038
1.6977
1.6876
1.6654
1.5820
1.5815
1.5809
1.5795
1.5785
1.5776
1.5770
1.5758
1.5748
1.5745
1.5739
1.5729
1.5723
1.5281
1.5274
1.5279
1.5279
1.5280
1.5283
1.5285
1.5288
1.5295
1.5305
1.5321
1.5336
1.5364
1.5443
1.5820
1.5815
1.5809
1.5795
1.5785
1.5776
1.5770
1.5758
1.5748
1.5745
1.5739
1.5729
1.5723

58
Table 8: Measured refractive indices ( en and on ) of 5PCH at λ=546, 589, and 633 nm,
and at different temperatures.
λ (nm)
T (oC) 546 589 633
ne no ne no ne no
24. 9
30. 1
34. 1
39. 2
44. 2
49. 3
50. 4
51. 9
52. 9
54. 2
55. 2
56. 0
57. 0
1. 6079
1. 6064
1. 6032
1. 5969
1. 5893
1. 5778
1. 5738
1. 5683
1. 5143
1. 5136
1. 5131
1. 5127
1. 5123
1. 4907
1. 4904
1. 4893
1. 4890
1. 4888
1. 4902
1. 4911
1. 4933
1. 5143
1. 5136
1. 5131
1. 5127
1. 5123
1. 6036
1. 6021
1. 5984
1. 5925
1. 5848
1. 5734
1. 5697
1. 5637
1. 5109
1. 5102
1. 5097
1. 5094
1. 5089
1. 4878
1. 4873
1. 4866
1. 4861
1. 4861
1. 4875
1. 4883
1. 4901
1. 5109
1. 5102
1. 5097
1. 5094
1. 5089
1. 6001
1. 5985
1. 5944
1. 5886
1. 5811
1. 5695
1. 5665
1. 5593
1. 5080
1. 5074
1. 5068
1. 5064
1. 5061
1. 4854
1. 4849
1. 4842
1. 4835
1. 4833
1. 4844
1. 4856
1. 4869
1. 5080
1. 5074
1. 5068
1. 5064
1. 5061

59
Table 9: Measured refractive indices ( en and on ) of MLC-6241-000 at λ=589, 633 and 656 nm, and at different temperatures.
λ (nm)
T ( oC ) 589 633 656
ne no ne no ne no
11. 7
13. 5
16. 6
21. 2
25. 2
29. 9
34. 5
39. 9
44. 6
49. 4
53. 7
1. 5682
1. 5676
1. 5661
1. 5637
1. 5614
1. 5587
1. 5557
1. 5515
1. 5494
1. 5469
1. 5443
1. 4796
1. 4794
1. 4782
1. 4768
1. 4753
1. 4742
1. 4727
1. 4706
1. 4695
1. 4678
1. 4673
1. 5657
1. 5650
1. 5634
1. 5609
1. 5587
1. 5564
1. 5543
1. 5504
1. 5472
1. 5443
1. 5413
1. 4779
1. 4772
1. 4762
1. 4744
1. 4739
1. 4724
1. 4712
1. 4697
1. 4682
1. 4662
1. 4651
1. 5647
1. 5634
1. 5619
1. 5595
1. 5568
1. 5548
1. 5509
1. 5475
1. 5446
1. 5426
1. 5395
1. 4771
1. 4765
1. 4755
1. 4738
1. 4729
1. 4714
1. 4699
1. 4683
1. 4671
1. 4655
1. 4640

60
4.3 Measurement of liquid crystal refractive indices at infrared light spectrum
We use the wedged-cell refractometer method to measure the LC refractive
indices at wavelength equal to 1.55 and 10.6 mµ .58,59 Figure 5 depicts the experimental
apparatus for measuring the refractive indices of E7 at λ=1.55 and 10.6 µm. A laser diode
operating at the fundamental Gaussian mode was used as the light source. The laser was
especially designed to be injected into an optical fiber. In order to obtain a free
propagating laser beam, a collimator was connected to the output side of the optical fiber.
The laser beam was linearly polarized by means of a polarizer and the polarization axis
was 45o with respect to the LC directors. The beam diameter was condensed to ~1 mm by
two con-focal lenses (L1 and L2) shown in Fig. 1. To form a wedged LC cell, two ITO
(indium-tin-oxide) glass substrates were separated by two spacers having different
thicknesses. The wedge angle was measured by an optical method to be θ = 0.04017
radians with a precision of 6×10⁻⁵ radians.

61
Figure 5: The experimental apparatus for measuring the refractive indexes at IR laser wavelengths. 1) Laser source. 2) Optical fiber. 3) Beam collimator. 4) Polarizer. 5) Thermostat containing the wedged LC cell. 6) Extraordinary beam. 7) Ordinary beam. 8) Micrometric track. 9) Point-like detector. 10) Digital oscilloscope. 11) Temperature controller. L1 and L2 are two con-focal lenses acting as a beam condenser.
The alignment of the LC inside the cell is planar which was obtained by buffing
the spin-coated poly-vinyl alcohol layer. The assembled LC cell exhibited a good
molecular alignment, as inspected from a polarizing optical microscope. During
experiments, the front substrate was arranged to be normal to the incoming infrared laser
beam. The wedged cell was enclosed inside a thermostat and the sample temperature was
controlled within 0.1 oC accuracy. A point-like detector designed for operation at λ=1.55
or 10.6 µm was mounted on a micrometric track. Under such condition, the detector can
be moved up and down with a very precise control of its position. The position of the
refracted laser beam is easily detected by moving the detector on the track. The detector
signal is displayed on a LeCroy digital oscilloscope. The measurement principle consists
of the evaluation of the deviation angle experienced by the laser beam due to the

62
refraction of the beams by the LC material. In fact, when the laser beam passes through
the wedged LC cell it undergoes a splitting process, and two beams (ordinary and
extraordinary) emerge from the cell. The refractive indices are then retrieved by using the
Snell law and simple geometrical calculations. The little shifts due to the presence of the
glass substrates are also taken into account. The accuracy on the measurement of the
refractive indices is estimated to be ~0.7 %.
The experimental apparatus used for the measurement at 10.6 µm wavelength is
analogous to the aforementioned one. The laser source is a CW CO2 laser that operates on
the fundamental Gaussian mode at λ = 10.6 µm (line P20). The detector used is the
infrared pyroelectric video camera (Spiricon Pyrocam III, model PY-III-C-A). The two
glass substrates of the wedged cell are now replaced by two ZnSe plates that allow the
transmission of the CO2 laser beam. In this case, the estimated accuracy on the refractive
indices is 0.5 %.36
The refractive index data of E7 measured at wavelength equal to 1.55 and 10.6
µm are listed in Table 10.

63
Table 10: Measured refractive indices ( en and on ) of E7 at λ=1.55 and 10.6 µm, at different temperatures.
λ (µm) 1.55 10.6 T (oC) ne no
T (oC) ne no 15.6 20.3 26 29.1 35.2 40.4 45.4 49.6 55.5 58.6 60.6 65 68.5
1.70869 1.70004 1.69239 1.68706 1.67841 1.66976 1.65744 1.65145 1.62782 1.60551 1.54858 1.54558 1.54425
1.50928 1.51061 1.50895 1.50661 1.50495 1.50562 1.50695 1.50761 1.51427 1.51827 1.54858 1.54558 1.54425
18.6 20.2 26 29.6 36.2 40.7 46.1 50.1 55 57 57.2 57.4 57.8
1.69624 1.69271 1.68795 1.68459 1.67454 1.6726 1.66271 1.66042 1.65389 1.62777 1.61154 1.60271 1.59989
1.49188 1.494 1.49294 1.49964 1.49417 1.49682 1.49929 1.49805 1.50088 1.50829 1.51447 1.51447 1.51729

64
4.4 Measurement of UV absorption spectra
The UV absorption spectra of MLC-9200-000, MLC-9200-100, MLC-6608, and TL-
216 were measured at T = 23 oC by dissolving each LC mixture into a UV transparent LC
host MLC-6815. To avoid detector saturation, the guest LC mixture was controlled at 1
wt %. We used the dual channel Cary 500 UV spectrophotometer and quartz cells for the
UV measurements. The quartz substrates were sputtered with SiO2 alignment layers for
achieving homogeneous alignment, but no indium-tin-oxide conductive electrode was
deposited. The cell gap was controlled at d=6 µm.
Figure 6 depicts the UV absorption spectra of 1 wt % MLC-9200-000, MLC-9200-
100, MLC-6608, and TL-216 dissolved in MLC-6815. The dashed, dashed-dot, black
solid line, and grey solid line represent their UV absorption spectra, respectively. In Fig.
1, MLC-9200-100 has a longer resonance absorption wavelength than MLC-9200-000.
This explains why MLC-9200-100 ( n∆ ~0.114) exhibits a higher birefringence than
MLC-9200-000 ( n∆ ~0.085). MLC-9200-000 and MLC-6608 ( n∆ ~0.083) have similar
resonance absorption peaks so that the two LC mixtures have a comparable birefringence,
but their dielectric anisotropy has opposite signs. Among the four mixtures studied, TL-
216 has the longest absorption wavelengths. Thus, TL-216 has the highest birefringence
among these LC mixtures investigated. However, its UV stability is the worst among
these four. UV stability is especially important to LCoS projection display where the
ultra-high-pressure lamp emits harmful UV contents. Although UV and blue cutoff
wavelength filters are used to remove the harmful UV contents, any residual transmitted
UV light could degrade the long-term stability of the LC materials or alignment layers75.

65
Whichever fails first will deteriorate the LC panel’s overall performance and limit the
projector’s lifetime.
200 250 300 350 4000.0
0.1
0.2
0.3
0.4
0.5
0.6
0.7
0.8
0.9
O
ptic
al D
ensi
ty
Wavelength (nm)
MLC-9200-000 MLC-9200-100 MLC-6608 TL-216
Figure 6: UV absorption spectrum of 1 wt % MLC-9200-000, MLC-9200-000, MLC-6608, and TL-216 dissolved in a UV transparent MLC-6815 mixture. Measurement was made at T=23 oC. The dashed, dashed-dot, black solid, and grey solid lines are UV absorption spectra of MLC-9200-000, MLC-9200-100, MLC-6608, and TL-216, respectively. Cell gap d=6 µm.

66
4.5 Summary
We have measured the liquid crystal refractive indices using a multi-wavelength
Abbe refractometer in the visible spectral region and a wedged cell refractometer method
in the IR region. In the visible region, six interference color filters with =λ 450, 486, 546,
589, 633 and 656 nm are used. To investigate temperature effect, we use a circulating
constant temperature bath to control the sample temperature. The temperature range is
from 10 to 55 oC. The LC refractive indices at =λ 1.55 and 10.6 µm are measured by the
wedged-cell refractometer method. The UV absorption spectra of several liquid crystals
are measured, too. In Chapter 5, these experimental data are used to validate the physical
models we derived.

67
CHAPTER 5: EXPERIMENTAL VALIDATIONS OF THE DERIVED THEORETICAL MODEL
In this Chapter, the measured en and on data are used to validate the derived
theoretical models: extended Cauchy model, two-coefficient Cauchy model, four-
parameter model, and three-parameter parabolic model. We also show how to validate the
Vuks equation by using the experimental data of liquid crystals.
5.1 Extended and two-coefficient Cauchy models
The classical Cauchy model is used to describes the wavelength-dependent
refractive index of isotropic media. Here, we extend the Cauchy model to describing the
wavelength effect on the refractive indices of anisotropic liquid crystals, including low,
moderate, and high birefringence liquid crystals. The two-coefficient Cauchy model is
simplified from the extended Cauchy model to describe the wavelength dispersion of the
low birefringence liquid crystals. In this section, we will use several liquid crystals with
low, moderate, and high birefringence to validate the extended Cauchy model and the
simplified two-coefficient Cauchy model.
We have selected seven LC mixtures, MLC-9200-000, MLC-9200-100, MLC-
6241-000, MLC-6608, TL-216, E44, E7 and two LC compounds (5CB and 5PCH) as
examples to validate the physical models we derived. The first five LC mixtures are
commonly employed for TFT-LCD applications. MLC-9200-000 and MLC-9200-100 are
Merck two-bottle mixtures. These two mixtures have very similar physical properties
except for different birefringence. MLC-9200-000 has ∆n~0.085 and MLC-9200-100 has
∆n~0.114. By mixing these two bottles in a proper fraction, birefringence in the 0.085-

68
0.114 range can be formulated. The mixture MLC-6608 (∆n~0.083) has a negative
dielectric anisotropy, ∆ε~−4. It is a representative mixture for vertical alignment. Lastly,
TL-216 is a high birefringence (∆n~0.213) LC mixture used in a color-sequential liquid-
crystal-on-silicon (LCoS) projection display.76 Excellent agreement between theory and
experiment is obtained.
0.40 0.45 0.50 0.55 0.60 0.65 0.701.46
1.48
1.50
1.52
1.54
1.56
1.58
1.60
1.62
1.64
no
ne
25 oCMLC-9200-100
MLC-9200-000
Ref
ract
ive
Indi
ces
Wavelength (µm)
Figure 7: Wavelength-dependent refractive indices of MLC-9200-000 and MLC-9200- 100 at T= 25 oC. Open and filled circles and triangles, respectively, represent the experimental data for ne and no of MLC-9200-000 and MLC-9200-100. Solid and dashed lines are fittings by using the three-coefficient, Eqs. (2-7) and (2-8) and the two-coefficient, Eqs. (2-21) and (2-22) Cauchy models, respectively. The fitting parameters are listed in Table 11.
Figure 7 depicts the wavelength-dependent refractive indices of MLC-9200-000
and MLC-9200-100 at T = 25 oC. The open and filled circles represent the experimental
data of en and on for MLC-9200-000, and the open and filled triangles are the

69
corresponding en and on for MLC-9200-100, respectively. The solid and dashed lines are
fittings using the three-coefficient, Eqs. (2-18) and (2-19) and two-coefficient Cauchy
model Eqs. (2-21) and (2-22), respectively. Table 11 lists the fitting parameters. In figure
7, all the solid and dashed lines fit the experimental data very well and the dashed lines
almost completely overlap with the solid lines. It means the three- and two-coefficient
Cauchy models fit the experimental data of MLC-9200-000 and MLC-9200-100 equally
well. From Table 11, we find the fitting Cauchy coefficients Ce and Co are considerably
smaller than the Be and Bo for both MLC-9200-000 and MLC-9200-100. This indicates
that the magnitude of the 4−λ term is much smaller than that of the 2−λ term and can be
ignored. For low birefringence LC materials, the two-coefficient Cauchy model works
equally well as the three-coefficient one.

70
Table 11: The fitting parameters of MLC-9200-000, MLC-9200-100, MLC-6608, TL-216, E44, E7, 5CB, 5PCH, and MLC-6241-000 for the three- and two-coefficient Cauchy models. T=25 oC. The Cauchy coefficients B and C are in units of µm2 and µm4, respectively.
Materials Cauchy Models ne no
Ae Be Ce Ao Bo Co
MLC-9200-000 Three-coefficient 1.5382 0.0073 4.00× 10⁻⁵ 1.4600 0.0058 3.95× 10⁻¹⁷ Two-coefficient 1.5377 0.0076 1.4600 0.0058 MLC-9200-100 Three-coefficient 1.5720 0.0111 4.00× 10⁻⁵ 1.4740 0.0063 6.04× 10⁻¹⁸ Two-coefficient 1.5715 0.0114 1.4740 0.0063 MLC-6608 Three-coefficient 1.5359 0.0070 4.02× 10⁻¹⁷ 1.4609 0.0050 3.29× 10⁻¹⁷ Two-coefficient 1.5359 0.0070 1.4609 0.0050 TL-216 Three-coefficient 1.6772 0.0155 0.0011 1.4989 0.0079 0.0001 Two-coefficient 1.6640 0.0234 1.4976 0.0086 E44 Three-coefficient 1.7282 0.0121 0.0027 1.5006 0.0091 0.0001 Two-coefficient 1.6956 0.0316 1.4995 0.0098 E7 Three-coefficient 1.6933 0.0078 0.0028 1.4990 0.0072 0.0003 Two-coefficient 1.6594 0.0281 1.4952 0.0095 5CB Three-coefficient 1.6708 0.0081 0.0024 1.5139 0.0052 0.0008 Two-coefficient 1.6423 0.0251 1.5039 0.0112 5PCH Three-coefficient 1.5801 0.0073 0.0003 1.4718 0.0049 0.0002 Two-coefficient 1.5766 0.0094 1.4695 0.0064 MLC-6241-000 Three-coefficient 1.5397 0.0075 1.03× 10⁻⁵ 1.4601 0.0054 3.15× 10⁻¹⁷ Two-coefficient 1.5395 0.0076 1.4601 0.0054
Figure 8 depicts the wavelength-dependent refractive indices of MLC-6608 and
TL-216 at T =25 oC. MLC-6608 is a negative LC mixture; its dielectric anisotropy is
2.4−=∆ε . The open and filled circles and triangles represent the experimental data of
en and on for MLC-6608 and TL-216, respectively. The solid and dashed lines are
fittings using the three-coefficient Eqs. (2-18) and (2-19) and two-coefficient Cauchy
models Eqs. (2-21) and (2-22). The fitting parameters are listed in Table 2. In figure 8,
the dashed lines almost completely overlap with the solid lines; both models fit the
experimental data of MLC-6608 very well. However, there are some differences between
the fitting curves using the three- and two-coefficient models for TL-216. The fitting

71
error of the three-coefficient Cauchy model ( 2χ ~10-7) is one order smaller than that of
the two-coefficient Cauchy model ( 2χ ~10-6). Here, the 2χ deviation is defined as the
sum of the squares of observed values minus expected values and then divided by the
expected values. In Table 11, the Cauchy coefficients Ce and Co are considerably smaller
than Be and Bo for MLC-6608, however, the coefficient Ce is comparable to Be for TL-
216. This indicates that both the three- and two-coefficient Cauchy models fit the
experimental data of MLC-6608 well, but the three-coefficient Cauchy model fits the en
data better than the two-coefficient Cauchy model for TL-216. Thus, for TL-216 the 4−λ
term is comparable to the 2−λ term and cannot be ignored.
0.40 0.45 0.50 0.55 0.60 0.65 0.701.45
1.50
1.55
1.60
1.65
1.70
1.75
1.80
1.85
25 oC
no
ne
MLC-6608
TL-216
Refr
activ
e In
dice
s
Wavelength (µm)
Figure 8: Wavelength-dependent refractive indices of MLC-9200-000 and MLC-9200- 100 at T= 25 oC. Open and filled circles and triangles, respectively, represent the experimental data for ne and no of MLC-9200-000 and MLC-9200-100. Solid and dashed lines are fittings by using the three-coefficient, Eqs. (2-7) and (2-8) and the two- coefficient, Eqs. (2-21) and (2-22) Cauchy models, respectively. The fitting parameters are listed in Table 11.

72
In Figure 9, we show the wavelength-dependent refractive indices of E44, E7,
5CB, 5PCH and MLC-6241-000 at T=25 oC. The birefringence of E44, E7, 5CB, 5PCH
and MLC-6241-000 is ~0.258, 0.217, 0.177, 0.116 and 0.086, respectively, at λ=589 nm
and T=25 oC. The open and filled pentagons, circles, squares, upward- and downward-
triangles are the ne and no of E44, E7, 5CB, 5PCH and MLC-6241-000, respectively. The
solid and dashed lines are fittings using the three-coefficient, Eqs. (2-18) and (2-19), and
two-coefficient Eqs. (2-21) and (2-22) Cauchy models. The fitting parameters are listed
in Table 2. From figure 9, the three-coefficient Cauchy model fits the experimental ne and
no data for all the four liquid crystals well. However, the two-coefficient Cauchy model
does not fit the experimental results of E44, E7, and 5CB so nicely as the three-
coefficient Cauchy model because these three LCs have a higher birefringence. For
5PCH (∆n~0.1158), the two-coefficient Cauchy model fits the experimental ne and no
data fairly well although the three-coefficient Cauchy model has slightly better fitting.
For MLC-6241-000, the fittings by the three- and two-coefficient Cauchy models overlap
each other, similar to the other low birefringence liquid crystals. From Figures 7, 8, and 9,
we found a boundary value of birefringence ( 12.0=∆n ) below which the three- and two-
coefficient Cauchy models fit the LC refractive indices ne and no equally well. However,
for a high birefringence ( 12.0>∆n ) liquid crystal the three-coefficient Cauchy model
must be used.

73
0.40 0.45 0.50 0.55 0.60 0.65 0.701.45
1.50
1.55
1.60
1.65
1.70
1.75
1.80
1.85
1.90
no
ne
Ref
ract
ive
Indi
ces
Wavelength (µm)
E44 25 oC E7 5CB 5PCH 6241-000
Figure 9: Wavelength-dependent refractive indices of E44, E7, 5CB, 5PCH and MLC- 6241-000 at T=25 oC. The open and filled pentagons, circles, triangles, upward- and downward-triangles represent the experimental data of ne and no for E44, E7, 5CB, 5PCH, and MLC-6241-000, respectively. While solid and dashed lines are fittings using the three-coefficient Eqs. (2-18) and (2-19) and two-coefficient Eqs. (2-21) and (2-22) Cauchy models, respectively. The fitting parameters are listed in Table 11.
In summary, the two-coefficient Cauchy model can be used for describing the
wavelength effect of low birefringence ( 12.0<∆n ) LC mixtures, no matter they are
positive or negative ∆ε materials. Since the two-coefficient model has only two
parameters, it is more convenient to fit with experimental data. However, for a LC
mixture with high birefringence ( 12.0>∆n ), the three-coefficient Cauchy model should
be used because the 4−λ term is comparable to the 2−λ term and cannot be neglected.
Based on our experimental results of a dozen LC compounds and mixtures, n∆ ~0.12 can

74
be treated as the division between the 2-coefficient and 3-coefficient Cauchy models. In
addition, using the extended Cauchy model we can extrapolate the infrared refractive
indices based on the data measured in the visible spectral region. The extrapolated results
agree well with those measured directly.59

75
5.2 Valication of Vuks Model
Lorentz-Lorenz formula relates the refractive index with the polarizability of
isotropic media. It is widely used for the determination of the average polarizability of
anisotropic molecules. In 1964, Vuks made a drastic assumption that the internal field in
a crystal is the same in all directions and derived the Vuks equation based on the Lorentz-
Lorenz equation. Vuks equation correlates the individual component of refractive index
with the individual component of the polarizability. He used the experimental data of
several crystals, naphthalene, diphenyl, anthracene and phenanthrene, to validate the
equation and good agreement between theory and experiment was achieved. After four
decades, Vuks equation has been widely used to correlate the refractive indices with the
polarizabilites of liquid crystals. Moreover, several physical models are derived based on
the Vuks equation. Thus, it is necessary to validate the Vuks equation using the
experimental data of liquid crystals directly. The idea on how to validate Vuks equation
was shown in Sec. 3.3. We use low, moderate, and high-birefringence liquid crystals to
validate Vuks model.21
Figure 10 depicts the temperature-dependent birefringence of UCF-35, 5CB,
5PCH, MLC-6241-000 and UCF-280 measured at λ=589 nm. The filled circles, squares,
open circles, filled downward-triangles, and open upward-triangles are the measured
birefringence of UCF-35, 5CB, 5PCH, MLC-6241-000 and UCF-280, respectively, at
different temperatures. The temperature range for the experiment is from 10 to 55 oC. At
room temperature and λ=589 nm, the birefringence of UCF-35, 5CB, 5PCH, MLC-6241-
000 and UCF-280 is 0.35, 0.2, 0.12, 0.086 and 0.085, respectively. The solid lines
represent fittings using the Haller equation, Eq. (3-43). The clearing point for UCF-35,

76
5CB, 5PCH, MLC-6241-000, and UCF-280 is 95.3, 33.4, 52.9, 100 and 66.2 oC,
respectively. From these fittings, we find [ on)(∆ , β]= [0.5727, 0.2719], [0.3505, 0.1889],
[0.1706, 0.1512], [0.1221, 0.2209] and [0.1426, 0.2513] for UCF-35, 5CB, 5PCH, MLC-
6241-000 and UCF-280, respectively. Although UCF-280 has a larger on)(∆ than MLC-
6241-000, its clearing temperature is much lower. As a result, its birefringence at room
temperature is lower than that of MLC-6241-000 due to the order parameter effect.
280 285 290 295 300 305 310 315 320 325 330 3350.05
0.10
0.15
0.20
0.25
0.30
0.35
Bire
fring
ence
(∆n)
Temperature (K)
UCF-35 5CB 5PCH MLC-6241-000 UCF-280
Figure 10: Temperature-dependent birefringence (∆n) of UCF-35 (filled circles), 5CB (open squares), 5PCH (open circles), MLC-6241-000 (filled downward-triangles) and UCF-280 (open upward-triangles) at λ=589 nm. The five solid lines are fitting curves using β)/1()( co TTnn −∆=∆ , where Tc is the clearing point.

77
In Figure 11, we plot the values of ( 22 +>< n ) and ( 5.010 −>< n ) of 5CB and
5PCH in the same figure in order to validate Eq. (3-50) which is a close approximation of
Vuks equation. The filled and open squares, circles, and upward-triangles are the
measured values of 22 +>< n and 5.010 −>< n at λ =546, 589 and 633 nm,
respectively. From Fig. 5, we find that these data almost overlap each other. The
difference is as small as ~0.2% for 5CB and ~0.1% for 5PCH. From Eq. (3-36), the right
side of Eq. (3-50) can be written as
5.0)(105.010 −−=− BTAn . (5-1)

78
280 285 290 295 300 305 310 315 320 325 3304.25
4.30
4.35
4.40
4.45
4.50
4.55
4.60
4.65
4.70
5PCH
5CB
Left
and
right
term
s of
Eq.
(18)
Temperature (K)
546 nm 589 nm 633 nm
Figure 11: Validation of Eq. (3-50) using the experimental data of 5CB and 5PCH. Filled squares, circles and upward-triangles are the calculated values of 22 +>< n at λ=546, 589 and 633 nm, respectively. Open squares, circles and upward-triangles are the corresponding values of 5.010 −>< n . Solid lines are fitting results using Eq. (5-1).
The solid lines shown in Figure 11 are fitting results using Eq. (5-1). The fitting
parameters are: [A, B]= [1.7751�5.81x10⁻⁴], [1.7674�5.79x10⁻⁴], and [1.7601�5.75x10-
4] for 5CB at λ= 546, 589 and 633 nm, respectively. The corresponding [A, B] values for
5PCH are [1.6837 � 5.09x10⁻⁴], [1.6795 � 5.06x10⁻⁴], and [1.6684 � 4.82x10⁻⁴]. From
Figure 11, the agreement between experiment and fitting results is excellent for 5CB and
5PCH. The experimental data measured at different wavelengths and temperatures of
5CB and 5PCH all satisfy Eq. (3-50) very well. Therefore, Vuks equation is proven to be

79
self-consistent for describing the refractive indices of LC compounds (5CB and 5PCH)
although the isotropic local field is assumed.
280 290 300 310 320 3304.0
4.1
4.2
4.3
4.4
4.5
4.6
4.7
4.8
4.9
5.0
UCF-280
MLC-6241-000
λ=656 nm
UCF-35
Left
and
Rig
ht T
erm
s of
Eq.
(18)
Temperature (K)
Figure 12: Validation of Eq. (3-50) using the experimental data of UCF-35, UCF-280, and MLC-6241-000. Filled squares, circles and upward-triangles are the calculated values of 22 +>< n at λ=656 nm for UCF-35, MLC-6241-000 and UCF-280, respectively. Open squares, circles and upward-triangles are the calculated values of the corresponding values of 5.010 −>< n . Solid lines are fitting results using Eq. (5-1).
Figure 12 shows a similar plot for UCF-35, MLC-6241-000 and UCF-280. The
filled squares, circles and upward-triangles are the measured values for 22 +>< n at
λ =656 nm for UCF-35, MLC-6241-000 and UCF-280, respectively. The open squares,
circles, and upward-triangles are the corresponding values for 5.010 −n at λ=656 nm.
In Fig. 6, we plot the data at λ=656 nm because UCF-35 has more complete experimental

80
data at this wavelength. The refractive indices of these three LC mixtures vary from
~1.46 to ~1.86. Despite such variation, Eq. (3-50) still holds very well.
In Figure 12, all the experimental data of the left and right terms of Eq. (3-50)
overlap quite well for UCF-35, MLC-6241-000 and UCF-280 although UCF-35 has 4X
higher birefringence than the other two mixtures. The difference between the right- and
left-hand terms of Eq. (3-50) is as small as ~0.5% for UCF-35 and ~0.1% for MLC-6241-
000 and UCF-280. Solid lines are the fitting results using Eq. (5-1). The fitting
parameters are: [A, B]= [1.8003�5.12x10⁻⁴], [1.6216�4.05 x10⁻⁴], and [1.6511�4.79
x10-4] for UCF-35, MLC-6241-000 and UCF-280, respectively. The fitting results agree
very well with the experimental data. Therefore, Vuks equation is proven to be self-
consistent for both high and low birefringence LC mixtures.
As shown in Figs. 11 and 12, the 22 +n term is slightly larger than
the 5.010 −n term. This is because we have omitted the higher order terms while
deriving Eqs. (3-11) and (3-12) which, in turn, lead to Eqs. (3-48) and (3-50). The five
LC materials we selected have refractive index spanning from ~1.46 to ~1.86. All the
experimental data satisfy Eq. (3-50) quite well. It implies that the Vuks equation is valid
for describing LC refractive indices independent of their molecular structures and
electron conjugation length.
Since Vuks equation correlates the macroscopic refractive index to the
microscopic molecular polarizability, if we know refractive index, then we can calculate
the molecular polarizability, or vise versa. For instance, if we plug the measured en and

81
on data back to Eq. (3-4), we can calculate the eα and oα values of the five LC
compounds and mixtures at different temperatures and wavelengths.
In Eq. (3-4), there is still an unknown parameter N; the number of molecules per
unit volume. However, N is equal to MN Aρ , where ρ is the LC density, M is the
molecular weight, and AN is the Avogadro’s number. Rearranging Eq. (3-4), we find48
21
43
2
2
+><−
⋅=nn
NM e
Ae πρ
α , (5-2)
21
43
2
2
+><−
⋅=nn
NM o
Ao πρ
α . (5-3)
Let us use 5CB as an example to calculate the molecular polarizabilities, αe and
αo. For 5CB, the molecular weight is M=249.3 g/mol and the density )(Tρ is taken from
that measured by Zeller.62 Using our measured refractive indices at λ=589 nm, we can
calculate the αe and αo of 5CB from Eqs. (5-2) and (5-3).
Figure 13 plots the temperature-dependent αe, αo and α of 5CB at λ=589 nm.
The open and filled circles represent the calculated values for αe and αo, respectively. In
the isotropic state, αe and αo are equal. The open triangles represent the calculated
average polarizability <α> in the nematic phase. From Fig. 13, αe decreases while αo
increases as the temperature increases. However, the average polarizability α is quite
insensitive to the temperature. The average polarizability for 5CB at λ=589 nm is found
to be α ~ 323103.3 −−× cm , which agrees very well with the calculated value
( α ~ 3231025.3 −−× cm ) published by Sarkar et al.67

82
285 290 295 300 305 310 315 320 325 330
2.8
3.0
3.2
3.4
3.6
3.8
4.0
4.2
4.4
αo
<α>
αe
αe a
nd α
o (1
0-23 c
m-3
)
Temperature (K)
Figure 13: Temperature-dependent molecular polarizabilites, αe and αo, of 5CB at λ=589 nm. Open and filled circles are the results for αe and αo, respectively. Triangles represent the average polarizability <α>. In the isotropic phase, αe= αo.

83
5.3 Valication of Four-parameter Model and Three-parameter Parabolic Model
Temperature effect plays a key role for projection displays since the display panel
could reach 50 ~ 60 oC due to the thermal effect of the lamp. In chapter 3, we derived the
four-parameter model and three-parameter parabolic model for describing the
temperature effect on the LC refractive indices based on the Vuks equation. The four-
parameter model describes the temperature effect on the low, moderate, and high-
birefringence liquid crystals very well. The three-parameter parabolic model is mainly
used for describing the temperature effect of the low birefringence liquid crystals with a
high clearing temperature when the temperature is not close to the clearing temperature.
To validate the four-parameter model, we use the model to fit the experimental data of
5CB, 5PCH, MLC-6241-000, and UCF-35 measured at λ=546, 589, and 633 nm.
Excellent agreement between the four-parameter model and the experimental data is
obtained. To validate the three-parameter parabolic model, we fit the model with the
experimental data of MLC-6241-000. The agreement is also excellent.
5.3.1 Validation of the Four-parameter Model
Although the four-parameter model has four unknowns: A , B , on)(∆ and β ,
they can be obtained by the two-step fittings. In experiment, we measured the refractive
indices ( en and on ) using Abbe Refractometer at six wavelengths in the temperature
range from 10 to 55 oC. Once the refractive indices are measured, birefringence and

84
average refractive index can be calculated. The first step is to use Eq. (3-36) to fit the
average refractive index data and obtain parameters A and B. The second step is to use
Eq. (3-43) to fit the birefringence data and extract on)(∆ and β. Finally, we plug these
two sets of parameters into Eqs. (3-51) and (3-52) to calculate the refractive indices and
compare the calculated results with the measured ones. We use four different materials:
5CB, 5PCH, MLC-6241-000 and UCF-35 to validate the four-parameter model. At room
temperature, the birefringence of UCF-35, 5CB, 5PCH and MLC-6241-000 is 0.35, 0.2,
0.12 and 0.085, respectively, at λ=589 nm. And their clearing temperature is 368.3,
306.6, 325.9 and 373.7 K, respectively. Excellent agreement is obtained between the
calculated results and experimental data of these four different materials.
Figure 14 depicts the temperature-dependent average refractive index of 5CB,
5PCH, UCF-35 and MLC-6241-000 at λ=589 nm. Circles, upward-triangles, squares and
downward-triangles represent experimental data for 5CB, 5PCH, MLC-6241-000 and
UCF-35, respectively, while solid lines are fitting results using Eq. (3-36). The fitting
parameters for these four materials are listed in Table 12. The average refractive index
decreases linearly as the temperature increases. In the isotropic phase, the refractive index
also decreases linearly with the increased temperature. Near the isotropic temperature,
there is a sudden decrease in refractive index because of the second order phase transition
which results in a density fluctuation.62 The filled circles and triangles in Figure 14 are
the isotropic refractive index for 5CB and 5PCH, respectively. They also decrease
linearly with increasing temperature in the isotropic state, but the slope is slightly
different from that of the nematic state.

85
280 285 290 295 300 305 310 315 320 325 330 3351.48
1.50
1.52
1.54
1.56
1.58
1.60
1.62
1.64
1.66
MLC-6241-0005PCH
UCF-35
5CB
<n>
Temperature (K)
Figure 14: Temperature-dependent average refractive index <n> of 5CB, 5PCH, MLC- 6241-000 and UCF-35 at λ=589 nm. Open circles, upward-triangles, squares and downward-triangles are average refractive index <n> of 5CB, 5PCH, MLC-6241-000 and UCF-35, respectively. Solid lines are fittings by using Eq. (3-36). The fitting parameters are listed in Table 12. The filled circles and triangles are isotropic refractive index for 5CB and 5PCH, respectively.
Figure 10 depicts the temperature-dependent birefringence of 5CB, 5PCH, MLC-
6241-000 and UCF-35 at λ =589 nm. The filled circles, squares, open circles, filled
downward-triangles, and open upward-triangles are the measured birefringence of UCF-
35, 5CB, 5PCH, MLC-6241-000 and UCF-280, respectively, at different temperatures.
The solid lines are fitting results using Eq. (3-43). The fitting parameters for these four

86
materials at λ =589 nm are also listed in Table 12. Through fittings, we obtain parameters
on)(∆ and β.
Table 12: Fitting parameters for the average refractive index >< n and birefringence )( n∆ of four LCs at λ=589 nm.
LC <n> ∆n
A B (K-1) on)(∆ β
5CB 1.7674 5.79x10⁻⁴ 0.3505 0.1889
5PCH 1.6795 5.07x10⁻⁴ 0.1703 0.1491
MLC-6241-000 1.6233 4.00x10⁻⁴ 0.1224 0.2234
UCF-35 1.8187 5.32x10⁻⁴ 0.5727 0.2719
For a full color display, we need to know the refractive indices at the three
primary colors. Figure 15 depicts the temperature-dependent refractive indices of 5CB at
λ = 546, 589 and 633 nm. Squares, circles and triangles are experimental data measured
at λ= 546, 589, and 633 nm, respectively, and solid lines are fitting results using the four-
parameter model. The agreement is excellent. In an isotropic phase, the optical anisotropy
disappears, i.e. oe nn = , regardless of wavelength. The fitting parameters for the four-
parameter model are listed in Table 13. As shown in Figure 15, the agreement between
the four-parameter model and experimental data is excellent.
Due to the shorter molecular conjugation, 5PCH has a lower birefringence than
5CB, however, its clearing temperature is higher. Thus, similar to 5CB, 5PCH has been

87
widely used in many commercial LC mixtures. Figure 16 depicts the temperature-
dependent refractive indices of 5PCH at λ = 546, 589 and 633 nm. Squares, circles and
triangles are the experimental data measured at λ=546, 589, and 633 nm, respectively,
and solid lines are fitting results using the four-parameter model. Above clearing point
(Tc=325.9 K), the optical anisotropy vanishes so that oe nn = . The fitting parameters for
the four-parameter model are listed in Table 14. Excellent agreement between the four-
parameter model and experimental data is achieved.
280 290 300 310 320 3301.52
1.54
1.56
1.58
1.60
1.62
1.64
1.66
1.68
1.70
1.72
1.74
1.765CB
no
ne
Ref
ract
ive
Indi
ces
Temperature (K)
546 nm 589 nm 633 nm
Figure 15: Temperature-dependent refractive indices of 5CB at λ= 546, 589 and 633 nm. Squares, circles and triangles are experimental data for refractive indices measured at λ=546, 589 and 633 nm, respectively. Solid lines are fittings using the 4-parameter model Eqs., (3-51) and (3-52). The fitting parameters are listed in Table 13.

88
Table 13: Fitting parameters for the average refractive index >< n and birefringence )( n∆ of 5CB at λ=546, 589 and 633 nm.
λ (nm) <n> ∆n
A B (K-1) (∆n)o β
546 1.7751 5.81x10⁻⁴ 0.3594 0.1862
589 1.7674 5.79x10⁻⁴ 0.3505 0.1889
633 1.7601 5.75x10⁻⁴ 0.3389 0.1855
295 300 305 310 315 320 325 330
1.48
1.50
1.52
1.54
1.56
1.58
1.60
1.62
no
ne 546 nm 589 nm 633 nm
5PCH
Ref
ract
ive
Indi
ces
Temperature (K)
Figure 16: Temperature-dependent refractive indices of 5PCH at λ= 546, 589 and 633 nm. Squares, circles and triangles are experimental data for refractive indices measured at λ= 546, 589 and 633 nm, respectively. Solid lines are fittings using the 4-parameter model, Eqs. (3-51) and (3-52). The fitting parameters are listed in Table 14.

89
Table 14: Fitting parameters for the average refractive index >< n and birefringence )( n∆ of 5PCH at λ=546, 589 and 633 nm.
λ (nm) <n> ∆n
A B (K-1) (∆n)o β
546 1.6837 5.09x10⁻⁴ 0.1719 0.1473
589 1.6795 5.06x10⁻⁴ 0.1703 0.1491
633 1.6684 4.82x10⁻⁴ 0.1682 0.1487
Figure 17 depicts the temperature-dependent refractive indices of MLC-6241-000
and UCF-35 at λ = 589 nm. Circles and squares are measured refractive indices of MLC-
6241-000 and UCF-35, respectively. Solid lines are fitting results using the four-
parameter model. The fitting parameters for the four-parameter model are listed in Table
12. Excellent agreements are achieved between the four-parameter model and
experimental data.
Therefore, the four-parameter model fits very well with all the four LC materials
we studied although their birefringence values span a wide range. It is an accurate model
to describe the temperature effect on the refractive indices of liquid crystals.

90
280 290 300 310 320 330 340 350 360 370
1.45
1.50
1.55
1.60
1.65
1.70
1.75
1.80
1.85
1.90
1.95
no
neno
ne
UCF- 35
MLC-6241-000
Ref
ract
ive
Indi
ces
Temperature (K)
Figure 17: Temperature-dependent refractive indices of UCF-35 and MLC-6241-000 at λ= 589 nm. Squares and circles are experimental data for refractive indices of UCF-35 and MLC-6241-000, respectively. Solid lines are fittings using the four-parameter model, Eqs. (3-51) and (3-52). Dashed lines are fittings using the three-parameter parabolic model, Eqs. (3-53) and (3-54). The fitting parameters for the two models are listed in Tables 12 and 15, respectively.

91
5.3.2 Validation of the Three-parameter parabolic Model
For a low n∆ , high cT LC compound or mixture, the four-parameter model can be
reduced to a three-parameter parabolic model. To validate the parabolic model, we chose
two LC mixtures: MLC-6241-000 (∆n~0.085) and UCF-35 (∆n~0.35); their clearing
temperatures are 100 and 95.3 oC, respectively. Figure 17 depicts the temperature-
dependent refractive indices of MLC-6241-000 and UCF-35 at λ = 589 nm. Circles and
squares are measured refractive indices of MLC-6241-000 and UCF-35, respectively.
Solid lines are fitting results using the four-parameter model and dashed lines are fitting
results using the three-parametrer parabolic model. The fitting parameters for the three-
parameter parabolic model are listed in Table 15. For MLC-6241-000, the fitting
parameters (Ae, Be, Ce) for en are (1.6495, 2.00x10⁻⁵, 9.25x10⁻⁷) and (Ao, Bo, Co) for on
are (1.6343, 7.50x10⁻⁴, 7.21x10⁻⁷), respectively. For UCF-35, the fitting parameters (Ae,
Be, Ce) for en are (1.0367, -0.0069, 1.00x10⁻⁵) and (Ao, Bo, Co) for on are (1.8276,
0.0019, 3.24x10⁻⁶), respectively.
At room temperature, the birefringence of MLC-6241-000 and UCF-35 are
around 0.085 and 0.35 at λ= 589 nm, respectively. In Fig. 17, the three-parameter
parabolic model (dashed lines) fits the experimental data of the two materials very well
and almost overlaps each other with the four-parameter model when the temperature is
far from the clearing point. In the three-parameter model, we predict all the oeA , , oeB , and

92
oeC , coefficients should be positive. From this viewpoint, the three-parameter parabolic
model fits the experimental data of MLC-6241-000 better than that of UCF-35 because
one of the fitting parameters eB for UCF-35 is negative although its value is relatively
small. To explain this discrepancy, we need to review the assumption made during the
derivation of Eqs. (3-53) and (3-54). The two assumptions made there are: 1) the LC
birefringence is low, and 2) cTT << . Under these conditions, the four-parameter model
can be expanded into power series which leads to the four-parameter parabolic model.
However, the birefringence of UCF-35 is quite high so that the power expansion is less
accurate. Consequently, the fitting results for UCF-35 are less satisfactory. Thus, the
three-parameter parabolic model is more suitable for the low birefringence LC materials
while the operating temperature is far from the clearing temperature.
Table 15: Fitting parameters for the 3-parameter parabolic model, Eqs.(3-53) and (3-54).
λ=589 nm. The LC mixtures studied are MLC-6241-000 and UCF-35.
Materials ne no
Ae Be (K-1) Ce (K-2) Ao Bo(K-1) Co(K-2)
MLC-6241-000 1.6495 2.00x10⁻⁵ 9.25x10⁻⁷ 1.6343 7.50x10⁻⁴ 7.21x10⁻⁷
UCF-35 1.0367 -0.0069 1.00x10⁻⁵ 1.8276 0.00194 3.24x10⁻⁶

93
5.4 Summary
In chapter 5, the experimental data of liquid crystal refractive indices are used to
validate the extended three-coefficient and two-coefficient Cauchy models, the four-
parameter model, the three-parameter parabolic model , and the Vuks model. Liquid
crystals with low birefringence (MLC-9200-000, MLC-9200-100, MLC-6241-000, MLC-
6608, UCF-280), middle birefringence (5PCH, 5CB, E7, TL-216), and high birefringence
(E44, UCF-35) are used to validate these physical models. The three-coefficient Cauchy
model describes the wavelength effect on liquid crystal refractive indices very well,
whereas the two-coefficient Cauchy model is only suitable for the low birefringence
( 12.0<∆n ) liquid crystals. The four-parameter model describes the temperature effect
on liquid crystal refractive indices very well, whereas the three-parameter parabolic
model is only suitable for low birefringence liquid crystals with a high clearing point and
the temperature considered is far below the clearing point at the same time. Vuks model
which is very similar to Lorentz-Lorenz equation is proven to be self-consistent using our
experimental data for the first time. Experiment agrees very well with theory.

94
CHAPTER 6: APPLICATIONS IN DISPLAY AND PHOTONIC DEVICES
Liquid crystals are widely used in display and photonic devices. Our work not
only explains the essence of the physical phenomena for liquid crystals but also explores
new display and photonic applications. The derived physical models show how the LC
refractive indices change as a function of wavelength and temperature. It is important for
optimizing the device designs of direct-view and projection displays. The temperature
gradient models clearly the factors affecting the values of dTdne / and dTdno / . The
models tell us how to design a liquid crystal with high dTdno / at room temperature.
These high liquid crystals are useful for the thermally tunable liquid crystal photonic
crystal fibers (LCPCFs) and the thermal soliton in nematic liquid crystals. We could
extrapolate the LC refractive index data measured in the visible region to any infrared
wavelength using the extended Cauchy model and the four-parameter model. Thus, the
complete LC refractive index data in the infrared region could be achieved. It is
important to know the LC property in the infrared region in which liquid crystals are also
widely used. These models are also useful for finding the index-matched liquid crystals
and photopolymers for polymer dispersed liquid crystal (PDLC) applications.
This chapter describes the following topics: high temperature-gradient refractive
index liquid crystals, highly thermally tunable liquid crystal photonic crystal fibers, the

95
thermal solitons in nematic liquid crystals, infrared refractive indices of liquid crystals,
and index matchable study for polymer-dispersed liquid crystals (PDLC).
6.1 High Temperature-gradient Refractive Index Liquid Crystals
Based on the guidelines discussed in Section 3.6, we find that high birefringence,
low clearing point and small B coefficient help to enhance dTdno / value at room
temperature. We formulated two LC mixtures, UCF-1 and UCF-2, which exhibit a high
temperature-gradient refractive index.
In order to obtain high dTdno / at room temperature, we need to select liquid
crystals with high birefringence, lower clearing temperature and a small B coefficient.
To formulate such specific mixtures, we used some laterally substituted isothiocyannato
(NCS) tolanes.77,78 Due to the lateral fluoro or methyl substitution, these NCS tolanes
exhibit a relatively low clearing temperature. The compounds containing the NCS polar
group possesses a smaller B coefficient than the cyano (CN) compounds. The molecular
structures and their corresponding phase transition temperatures (PTT) are listed in Table
16.
The phase transition temperatures of these LC compounds were measured by
using a high sensitivity differential scanning calorimeter (DSC, TA Instrument Model Q-
100) at 2 oC/min scanning rate. By changing the ratio of these single compounds, we
prepared two mixtures, designated as UCF-1 and UCF-2.50 Their clearing temperatures
are 29.7 oC and 32.3 oC, respectively, and melting point below -20 oC. The physical

96
properties of UCF-1 and UCF-2 were measured at room temperature (23oC) and results
are listed in Table 17.
Table 16: Molecular structures and phase transition temperatures (PTT) of the compounds used for formulating mixtures. Here, Cr, N, S and I stand for crystalline, nematic, smectic, and isotropic phase, respectively.
LC compounds Structures PTT (oC)
CP3NCS C3H7 NCS Cr 3.0 N 41.3 I
PTP4NCS C4H9 NCS Cr 44.0 SK 70.5 SE 86.9 I
PTP(3F)4NCS C4H9 NCS
F
Cr 38.6 I
PTP(3Me)4NCS C5H11 NCS
Me
Cr 42.3 I
Table 17: Physical properties of UCF-1 and UCF-2. n∆ was measured at λ = 589 nm and T =23 oC.
LC Materials Vth (Vrms) εII ε⊥ ∆ε K11 (pN) K33 (pN) ∆n UCF-1 1.01 13.6 5.2 8.4 4.66 11.4 0.2545 UCF-2 1.15 13.6 4.9 8.7 5.90 11.0 0.2755
We measured the refractive indices of our new mixtures using the Multi-
wavelength Abbe refractometer and compared results with three commercial single

97
compounds: 5CB, 6CB, and 5PCH (cyano-chclohexane-phenyl). These LC mixtures are
nematic at room temperature (T~22oC).
To demonstrate the high n∆ advantage, we intentionally designed the UCF-1 and
UCF-2 to have similar clearing temperatures as 6CB and 5CB, respectively. Figure 18
depicts the temperature-dependent refractive indices of UCF-1 and 6CB at λ=589 nm.
Red circles and black triangles represent experimental data for UCF-1 and 6CB,
respectively, while solid lines are the fitting results using Eqs. (3-51) and (3-52). The
fitting parameters [ A , B ] and [ on)(∆ , β] are listed in Table 18. The agreement between
experiment and theory is pretty good.
285 290 295 300 305 310 315 320 3251.50
1.55
1.60
1.65
1.70
1.75
1.80
1.85
1.90
no
ne
no
ne
Ref
ract
ive
Indi
ces
Temperature (K)
UCF-1 6CB
Figure 18: Temperature-dependent refractive indices of UCF-1 and 6CB at λ=589 nm. Red circles and black triangles are refractive indices of UCF-1 and 6CB, respectively. Solid lines are fittings using Eqs. (3-51) and (3-52). The fitting parameters are listed in Table 18.

98
Table 18: Fitting parameters for the average refractive index <n> and birefringence (∆n) of the five LCs studied: UCF-1, 6CB, UCF-2, 5CB and 5PCH at λ=589 nm.
LC Materials <n> ∆n
A B (K-1) on)(∆ β
UCF-1 1.8112 5.08x10⁻⁴ 0.5397 0.1973
6CB 1.7491 5.47x10⁻⁴ 0.3026 0.1780 UCF-2 1.8100 4.90x10⁻⁴ 0.5416 0.1936 5CB 1.7674 5.79x10⁻⁴ 0.3505 0.1889
5PCH 1.6795 5.07x10⁻⁴ 0.1705 0.1512
From Figure 18, UCF-1 has a higher en , on and n∆ than 6CB. At room
temperature (T~295K), the birefringence of UCF-1 is n∆ ~0.25, as compared to ~0.15 for
6CB. As temperature increases, en decreases while on increases for both UCF-1 and 6CB
except at a different rate. The clearing point for UCF-1 and 6CB is 302.7K and 301.1K,
respectively. In the isotropic state, the refractive index of UCF-1 and 6CB decreases
linearly with increasing temperature. From Figure 18, we find UCF-1 has a much larger
dTdno / than 6CB in the nematic range. We will compare the dTdno / quantitatively for
all the LC studied later.
Similarly, we prepared UCF-2 to match the clearing temperature of 5CB. The
clearing point for UCF-2 and 5CB is 305.3K and 306.4 K, respectively. Figure 19 depicts
the temperature-dependent refractive indices of UCF-2 and 5CB at λ =589 nm. Magenta
circles and blue triangles represent experimental data for UCF-2 and 5CB, respectively,
while solid lines are fitting results using Eqs. (3-51) and (3-52). The fitting parameters

99
A , B , on)(∆ and β are also listed in Table 18. From Figure 19, UCF-2 has a higher en ,
on and n∆ than 5CB.
280 285 290 295 300 305 310 315 320 325 3301.50
1.55
1.60
1.65
1.70
1.75
1.80
1.85
1.90
no
ne
no
ne
Ref
ract
ive
Indi
ces
Temperature (K)
UCF-2 5CB
Figure 19: Temperature-dependent refractive indices of UCF-2 and 5CB at λ=589 nm. Magenta circles and blue triangles are refractive indices of UCF-2 and 5CB, respectively, and solid lines are fitting results using Eqs. (3-51) and (3-52). The fitting parameters are listed in Table 18.
Figure 20 depicts the temperature-dependent average refractive index >< n for
UCF-1, UCF-2, 6CB and 5CB at λ=589 nm. The circles represent the experimental data
and solid lines are fitting results using Eq. (3-36). Indeed, >< n decreases linearly as the
temperature increases. The fitting parameters A and B for these four materials are listed in
Table 18.

100
282 284 286 288 290 292 294 296 298 300 302 304 306 3081.56
1.57
1.58
1.59
1.60
1.61
1.62
1.63
1.64
1.65
1.66
1.67
1.68
6CB
5CB
UCF-2
UCF-1
<n>
Temperature (K)
Figure 20: Temperature-dependent average refractive index of UCF-1, UCF-2, 6CB and 5CB at λ=589 nm. Circles represent experimental data and solid lines are fitting results using Eq. (3-36). The fitting parameters A and B for these four materials are listed in Table 18.
Figure 21 depicts the temperature-dependent n∆ of UCF-1, UCF-2, 6CB and
5CB at λ =589 nm. The circles are experimental data while solid lines are fitting results
using Eq. (3-43). The fitting parameters 0)( n∆ and β are listed in Table 18.

101
282 284 286 288 290 292 294 296 298 300 302 304 3060.08
0.12
0.16
0.20
0.24
0.28
0.32
6CB
5CB
UCF-1
UCF-2
Bire
frin
genc
e (∆
n)
Temperature (K)
Figure 21: Temperature-dependent birefringence of UCF-1, UCF-2, 6CB and 5CB at λ=589 nm. Red, Magenta, black and blue circles represent experimental data while solid lines are fitting results using Eq. (3-43). The fitting parameters 0)( n∆ and β are listed in Table 18.
Using the parameters listed in Table 18, we are able to calculate the dTdne / and
dTdno / for UCF-1, UCF-2, 6CB, 5CB and 5PCH using Eqs. (3-57) and (3-58). Because
dTdne / is always negative, we plot dTdne /− instead. Results are shown in Figure 22
where solid and dashed lines represent the calculated dTdno / and dTdne /− by using
Eqs. (3-58) and (3-57) for these five LCs, respectively.

102
270 280 290 300 310 320 330-0.002
0.000
0.002
0.004
0.006
0.008
0.010
0.012 UCF-1 6CB UCF-2 5CB 5PCH
-dn e
/dT
and
dno/
dT
Temperature (K)270 280 290 300 310 320 330
-0.002
0.000
0.002
0.004
0.006
0.008
0.010
0.012 UCF-1 6CB UCF-2 5CB 5PCH
-dn e
/dT
and
dno/
dT
Temperature (K)
Figure 22: Temperature-dependent dTdno / of UCF-1, UCF-2, 6CB, 5CB, and 5PCH at λ=589 nm. Red, magenta, black, blue and green solid lines represent the calculated
dTdno / curves for UCF-1, UCF-2, 6CB, 5CB, and 5PCH, respectively, while the dashed lines represent the calculated dTdne /− curves. The parameters B, 0)( n∆ and β used in the calculations are listed in Table 18.
From Figure 22, we find the dTdne / (dashed lines) for both LCs remains
negative throughout their nematic range. That means the extraordinary refractive index
decreases as the temperature increases in the entire nematic range. However, dTdno /
changes sign at the cross-over temperature oT . For practical applications, it is desirable to
operate the LC device at room temperature (RT). Therefore, we should design a LC with
cross-over temperature lower than 295K to assure a positive dTdno / at RT. From Figure
14, the cross-over temperature ( oT ) of UCF-1, UCF-2, 6CB, 5CB and 5PCH is ~254K (or
-19 oC), ~255K (or -18 oC), ~280.8K (or 7.8 oC), ~282.9K (or 9.9oC) and ~315.9K (or

103
42.9oC), respectively. Based on Eq. (3-58), low cT and high birefringence are two
important factors for achieving a large dTdno / at RT. The clearing point for UCF-1,
UCF-2, 6CB, 5CB and 5PCH is 302.7K, 305.3K, 301.1K, 306.4K, and 326K,
respectively. Thus, the on of UCF-1, UCF-2, 6CB, and 5CB increases with increasing
temperature when T is greater than RT but less than cT . For 5PCH, its cross-over
temperature is higher than RT so that its dTdno / remains negative when oTT < . The
cross-over temperature we obtained for 5PCH agrees very well with the experimental
data reported by the Merck group. As the temperature approaches cT , both dTdne / and
dTdno / change dramatically as shown clearly in Figure 22.
From Fig. 14, the dTdno / (in unit of K-1) of UCF-1, UCF-2, 6CB, and 5CB at
RT is 1.73x10⁻³, 1.27x10⁻³, 9.24x10⁻⁴, and 4.60x10⁻⁴, respectively. Due to the higher
birefringence and a slightly lower clearing temperature, the dTdno / of UCF-1 is ~4X
higher than that of 5CB at RT. As T approaches cT , the dTdno / of each LC increases by
more than one order of magnitude than that in the nematic phase. However, in the
vicinity of phase transition temperature, a small temperature fluctuation would cause a
big change in dTdno / . Moreover, light scattering is present in the vicinity of phase
transition temperature.
In summary, We have analyzed the factors affecting the dTdno / of a LC
material. High birefringence and low clearing temperature are the two most critical
parameters. Based on these simple guidelines, we formulated two exemplary high
birefringence and low clearing temperature LC mixtures, UCF-1 and UCF-2, using the
laterally substituted isothiocyannato tolane compounds. The dTdno / of UCF-1 is about

104
4X higher than that of 5CB at room temperature. Moreover, the melting temperature of
UCF-1 and UCF-2 is below −20 oC, which is much lower than that of 5CB and 6CB. The
novel liquid crystals explores the new photonic applications such as highly thermal
tunable liquid crystal photonic crystal fibers, the thermal solitons in nematic liquid
crystals, and so on.
6.2 Highly Thermal Tunable Liquid Crystal Photonic Crystal Fibers
Photonic crystal fibers (PCFs), also referred to as microstructured optical fibers,
have a microstructured cross section of air holes running along the length of the fiber,
which is usually made from silica. In recent years much attention has been focused on
developing and designing photonic crystal fibers for various applications such as super-
continuum generation, nonlinear signal processing in high-speed optical time domain
multiplexing communication systems, high-power double-clad fiber lasers, air core fibers
for high power laser delivery, etc.
However, these applications are all relying on fibers with static properties. For
certain applications, it is desirable to dynamically alter the transmission properties of the
fiber and, thereby, tune/trim them. For example, in applications involving dispersion,
polarization or attenuation, the transmission properties can be changed while keeping the
signal within the fiber. For this purpose, photonic crystal fibers are an interesting
candidate, since the air holes give close access to the guiding light in the core and opens
up for using liquids or liquid crystals infiltrated into the capillaries instead of air.41 The
optical properties of the liquids or liquid crystals are usually easier to modify than the

105
silica, and this, therefore, opens up a new application, e.g., tunable photonic crystal fiber
based components.
Photonic crystal fibers can guide light using two very different principles. The
first is modified total-internal reflection (MTIR), which relies on guiding in a high-index
core surrounded by a low-index cladding materials. The second is guiding in a low-index
core surrounded by a cladding arrangement of high-index rods. Light coupled into the
core can be guided through anti-resonant reflection from the rods, which forms a sort of
2D Fabry-Perot activities surrounding the core.55 This is also referred to as the photonic
bandgap effect if the rods are periodic, because when calculating the allowed optical
modes in the periodic structure, gaps appear between bands of allowed modes. Within
these gaps, a guided mode can exist when a low-index defect is created in the periodic
structure.
The photonic bandgaps of a LC-filled PCF can be thermally tuned using nematic,
smectic A, and cholesteric mesophases, and these phases yields different functionalities
such as threshold switching or linear shifting of the bandgaps18. In the latter case, thermal
shifting the bandgaps can for example be achieved by utilizing the temperature
dependence of the ordinary refractive index, dTdno / , of nematic LCs by resistive or
optically induced heating.19 In this case, it is desirable to have a high tuning sensitivity
around room temperature in order to decrease the power consumption and ease the device
handling. Further, for applications involving for example dispersion trimming of short
laser pulses with high peak power it is desirable to use single-mode PCFs having a very
large mode area in order to have a low fraction of the field propagating in the LC.

106
In collaborating with a group from Danmark, we have demonstrated a highly
tunable large-core single-mode photonic bandgap fiber, which has a core diameter of 25
µm, an effective mode area of 440 µm2 and a high tuning sensitivity near room
temperature.20 This is achieved using UCF-1 and a three-rod core PCF.20
In this experiment we used two meters of a so-called LMA25 PCF, where the core
is surrounded by six rings of air holes arranged in a triangular lattice (Figure 23, inset).
The hole diameter (d), inter hole distance (Λ), core size and outer diameter was 2.9µm,
11.2µm, 25µm and 470µm, respectively. The large mode-area is obtained using a three-
rod core design9. The endlessly single mode property for index-guiding is retained by
scaling the relative hole diameter to d/Λ=0.26, which is slightly larger than the theoretical
limit of 0.25. High leakage and bend loss was observed for λ<1µm due to the relatively
small air holes.
First, the air holes were filled with the commercial available nematic LC E7
(Merck, Darmstadt, Germany) for 10mm of the length using capillary forces. The LC was
heated to isotropic phase and cooled down again slowly to achieve a homogenous
alignment. Polarized microscopy observations on a single silica capillary tube, with an
inner diameter of 6µm, indicated that the LC was planar aligned, i.e., with the LC
director aligned along the fiber axis, and, therefore, with the ordinary index ( on )
predominantly determining the spectral features of the fibre.
Figure 23 shows the transmission spectrum at temperatures between T = 40°C and
55°C in steps of 5°C. The transmission spectrum was obtained by butt-coupling an
endlessly single mode PCF with 10µm core diameter to both ends of the LMA25. White
light from a halogen-tungsten white light source was coupled into one end and the

107
transmission spectrum were recorded by an optical spectrum analyser (ANDO AQ6317B)
and normalized to the spectrum of an un-filled fibre.20
Figure 23: Transmission spectrum for the three-rod core PCF, where the air holes has been filled for 10mm of the length with the nematic liquid crystal E7 (Merck, Darmstadt, Germany). Inset shows an optical micrograph of the PCF end facet. Hole diameter and inter hole distance is 2.9µm and 11.2µm, respectively.
The bandgap centered around λ=1300nm has a bandwidth of 345-410nm, which
depends on temperature. As the temperature is increased, the center wavelength of the
bandgap shifts toward longer wavelength due to a positive dTdno / , which increases as
the clearing temperature of E7 is approached (Tc=58°C). At the same time, the bandwidth
of the bandgap increases, which implies that the shorter and longer bandgap edge to
experience a different shift, i.e., the long wavelength edge experiences a larger shift than
the short wavelength edge. The tuning sensitivity at 52.5°C was measured at the long

108
wavelength edge of the bandgap to 7nm/°C or 0.46% per °C when normalized to the
center wavelength at the bandgap edge. The small transmission peak at 1650nm is a
direct feature of the LC anisotropy, which causes a splitting in effective index of the TE01
and the TM01 cladding states supported by a LC infiltrated micro channel. The splitting is
observed since the electric field of the TE01 is solely in the transversal direction, while the
TM01 has a part of the electric field in the longitudinal direction. The TM01 mode,
therefore, experiences the extraordinary index of the LC and a gap in effective index is
formed between the bands derived from the TE01 and TM01 cladding states.
Simulations using the refractive indices of E7 presented in a previous
publication19 confirmed the presence of a guided mode in this bandgap. The simulation
were performed by solving the wave equation using a home-developed plane wave tool,
expanding the vectorial magnetic field of the eigenmodes in plane waves and using a
tensorial dielectric function as described by Meade79,80 and Johnson81. A supercell
consisting of 8x8 elementary cells of the periodic cladding structure is used. Supercell
convergence was enhanced by use of a coupling-reducing k-point82
The insertion loss of the LC device is difficult to establish exactly due to Fabry-
Perot effects between the two end-facets forming the butt coupling, which cause ripples
in the transmission spectrum. We estimate the loss to be less than 0.5dB.
The tuning sensitivity at room temperature can be increased using an optimized
LC mixture, which has high dTdno / at room temperature. Therefore, another LCPCF
sample was prepared using the same approach as with E7 but with the nematic LC
mixture UCF-1.50 Polarized microscopy observations on a single capillary tube with

109
UCF-1 also indicated a planar alignment of the LC director. Figure 24 shows the
transmission spectrum for the filled PCF.
Figure 24: Temperature dependent transmission spectra for the three-rod core PCF, where the air holes have been filled for 10mm of the length with UCF-1.
The spectrum shows high transmission in two bandgaps, bandgap A centered
around 1150 nm and bandgap B centered around 1700 nm. In between these two
bandgaps, a weaker transmission peak appears. This feature is also a direct consequence
of the LC anisotropy, which causes a splitting of the EH11 mode of an LC-infiltrated
microchannel from the HE12 and HE31 modes,83 so that a narrow bandgap opens up
between the cladding states derived from these modes. As observed from figure 24, the
width and transmission of the bandgap is reduced as the temperature of UCF-1 is
increased, which is due to a decreasing anisotropy as the temperature approaches the

110
clearing temperature of UCF-1 (Tc=29.7 °C), whereby the splitting of the EH11, HE12 and
HE31 cladding modes is diminished.
The refractive indices of UCF-1 are shown on figure 25 and were measured using
a Multiwavelength Abbe Refractometer (Atago DR-M4), and fitted using the extended
Cauchy equations.45 The extrapolated data at the infrared spectrum are used to do the
simulations.
0.4 0.6 0.8 1.0 1.2 1.4 1.61.5
1.6
1.7
1.8
1.9
2.0
no
ne
Ref
ract
ive
Indi
ces
Wavelength (µm)
25 oC 27.5 oC
Figure 25: Wavelength- and temperature-dependent refractive indices en and on of UCF- 1 at T=25 oC and 27.5 oC. Circles and rectangles are measured refractive indices at λ=450, 486, 546, 589, 633, and 656 nm and at T=25 oC and 27.5 oC, respectively. Solid and dashed curves are fitting curves using the extended Cauchy equation, Eqs. (2-7) and (2-8).The fitting curves are extrapolated to the infrared region based on the experimental data measured in the visible spectral region.

111
Figure 26 shows a comparison between the measured normalized transmission
spectrum of bandgap B and simulation of two-times the coupling loss between the index-
guided mode (unfilled PCF) and the bandgap-guided mode (LC filled PCF) evaluated
using overlap integrals and the refractive indices of UCF-1 shown on figure 25. Insets
show simulated mode fields of the index-guided mode in an unfilled PCF (TIR mode), a
PBG guided mode at the center and at the short wavelength edge of the bandgap.
Figure 26: Transmission spectrum of the UCF-1 filled PCF (solid line) and simulated coupling loss (dotted line) from the index-guiding to the bandgap-guiding part of the PCF. Insets show an index-guided mode and PBG guided modes at the bandgap center and edge.
Edge PBG
Center PBG
TIR mode

112
The simulated coupling loss agrees well with the shape of the PBG spectrum, and
it is, therefore, concluded that coupling loss (<0.5dB) is the dominant loss mechanism, as
was also found by Steinvurzel et al.84 The deviation at λ>1.65µm is caused by intensity
fluctuations of the halogen-tungsten white light source. In the center of Bandgap B,
simulation showed that only 0.4-0.5% of the field energy was propagating in the LC,
while simulation on a LC infiltrated single-rod core PCF with d=3µm and Λ=7µm7
indicated that approximately 4-5% of the field was propagating in the LC. This indicates
that the interaction of field and LC can be reduced one order of magnitude by using a
three-rod core design and reducing the relative hole size, while retaining high spectral
tuning sensitivity.
The spectral tuning sensitivity of the UCF-1 infiltrated PCF at 28°C was
measured at the long wavelength edge of bandgap A to 27nm/°C or 2.1% when
normalized. The tuning sensitivity at room temperature using UCF-1 is, therefore,
approximately 4.6 times higher than when using E7 above 50°C, which is directly related
to a higher temperature gradient of UCF-1 at room temperature compared to E7 as shown
in figure 27. The temperature gradient at λ=589 nm was calculated using a four-
parameter model17 for describing the temperature effect on the LC refractive indices. The
four parameters were gained by fitting the temperature dependent LC refractive indices
measured at temperature from 15 to 55 oC with a 5 oC interval and at λ=589 nm.

113
15 20 25 30 35 40 45 50 55 60-0.002
0.000
0.002
0.004
0.006
0.008
0.010
0.012
E7UCF-1
no ne
-dn e
/dT
and
dno/d
T
Temperature (oC)
Figure 27: dTdno / and dTdne /− for E7 and UCF-1 calculated at λ=589nm.
In summary , a highly tunable single mode photonic bandgap fiber device has
been demonstrated, which utilizes a three-rod core PCF and a specially prepared liquid
crystal mixture (UCF-1) with high temperature gradient refractive index at room
temperature in order to obtain a large mode area and high tuning sensitivity. The guided
mode has an effective area of 440 µm2 with an insertion loss of less than 0.5dB. The loss
is mainly attributed to coupling losses between the index-guided section and the bandgap-
guided section. The thermal tuning sensitivity of the spectral position of the bandgap was
measured to be 27 nm/°C around room temperature, which is 4.6 times higher than that
using the commercial E7 LC mixture operated at a temperature above 50 oC.

114
6.3 Thremal Solitons in nematic Liquid Crystals
Soliton is a wave that is defined by some rules: 1) a travelling wave, 2) carrying
an energy that is finite and localized, 3) stable, 4) display elastic behavior during
collision, and 5) as the beam carries on more energy than the solitary wave should do, it
splits into several solitons.38 The name soliton comes from this particle-like behavior. A
spatial optical soliton is an electromagnetic wave with its energy localized in space. The
2D+1 notation refers to the symmetry; the energy is confined in a 2D transverse plane
and propagates in the third direction. To excite a soliton would require a nonlinear
response from the material.85-92
In 2001, Warenghem reported the first “thermal soliton” observed in dye-doped
nematic liquid crystals confined in a capillary.36,37 For a range of input power, the laser
beam is no longer diverging nor focusing and it propagates straightly, over a long
distance compared to the Rayleigh range of the initial beam. The transverse profile of
these beams is studied and found to be constant. They also conducted the collision
experiments and found that the behavior of the thermal soliton is consistent with the
required elastic collision.
The nonlinear mechanism responsible for the thermal soliton is the thermal
indexing. The 5CB LC used has a positive temperature gradient of ordinary refractive
index. The role of the positive temperature gradient is to enhance the focusing property.
In their experiment, they doped a few percent of dye molecules into 5CB to increase the
temperature more quickly since the temperature gradient of 5CB in the room temperature

115
is not large enough to trigger the thermal soliton. Our high temperature-gradient LC
mixtures UCF-1 and UCF-2 would be particularly desirable for enhancing the thermal
soliton properties.
6.4 Infrared Refractive Indices of Liquid Crystals
Liquid crystals (LCs) possess a relatively large birefringence ( )oe nnn −=∆ in
the infrared (IR) region69-71 and have been used extensively for dynamic scene
projectors,93 laser beam steering,94,95 tunable bandgap photonic crystal fibers,16-20 and
millimeter-wave electronic phase shifters.96,97 Simple methods, such as voltage- or
wavelength-dependent phase retardation methods have been developed for measuring the
IR birefringence of LCs.52 However, only few methods, e.g., the Talbot-Rayleigh
refractometer and wedged cell refractometer, are available for measuring the individual
extraordinary ( en ) and ordinary ( on ) refractive indices in the IR region. By contrast, in
the visible spectral region, the LC refractive indices can be measured quite easily by the
commercial Abbe refractometer. Its accuracy is up to the fourth decimal point (±0.0002).
However, the usable range of Abbe refractometer is limited to the visible and near IR
spectra because of the faint refractive light from the main prism and the transparency of
the prism.
The major absorption of a LC compound occurs in two spectral regions:
ultraviolet (UV) and IR.12 The *σσ → electronic transition take place in the vacuum UV
(100-180 nm) region whereas the *ππ → electronic transition occur in the UV (180-400

116
nm) region. If a LC molecule has a longer conjugation, its electronic transition
wavelength would extend to a longer UV wavelength. In the near IR region, some
overtone molecular vibration bands appear. The fundamental molecular vibration bands,
such as CH, CN, and C=C, occur in the mid and long IR regions. Typically, the oscillator
strength of these vibration bands is about two orders of magnitude weaker than that of the
electronic transitions. Thus, the resonant enhancement of these bands to the LC
birefringence is localized. Thus, it is reasonable for us to extrapolate the data at the
visible light region to the infrared region.21,25
Next, we will show how to link the visible and IR refractive indices by the
extended Cauchy equations and validate the method. Then, we will show how to get the
refractive indices in the whole nematic phase based on the four-parameter model by using
the extrapolated en and on . First, we measured the refractive indices of E7 LC mixture at
six visible wavelengths using an Abbe refractometer and two IR wavelengths (λ=1.55
and 10.6 µm) using a wedged cell refractometer. We fit the visible refractive index data
with the extended Cauchy equation. Once the three Cauchy coefficients are obtained, we
use the extended Cauchy equations to extrapolate the refractive indices to the IR
wavelengths. These extrapolated data almost strike through the experimental results.
The refractive indices of E7 were measured at λ = 450, 486, 546, 589, 633, and
656 nm in the temperature range from 15 to 50 oC at 5 oC intervals and at λ=1.55 and
10.6 µm. The measured data are listed in Tables 6 and 10. Figure 28 depicts the
temperature-dependent refractive indices of E7 at λ=589 nm. Open squares, circles, and
upward-triangles represent en , on , and average refractive index n for E7, respectively.
The solid curves are fitting results using Eqs. (3-51) and (3-52). The fitting parameters

117
[ A , B , on)(∆ , β ] are [1.7546, 5.36x10⁻⁴, 0.3768, 0.2391]. The solid straight lines are
fitting results using Eq. (3-36). The fitting parameters [ A , B ] are [1.7546, 5.36x10⁻⁴].
Clearly, the average refractive index decreases linearly as the temperature increases.
285 290 295 300 305 310 315 320 325 3301.50
1.55
1.60
1.65
1.70
1.75
<n>
no
ne589 nm
R
efra
ctiv
e In
dice
s
Temperature (K)
Figure 28: Temperature-dependent refractive indices of E7 at λ= 589 nm. The open squares and circles represent the en and on measured at λ=589 nm using the multi- wavelength Abbe refractometer. The open upward triangles are average refractive index n calculated by the experimental data. The solid curves are the fittings using the four-
parameter model [Eqs. (3-51) and (3-52)]. The fitting parameters [ A , B , 0)( n∆ , β ] are [1.7546, 5.36x10⁻⁴, 0.3768, 0.2391]. The solid straight line is the fitting using Eq. (3-36). The fitting parameters [ A , B ] are [1.7546, 5.36x10⁻⁴].
Next, we use the extended Cauchy model to fit the refractive indices en and on ,
measured at the abovementioned visible wavelengths and temperature range. Then we get
the six Cauchy coefficients [ eA , eB , eC ] and [ oA , oB , oC ] for en and on , respectively.

118
In Table 19, we show the fitting parameters [ eA , eB , eC ] and [ oA , oB , oC ] for the
extended Cauchy model [(Eqs. (2-7) and (2-8)] in the temperature range from 15 to 50 oC
by using the experimental data measured in the visible spectrum.
Table 19: Fitting parameters for the extended Cauchy model [(Eqs. (2-7) and (2-8)] at different temperatures (in oC) by using the experimental data measured at visible wavelengths (in µm).
Temperature ne no
(oC) Ae Be (µm2) Ce (µm4) Ao Bo(µm2) Co(µm4)
15 1.7055 0.0087 0.0028 1.5006 0.0065 0.0004
20 1.6993 0.0085 0.0027 1.4998 0.0067 0.0004
25 1.6933 0.0078 0.0028 1.4994 0.0070 0.0004
30 1.6846 0.0090 0.0025 1.4989 0.0072 0.0004
35 1.6761 0.0091 0.0025 1.4987 0.0071 0.0004
40 1.6662 0.0091 0.0024 1.5033 0.0049 0.0008
45 1.6565 0.0083 0.0024 1.5018 0.0068 0.0006
50 1.6395 0.0095 0.0020 1.5062 0.0063 0.0006
Figure 29 depicts the wavelength-dependent refractive indices of E7 at T = 25 oC.
The open squares and circles represent the en and on of E7 in the visible region while
the downward and upward triangles stand for the measured data at λ= 1.55 and 10.6 µm,
respectively. The solid curves are the fittings to the experimental en and on data in the

119
visible spectrum by using the extended Cauchy model [Eqs. (2-7) and (2-8)]. The fitting
parameters are listed in Table 19. In figure 29, we extrapolate the extended Cauchy
model to the near and far infrared spectra. The extrapolated lines almost strike through
the center of the experimental data measured at λ=1.55 and 10.6 µm. The largest
difference between the extrapolated and experimental data is only 0.4%. Considering the
experimental error in the wedged cell refractometer method, the agreement between
experiment and theory is very good. Figure 21 also indicates that the refractive indices
will saturate in the far infrared region. The extended Cauchy model predicts that en and
on would saturate to Ae and Ao in the long IR wavelength, respectively. For E7, the
measured ( en , on ) at λ=10.6 µm are (1.6914, 1.4936) while the fitting parameters
( eA , oA ) are (1.6933, 1.4994). The difference is less than 0.38%.59
Temperature-dependent refractive indices are important for practical applications,
such as projection displays and thermal-induced photonic band-gap tuning. It is highly
desirable to predict the refractive indices at the designated operating temperature of a LC
device, especially in the IR region. Here, we extrapolate the IR refractive indices using
the extended Cauchy model and compare with those measured directly at λ=1.55 and
10.6 µm at T=15, 20, 25, 30, 35, 40, 45, and 50 oC. Then by using the four-parameter
model [Eqs. (3-51) and (3-52)] to fit the extrapolated data at λ=1.55 and 10.6 µm, we
obtain the refractive indices en and on in the whole nematic phase range at these two
wavelengths.

120
0 2 4 6 8 10 12
1.50
1.55
1.60
1.65
1.70
1.75
1.80
Ref
ract
ive
Indi
ces
Wavelength (µm)
ne
no
E7 25 oC
Figure 29: Wavelength-dependent refractive indices of E7 at T = 25 oC. The open squares and circles are the en and on of E7 measured in the visible spectrum. The solid curves are the fittings to the experimental data using the extended Cauchy model [Eqs. (2-7) and (2-8)]. The fitting parameters are listed in Table 19. The downward and upward triangles are en and on of E7 measured at T =25 oC and λ=1.55 and 10.6 µm, respectively.
Figure 30 depicts the temperature-dependent refractive indices of E7 at λ = 1.55
µm. The open circles are the en and on extrapolated from the extended Cauchy model.
The open triangles are the average refractive index n calculated from the extrapolated
en and on . The solid curves are the fittings using the four-parameter model [Eqs. (3-51)
and (3-52)]. The solid straight line is the fitting using Eq. (3-36). The fitting parameters
are listed in Table 20. The filled circles are the refractive indices measured by the wedged
LC cell refractometric method. The filled triangles are the average refractive index n

121
calculated from the experimental data. In Figure 30, excellent agreement among the
extended Cauchy model, four-parameter model, and measured experimental data is
found. The difference between the predicted values and the experimental data is less than
0.38%. The difference may be caused partly by the measurement error and by the local
molecular overtone vibration bands. In Figure 30, the average refractive index n
decreases linearly as the temperature increases. In the isotropic phase range, en equals to
on and the anisotropy vanishes. The refractive index in the isotropic phase also decreases
linearly as the temperature increases.

122
285 290 295 300 305 310 315 320 325 330 335 340 3451.48
1.50
1.52
1.54
1.56
1.58
1.60
1.62
1.64
1.66
1.68
1.70
1.72
<n>
no
ne
1.55 µm
Ref
ract
ive
Indi
ces
Temperature (K)
E7
Figure 30: Temperature-dependent refractive indices of E7 at λ=1.55 µm. The filled circles are the refractive indices en and on measured by the wedged LC cell method. The filled-triangles are the average refractive index <n> calculated by the experimental data. The open circles are the en and on extrapolated from the experimental data measured at visible spectrum using the extended Cauchy model. The open triangles are average refractive index <n> calculated by the extrapolated en and on . The solid curves are the fittings using Eqs. (3-51) and (3-52). The solid straight line is the fitting using Eq. (3-36). The fitting parameters are listed in Table 20

123
Table 20: Fitting parameters for the average refractive index n and birefringence )( n∆ of E7 at λ=1.55 and 10.6 µm calculated by the extrapolated refractive indices from the visible spectrum.
λ (µm) <n> ∆n
A B (K-1) (∆n)o β
1.55 1.7230 5.24x10⁻⁴ 0.3485 0.2542
10.6 1.7201 5.25x10⁻⁴ 0.3499 0.2579
Figure 31 depicts the temperature-dependent refractive indices of E7 at λ = 10.6
µm. The open circles represent the extrapolated en and on from the experimental data
measured at visible wavelengths using the extended Cauchy model. The open triangles
are the average refractive index n calculated by the extrapolated en and on . The solid
curves are the fittings using the four-parameter model [Eqs. (3-51) and (3-52)]. The solid
straight line is the fitting using Eq. (3-36). The fitting parameters are listed in Table 20.
The filled circles are the refractive indices en and on measured by the wedged cell
refractometer method. The filled triangles are the average refractive index n calculated
by the experimental data. In figure 31, excellent agreement among the extended Cauchy
model, four-parameter model, and experimental data is also found. The difference
between the theoretical values and the experimental data is less than 0.4%. The difference
may result from the local molecular vibrations. In the low IR region, several molecular
vibration bands exist. Because of relatively weak oscillator strength, their contribution to
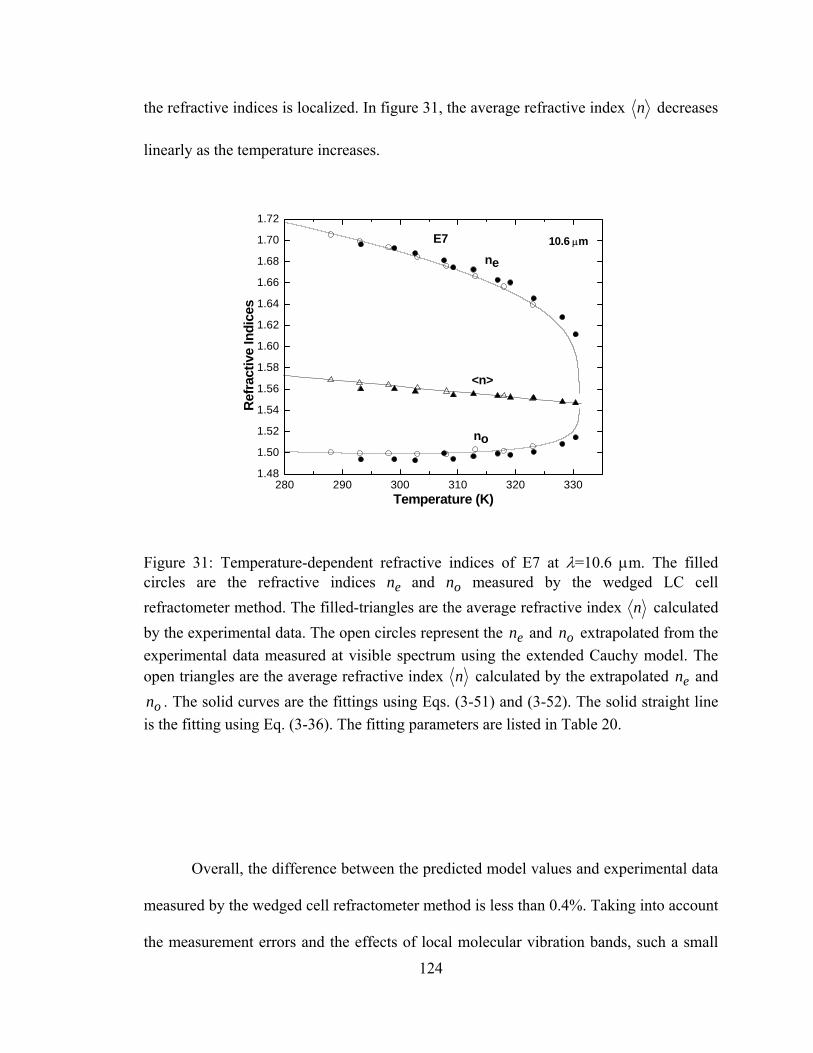
124
the refractive indices is localized. In figure 31, the average refractive index n decreases
linearly as the temperature increases.
280 290 300 310 320 3301.48
1.50
1.52
1.54
1.56
1.58
1.60
1.62
1.64
1.66
1.68
1.70
1.72
<n>
no
ne
10.6 µmE7
Ref
ract
ive
Indi
ces
Temperature (K)
Figure 31: Temperature-dependent refractive indices of E7 at λ=10.6 µm. The filled circles are the refractive indices en and on measured by the wedged LC cell refractometer method. The filled-triangles are the average refractive index n calculated by the experimental data. The open circles represent the en and on extrapolated from the experimental data measured at visible spectrum using the extended Cauchy model. The open triangles are the average refractive index n calculated by the extrapolated en and
on . The solid curves are the fittings using Eqs. (3-51) and (3-52). The solid straight line is the fitting using Eq. (3-36). The fitting parameters are listed in Table 20.
Overall, the difference between the predicted model values and experimental data
measured by the wedged cell refractometer method is less than 0.4%. Taking into account
the measurement errors and the effects of local molecular vibration bands, such a small
125
difference is acceptable. That means the extrapolated IR refractive indices from those
measured by the Abbe refractometer (visible wavelengths) and those measured directly
from the wedged cell refractometer at discrete IR laser wavelengths are consistent. The
advantages of using Abbe refractometer are twofold: it is easy to use and less time
consuming. As we discussed before, the oscillator strength of these vibration bands is
about two orders of magnitude weaker than that of the electronic transitions. The resonant
enhancement of these bands to the LC refractive indices and birefringence are localized.
Thus, we can extrapolate the visible spectral data to the refractive indices at the non-
resonant IR wavelengths by the extended Cauchy equation. Further, basing on the
extrapolated data, we can predict the refractive indices at these IR wavelengths in the
whole LC nematic range by the four-parameter model.59
In summary, we have measured the refractive indices of E7 in the visible, near
and far IR spectral regions. In the visible region, a multi-wavelength Abbe refractometer
was proven to be powerful and accurate. In the near IR (λ=1.55 µm) and long IR (λ=10.6
µm) regions, the LC refractive indices can be measured using a wedged cell
refractometer method. These data can be fitted smoothly by the extended Cauchy model.
126
6.5 Refractive Index Matching between Liquid Crystal and Photopolymers for Polymer Dispersed Liquid Crystal (PDLC) Application
6.5.1 Introduction
Polymer-dispersed liquid crystal (PDLC) and polymer-stabilized liquid crystal
(PSLC) are useful for displays1,98-100, tunable wavelength filters101-103, tunable liquid
crystal lenses, 104,105 and polarization independent phase modulators106. In a PDLC, the
refractive index difference between the LC droplets and polymer matrix plays an
important role in determining the voltage-off and voltage-on state transmittance. In a
normal-mode PDLC, the droplet size is controlled at ~1 µm, which is comparable with
the visible light wavelength. In the voltage-off state, the droplets are randomly oriented.
The index mismatch between the LC (whose average refractive index is given by:
3/)2( oe nnn += ) and polymer matrix ( pn ) affects the light scattering capability. For a
given droplet size, the larger the index mismatch, the higher the light scattering.
Conversely, in the voltage-on state the LC directors inside the droplets are reoriented
along the electric field direction so that the refractive index becomes on ; the ordinary
refractive index. If po nn ~ , then the PDLC becomes isotropic and will have an excellent
transmittance. Therefore, the preferred LC material for PDLC is not only high
birefringence ( oe nnn −=∆ ) but also good index match between on and pn . In a PSLC
system, polymer networks help to improve response time 107. A good index match would
reduce light scattering.

127
In this chapter, we compare the refractive index of cured polymers with liquid crystals
at different wavelengths and temperatures. The fabrication method of the thin cured
polymer films is briefly described. The refractive index of the cured polymer films
(NOA65 and NOA81) and six nematic liquid crystals (BL038, BL006, BL003, E48, E44,
and E7) were measured using a multi-wavelength Abbe refractometer. We compare the
refractive index between NOA 65 and these six commercial liquid crystals, and NOA81
with two UCF high birefringence mixtures: UCF-1 and UCF-2. Then, we fabricate some
PDLC cells using the four selected index-matched LC mixtures in the NOA65 polymer
system and characterize their electro-optic properties at λ=633 nm. Finally, we obtain
good correlation between material and device performances.
6.5.2 Refractive Index Measurements for Photopolymers and Liquid Crystals
NOA65 (Norland Optical Adhesive) is a favorite photocurable polymer because
its refractive index ( pn ~1.52) is close to the on of many commercial LC mixtures. On the
other hand, NOA81 has a higher refractive index ( pn ~1.56), which is close to the on of
our UCF high birefringence LC mixtures. In this study, we compare the refractive indices
of NOA65 with six Merck LC mixtures, and NOA81 with two UCF high birefringence
LC mixtures using a multiwavelength Abbe refractometer (Atago DR-M4). Before UV
curing, NOA65 and NOA81 are clear and colorless liquids. The measurement of the
monomers is fairly simple. However, in a practical device, such as a PDLC, all the

128
monomers are cured to form a polymer matrix. Therefore, it is more meaningful to
measure the refractive index of the cured polymers than the monomers.
In order to fabricate a polymer film, we infiltrated the monomers into an empty
cell with a 1-mm gap using capillary flow. The cells were placed on a hot plate with a
constant temperature (T~50 oC). Then, we illuminated the cell with a uniform UV light (I
=14 mW/cm2) for 40 minutes because of the large cell gap. We then peeled off the glass
substrates and removed the thick polymer film under a high temperature (T~120 oC). The
film was kept in a stove with a constant temperature of 50 oC for 12 hours to age
completely. The cured polymer film of NOA65 is quite flexible, while the cured NOA81
is a little hard. In order to get an accurate measurement, we cut the films into rectangular
parallelepipeds of the following dimensions: 15-mm long, 9-mm wide, and 1-mm thick.
The bottom surface of the samples was polished so that it made contact with the main
prism surface of the Abbe refractometer completely. First, we put a small drop of contact
liquid (monobromonaphthalene) on the main prism, then put the sample on and ensured
the contact liquid spread evenly between the sample and the main prism. It is important to
get rid of any dusts and bubbles between the solid sample and the main prism. A lighting
glass was used to compensate for the weak light because the samples are thin. Similarly,
we spread a small amount of the contact liquid on the top surface of the sample and put
the lighting glass on top of the contact liquid. The thin contact liquid should spread
evenly between the sample and the lighting glass. Now the contact liquid is sandwiched
as films between the main prism and the sample, and between the sample and the lighting
glass. The incident light entered the sample slightly aslant from the upside.

129
Figure 32 shows the experimental setup for measuring the cured polymer films.
By moving the lighting glass to the front and rear, pressing the lighting glass to the
sample by fingers, and adjusting the height and angle of the light guide, we found a clear
and correct boundary line. This is the sign for the accurate measurements using the Abbe
refractometer. We measured the refractive indices of LCs and polymers at six
wavelengths: 450, 486, 546, 589, 633, and 656 nm. By connecting a constant circulating
temperature bath (Atago 60-C3) with the Abbe refractometer, we measured the
temperature-dependent refractive index of the samples from 15 to 55 oC at 5 oC intervals.
AbbeAbbe refractometerrefractometer
(DR(DR--M4)M4)Main prismMain prism
Light guide:Light guide:450450--656 nm656 nm
SampleSample
Contact liquid:Contact liquid:Lighting glassLighting glass
AtagoAtago 6060--C3C3(10~55 (10~55 ooCC))
Circulating constant temperature bathCirculating constant temperature bath
monobromonaphthalenemonobromonaphthalene
Figure 32: The experimental setup for measuring the refractive index of cured polymer films: NOA65 and NOA81.

130
Figure 33 shows the wavelength- and temperature-dependent refractive index of the
cured NOA65 polymer. The squares, circles, upward-triangles, downward-triangles,
diamonds, and pentagons represent the measured refractive index of NOA65 at λ=450,
486, 546, 589, 633, and 656 nm, respectively. The measured refractive index data of
NOA65 are listed in Table 21. In Figure 33, we find the refractive index of NOA65
decreases linearly as temperature increases at a given wavelength. The solid lines are
fittings using Eq. (3-36). The fitting values of A and B are listed in Table 22. This linear
decrease with increasing temperature is due to the isotropic nature of NOA65. As the
temperature increases, its density decreases linearly causing a decrease in the refractive
index.

131
290 295 300 305 310 315 320 325 3301.5175
1.5200
1.5225
1.5250
1.5275
1.5300
1.5325
1.5350
1.5375
1.5400
1.5425
NOA65
Ref
ract
ive
Inde
x
Temperature [K]
450 nm 486 nm 546 nm 589 nm 633 nm 656 nm
Figure 33: Wavelength- and temperature-dependent refractive index of cured NOA65. The squares, circles, upward-triangles, downward-triangles, diamonds, and pentagons represent the measured refractive index of NOA65 at λ=450, 486, 546, 589, 633 and 656 nm, respectively. Solid lines are fittings using Eq. (3-36) and the fitting parameters are listed in Table 22.
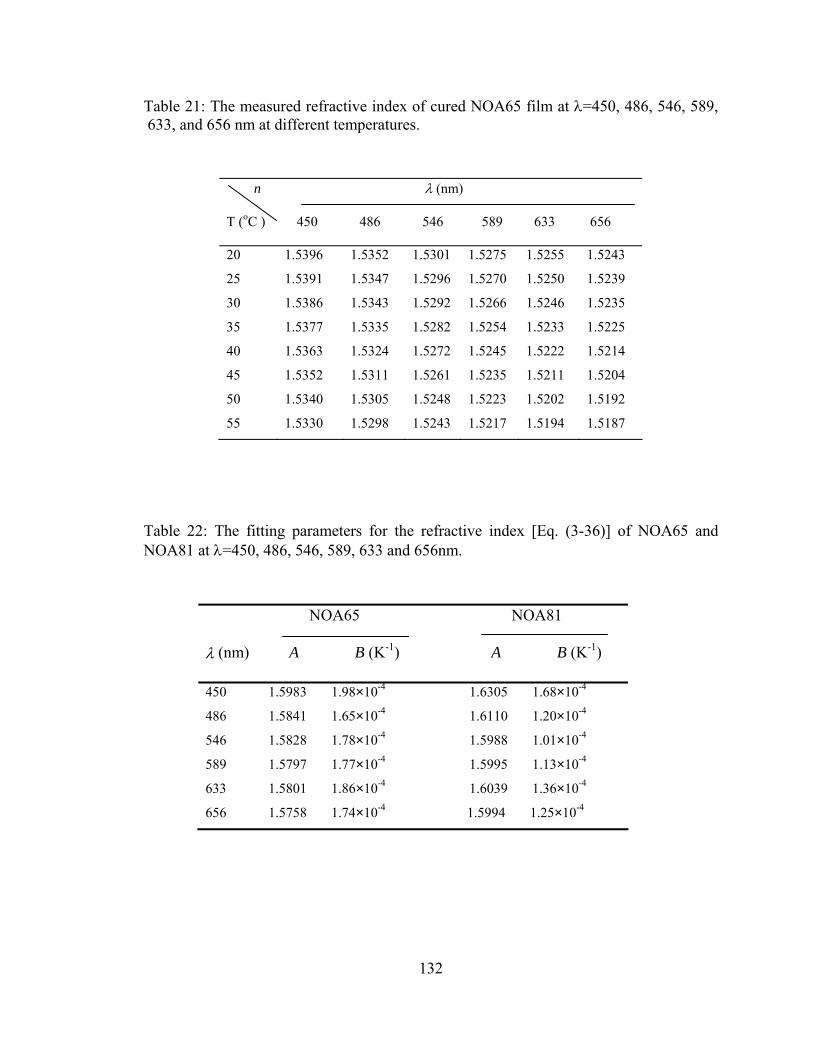
132
Table 21: The measured refractive index of cured NOA65 film at λ=450, 486, 546, 589, 633, and 656 nm at different temperatures.
n λ (nm)
T (oC ) 450 486 546 589 633 656
20
25
30
35
40
45
50
55
1.5396
1.5391
1.5386
1.5377
1.5363
1.5352
1.5340
1.5330
1.5352
1.5347
1.5343
1.5335
1.5324
1.5311
1.5305
1.5298
1.5301
1.5296
1.5292
1.5282
1.5272
1.5261
1.5248
1.5243
1.5275
1.5270
1.5266
1.5254
1.5245
1.5235
1.5223
1.5217
1.5255
1.5250
1.5246
1.5233
1.5222
1.5211
1.5202
1.5194
1.5243
1.5239
1.5235
1.5225
1.5214
1.5204
1.5192
1.5187
Table 22: The fitting parameters for the refractive index [Eq. (3-36)] of NOA65 and NOA81 at λ=450, 486, 546, 589, 633 and 656nm.
NOA65 NOA81
λ (nm) A B (K-1) A B (K-1)
450 1.5983 1.98×10⁻⁴ 1.6305 1.68×10⁻⁴
486 1.5841 1.65×10⁻⁴ 1.6110 1.20×10⁻⁴
546 1.5828 1.78×10⁻⁴ 1.5988 1.01×10⁻⁴
589 1.5797 1.77×10⁻⁴ 1.5995 1.13×10⁻⁴
633 1.5801 1.86×10⁻⁴ 1.6039 1.36×10⁻⁴
656 1.5758 1.74×10⁻⁴ 1.5994 1.25×10⁻⁴

133
Figure 34 shows a similar plot for NOA81. The squares, circles, upward-triangles,
downward-triangles, diamonds, and pentagons represent the measured refractive index of
NOA81 at λ=450, 486, 546, 589, 633, and 656 nm, respectively. The measured refractive
index data of NOA81 are listed in Table 23. Similarly to NOA65, the refractive index of
NOA81 decreases linearly as the temperature increases. The solid lines in Figure 34 are
fittings using Eq. (3-36) and the fitting parameters are listed in Table 22. We also
measured the wavelength- and temperature-dependent refractive index of NOA65 and
NOA81 in the monomer state. After UV curing, the refractive index of the cured
polymers increases 1.7% and 2.2% for NOA65 and NOA81, respectively. This slight
refractive index increase originates from the increased density of the polymer after cross-
linking.
Table 23: The measured refractive index of cured NOA81 film at λ=450, 486, 546, 589, 633, and 656 nm at different temperatures.
n λ (nm)
T (oC ) 450 486 546 589 633 656
20
25
30
35
40
45
50
55
1.5814
1.5803
1.5797
1.5786
1.5782
1.5769
1.5762
1.5754
1.5759
1.5752
1.5744
1.5739
1.5735
1.5729
1.5721
1.5716
1.5692
1.5689
1.5681
1.5677
1.5673
1.5668
1.5662
1.5657
1.5662
1.5658
1.5652
1.5644
1.564
1.5634
1.5629
1.5623
1.5645
1.5634
1.5628
1.562
1.5615
1.5608
1.5603
1.5595
1.5627
1.5621
1.5617
1.5607
1.5603
1.5594
1.5586
1.5583

134
290 295 300 305 310 315 320 325 330
1.558
1.560
1.562
1.564
1.566
1.568
1.570
1.572
1.574
1.576
1.578
1.580
1.582
1.584
NOA81
Ref
ract
ive
Inde
x
Temperature [K]
450 nm 486 nm 546 nm 589 nm 633 nm 656 nm
Figure 34: Wavelength- and temperature-dependent refractive index of cured NOA81. The squares, circles, upward-triangles, downward-triangles, diamonds, and pentagons represent the measured refractive index of NOA81 at λ=450, 486, 546, 589, 633 and 656 nm, respectively. Solid lines are fittings using Eq. (3-36) and the fitting parameters are listed in Table 22.
For a normal-mode PDLC, the light scattering in the voltage-off state depends on
the LC birefringence; the higher the birefringence, the higher the scattering efficiency. In
the voltage-on state, the transmittance depends on the refractive index match between the
LC ( on ) and the polymer matrix ( pn ). If on ~ pn , then the on-state will be highly
transparent. After having measured the pn of NOA65, we selected two commercial high
birefringence LC series with their on close to pn . The two LC series are BL-series
(BL038, BL006, and BL003) and E-series (E48, E44, and E7). To measure the refractive
indices, we aligned the LCs perpendicular to the main and secondary prism surfaces of

135
the Abbe refractometer by coating these two surfaces with a surfactant comprising of
0.294 wt % hexadecyletri-methyle-ammonium bromide (HMAB) in methanol solution.
The measured extraordinary (ne) and ordinary (no) refractive indices of E44, E7, E48,
BL038, BL006, and BL003 are listed in Tables 5, 6, 24, 25, 26 and 27 respectively.
From these data, we find that en always decreases as temperature increases, whereas on
declines modestly first and then increases after the temperature passes the crossover
temperature50. The average refractive index n (which is defined as 3/)2( oe nn + ) also
decreases linearly as temperature increases49.
Table 24: The measured refractive indices (ne and no) of E48 at λ = 450, 486, 546, 589,
633, and 656 nm at different temperatures.
λ (nm)
T 450 486 546 589 633 656
(oC ) ne no ne no ne no ne no ne no ne no
15
20
25
30
35
40
45
50
55
1.8209
1.8151
1.8086
1.8017
1.7942
1.7869
1.7780
1.7704
1.7608
1.5399
1.5391
1.5384
1.5403
1.5403
1.5406
1.5395
1.5399
1.5392
1.7969
1.7912
1.7850
1.7782
1.7720
1.7649
1.7575
1.7489
1.7399
1.5366
1.5360
1.5353
1.5342
1.5345
1.5337
1.5336
1.5339
1.5343
1.7715
1.7660
1.7601
1.7542
1.7478
1.7411
1.7338
1.7263
1.7176
1.5282
1.5274
1.5268
1.5261
1.5255
1.5252
1.5250
1.5250
1.5252
1.7593
1.7539
1.7481
1.7423
1.7362
1.7298
1.7226
1.7152
1.7070
1.5239
1.5233
1.5225
1.5217
1.5214
1.5206
1.5206
1.5205
1.5207
1.7503
1.7451
1.7391
1.7335
1.7275
1.7210
1.7140
1.7071
1.6989
1.5204
1.5197
1.5188
1.5180
1.5176
1.5172
1.5168
1.5167
1.5170
1.7463
1.7408
1.7354
1.7298
1.7235
1.7169
1.7106
1.7034
1.6949
1.5195
1.5186
1.5175
1.5165
1.5161
1.5158
1.5156
1.5151
1.5156

136
Table 25: The measured refractive indices (ne and no) of BL038 at λ=450, 486, 546, 589, 633, and 656 nm at different temperature.
Table 26: The measured refractive indices (ne and no) of BL006 at λ=450, 486, 546, 589, 633, and 656 nm at different temperature.
λ (nm)
T 450 486 546 589 633 656
(oC ) ne no ne no ne no ne no ne no ne no
15
20
25
30
35
40
45
50
55
1.8796
1.8726
1.8671
1.8611
1.8544
1.8481
1.8401
1.8325
1.8252
1.5478
1.5475
1.5469
1.5458
1.5457
1.5447
1.5446
1.5444
1.5441
1.8511
1.8450
1.8392
1.8334
1.8271
1.8206
1.8137
1.8066
1.7992
1.5407
1.5401
1.5396
1.5385
1.538
1.5375
1.537
1.5369
1.5363
1.8196
1.8142
1.8086
1.8029
1.7971
1.7907
1.7846
1.7778
1.7709
1.5323
1.5311
1.5305
1.5299
1.5291
1.5284
1.5277
1.5272
1.5269
1.8047
1.7994
1.7939
1.7884
1.7827
1.7767
1.7704
1.7641
1.7571
1.5276
1.5266
1.5258
1.5250
1.5241
1.5239
1.5231
1.5227
1.5222
1.794
1.7888
1.7832
1.7781
1.7721
1.7662
1.7603
1.7541
1.7475
1.5239
1.5234
1.5221
1.5213
1.5206
1.5200
1.5194
1.5187
1.5183
1.7887
1.7833
1.7786
1.7729
1.7675
1.7618
1.7554
1.7491
1.7430
1.5228
1.5217
1.5209
1.5199
1.5190
1.5181
1.5179
1.5169
1.5170
λ (nm)
T 450 486 546 589 633 656
(oC ) ne no ne no ne no ne no ne no ne no
15
20
25
30
35
40
45
50
55
1.8988
1.8913
1.8869
1.8811
1.8760
1.8702
1.8630
1.8566
1.8486
1.5478
1.5516
1.5505
1.5479
1.5482
1.5472
1.5454
1.5447
1.5441
1.8672
1.8620
1.8563
1.8508
1.8449
1.8391
1.8328
1.8265
1.8200
1.5438
1.5434
1.5421
1.5414
1.5405
1.5399
1.5387
1.5382
1.5377
1.8349
1.8299
1.8248
1.8194
1.8140
1.8084
1.8024
1.7964
1.7905
1.5348
1.5339
1.5331
1.5323
1.5312
1.5306
1.5294
1.5292
1.5286
1.8194
1.8148
1.8097
1.8046
1.7994
1.7938
1.7880
1.7822
1.7764
1.5304
1.5296
1.5285
1.5275
1.5266
1.5257
1.5249
1.5245
1.5238
1.8083
1.8036
1.7988
1.7937
1.7885
1.7830
1.7774
1.7721
1.7659
1.5266
1.5259
1.5249
1.5239
1.5229
1.5221
1.5211
1.5204
1.5199
1.8033
1.7986
1.7937
1.7884
1.7835
1.7784
1.7726
1.7672
1.7613
1.5257
1.5244
1.5236
1.5224
1.5215
1.5206
1.5200
1.5192
1.5181

137
Table 27: The measured refractive indices (ne and no) of BL003 at λ=450, 486, 546, 589, 633, and 656 nm at different temperature.
6.5.3 Refractive Index Comparison
The wavelength-dependent refractive index of the UV-cured polymers can be
described by the extended Cauchy equation, Eqs. (2-7) and (2-8). NOA81 ( 56.1~pn )
has a higher refractive index than NOA65 ( 52.1~pn ). For a linearly conjugated LC, a
high on often leads to a high n∆ . Most of the commercially available high birefringence
( n∆ ~0.20-0.28) liquid crystals have on ~1.50-1.52. These are the mixtures of cyano-
biphenyls and cyano-terphenyls, e.g., Merck E-series and BL-series. Only some high
λ (nm)
T 450 486 546 589 633 656
(oC ) ne no ne no ne no ne no ne no ne no
15
20
25
30
35
40
45
50
55
1.8654
1.8592
1.8541
1.8473
1.8415
1.8334
1.8255
1.8186
1.8113
1.5489
1.5472
1.5477
1.5451
1.5443
1.5444
1.5447
1.5444
1.5439
1.8374
1.8316
1.8260
1.8199
1.8135
1.8071
1.8001
1.7931
1.7855
1.5408
1.5403
1.5390
1.5388
1.5379
1.5375
1.5369
1.5366
1.5368
1.8082
1.8030
1.7973
1.7916
1.7857
1.7794
1.7728
1.7662
1.7591
1.5324
1.5314
1.5306
1.5302
1.5293
1.5284
1.5279
1.5275
1.5276
1.7943
1.7891
1.7837
1.7780
1.7723
1.7661
1.7598
1.7534
1.7465
1.5279
1.5270
1.5260
1.5254
1.5246
1.5238
1.5234
1.5228
1.5229
1.7838
1.7790
1.7736
1.7682
1.7625
1.7564
1.7501
1.7438
1.7367
1.5246
1.5234
1.5224
1.5215
1.5210
1.5203
1.5197
1.5193
1.5190
1.7793
1.7742
1.7691
1.7636
1.7577
1.7521
1.7458
1.7397
1.7327
1.5235
1.5221
1.5216
1.5204
1.5192
1.5190
1.5186
1.5179
1.5176

138
birefringence ( n∆ ≥0.4) LCs have on >1.55. These are mainly isothiocyanato-tolane
mixtures, e.g., UCF-series. Thus, we compare the index matching of some Merck E-
series (E7, E48, and E44) and BL-series (BL003, BL006, and BL038) liquid crystals with
NOA65, and some high birefringence UCF mixtures (UCF-1 and UCF-2) with NOA81.
Figure 35 shows the measured refractive index of the UV-cured NOA65 and the
ordinary refractive index of E48, E44, and E7, as a function of wavelength at T=20 oC.
The filled circles, open squares, upward triangles, and downward triangles are the
measured ordinary refractive index of NOA65, E48, E44, and E7, respectively. The
respective solid lines represent the fittings of each material using the extended Cauchy
model [Eqs. (2-7) and (2-8)]. The fitting parameters A, B and C are listed in Table 28.
From figure 35, E48, E44, and E7 all have a good index matching with NOA65. More
specifically, E44 has the best match in the red spectral region while E7 and E48 have the
best match in the blue region. In the green region (λ=546 nm), E44 has a slightly higher
index, while E7 and E48 are slightly lower than NOA65, but the difference is in the third
decimal.
Figure 36 shows the refractive index of the cured NOA65 and the ordinary
refractive index of BL038, BL006, and BL003 as a function of wavelength at T=20 oC.
The filled circles, open squares, upward-triangles, and downward-triangles are the
measured ordinary refractive index of NOA65, BL038, BL006, and BL003, respectively.
The solid lines represent the fittings of each material using the extended Cauchy model
[Eqs. (2-7) and (2-8)]. The fitting parameters are listed in Table 28. In Figure 36, BL038,
BL006, and BL003 have a similar trend in )(λon . The index matching with NOA65 is

139
pretty good in the green and red spectral regions. A larger deviation is observed in the
blue region, but the difference is still in the third decimal.
0.45 0.50 0.55 0.60 0.65 0.70
1.515
1.520
1.525
1.530
1.535
1.540
1.545
1.550
1.555
T=20 oCR
efra
ctiv
e In
dex
Wavelength [µm]
E48 E44 E7 NOA65
Figure 35: Wavelength dependent refractive index of NOA65 and the ordinary refractive index of E48, E44 and E7 at T=20 oC. The open squares, upward-triangles and filled circles, downward-triangles are the measured refractive index of E48, E44, NOA65 and E7, respectively. The solid lines represent the fittings using the extended Cauchy model [Eqs. (2-7) and (2-8)]. The fitting parameters are listed in Table 28.
Table 28: The fitting parameters for the refractive index [Eqs. (2-7) and (2-8)] of NOA65 and NOA81 and the ordinary refractive index of E48, E44, E7, BL038, BL006, BL003, UCF-1 and UCF-2 at Τ= 20 oC.
Cauchy
coefficients NOA65 E48 E44 E7 BL038 BL006 BL003 NOA81 UCF-1 UCF-2 A
B (µm2)
C (µm2)
1.5130
0.0045
1.8×10⁻⁴
1.5027
0.0055
5.6×10⁻⁴
1.5018
0.0089
1.0×10⁻⁴
1.4995
0.0068
4.1×10⁻⁴
1.5042
0.0065
4.7×10⁻⁴
1.5034
0.0085
1.9×10⁻⁴
1.5056
0.0057
5.9×10⁻⁴
1.5519
0.0036
4.9×10⁻⁴
1.5439
0.0038
0.0019
1.5422
0.0043
0.0018

140
0.45 0.50 0.55 0.60 0.65 0.701.515
1.520
1.525
1.530
1.535
1.540
1.545
1.550
1.555
T=20 oCR
efra
ctiv
e In
dex
Wavelength [µm]
BL038 BL006 BL003 NOA65
Figure 36: Wavelength dependent refractive index of NOA65 and the ordinary refractive index of BL038, BL006, and BL003 at T=20 oC. The open squares, upward-triangles and filled circles, downward-triangles are the measured refractive index of BL038, BL006, NOA65 and BL003, respectively. The solid lines represent the fittings using the extended Cauchy model [Eqs. (2-7) and (2-8)]. The fitting parameters are listed in Table 28.
The ordinary refractive index of NOA81 is larger than NOA65. The measured
value of NOA81 at λ=589 nm and T=20 oC is 1.5662. No commercially available LC
mixtures have such a high on . We have formulated two new LC mixtures designated as
UCF-1 and UCF-2 whose ordinary refractive index matches with NOA81. Figure 37
shows the refractive index of the cured NOA81 and the ordinary refractive index of UCF-
1 and UCF-2 as a function of wavelength at T=20 oC. The filled circles, open squares,
and upward-triangles are the measured ordinary refractive index of NOA81, UCF-1, and

141
UCF-2, respectively. The solid lines represent the fittings of each material using the
extended Cauchy model [Eqs. (2-7) and (2-8)]. The fitting parameters are listed in Table
28. In Figure 37, the on of UCF-1 and UCF-2 match well with that of NOA81 in the red
region. As the wavelength gets shorter, the deviation increases gradually. This is because
the longest electronic absorption band ( 2λ ) of the high birefringence LCs usually extends
to ~350 nm region. The resonance-enhanced refractive index is large as the wavelength
approaches 2λ .
0.40 0.45 0.50 0.55 0.60 0.65 0.70
1.56
1.57
1.58
1.59
1.60
1.61
1.62
1.63
1.64T=20 oC
Ref
ract
ive
Inde
x
Wavelength [µm]
NOA81 UCF-1 UCF-2
Figure 37: Wavelength dependent refractive index of NOA81 and the ordinary refractive index of UCF-1 and UCF-2 at T=20 oC. The filled circles, open squares and upward- triangles are the measured refractive index of NOA81, UCF-1 and UCF-2, respectively. The solid lines represent the fittings using the extended Cauchy model [Eqs. (2-7) and (2-8)]. The fitting parameters are listed in Table 28.

142
In a PDLC system, good index matching ( po nn ~ ) between the employed
polymer and liquid crystal helps to improve the transmittance in the voltage-on state. On
the other hand, a larger index mismatch ( pnn > ), i.e., a higher birefringence LC
enhances the light scattering efficiency in the voltage-off state. However, refractive index
match or mismatch is not the only factor deciding the PDLC performance. UV stability of
liquid crystals and miscibility between polymers and liquid crystals also play important
roles affecting the PDLC properties. As we discussed before, the E-series and BL-series
liquid crystals all have a good index match with NOA65. All these six liquid crystals are
good candidates for PDLC application when NOA65 is used. In the visible spectrum, E48
and E7 have very similar ordinary refractive index at T=20 oC, as do BL038 and BL003.
However, E48 (BL038) has a higher birefringence than E7 (BL003). Thus, we choose to
compare the NOA65 PDLC systems using BL038, E48, BL006, and E44.
6.5.4 PDLC Cell Fabrication and Measurements
To prepare PDLC samples, we mixed NOA65 with E48, E44, BL038, and BL006;
each at 30:70 wt% ratio. To ensure a uniform mixing, we stirred the LC/monomer
mixtures using magnetic stirrers for half an hour at T=120 oC (put the bottles with the
LC/monomer on a hot plate). Each LC/monomer mixture was then injected to an empty
glass cell (cell gap ~ 8 µm) in the isotropic state. The inner surfaces of the glass
substrates were coated with a thin indium-tin-oxide (ITO) layer, but no polyimide layer.

143
To cure the samples, the cells were exposed to UV light (I=65 mW/cm2) for 15 minutes
at T=20 oC.
The voltage-dependent transmittance (VT) curves were measured and used to
compare the contrast ratio of the PDLC cells. The experimental setup is shown in Figure
38. An unpolarized He-Ne laser (λ=633 nm) beam was normally incident on the PDLC
cell. A photodiode detector was placed at 25 cm behind the cell. The corresponding
collection angle is ~2o. A LabVIEW data acquisition system was used to control the
applied voltage and record the measured VT curves.
LaserLaser
PDLCPDLC DetectorDetectorPinholePinhole
LabVIEWLabVIEW
VoltageVoltagecontrolcontrol
LaserLaser
PDLCPDLC DetectorDetectorPinholePinhole
LabVIEWLabVIEW
VoltageVoltagecontrolcontrol
Figure 38: The experimental setup for measuring the transmittance of the PDLC cells.

144
6.5.5 Results and Discussions
From the measured VT curves, we find that BL038 is better than BL006, and E48
is better than E44 in the NOA65 PDLC systems, although these four LC mixtures all
have a good index match with NOA65. The BL038 (E48) PDLC cell exhibits a lower
transmittance in the voltage-off state and a higher transmittance in the voltage-on state
than that of BL006 (E44). It implies that the refractive index match is not the only factor
affecting the contrast ratio of a PDLC; the LC/polymer miscibility also plays an
important role. It is likely that BL038 and E48 have a better miscibility in NOA65 than
BL006 and E44.
In Figure 39, we compare the normalized VT curves of the BL038 and E48 PDLC
cells at λ=633 nm. For both cells, the polymer (NOA65) and LC ratio is 30:70 and cell
gap is 8 µm. To calibrate the substrate reflection losses, the transmittance of the PDLC
cell is normalized to that of a homogeneous cell filled with the corresponding liquid
crystal. The red line represents the transmittance of the BL038 PDLC cell and the blue
line represents the transmittance of the E48 PDLC cell. In Figure 39, the BL038 PDLC
cell has a lower transmittance at V=0 and a higher transmittance in the on-state than E48.
The saturation voltage of both cells happens at ~20 Vrms, thus, we define the contrast ratio
as: CR= T(V=20 Vrms)/T(V=0). The measured contrast ratio is 13:1 and 10:1 for the
BL038 and E48 PDLC cells, respectively. We could enhance contrast ratio by using a
thicker cell gap. The tradeoff is the increased operating voltage.

145
0 5 10 15 20 25 300.0
0.1
0.2
0.3
0.4
0.5
0.6
0.7
0.8
0.9
1.0
E48BL038
Norm
aliz
ed T
rans
mitt
ance
Voltage [Vrms]
Figure 39: Voltage-dependent normalized transmittance of the BL038 and E48 PDLC cells at λ=633 nm. For both cells, the LC:NOA65 ratio is 70:30. The two cells have same thickness (d=8µm) and have no polyimide layer on the glass substrates.
Two factors contributing to the higher contrast ratio of the BL038 PDLC cell over
E48 are higher birefringence and better index matching with NOA65. In Figure 40, we
compare the wavelength-dependent refractive index of NOA65 and the ordinary
refractive index of BL038 and E48 at T=20 oC. The filled circles, open squares, and
upward-triangles are the measured refractive index of NOA65, BL038, and E48,
respectively. The solid lines represent the fittings using the extended Cauchy model [Eq.
(2-7) and (2-8)]. The fitting parameters are listed in Table 28. From Figure 40, we find
that BL038 has a better index match than E48 at λ=633 nm. Thus, the BL038 PDLC cell
has a higher transmittance in the voltage-on state than the E48 cell when the He-Ne laser

146
(λ=633 nm) is used. However, this explanation is only qualitative. In the voltage-on state,
the LC directors near the inner boundaries of the droplets are hardly reoriented by the
electric field because of the strong surface anchoring. These anchored LC directors have
some en components. As a result, the effective refractive index in the voltage-on state is
slightly larger than on . It is difficult to estimate how much these boundary layers
contribute to the effective refractive index.
0.45 0.50 0.55 0.60 0.65 0.70
1.515
1.520
1.525
1.530
1.535
1.540
1.545
1.550T=20 oC
Ref
ract
ive
Inde
x
Wavelength [µm]
NOA65 BL038 E48
Figure 40: Wavelength dependent refractive index of NOA65 (circles) and the ordinary refractive index of BL038 (squares) and E48 (triangles) at T=20 oC. The solid lines represent the fittings using the extended Cauchy model [Eqs. (2-7) and (2-8)]. The fitting parameters are listed in Table 28.

147
Figure 41 shows the wavelength-dependent birefringence of BL038 and E48 at
T=20 oC. The squares and triangles represent the experimental data of BL038 and E48,
respectively. The solid lines are fittings using the following single-band birefringence
dispersion model27:
2*2
2*2
)(λλ
λλλ−
=∆ Gn , (6-1)
where G is a proportionality constant and *λ is the mean resonant wavelength of the
liquid crystal. The fitting parameters [G (µm-2), λ* (µm)] for BL038 and E48 are [3.509,
0.252] and [3.210, 0.244], respectively. In Figure 41, BL038 exhibits a larger
birefringence than E48 in the entire visible spectral region. Thus, the difference between
the average refractive index of BL038 and the refractive index of NOA65 is larger than
that between E48 and NOA65, i.e., the refractive index mismatch between BL038 and
NOA65 is larger than that between E48 and NOA65. A larger index mismatch leads to a
higher scattering efficiency. As a result, the BL038 PDLC cell has a lower transmittance
at V=0 than the E48 cell.

148
0.40 0.45 0.50 0.55 0.60 0.65 0.700.21
0.22
0.23
0.24
0.25
0.26
0.27
0.28
0.29
0.30
0.31
0.32
0.33
T=20 oC
Bire
frin
genc
e (∆
n)
Wavelength [µm]
BL038 E48
Figure 41: Wavelength dependent birefringence of BL038 (squares) and E48 (triangles) at T=20 oC. The solid lines are fittings using the single-band model [Eq. (6-1)]. The fitting parameters [G(µm-2), λ*(µm)] for BL038 and E48 are [3.509, 0.252] and [3.210, 0.244], respectively.

149
6.5.6 Conclusion
In this chapter, the refractive index of cured polymers, NOA65 and NOA81, were
measured at six visible wavelengths and in the temperature range from 20 to 55 oC using
a multi-wavelength Abbe refractometer. The refractive indices of Merck E-series (E48,
E44, and E7) and BL-series (BL038, BL006, and BL003) LC mixtures were measured.
Comparative study on the refractive index between these liquid crystals and cured
polymers was made. Among the LC materials we studied, BL038 and E48 are good
candidates for making PDLC system incorporating NOA65. Indeed, the BL038 PDLC
cell shows a higher contrast ratio than the E48 cell because BL038 has a better matched
ordinary refractive index, higher birefringence, and similar miscibility as compared to
E48. Liquid crystals having a good miscibility with polymer, matched ordinary refractive
index, and higher birefringence help to improve the PDLC contrast ratio for display
applications.

150
CHAPTER 7: GENERAL SUMMARY
This dissertation has accomplished following three objectives: 1) development of
physical models for LC refractive indices, 2) establishment of guidelines for formulating
high dTdno / LC mixtures and 3) applications of these physical models in displays and
photonic devices including optimum design for displays, high thermally tunable liquid
crystal photonic crystal fibers, thermal solitons in nematic liquid crystals, infrared
refractive indices of liquid crystals, and index-matched polymer-dispersed liquid crystals
(PDLC).
7.1 Development of Physical Models for Explaining the Wavelength Effect on Liquid Crystal Refractive Indices
We have derived and compared the three- and two-coefficient Cauchy models for
describing the wavelength effect on the refractive indices of liquid crystals based on the
three-band model and Vuks model. If the LC birefringence is larger than ~0.12, the three-
coefficient Cauchy model should be used. On the other hand, if the LC birefringence is
smaller than ~0.12, the 4−λ term can be ignored and the two-coefficient Cauchy model

151
works equally well as the three-coefficient Cauchy model. Most of TFT LC mixtures
developed for direct-view and projection displays have a relatively low birefringence.
Thus, the two-coefficient Cauchy model is adequate. The original Cauchy equation is
aimed to describe the refractive index of isotropic media. However, we extend the
Cauchy equation to describe the refractive indices of anisotropic media. The extended
Cauchy model indicates both en (extraordinary refractive index) and on (ordinary
refractive index) decrease as the wavelength increase in the visible and infrared regions.
Due to the weak oscillator strength of the absorptions in the infrared region, the resonant
enhancements of these absorptions to the LC refractive indices are localized. Generally,
the LC refractive indices change a little in the near infrared region and saturate in the mid
and far infrared regions.
7.2 Development of Physical Models for Explaining the Temperature Effect on Liquid Crystal Refractive Indices
We have also derived and compared the four-parameter and three-parameter
parabolic models for describing the temperature effect on the refractive indices of LCs
based on the Vuks equation and Haller equation. The four-parameter model fits the
experimental data very well in the whole nematic range. These four parameters can be
obtained by two-stage fittings. The four-parameter model can be further simplified to the
three-parameter parabolic model if the birefringence is low and the operating temperature
is not too close to the clearing temperature. Using the four-parameter model, we could

152
extrapolate the LC refractive indices in the whole nematic range. To know the LC
properties at the operating temperature beforehand is very important for projection
display and photonic applications.
7.3 Validation of Vuks Model
Vuks model is analogous to the classical Lorentz-Lorenz equation which
describes the refractive index of isotropic media. Vuks assumes the internal field is
isotropic in the crystals and relates the macroscopic refractive indices to the microscopic
polarizabilities of the molecules. Vuks validated his model using the measured refractive
indices and molecular polarizabilities of several crystals. Most physical models we
derived for liquid crystals are based on the Vuks model. Thus, it is necessary to validate
the Vuks model using the experimental data of liquid crystals directly. The Vuks equation
is validated to be self-consistent, for the first time, by the measured refractive indices of
liquid crystals.
7.4 Developments of Physical Models for the Temperature Gradient of LC refractive indices and Guidelines for Formulating High dno/dT Liquid Crystals
The temperature gradients of LC refractive indices, dTdne / and dTdno / are
derived based on the four-parameter model. We brought forward a new concept, the

153
crossover temperature oT at which dTdno / is equal to zero. The dTdne / remains
negative throughout the nematic range. On the other hand, dTdno / is negative when the
temperature is below the crossover temperature (To) but becomes positive when the
temperature is beyond To. This indicates that ne, the extraordinary refractive index,
decreases monotonously as temperature increases throughout the nematic range whereas
no, the ordinary refractive index, could decrease or increase with temperature depending
on where the crossover temperature is. Both dTdne / and dTdno / change sharply as the
temperature approaches the clearing temperature. However, the light scattering is large
when the temperature approaches the clearing point.
We have analyzed the physical origins of the temperature gradient of the ordinary
refractive index ( dTdno / ) of liquid crystals. To achieve a large dTdno / , high
birefringence and low clearing temperature play crucial roles. Based on these simple
guidelines, we formulated two exemplary liquid crystal mixtures, designated as UCF-1
and UCF-2, and compared their physical properties with a commonly used commercial
liquid crystal compound 5CB. The dTdno / of UCF-1 is ~4X higher than that of 5CB at
room temperature. Moreover, the melting temperature of UCF-1 and UCF-2 is below −20
oC, which is much lower than that of 5CB and 6CB. These high dTdno / liquid crystals
are useful for new photonic applications, such as the highly thermally tunable liquid
crystal photonic crystal fibers, the laser-induced thermal solitons in nematic liquid
crystals.

154
7.5 High Thermally Tunable Liquid Crystal Photonic Crystal Fibers and Thermal Solitons in Nematic Liquid Crystals
The new liquid crystals with high temperature gradient of ordinary refractive
index are preferred for the liquid crystal infiltrated photonic bandgap fiber device and the
thermal soliton in nematic liquid crystal confined in a capillary. For the liquid crystal-
infiltrated photonic crystal bandgap fibers, the high dTdno / liquid crystals greatly
improve the tuning sensitivity of the spectral position of the bandgaps. Cooperating with
a Danish group, we demonstrate a high thermally tunable single mode liquid crystal
photonic bandgap fiber device, which utilizes a three-rod core PCF and infiltrated with
UCF-1 in order to obtain a large mode area and high thermal tuning sensitivity. The
guided mode has an effective area of 440 µm2 with an insertion loss of less than 0.5dB.
The thermal tuning sensitivity of the spectral position of the bandgap was measured to be
27 nm/°C around room temperature, which is 4.6X higher than that using a commercial
Merck E7 at temperature above 50 oC. To trigger the thermal soliton in nematic liquid
crystal confined in a capillary easily, a liquid crystal with high positive dTdno / ordinary
refractive index are preferred to reduce the laser power.

155
7.6 Infrared Refractive Indices of Liquid Crystal
Liquid crystals are widely used in the photonic devices operated in the infrared
region since many liquid crystals still hold high birefringence in the infrared region. Thus,
knowing the LC refractive indices at the designated infrared wavelength helps to
optimize the device design. However, the measurement of the LC refractive indices in the
infrared region is difficult and time consuming. Basing on the extended Cauchy model
and the four-parameter model, we could successfully extrapolate the refractive indices
measured in the visible light region to the infrared region. We show the validity to link
the experimental data measured in the visible region to infrared by the extended Cauchy
equation. The data measured at λ =1.55 and 10.6 µm, respectively, by the wedged-cell
refractometer method are used to valid the method. Good agreement among the extended
Cauchy model, four-parameter model, and experimental data is achieved.
7.7 Index-matched Polymer-dispersed Liquid Crystals (PDLC)
Finally, the comparative study between liquid crystals and photopolymers was
developed for polymer-dispersed liquid crystals (PDLC) applications. The extended
Cauchy model and the four-parameter model are used to realize this goal. The refractive
index of cured polymers, NOA65 and NOA81, were measured at six visible wavelengths

156
and in the temperature range from 20 to 55 oC using a multi-wavelength Abbe
refractometer. The refractive indices of Merck E-series (E48, E44, and E7) and BL-series
(BL038, BL006, and BL003) LC mixtures were measured. Comparative study on the
refractive index between these liquid crystals and cured polymers was made. Among the
LC materials we studied, BL038 and E48 are good candidates for making PDLCs system
incorporating NOA65. Indeed, the BL038 PDLC cell shows a higher contrast ratio than
the E48 PDLC cell because BL038 has a better matched ordinary refractive index, higher
birefringence, and similar miscibility as compared to E48. Liquid crystals having a good
miscibility with polymer, matched ordinary refractive index, and higher birefringence
help to improve the PDLC contrast ratio and transmittance for display applications.

157
LIST OF REFERENCES
1. S. T. Wu and D. K. Yang, Reflective Liquid Crystal Displays (Wiley, New York,
2001).
2. E. Stupp and M. Brennesholtz, Projection Display (Wiley, New York, 1999).
3. H. C. Huang, B. L. Zhang, H. S. Kwok, P.W. Cheng and Y.C. Chen, “Color filter
liquid-crystal-on-silicon microdisplays,” SID Tech. Digest 36, 880-883 (2005)
4. D. Cuypers, H. De Smet, and A. Van Calster, “Fringe field effects in microdisplay,”
SID Tech. Digest 36, 1298-1301 (2005).
5. K. H. Fan-Chiang, S. T. Wu, and S. H. Chen, “Fringing-field effects on high
resolution microdisplays,” (invited paper) IEEE/OSA J. Display Technology 1, (Dec.
2005).
6. J. Anderson, C. Chen and P. Bos, “Fast VAN LCoS microdisplay,” SID Tech. Digest
36, 1366-1369 (2005).
7. S. D. Yeo, C. H. Oh, H. W. Lee and M. H. Park, “LCD technologies for the TV
applications,” SID Tech. Digest 36, 1738-1741 (2005).
8. Y. Yoshida, Y. Kikuchi, and S. Daly, “Image quality improvements in large-screen
LCD-TV,” SID Tech. Digest 36, 1852-1855 (2005).
9. R. A. Soref, “Liquid-crystal fiberoptic switch,” Opt. Lett. 4, 155 (1979).
10. K. Hirabayashi, M. Wada, C. Amano, “Liquid crystal variable optical attenuators
integrated on planar lightwave circuits,” J. Lighwave Techn. 13, 609 (2001).
11. M. W. Maeda, J. S. Patel, C. L. Lin, J. Horrobin, and R. Spicer, “Electronically
tunable liquid-crystal-etalon filter for high-density WDM systems,” IEEE Photon.
Technol. Lett. 2, 820 (1990).

158
12. Y. Q. Lu, F. Du, Y. H. Wu and S. T. Wu, “Liquid Crystal Based Fourier Optical
Spectrum Analyzer without Moving Parts,” Jpn. J. Appl. Phys. 44, 291 (2005).
13. M. Escuti, C. C. Bowley, and G. P. Crawford, “A model of the fast-switching
polymer-stabilized IPS configuration,” Soc. Inform. Display Tech. 30, 32 (1999).
14. R. A. M. Hikmet, “Electrically induced light scattering from anisotropic gels,” J.
Appl. Phys 68, 4406 (1990).
15. K. Hirabayashi, M. Wada and C. Amano, “Optical-fiber variable-attenuator arrays
using polymer-network liquid crystal,” IEEE Photon. Technol. Lett. 13, 487 (2001).
16. T. T. Larsen, A. Bjarklev, D. S. Hermann and J. Broeng, “Optical devices based on
liquid crystal photonic bandgap fibres,” Opt. Express 11, 2589 (2003).
17. F. Du, Y. Q. Lu and S. T. Wu, “Electrically tunable liquid crystal photonic crystal
fiber,” Appl. Phys. Lett. 85, 2181 (2004).
18. T. T. Alkeskjold, A. Bjarklev, D. S. Hermann, and J. Broeng, “Optical devices based
on liquid crystal photonic bandgap fibres,” Opt. Express 11, 2589, 2003.
19. T. T. Alkeskjold, J. Lægsgaard, A. Bjarklev, D. S. Hermann, Anawati, J. Li and S. T.
Wu, “All-optical modulation in dye-doped nematic liquid crystal photonic bandgap
fibers,” Opt. Express 12, 5857, 2004.
20. T. T. Alkeskjold, J. Laegsgaard, A. Bjarklev, D. S. Hermann, J. Broeng, J. Li, S.
Gauza and S. T. Wu, “Highly tunable large-core single-mode liquid crystal photonic
bandgap fiber,” Accepted, Applied Optics (2005).
21. I. C. Khoo and S. T. Wu, Optics and Nonlinear Optics of Liquid Crystals, (World
Scientific, Singapore, 1993).
22. W. H. de Jeu, Physical properties of liquid crystalline materials, (Gordon and

159
Breach, New York, 1980).
23. P. G. de Gennes and J. Prost, The physics of liquid crystals, 2nd ed. (Clarendon
Press, Oxford, New York, 1993).
24. G. Vertogen and W. H. de Jeu, Thermotropic liquid crystal, fundamentals, (Springer-
Verlag, Berlin, 1988).
25. S. T. Wu, “Absorption measurements of liquid crystals in the ultraviolet, visible, and
infrared”, J. Appl. Phys. 84, 4462, (1998).
26. M. F. Vuks, “Determintion of the optical anisotropy of aromatic molecules from the
double refraction of crystals”,Opt. Spektrosk. 20, 644 (1966)
27. S. T. Wu, “Birefringence dispersions of liquid crystals,” Phys. Rev. A 33, 1270,
(1986).
28. S. T. Wu, “A semiempirical model for liquid-crystal refractive index dispersions,” J.
Appl. Phys. vol. 69, 2080, (1991).
29. I. Abdulhalim, “Dispersion relations for the refractive indices and the effective
birefringence of liquid crystals,” Mol. Cryst. Liq. Cryst. 197, 103-108 (1991).
30. S. T. Wu, C. S. Wu, M. Warenghem, and M. Ismaili, “Refractive index dispersions
of liquid crystals,” Opt. Eng. 32, 1775, (1993).
31. E. M. Averyanov, “Dispersion of refractive indices in nematic liquid crystals,” J.
Opt. Technol. 64, 417-423 (1997).
32. I. Haller, “Thermotropic and static properties of liquid crystals,” Prog. Solid State
Chem. 10, 103-118 (1975).

160
33. S. Jen, N. Clark and P. S. Pershan, “Polarized raman scattering studies of
orientational order in uniaxial liquid crystalline phases,” J. Chem. Phys. 66, 4635-
4661 (1977)
34. M. Warenghem and G. Joly, "Liquid crystal refractive indices behavior versus
wavelength and temperature”, Mol. Cryst. Liq. Cryst. 207, 205-218 (1991).
35. I. C. Khoo and S. Shepard, “Submillisecond grating diffractions in nematic liquid
crystal films”, J. Appl. Phys., 54, 5491-5493 (1990).
36. M. Warenghem, J. F. Henninot, and G. Abbate, “Non linearly induced self
waveguiding structure in dye doped nematic liquid crystals confined in capillaries,”
Opt. Express 2, 483 (1998).
37. M. Warenghem, J. F. Henninot, F. Derrin, and G. Abbate, “Thermal and orientational
spatial optical solitons in dye-doped liquid crystals,” Mol. Cryst. Liq. Cryst. 373, 213
(2002).
38. L. Lam and J. Prost, Solitons in liquid crystals, (Springer-Verlag, New York, 1992).
39. V. Freedericksz and V. Zolina, “Forces causing the orientation of an anisotropic
liquid”, Trans. Faraday Soc. 29, 919 (1933).
40. M. Born and E. Wolf, Principle of Optics, Sixth ed., (Pergamon Press, New York,
1980).
41. J. D. Jackson, Classical Electrodynamics, 2nd Ed., (Wiley, New York 1962), Chap. 4.
42. L. M. Blinov, Electro-optical and magneto-optical properties of liquid crystals,
(Wiley & Sons, New York, 1983), Chap. 2.
43. H. Mada and S. Kobayashi, “Wavelength and voltage dependences of refractive
indices of nematic liquid crystals”, Mol. Cryst. Liq. Cryst. 33, 47 (1976).

161
44. L. Pohl and U. Finkenzeller, Liquid Crystals: Applications and Uses, edited by B.
Bahadur, Singapore: World Scientific, 1990, vol.1, Ch. 4.
45. J. Li and S. T. Wu, “Extended Cauchy equations for the refractive indices of liquid
crystals,” J. Appl. Phys. 95, 896-901 (2004).
46. J. Li and S. T. Wu, “Two-coefficient Cauchy model for low birefringence liquid
crystals”, J. Appl. Phys. 96, 170-174 (2004).
47. J. Li, C. H. Wen, S. Gauza, R. Lu and S. T. Wu, “Refractive indices of liquid crystals
for display applications,” (invited paper) IEEE/OSA J. Display Technology 1, 51-61
(2005).
48. J. Li and S. T. Wu, “Self-consistency of Vuks equations for liquid-crystal refractive
indices”, J. Appl. Phys. 96, 6253-6258 (2004).
49. J. Li, S. Gauza, and S. T. Wu, “Temperature effect on liquid crystal refractive
indices”, J. Appl. Phys. 96, 19-24 (2004).
50. J. Li, S. Gauza and S. T. Wu, “High temperature-gradient refractive index liquid
crystals” Opt. Express 12, 2002-2010, (2004).
51. J. C. Knight, J. Broeng, T. A. Birks, and P.St. J. Russell, “Photonic band gap
guidance in optical fibers,” Science 282, 1476-1478 (1998).
52. B. J. Eggleton, C. Kerbage, P.S. Westbrook, R. Windeler and A. Hale,
“Microstructured optical fiber devices,” Opt. Express 9, 698-713 (2001)
53. C. Kerbage and B. J. Eggleton, “Numerical analysis and experimental design of
tunable birefringence in microstructured optical fiber,” Opt. Express 10, 246-255
(2002).
54. P. St. J. Russell, “Photonic crystal fibers,” Science 299, 358-362 (2003).

162
55. N. M. Litchinitser, S. C. Dunn, P. E. Steinvurzel, B. J. Eggleton, T. P. White, R. C.
McPhedran and C. M. de Sterke, “Application of an ARROW model for designing
tunable photonic devices,” Opt. Express 12, 1540-1550 (2004).
56. M. W. Haakestad, T. T. Alkeskjold, M. D. Nielsen, L. Scolari, J. Riishede, H. E.
Engan, and A. Bjarklev, “Electrically tunable photonic bandgap guidance in a liquid-
crystal-filled photonic crystal fiber,” IEEE Photonics Technol. Lett. 17, 819-821
(2005).
57. L. Scolari, T. T. Alkeskjold, J. Riishede and A. Bjarklev, D. S. Hermann, M. D.
Nielsen and P. Bassi, “Continuously tunable devices based on electrical control of
dual-frequency liquid crystal filled photonic bandgap fibers,” Opt. Express 13, 7483-
7496 (2005).
58. S. Brugioni, S. Faetti, and R. Meucci, “Mid-infrared refractive indices of the nematic
mixture E7,” Liq. Cryst. 30, 927 (2003).
59. J. Li, S. T. Wu, S. Brugioni, S. Faetti and R. Meucci “Infrared refractive indices of
liquid crystals,” J. Appl. Phys. 97, 073501 (2005).
60. G. Weber, U. Finkenzeller, T. Geelhaar, H. J. Plach, B. Rieger, and L. Pohl, Liq.
Cryst. 5, 1381 (1989).
61. R. Tarao, H. Saito, S. Sawada, and Y. Goto, SID Tech. Digest 25, 233 (1994).
62. H. R. Zeller, “Dielectric relaxation in nematics and Doolittle’s law,” Phys. Rev. A 26,
1875-1787 (1982).
63. G. R. Van Hecke andJ. Stecki, “Pretransitional behavior of the density of the nematic
phase,” Phys. Rev. A 25, 1123-1126 (1982).
64. K. S. Sundararajan, Z. Krist. 93, 238 (1936).

163
65. C. Bunn and R. Daubeny, Trans. Faraday Soc. 50, 1173 (1954).
66. A. D. Buckingham, Molecular Electro-Optics, edited by C. T. O’Konski (Dekker,
New York, 1976), Chap. 2.
67. P. Sarkar, P. Mandal, S. Paul and R. Paul, “X-ray diffraction, optical birefringence,
dielectric and phase transition properties of the long homologous series of
nematogens 4-(trans-4’-n-alkylcyclohexyl) isothiocyanatobenzens,” Liq. Cryst. 30,
507-527 (2003).
68. L. Pohl and U. Finkenzeller, Liquid Crystals: Applications and Uses, edited by B.
Bahadur, Singapore: World Scientific, 1990, vol.1, Ch. 4.
69. S. T. Wu, U. Efron and L. D. Hess, “Infrared birefringence of liquid crystals,” Appl.
Phys. Lett. 44, 1033-1035 (1984).
70. S. T. Wu, U. Efron and L. D. Hess, “Birefringence measurements of liquid crystals,”
Applied Optics 23, 3911-3915 (1984).
71. S. Brugioni and R. Meucci, “Mid-infrared interferometric measurement of liquid
crystal anisotropy,” Opt. Comm. 230, 19-22 (2004).
72. E. Batella, A. d’Alessandro and M. Warenghem, “Extension of phase modulation
ellipsometry to measure refractive indices of liquid crystals,” Mol. Cryst. Liq. Cryst.,
372, 275-289 (2001).
73. N. A. Vaz, G. W. Smith, G. P. Montgomery, and W. D. Marion, “Refractive indices
of a Methylstilbene polymer liquid crystal,” Mol. Cryst. Liq. Cryst., 198, 305-321
(2001).
74. V. Tkachenko, G. Abbate, A. Marino, F. Vita, M. Giocondo, A. Mazzulla and L. D.
Stefano, “Nematic liquid crystal dispersion in the visible-near infrared range,” the

164
11th international topical meeting on Optic of liquid crystals, Marriott Suites
Clearwater Beach on Sand Key, Florida , October 2005.
75. C. H. Wen, S. Gauza, and S. T. Wu, “Ultraviolet stability of liquid crystal alignment
layers and mixtures,” Proc. SPIE, 5740, 67-75 (2005).
76. P. Janssen, J. A. Shimizu, J. Dean, and R. Albu, “Design aspects of a scrolling color
LCoS display,” Displays 23, 99 (2002).
77. S. Gauza, H. Wang, C. H Wen, S. T. Wu, A. J. Seed and R. Dąbrowski, “High
birefringence isothiocyanato tolane liquid crystals,” Jpn. J. Appl. Phys. Part 1, 42,
3463-3466 (2003).
78. A. Spadło, R. Dąbrowski, M. Filipowicz, Z. Stolarz, J. Przedmojski, S. Gauza, Y. H.
Fan, S. T. Wu, “Synthesis, mesomorphic and optical properties of
isothiocyanatotolanes,” Liq. Cryst. 30, 191-198 (2003).
79. R. D. Meade, A. M. Rappe, K. D. Brommer, J. D. Joannopoulos, and O. L. Alerhand,
“Accurate theoretical analysis of photonic band-gap materials,” Phys. Rev. B 48,
8434-8437 (1993).
80. R. D. Meade, A. M. Rappe, K. D. Brommer, J. D. Joannopoulos, and O. L. Alerhand.
Erratum, “Accurate theoretical analysis of photonic band-gap materials,” Phys. Rev.
B 55, 15942 (1997).
81. S. G. Johnson and J. D. Joannopoulos, “Block-iterative frequency-domain methods
for Maxwell's equations in a planewave basis,” Optics Express 8, 173-190 (2001).
82. M. Albertsen, J. Lægsgaard, S. E. B. Libori, K. Hougaard, J. Riishede, and A.
Bjarklev, “Coupling reducing k-points for photonic crystal fiber calculations,”
Photonics and Nanostructures 1, 43-54 (2003).

165
83. J. D. Dai and C. K. Jen, “Analysis of cladded uniaxial single-crystal fibers,” J. Opt.
Soc. Am. A 8, 2021-5 (1991).
84. P. Steinvurzel, B. T. Kuhlmey, T. P. White, M. J. Steel, C. Martijn. de Sterke, B.
J. Eggleton, “Long wavelength anti-resonant guidance in high index inclusion
microstructured fibers,” Opt. Express 12, 5424-34 (2004).
85. N. V. Tabiryan, A. V. Sukhov, B. Ya Zel’dovich, “The orientational optical
nonlinearity of liquid crystals,” Mol. Cryst. Liq. Cryst. 136, 1 (1986)
86. A. W. Snyder, D. J. Mitchell, L. Poladian, and F. Ladouceur, “Self-induced optical
fibers: spatial solitary waves,” Opt. Lett. 16, 21-23 (1991).
87. E. Braun, L. Faucheux, and A. Libchaber, “Strong self-focusing in nematic liquid
crystals,” Phys. Rev. A 48, 611-622 (1993).
88. E. Braun, L. Faucheux, A. Libchaber, D. W. McLaughlin, D. J. Muraki, M. J.
Shelley, Europhys. Letts. 23, 239-244 (1993).
89. D. W. McLaughlin, D. J. Muraki and M. J. Shelley, “Light interacting with liquid
crystals,” Physica D 68, 116-126 (1993).
90. I. C. Khoo, “Nonlinear optics of liquid crystals,” in Prog. Opt. 27, 105 (1988).
91. M. Peccianti and G. Assanto, “Signal readdressing by steering of spatial solitons in
bulk nematic liquid crystals,” Opt. Lett. 26, 1690-1692 (2001).
92. M. Peccianti, A. De Rossi, G. Assanto, A. De Luca, C. Umeton, and I.C. Khoo,
“Electrically assisted self-confinement and waveguiding in planar nematic liquid
crystal cells,” Appl. Phys. Lett. 77, 7-9 (2000).
93. U. Efron, S. T. Wu, J. Grinberg, and L. D. Hess, Opt. Eng. 24, 111 (1985).
94. R. M. Matic, Proc. SPIE 2120, 194 (1994).

166
95. P. F. McManamon, T. A. Dorschner, D. L. Corkum, L. Friedman, D. S. Hobbs, M.
Holz, S. Liberman, H. Q. Nguyen, D. P. Resler, R. C. Sharp, and E. A. Watson,
Proc. of the IEEE 84, 268 (1996).
96. D. Dolfi, M. Labeyrie, P. Joffre, and J. P. Huignard, Electron Lett. 29, 926 (1993).
97. K. C. Lim, J. D. Margerum, and A. M. Lackner, Appl. Phys. Lett. 62, 1065 (1993).
98. J. L. Fergason, “Polymer encapsulated nematic liquid crystals for display and light
control applications,” SID Symposium Digest 16, pp. 68-69, 1985.
99. J. W. Doane, A. Golemme, B. G. Wu, and S. Zumer, “Field controlled light
scattering from nematic microdroplets,” Appl. Phys. Lett. 48, 269-271, 1986.
100. P. S. Drzaic, Liquid Crystal Dispersions, (World Scientific, Singapore, 1995).
101. S. Matsumoto, M. Houlbert, T. Hayashi, and K. Kubodera, “Fine droplets of liquid
crystals in a transparent polymer and their response to an electric field,” Appl. Phys.
lett. 69, 1044-1046, (1996).
102. S. Matsumoto, K. Hirabayashi, S. Sakata, and T. Hayashi, “Tunable wavelength
filter using nano-sized droplets of liquid crystal,” IEEE Photonics Technol. Lett. 11,
442-444, (1999).
103. D. E. Lucchetta, R. Karapinar, A. Manni, and F. Simoni, “Phase-only modulation by
nanosized polymer-dispersed liquid crystals,” J. Appl. Phys. Vol. 91, 6060-
6065,( 2002).
104. H. Ren, Y. H. Fan and S. T. Wu, “Tunable Fresnel lens using nanoscale polymer-
dispersed liquid crystals,” Appl. Phys. Lett. 83, 1515-1517 (2003).
105. H. Ren, Y.H. Fan, Y. H. Lin, and S. T. Wu, “Tunable-focus microlens arrays using
nanosized polymer-dispersed liquid crystal droplets,” Opt. Commun., 247, 101-106

167
(2005).
106. H. Ren, Y. H. Lin, Y. H. Fan, and S. T. Wu, “Polarization-independent phase
modulation using a polymer-dispersed liquid crystal,” Appl. Phys. Lett., 86, 141110
(2005).
107. Y. H. Fan, Y. H. Lin, H. Ren, S. Gauza, and S. T. Wu, “Fast-response time and
scattering-free polymer network liquid crystals for infrared light modulators,” Appl.
Phys. Lett. 84, 1233-1235, 2004.
108. J. Li, G. Baird, Y. H. Lin, H. W. Ren and S. T. Wu, “Refractive index matching
between liquid crystals and photopolymers”, J. Society for Information Display 13,
(November, 2005).


![REFRACTIVE INDICES DETERMINATION OF A NEW … · extraordinary refractive index, ... [1-3], the hollow prism technique [4,5] ... Refractive indices determination of a new nematic](https://img.pdfslide.net/doc/110x75/5ac1302a7f8b9a433f8c8ea2/refractive-indices-determination-of-a-new-refractive-index-1-3-the-hollow.jpg)