Embed Size (px)
Citation preview

University of Illinois at Urbana-Champaign
Air Conditioning and Refrigeration Center A National Science Foundation/University Cooperative Research Center
Refrigerant and Oil Migration and Retention in Air Conditioning
and Refrigeration Systems
V. P. Sheth and T. A. Newell
ACRC TR-240 June 2005
For additional information:
Air Conditioning and Refrigeration Center University of Illinois Mechanical & Industrial Engineering Dept. 1206 West Green Street Prepared as part of ACRC Project 164# Urbana, IL 61801 Refrigerant and Oil Migration and Retention in Refrigeration Systems (217) 333-3115 T. A. Newell, and P. S. Hrnjak, Principal Investigators

The Air Conditioning and Refrigeration Center was founded in 1988 with a grant from the estate of Richard W. Kritzer, the founder of Peerless of America Inc. A State of Illinois Technology Challenge Grant helped build the laboratory facilities. The ACRC receives continuing support from the Richard W. Kritzer Endowment and the National Science Foundation. The following organizations have also become sponsors of the Center. Arçelik A. S. Behr GmbH and Co. Carrier Corporation Cerro Flow Products, Inc. Copeland Corporation Daikin Industries, Ltd. Danfoss A/S Delphi Thermal and Interior Embraco S. A. Ford Motor Company Fujitsu General Limited General Motors Corporation Hill PHOENIX Hydro Aluminum Adrian, Inc. Ingersoll-Rand/Climate Control Lennox International, Inc. LG Electronics, Inc. Manitowoc Ice, Inc. Modine Manufacturing Co. Novelis Global Technology Centre Parker Hannifin Corporation Peerless of America, Inc. Samsung Electronics Co., Ltd. Sanden Corporation Sanyo Electric Co., Ltd. Tecumseh Products Company Trane Visteon Automotive Systems Wieland-Werke, AG Wolverine Tube, Inc. For additional information: Air Conditioning & Refrigeration Center Mechanical & Industrial Engineering Dept. University of Illinois 1206 West Green Street Urbana, IL 61801 217 333 3115
iii
Table of Contents
Page
List of Figures .............................................................................................................. iv
List of Tables ................................................................................................................. v
Nomenclature ............................................................................................................... vi Chapter 1: Introduction................................................................................................. 1
Chapter 2: Experimental Setup and Procedure .......................................................... 2 2.1 Modification of Air Conditioning Unit........................................................................................... 2 2.2 Energy Balance and Charge Calculation ..................................................................................... 2 2.3 Test Section Geometrical and EES Volume Calculation ............................................................ 3 2.4 Data Collection Procedure............................................................................................................. 4
Chapter 3: Analysis and Literature Review................................................................ 7 3.1 Literature Review of Void Fraction ............................................................................................... 7 3.2 Void Fraction Data Analysis .......................................................................................................... 7 3.3 Oil Holdup Model and Data Analysis............................................................................................ 9
Chapter 4: Experimental Results .............................................................................. 10 4.1 Total Experimental Oil and Refrigerant Mass............................................................................ 10 4.2 Experimental Oil and Refrigerant Mass per Unit Length.......................................................... 15 4.3 Evaporator and Condenser Coil Temperatures......................................................................... 20 4.4 Predicted and Experimental Refrigerant Mass in the Evaporator and Condenser................ 22 4.5 Predicted and Experimental Oil Mass in the Evaporator and Condenser .............................. 22 4.6 Conclusion .................................................................................................................................... 22
Bibliography ................................................................................................................ 26

iv
List of Figures
Page Figure 2.1 Actual unit with several connections cut off. ...............................................................................................4 Figure 2.2 Unit after modifications were made. ............................................................................................................5 Figure 2.3 Schematic of A/C unit after modifications were made.................................................................................5 Figure 2.4 Unit while energy balance was performed. ..................................................................................................6 Figure 4.1 Refrigerant and Oil Mass in All Components for Data Set 1 .....................................................................10 Figure 4.2 Refrigerant and Oil Mass in All Components for Data Set 2 .....................................................................11 Figure 4.3 Refrigerant and Oil Mass in All Components for Data Set 3 .....................................................................11 Figure 4.4 Refrigerant and Oil Mass in All Components for Data Set 4 .....................................................................12 Figure 4.5 Refrigerant and Oil Mass in All Components for Data Set 5 .....................................................................12 Figure 4.6 Refrigerant and Oil Mass in All Components for Data Set 6 .....................................................................13 Figure 4.7 Refrigerant and Oil Mass in All Components for Data Set 7 .....................................................................13 Figure 4.8 Refrigerant and Oil Mass in All Components for Data Set 8 .....................................................................14 Figure 4.9 Refrigerant and Oil Mass in All Components for Data Set 9 .....................................................................14 Figure 4.10 Refrigerant and Oil Mass per Length (g/m) in All Components for Data Set 1 .......................................15 Figure 4.11 Refrigerant and Oil Mass per Length (g/m) in All Components for Data Set 2 .......................................16 Figure 4.12 Refrigerant and Oil Mass per Length (g/m) in All Components for Data Set 3 .......................................16 Figure 4.13 Refrigerant and Oil Mass per Length (g/m) in All Components for Data Set 4 .......................................17 Figure 4.14 Refrigerant and Oil Mass per Length (g/m) in All Components for Data Set 5 .......................................17 Figure 4.15 Refrigerant and Oil Mass per Length (g/m) in All Components for Data Set 6 .......................................18 Figure 4.16 Refrigerant and Oil Mass per Length (g/m) in All Components for Data Set 7 .......................................18 Figure 4.17 Refrigerant and Oil Mass per Length (g/m) in All Components for Data Set 8 .......................................19 Figure 4.18 Refrigerant and Oil Mass per Length (g/m) in All Components for Data Set 9 .......................................19 Figure 4.19 Evaporator Coil Temperatures for Data Set 4 to Data Set 9.....................................................................21 Figure 4.20 Condenser Coil Temperatures for Data Set 4 to Data Set 9 .....................................................................21

v
List of Tables
Page Table 2.1 1st Run of Volume Calculation comparing Geometric and EES Method.......................................................6 Table 2.2 2nd Run of Volume Calculation comparing Geometric and EES Method......................................................6 Table 4.1 Condenser Coil Temperatures. ....................................................................................................................23 Table 4.2 Evaporator Coil Temperatures.....................................................................................................................23 Table 4.3 Predicted and Experimental Refrigerant Mass in Evaporator and Condenser. ............................................24 Table 4.4 Predicted Refrigerant Vapor and Liquid Mass in each section of the Evaporator for Set 1. .......................24 Table 4.5 Predicted and Experimental Oil Mass in Evaporator and Condenser. .........................................................24 Table 4.6 Predicted Oil Mass in each section of Evaporator for Data Set 2 using Liquid Volume Fraction
Model...................................................................................................................................................................25

vi
Nomenclature
oC& Oil to Total Mass Flow Rate Ratio
D Diameter (m) Ft Froude Rate g Gravitation Acceleration G Mass Flux (Kg/m2s) L Length (m) mc Weight of Empty Component (g) me Weight of Component with Oil only (g) mf Weight of Component with Refrigerant and Oil (g) mo Oil Holdup Mass (g) mr Refrigerant Mass in Component (g) T Temperature (°C) Tsat Saturation Temperature (°C)
ts∀ Vapor Volume of Component (m3)
Voll Liquid Refrigerant Specific Volume (m3/Kg) Volts Specific Volume of Component (m3/Kg) Volv Vapor Refrigerant Specific Volume (m3/Kg) x Quality Xtt Lockhart-Martinelli Parameter α Void Fraction
µ Dynamic Viscosity (Kg/m-s) ν Kinematic Viscosity (m2/s) ρ Density (Kg/ m3)
Common Subscripts i Inner l Liquid o Oil r Refrigerant v Vapor x at a Given Quality

1
Chapter 1: Introduction
Oil trapped in an air conditioning system’s tubing and heat exchangers has several ill effects on the system.
These include degradation of heat transfer in the heat exchanger units, increased pressure drop, insufficient
lubrication for the compressor, and possible flooding of the compressor suction ports with oil causing failure of the
compressor. To be able to quantitatively define the effects of oil entrapment on these parameters, initially, a study
to find out the amount of oil trapped in the different components of an air conditioning system is required.
The objective of this study is to collect quantitative oil hold up data for a commercially available air
conditioning system using R-22 as the refrigerant. The goal is to compare refrigerant charge and oil holdup
predictions with the data collected from the system experiments.
This document is made up of 4 chapters. Chapter 2 discusses the experimental setup and procedures.
Chapter 3 presents a literature review on void fraction and the analysis used to analyze the collected data. The
experimental data and results are presented in Chapter 4 along with a conclusion.

2
Chapter 2: Experimental Setup and Procedure
A commercially available “Sunbeam” window air conditioning unit using R-22 as a refrigerant is used for
this study. This chapter presents a description of the experimental modification and setup of the air conditioning
unit, and the procedure and measurement techniques used to gather oil hold up data for the present study.
2.1 Modification of Air Conditioning Unit The air conditioning unit used for this experiment is a Sunbeam model SCK 5200M air conditioner with a
cooling capacity of 1524 watts (5200 BTU/hour). The unit has a rated input power of 515 watts and a rated current
of 5 amperes. The quantity of R-22 refrigerant in the original system is 340.2 grams (12 ounces). The design
pressures for the unit are 2.55 megapascals (370 psi) on the high end and 1.03 megapascals (150 psi) on the low end.
Several modifications were made to the standard unit in the process of getting it ready to gather oil hold up data.
Figure 2.1 shows a photograph of the actual unit with several of its connections cut off to make the necessary
modifications. The modifications consisted of adding Schrader valves, Allin “Liquid Eye” sight glasses, a filter
dryer, several 6.35 mm (¼”) and 9.53 mm (3/8”) Swagelock shut-off valves, and a Swagelock needle valve. The
modifications also included extension of the 3 main tubes. These tubes are the suction line, the compressor
discharge line, and the liquid line. In the original unit, a capillary tube was located between the condenser and the
evaporator. In the modified system, this capillary tube was replaced with a needle valve, which acts as the
expansion valve. Each of these 3 sections of modified tubing consists of a 1 meter long section of tube between 2
shut off valves. Shut off valves are also installed at the entry of the compressor, the evaporator and the condenser.
These valves allow for the gathering of oil hold up and refrigerant charge data in the condenser and the evaporator.
A sight glass is installed on the tube going from the evaporator to the compressor to make sure there is fully
evaporated refrigerant going to the compressor. A sight glass is also installed on the tube going from the condenser
to the expansion valve to view refrigerant going to the expansion valve. Additionally there is also a sight glass
installed before the evaporator inlet. Out of the 3 modified tube sections, the tube going from the evaporator to the
compressor is a 9.53 mm (3/8”) diameter pipe, while the other 2 tubes are 6.35 mm (¼”) in diameter. A pair of
pressure gauges is also installed in the loop with one pressure gauge on the high pressure side of the compressor and
the other one on the low pressure side. The various tube connections were sweat fitted on to the loop using silver
solder. The shut-off valves, pressure gauges, and sight glasses were connected on the loop using compression and
flare fittings. The shut-off valves enable the 3 tube sections, the condenser and the evaporator to be sealed off and
separated from the rest of the system. The Schrader valves enable the various sections of the system to be charged
and discharged with refrigerant or nitrogen as needed. A photograph of the unit after the modifications have been
made is shown in Figure 2.2 and a schematic of the unit after the modifications is shown in Figure 2.3.
2.2 Energy Balance and Charge Calculation Before any modifications to the air conditioning unit were made, an energy balance was performed on the
system. The amount of power consumed by the compressor was continuously measured using a watt meter. Duct
work was build around the condenser and evaporator inlet and outlet. These ducts were then divided into smaller
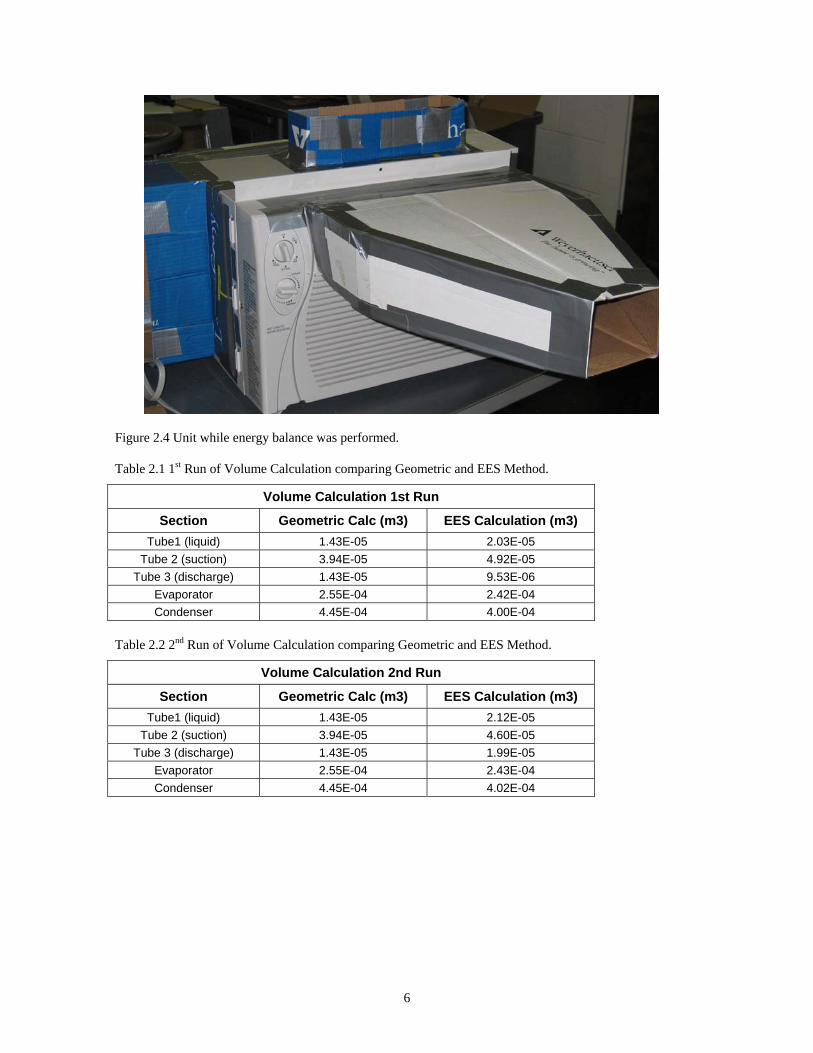
units of area using thread. The purpose of the thread was to set up a grid for measurement locations. Figure 2.4

3
shows a picture of the unit while the energy balance was being performed. The flow of air in each unit of area was
measured using a flow meter as well as the temperature in each unit of area was recorded. Using this data the heat
rejected by the condenser was calculated and the heat absorbed by the evaporator was calculated. The difference
between the two is the amount of power consumed by the compressor. The results agreed to within +/- 10% of this
amount.
After the modifications were made a charge calculation was done on the new system due to the extra
volume of tubing added to the unit. The volume of the tubes was calculated by measuring the length and internal
diameters of the pipes. A high side pressure of 1.21 megapascal (175 psi) and a low side pressure of 0.483
megapascal (70 psi) were assumed for the calculation. Using EES and these assumptions a simple calculation was
made to determine the density of the refrigerant at the four different sections of the system. From the volume of the
tubes and the density of refrigerant the extra mass of refrigerant charge to be added to the system was determined to
be approximately 63.79 grams (2.25 ounces).
2.3 Test Section Geometrical and EES Volume Calculation The test section volumes required for void fraction calculations are found experimentally as well as
geometrically. For the experimental method, the three tube sections and the condenser and evaporator are first
cleaned out to make sure there is no oil in them. This is done by flushing the components with pure R-22. The
components are then disconnected and each of them is weighed. This is recorded as their dry weight without any oil
or refrigerant. After this the components are put together again and filled with pure refrigerant. The room
temperature is noted, which is the temperature of the refrigerant in the components. The saturation pressure of the
refrigerant at room temperature is found using Engineering Equation Solver (EES). The system is then filled with
the vapor to approximately ¾ of the saturation pressure. This is done to ensure that there is just vapor and no liquid
in the components. The shut off valves for each component are then closed off and the system is taken apart. Each
of the components is then weighed and the refrigerant is removed carefully. Each of the components is then weighed
again to determine the mass of refrigerant in them. This also gives dry weights for the components that are used to
calculate the mass of oil in each one of them later. The pressure and temperature are substituted into EES to
determine a density for the refrigerant vapor in the components. Using this density and refrigerant mass measured in
each section, the volume for each of the components is calculated. This was repeated twice for each of the
components.
For the geometrical determination of a component’s volume, the volume is calculated by measuring the
geometry for each of the components. This is relatively easy for the three tube sections as they are just 1 meter long
sections. For the condenser and the evaporator, the geometrical calculations are an approximation due to their
complicated design, which renders it hard to get exact geometrical measurements. The geometrical volume
calculations for the tube sections are accurate due to their relatively simple geometry. Table 2.1 and 2.2 show the
geometrical and EES volume data for the 1st and 2nd run for the 3 tube sections as well as the evaporator and the
condenser.
For calculations the geometrical volume will be used for the tube sections and the experimental volume
will be used for the condenser and the evaporator. The tube sections have a much simpler geometry, but not enough

4
refrigerant mass in them. The lower mass leads to a much higher uncertainty in the volume calculation based on the
vapor mass measurement technique. Therefore the geometrical volume is more accurate than the experimental one
calculated using EES. On the other hand the condenser and the evaporator have a much larger refrigerant mass in
them, but a more complicated geometry. Thus for all calculation purposes the geometrical volume of the tube
sections will be used and the experimental volume of the condenser and the evaporator will be used. These are the
bold quantities in Table 2.1 and 2.2.
2.4 Data Collection Procedure Initially the dry weight of each of the components was found by placing the components on a scale. To
take a set of data, the system is first put together. A vacuum is drawn on the system and it is ensured that there are
no leaks in the system. The system is then charged with the proper amount of charge as calculated above. The
system is turned on and then allowed to stabilize for approximately 2 hours. After this the power to the compressor
is cut off while all the shut off valves are simultaneously turned off to trap the refrigerant and oil in the respective
components. This is done with the help of several laboratory personnel. Each one of the components is then
disconnected from the system and weighed. The refrigerant is then removed from each of the components and they
are weighed again. This gives the mass of refrigerant trapped in each one of them. At this point the components
only contain oil in them. The dry weights of the components are subtracted from the weight of the components with
oil to give the mass of oil in each one of them.
Figure 2.1 Actual unit with several connections cut off.

5
Figure 2.2 Unit after modifications were made.
Figure 2.3 Schematic of A/C unit after modifications were made.
Condenser Coil
Evaporator Coil
Compressor
Shut off valve Expansion valve Eye Glass
Compressor Discharge Pipe 3
Liquid Line Pipe 1
Compressor Suction Pipe 2
6
Figure 2.4 Unit while energy balance was performed.
Table 2.1 1st Run of Volume Calculation comparing Geometric and EES Method.
Volume Calculation 1st Run
Section Geometric Calc (m3) EES Calculation (m3) Tube1 (liquid) 1.43E-05 2.03E-05
Tube 2 (suction) 3.94E-05 4.92E-05 Tube 3 (discharge) 1.43E-05 9.53E-06
Evaporator 2.55E-04 2.42E-04 Condenser 4.45E-04 4.00E-04
Table 2.2 2nd Run of Volume Calculation comparing Geometric and EES Method.
Volume Calculation 2nd Run
Section Geometric Calc (m3) EES Calculation (m3) Tube1 (liquid) 1.43E-05 2.12E-05
Tube 2 (suction) 3.94E-05 4.60E-05 Tube 3 (discharge) 1.43E-05 1.99E-05
Evaporator 2.55E-04 2.43E-04 Condenser 4.45E-04 4.02E-04

7
Chapter 3: Analysis and Literature Review
This literature review discusses the various parameters used in void fraction models. Various void fraction
models are also discussed. The methodology for collecting oil holdup data described in chapter 2 is defined as the
proper procedure. A more detailed description of this procedure and details not addressed in this section can be
found in Dobson [2], Graham [3], Kopke [5], Piggott [7], and Wilson [9].
3.1 Literature Review of Void Fraction A series of Air Conditioning and Refrigeration Center (ACRC) technical papers as well as other authors
have reviewed void fraction literature. Correlation between pressure drop and four flow regimes of refrigerant vapor
and liquid phases was presented using a Lockhart-Martinelli parameter, Lockhart [6], which was developed in 1949.
The four flow regimes were based on the turbulent or laminar behavior of the refrigerant vapor and liquid phase.
This parameter is also adequate for correlating void fraction in these flow regimes, as was found later. The
parameter for turbulent vapor and liquid, is defined as
1.05.09.01⎟⎟⎠
⎞⎜⎜⎝
⎛⎟⎟⎠
⎞⎜⎜⎝
⎛⎟⎠⎞
⎜⎝⎛ −
=v
l
l
vtt x
xXµµ
ρρ
(3.1)
The Froude rate parameter, which is a ratio relating vapor kinetic energy to gravitational effects on the liquid, was
defined by Hurlburt and Newell [4] as
5.023
)1( ⎟⎟⎠
⎞⎜⎜⎝
⎛−
=xgD
GxFtivρ
(3.2)
Graham [3] then developed a void fraction model based on an empirical study using this parameter. The void
fraction for two regions is defined by Graham’s model which is distinguished only by Froude rate numbers.
}{ )](ln0328.0[)]ln(3.0[1exp1 2 FtFt −−−−=α Ft > 0.01032 (3.3)
0=α Ft <= 0.01032 (3.4) Graham developed another void fraction model based on the Wallis [8] model. This took into account the effect of
mass flux variations and is recommended to be used for smooth tubes only. This is the ACRC void fraction model
used for the present study.
321.011
−
⎟⎟⎠
⎞⎜⎜⎝
⎛++=
ttt F
Xα (3.5)
3.2 Void Fraction Data Analysis From the physical data that is collected as described in chapter 2, the data was reduced and analyzed to
meaningful numbers using the following methods and equations. The technique for measuring the oil and
refrigerant mass was briefly discussed previously in chapter 2. Once the shut off valves are turned off to trap the
refrigerant and oil in the respective components, each of the components is carefully taken apart from the system. A
weight measurement of all the components (evaporator, condenser, liquid line, compressor suction line, compressor
discharge line) is done. This weight includes the refrigerant and oil and is recorded as mf. The refrigerant in the

8
component is vented out while making sure that any oil that may leak is collected and accounted for using a towel.
After venting, the component is weighed again and the weight is noted as me. The empty weights of the components
were recorded initially and noted as mc. This is followed by the calculation of void fraction and oil holdup using the
following equations.
The oil holdup mass is given as ceo mmm −= (3.6)
The refrigerant mass is given as efr mmm −= (3.7)
The specific volume of each component is given as r
tsts m
Vol ∀= , (3.8)
where ts∀ is the vapor volume of the component, which was defined in chapter 2 as the geometric volume of the
tube components and as the experimental volume for the evaporator and condenser.
The following property functions in EES combined with equations 3.6, 3.7, and 3.8 were used to obtain the
component static quality as a function of saturation temperature and specific volume, the specific volume at 100%
quality and the specific volume at zero quality respectively.
),,22( tssat VolvTTRQualityx === (3.9)
)1,,22( === xTTRVolumeVol satv (3.10)
)0,,22( === xTTRVolumeVol satl (3.11)
Equation 3.12 is then solved simultaneously with the above mentioned EES property functions to obtain the
experimental void fraction,α .
1
1.1−
⎥⎦
⎤⎢⎣
⎡+⎟
⎠⎞
⎜⎝⎛ −
=l
v
VolVolx
αα
(3.12)
This is the same procedure used by Crompton [1] for her experimental calculations.
The α obtained here is then used along with the ACRC void fraction model described above in equation
3.5, to give a flow quality for each of the components. The quality for the compressor discharge is used as the
condenser inlet quality and the quality for the liquid line is used as the condenser outlet quality. A constant enthalpy
drop over the expansion valve is assumed and in combination with the quality of the liquid line, EES is used to find
the evaporator inlet quality. The compressor suction quality is used as the evaporator outlet quality. Once the inlet
and outlet qualities for the evaporator and condenser are known, these are used along with the ACRC void fraction
model to get intermediate void fractions for the number of sections that each of the components (evaporator and
condenser) are broken up into to calculate predicted refrigerant mass. The predicted refrigerant mass is calculated
by multiplying the corresponding section volume by the liquid and vapor refrigerant density and the void fraction
and adding all the sections up to give the total amount of refrigerant in each component. These are then compared to
the experimental refrigerant mass quantities.

9
3.3 Oil Holdup Model and Data Analysis The oil mass data gathered from the experiments is compared to predicted oil mass numbers given by oil
holdup models. In particular the predicted oil holdup model used in this study is the one proposed by Crompton [1].
Crompton has proposed two different oil holdup models based on the quality of the refrigerant.
For qualities higher than 70%, it is expected that the viscous oil film has a significant effect on flow
conditions which results in an increase in oil holdup for that range. An oil holdup model for this higher quality
range is formulated using the Blasius turbulent flow formula for predicting the interfacial shear stress between the
liquid and vapor phases. This is called the viscous film model. For qualities lower than 70% an oil holdup model
derived from a conservation of mass analysis is proposed. At a given quality and void fraction this model uses the
calculated value of oil at the measured flowing oil concentration to predict the amount of oil. This model is called
the liquid volume fraction model.
The liquid volume fraction model gives the oil holdup per unit length as
⎟⎠⎞
⎜⎝⎛
−−
=xL
mL
m oox
11 α
(3.13)
and the viscous film model gives the oil holdup per unit length as
⎟⎟⎠
⎞⎜⎜⎝
⎛−
⎟⎠⎞
⎜⎝⎛=
xC
Lm
Lm oloil
1
& (3.14)
The detailed derivations and explanations for both these models can be found in Crompton [1]. Since the
experimental data in this study has given qualities of 70% or less in majority of the cases, the liquid volume fraction
model is the one used for the prediction of oil holdup for this study.
To calculate oil holdup for the evaporator and condenser in this study, the experimental liquid line oil
holdup was substituted into equation 3.13 as L
mox . Then using the liquid line void fraction and flow quality the
predicted oil holdup in the liquid line was obtained by solving for L
mo . This was then substituted back into
equation 3.13 along with the quality and void fraction for the particular component section to give the oil holdup in
that section. The oil holdup for the different sections in the evaporator and the condenser were then added up to
give a total oil holdup for the respective components.

10
Chapter 4: Experimental Results
This chapter presents the raw experimental data collected. The data is presented as total oil and refrigerant
mass in each component for each of the 9 sets of data. In addition to this the data is also presented as oil and
refrigerant mass per length of tube (meters) in each component for each of the 9 sets of data.
4.1 Total Experimental Oil and Refrigerant Mass A total of 9 sets of data were collected. The following figures show the actual amount of oil and refrigerant
mass experimentally found in each of the components of the system. The method used for this is described
previously in chapter 2. The condenser and evaporator have the largest amount of oil and refrigerant out of all the
components due to their size. The condenser tubing when straightened out would be 13.5m in length and the
evaporator tubing would be 7.73m in length. The compressor discharge, compressor suction and the liquid line are
all 1m long tubes.
The data shows that for all the runs, most of the refrigerant charge is stored in the condenser. This can be
attributed to the fact that the condenser has a much bigger volume due to its longer length (13.5m) of tubing
compared to the rest of the components. In addition the condenser has a liquid region, whereas the evaporator begins
at a quality greater than zero. The evaporator does not have a section with pure liquid refrigerant which is where
the bulk of the mass is contained.
1.12
80.46
6.95
68.24
2.690.03 1.35 0.04
32.14
0.180.00
10.00
20.00
30.00
40.00
50.00
60.00
70.00
80.00
90.00
CompressorDischarge
Condenser Liquid Line Evaporator Compressor Suction
Component
Oil
and
Ref
riger
ant M
ass (
g)
Refrigerant Mass Oil Mass
Figure 4.1 Refrigerant and Oil Mass in All Components for Data Set 1

11
2.05
97.61
5.79
41.45
1.850.52
24.60
1.59
10.92
1.220.00
20.00
40.00
60.00
80.00
100.00
120.00
CompressorDischarge
Condenser Liquid Line Evaporator Compressor Suction
Component
Oil
and
Ref
riger
ant M
ass (
g)
Refrigerant Mass Oil Mass
Figure 4.2 Refrigerant and Oil Mass in All Components for Data Set 2
0
157.27
0
55.11
00.76
38.93
1.97
23.54
3.130
20
40
60
80
100
120
140
160
180
CompressorDischarge
Condenser Liquid Line Evaporator Compressor Suction
Component
Oil
and
Ref
riger
ant M
ass (
g)
Refrigerant Mass Oil Mass
Figure 4.3 Refrigerant and Oil Mass in All Components for Data Set 3

12
4.99
125.03
7.65
43.68
4.340.95
30.62
1.49
17.40
1.900
20
40
60
80
100
120
140
CompressorDischarge
Condenser Liquid Line Evaporator Compressor Suction
Component
Oil
and
Ref
riger
ant M
ass (
g)
Refrigerant Mass Oil Mass
Figure 4.4 Refrigerant and Oil Mass in All Components for Data Set 4
3.8
164.38
8.92
47.74
6.530.96
36.51
1.32
55.18
2.240
20
40
60
80
100
120
140
160
180
CompressorDischarge
Condenser Liquid Line Evaporator Compressor Suction
Component
Oil
and
Ref
riger
ant M
ass (
g)
Refrigerant Mass Oil Mass
Figure 4.5 Refrigerant and Oil Mass in All Components for Data Set 5

13
4.61
269.75
23.48
73.97
10.910.74
45.32
3.4018.08
2.400
50
100
150
200
250
300
CompressorDischarge
Condenser Liquid Line Evaporator Compressor Suction
Component
Oil
and
Ref
riger
ant M
ass (
g)
Refrigerant Mass Oil Mass
Figure 4.6 Refrigerant and Oil Mass in All Components for Data Set 6
4.65
238.18
18.92
55.02
5.30.44
27.37
1.5021.04
1.000
50
100
150
200
250
300
CompressorDischarge
Condenser Liquid Line Evaporator Compressor Suction
Component
Oil
and
Ref
riger
ant M
ass (
g)
Refrigerant Mass Oil Mass
Figure 4.7 Refrigerant and Oil Mass in All Components for Data Set 7

14
5.26
228.94
11.44
57.38
8.030.49
20.60
0.98 7.14 1.230
50
100
150
200
250
CompressorDischarge
Condenser Liquid Line Evaporator Compressor Suction
Component
Oil
and
Ref
riger
ant M
ass (
g)
Refrigerant Mass Oil Mass
Figure 4.8 Refrigerant and Oil Mass in All Components for Data Set 8
5.51
214.21
11.64
72.21
9.990.43
17.460.96
24.13
1.210
50
100
150
200
250
CompressorDischarge
Condenser Liquid Line Evaporator Compressor Suction
Component
Oil
and
Ref
riger
ant M
ass (
g)
Refrigerant Mass Oil Mass
Figure 4.9 Refrigerant and Oil Mass in All Components for Data Set 9

15
4.2 Experimental Oil and Refrigerant Mass per Unit Length The following figures show the actual amount of oil and refrigerant mass per unit length, found
experimentally in each of the components of the system. On average the oil in the system appears to have a fairly
uniform distribution of approximately 1 to 4 grams per meter. The condenser and evaporator oil retention per tube
length are similar even though the evaporator has a higher average velocity due to lower refrigerant density and
higher average viscosity due to lower temperature.
1.12
5.96
6.95
8.83
2.69
0.03 0.10 0.04
4.16
0.180.00
1.00
2.00
3.00
4.00
5.00
6.00
7.00
8.00
9.00
10.00
CompressorDischarge
Condenser Liquid Line Evaporator Compressor Suction
Component
Oil
and
Ref
riger
ant M
ass (
g) p
er L
engt
h of
Tub
e (m
)
Refrigerant Mass Oil Mass
Figure 4.10 Refrigerant and Oil Mass per Length (g/m) in All Components for Data Set 1

16
2.05
7.23
5.795.36
1.85
0.52
1.821.59 1.41 1.22
0.00
1.00
2.00
3.00
4.00
5.00
6.00
7.00
8.00
CompressorDischarge
Condenser Liquid Line Evaporator Compressor Suction
Component
Oil
and
Ref
riger
ant M
ass (
g) p
er L
engt
h of
Tub
e (m
)
Refrigerant Mass Oil Mass
Figure 4.11 Refrigerant and Oil Mass per Length (g/m) in All Components for Data Set 2
0.00
11.65
0.00
7.13
0.000.76
2.881.97
3.05 3.13
0.00
2.00
4.00
6.00
8.00
10.00
12.00
14.00
CompressorDischarge
Condenser Liquid Line Evaporator Compressor Suction
Component
Oil
and
Ref
riger
ant M
ass (
g) p
er L
engt
h of
Tub
e (m
)
Refrigerant Mass Oil Mass
Figure 4.12 Refrigerant and Oil Mass per Length (g/m) in All Components for Data Set 3

17
4.99
9.26
7.65
5.65
4.34
0.95
2.27
1.49
2.251.90
0.00
1.00
2.00
3.00
4.00
5.00
6.00
7.00
8.00
9.00
10.00
CompressorDischarge
Condenser Liquid Line Evaporator Compressor Suction
Component
Oil
and
Ref
riger
ant M
ass (
g) p
er L
engt
h of
Tub
e (m
)
Refrigerant Mass Oil Mass
Figure 4.13 Refrigerant and Oil Mass per Length (g/m) in All Components for Data Set 4
3.80
12.18
8.92
6.18 6.53
0.96
2.70
1.32
7.14
2.24
0.00
2.00
4.00
6.00
8.00
10.00
12.00
14.00
CompressorDischarge
Condenser Liquid Line Evaporator Compressor Suction
Component
Oil
and
Ref
riger
ant M
ass (
g) p
er L
engt
h of
Tub
e (m
)
Refrigerant Mass Oil Mass
Figure 4.14 Refrigerant and Oil Mass per Length (g/m) in All Components for Data Set 5

18
4.61
19.98
23.48
9.5710.91
0.74
3.36 3.402.34 2.40
0.00
5.00
10.00
15.00
20.00
25.00
CompressorDischarge
Condenser Liquid Line Evaporator Compressor Suction
Component
Oil
and
Ref
riger
ant M
ass (
g) p
er L
engt
h of
Tub
e (m
)
Refrigerant Mass Oil Mass
Figure 4.15 Refrigerant and Oil Mass per Length (g/m) in All Components for Data Set 6
4.65
17.64
7.12
5.30
0.44
2.03 1.502.72
1.00
18.92
0.00
2.00
4.00
6.00
8.00
10.00
12.00
14.00
16.00
18.00
20.00
CompressorDischarge
Condenser Liquid Line Evaporator Compressor Suction
Component
Oil
and
Ref
riger
ant M
ass (
g) p
er L
engt
h of
Tub
e (m
)
Refrigerant Mass Oil Mass
Figure 4.16 Refrigerant and Oil Mass per Length (g/m) in All Components for Data Set 7

19
5.26
11.44
7.428.03
0.491.53
0.98 0.92 1.23
16.96
0.00
2.00
4.00
6.00
8.00
10.00
12.00
14.00
16.00
18.00
CompressorDischarge
Condenser Liquid Line Evaporator Compressor Suction
Component
Oil
and
Ref
riger
ant M
ass (
g) p
er L
engt
h of
Tub
e (m
)
Refrigerant Mass Oil Mass
Figure 4.17 Refrigerant and Oil Mass per Length (g/m) in All Components for Data Set 8
5.51
15.87
11.64
9.349.99
0.431.29 0.96
3.12
1.21
0.00
2.00
4.00
6.00
8.00
10.00
12.00
14.00
16.00
18.00
CompressorDischarge
Condenser Liquid Line Evaporator Compressor Suction
Component
Oil
and
Ref
riger
ant M
ass (
g) p
er L
engt
h of
Tub
e (m
)
Refrigerant Mass Oil Mass
Figure 4.18 Refrigerant and Oil Mass per Length (g/m) in All Components for Data Set 9
20
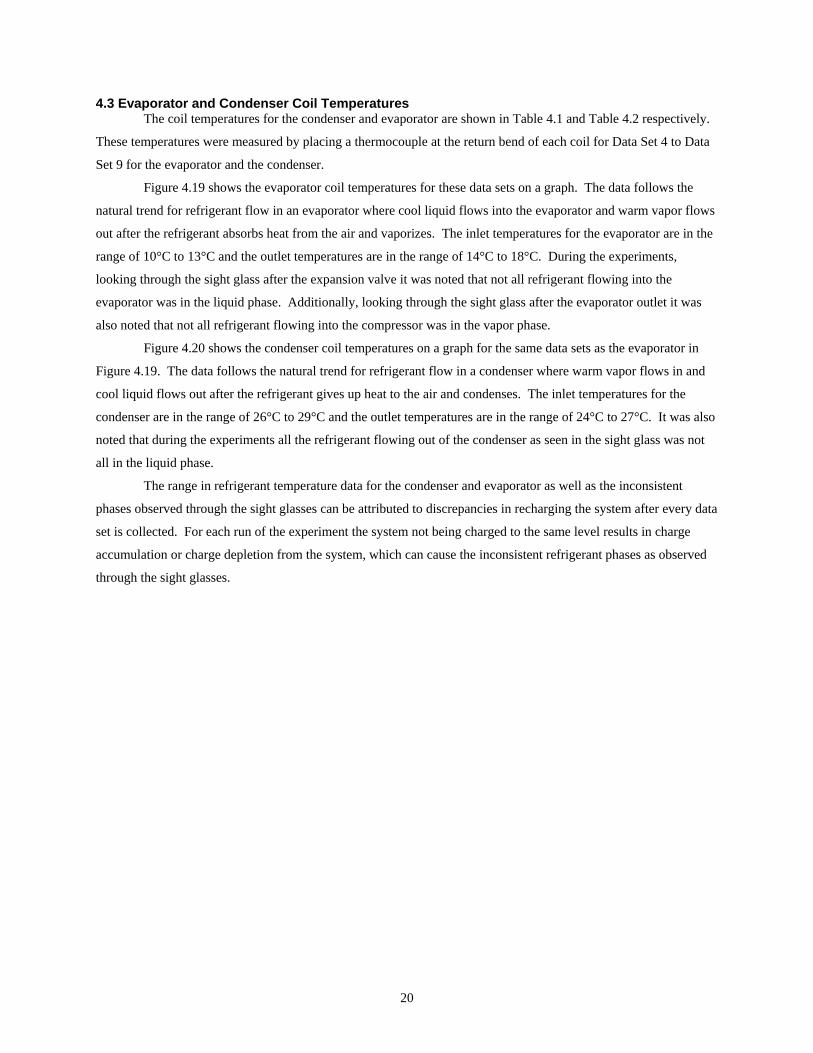
4.3 Evaporator and Condenser Coil Temperatures The coil temperatures for the condenser and evaporator are shown in Table 4.1 and Table 4.2 respectively.
These temperatures were measured by placing a thermocouple at the return bend of each coil for Data Set 4 to Data
Set 9 for the evaporator and the condenser.
Figure 4.19 shows the evaporator coil temperatures for these data sets on a graph. The data follows the
natural trend for refrigerant flow in an evaporator where cool liquid flows into the evaporator and warm vapor flows
out after the refrigerant absorbs heat from the air and vaporizes. The inlet temperatures for the evaporator are in the
range of 10°C to 13°C and the outlet temperatures are in the range of 14°C to 18°C. During the experiments,
looking through the sight glass after the expansion valve it was noted that not all refrigerant flowing into the
evaporator was in the liquid phase. Additionally, looking through the sight glass after the evaporator outlet it was
also noted that not all refrigerant flowing into the compressor was in the vapor phase.
Figure 4.20 shows the condenser coil temperatures on a graph for the same data sets as the evaporator in
Figure 4.19. The data follows the natural trend for refrigerant flow in a condenser where warm vapor flows in and
cool liquid flows out after the refrigerant gives up heat to the air and condenses. The inlet temperatures for the
condenser are in the range of 26°C to 29°C and the outlet temperatures are in the range of 24°C to 27°C. It was also
noted that during the experiments all the refrigerant flowing out of the condenser as seen in the sight glass was not
all in the liquid phase.
The range in refrigerant temperature data for the condenser and evaporator as well as the inconsistent
phases observed through the sight glasses can be attributed to discrepancies in recharging the system after every data
set is collected. For each run of the experiment the system not being charged to the same level results in charge
accumulation or charge depletion from the system, which can cause the inconsistent refrigerant phases as observed
through the sight glasses.

21
Evap Coil No. vs Temp
10
11
12
13
14
15
16
17
18
1 2 3 4 5 6 7 8 9 10
Evaporator Coil Number
Tem
pera
ture
(deg
C)
4th set of data 5th set of data 6th set of data 7th set of data 8th set of data 9th set of data
Figure 4.19 Evaporator Coil Temperatures for Data Set 4 to Data Set 9
Cond Coil No. vs Temp
23
24
25
26
27
28
29
30
1 3 5 7 9 11 13 15
Condenser Coil Number
Tem
pera
ture
(deg
C)
4th set of data 5th set of data 6th set of data 7th set of data 8th set of data 9th set of data
Figure 4.20 Condenser Coil Temperatures for Data Set 4 to Data Set 9

22
4.4 Predicted and Experimental Refrigerant Mass in the Evaporator and Condenser Table 4.3 shows a comparison of the experimental refrigerant mass in the evaporator and the condenser for
all the data sets versus the predicted refrigerant mass for both the components calculated using the ACRC model.
For Data set 3, some of the weight data for the liquid line, compressor suction and compressor discharge needed for
void fraction calculations were not collected. The predicted refrigerant mass for data set 3 is unavailable due to this
fact as it could not be calculated.
Table 4.4 shows the vapor and liquid refrigerant mass in each section of the evaporator for the different
quality sections that the evaporator is broken up into, using the inlet and exit qualities for Data set 1. Using these
qualities and the ACRC void fraction model in Engineering Equation Solver (EES) the respective void fractions are
calculated which in turn give the respective vapor and liquid refrigerant masses. The predicted refrigerant masses
for all the remaining sets of data for the evaporator and condenser are calculated in a similar fashion.
4.5 Predicted and Experimental Oil Mass in the Evaporator and Condenser Table 4.5 shows a comparison of the experimental oil mass in the evaporator and the condenser for all the
data sets versus the predicted oil mass for both the components calculated using the Liquid Volume Fraction Model
proposed by Crompton [1]. The quantities for Data Set 3 were not calculated due to the same reasons mentioned
above.
Table 4.6 shows the mass of oil in each section of the evaporator for Data Set 2, for the different qualities
and void fractions of each section that were calculated as previously described. Using these quality and void
fraction numbers and the oil hold up in the liquid line in combination with the Liquid Volume Fraction Model gives
the oil hold up in each of these sections. The predicted oil hold up numbers for the remaining sets of data for the
evaporator and the condenser are calculated in a similar fashion.
As seen from Table 4.3 there seems to be a gradual accumulation of refrigerant charge after the 1st set of
data in the condenser for the experimental values. The same trend is seen in Table 4.5 for the oil mass in the
condenser. This accumulation may be attributed to the 90 degree rise and bend in tubing at the condenser outlet as
seen in Figure 2.2.
4.6 Conclusion This study experimented with a method of measuring the amount of oil and refrigerant trapped in a
component, namely the evaporator and condenser, to compare with a previously proposed oil prediction model. In
addition to this the experiment proposed a method of measuring the amount of oil and refrigerant in an actual air
conditioning system, namely a window air conditioner. Overall the predicted refrigerant mass quantities are
approximately within 20% of the experimental quantities of refrigerant collected. Whereas the predicted oil mass
quantities differ greatly from the experimental quantities of oil collected for both the evaporator and the condenser.
As mentioned before, one of the main reasons this can be attributed to are the changes in the tube circuiting. All
data points to the fact that the 90 degree rise and bend in the pipe leaving the condenser resulted in refrigerant and
oil getting held up in the condenser and the quantity building up over time as more experiments were performed.
Another factor contributing to this could be the use of different diameter pipes in different sections of the system.

23
The pipes connecting the condenser and evaporator are all 6.35mm (¼”) pipes, whereas the pipe going from the
evaporator to the compressor is a 9.53mm (3/8”) pipe.
In conclusion, a few things during the setup process for this experiment need to be changed so that it can be
successfully applied on a different system such as an air conditioner for a house or a grocery store for a future
project. The fabrication process should be refined to use same diameter tubing everywhere and also to make sure
that no hard bends are produced that would result in the abrupt refrigerant velocity change or holdup. All joints
need to provide a smooth transition.
Table 4.1 Condenser Coil Temperatures.
Coil Temperature (°C)
Condenser Coil No. Set 4 Set 5 Set 6 Set 7 Set 8 Set 9
1 28.9 26.6 28.4 28.4 28.8 27.0 2 28.8 26.2 27.9 27.0 28.9 27.2 3 28.7 27.6 27.1 24.7 28.2 26.8 4 28.8 28.4 28.2 25.0 27.7 27.0 5 28.1 27.8 28.1 24.1 27.8 27.3 6 27.8 27.1 27.9 24.2 28.2 27.7 7 28.3 27.0 27.9 25.1 27.8 27.4 8 28.4 26.9 28.2 24.8 27.2 27.3 9 28.1 26.7 27.1 24.1 27.7 27.0
10 28.0 26.7 26.3 24.0 27.4 27.4 11 27.9 27.0 26.5 24.0 27.2 26.9 12 28.0 26.9 26.1 23.5 26.8 26.9 13 27.3 27.1 25.0 24.3 26.5 27.1 14 26.9 26.8 25.1 24.3 26.0 26.5 15 26.7 26.4 24.2 24.8 25.6 25.2
Table 4.2 Evaporator Coil Temperatures.
Coil Temperature (°C)
Evaporator Coil No. Set 4 Set 5 Set 6 Set 7 Set 8 Set 9
1 13.9 14.5 17.5 17.4 17.4 13.9 2 13.4 14.1 15.9 14.5 16.5 13.8 3 13.6 13.1 15.1 14.3 13.6 13.7 4 13.5 12.2 14.5 13.9 13.6 13.3 5 13.4 14.1 13.8 13.8 12.9 13.2 6 12.8 14.2 13.3 12.6 12.8 13.2 7 12.9 12.5 12.9 12.9 12.6 12.4 8 12.8 12.8 12.6 11.8 12.1 12.2 9 12.8 11.8 12.8 11.5 11.4 11.7 10 12.6 12.0 10.4 11.3 10.4 10.8

24
Table 4.3 Predicted and Experimental Refrigerant Mass in Evaporator and Condenser.
Evaporator Condenser
Exp. Ref Mass (g)
Predicted Ref Mass (g)
Exp. Ref Mass (g)
Predicted Ref Mass (g)
Data Set 1 68.24 42.06 80.46 72.43 Data Set 2 41.45 36.48 97.61 79.44 Data Set 3 55.11 157.27 Data Set 4 43.68 52.94 125.03 150.41 Data Set 5 47.74 65.89 164.38 147.23 Data Set 6 73.97 91.23 269.75 199.79 Data Set 7 55.02 65.88 238.18 197.51 Data Set 8 57.38 77.5 228.94 193.14 Data Set 9 72.21 85.36 214.21 206.39
Table 4.4 Predicted Refrigerant Vapor and Liquid Mass in each section of the Evaporator for Set 1.
Evaporator Set 1 Computed Refrigerant Liquid and Vapor Masses
X alpha Ref Vapor Mass (g) Ref Liquid Mass (g) 0.1735 0.7813 0.92 6.60 0.2297 0.8258 0.98 5.25 0.2859 0.8581 1.01 4.28 0.3421 0.8827 1.04 3.54 0.3983 0.9021 1.07 2.95 0.4544 0.9181 1.08 2.47 0.5106 0.9314 1.10 2.07 0.5668 0.9427 1.11 1.73 0.623 0.9526 1.13 1.43
0.6792 0.9612 1.14 1.17 Total 10.58 31.48 Total Refrigerant Mass (g) 42.06
Table 4.5 Predicted and Experimental Oil Mass in Evaporator and Condenser.
Evaporator Condenser
Exp. Oil Mass (g)
Predicted Oil Mass using Liquid Volume
Fraction Model (g) Exp. Oil Mass (g)
Predicted Oil Mass using Liquid Volume
Fraction Model (g) Data Set 1 32.14 0.19 1.35 0.21 Data Set 2 10.92 8.51 24.60 9.98 Data Set 3 23.54 38.93 Data Set 4 17.40 7.19 30.62 11.34 Data Set 5 55.18 6.35 36.51 8.34 Data Set 6 18.08 10.36 45.32 13.45 Data Set 7 21.04 3.49 27.37 5.88 Data Set 8 7.14 4.09 20.60 5.93 Data Set 9 24.13 6.37 17.46 9.03

25
Table 4.6 Predicted Oil Mass in each section of Evaporator for Data Set 2 using Liquid Volume Fraction Model.
X Alpha Liquid Volume Fraction Model Oil
0.2014 0.7903 1.35 0.2757 0.8415 1.13 0.3501 0.8768 0.98 0.4244 0.9029 0.87 0.4987 0.9231 0.79 0.5731 0.9394 0.73 0.6474 0.9528 0.69 0.7217 0.9643 0.66 0.7961 0.9743 0.65 0.8704 0.9833 0.66
Total Predicted Oil Mass in Evaporator (g) 8.51
26
Bibliography
[1] Crompton, J.A., T.A. Newell, and J.C. Chato, “Experimental Measurement and Modeling of Oil Holdup”, ACRC TR-226 (also MS thesis by J.A. Crompton), Air Conditioning and Refrigeration Center, University of Illinois at Urbana-Champaign IL, 2004.
[2] Dobson, M.K., J.C. Chato, J.P. Wattelet, J.A. Gaibel, M. Ponchner, P.J. Kenney, R.L. Shimon, T.C. Villaneuva, N.L. Rhines, K.A. Sweeney, D.G. Allen, and T.T. Hershberger, “Heat Transfer and Flow Regimes During Condensation in Horizontal Tubes”, ACRC TR-57 (also PhD dissertation by M.K. Dobson), Air Conditioning and Refrigeration Center, University of Illinois at Urbana-Champaign IL, 1994.
[3] Graham, D.M., H.R. Kopke, M.J. Wilson, D.A. Yashar, J.C. Chato, and T.A. Newell, “An Investigation of Void Fraction in the Annular/Stratified Flow Regions in Smooth, Horizontal Tubes”, ACRC TR-144, Air Conditioning and Refrigeration Center, University of Illinois at Urbana-Champaign IL, 1998(b).
[4] Hurlburt, E.T., and T.A. Newell, “Modeling of the Evaporation and Condensation of Zeotropic Refrigerant Mixture in Horizontal Tubes,” ACRC TR-142 (also MS thesis by H.R. Kopke), Air Conditioning and Refrigeration Center, University of Illinois at Urbana-Champaign IL, 1997.
[5] Kopke, H.R., T.A. Newell, and J.C. Chato, “Experimental Investigation of Void Fraction during Refrigerant Mixtures in Horizontal Tubes”, ACRC TR-142 (also MS thesis by H.R. Kopke), Air Conditioning and Refrigeration Center, University of Illinois at Urbana-Champaign IL, 1998.
[6] Lockhart, R.W. and R.C. Martinelli, “Proposed Correlation of Data for Isothermal two-phase, two-component flow in pipes,” Chemical Engineering Progress, Vol. 45, no. 1, pp. 39-48, 1949.
[7] Piggott III, W.T., T.A. Newell, and J.C. Chato, “Investigation of an R134a Refrigerant/Iso 32 Polyol Ester Oil Mixture in Condensation”, ACRC TR-192 (also MS thesis by W.T. Piggott), Air Conditioning and Refrigeration Center, University of Illinois at Urbana-Champaign IL, 2001.
[8] Wallis, G.B., One Dimensional Two-Phase Flow, McGraw Hill, New York, pp. 51-54, 1969.
[9] Wilson, M.J., T.A. Newell, and J.C. Chato, “A Study of Two-Phase Refrigerant Behavior in Flattened Tubes”, ACRC CR-35 (also PhD dissertation by M.J. Wilson), Air Conditioning and Refrigeration Center, University of Illinois at Urbana-Champaign IL, 2001.