Embed Size (px)
Citation preview
REFRIGERATED BEVERAGE VENDING MACHINE OUTDOOR LOCATION AND ELEVATED (90°F) OUTDOOR TEMPERATURE ANALYSIS
Max Wei and Jeffery B. Greenblatt
Lawrence Berkeley National Laboratory Environmental Energy Technologies Division Energy Analysis and Environmental Impacts Department Berkeley, CA 94720
June 2014
The work described in this report was funded by the U.S. Department of Energy’s Office of Energy Efficiency and Renewable Energy, Building Technologies Program under Contract No. DE-AC02- 05CH11231.
LBNL # 6744E
2
Disclaimer
This document was prepared as an account of work sponsored by the United States
Government. While this document is believed to contain correct information, neither the
United States Government nor any agency thereof, nor The Regents of the University of
California, nor any of their employees, makes any warranty, express or implied, or assumes
any legal responsibility for the accuracy, completeness, or usefulness of any information,
apparatus, product, or process disclosed, or represents that its use would not infringe privately
owned rights. Reference herein to any specific commercial product, process, or service by its
trade name, trademark, manufacturer, or otherwise, does not necessarily constitute or imply its
endorsement, recommendation, or favoring by the United States Government or any agency
thereof, or The Regents of the University of California. The views and opinions of authors
expressed herein do not necessarily state or reflect those of the United States Government or
any agency thereof, or The Regents of the University of California.
Copyright Notice
This manuscript has been authored by an author at Lawrence Berkeley National Laboratory
under Contract No. DE-AC02-05CH11231with the U.S. Department of Energy. The U.S.
Government retains, and the publisher, by accepting the article for publication, acknowledges,
that the U.S. Government retains a non-exclusive, paid-up, irrevocable, world-wide license to
publish or reproduce the published form of this manuscript, or allow others to do so, for U.S.
Government purposes.
3
COMMERCIAL REFRIGERATED BEVERAGE VENDING MACHINE OUTDOOR
LOCATION AND ELEVATED (90°F) OUTDOOR TEMPERATURE ANALYSIS
Max Wei and Jeffery B. Greenblatt
July 8, 14
Summary
The purpose of this LBNL report is to document two findings: (1) the estimated fraction of beverage
vending machines that are outdoors; and (2) the number of 90⁰F or hotter days that the overall population
of BVM experiences in the course of an average year in the U.S. Based on a sampling of over 1000
BVMs located on college campuses around the country, we estimate that outdoor BVMs constitute 16%
or less of the overall BVM population. We also find that the number of days hotter than 90⁰F for the
overall population of BVM is very small (1.3%). The analysis is based on three years of annual cooling
degree data (CDD) for 56 cities across the country.
Beverage Vending Machine Sampling from U.S. Campuses
The first question to be addressed is the number of BVM that are installed outdoors.
BVM are commonly found in factories, colleges, schools, hotels, and hospitals. Intuitively, we might
expect that the bulk of BVMs are found indoors for a multitude of reasons: less risk of vandalism and
theft, less maintenance requirements due to a more controlled environment, longer machine lifetimes, and
ease of customer access.
Given the funding constraints of this work and the desire to obtain a preliminary result without a large
survey or extensive market research, a web search was conducted for BVM locations. BVM locations
and types of vending machines were found for six colleges and universities around the country. This
data was freely available on the web as many colleges and universities offer information on facilities and/
or auxiliary dining services for their students and staff. It was also felt that campuses and large campuses
in particular are fairly representative of the general BVM population since they have a mix of building
types that mirror up some of the major markets for BVM above. Campuses typically have many office
buildings, laboratory buildings that could be a proxy for small factories or industrial sites, parking
facilities, residence buildings that mimic commercial lodging facilities, sports facilities, and medical
facilities. On the other hand, colleges and universities might have a larger prevalence of outdoor BVM
since they are generally in environments where people are circulating around and where overall security
may be higher than in an average setting.
Results for this sampling of campus BVM are summarized in Table 1 and raw data is provided in the
Appendix. Out of a total sample of 1106 vending machines, about two-thirds are found to be beverage
vending machines. Of these, on average 15.5% are located outdoors. This data set samples from a range
of states in the East, Midwest and Western U.S. and draw from both urban and suburban locations. Urban
locations would be expected to have more indoor BVM. However, the bulk of data is from three large
universities in relatively warm weather locations (University of North Carolina-Charlotte, UCLA, and
University of Texas-Austin). This data set may thus skew the estimate of outdoor vending machines to a
4
higher percentage, so the true number may be slightly lower than 15%. (The three large campuses have
17.7% of their BVM located outdoors, so perhaps an upper limit for outdoor BVM is 20%). Nonetheless,
we take the average percentage of outdoor vending machines at 16% for the 90⁰F analysis below. We
take the total number of BVM in the U.S. at two million units based on data from the 2009 Final Rule
(Federal Register, Vol. 74, No. 167, pp. 44914-44968) extrapolated to 2014, and assume that 16% or
320,000 of these units are outdoors (Table 2).
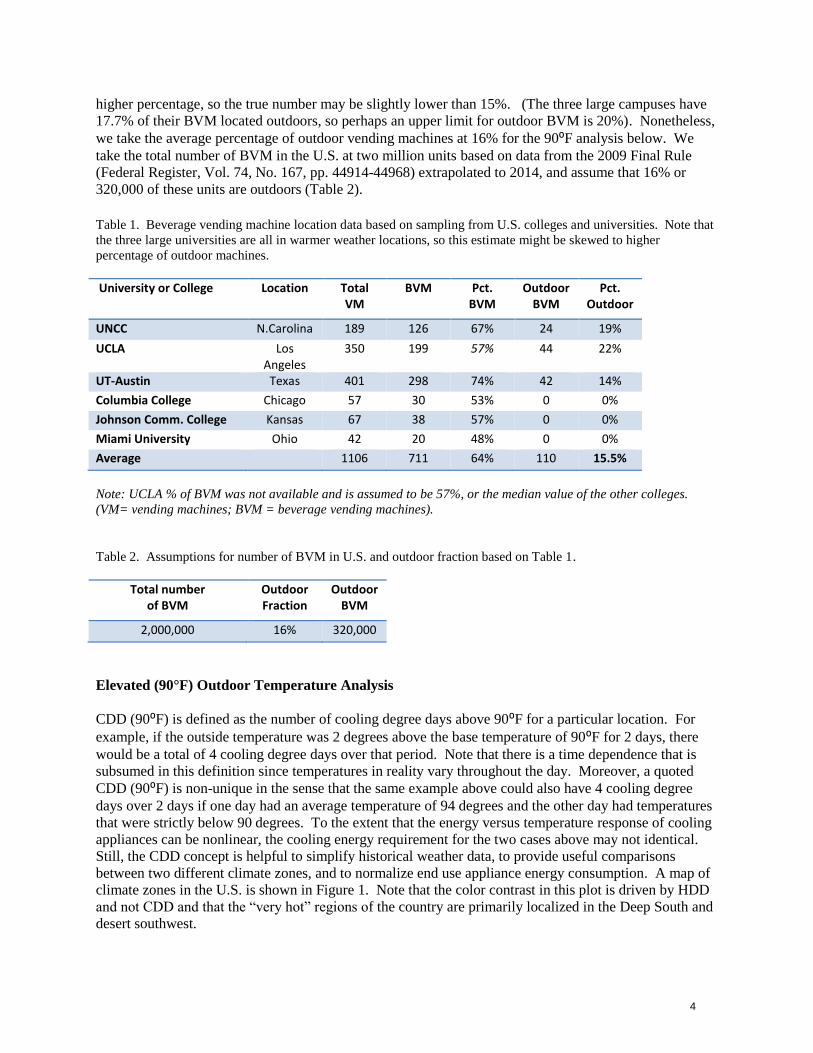
Table 1. Beverage vending machine location data based on sampling from U.S. colleges and universities. Note that
the three large universities are all in warmer weather locations, so this estimate might be skewed to higher
percentage of outdoor machines.
University or College Location Total VM
BVM Pct. BVM
Outdoor BVM
Pct. Outdoor
UNCC N.Carolina 189 126 67% 24 19%
UCLA Los Angeles
350 199 57% 44 22%
UT-Austin Texas 401 298 74% 42 14%
Columbia College Chicago 57 30 53% 0 0%
Johnson Comm. College Kansas 67 38 57% 0 0%
Miami University Ohio 42 20 48% 0 0%
Average 1106 711 64% 110 15.5%
Note: UCLA % of BVM was not available and is assumed to be 57%, or the median value of the other colleges.
(VM= vending machines; BVM = beverage vending machines).
Table 2. Assumptions for number of BVM in U.S. and outdoor fraction based on Table 1.
Total number of BVM
Outdoor Fraction
Outdoor BVM
2,000,000 16% 320,000
Elevated (90°F) Outdoor Temperature Analysis
CDD (90⁰F) is defined as the number of cooling degree days above 90⁰F for a particular location. For
example, if the outside temperature was 2 degrees above the base temperature of 90⁰F for 2 days, there
would be a total of 4 cooling degree days over that period. Note that there is a time dependence that is
subsumed in this definition since temperatures in reality vary throughout the day. Moreover, a quoted
CDD (90⁰F) is non-unique in the sense that the same example above could also have 4 cooling degree
days over 2 days if one day had an average temperature of 94 degrees and the other day had temperatures
that were strictly below 90 degrees. To the extent that the energy versus temperature response of cooling
appliances can be nonlinear, the cooling energy requirement for the two cases above may not identical.
Still, the CDD concept is helpful to simplify historical weather data, to provide useful comparisons
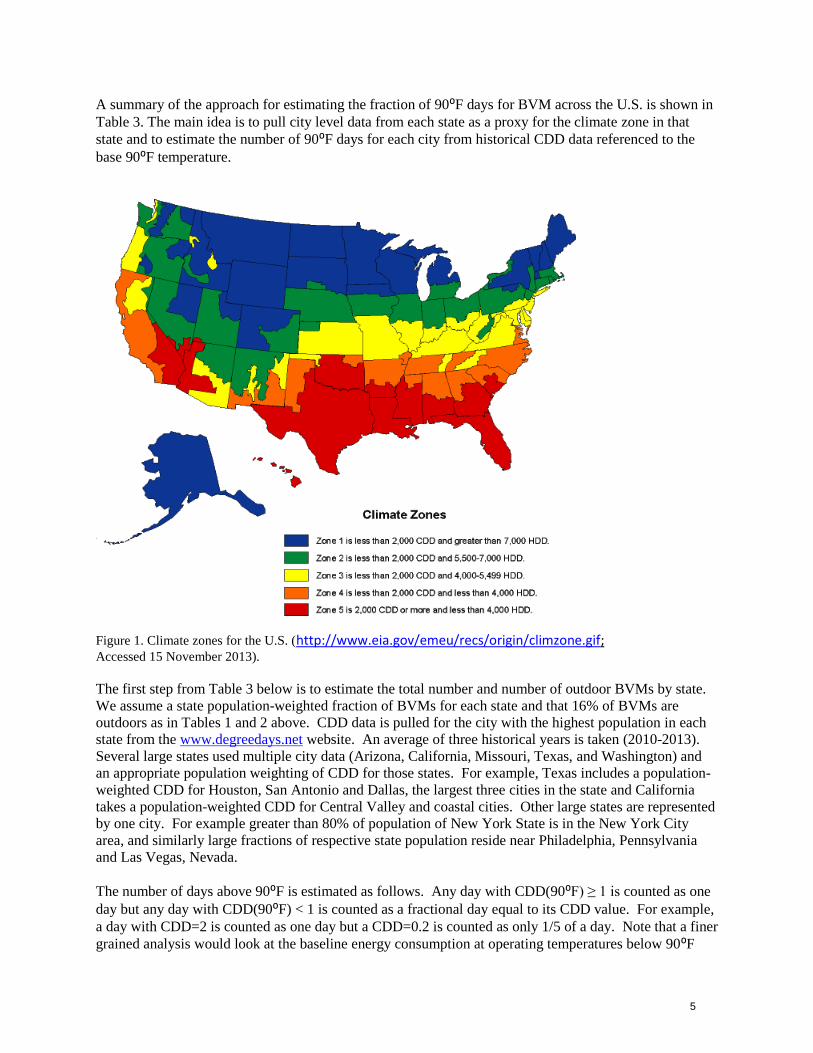
between two different climate zones, and to normalize end use appliance energy consumption. A map of
climate zones in the U.S. is shown in Figure 1. Note that the color contrast in this plot is driven by HDD
and not CDD and that the “very hot” regions of the country are primarily localized in the Deep South and
desert southwest.
5
A summary of the approach for estimating the fraction of 90⁰F days for BVM across the U.S. is shown in
Table 3. The main idea is to pull city level data from each state as a proxy for the climate zone in that
state and to estimate the number of 90⁰F days for each city from historical CDD data referenced to the
base 90⁰F temperature.
Figure 1. Climate zones for the U.S. (http://www.eia.gov/emeu/recs/origin/climzone.gif; Accessed 15 November 2013).
The first step from Table 3 below is to estimate the total number and number of outdoor BVMs by state.
We assume a state population-weighted fraction of BVMs for each state and that 16% of BVMs are
outdoors as in Tables 1 and 2 above. CDD data is pulled for the city with the highest population in each
state from the www.degreedays.net website. An average of three historical years is taken (2010-2013).
Several large states used multiple city data (Arizona, California, Missouri, Texas, and Washington) and
an appropriate population weighting of CDD for those states. For example, Texas includes a population-
weighted CDD for Houston, San Antonio and Dallas, the largest three cities in the state and California
takes a population-weighted CDD for Central Valley and coastal cities. Other large states are represented
by one city. For example greater than 80% of population of New York State is in the New York City
area, and similarly large fractions of respective state population reside near Philadelphia, Pennsylvania
and Las Vegas, Nevada.
The number of days above 90⁰F is estimated as follows. Any day with CDD(90⁰F) ≥ 1 is counted as one
day but any day with CDD(90⁰F) < 1 is counted as a fractional day equal to its CDD value. For example,
a day with CDD=2 is counted as one day but a CDD=0.2 is counted as only 1/5 of a day. Note that a finer
grained analysis would look at the baseline energy consumption at operating temperatures below 90⁰F
6
and keep a tally and running sum of the increase in energy pegged to each increasing increment in CDD
value. This would essentially calculate how much increase in BVM energy is due to hot summer days.
As one indicator of how many “really hot days” there are in the course of a typical year, the average CDD
value for 45/50 states is less than or equal to 1.3. This means that for approximately half of the “hot”
days in these states, the average daily temperature is within a degree or two of 90⁰F. The five states with
higher average CDD values are Arizona, Kansas, Oklahoma, Nevada, and Texas, which together
constitute about 13.3% of the U.S. population. We thus did not find an overwhelming reason to justify
doing this more fine-grained detailed analysis, although it would be a relatively straightforward extension
of this work.
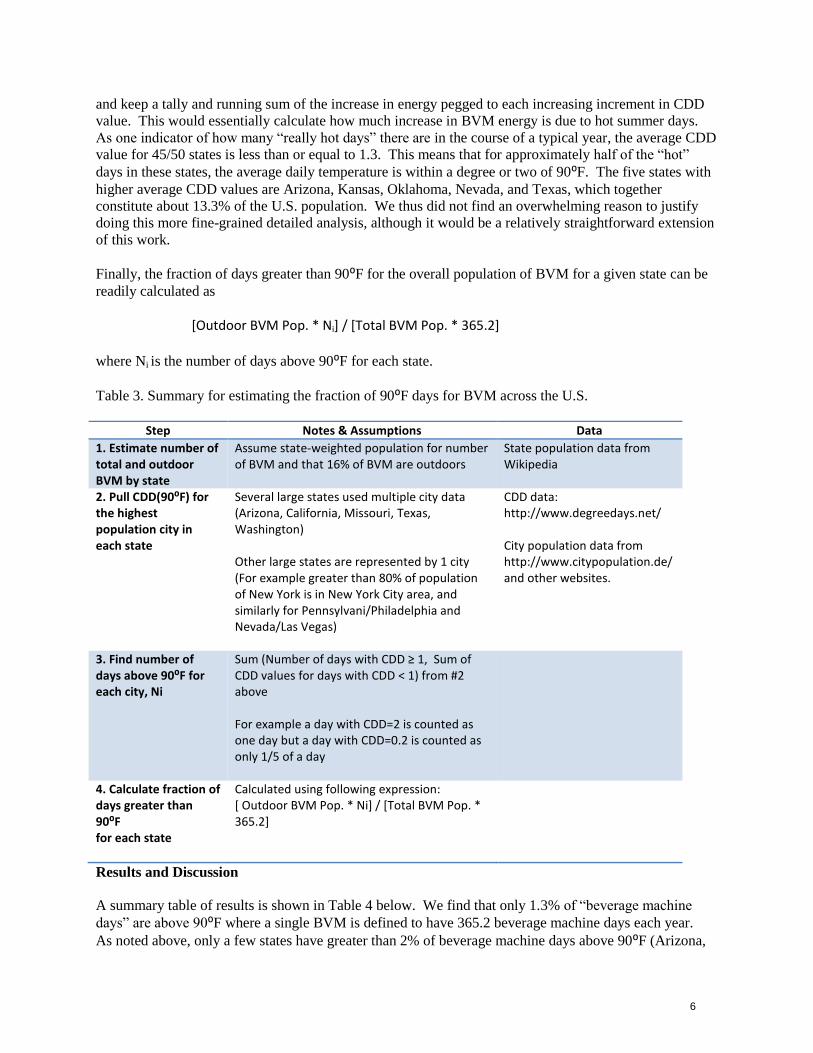
Finally, the fraction of days greater than 90⁰F for the overall population of BVM for a given state can be
readily calculated as
[Outdoor BVM Pop. * Ni] / [Total BVM Pop. * 365.2] where Ni is the number of days above 90⁰F for each state.
Table 3. Summary for estimating the fraction of 90⁰F days for BVM across the U.S.
Step Notes & Assumptions Data
1. Estimate number of total and outdoor BVM by state
Assume state-weighted population for number of BVM and that 16% of BVM are outdoors
State population data from Wikipedia
2. Pull CDD(90⁰F) for the highest population city in each state
Several large states used multiple city data (Arizona, California, Missouri, Texas, Washington) Other large states are represented by 1 city (For example greater than 80% of population of New York is in New York City area, and similarly for Pennsylvani/Philadelphia and Nevada/Las Vegas)
CDD data: http://www.degreedays.net/ City population data from http://www.citypopulation.de/ and other websites.
3. Find number of days above 90⁰F for each city, Ni
Sum (Number of days with CDD ≥ 1, Sum of CDD values for days with CDD < 1) from #2 above For example a day with CDD=2 is counted as one day but a day with CDD=0.2 is counted as only 1/5 of a day
4. Calculate fraction of days greater than 90⁰F for each state
Calculated using following expression: [ Outdoor BVM Pop. * Ni] / [Total BVM Pop. * 365.2]
Results and Discussion
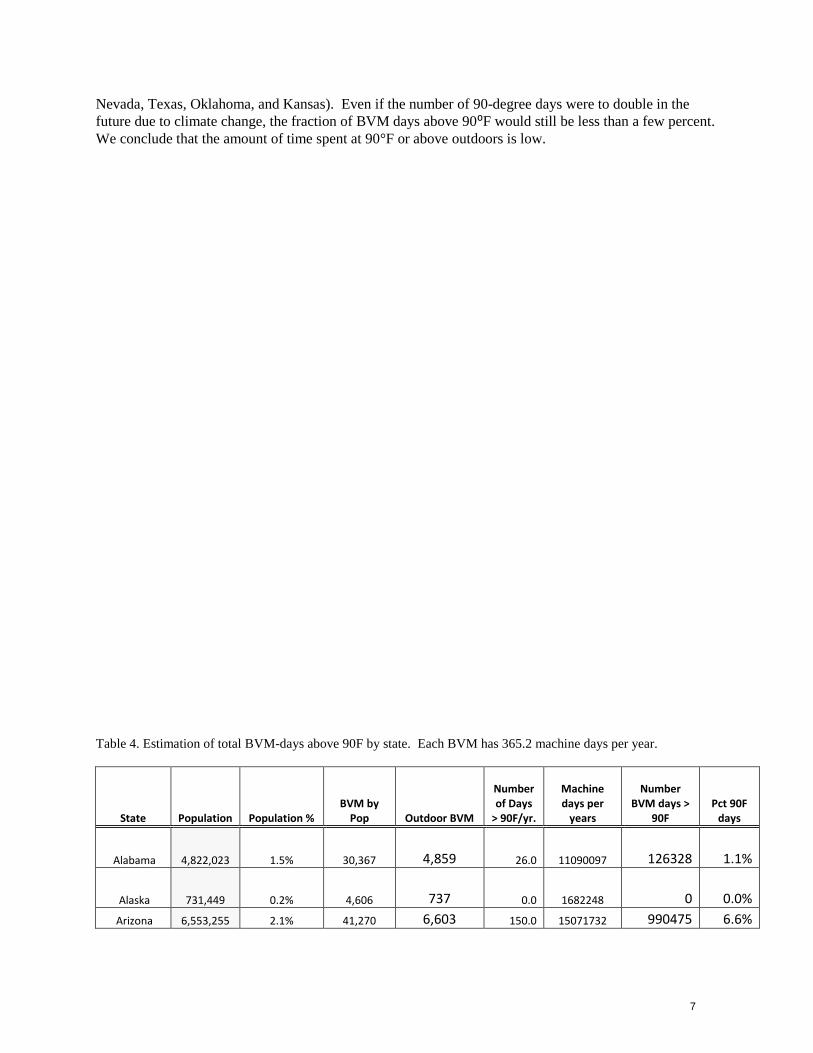
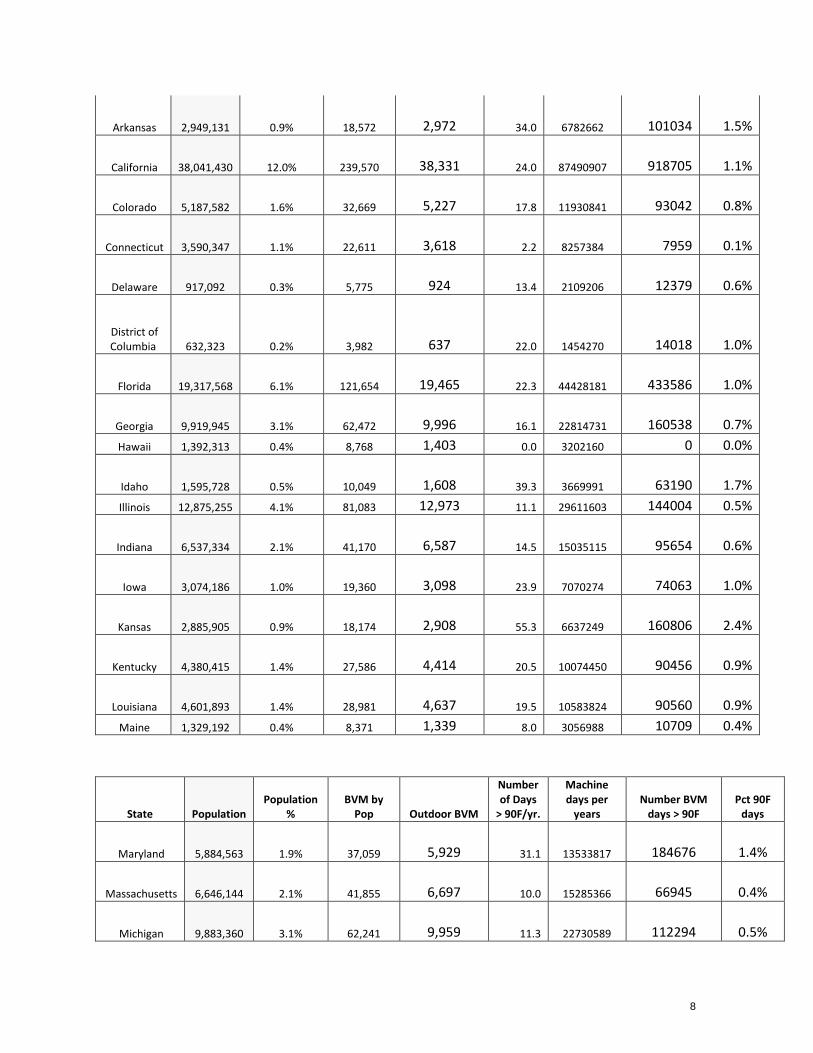
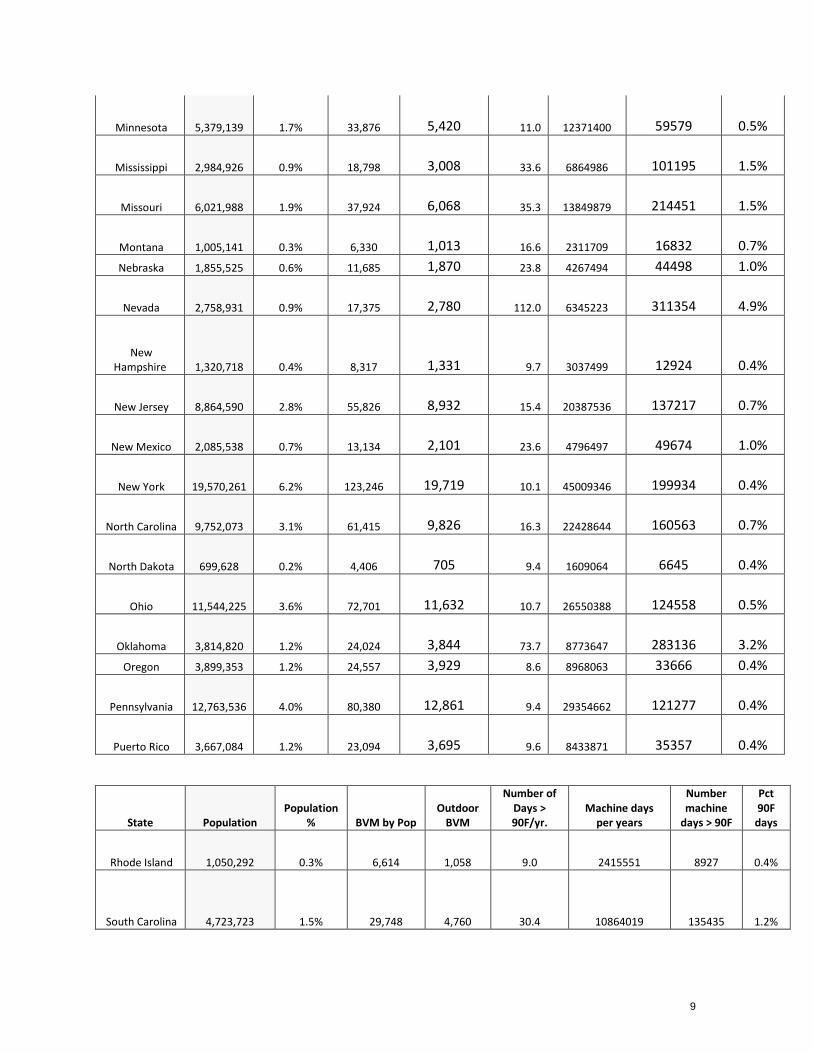
A summary table of results is shown in Table 4 below. We find that only 1.3% of “beverage machine
days” are above 90⁰F where a single BVM is defined to have 365.2 beverage machine days each year.
As noted above, only a few states have greater than 2% of beverage machine days above 90⁰F (Arizona,
7
Nevada, Texas, Oklahoma, and Kansas). Even if the number of 90-degree days were to double in the
future due to climate change, the fraction of BVM days above 90⁰F would still be less than a few percent.
We conclude that the amount of time spent at 90°F or above outdoors is low.
Table 4. Estimation of total BVM-days above 90F by state. Each BVM has 365.2 machine days per year.
State Population Population % BVM by
Pop Outdoor BVM
Number of Days
> 90F/yr.
Machine days per
years
Number BVM days >
90F Pct 90F
days
Alabama 4,822,023 1.5% 30,367 4,859 26.0 11090097 126328 1.1%
Alaska 731,449 0.2% 4,606 737 0.0 1682248 0 0.0%
Arizona 6,553,255 2.1% 41,270 6,603 150.0 15071732 990475 6.6%
8
Arkansas 2,949,131 0.9% 18,572 2,972 34.0 6782662 101034 1.5%
California 38,041,430 12.0% 239,570 38,331 24.0 87490907 918705 1.1%
Colorado 5,187,582 1.6% 32,669 5,227 17.8 11930841 93042 0.8%
Connecticut 3,590,347 1.1% 22,611 3,618 2.2 8257384 7959 0.1%
Delaware 917,092 0.3% 5,775 924 13.4 2109206 12379 0.6%
District of Columbia 632,323 0.2% 3,982 637 22.0 1454270 14018 1.0%
Florida 19,317,568 6.1% 121,654 19,465 22.3 44428181 433586 1.0%
Georgia 9,919,945 3.1% 62,472 9,996 16.1 22814731 160538 0.7%
Hawaii 1,392,313 0.4% 8,768 1,403 0.0 3202160 0 0.0%
Idaho 1,595,728 0.5% 10,049 1,608 39.3 3669991 63190 1.7%
Illinois 12,875,255 4.1% 81,083 12,973 11.1 29611603 144004 0.5%
Indiana 6,537,334 2.1% 41,170 6,587 14.5 15035115 95654 0.6%
Iowa 3,074,186 1.0% 19,360 3,098 23.9 7070274 74063 1.0%
Kansas 2,885,905 0.9% 18,174 2,908 55.3 6637249 160806 2.4%
Kentucky 4,380,415 1.4% 27,586 4,414 20.5 10074450 90456 0.9%
Louisiana 4,601,893 1.4% 28,981 4,637 19.5 10583824 90560 0.9%
Maine 1,329,192 0.4% 8,371 1,339 8.0 3056988 10709 0.4%
State Population Population
% BVM by
Pop Outdoor BVM
Number of Days
> 90F/yr.
Machine days per
years Number BVM
days > 90F Pct 90F
days
Maryland 5,884,563 1.9% 37,059 5,929 31.1 13533817 184676 1.4%
Massachusetts 6,646,144 2.1% 41,855 6,697 10.0 15285366 66945 0.4%
Michigan 9,883,360 3.1% 62,241 9,959 11.3 22730589 112294 0.5%
9
Minnesota 5,379,139 1.7% 33,876 5,420 11.0 12371400 59579 0.5%
Mississippi 2,984,926 0.9% 18,798 3,008 33.6 6864986 101195 1.5%
Missouri 6,021,988 1.9% 37,924 6,068 35.3 13849879 214451 1.5%
Montana 1,005,141 0.3% 6,330 1,013 16.6 2311709 16832 0.7%
Nebraska 1,855,525 0.6% 11,685 1,870 23.8 4267494 44498 1.0%
Nevada 2,758,931 0.9% 17,375 2,780 112.0 6345223 311354 4.9%
New Hampshire 1,320,718 0.4% 8,317 1,331 9.7 3037499 12924 0.4%
New Jersey 8,864,590 2.8% 55,826 8,932 15.4 20387536 137217 0.7%
New Mexico 2,085,538 0.7% 13,134 2,101 23.6 4796497 49674 1.0%
New York 19,570,261 6.2% 123,246 19,719 10.1 45009346 199934 0.4%
North Carolina 9,752,073 3.1% 61,415 9,826 16.3 22428644 160563 0.7%
North Dakota 699,628 0.2% 4,406 705 9.4 1609064 6645 0.4%
Ohio 11,544,225 3.6% 72,701 11,632 10.7 26550388 124558 0.5%
Oklahoma 3,814,820 1.2% 24,024 3,844 73.7 8773647 283136 3.2%
Oregon 3,899,353 1.2% 24,557 3,929 8.6 8968063 33666 0.4%
Pennsylvania 12,763,536 4.0% 80,380 12,861 9.4 29354662 121277 0.4%
Puerto Rico 3,667,084 1.2% 23,094 3,695 9.6 8433871 35357 0.4%
State Population Population
% BVM by Pop Outdoor
BVM
Number of Days > 90F/yr.
Machine days per years
Number machine
days > 90F
Pct 90F
days
Rhode Island 1,050,292 0.3% 6,614 1,058 9.0 2415551 8927 0.4%
South Carolina 4,723,723 1.5% 29,748 4,760 30.4 10864019 135435 1.2%
10
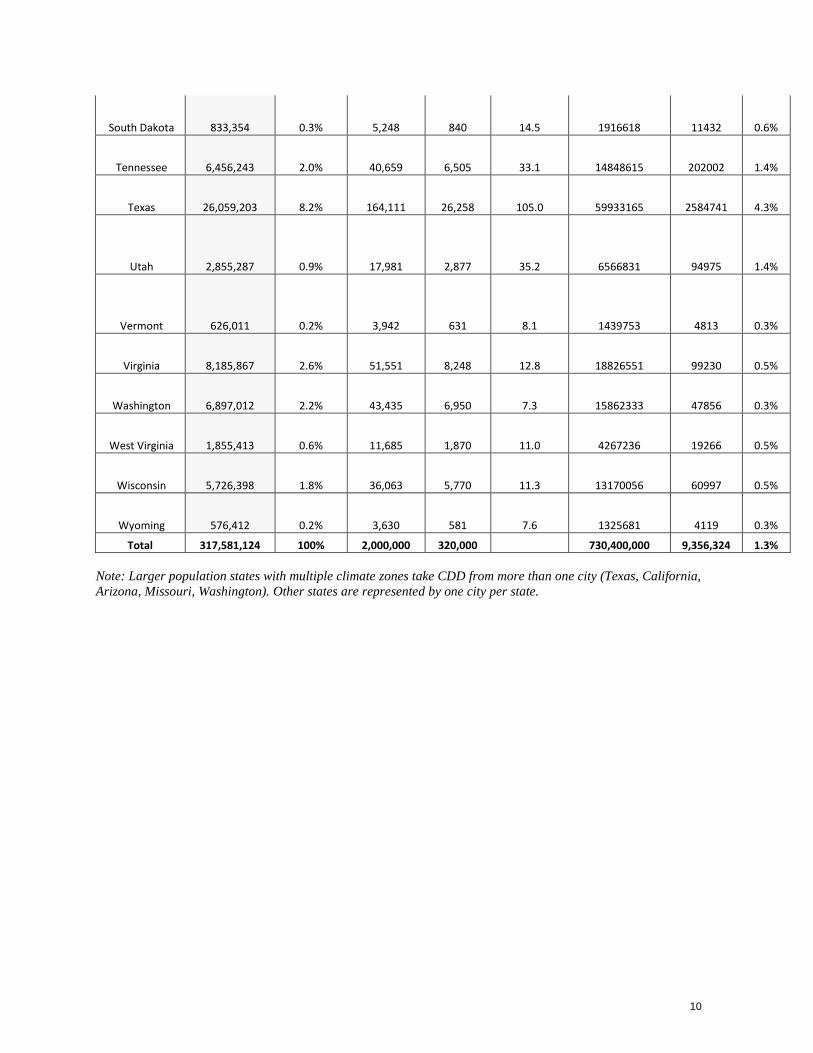
South Dakota 833,354 0.3% 5,248 840 14.5 1916618 11432 0.6%
Tennessee 6,456,243 2.0% 40,659 6,505 33.1 14848615 202002 1.4%
Texas 26,059,203 8.2% 164,111 26,258 105.0 59933165 2584741 4.3%
Utah 2,855,287 0.9% 17,981 2,877 35.2 6566831 94975 1.4%
Vermont 626,011 0.2% 3,942 631 8.1 1439753 4813 0.3%
Virginia 8,185,867 2.6% 51,551 8,248 12.8 18826551 99230 0.5%
Washington 6,897,012 2.2% 43,435 6,950 7.3 15862333 47856 0.3%
West Virginia 1,855,413 0.6% 11,685 1,870 11.0 4267236 19266 0.5%
Wisconsin 5,726,398 1.8% 36,063 5,770 11.3 13170056 60997 0.5%
Wyoming 576,412 0.2% 3,630 581 7.6 1325681 4119 0.3%
Total 317,581,124 100% 2,000,000 320,000
730,400,000 9,356,324 1.3%
Note: Larger population states with multiple climate zones take CDD from more than one city (Texas, California,
Arizona, Missouri, Washington). Other states are represented by one city per state.
11
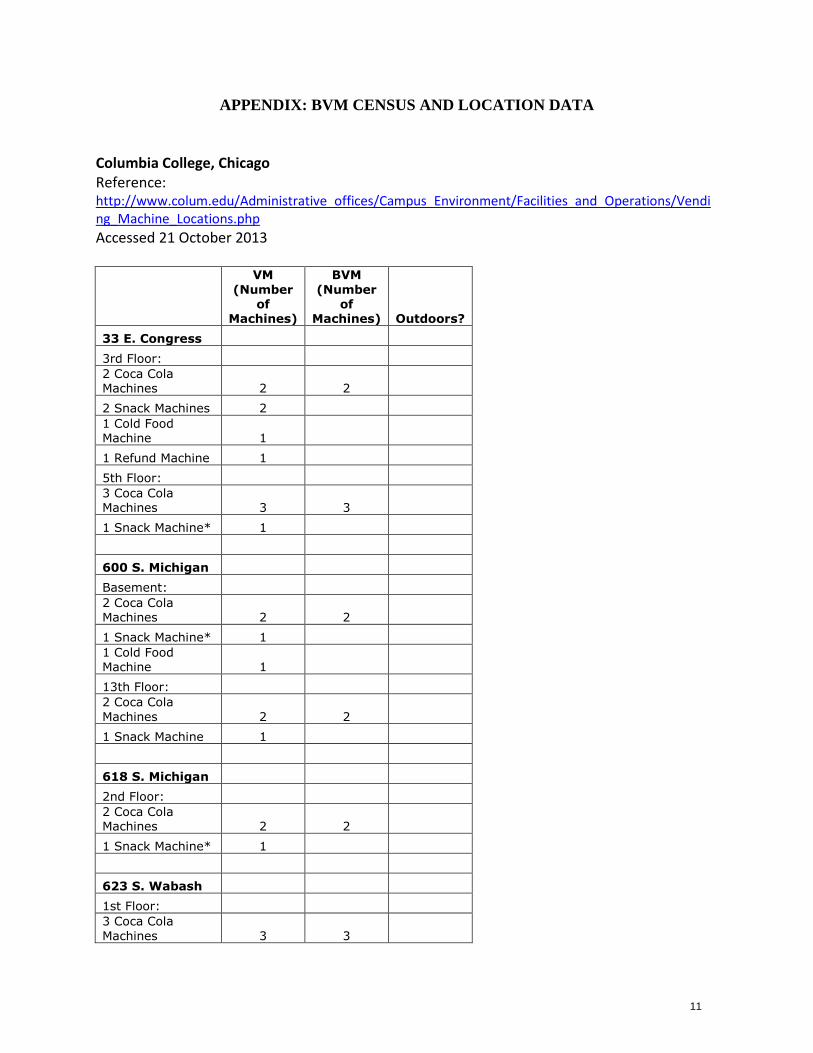
APPENDIX: BVM CENSUS AND LOCATION DATA
Columbia College, Chicago Reference: http://www.colum.edu/Administrative_offices/Campus_Environment/Facilities_and_Operations/Vending_Machine_Locations.php
Accessed 21 October 2013
VM
(Number of
Machines)
BVM
(Number of
Machines) Outdoors?
33 E. Congress
3rd Floor:
2 Coca Cola Machines 2 2
2 Snack Machines 2
1 Cold Food Machine 1
1 Refund Machine 1
5th Floor:
3 Coca Cola Machines 3 3
1 Snack Machine* 1
600 S. Michigan
Basement:
2 Coca Cola Machines 2 2
1 Snack Machine* 1
1 Cold Food Machine 1
13th Floor:
2 Coca Cola
Machines 2 2
1 Snack Machine 1
618 S. Michigan
2nd Floor:
2 Coca Cola Machines 2 2
1 Snack Machine* 1
623 S. Wabash
1st Floor:
3 Coca Cola
Machines 3 3
12
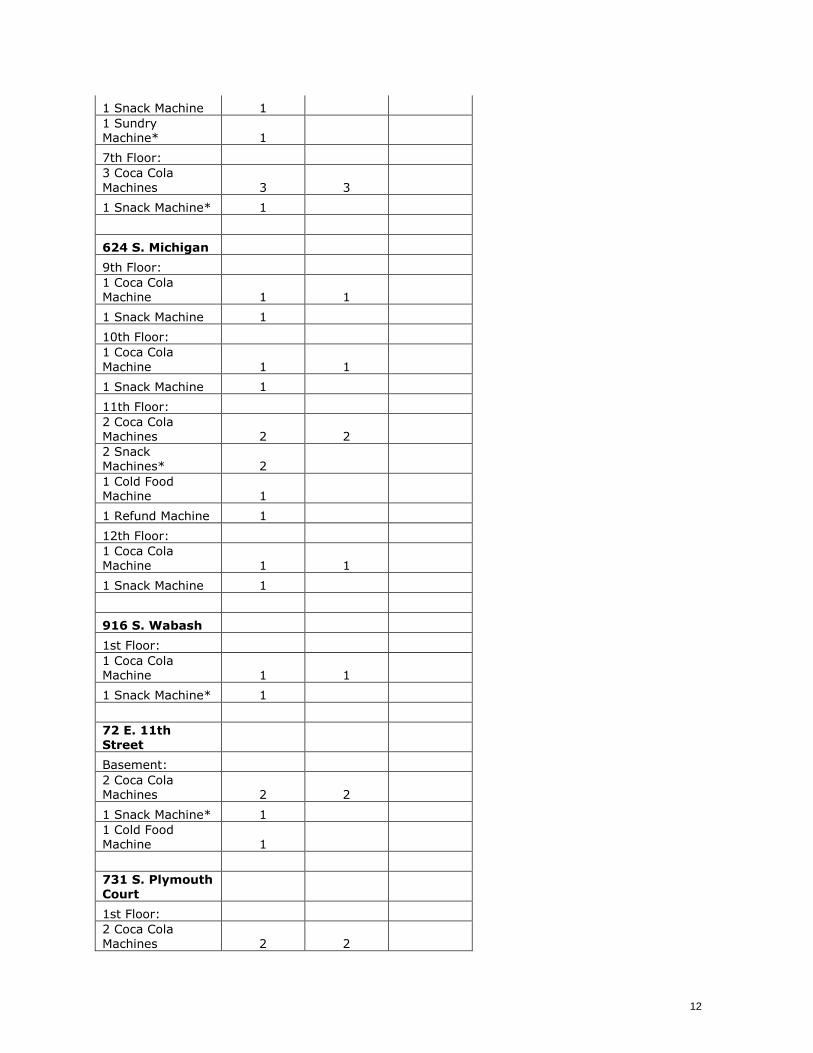
1 Snack Machine 1
1 Sundry Machine* 1
7th Floor:
3 Coca Cola
Machines 3 3
1 Snack Machine* 1
624 S. Michigan
9th Floor:
1 Coca Cola Machine 1 1
1 Snack Machine 1
10th Floor:
1 Coca Cola
Machine 1 1
1 Snack Machine 1
11th Floor:
2 Coca Cola Machines 2 2
2 Snack Machines* 2
1 Cold Food Machine 1
1 Refund Machine 1
12th Floor:
1 Coca Cola Machine 1 1
1 Snack Machine 1
916 S. Wabash
1st Floor:
1 Coca Cola Machine 1 1
1 Snack Machine* 1
72 E. 11th Street
Basement:
2 Coca Cola Machines 2 2
1 Snack Machine* 1
1 Cold Food Machine 1
731 S. Plymouth Court
1st Floor:
2 Coca Cola Machines 2 2
13
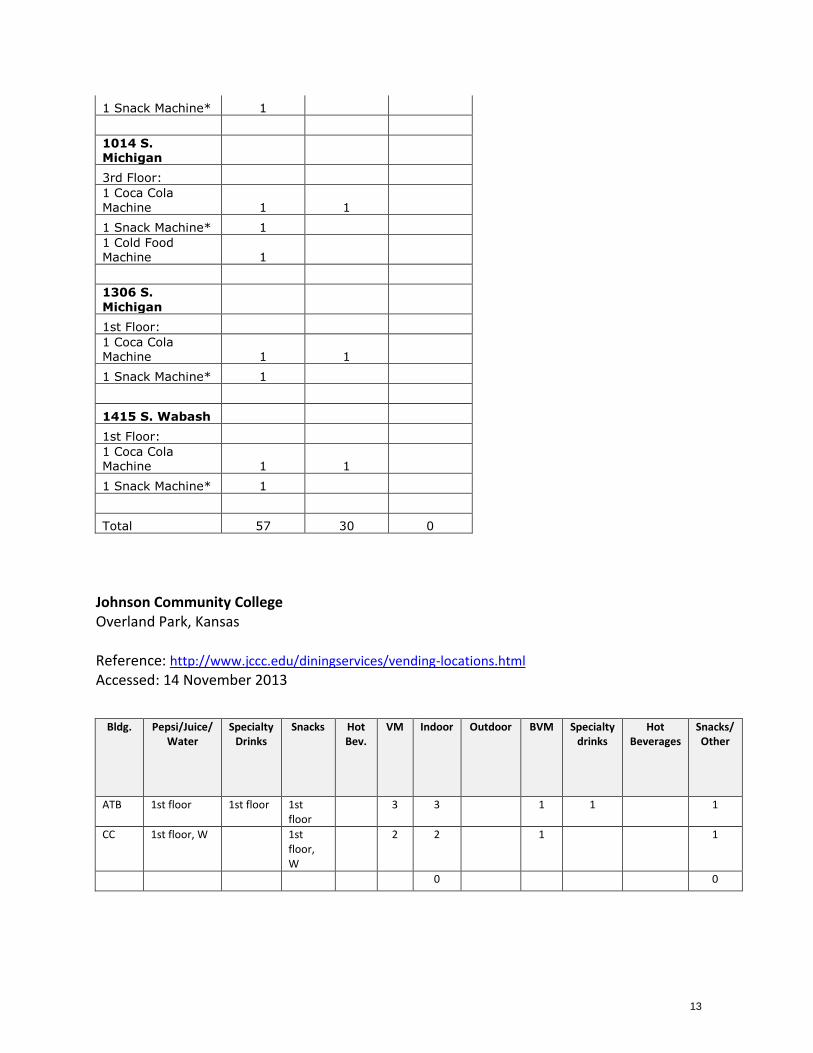
1 Snack Machine* 1
1014 S. Michigan
3rd Floor:
1 Coca Cola
Machine 1 1
1 Snack Machine* 1
1 Cold Food Machine 1
1306 S.
Michigan
1st Floor:
1 Coca Cola Machine 1 1
1 Snack Machine* 1
1415 S. Wabash
1st Floor:
1 Coca Cola Machine 1 1
1 Snack Machine* 1
Total 57 30 0
Johnson Community College Overland Park, Kansas Reference: http://www.jccc.edu/diningservices/vending-locations.html
Accessed: 14 November 2013
Bldg. Pepsi/Juice/ Water
Specialty Drinks
Snacks Hot Bev.
VM Indoor Outdoor BVM
Specialty drinks
Hot Beverages
Snacks/ Other
ATB 1st floor 1st floor 1st floor
3 3 1 1 1
CC 1st floor, W 1st floor, W
2 2 1 1
0 0
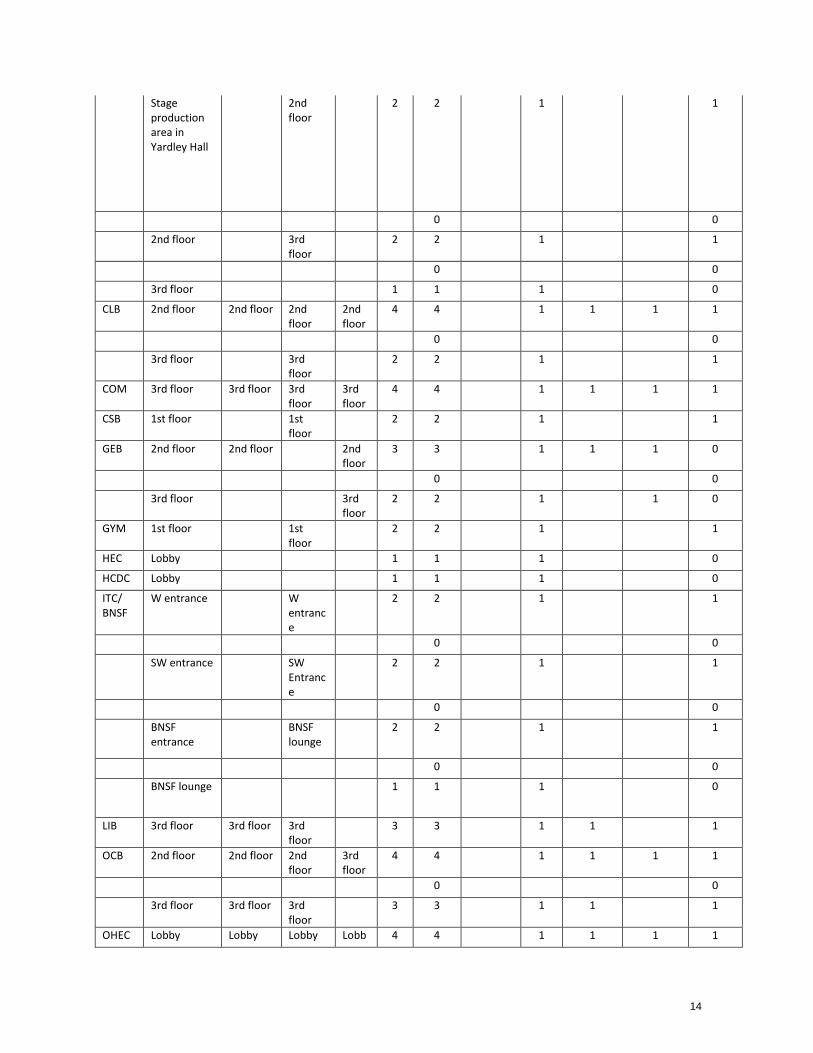
14
Stage production area in Yardley Hall
2nd floor
2 2 1 1
0 0
2nd floor 3rd floor
2 2 1 1
0 0
3rd floor 1 1 1 0
CLB 2nd floor 2nd floor 2nd floor
2nd floor
4 4 1 1 1 1
0 0
3rd floor 3rd floor
2 2 1 1
COM 3rd floor 3rd floor 3rd floor
3rd floor
4 4 1 1 1 1
CSB 1st floor 1st floor
2 2 1 1
GEB 2nd floor 2nd floor 2nd floor
3 3 1 1 1 0
0 0
3rd floor 3rd floor
2 2 1 1 0
GYM 1st floor 1st floor
2 2 1 1
HEC Lobby 1 1 1 0
HCDC Lobby 1 1 1 0
ITC/ BNSF
W entrance W entrance
2 2 1 1
0 0
SW entrance SW Entrance
2 2 1 1
0 0
BNSF entrance
BNSF lounge
2 2 1 1
0 0
BNSF lounge 1 1 1 0
LIB 3rd floor 3rd floor 3rd floor
3 3 1 1 1
OCB 2nd floor 2nd floor 2nd floor
3rd floor
4 4 1 1 1 1
0 0
3rd floor 3rd floor 3rd floor
3 3 1 1 1
OHEC Lobby Lobby Lobby Lobb 4 4 1 1 1 1
15
y
PA Lounge Lounge 2 2 1 1
RC 2nd floor, E and W
2nd floor E
2nd floor, E and W
2nd floor, E
4 4 1 1 1 1
0 0
3rd floor, E and W
3rd floor E
3rd floor, E and W
3 3 1 1 1
SCI 2nd floor, W 2nd floor, W
2nd floor, W
2nd floor, W
4 4 1 1 1 1
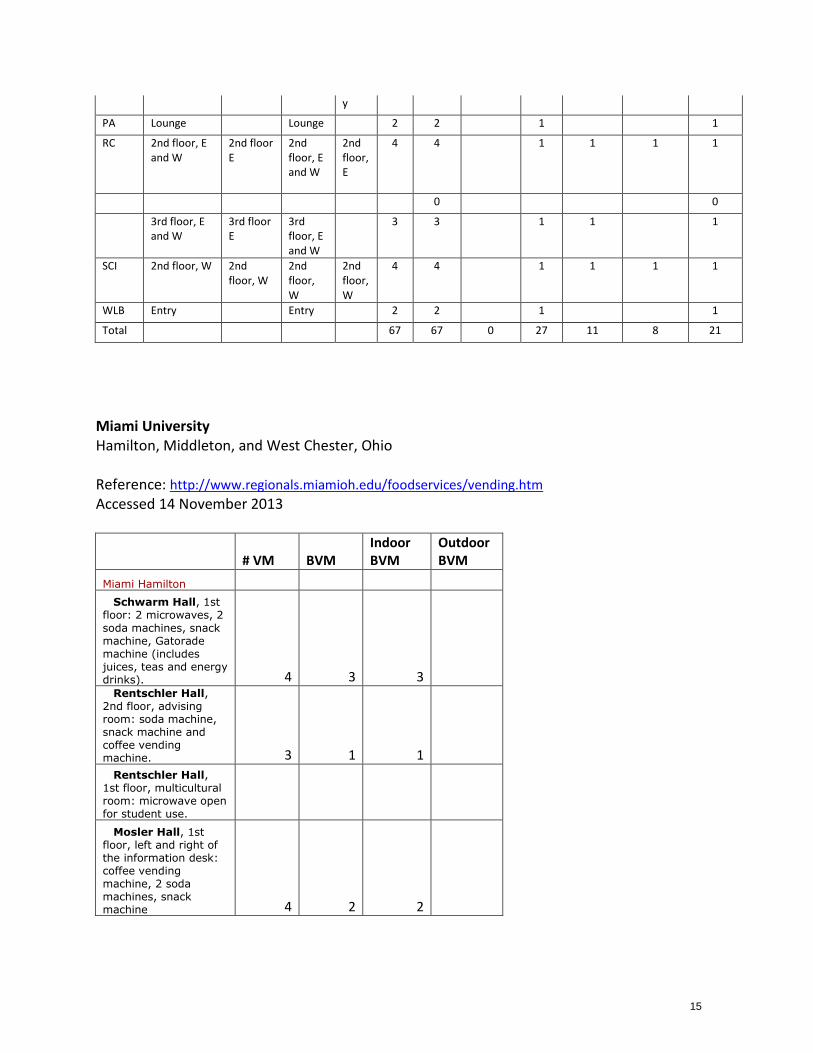
WLB Entry Entry 2 2 1 1
Total 67 67 0 27 11 8 21
Miami University Hamilton, Middleton, and West Chester, Ohio Reference: http://www.regionals.miamioh.edu/foodservices/vending.htm
Accessed 14 November 2013
# VM BVM Indoor BVM
Outdoor BVM
Miami Hamilton
Schwarm Hall, 1st floor: 2 microwaves, 2
soda machines, snack machine, Gatorade machine (includes juices, teas and energy drinks). 4 3 3
Rentschler Hall, 2nd floor, advising room: soda machine, snack machine and coffee vending machine. 3 1 1
Rentschler Hall, 1st floor, multicultural room: microwave open for student use.
Mosler Hall, 1st floor, left and right of the information desk: coffee vending machine, 2 soda machines, snack machine 4 2 2
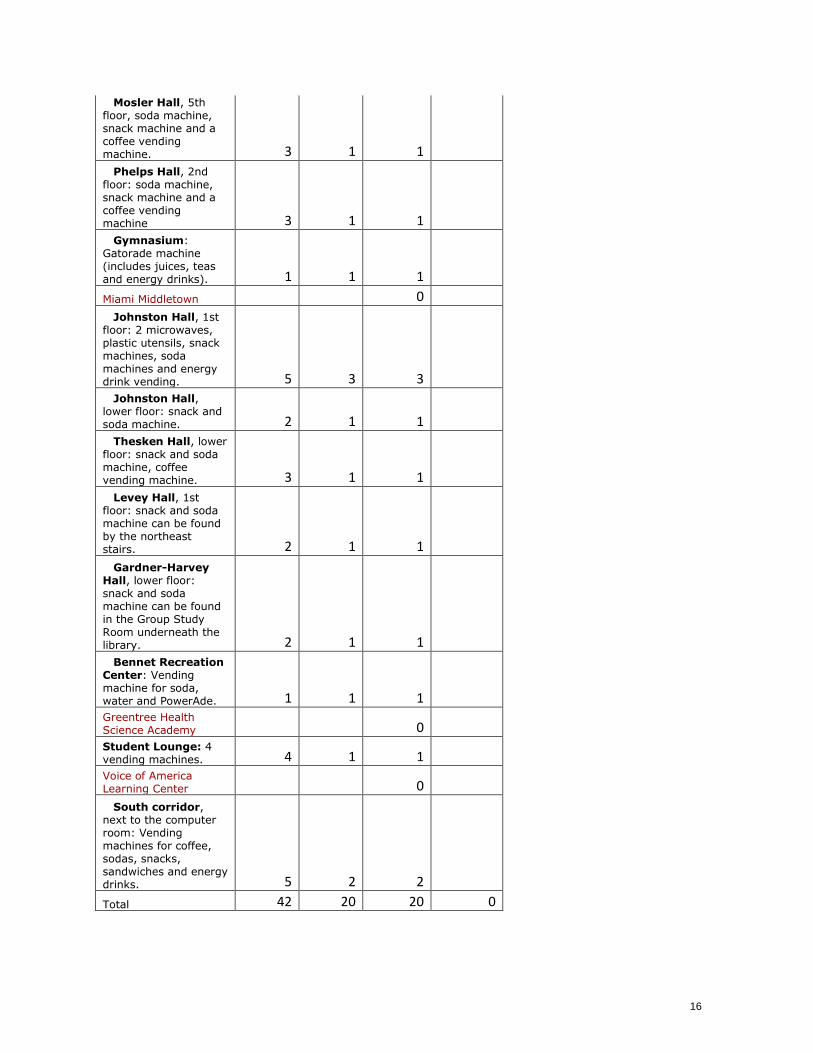
16
Mosler Hall, 5th floor, soda machine, snack machine and a coffee vending machine. 3 1 1
Phelps Hall, 2nd floor: soda machine, snack machine and a coffee vending machine 3 1 1
Gymnasium: Gatorade machine (includes juices, teas and energy drinks). 1 1 1
Miami Middletown 0
Johnston Hall, 1st floor: 2 microwaves, plastic utensils, snack machines, soda machines and energy drink vending. 5 3 3
Johnston Hall, lower floor: snack and soda machine. 2 1 1
Thesken Hall, lower floor: snack and soda machine, coffee vending machine. 3 1 1
Levey Hall, 1st floor: snack and soda machine can be found by the northeast stairs. 2 1 1
Gardner-Harvey Hall, lower floor: snack and soda machine can be found in the Group Study Room underneath the library. 2 1 1
Bennet Recreation Center: Vending machine for soda, water and PowerAde. 1 1 1 Greentree Health Science Academy 0 Student Lounge: 4 vending machines. 4 1 1
Voice of America Learning Center 0
South corridor, next to the computer room: Vending machines for coffee, sodas, snacks, sandwiches and energy drinks. 5 2 2
Total 42 20 20 0
17
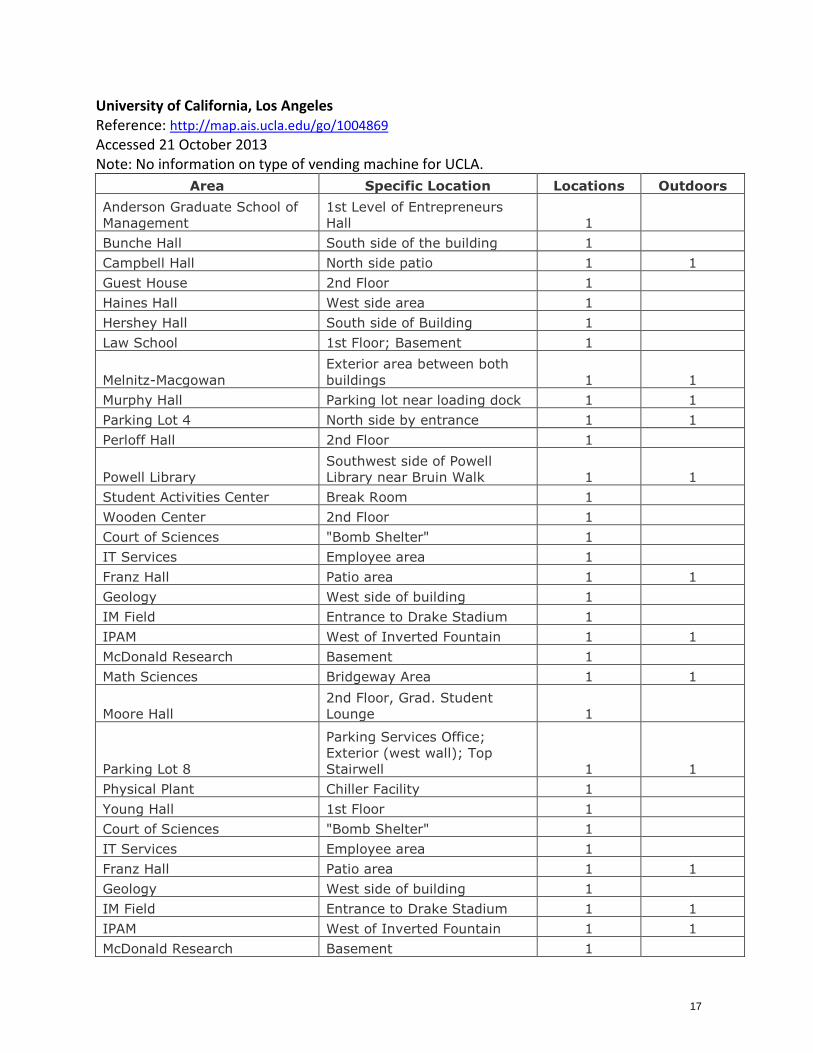
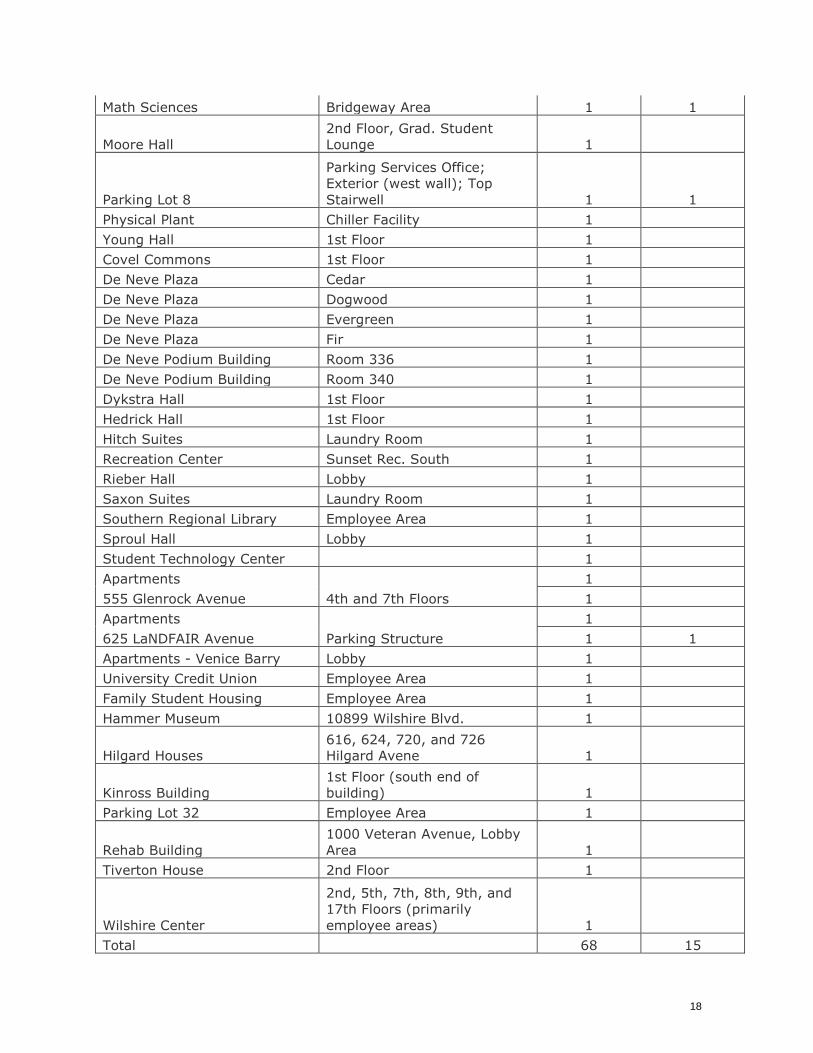
University of California, Los Angeles Reference: http://map.ais.ucla.edu/go/1004869
Accessed 21 October 2013 Note: No information on type of vending machine for UCLA.
Area Specific Location Locations Outdoors
Anderson Graduate School of
Management
1st Level of Entrepreneurs
Hall 1
Bunche Hall South side of the building 1
Campbell Hall North side patio 1 1
Guest House 2nd Floor 1
Haines Hall West side area 1
Hershey Hall South side of Building 1
Law School 1st Floor; Basement 1
Melnitz-Macgowan
Exterior area between both
buildings 1 1
Murphy Hall Parking lot near loading dock 1 1
Parking Lot 4 North side by entrance 1 1
Perloff Hall 2nd Floor 1
Powell Library
Southwest side of Powell
Library near Bruin Walk 1 1
Student Activities Center Break Room 1
Wooden Center 2nd Floor 1
Court of Sciences "Bomb Shelter" 1
IT Services Employee area 1
Franz Hall Patio area 1 1
Geology West side of building 1
IM Field Entrance to Drake Stadium 1
IPAM West of Inverted Fountain 1 1
McDonald Research Basement 1
Math Sciences Bridgeway Area 1 1
Moore Hall
2nd Floor, Grad. Student
Lounge 1
Parking Lot 8
Parking Services Office;
Exterior (west wall); Top
Stairwell 1 1
Physical Plant Chiller Facility 1
Young Hall 1st Floor 1
Court of Sciences "Bomb Shelter" 1
IT Services Employee area 1
Franz Hall Patio area 1 1
Geology West side of building 1
IM Field Entrance to Drake Stadium 1 1
IPAM West of Inverted Fountain 1 1
McDonald Research Basement 1
18
Math Sciences Bridgeway Area 1 1
Moore Hall
2nd Floor, Grad. Student
Lounge 1
Parking Lot 8
Parking Services Office;
Exterior (west wall); Top
Stairwell 1 1
Physical Plant Chiller Facility 1
Young Hall 1st Floor 1
Covel Commons 1st Floor 1
De Neve Plaza Cedar 1
De Neve Plaza Dogwood 1
De Neve Plaza Evergreen 1
De Neve Plaza Fir 1
De Neve Podium Building Room 336 1
De Neve Podium Building Room 340 1
Dykstra Hall 1st Floor 1
Hedrick Hall 1st Floor 1
Hitch Suites Laundry Room 1
Recreation Center Sunset Rec. South 1
Rieber Hall Lobby 1
Saxon Suites Laundry Room 1
Southern Regional Library Employee Area 1
Sproul Hall Lobby 1
Student Technology Center 1
Apartments
4th and 7th Floors
1
555 Glenrock Avenue 1
Apartments
Parking Structure
1
625 LaNDFAIR Avenue 1 1
Apartments - Venice Barry Lobby 1
University Credit Union Employee Area 1
Family Student Housing Employee Area 1
Hammer Museum 10899 Wilshire Blvd. 1
Hilgard Houses
616, 624, 720, and 726
Hilgard Avene 1
Kinross Building
1st Floor (south end of
building) 1
Parking Lot 32 Employee Area 1
Rehab Building
1000 Veteran Avenue, Lobby
Area 1
Tiverton House 2nd Floor 1
Wilshire Center
2nd, 5th, 7th, 8th, 9th, and
17th Floors (primarily
employee areas) 1
Total 68 15
19
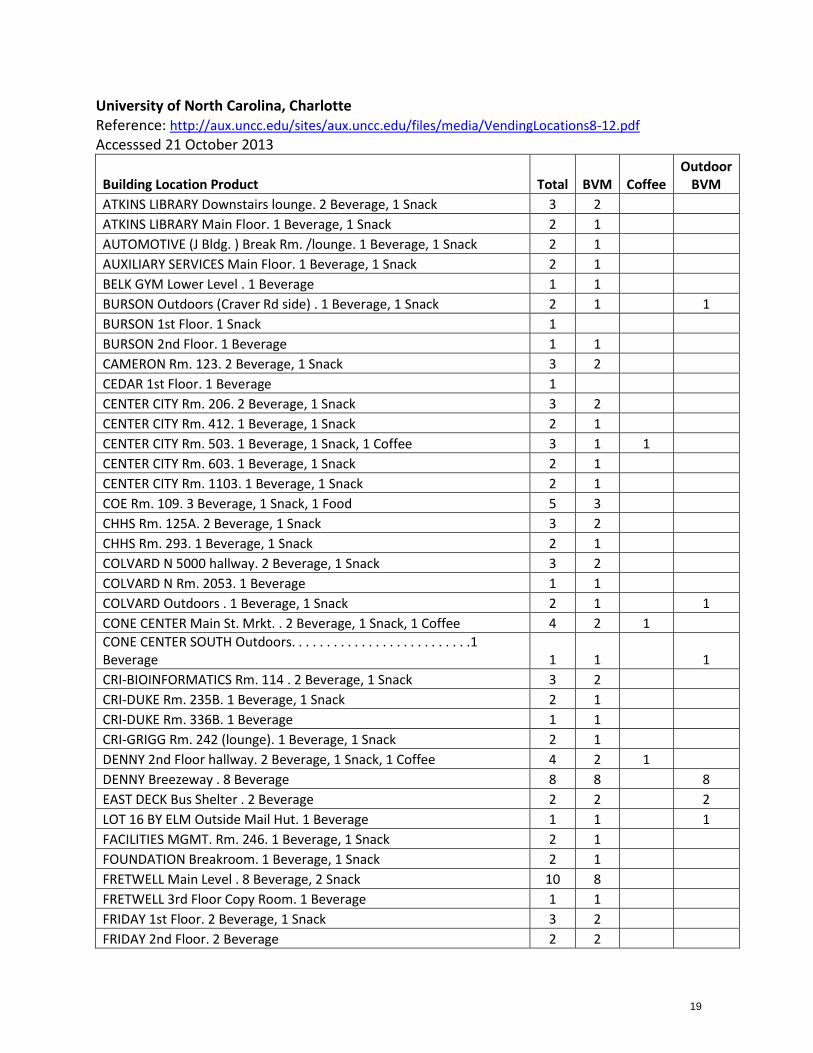
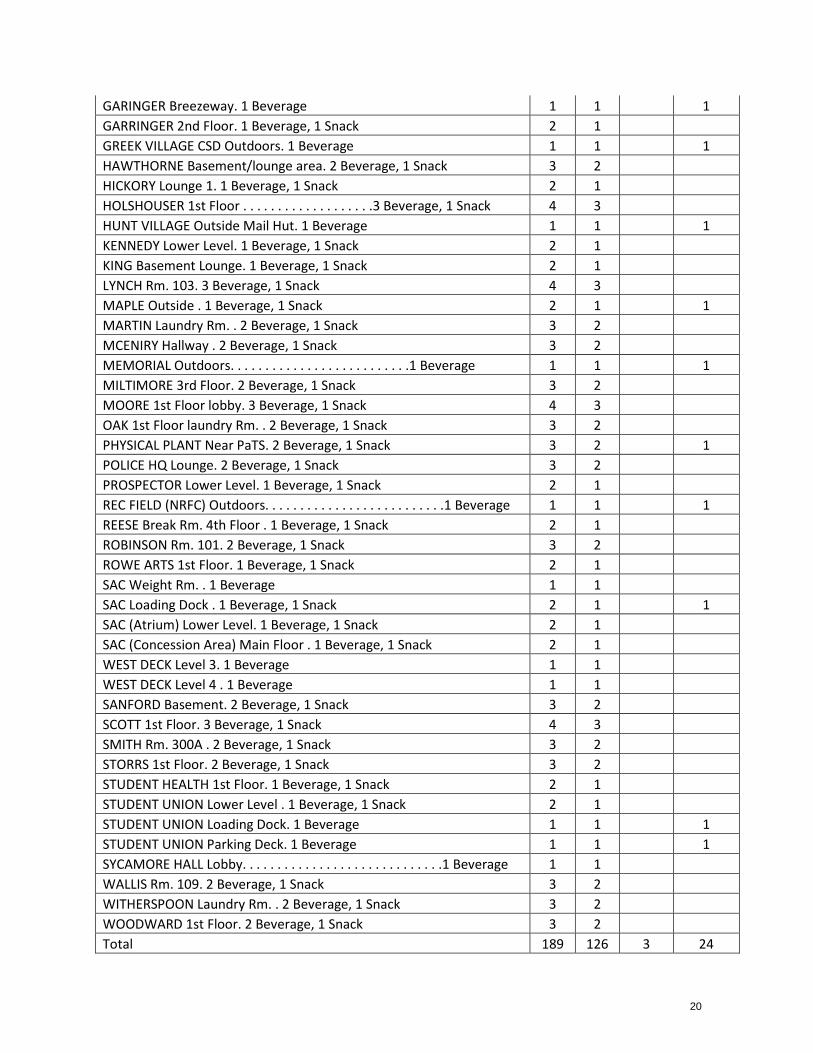
University of North Carolina, Charlotte Reference: http://aux.uncc.edu/sites/aux.uncc.edu/files/media/VendingLocations8-12.pdf
Accesssed 21 October 2013
Building Location Product Total BVM Coffee Outdoor
BVM
ATKINS LIBRARY Downstairs lounge. 2 Beverage, 1 Snack 3 2
ATKINS LIBRARY Main Floor. 1 Beverage, 1 Snack 2 1
AUTOMOTIVE (J Bldg. ) Break Rm. /lounge. 1 Beverage, 1 Snack 2 1
AUXILIARY SERVICES Main Floor. 1 Beverage, 1 Snack 2 1
BELK GYM Lower Level . 1 Beverage 1 1
BURSON Outdoors (Craver Rd side) . 1 Beverage, 1 Snack 2 1 1
BURSON 1st Floor. 1 Snack 1
BURSON 2nd Floor. 1 Beverage 1 1
CAMERON Rm. 123. 2 Beverage, 1 Snack 3 2
CEDAR 1st Floor. 1 Beverage 1
CENTER CITY Rm. 206. 2 Beverage, 1 Snack 3 2
CENTER CITY Rm. 412. 1 Beverage, 1 Snack 2 1
CENTER CITY Rm. 503. 1 Beverage, 1 Snack, 1 Coffee 3 1 1
CENTER CITY Rm. 603. 1 Beverage, 1 Snack 2 1
CENTER CITY Rm. 1103. 1 Beverage, 1 Snack 2 1
COE Rm. 109. 3 Beverage, 1 Snack, 1 Food 5 3
CHHS Rm. 125A. 2 Beverage, 1 Snack 3 2
CHHS Rm. 293. 1 Beverage, 1 Snack 2 1
COLVARD N 5000 hallway. 2 Beverage, 1 Snack 3 2
COLVARD N Rm. 2053. 1 Beverage 1 1
COLVARD Outdoors . 1 Beverage, 1 Snack 2 1 1
CONE CENTER Main St. Mrkt. . 2 Beverage, 1 Snack, 1 Coffee 4 2 1
CONE CENTER SOUTH Outdoors. . . . . . . . . . . . . . . . . . . . . . . . . .1 Beverage 1 1 1
CRI-BIOINFORMATICS Rm. 114 . 2 Beverage, 1 Snack 3 2
CRI-DUKE Rm. 235B. 1 Beverage, 1 Snack 2 1
CRI-DUKE Rm. 336B. 1 Beverage 1 1
CRI-GRIGG Rm. 242 (lounge). 1 Beverage, 1 Snack 2 1
DENNY 2nd Floor hallway. 2 Beverage, 1 Snack, 1 Coffee 4 2 1
DENNY Breezeway . 8 Beverage 8 8 8
EAST DECK Bus Shelter . 2 Beverage 2 2 2
LOT 16 BY ELM Outside Mail Hut. 1 Beverage 1 1 1
FACILITIES MGMT. Rm. 246. 1 Beverage, 1 Snack 2 1
FOUNDATION Breakroom. 1 Beverage, 1 Snack 2 1
FRETWELL Main Level . 8 Beverage, 2 Snack 10 8
FRETWELL 3rd Floor Copy Room. 1 Beverage 1 1
FRIDAY 1st Floor. 2 Beverage, 1 Snack 3 2
FRIDAY 2nd Floor. 2 Beverage 2 2
20
GARINGER Breezeway. 1 Beverage 1 1 1
GARRINGER 2nd Floor. 1 Beverage, 1 Snack 2 1
GREEK VILLAGE CSD Outdoors. 1 Beverage 1 1 1
HAWTHORNE Basement/lounge area. 2 Beverage, 1 Snack 3 2
HICKORY Lounge 1. 1 Beverage, 1 Snack 2 1
HOLSHOUSER 1st Floor . . . . . . . . . . . . . . . . . . .3 Beverage, 1 Snack 4 3
HUNT VILLAGE Outside Mail Hut. 1 Beverage 1 1 1
KENNEDY Lower Level. 1 Beverage, 1 Snack 2 1
KING Basement Lounge. 1 Beverage, 1 Snack 2 1
LYNCH Rm. 103. 3 Beverage, 1 Snack 4 3
MAPLE Outside . 1 Beverage, 1 Snack 2 1 1
MARTIN Laundry Rm. . 2 Beverage, 1 Snack 3 2
MCENIRY Hallway . 2 Beverage, 1 Snack 3 2
MEMORIAL Outdoors. . . . . . . . . . . . . . . . . . . . . . . . . .1 Beverage 1 1 1
MILTIMORE 3rd Floor. 2 Beverage, 1 Snack 3 2
MOORE 1st Floor lobby. 3 Beverage, 1 Snack 4 3
OAK 1st Floor laundry Rm. . 2 Beverage, 1 Snack 3 2
PHYSICAL PLANT Near PaTS. 2 Beverage, 1 Snack 3 2 1
POLICE HQ Lounge. 2 Beverage, 1 Snack 3 2
PROSPECTOR Lower Level. 1 Beverage, 1 Snack 2 1
REC FIELD (NRFC) Outdoors. . . . . . . . . . . . . . . . . . . . . . . . . .1 Beverage 1 1 1
REESE Break Rm. 4th Floor . 1 Beverage, 1 Snack 2 1
ROBINSON Rm. 101. 2 Beverage, 1 Snack 3 2
ROWE ARTS 1st Floor. 1 Beverage, 1 Snack 2 1
SAC Weight Rm. . 1 Beverage 1 1
SAC Loading Dock . 1 Beverage, 1 Snack 2 1 1
SAC (Atrium) Lower Level. 1 Beverage, 1 Snack 2 1
SAC (Concession Area) Main Floor . 1 Beverage, 1 Snack 2 1
WEST DECK Level 3. 1 Beverage 1 1
WEST DECK Level 4 . 1 Beverage 1 1
SANFORD Basement. 2 Beverage, 1 Snack 3 2
SCOTT 1st Floor. 3 Beverage, 1 Snack 4 3
SMITH Rm. 300A . 2 Beverage, 1 Snack 3 2
STORRS 1st Floor. 2 Beverage, 1 Snack 3 2
STUDENT HEALTH 1st Floor. 1 Beverage, 1 Snack 2 1
STUDENT UNION Lower Level . 1 Beverage, 1 Snack 2 1
STUDENT UNION Loading Dock. 1 Beverage 1 1 1
STUDENT UNION Parking Deck. 1 Beverage 1 1 1
SYCAMORE HALL Lobby. . . . . . . . . . . . . . . . . . . . . . . . . . . . .1 Beverage 1 1
WALLIS Rm. 109. 2 Beverage, 1 Snack 3 2
WITHERSPOON Laundry Rm. . 2 Beverage, 1 Snack 3 2
WOODWARD 1st Floor. 2 Beverage, 1 Snack 3 2
Total 189 126 3 24
21
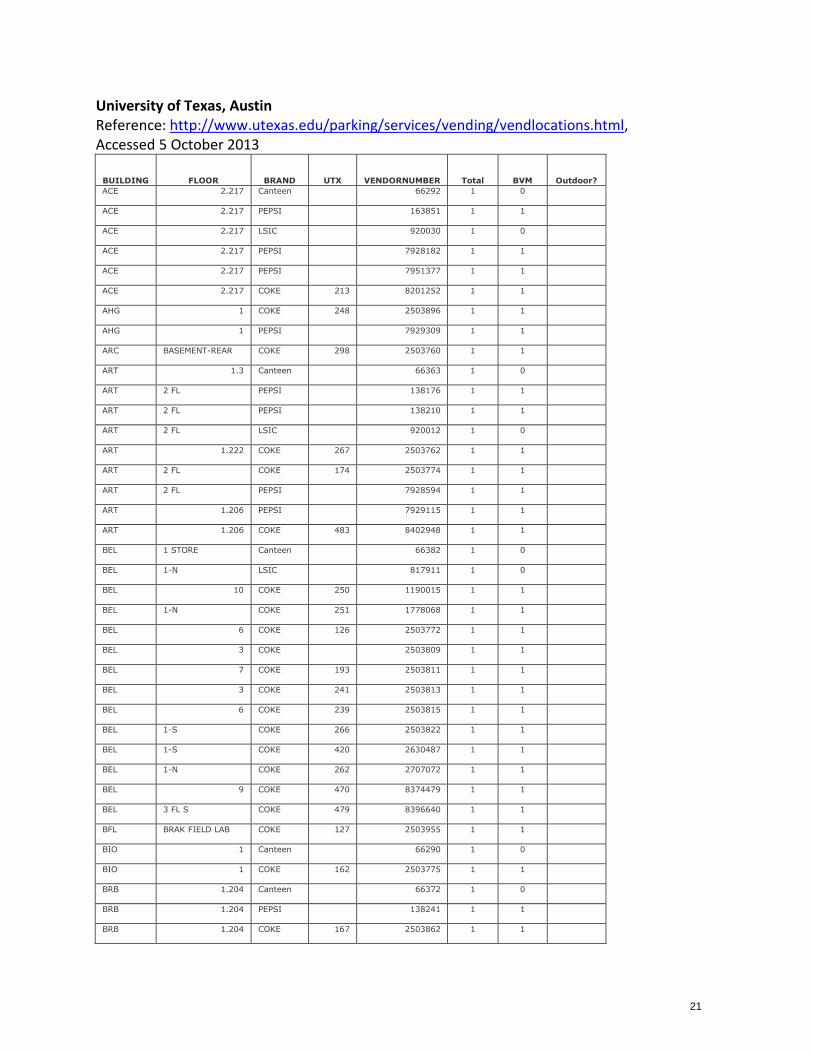
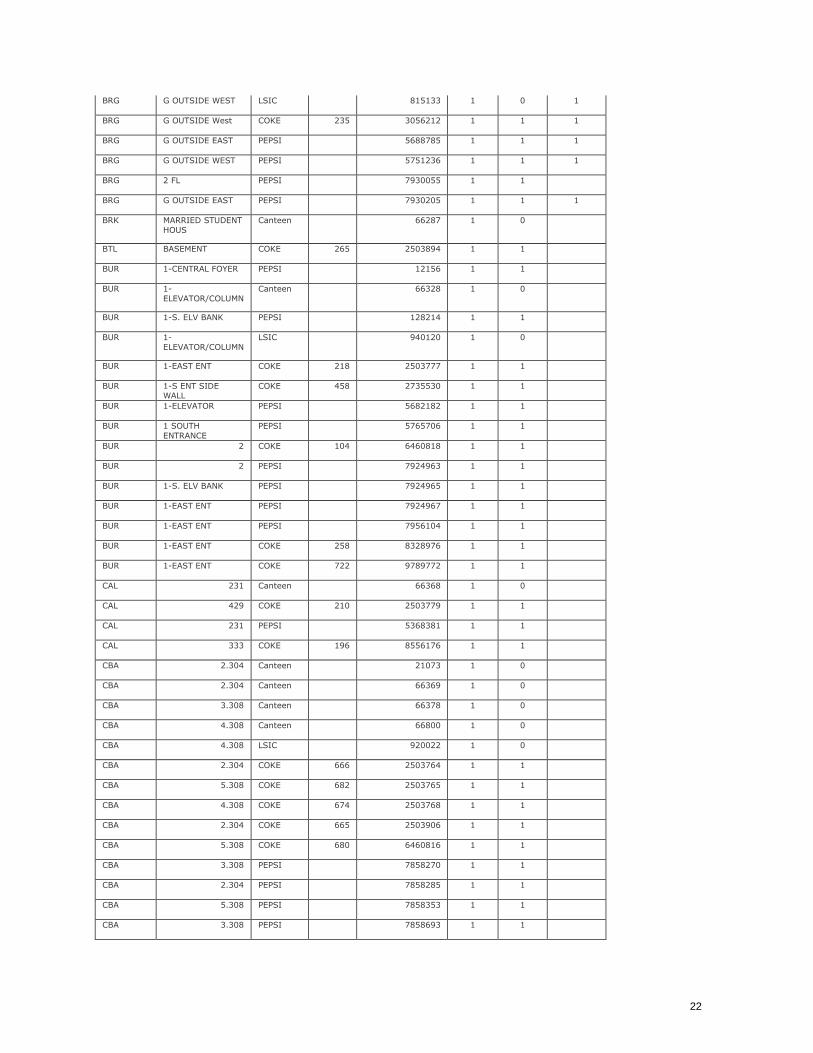
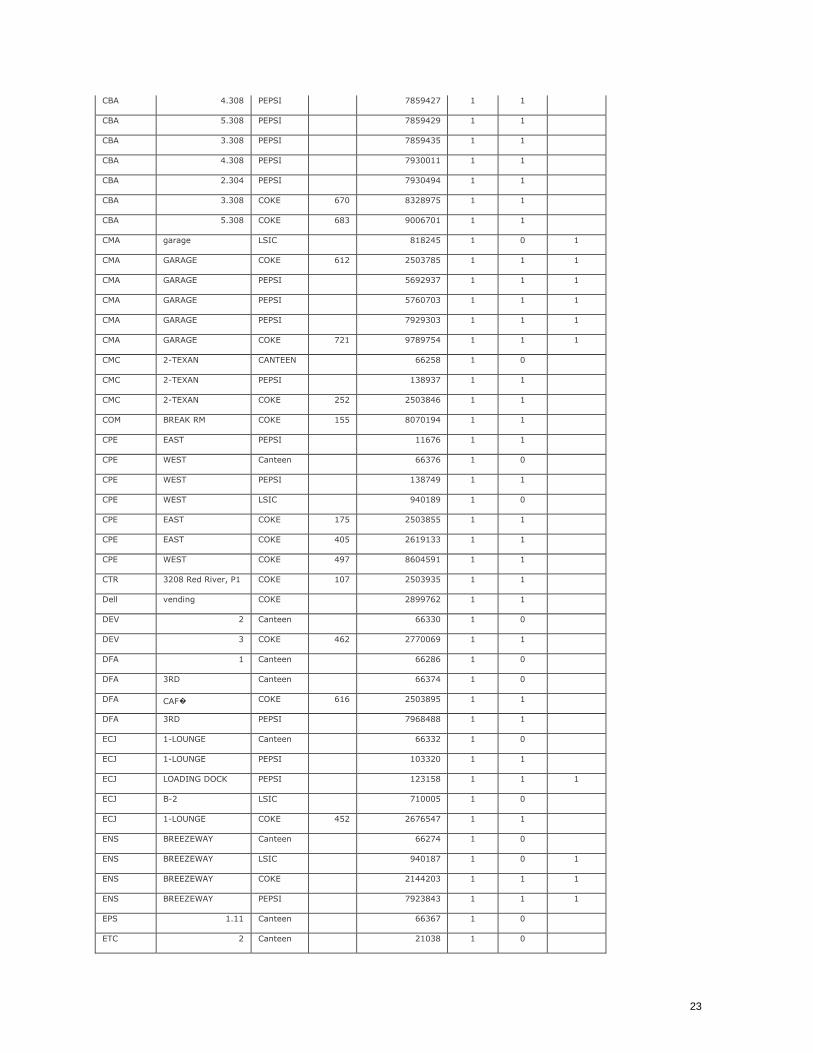
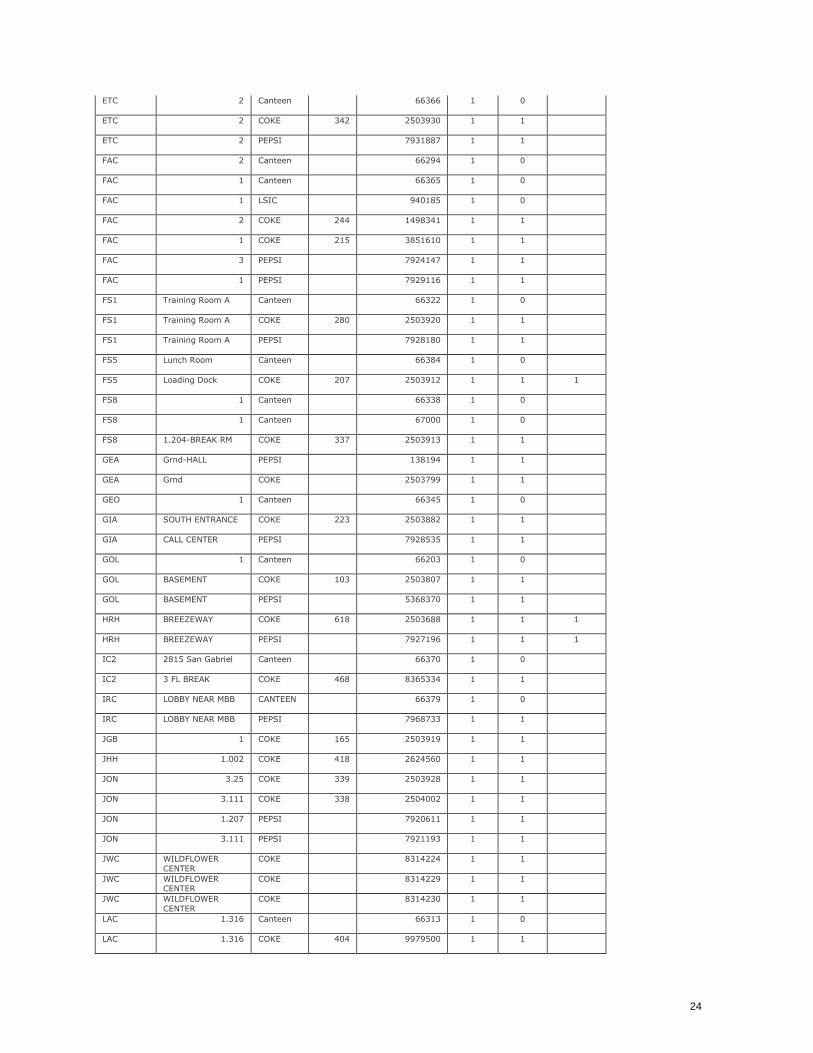
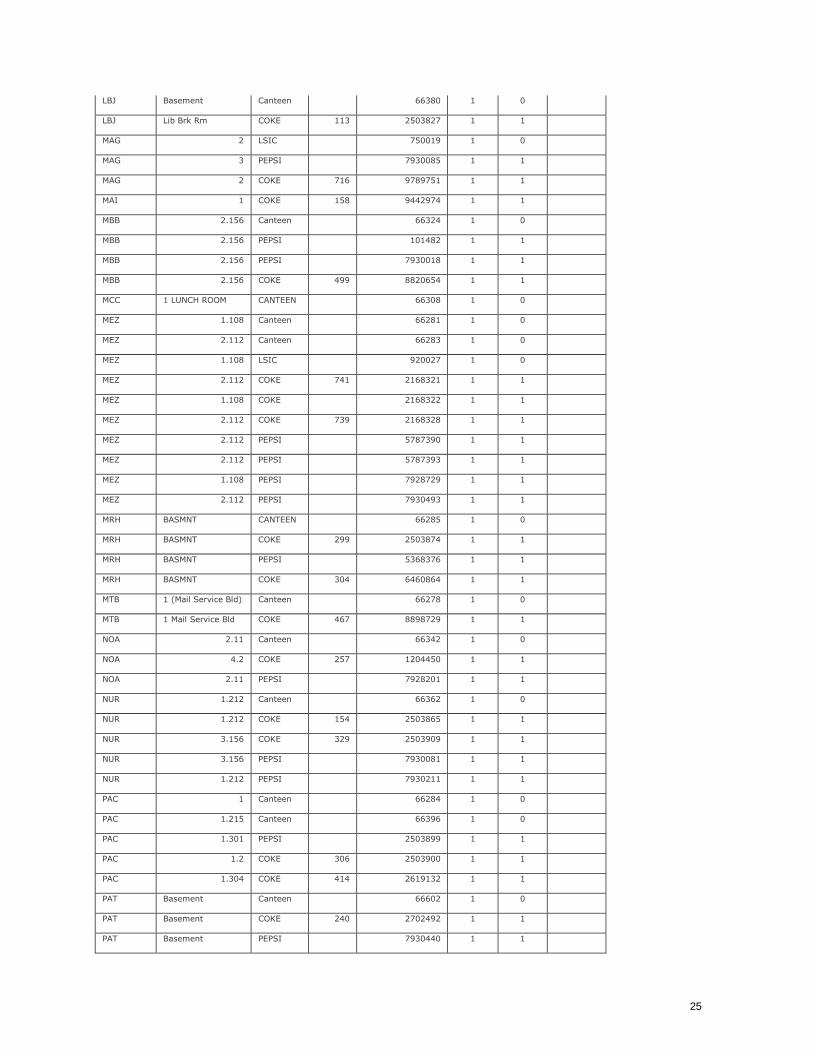
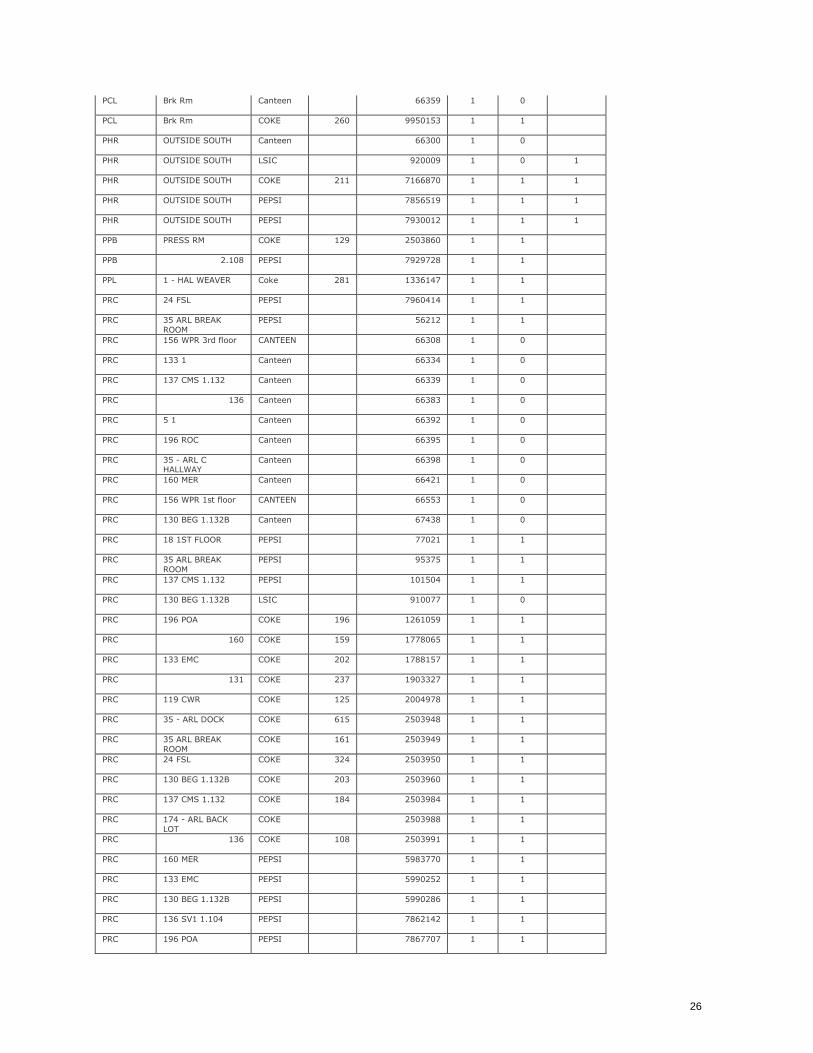
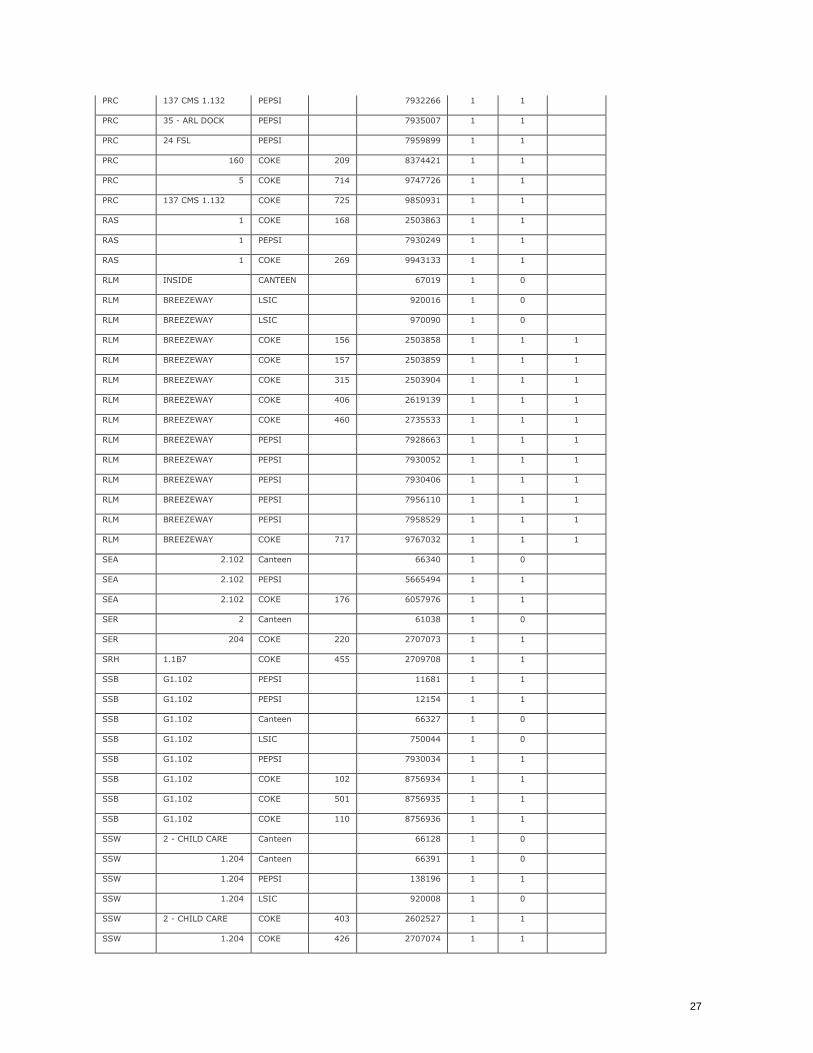
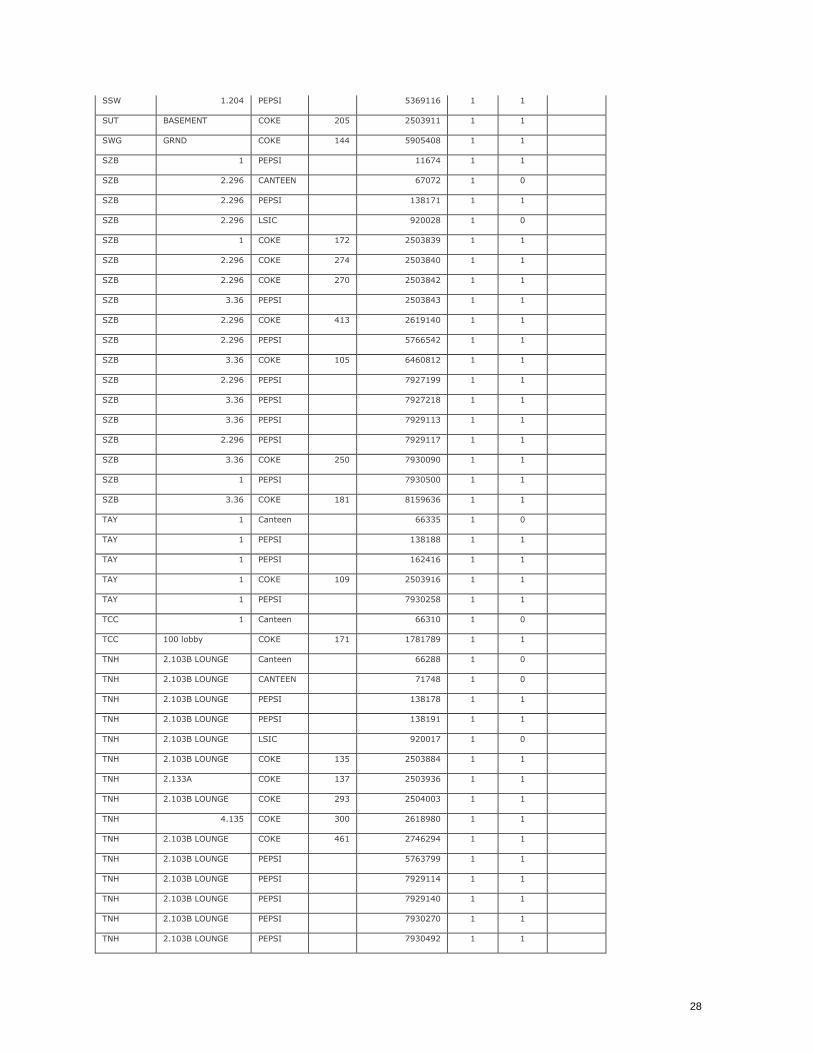
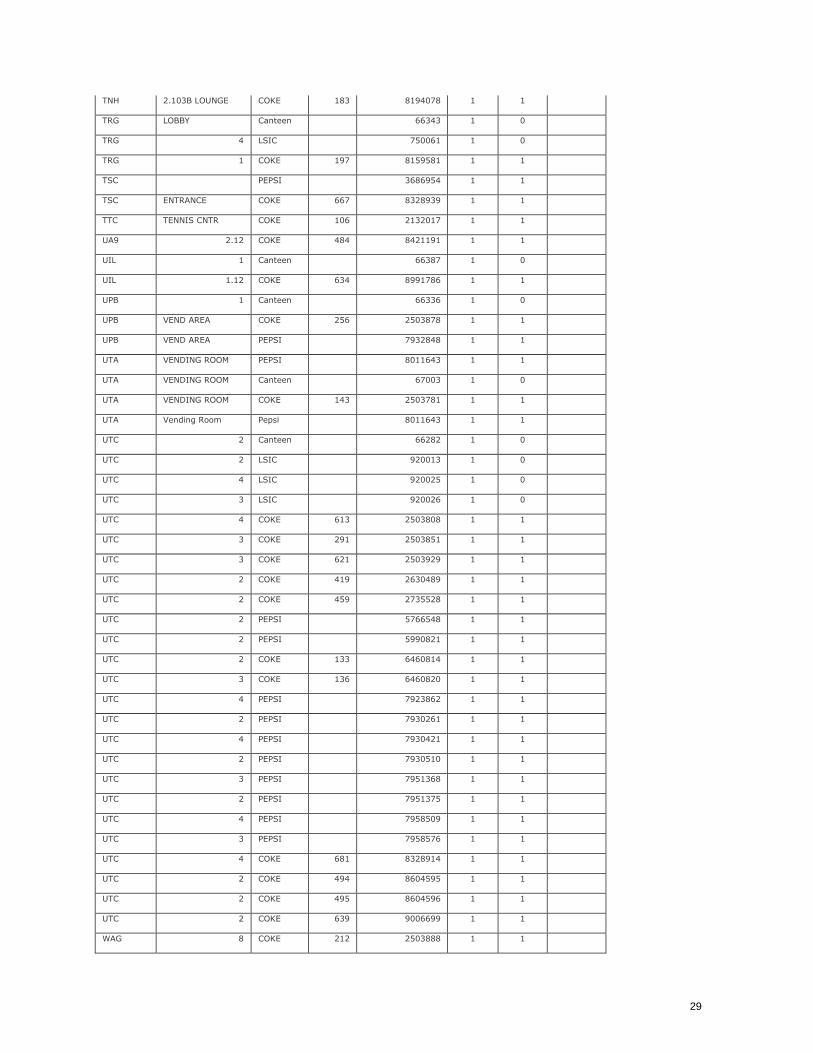
University of Texas, Austin Reference: http://www.utexas.edu/parking/services/vending/vendlocations.html, Accessed 5 October 2013
BUILDING FLOOR BRAND UTX VENDORNUMBER Total BVM Outdoor?
ACE 2.217 Canteen 66292 1 0
ACE 2.217 PEPSI 163851 1 1
ACE 2.217 LSIC 920030 1 0
ACE 2.217 PEPSI 7928182 1 1
ACE 2.217 PEPSI 7951377 1 1
ACE 2.217 COKE 213 8201252 1 1
AHG 1 COKE 248 2503896 1 1
AHG 1 PEPSI 7929309 1 1
ARC BASEMENT-REAR COKE 298 2503760 1 1
ART 1.3 Canteen 66363 1 0
ART 2 FL PEPSI 138176 1 1
ART 2 FL PEPSI 138210 1 1
ART 2 FL LSIC 920012 1 0
ART 1.222 COKE 267 2503762 1 1
ART 2 FL COKE 174 2503774 1 1
ART 2 FL PEPSI 7928594 1 1
ART 1.206 PEPSI 7929115 1 1
ART 1.206 COKE 483 8402948 1 1
BEL 1 STORE Canteen 66382 1 0
BEL 1-N LSIC 817911 1 0
BEL 10 COKE 250 1190015 1 1
BEL 1-N COKE 251 1778068 1 1
BEL 6 COKE 126 2503772 1 1
BEL 3 COKE 2503809 1 1
BEL 7 COKE 193 2503811 1 1
BEL 3 COKE 241 2503813 1 1
BEL 6 COKE 239 2503815 1 1
BEL 1-S COKE 266 2503822 1 1
BEL 1-S COKE 420 2630487 1 1
BEL 1-N COKE 262 2707072 1 1
BEL 9 COKE 470 8374479 1 1
BEL 3 FL S COKE 479 8396640 1 1
BFL BRAK FIELD LAB COKE 127 2503955 1 1
BIO 1 Canteen 66290 1 0
BIO 1 COKE 162 2503775 1 1
BRB 1.204 Canteen 66372 1 0
BRB 1.204 PEPSI 138241 1 1
BRB 1.204 COKE 167 2503862 1 1
22
BRG G OUTSIDE WEST LSIC 815133 1 0 1
BRG G OUTSIDE West COKE 235 3056212 1 1 1
BRG G OUTSIDE EAST PEPSI 5688785 1 1 1
BRG G OUTSIDE WEST PEPSI 5751236 1 1 1
BRG 2 FL PEPSI 7930055 1 1
BRG G OUTSIDE EAST PEPSI 7930205 1 1 1
BRK MARRIED STUDENT
HOUS
Canteen 66287 1 0
BTL BASEMENT COKE 265 2503894 1 1
BUR 1-CENTRAL FOYER PEPSI 12156 1 1
BUR 1-
ELEVATOR/COLUMN
Canteen 66328 1 0
BUR 1-S. ELV BANK PEPSI 128214 1 1
BUR 1-
ELEVATOR/COLUMN
LSIC 940120 1 0
BUR 1-EAST ENT COKE 218 2503777 1 1
BUR 1-S ENT SIDE WALL
COKE 458 2735530 1 1
BUR 1-ELEVATOR PEPSI 5682182 1 1
BUR 1 SOUTH
ENTRANCE
PEPSI 5765706 1 1
BUR 2 COKE 104 6460818 1 1
BUR 2 PEPSI 7924963 1 1
BUR 1-S. ELV BANK PEPSI 7924965 1 1
BUR 1-EAST ENT PEPSI 7924967 1 1
BUR 1-EAST ENT PEPSI 7956104 1 1
BUR 1-EAST ENT COKE 258 8328976 1 1
BUR 1-EAST ENT COKE 722 9789772 1 1
CAL 231 Canteen 66368 1 0
CAL 429 COKE 210 2503779 1 1
CAL 231 PEPSI 5368381 1 1
CAL 333 COKE 196 8556176 1 1
CBA 2.304 Canteen 21073 1 0
CBA 2.304 Canteen 66369 1 0
CBA 3.308 Canteen 66378 1 0
CBA 4.308 Canteen 66800 1 0
CBA 4.308 LSIC 920022 1 0
CBA 2.304 COKE 666 2503764 1 1
CBA 5.308 COKE 682 2503765 1 1
CBA 4.308 COKE 674 2503768 1 1
CBA 2.304 COKE 665 2503906 1 1
CBA 5.308 COKE 680 6460816 1 1
CBA 3.308 PEPSI 7858270 1 1
CBA 2.304 PEPSI 7858285 1 1
CBA 5.308 PEPSI 7858353 1 1
CBA 3.308 PEPSI 7858693 1 1
23
CBA 4.308 PEPSI 7859427 1 1
CBA 5.308 PEPSI 7859429 1 1
CBA 3.308 PEPSI 7859435 1 1
CBA 4.308 PEPSI 7930011 1 1
CBA 2.304 PEPSI 7930494 1 1
CBA 3.308 COKE 670 8328975 1 1
CBA 5.308 COKE 683 9006701 1 1
CMA garage LSIC 818245 1 0 1
CMA GARAGE COKE 612 2503785 1 1 1
CMA GARAGE PEPSI 5692937 1 1 1
CMA GARAGE PEPSI 5760703 1 1 1
CMA GARAGE PEPSI 7929303 1 1 1
CMA GARAGE COKE 721 9789754 1 1 1
CMC 2-TEXAN CANTEEN 66258 1 0
CMC 2-TEXAN PEPSI 138937 1 1
CMC 2-TEXAN COKE 252 2503846 1 1
COM BREAK RM COKE 155 8070194 1 1
CPE EAST PEPSI 11676 1 1
CPE WEST Canteen 66376 1 0
CPE WEST PEPSI 138749 1 1
CPE WEST LSIC 940189 1 0
CPE EAST COKE 175 2503855 1 1
CPE EAST COKE 405 2619133 1 1
CPE WEST COKE 497 8604591 1 1
CTR 3208 Red River, P1 COKE 107 2503935 1 1
Dell vending COKE 2899762 1 1
DEV 2 Canteen 66330 1 0
DEV 3 COKE 462 2770069 1 1
DFA 1 Canteen 66286 1 0
DFA 3RD Canteen 66374 1 0
DFA CAF� COKE 616 2503895 1 1
DFA 3RD PEPSI 7968488 1 1
ECJ 1-LOUNGE Canteen 66332 1 0
ECJ 1-LOUNGE PEPSI 103320 1 1
ECJ LOADING DOCK PEPSI 123158 1 1 1
ECJ B-2 LSIC 710005 1 0
ECJ 1-LOUNGE COKE 452 2676547 1 1
ENS BREEZEWAY Canteen 66274 1 0
ENS BREEZEWAY LSIC 940187 1 0 1
ENS BREEZEWAY COKE 2144203 1 1 1
ENS BREEZEWAY PEPSI 7923843 1 1 1
EPS 1.11 Canteen 66367 1 0
ETC 2 Canteen 21038 1 0
24
ETC 2 Canteen 66366 1 0
ETC 2 COKE 342 2503930 1 1
ETC 2 PEPSI 7931887 1 1
FAC 2 Canteen 66294 1 0
FAC 1 Canteen 66365 1 0
FAC 1 LSIC 940185 1 0
FAC 2 COKE 244 1498341 1 1
FAC 1 COKE 215 3851610 1 1
FAC 3 PEPSI 7924147 1 1
FAC 1 PEPSI 7929116 1 1
FS1 Training Room A Canteen 66322 1 0
FS1 Training Room A COKE 280 2503920 1 1
FS1 Training Room A PEPSI 7928180 1 1
FS5 Lunch Room Canteen 66384 1 0
FS5 Loading Dock COKE 207 2503912 1 1 1
FS8 1 Canteen 66338 1 0
FS8 1 Canteen 67000 1 0
FS8 1.204-BREAK RM COKE 337 2503913 1 1
GEA Grnd-HALL PEPSI 138194 1 1
GEA Grnd COKE 2503799 1 1
GEO 1 Canteen 66345 1 0
GIA SOUTH ENTRANCE COKE 223 2503882 1 1
GIA CALL CENTER PEPSI 7928535 1 1
GOL 1 Canteen 66203 1 0
GOL BASEMENT COKE 103 2503807 1 1
GOL BASEMENT PEPSI 5368370 1 1
HRH BREEZEWAY COKE 618 2503688 1 1 1
HRH BREEZEWAY PEPSI 7927196 1 1 1
IC2 2815 San Gabriel Canteen 66370 1 0
IC2 3 FL BREAK COKE 468 8365334 1 1
IRC LOBBY NEAR MBB CANTEEN 66379 1 0
IRC LOBBY NEAR MBB PEPSI 7968733 1 1
JGB 1 COKE 165 2503919 1 1
JHH 1.002 COKE 418 2624560 1 1
JON 3.25 COKE 339 2503928 1 1
JON 3.111 COKE 338 2504002 1 1
JON 1.207 PEPSI 7920611 1 1
JON 3.111 PEPSI 7921193 1 1
JWC WILDFLOWER
CENTER
COKE 8314224 1 1
JWC WILDFLOWER CENTER
COKE 8314229 1 1
JWC WILDFLOWER
CENTER
COKE 8314230 1 1
LAC 1.316 Canteen 66313 1 0
LAC 1.316 COKE 404 9979500 1 1
25
LBJ Basement Canteen 66380 1 0
LBJ Lib Brk Rm COKE 113 2503827 1 1
MAG 2 LSIC 750019 1 0
MAG 3 PEPSI 7930085 1 1
MAG 2 COKE 716 9789751 1 1
MAI 1 COKE 158 9442974 1 1
MBB 2.156 Canteen 66324 1 0
MBB 2.156 PEPSI 101482 1 1
MBB 2.156 PEPSI 7930018 1 1
MBB 2.156 COKE 499 8820654 1 1
MCC 1 LUNCH ROOM CANTEEN 66308 1 0
MEZ 1.108 Canteen 66281 1 0
MEZ 2.112 Canteen 66283 1 0
MEZ 1.108 LSIC 920027 1 0
MEZ 2.112 COKE 741 2168321 1 1
MEZ 1.108 COKE 2168322 1 1
MEZ 2.112 COKE 739 2168328 1 1
MEZ 2.112 PEPSI 5787390 1 1
MEZ 2.112 PEPSI 5787393 1 1
MEZ 1.108 PEPSI 7928729 1 1
MEZ 2.112 PEPSI 7930493 1 1
MRH BASMNT CANTEEN 66285 1 0
MRH BASMNT COKE 299 2503874 1 1
MRH BASMNT PEPSI 5368376 1 1
MRH BASMNT COKE 304 6460864 1 1
MTB 1 (Mail Service Bld) Canteen 66278 1 0
MTB 1 Mail Service Bld COKE 467 8898729 1 1
NOA 2.11 Canteen 66342 1 0
NOA 4.2 COKE 257 1204450 1 1
NOA 2.11 PEPSI 7928201 1 1
NUR 1.212 Canteen 66362 1 0
NUR 1.212 COKE 154 2503865 1 1
NUR 3.156 COKE 329 2503909 1 1
NUR 3.156 PEPSI 7930081 1 1
NUR 1.212 PEPSI 7930211 1 1
PAC 1 Canteen 66284 1 0
PAC 1.215 Canteen 66396 1 0
PAC 1.301 PEPSI 2503899 1 1
PAC 1.2 COKE 306 2503900 1 1
PAC 1.304 COKE 414 2619132 1 1
PAT Basement Canteen 66602 1 0
PAT Basement COKE 240 2702492 1 1
PAT Basement PEPSI 7930440 1 1
26
PCL Brk Rm Canteen 66359 1 0
PCL Brk Rm COKE 260 9950153 1 1
PHR OUTSIDE SOUTH Canteen 66300 1 0
PHR OUTSIDE SOUTH LSIC 920009 1 0 1
PHR OUTSIDE SOUTH COKE 211 7166870 1 1 1
PHR OUTSIDE SOUTH PEPSI 7856519 1 1 1
PHR OUTSIDE SOUTH PEPSI 7930012 1 1 1
PPB PRESS RM COKE 129 2503860 1 1
PPB 2.108 PEPSI 7929728 1 1
PPL 1 - HAL WEAVER Coke 281 1336147 1 1
PRC 24 FSL PEPSI 7960414 1 1
PRC 35 ARL BREAK
ROOM
PEPSI 56212 1 1
PRC 156 WPR 3rd floor CANTEEN 66308 1 0
PRC 133 1 Canteen 66334 1 0
PRC 137 CMS 1.132 Canteen 66339 1 0
PRC 136 Canteen 66383 1 0
PRC 5 1 Canteen 66392 1 0
PRC 196 ROC Canteen 66395 1 0
PRC 35 - ARL C HALLWAY
Canteen 66398 1 0
PRC 160 MER Canteen 66421 1 0
PRC 156 WPR 1st floor CANTEEN 66553 1 0
PRC 130 BEG 1.132B Canteen 67438 1 0
PRC 18 1ST FLOOR PEPSI 77021 1 1
PRC 35 ARL BREAK
ROOM
PEPSI 95375 1 1
PRC 137 CMS 1.132 PEPSI 101504 1 1
PRC 130 BEG 1.132B LSIC 910077 1 0
PRC 196 POA COKE 196 1261059 1 1
PRC 160 COKE 159 1778065 1 1
PRC 133 EMC COKE 202 1788157 1 1
PRC 131 COKE 237 1903327 1 1
PRC 119 CWR COKE 125 2004978 1 1
PRC 35 - ARL DOCK COKE 615 2503948 1 1
PRC 35 ARL BREAK
ROOM
COKE 161 2503949 1 1
PRC 24 FSL COKE 324 2503950 1 1
PRC 130 BEG 1.132B COKE 203 2503960 1 1
PRC 137 CMS 1.132 COKE 184 2503984 1 1
PRC 174 - ARL BACK
LOT
COKE 2503988 1 1
PRC 136 COKE 108 2503991 1 1
PRC 160 MER PEPSI 5983770 1 1
PRC 133 EMC PEPSI 5990252 1 1
PRC 130 BEG 1.132B PEPSI 5990286 1 1
PRC 136 SV1 1.104 PEPSI 7862142 1 1
PRC 196 POA PEPSI 7867707 1 1
27
PRC 137 CMS 1.132 PEPSI 7932266 1 1
PRC 35 - ARL DOCK PEPSI 7935007 1 1
PRC 24 FSL PEPSI 7959899 1 1
PRC 160 COKE 209 8374421 1 1
PRC 5 COKE 714 9747726 1 1
PRC 137 CMS 1.132 COKE 725 9850931 1 1
RAS 1 COKE 168 2503863 1 1
RAS 1 PEPSI 7930249 1 1
RAS 1 COKE 269 9943133 1 1
RLM INSIDE CANTEEN 67019 1 0
RLM BREEZEWAY LSIC 920016 1 0
RLM BREEZEWAY LSIC 970090 1 0
RLM BREEZEWAY COKE 156 2503858 1 1 1
RLM BREEZEWAY COKE 157 2503859 1 1 1
RLM BREEZEWAY COKE 315 2503904 1 1 1
RLM BREEZEWAY COKE 406 2619139 1 1 1
RLM BREEZEWAY COKE 460 2735533 1 1 1
RLM BREEZEWAY PEPSI 7928663 1 1 1
RLM BREEZEWAY PEPSI 7930052 1 1 1
RLM BREEZEWAY PEPSI 7930406 1 1 1
RLM BREEZEWAY PEPSI 7956110 1 1 1
RLM BREEZEWAY PEPSI 7958529 1 1 1
RLM BREEZEWAY COKE 717 9767032 1 1 1
SEA 2.102 Canteen 66340 1 0
SEA 2.102 PEPSI 5665494 1 1
SEA 2.102 COKE 176 6057976 1 1
SER 2 Canteen 61038 1 0
SER 204 COKE 220 2707073 1 1
SRH 1.1B7 COKE 455 2709708 1 1
SSB G1.102 PEPSI 11681 1 1
SSB G1.102 PEPSI 12154 1 1
SSB G1.102 Canteen 66327 1 0
SSB G1.102 LSIC 750044 1 0
SSB G1.102 PEPSI 7930034 1 1
SSB G1.102 COKE 102 8756934 1 1
SSB G1.102 COKE 501 8756935 1 1
SSB G1.102 COKE 110 8756936 1 1
SSW 2 - CHILD CARE Canteen 66128 1 0
SSW 1.204 Canteen 66391 1 0
SSW 1.204 PEPSI 138196 1 1
SSW 1.204 LSIC 920008 1 0
SSW 2 - CHILD CARE COKE 403 2602527 1 1
SSW 1.204 COKE 426 2707074 1 1
28
SSW 1.204 PEPSI 5369116 1 1
SUT BASEMENT COKE 205 2503911 1 1
SWG GRND COKE 144 5905408 1 1
SZB 1 PEPSI 11674 1 1
SZB 2.296 CANTEEN 67072 1 0
SZB 2.296 PEPSI 138171 1 1
SZB 2.296 LSIC 920028 1 0
SZB 1 COKE 172 2503839 1 1
SZB 2.296 COKE 274 2503840 1 1
SZB 2.296 COKE 270 2503842 1 1
SZB 3.36 PEPSI 2503843 1 1
SZB 2.296 COKE 413 2619140 1 1
SZB 2.296 PEPSI 5766542 1 1
SZB 3.36 COKE 105 6460812 1 1
SZB 2.296 PEPSI 7927199 1 1
SZB 3.36 PEPSI 7927218 1 1
SZB 3.36 PEPSI 7929113 1 1
SZB 2.296 PEPSI 7929117 1 1
SZB 3.36 COKE 250 7930090 1 1
SZB 1 PEPSI 7930500 1 1
SZB 3.36 COKE 181 8159636 1 1
TAY 1 Canteen 66335 1 0
TAY 1 PEPSI 138188 1 1
TAY 1 PEPSI 162416 1 1
TAY 1 COKE 109 2503916 1 1
TAY 1 PEPSI 7930258 1 1
TCC 1 Canteen 66310 1 0
TCC 100 lobby COKE 171 1781789 1 1
TNH 2.103B LOUNGE Canteen 66288 1 0
TNH 2.103B LOUNGE CANTEEN 71748 1 0
TNH 2.103B LOUNGE PEPSI 138178 1 1
TNH 2.103B LOUNGE PEPSI 138191 1 1
TNH 2.103B LOUNGE LSIC 920017 1 0
TNH 2.103B LOUNGE COKE 135 2503884 1 1
TNH 2.133A COKE 137 2503936 1 1
TNH 2.103B LOUNGE COKE 293 2504003 1 1
TNH 4.135 COKE 300 2618980 1 1
TNH 2.103B LOUNGE COKE 461 2746294 1 1
TNH 2.103B LOUNGE PEPSI 5763799 1 1
TNH 2.103B LOUNGE PEPSI 7929114 1 1
TNH 2.103B LOUNGE PEPSI 7929140 1 1
TNH 2.103B LOUNGE PEPSI 7930270 1 1
TNH 2.103B LOUNGE PEPSI 7930492 1 1
29
TNH 2.103B LOUNGE COKE 183 8194078 1 1
TRG LOBBY Canteen 66343 1 0
TRG 4 LSIC 750061 1 0
TRG 1 COKE 197 8159581 1 1
TSC PEPSI 3686954 1 1
TSC ENTRANCE COKE 667 8328939 1 1
TTC TENNIS CNTR COKE 106 2132017 1 1
UA9 2.12 COKE 484 8421191 1 1
UIL 1 Canteen 66387 1 0
UIL 1.12 COKE 634 8991786 1 1
UPB 1 Canteen 66336 1 0
UPB VEND AREA COKE 256 2503878 1 1
UPB VEND AREA PEPSI 7932848 1 1
UTA VENDING ROOM PEPSI 8011643 1 1
UTA VENDING ROOM Canteen 67003 1 0
UTA VENDING ROOM COKE 143 2503781 1 1
UTA Vending Room Pepsi 8011643 1 1
UTC 2 Canteen 66282 1 0
UTC 2 LSIC 920013 1 0
UTC 4 LSIC 920025 1 0
UTC 3 LSIC 920026 1 0
UTC 4 COKE 613 2503808 1 1
UTC 3 COKE 291 2503851 1 1
UTC 3 COKE 621 2503929 1 1
UTC 2 COKE 419 2630489 1 1
UTC 2 COKE 459 2735528 1 1
UTC 2 PEPSI 5766548 1 1
UTC 2 PEPSI 5990821 1 1
UTC 2 COKE 133 6460814 1 1
UTC 3 COKE 136 6460820 1 1
UTC 4 PEPSI 7923862 1 1
UTC 2 PEPSI 7930261 1 1
UTC 4 PEPSI 7930421 1 1
UTC 2 PEPSI 7930510 1 1
UTC 3 PEPSI 7951368 1 1
UTC 2 PEPSI 7951375 1 1
UTC 4 PEPSI 7958509 1 1
UTC 3 PEPSI 7958576 1 1
UTC 4 COKE 681 8328914 1 1
UTC 2 COKE 494 8604595 1 1
UTC 2 COKE 495 8604596 1 1
UTC 2 COKE 639 9006699 1 1
WAG 8 COKE 212 2503888 1 1
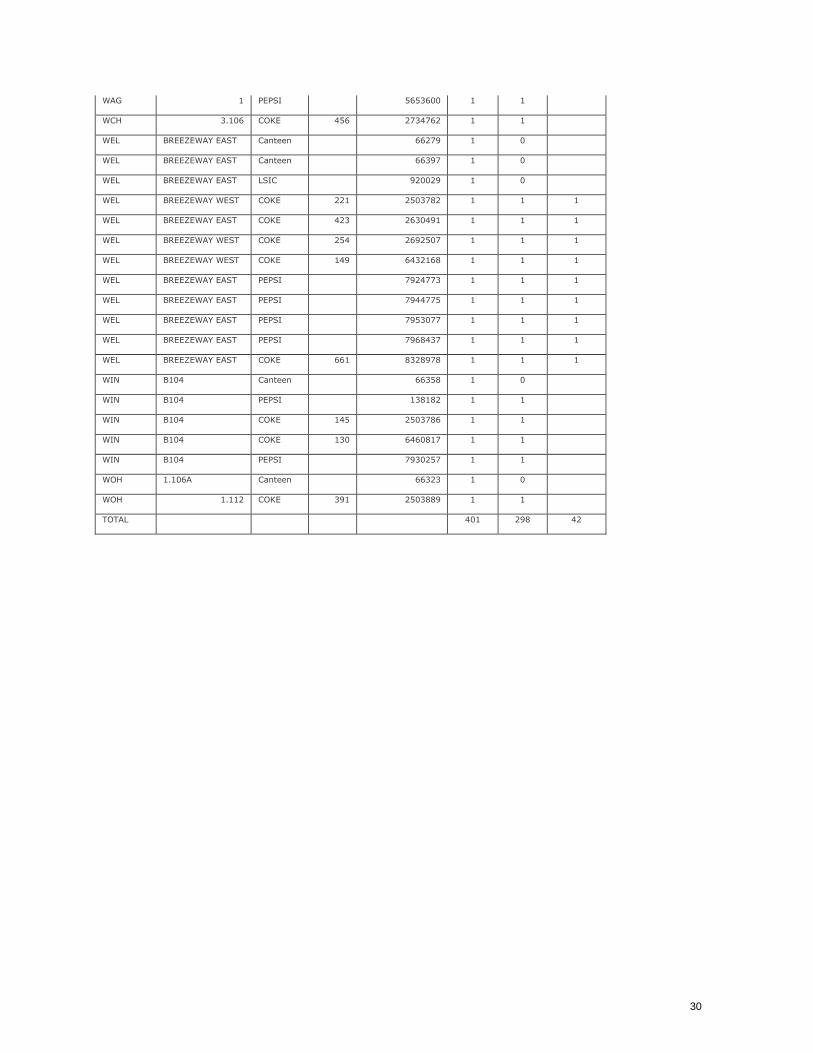
30
WAG 1 PEPSI 5653600 1 1
WCH 3.106 COKE 456 2734762 1 1
WEL BREEZEWAY EAST Canteen 66279 1 0
WEL BREEZEWAY EAST Canteen 66397 1 0
WEL BREEZEWAY EAST LSIC 920029 1 0
WEL BREEZEWAY WEST COKE 221 2503782 1 1 1
WEL BREEZEWAY EAST COKE 423 2630491 1 1 1
WEL BREEZEWAY WEST COKE 254 2692507 1 1 1
WEL BREEZEWAY WEST COKE 149 6432168 1 1 1
WEL BREEZEWAY EAST PEPSI 7924773 1 1 1
WEL BREEZEWAY EAST PEPSI 7944775 1 1 1
WEL BREEZEWAY EAST PEPSI 7953077 1 1 1
WEL BREEZEWAY EAST PEPSI 7968437 1 1 1
WEL BREEZEWAY EAST COKE 661 8328978 1 1 1
WIN B104 Canteen 66358 1 0
WIN B104 PEPSI 138182 1 1
WIN B104 COKE 145 2503786 1 1
WIN B104 COKE 130 6460817 1 1
WIN B104 PEPSI 7930257 1 1
WOH 1.106A Canteen 66323 1 0
WOH 1.112 COKE 391 2503889 1 1
TOTAL 401 298 42