Embed Size (px)
Citation preview

36 IEEE TRANSACTIONS ON NUCLEAR SCIENCE, VOL. 46, NO. 1, FEBRUARY 1999
Region-of-Interest Microtomographyfor Component Inspection
Andrew R. Kalukin, Denis T. Keane, and Wayne G. Roberge
Abstract—The authors describe a novel technique for the non-destructive evaluation of microelectronic components using X-ray microtomography. Existing microtomography systems havespatial resolution of order 1 ���m but require X-ray source bril-liance that would become unachievable at higher resolutions. Theauthors describe an imaging method that reduces the numberof X-ray photons required from the source without degradingthe resolution. The feasibility of the technique is demonstratedthrough a series of computer simulations. The results are verifiedwith real data from synchrotron experiments.
Index Terms—Component inspection, imaging, inspection, mi-croelectronics, microtomography, quality control, X rays.
I. INTRODUCTION
T HE RAPID evolution of microelectronic devices placesstringent demands on the technology of component in-
spection [1]. Advanced devices have tracks and wires thatare commonly less than 1m in size and, as packagingdensities continue to increase, these dimensions will decreasecorrespondingly. Further, the geometry of advanced devicesis extremely complicated, with millions of active elementspackaged in multiple layers with complex interconnections.Unfortunately, none of the inspection techniques which arecurrently available is entirely satisfactory for the evaluationof such devices. Diffraction limits the resolution that canbe obtained with optical inspection methods to1 m. Ex-isting inspection systems based on X-ray transmission andlaminography have resolutions100 m. Electron microscopyand scanning tunneling microscopy (STM) have submicronresolution but limited capabilities for imaging buried circuitsand other multilayered structures.
A promising technology that may circumvent these limita-tions is X-ray microtomography [2]–[7]. X-ray tomography isa noninvasive imaging technique that combines the informa-tion from multiple radiographs to produce three-dimensionalimages of the internal structure of objects. The luminosityand collimation of X-ray tubes limit the resolution that canbe obtained with commercial X-ray tomography systems to
100 m [8]–[10]. However, Grodzins [11] pointed outthat order-of-magnitude improvements in the resolution couldbe obtained by exploiting the high luminosity and collima-
Manuscript received June 2, 1998; revised October 19, 1998. This workwas supported in part by grants to Rensselaer by IBM and the SemiconductorResearch Corporation.
A. R. Kalukin and W. G. Roberge are with Rensselaer Polytechnic Institute,Troy, NY 12180 USA (e-mail: [email protected]).
D. T. Keane is with DND-CAT Synchrotron Research Center, Argonne, IL6043 USA.
Publisher Item Identifier S 0018-9499(99)02189-9.
tion of synchrotron light sources. These improvements weresubsequently realized with the development of the first micro-tomography systems [2], [12]–[18], which used synchrotronand other X-ray sources to make images with 1 m.
Rapid advances in the development of X-ray detectors andbeamlines [19]–[28] now make it possible to contemplatemicrotomography with 10 nm. However, the number ofX-ray photons required to image an object increases rapidlyas decreases (see [3] and also Section II). Consequently,the limits on the resolution that can be obtained with futuresystems are likely to be imposed by the number of photons thatcan be delivered by the X-ray source. In this paper, we describea method for limiting the required brilliance and acquisitiontime by examining only a small “region of interest” (ROI)inside the target object. In Section II, we briefly review theprinciples of X-ray microtomography, including the importantrelation between X-ray flux and resolution. The ROI imagingmethod is described in Section III. Tests of the ROI methodon simulated targets are discussed in Section IV and a “blindtest” of the method using real synchrotron data is described inSection V. Our results are summarized in Section VI.
II. I MAGE RECONSTRUCTION FROM
COMPLETE PROJECTION DATA
Excellent descriptions of the principles of X-ray tomographycan be found in a number of monographs and articles (e.g.,see, [29]–[33]). Here we merely summarize a few points thatare important in the present application. X-ray tomographyreconstructs the spatial distribution of theX-ray attenuationcoefficient inside some object (the “target”). In the simplestexperimental setup, the object is reconstructed as a set ofplanar slices, one of which is illustrated schematically inFig. 1. Let be the number of photons entering the targetalong a particular ray and be the number that reachthe detector without being absorbed or scattered. Accordingto Beer’s Law
(1)
where denotes the path integral along. Noting that eachray is specified by its impact parameterand orientation , wesee that the set of attenuation measurements for all possiblerays can be represented formally by the function
(2)
0018–9499/99$10.00 1999 IEEE

KALUKIN et al.: REGION-OF-INTEREST MICROTOMOGRAPHY 37
Fig. 1. A simple setup for imaging one slice (thex–y plane) of the target(the shaded region). X-ray beams pass from the sourceS to the detectorDalong a straight ray. The ray is specified uniquely by its impact parametertand the orientation� of the source-detector system. Distance along the rayis specified bys.
where and are Cartesian coordinates in a frame rotated byrelative to the – system. The objective of tomography is
to invert (2) to find in terms of .The formal solution of (2) is known as theprojection slice
theorem.1 Consider the Fourier transform of with respectto
(3)
where is spatial frequency in cycles per unit of. Bysubstituting (2) for into (3) and transforming variables from
to , one can easily show that
(4)
where is the Fourier transform of . Equation(4) shows that the Fourier transform of each projection isa one-dimensional slice of space through the origin.The reconstruction of can be performed directly inspace by using the projections at multiple angles to construct
, or in space using various algorithms (e.g.,see, [30]).
The projection slice theorem establishes certain criteriawhich must be satisfied in order to reconstruct a target exactly.Define the radius of the target to be the smallest numbersuch that if . Then for an exactreconstruction: 1) the impact parameters must span the entireinterval ; 2) the target must be band limited; and 3)the projections must be Nyquist sampled: if is the (scalar)bandwidth of , then the sampling intervals inand mustsatisfy and , respectively.
In practice, an additional requirement is imposed by thefact that noise in the projection measurements is generallyamplified by the reconstruction algorithm. Thus, the signal-to-noise in the measurements must be higher than the signal-to-noise which is desired in the reconstructed image. Flanneryand Roberge [3] estimated the number of photons required toreconstruct an image as a function of the desired accuracy, onthe assumption that the measurement errors are dominated byphoton counting noise with Poisson statistics. To reconstruct
1The set ofP� values for all possiblet with � fixed is referred to as the“projection of f at angle�.”
Fig. 2. A truncated projection (solid lines) includes rays inside the ROI (theshaded circle) but omits rays outside it. Lewitt’s truncated projection algorithmaugments the truncated projection with coarsely-spaced rays outside the ROI(dashed lines).
one slice of the target with relative error, the number ofphotons incident on the target cannot be smaller than
(5)
where is the ray spacing, is the size of each pixelin the image, is a characteristic value of the target function,and is a dimensionless coefficient of order unity thatdepends on the reconstruction algorithm. Expression (5) showsthat an order-of-magnitude enhancement in the resolution ofmicrotomography (e.g., from 1 to 0.1m) would requirea thousandfold increase in . It is therefore, attractiveto consider approximate reconstruction methods that requirefewer photons.
III. RECONSTRUCTION FROMTRUNCATED PROJECTIONS
An obvious way to limit is to illuminate just afraction of the target and reconstruct only the illuminatedregion. Suppose, for example, that one only wishes to imagea circle of radius about some point . One might try toaccomplish this by centering the rotation axis onand usinga set of truncated projections, which omits all of the rayswith (Fig. 2). Although truncated projections are“incomplete,” in the sense that the data are insufficient for anexact reconstruction, empirical evidence shows that accurateapproximations to an exact image can be obtained fromincomplete data of various types [34]–[52]. However, it is alsowell known that the images constructed from incomplete datagenerally contain artifacts, the characteristics of which dependboth on the reconstruction algorithm and on the structureof the target [53]–[56]. Because certain artifacts would beunacceptable in component inspection (e.g., spurious breaksin the image of a buried line), it is necessary to test anyalgorithm which is proposed for truncated projection imagingby reconstructing realistic targets.
In this article, we test a truncated projection algorithmsuggested by Lewitt and Bates [45] and described by Nalcioglu
38 IEEE TRANSACTIONS ON NUCLEAR SCIENCE, VOL. 46, NO. 1, FEBRUARY 1999
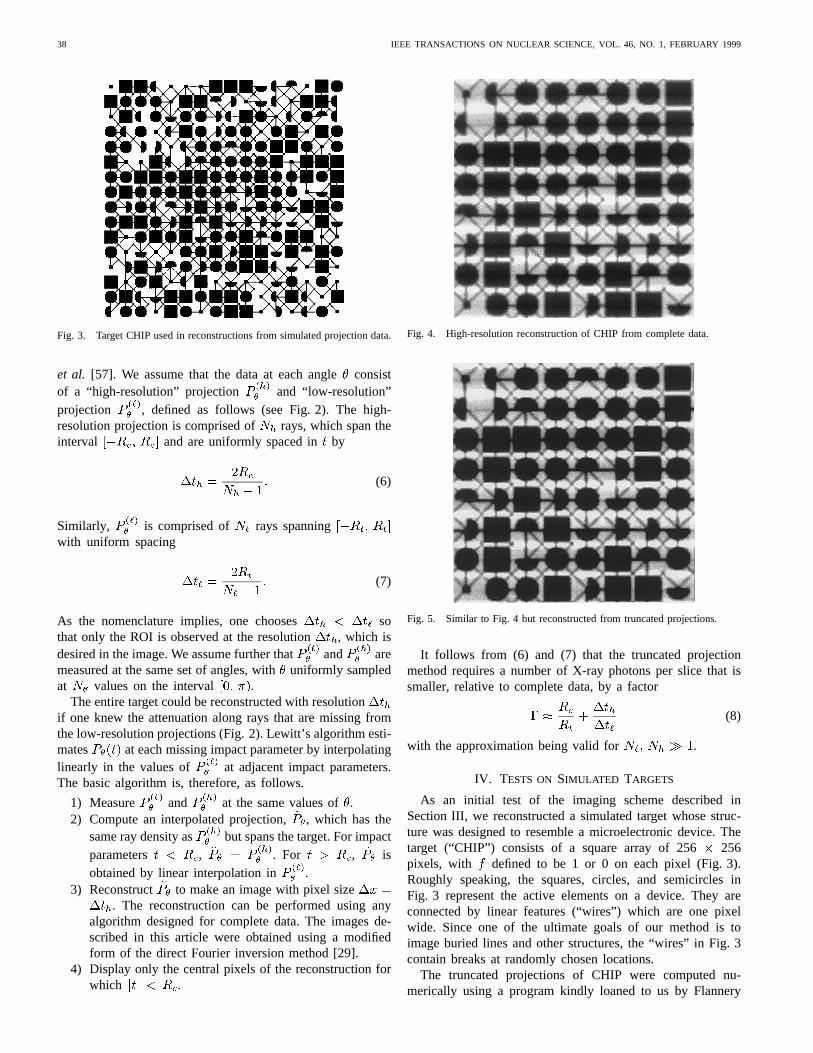
Fig. 3. Target CHIP used in reconstructions from simulated projection data.
et al. [57]. We assume that the data at each angleconsistof a “high-resolution” projection and “low-resolution”projection , defined as follows (see Fig. 2). The high-resolution projection is comprised of rays, which span theinterval and are uniformly spaced inby
(6)
Similarly, is comprised of rays spanningwith uniform spacing
(7)
As the nomenclature implies, one chooses sothat only the ROI is observed at the resolution , which isdesired in the image. We assume further that and aremeasured at the same set of angles, withuniformly sampledat values on the interval .
The entire target could be reconstructed with resolutionif one knew the attenuation along rays that are missing fromthe low-resolution projections (Fig. 2). Lewitt’s algorithm esti-mates at each missing impact parameter by interpolatinglinearly in the values of at adjacent impact parameters.The basic algorithm is, therefore, as follows.
1) Measure and at the same values of.2) Compute an interpolated projection, , which has the
same ray density as but spans the target. For impactparameters , . For , isobtained by linear interpolation in .
3) Reconstruct to make an image with pixel size. The reconstruction can be performed using any
algorithm designed for complete data. The images de-scribed in this article were obtained using a modifiedform of the direct Fourier inversion method [29].
4) Display only the central pixels of the reconstruction forwhich .
Fig. 4. High-resolution reconstruction of CHIP from complete data.
Fig. 5. Similar to Fig. 4 but reconstructed from truncated projections.
It follows from (6) and (7) that the truncated projectionmethod requires a number of X-ray photons per slice that issmaller, relative to complete data, by a factor
(8)
with the approximation being valid for .
IV. TESTS ON SIMULATED TARGETS
As an initial test of the imaging scheme described inSection III, we reconstructed a simulated target whose struc-ture was designed to resemble a microelectronic device. Thetarget (“CHIP”) consists of a square array of 256 256pixels, with defined to be 1 or 0 on each pixel (Fig. 3).Roughly speaking, the squares, circles, and semicircles inFig. 3 represent the active elements on a device. They areconnected by linear features (“wires”) which are one pixelwide. Since one of the ultimate goals of our method is toimage buried lines and other structures, the “wires” in Fig. 3contain breaks at randomly chosen locations.
The truncated projections of CHIP were computed nu-merically using a program kindly loaned to us by Flannery

KALUKIN et al.: REGION-OF-INTEREST MICROTOMOGRAPHY 39
Fig. 6. Pixel gray scale value across several pixels of the reconstructedimages of CHIP.
and reconstructed using the method described in Section III.The low-resolution projections were computed forimpact parameters with equal to the diagonal of the squareimage. Each high-resolution projection consisted ofrays spaced by ; the ROI is, therefore, a circle ofradius centered at the geometrical center of CHIP.Both the high- and low-resolution projections were computedat angles.
Two reconstructions are shown in Figs. 4 and 5. Fig. 4 wasreconstructed from complete data with uniform ray spacing,and Fig. 5 was reconstructed at the same resolution from thetruncated projection dataset described above. Apart from thereconstruction algorithm itself, resetting each of the upper andlower gray scale thresholds to maximize contrast was the onlyimage processing applied to these figures. It is apparent thatthe complete and truncated projection images have similarresolution. This is confirmed in Fig. 6, where we plot thereconstructed functions along several pixels near the middleof CHIP. The black and white pixels in CHIP correspondto and , respectively, so the analogous plotfor the target (the solid curve) has perfectly sharp edges.These edges are blurred in both reconstructions, as one wouldexpect, but Fig. 6 shows that the resolution is essentiallythe same in Figs. 4 and 5. We conclude that the truncatedprojection method does not degrade the resolution significantlycompared to reconstructions from complete data with the sameray spacing.
The only artifacts in Fig. 5 are mild streaks near dis-continuous edges in the target. However, these artifacts arelargely confined to the boundaries of the picture and are notpresent conspicuously in the ROI. Notice that the “wires”are reproduced faithfully, albeit with degraded resolution. Adetailed comparison between Figs. 3 and 5 reveals no spuriousbreaks in the wires and that every break in the target showsup in the image, provided the break is not smaller than theresolution.
V. BLIND TEST
To test the truncated projection method on real data, wecarried out a blind test using synchrotron measurements ac-
Fig. 7. Blind test—high-resolution reconstruction of wire target from com-plete projections.
Fig. 8. Blind test—high-resolution reconstruction of wire target in Fig. 7using truncated projections.
quired by an experimental group at the Brookhaven NationalSynchrotron Light Source. The target consisted of a wiringassembly several millimeters on a side.2 The experimentalgroup acquired a complete set of projection data and con-structed a truncated projection set by discarding the attenuationmeasurements for three out of every four rays outside a ROIradius . In these measurements, was 24 m,and was 6 m. Only the truncated projection data wereprovided to our group.
The image in Fig. 7 was reconstructed from the originalcomplete set of high-resolution projections by the Brookhavengroup. The image in Fig. 8 was reconstructed by us fromthe truncated projections. The bright ring in Fig. 8 is areproducible artifact in full-view reconstructions of band-limited incomplete data with Poisson noise conditions. Thering typically appears tangent to the edge of the reconstructionimage and could be removed, if desired, with appropriatesoftware [54], [56]. However, in other respects the imagesin Figs. 7 and 8 are essentially identical. Both images containstreaks and other artifacts, but the artifacts are the same inboth images. Finally, we note the truncated projection imageused only about half the X-ray photons needed to make thecomplete-data image (Fig. 8).
2Of course, the fact that this target is much larger than the electroniccomponents of ultimate practical interest is of no significance insofar as ourtest is concerned.

40 IEEE TRANSACTIONS ON NUCLEAR SCIENCE, VOL. 46, NO. 1, FEBRUARY 1999
VI. SUMMARY
We have described a method for X-ray microtomographythat reduces the number of photons that would be required forcomponent inspection, hence the data acquisition time and therequired source brilliance. The truncated projection methodmakes it possible to reconstruct a particular region of anobject at high resolution while minimizing the required numberof photons for the rest of the sample. This is accomplishedby augmenting the high-resolution data with artificial dataobtained by interpolation in a low-resolution measurement.We have demonstrated the usefulness of this approach byreconstructing targets from simulated projections and from realsynchroton data. The resolution of a truncated projection is notsignificantly poorer than the resolution of an image made fromcomplete data acquired with the same ray spacing. Further, theartifacts in truncated projection images are acceptable for thetargets of interest in component inspection. The tests reportedin this article demonstrate that truncated projection imagingcan reduce the X-ray photon requirement by a factor of2.Much greater reductions could be obtained, in principle, byrestricting the ROI to a much smaller fraction of the total targetvolume and by carrying out the calculations on machines withlarger RAM capability. Further work on this approach wouldclearly be of value.
ACKNOWLEDGMENT
The authors would like to thank the experimental tomog-raphy group at Exxon Research and Engineering Co. forproviding access to their X-ray beamline.
REFERENCES
[1] M. Minges, Electronics Materials Handbook—Packaging,vol. 1. OH:ASM, 1989, p. 867.
[2] B. P. Flannery, H. W. Deckman, W. G. Roberge, and K. L. D’Amico,“Three-dimensional X-ray microtomography,”Science,vol. 237, pp.1439–1444, Sept. 1987.
[3] B. P. Flannery and W. G. Roberge, “Observation strategies for three-dimensional synchrotron microtomography,”J. Appl. Phys.,vol. 62, no.12, pp. 4668–4674, Dec. 1987.
[4] J. H. Kinney and M. C. Nichols, “X-ray tomographic microscopy(XTM) using synchrotron radiation,”Ann. Rev. Mater. Sci.,vol. 22,pp. 121–152, 1992.
[5] J. H. Kinney, S. R. Stock, M. C. Nichols, U. Bonse, T. M. Breunig, R. A.Saroyan, R. Nusshardt, O. C. Johnson, F. Busch, and S. D. Antolovich,“Nondestructive investigation of damage in composites using X-raytomographic microscopy (XTM),”J. Mater. Res.,vol. 5, no. 5, pp.1123–1129, 1990.
[6] A. Rindby, “Progress in X-ray microbeam spectroscopy,”X-Ray Spec-trometry, vol. 22, pp. 187–191, 1993.
[7] P. Wells, J. R. Davis, B. Suendermann, P. A. Shadbolt, N. Benci, J. A.Grant, D. R. Davies, and M. J. Morgan, “A simple transmission X-raymicrotomography instrument,”Nucl. Instrum. Methods Phys. Res.,vol.B72, pp. 261–270, 1992.
[8] T. Lang, B. H. Hasegawa, S. C. Liew, J. K. Brown, S. C. Blankespoor,S. M. Reilly, E. L. Gingold, and C. E. Cann, “Description of a prototypeemission-transmission computed tomography imaging system,”J. Nucl.Med., vol. 33, pp. 1881–1887, Oct. 1992.
[9] S. A. Larsson, S. Kimiaei, and T. Ribbe, “Simultaneous SPECT andCT with shutter controlled radionuclide sources and parallel collimatorgeometry,”IEEE Trans. Nucl. Sci.,vol. 40, pp. 1117–1122, Aug. 1993.
[10] R. L. Wahl, L. E. Quint, R. D. Cieslak, A. M. Aisen, R. A. Koeppe, andC. R. Meyer, “ ‘Anatometabolic’ tumor imaging: Fusion of FDG PETwith CT or MRI to localize foci of increased activity,”J. Nucl. Med.,vol. 34, no. 7, pp. 1190–1197, July 1993.
[11] L. Grodzins, “Optimum energies for X-ray transmission tomography ofsmall samples,”Nucl. Instrum. Methods,vol. 206, pp. S41–S45, 1983.
[12] D. K. Bowen, J. S. Elliott, S. R. Stock, and S. D. Dover, “X-raymicrotomography with synchrotron radiation,”SPIE X-Ray Imaging II,vol. 691, pp. 94–98, 1986.
[13] K. L. D’Amico, J. H. Dunsmuir, S. R. Ferguson, B. P. Flannery, and H.W. Deckman, “The Exxon microtomography beam line at the NationalSynchrotron Light Source (invited),”Rev. Sci. Instrum.,vol. 63, no. 1,pp. 574–577, Jan. 1992.
[14] K. L. D’Amico, H. W. Deckman, J. H. Dunsmuir, B. P. Flannery, and W.G. Roberge, “X-ray microtomography with monochromatic synchrotronradiation (invited),”Rev. Sci. Instrum.,vol. 60, no. 7, pp. 1524–1526,July 1992.
[15] E. N. Dementyev, I. P. Dolbnya, N. A. Kurylo, N. A. Mezentsev, V. F.Pindyurin, and M. A. Sheromov, “The experimental station for X-raymicroscopy and microtomography at the VEPP-3 storage ring,”Nucl.Instrum. Methods Phys. Res.,vol. A308, pp. 352–355, 1991.
[16] I. P. Dolbnya, G. N. Gavrilov, N. A. Mezentsev, V. F. Pindyurin,and M. A. Sheromov, “X-ray focusing monochromator for an X-rayscanning microscopy and microtomography station,”Nucl. Instrum.Methods Phys. Res.,vol. A308, pp. 416–418, 1991.
[17] P. Spanne and M. L. Rivers, “Computerized microtomography usingsynchrotron radiation from the NSLS,”Nucl. Instrum. Methods Phys.Res.,vol. B24/25, pp. 1063–1067, 1987.
[18] S. R. Stock, J. H. Kinney, T. M. Breunig, U. Bonse, S. D. Antolovich,Q. C. Johnson, and M. C. Nichols, “Synchrotron microtomography ofcomposites,” inMat. Res. Soc. Symp. Proc.,1989, vol. 143, pp. 273–278.
[19] W. S. Haddad, I. McNulty, J. E. Trebes, E. H. Anderson, R. A. Levesque,and L. Yang, “Ultrahigh-resolution X-ray tomography,”Science,vol.266, pp. 1213–1215, 1994.
[20] C. Jacobsen, J. Kirz, and S. Williams, “Resolution in soft X-raymicroscopes,”Ultramicroscopy,vol. 47, pp. 55–79, 1992.
[21] C. Jacobsen, S. Williams, E. Anderson, M. T. Browne, C. J. Buckley, D.Kern, J. Kirz, M. Rivers, and X. Zhang, “Diffraction-limited imaging ina scanning transmission X-ray microscope,”Optics Commun.,vol. 86,pp. 351–364, 1991.
[22] C. Jacobsen,SPIE Soft X-ray Microscopy,vol. 1741, 1993.[23] I. McNulty, W. S. Haddad, J. E. Trebes, and E. H. Anderson, “Soft
X-ray scanning microtomography with submicrometer resolution,”Rev.Sci. Instrum.,vol. 66, no. 2, pp. 1431–1433, Feb. 1995.
[24] I. McNulty, A. Khounsary, Y. P. Feng, Y. Qian, J. Barraza, C. Benson,and D. Shu, “A beamline for 1–4 keV microscopy and coherenceexperiments at the advanced photon source,”Rev. Sci. Instrum.,vol.66, no. 9, pp. 1–4, 1995.
[25] A. G. Michette, G. Morrison, and C. Buckley,X-ray Microscopy, vol.III. New York: Springer-Verlag, 1992.
[26] R. N. Watts, S. D. Liang, Z. H. Levine, T. B. Lucatorto, F. Polack,and M. R. Scheinfein, “A transmission X-ray microscope based onsecondary-electron imaging,”Rev. Sci. Inst.,to be published.
[27] W. Yun, B. Lai, A. Khounsary, Z. Cai, J. Barraza, and D. Leg-nini, “Design of a dedicated beamline for X-ray microfocusing- andcoherence-based techniques at the advanced photon source,”Rev. Sci.Instrum., vol. 67, no. 9, pp. 1–4.
[28] W. Yun, SPIE X-ray Microbeam Technology and Appl.,vol. 2516, 1995.[29] G. T. Herman,Image Reconstruction from Projections: The Fundamen-
tals of Computerized Tomography.New York: Academic, 1980.[30] A. C. Kak and M. Slaney,Principles of Computerized Tomographic
Imaging. New York: IEEE, 1988.[31] R. M. Lewitt and R. H. T. Bates, “Image reconstruction from projec-
tions—I: General theoretical considerations,”Optik, vol. 50, no. 1, pp.19–33, 1978.
[32] , “Image reconstruction from projections—II: Modified back-projection methods,”Optik, vol. 50, no. 2, pp. 85–109, 1978.
[33] F. Natterer, The Mathematics of Computerized Tomography,B. G.Teubner, Ed. New York: Wiley, 1986.
[34] A. H. Andersen, “Algebraic reconstruction in CT from limited views,”IEEE Trans. Med. Imaging,vol. 8, no. 1, pp. 50–55, Mar. 1989.
[35] J. C. Clark, M. R. Palmer, and P. D. Lawrence, “A transformationmethod for the reconstruction of functions from nonuniformly spacesamples,”IEEE Trans. Acoust. Speech Sig. Proc.,vol. ASSP-33, no. 4,pp. 1151–1165, Oct. 1985.
[36] A. M. Darling, T. J. Hall, and M. A. Fiddy, “Stable, noniterative objectreconstruction from incomplete data usinga priori knowledge,”J. Opt.Soc. Am.,vol. 73, no. 11, pp. 1466–1469, Nov. 1983.
[37] M. Defrise, R. Clack, and D. W. Townsend, “Image reconstruction fromtruncated, two-dimensional, parallel projections,”Inverse Problems,vol.11, pp. 287–313, 1995.
[38] J. C. Gore and S. Leeman, “The reconstruction of objects from in-complete projections,”Phys. Med. Biol.,vol. 25, no. 1, pp. 129–136,1980.

KALUKIN et al.: REGION-OF-INTEREST MICROTOMOGRAPHY 41
[39] C. Hamon, C. Roux, J. L. Coatrieux, and R. Collorec, “An analyticalmethod for 3D tomographic reconstruction from a small number ofprojections using a simple interpolation scheme,”ICASSP,vol. 4, pp.1857–1860, 1990.
[40] K. Hanson, “Limited angle CT reconstruction usinga priori informa-tion,” in Proc. ISMIII’82, pp. 527–533.
[41] , “Computed tomographic (CT) reconstruction from limited pro-jection angles,”SPIE Appl. Opt. Inst. in Med. X,vol. 347, pp. 166–173,1982.
[42] B. K. P. Horn, “Density reconstruction using arbitrary ray-samplingschemes,”Proc. IEEE,vol. 66, no. 5, pp. 551–562, 1978.
[43] T. Inouye, “Image reconstruction with limited angle projection data,”IEEE Trans. Nucl. Sci.,vol. NS-26, pp. 2666–2669, Apr. 1979.
[44] R. M. Lewitt, “Processing of incomplete measurement data in computedtomography,”Med. Physics,vol. 6, no. 5, pp. 412–417, Sept./Oct. 1979.
[45] R. M. Lewitt and R. H. T. Bates, “Image reconstruction from projec-tions—III: Projection completion methods (theory),”Optik, vol. 50, no.3, pp. 180–204, 1978.
[46] , “Image reconstruction from projections—IV: Projection com-pletion methods (computational examples),”Optik, vol. 50, no. 4, pp.269–278, 1978.
[47] J. Llacer, “Theory of imaging with a very limited number of projec-tions,” IEEE Trans. Nucl. Sci.,vol. NS-26, no. 1, pp. 596–602, Feb.1979.
[48] A. K. Louis and A. Rieder, “Incomplete data problems in X-raycomputerized tomography,”Numer. Math.,vol. 56, pp. 371–383, 1989.
[49] R. Rangayyan, A. P. Dhawan, and R. Gordon, “Algorithms for limited-view computed tomography: An annotated bibliography and a chal-lenge,” Appl. Optics,vol. 24, no. 23, pp. 4000–4012, Dec. 1985.
[50] P. Reimers, A. Kettschau, and J. Goebbels, “Region-of-interest (ROI)mode in industrial X-ray computed tomography,”NDT Int., vol. 23, no.5, pp. 255–261, Oct. 1990.
[51] M. Soumekh, “Band-limited interpolation from unevenly space sampleddata,” IEEE Trans. Acous., Speech, and Signal Processing,vol. 36, no.1, pp. 110–122, Jan. 1988.
[52] K. C. Tam, J. W. Eberhard, and K. W. Mitchell, “Incomplete-data CTimage reconstructions in industrial applications,”IEEE Trans. Nucl. Sci.,vol. 37, pp. 1490–1499, June 1990.
[53] R. Gordon, “Artifacts in reconstructions made from a few projections,”in Proc. First Int. Joint Conf.,IEEE Computer Society, Washington,DC, 1973, pp. 275–285.
[54] M. Muller and G. R. Arce, “Truncation artifacts in tomographic recon-structions from projections,”Appl. Opt.,vol. 35, no. 20, pp. 3902–3914,July 1996.
[55] P. V. Sankar, O. Nalcioglu, and J. Sklansky, “Undersampling errors inregion-of-interest tomography,”IEEE Trans. Med. Imag.,vol. MI-1, pp.168–178, Nov. 1983.
[56] P. S. Tofts and J. C. Gore, “Some sources of artefact in computedtomography,”Phys. Med. Biol.,vol. 25, no. 1, pp. 117–127, 1980.
[57] O. Nalcioglu, Z. H. Cho, and R. Y. Lou, “Limited field of viewreconstruction in computerized tomography,”IEEE Trans. Nucl. Sci.,vol. NS-26, pp. 546–551, Feb. 1979.