Embed Size (px)
Citation preview

Region of Interest (RoI)
Detection in Ground
Penetrating Radar (GPR) Data2D ENTROPY ANALYSIS
Presenter: Yu Zhang

AutobiographyRESEARCH INTERESTS
2
Autobiography
University of Vermont
Doctor of Philosophy (Ph.D.) in Electrical Engineering
2012 – Present
Advisor: Dr. Tian Xia
Huazhong University of Science and Technology
Bachelor of Science (B.S.) in Electrical Engineering
2008 – 2012
3

Research Interests
Compressive OFDM GPR
Tx Rx
Rebar
Concrete
30% Compression
5% Compression
Full OFDM Spectrum
4

Research Interests
Synthetic Aperture Radar (SAR)
based GPR imaging
Cylinder
Triangle
Rectangle
Test Scenario Regular GPR B-Scan Image GPR-SAR B-Scan Image
5

Research Interests
Low-Rank and Sparse Representation in
GPR and Through-the-Wall Radar Imaging
Test Scenario GPR B-Scan
Regular Clutter Removal
L + S Representation
6

Research Interests
GPR Signal Processing related
Problems
Image De-noising
Clutter Removal
Image Migration
Region of Interest (RoI) Detection
7

IntroductionWHY GPR, GPR OPERATING MECHANISM & OUR
GPR SYSTEM
8

Why GPR?
Non-destructive evaluation (NDE) of transportation
infrastructure.
GPR as a highly efficient NDE method:
Concrete bridge deck inspection;
Asphalt pavement monitoring;
Highway rebar detection;
Railroad ballast condition assessment,
Soil moisture estimation.
9

GPR Operating
Mechanism
Subsurface medias of different dielectric constants
Each position: A-Scan trace
Assemble all A-Scan traces: B-Scan image
10

Home made GPR System
Ultra-wide band (UWB) pulse generator
UWB antenna
High speed digitizer configuration
Wheel encoder
FPGA controller
PC & LabVIEW user interface
11

Prototype 12

Xia & Huston sitting on GPR 13
A ROBUST system package that can hold two adults’ weight!!!

Air-coupled Impulse GPR
System Specifications
Data acquisition unit 8 Gsps, 10-bit resolution
Sampling window width 40 ns
Pulse repetition frequency 0 to 30 kHz tunable
Horizontal resolution 1 cm at 60 miles/h survey speed
Signal bandwidth 600 MHz to 2 GHz tunable
Penetrating capability Up to 1 meter
14

Today’s TopicROI DETECTION IN GPR DATA USING 2-D ENTROPY
15

Why 2-D Entropy
Large volume (overall 20 miles) railroad GPR data set
collected during the field test at Metro St. Louis and
Massachusetts Bay Transit Authority.
Data collection in St. Louis Forest Park Station to Sunnen Station
High resolution GPR system brings us ~300 GB data.
How to process such large volume data???
16

Why 2-D Entropy
Large data volume
Sophisticated data processing is too computationally
complex and even infeasible
Properties of subsurface scatters or material are too
complex
Obtain of prior knowledge or training data is unrealistic
It is desirable to
Develop an unsupervised and automatic GPR data
processing method that can effectively and rapidly
identify suspicious features from big radargram
17

First Glance at 2-D
Entropy Analysis
Entropy is a measure of the uncertainty associated
with a random variable.
Entropy characterization is explored to identify singular
regions within a large GPR data set
High entropy value indicates high similarity
Low entropy value specifies high singularity
18

What do we have in a GPR
railroad B-Scan image
19
Noises Clutter
Cross-ties
or Sleepers
Useless
Background
Multiple Peaks from
one Scattering

Unsupervised GPR RoI
Detection based on Entropy
Raw Data
Stacking Every 50 Traces
Low Pass Filter
Hilbert Transform
A-Scan Decomposition
Region of Interest
2-D Entropy Analysis
Stacking Every 10 Trace
Clutter Removal
Subsurface Identification
Pre-processingPower Information
Characterization
Subsurface
Identification
B-Scan Image EnhancementRoI Detection
20

Pre-Processing
Step 1: Stack every 50 A-scan traces to calculate the
average to boost the signal-to-noise ratio (SNR).
o The selection of 50 traces for calculation considers the
balance between the obtainable image resolution and
noise reduction performance
Step 2: Apply Low Pass Filtering (LPF) with a 2 GHz
cutoff frequency.
o GPR transmission signal’s frequency: 600 MHz – 2 GHz
21
Power Information
Characterization
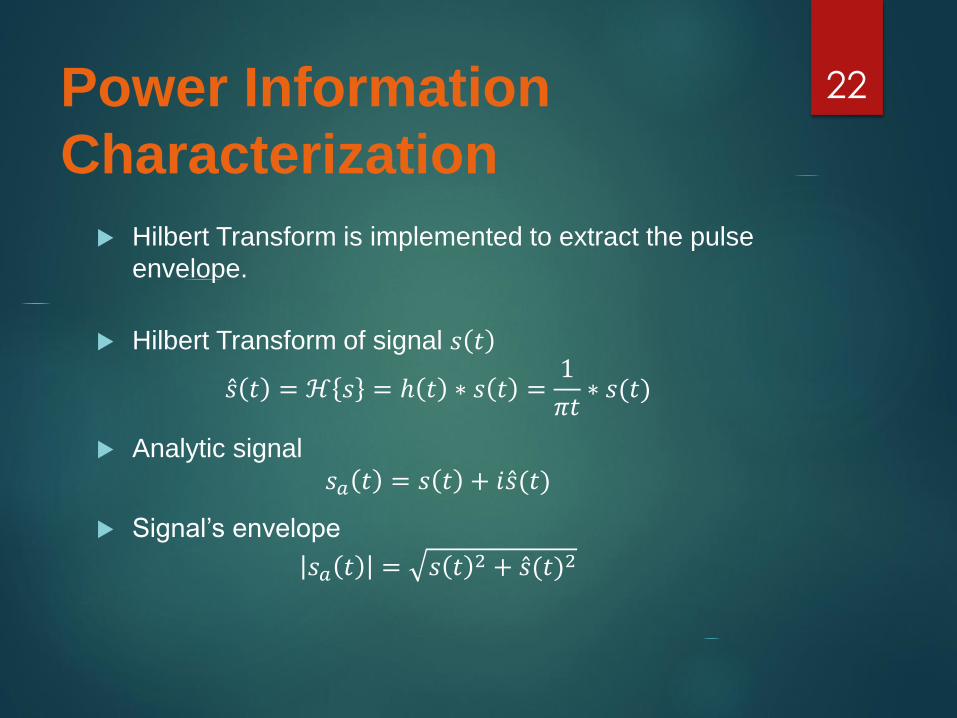
Hilbert Transform is implemented to extract the pulse
envelope.
Hilbert Transform of signal 𝑠 𝑡
𝑠 𝑡 = ℋ 𝑠 = ℎ 𝑡 ∗ 𝑠 𝑡 =1
𝜋𝑡∗ 𝑠(𝑡)
Analytic signal
𝑠𝑎 𝑡 = 𝑠 𝑡 + 𝑖 𝑠(𝑡)
Signal’s envelope
𝑠𝑎 𝑡 = 𝑠 𝑡2 + 𝑠(𝑡)2
22

Power Information
Characterization (con.)
Ricker wavelet source – 3 peaks
1st pulse - antennas’ direct coupling
2nd pulse - reflection signal from 1st scatter
3rd pulse – reflection signal from 2nd scatter
GPR A-Scan trace GPR A-Scan envelope
23

Subsurface Identification
A-Scan decomposition is performed to isolate
subsurface layer and narrow down the scope of data
Transmitter and receiver antennas’ direct coupling
pulse as the reference signal
By performing iterative cross correlations, an A-Scan
waveform is decomposed into the combinations of
multiple pulses of varying amplitude and phases
characterizing the reflection signals from different
scatters
24

Subsurface Identification
(con.)
Direct coupling signal 1st backscattering pulse 2nd backscattering pulse
25

B-Scan Image
Enhancement
Step 1: Remove the background signal using a 2-D
High Pass Filter (HPF)
o In horizontal direction, the frequency bandwidth of clutter
is much narrower than that of subsurface scattering
signals.
Step 2: Stack every 10 A-scan traces
o Further improve signal SNR as well as reduce data
volume and redundancy
26

Renyi’s Entropy
GPR backscattering signal 𝑌 𝑡 can be modeled as
𝑌 𝑡 = 𝐷 𝑡 + 𝑆(𝑡)
𝐷 𝑡 - reflection signal from objects of interest, 𝑆(𝑡) -
background signals.
Power normalization is first performed
𝑦𝑖 𝑡 =𝑌𝑖(𝑡)
2
𝑖=1𝑀 𝑌𝑖(𝑡)
2
𝑦𝑖 𝑡 - normalized signal, 𝑖 - trace index, 𝑀 – total
number of traces included, 𝑡 - time index of data points on
each trace.
Renyi’s entropy: 𝐸𝛼 𝑡 =1
1−𝛼loge 𝑖=1
𝑀 𝑦𝑖 𝑡𝛼
𝛼 – the entropy order. (𝛼 = 3 here)
27

2-D Entropy Based RoI
Detection
Step 1: 2-D Renyi entropy calculation
Step 2: Entropy curve smoothing using moving average
method:
𝐸𝑠𝑚𝑜𝑜𝑡ℎ 𝑛 =1
𝑚
𝑖=𝑛−𝑚+1
𝑛
𝐸(𝑖)
𝐸(𝑖) – entropy value of 𝑖th data in entropy sequence, 𝑚 is
selected as 5% of the total number of entropy data points
o Optimal smoothing performance as well as data resolution
Step 3: Adaptive entropy threshold determination using OTSU
method.
o Minimize inner-group variance & maximize inter-group variance
28

Lab Experiment
Railroad ballast test platform Side view for the subsurface structure
The ballast layer of 0.3 meters thickness is laid above the
soil
0.75 meters apart from the left end of the platform, an
area of 0.45 meters length and 0.2 meters depth is filled
with the fouled ballast, which is a mixture of sand, ballast,
and water
29
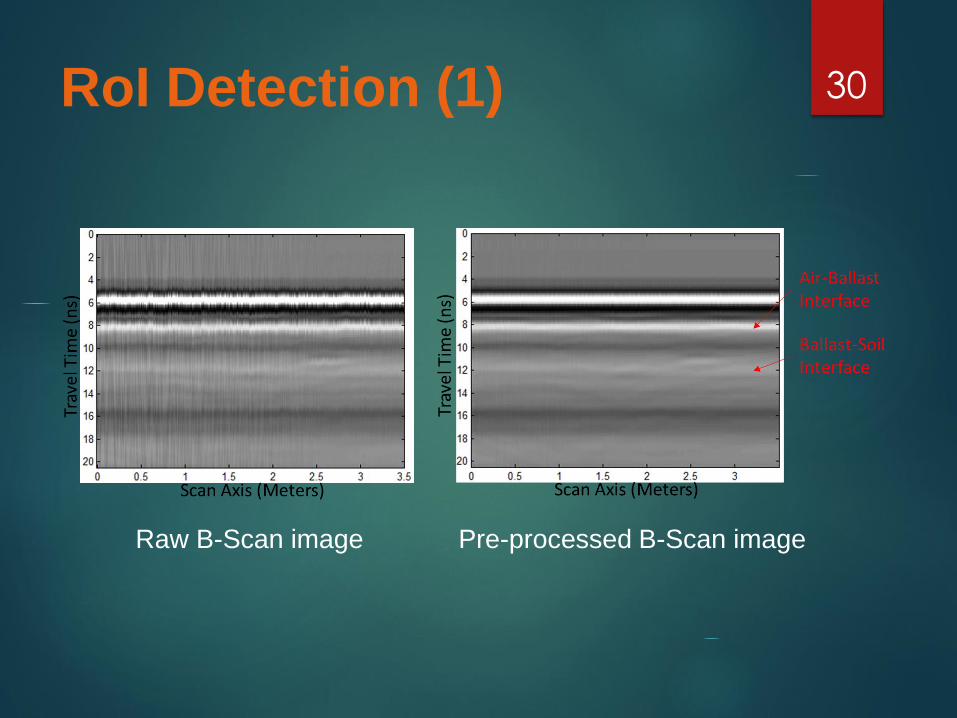
RoI Detection (1)
Raw B-Scan image Pre-processed B-Scan image
30

RoI Detection (2)
Signal Envelope Signal Decomposition
31

RoI Detection (3)
Ballast layer image Enhanced B-Scan
ballast layer image
32

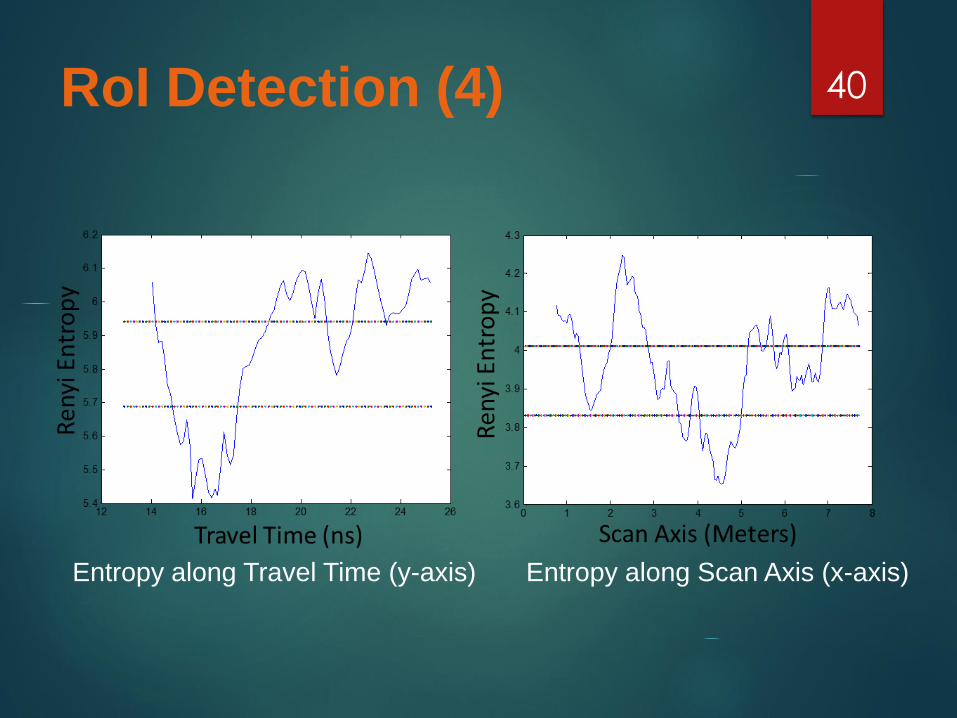
RoI Detection (4)
Entropy along Travel Time (y-axis) Entropy along Scan Axis (x-axis)
33

RoI Detection (5)
RoI Detection Result based on 2-D Entropy analysis
34

Railroad Ballast Field Test
Home made GPR system mounted on vehicle during field tests
35

Test Sites
Metro St. Louis MetroLink blue line
(1:00~4:00 am)
Railroad ballast
36

RoI Detection (1)
Raw B-Scan image Pre-processed B-Scan image
37

RoI Detection (2)
Signal Envelope Cross-tie marked by
signal decomposition
38

RoI Detection (3)
Ballast layer image Enhanced B-Scan
ballast layer image
39
RoI Detection (4)
Entropy along Travel Time (y-axis) Entropy along Scan Axis (x-axis)
40

RoI Detection (5)
Suspicious fouled ballast regions marked by white rectangle
41

Conclusions
The unsupervised automatic ROI detection method
developed in this study can effectively identify regions
of interest in subsurface for further in-depth analysis.
The proposed unsupervised automatic GPR data
processing algorithm has been effectively applied to
laboratory and field test data.
The analysis results prove that the proposed algorithm
can correctly identify the region of interest and can
accurately measure the region’s location.
42

Future Work
Local entropy & multi-scale entropy analysis
43

Q & A?
Q&A?
44