Embed Size (px)
Citation preview

Page | 1
Regional chapter from the Creative Industries
Environmental Scan
Developed by the GRLLEN & Creative Geelong Inc.

Page | 2
The G21 Region Creative Industries
Barwon South West Region
The G21 Region, which is the subject of this report, sits within the larger Barwon South
West Region, which also includes the Great South Coast.
Figure 1 - Barwon South West Region
Regional Development Victoria describes the Barwon South West region as:
“stretch[ing] from the tip of the Queenscliff Heads to the border of South
Australia. It is home to Victoria’s largest regional city, Geelong. The
region has access to a deep-water port at Portland, an established rail
network with interstate connections and several commercial airports. The
picturesque Great Ocean Road is a feature of the region. With its inviting
coastal towns, spectacular rainforests and iconic farming districts the
Barwon South West region is an ideal location to live, work and invest”1.
In 2013, Essential Economics Pty. Ltd. was contracted by Jennifer Cromarty, Socom Pty
Ltd via funding from Rural Councils Victoria, to undertake an analysis of the contribution
made to the Victorian economy by the creative industries located in the rural parts of the
state covered by Rural Councils Victoria. It should be noted that the City of Greater
Geelong is not included in the report, so the Barwon South West data presented here
excludes the Geelong information.
Figure 2 - Rural locations covered by Essential Economics2
1 http://www.rdv.vic.gov.au/victorian-regions/barwon-south-west 2 Essential Economics Pty. Ltd., 2013, Creative Industry in Rural Victoria, p. 7
Page | 3
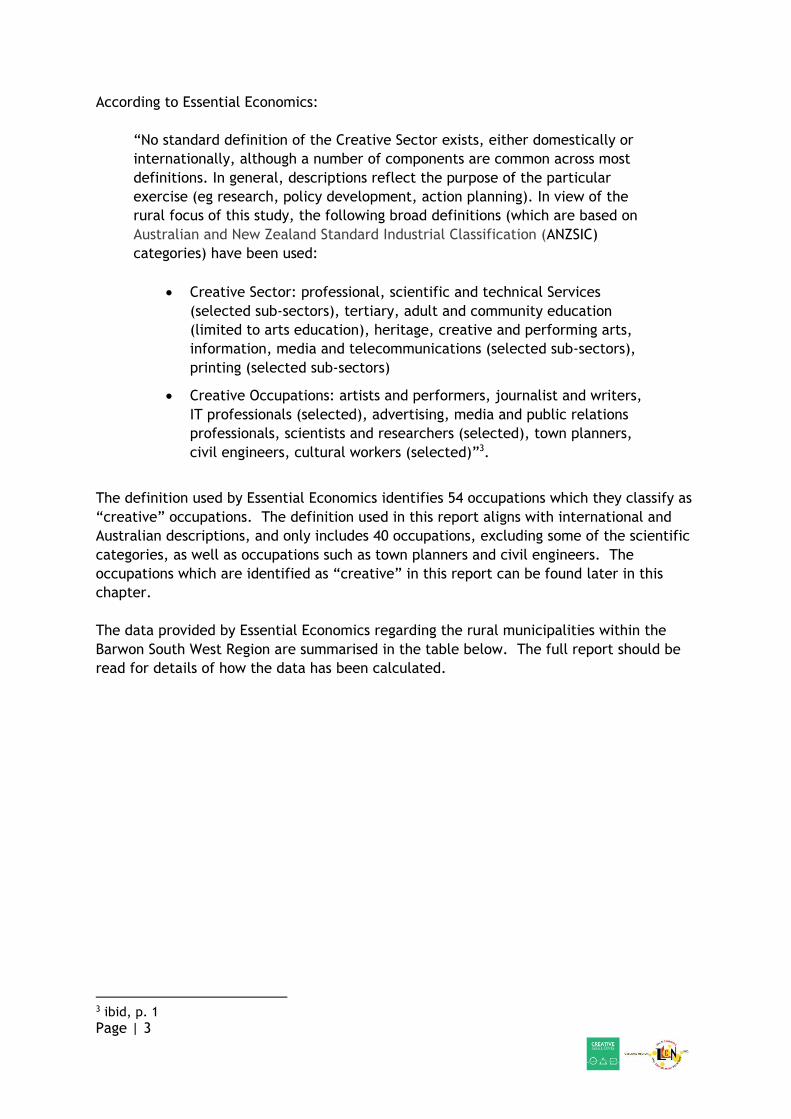
According to Essential Economics:
“No standard definition of the Creative Sector exists, either domestically or
internationally, although a number of components are common across most
definitions. In general, descriptions reflect the purpose of the particular
exercise (eg research, policy development, action planning). In view of the
rural focus of this study, the following broad definitions (which are based on
Australian and New Zealand Standard Industrial Classification (ANZSIC)
categories) have been used:
• Creative Sector: professional, scientific and technical Services
(selected sub-sectors), tertiary, adult and community education
(limited to arts education), heritage, creative and performing arts,
information, media and telecommunications (selected sub-sectors),
printing (selected sub-sectors)
• Creative Occupations: artists and performers, journalist and writers,
IT professionals (selected), advertising, media and public relations
professionals, scientists and researchers (selected), town planners,
civil engineers, cultural workers (selected)”3.
The definition used by Essential Economics identifies 54 occupations which they classify as
“creative” occupations. The definition used in this report aligns with international and
Australian descriptions, and only includes 40 occupations, excluding some of the scientific
categories, as well as occupations such as town planners and civil engineers. The
occupations which are identified as “creative” in this report can be found later in this
chapter.
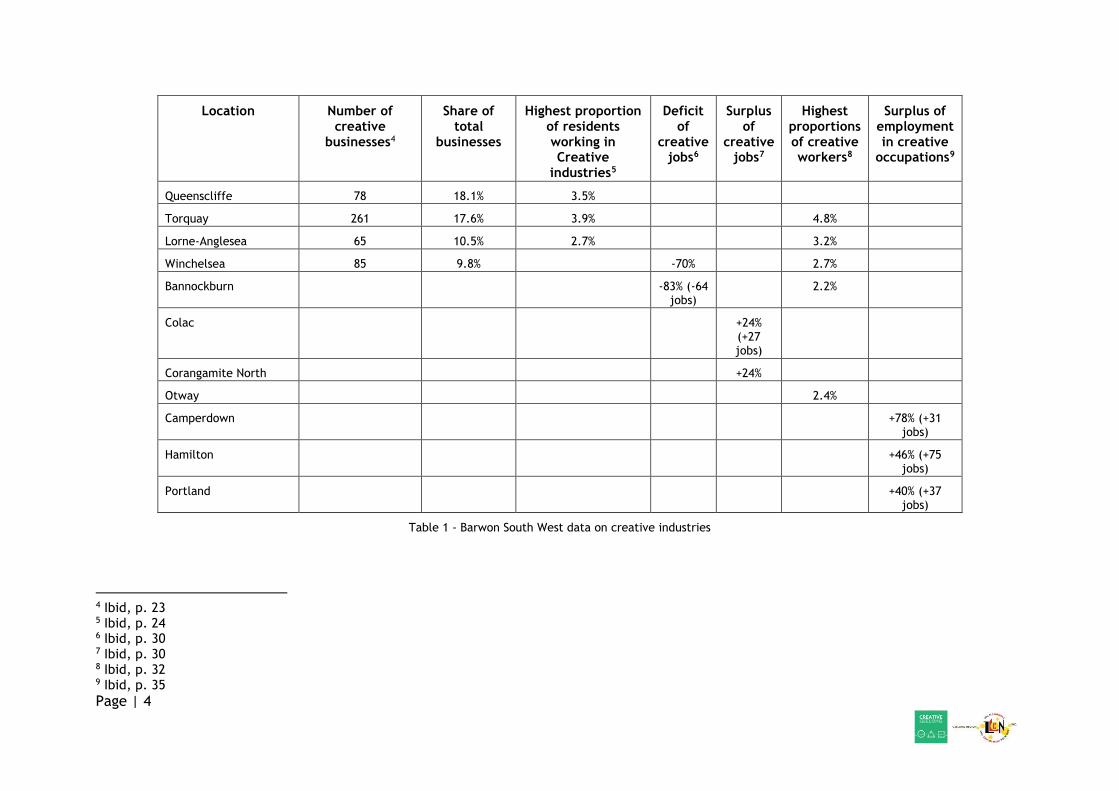
The data provided by Essential Economics regarding the rural municipalities within the
Barwon South West Region are summarised in the table below. The full report should be
read for details of how the data has been calculated.
3 ibid, p. 1
Page | 4
Location Number of creative
businesses4
Share of total
businesses
Highest proportion of residents working in Creative
industries5
Deficit of
creative jobs6
Surplus of
creative jobs7
Highest proportions of creative workers8
Surplus of employment in creative
occupations9
Queenscliffe 78 18.1% 3.5%
Torquay 261 17.6% 3.9% 4.8%
Lorne-Anglesea 65 10.5% 2.7% 3.2%
Winchelsea 85 9.8% -70% 2.7%
Bannockburn -83% (-64 jobs)
2.2%
Colac +24% (+27 jobs)
Corangamite North +24%
Otway 2.4%
Camperdown +78% (+31 jobs)
Hamilton +46% (+75 jobs)
Portland +40% (+37 jobs)
Table 1 - Barwon South West data on creative industries
4 Ibid, p. 23 5 Ibid, p. 24 6 Ibid, p. 30 7 Ibid, p. 30 8 Ibid, p. 32 9 Ibid, p. 35

Page | 5
The G21 Region
As stated earlier in this report, the fact that there is no specific ANZSIC category for the creative industries makes it difficult to gain access to truly accurate data in many cases. For example, the creative industries sit within the ANZSIC categories of Information Media and Telecommunications; Professional, Scientific and Technical Services; and Arts and Recreation Services. However, there are components of these sectors which do not classify as “creative”. For example, the hardware installation and maintenance aspects of the ICT industry are not creative, nor is much of the scientific and technical components of the Professional group. As well, the Arts and Recreation category also includes sport and gambling. Much of the data in this section of the report should therefore be considered indicative rather than specifically accurate, as it does not allow analysis at the lower levels of the ANZSIC groupings. The table below shows the ABS Business Count data on businesses in the above three ANZSIC groupings in the G21 Region with regard to their location of business registration. This data shows that, in 2015, there were 5,252 businesses in the G21 Region which were associated with the industry. Whilst recognising that some of these businesses sit within the “non-creative” parts of the sectors, this figure nevertheless indicates the importance of the creative industries to the region.
Information Media and
Telecommunications
Professional, Scientific
and Technical Services
Arts and Recreation Services
Total
Bannockburn 6 30 6 42
Golden Plains - South 3 38 5 46
Southern Golden Plains 9 68 11 88
Belmont 3 77 10 90
Corio - Norlane 3 47 7 57
Geelong 25 336 31 392
Geelong West - Hamlyn Heights 7 145 17 169
Grovedale 3 90 7 100
Highton 11 212 15 238
Lara 6 113 17 136
Leopold 4 42 9 55
Newcomb - Moolap 3 50 8 61
Newtown (Vic.) 4 136 16 156
North Geelong - Bell Park 0 96 11 107
Clifton Springs 0 76 8 84
Ocean Grove - Barwon Heads 17 202 28 247
Portarlington 7 47 3 57
CoGG 93 1,669 187 1,949
Queenscliff 6 53 16 75
Queenscliff 6 53 16 75 Winchelsea 21 245 23 289
Lorne - Anglesea 0 47 14 61
Torquay 7 60 12 79

Page | 6
Surf Coast 28 352 49 429
Colac 3 41 11 55
Colac Region 3 22 5 30
Colac Otway 6 63 16 85
Total 284 4,410 558 5,252
Table 2 - ABS Business Count by location of business registration10
REMPLAN
This section of the Environmental Scan provides quantitative data taken from the
economic modelling software used by Councils in the G21 Region – REMPLAN. Whilst the
Borough of Queenscliffe does not subscribe to REMPLAN, the G21 Alliance does and this
has enabled analysis to determine the overall data for the G21 Region, as well as the
individual data for each of the five municipalities which make up the region.
The data provided by REMPLAN includes economic and labour force information which, at
the time of this research, REMPLAN extracted from the following sources:
• ABS 2011 Census Journey To Work Employment
• ABS 2012 / 2013 National Input Output Tables
• ABS June 2014 Gross State Product
As can be seen, much of the REMPLAN data used in this report is now getting dated,
particularly that information based on the 2011 Census. The intent is to update these
Scans after the 2016 Census data is released in mid-2017.
The data provided in this section of the report relates to the overall G21 Region. Data for
each of the municipalities within the region can be found in the Appendices.
Economic data
According to REMPLAN, the total output estimate for the G21 Region is $29.609,251 billion11. As with the data in the previous section, REMPLAN does not allow analysis at the lowest level of the ANZSIC categories to enable truly accurate representation of the contribution made by the Creative Industries to the regional economy. Data relating to Professional, Scientific & Technical Services; Art, Sports, Adult, Community & Other Education; and Library & Other Information Services will be particularly problematic due
10 ABS, 2015, 81650 Counts of Australian Businesses, including Entries and Exits, http://www.abs.gov.au/AUSSTATS/[email protected]/DetailsPage/8165.0Jun%202011%20to%20Jun%202015?OpenDocument 11 REMPLAN defines “Output data” as ‘the gross revenue generated by businesses/organisations in each of the industry sectors in a defined region. Gross revenue is also referred to as total sales or total income’.

Page | 7
to the fact that these sectors contain a number of sub-industries that are not classified as “creative”. However, this data is somewhat more detailed than the previous section, and the descriptor “Creative Industries” will be used despite the discrepancies in accurate data. The Creative Industries sectors contribute $1.631,215 billion or 5.5% to the overall regional output as follows:
Professional, Scientific & Technical Services
$1,033.529 3.5%
Publishing (except Internet & Music Publishing)
$169.695 0.6%
Computer Systems Design & Related Services
$150.993 0.5%
Motion Picture & Sound Recording
$60.632 0.2%
Arts, Sports, Adult, Community & Other Education
$53.458 0.2%
Broadcasting (except Internet)
$44.720 0.2%
Heritage, Creative & Performing Arts
$42.159 0.1%
Printing (inc. reproduction of recorded media)
$39.818 0.1%
Internet Publishing, Broadcast, Websearch & Data Services
$21.688 0.1%
Library & Other Information Services
$14.523 0.0%
Table 3 - Output estimate for the G21 Region
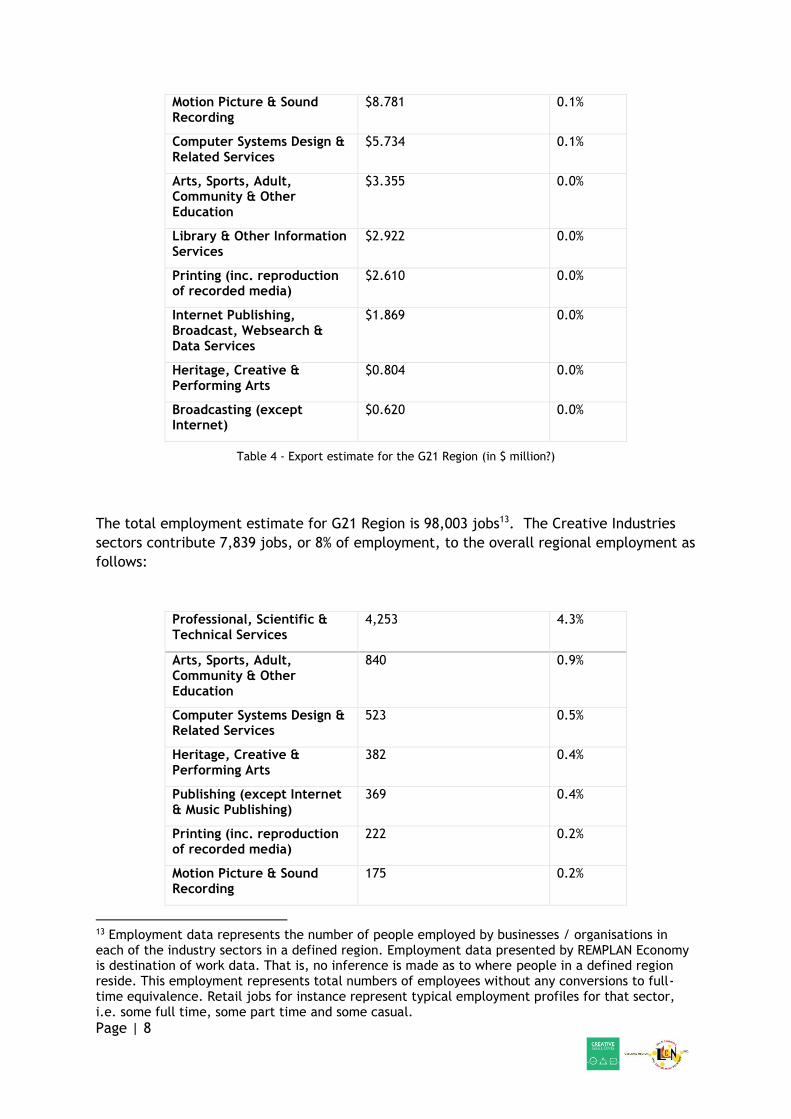
The total regional export estimate for G21 Region is $8.811,436 billion12. The Creative
Industries sectors contributes $150,579,000 (or $150.579 Million) or 1.7% to the overall
regional export estimate as follows:
Professional, Scientific & Technical Services
$83.735 1.0%
Publishing (except Internet & Music Publishing)
$40.149 0.5%
12 Regional export is defined as the goods and services produced by industry sectors in G21 Region which are sold to consumers, businesses, and governments based outside the region's boundaries.
Page | 8
Motion Picture & Sound Recording
$8.781 0.1%
Computer Systems Design & Related Services
$5.734 0.1%
Arts, Sports, Adult, Community & Other Education
$3.355 0.0%
Library & Other Information Services
$2.922 0.0%
Printing (inc. reproduction of recorded media)
$2.610 0.0%
Internet Publishing, Broadcast, Websearch & Data Services
$1.869 0.0%
Heritage, Creative & Performing Arts
$0.804 0.0%
Broadcasting (except Internet)
$0.620 0.0%
Table 4 - Export estimate for the G21 Region (in $ million?)
The total employment estimate for G21 Region is 98,003 jobs13. The Creative Industries
sectors contribute 7,839 jobs, or 8% of employment, to the overall regional employment as
follows:
Professional, Scientific & Technical Services
4,253 4.3%
Arts, Sports, Adult, Community & Other Education
840 0.9%
Computer Systems Design & Related Services
523 0.5%
Heritage, Creative & Performing Arts
382 0.4%
Publishing (except Internet & Music Publishing)
369 0.4%
Printing (inc. reproduction of recorded media)
222 0.2%
Motion Picture & Sound Recording
175 0.2%
13 Employment data represents the number of people employed by businesses / organisations in each of the industry sectors in a defined region. Employment data presented by REMPLAN Economy is destination of work data. That is, no inference is made as to where people in a defined region reside. This employment represents total numbers of employees without any conversions to full-time equivalence. Retail jobs for instance represent typical employment profiles for that sector, i.e. some full time, some part time and some casual.
Page | 9
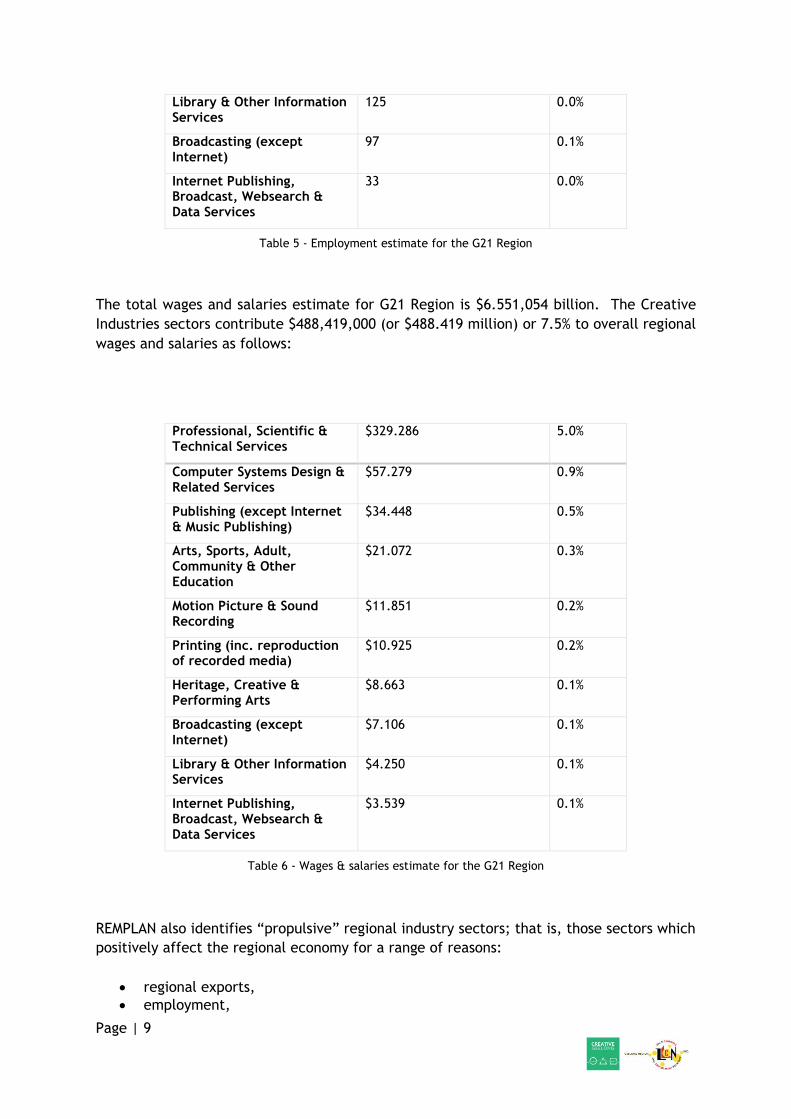
Library & Other Information Services
125 0.0%
Broadcasting (except Internet)
97 0.1%
Internet Publishing, Broadcast, Websearch & Data Services
33 0.0%
Table 5 - Employment estimate for the G21 Region
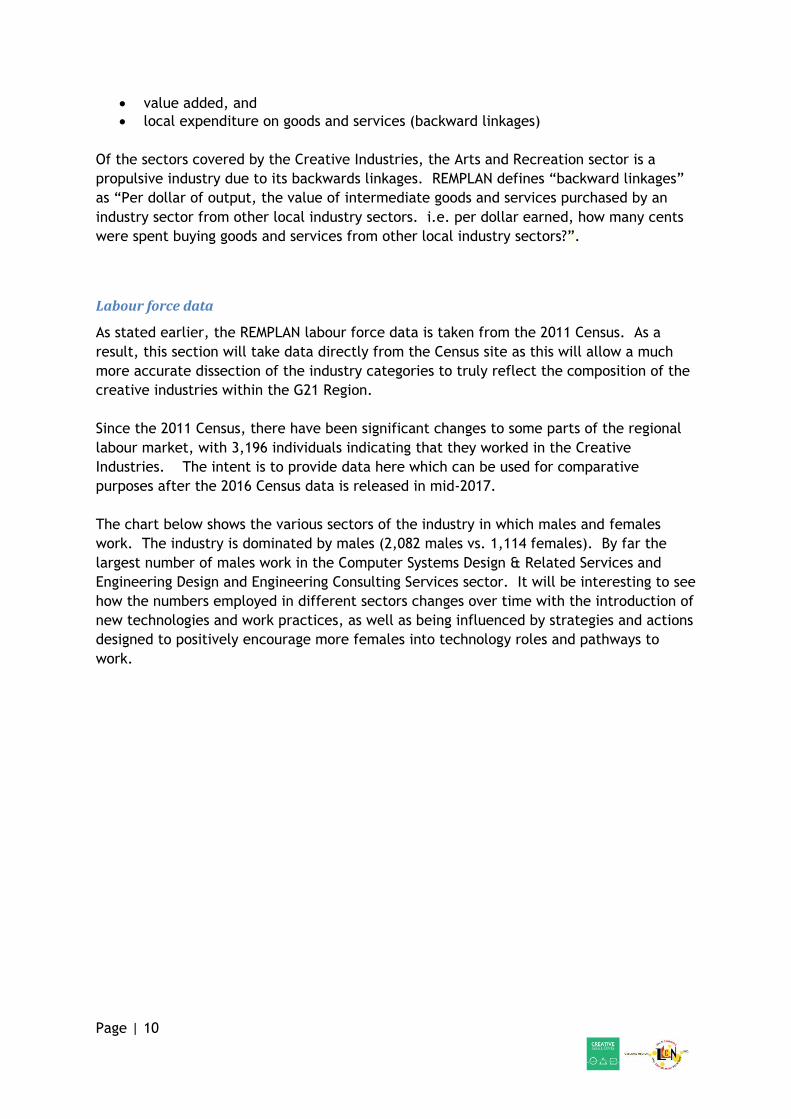
The total wages and salaries estimate for G21 Region is $6.551,054 billion. The Creative
Industries sectors contribute $488,419,000 (or $488.419 million) or 7.5% to overall regional
wages and salaries as follows:
Professional, Scientific & Technical Services
$329.286 5.0%
Computer Systems Design & Related Services
$57.279 0.9%
Publishing (except Internet & Music Publishing)
$34.448 0.5%
Arts, Sports, Adult, Community & Other Education
$21.072 0.3%
Motion Picture & Sound Recording
$11.851 0.2%
Printing (inc. reproduction of recorded media)
$10.925 0.2%
Heritage, Creative & Performing Arts
$8.663 0.1%
Broadcasting (except Internet)
$7.106 0.1%
Library & Other Information Services
$4.250 0.1%
Internet Publishing, Broadcast, Websearch & Data Services
$3.539 0.1%
Table 6 - Wages & salaries estimate for the G21 Region
REMPLAN also identifies “propulsive” regional industry sectors; that is, those sectors which
positively affect the regional economy for a range of reasons:
• regional exports,
• employment,
Page | 10
• value added, and
• local expenditure on goods and services (backward linkages)
Of the sectors covered by the Creative Industries, the Arts and Recreation sector is a
propulsive industry due to its backwards linkages. REMPLAN defines “backward linkages”
as “Per dollar of output, the value of intermediate goods and services purchased by an
industry sector from other local industry sectors. i.e. per dollar earned, how many cents
were spent buying goods and services from other local industry sectors?”.
Labour force data
As stated earlier, the REMPLAN labour force data is taken from the 2011 Census. As a
result, this section will take data directly from the Census site as this will allow a much
more accurate dissection of the industry categories to truly reflect the composition of the
creative industries within the G21 Region.
Since the 2011 Census, there have been significant changes to some parts of the regional
labour market, with 3,196 individuals indicating that they worked in the Creative
Industries. The intent is to provide data here which can be used for comparative
purposes after the 2016 Census data is released in mid-2017.
The chart below shows the various sectors of the industry in which males and females
work. The industry is dominated by males (2,082 males vs. 1,114 females). By far the
largest number of males work in the Computer Systems Design & Related Services and
Engineering Design and Engineering Consulting Services sector. It will be interesting to see
how the numbers employed in different sectors changes over time with the introduction of
new technologies and work practices, as well as being influenced by strategies and actions
designed to positively encourage more females into technology roles and pathways to
work.

Page | 11
Chart 1 – Creative Industry sectors by gender
The following charts show demographic data for age, occupation, education, hours worked
and income.
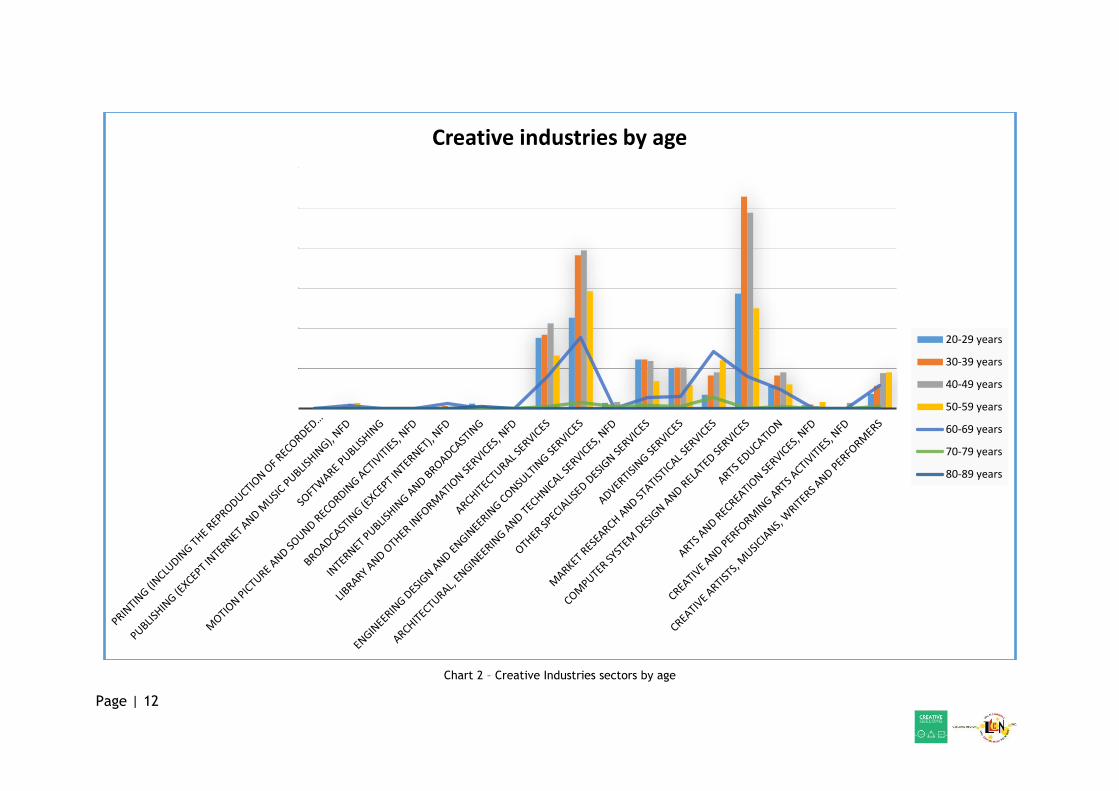
Age
The chart below shows the breakup of those working in the Creative Industries by different age cohorts. Due to the varied nature of sectors within the Creative Industries, it is not surprising that there is a wide spread of age cohorts represented. As would be expected, the computer systems design sector is dominated by younger people.
0 100 200 300 400 500 600 700 800 900
Printing (including the Reproduction of Recorded…
Publishing (except Internet and Music Publishing), nfd
Software Publishing
Motion Picture and Sound Recording Activities, nfd
Broadcasting (except Internet), nfd
Internet Publishing and Broadcasting
Library and Other Information Services, nfd
Architectural Services
Engineering Design and Engineering Consulting Services
Architectural, Engineering and Technical Services, nfd
Other Specialised Design Services
Advertising Services
Market Research and Statistical Services
Computer System Design and Related Services
Arts Education
Arts and Recreation Services, nfd
Creative and Performing Arts Activities, nfd
Creative Artists, Musicians, Writers and Performers
G21 Creative Industries by gender
Male Female
Page | 12
Chart 2 – Creative Industries sectors by age
Creative industries by age
20-29 years
30-39 years
40-49 years
50-59 years
60-69 years
70-79 years
80-89 years
Page | 13
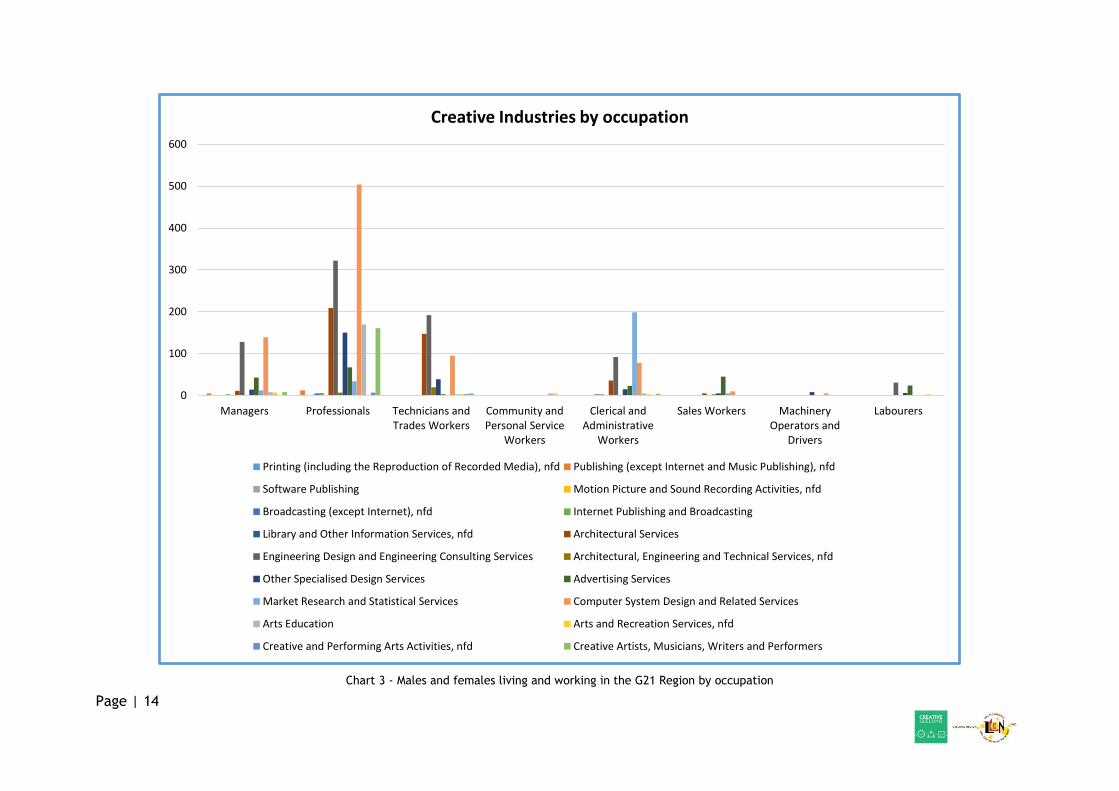
Occupation
With regard to the occupational areas in which those people work, the chart below shows
that not all people working within the Creative Industries are necessarily working in
creative occupations. Rather, the data demonstrates the diverse nature of work within
these sectors, including occupations which would not normally be associated with creative
work, such as labouring, sales, and trades work.
Conversely, not all creative occupations sit within the creative industries sectors. Many
medium to large organisations, regardless of industry sector, have ICT employees; and
unlikely sectors, such as the automotive industry employ designers. The chart on the
following page shows the spread of creative occupations across the G21 Region. 210
creative workers reside on Colac-Otway Shire, 289 in Golden Plains, 4,314 in the City of
Greater Geelong, 59 in the Borough of Queenscliffe, and 818 in Surf Coast Shire.
These data sets demonstrate the importance of carefully analysing the information
provided to ensure that incorrect assumptions are not being made with regard to the
numbers of people working in either creative industry sectors or creative occupations.
Page | 14
Chart 3 - Males and females living and working in the G21 Region by occupation
0
100
200
300
400
500
600
Managers Professionals Technicians andTrades Workers
Community andPersonal Service
Workers
Clerical andAdministrative
Workers
Sales Workers MachineryOperators and
Drivers
Labourers
Creative Industries by occupation
Printing (including the Reproduction of Recorded Media), nfd Publishing (except Internet and Music Publishing), nfd
Software Publishing Motion Picture and Sound Recording Activities, nfd
Broadcasting (except Internet), nfd Internet Publishing and Broadcasting
Library and Other Information Services, nfd Architectural Services
Engineering Design and Engineering Consulting Services Architectural, Engineering and Technical Services, nfd
Other Specialised Design Services Advertising Services
Market Research and Statistical Services Computer System Design and Related Services
Arts Education Arts and Recreation Services, nfd
Creative and Performing Arts Activities, nfd Creative Artists, Musicians, Writers and Performers

Page | 15
Chart 4 - G21 creative occupations
0
100
200
300
400
500
600
700
800
900A
rts
Pro
fess
ion
als
nfd
Act
ors
, Dan
cers
an
d O
ther
En
tert
ain
ers
Mu
sic
Pro
fess
ion
als
Ph
oto
grap
her
s
Vis
ual
Art
s an
d C
raft
s P
rofe
ssio
nal
s
Med
ia P
rofe
ssio
nal
s n
fd
Art
isti
c D
irec
tors
, an
d M
ed
ia P
rod
uce
rs a
nd
…
Au
tho
rs, a
nd
Bo
ok
and
Scr
ipt
Edit
ors
Film
, Tel
evis
ion
, Rad
io a
nd
Sta
ge D
ire
cto
rs
Jou
rnal
ists
an
d O
the
r W
rite
rs
Arc
hiv
ists
, Cu
rato
rs a
nd
Rec
ord
s M
anag
ers
Arc
hit
ects
, De
sign
ers,
Pla
nn
ers
and
Su
rvey
ors
…
Arc
hit
ects
an
d L
and
scap
e A
rch
ite
cts
Fash
ion
, In
du
stri
al a
nd
Jew
elle
ry D
esig
ner
s
Gra
ph
ic a
nd
Web
De
sign
ers,
an
d Il
lust
rato
rs
Inte
rio
r D
esig
ner
s
Sale
s, M
arke
tin
g an
d P
ub
lic R
elat
ion
s…
Ad
vert
isin
g an
d M
arke
tin
g P
rofe
ssio
nal
s
ICT
Sale
s P
rofe
ssio
nal
s
Pu
blic
Re
lati
on
s P
rofe
ssio
nal
s
Co
nfe
ren
ce a
nd
Eve
nt
Org
anis
ers
ICT
Pro
fess
ion
als
nfd
Bu
sin
ess
an
d S
yste
ms
An
alys
ts, a
nd
…
ICT
Bu
sin
ess
and
Sys
tem
s A
nal
ysts
Mu
ltim
edia
Sp
ecia
lists
an
d W
eb
De
velo
per
s
Soft
war
e an
d A
pp
licat
ion
s P
rogr
amm
ers
Jew
elle
rs
Per
form
ing
Art
s Te
chn
icia
ns
Wel
fare
, Rec
reat
ion
an
d C
om
mu
nit
y A
rts…
Gal
lery
, Lib
rary
an
d M
use
um
Tec
hn
icia
ns
Sign
wri
ters
Gal
lery
, Mu
seu
m a
nd
To
ur
Gu
ides
Vis
ual
Mer
chan
dis
ers
Arc
hit
ectu
ral,
Bu
ildin
g an
d S
urv
eyin
g Te
chn
icia
ns
Ph
oto
grap
hic
Dev
elo
pe
rs a
nd
Pri
nte
rs
Ad
vert
isin
g, P
ub
lic R
elat
ion
s an
d S
ale
s M
anag
ers
Art
s an
d M
edia
Pro
fess
ion
als
nfd
Bu
sin
ess
, Hu
man
Res
ou
rce
an
d M
arke
tin
g…
Pri
nt
Fin
ish
ers
and
Scr
een
Pri
nte
rs
Gra
ph
ic P
re-p
ress
Tra
des
Wo
rker
s
G21 creative occupations

Page | 16
Education
Of the3,196 respondents who indicated that they work in the Creative Industries in the G21 Region, 2,344 stated that they hold some form of post-secondary qualification. The table below shows the spread of qualifications.
Doctoral degree 30
Master degree 168
Graduate Diploma 68
Graduate Certificate 8
Bachelor degree 1,113
Advanced Diploma 272
Diploma 286
Certificate IV 112
Certificate III 271
Certificate II 16
Table 7 - Numbers with post-secondary qualifications
As can be seen from the chart below, the highest number of post-secondary qualifications are held by those working in the Engineering Design and Engineering Consulting Service; Computer System Design and Related Services; and Architectural Services sectors. The spread of actual qualifications is shown in the chart on the following page.
Chart 5 - Post-secondary qualifications by industry sector
0
200
400
600
800
1000
1200
1400
Education by industry sector

Page | 17
Chart 6 – Creative industries by education
0
50
100
150
200
250
300
350
400
Creative industries by education
Doctoral degree Master degree Graduate Diploma Graduate Certificate Bachelor degree
Advanced diploma Diploma Certificate IV Certificate III Certificate II
Page | 18
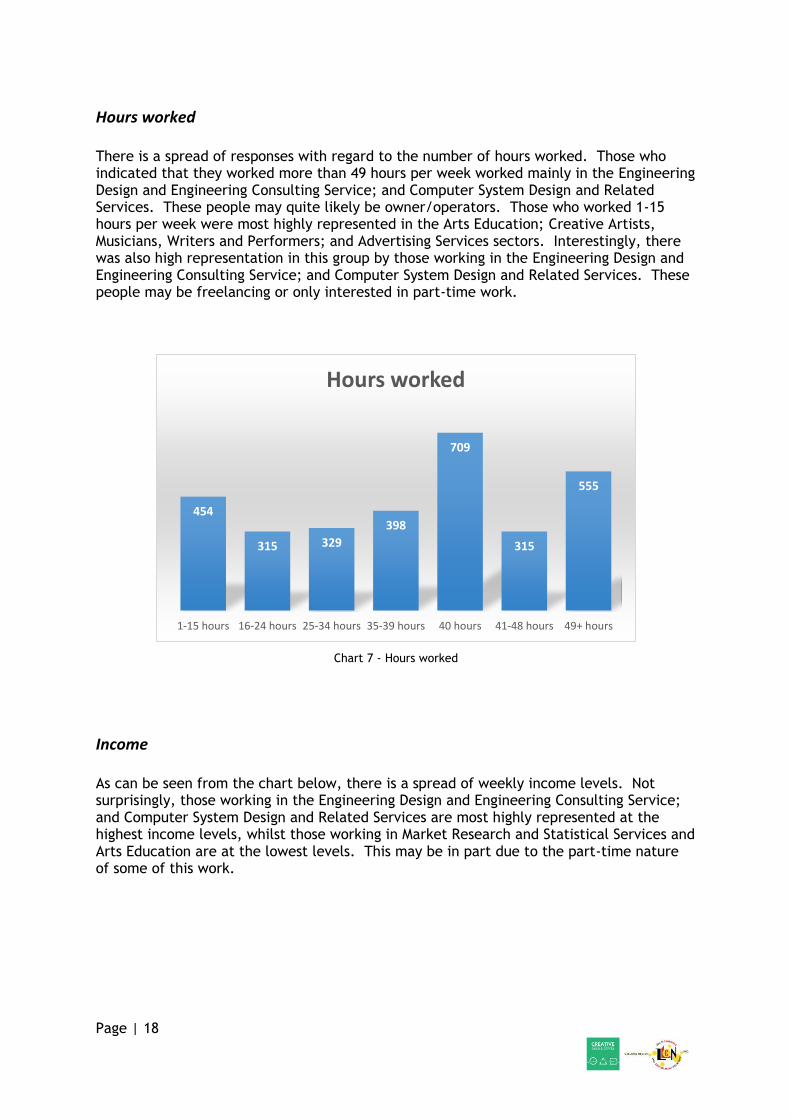
Hours worked There is a spread of responses with regard to the number of hours worked. Those who indicated that they worked more than 49 hours per week worked mainly in the Engineering Design and Engineering Consulting Service; and Computer System Design and Related Services. These people may quite likely be owner/operators. Those who worked 1-15 hours per week were most highly represented in the Arts Education; Creative Artists, Musicians, Writers and Performers; and Advertising Services sectors. Interestingly, there was also high representation in this group by those working in the Engineering Design and Engineering Consulting Service; and Computer System Design and Related Services. These people may be freelancing or only interested in part-time work.
Chart 7 - Hours worked
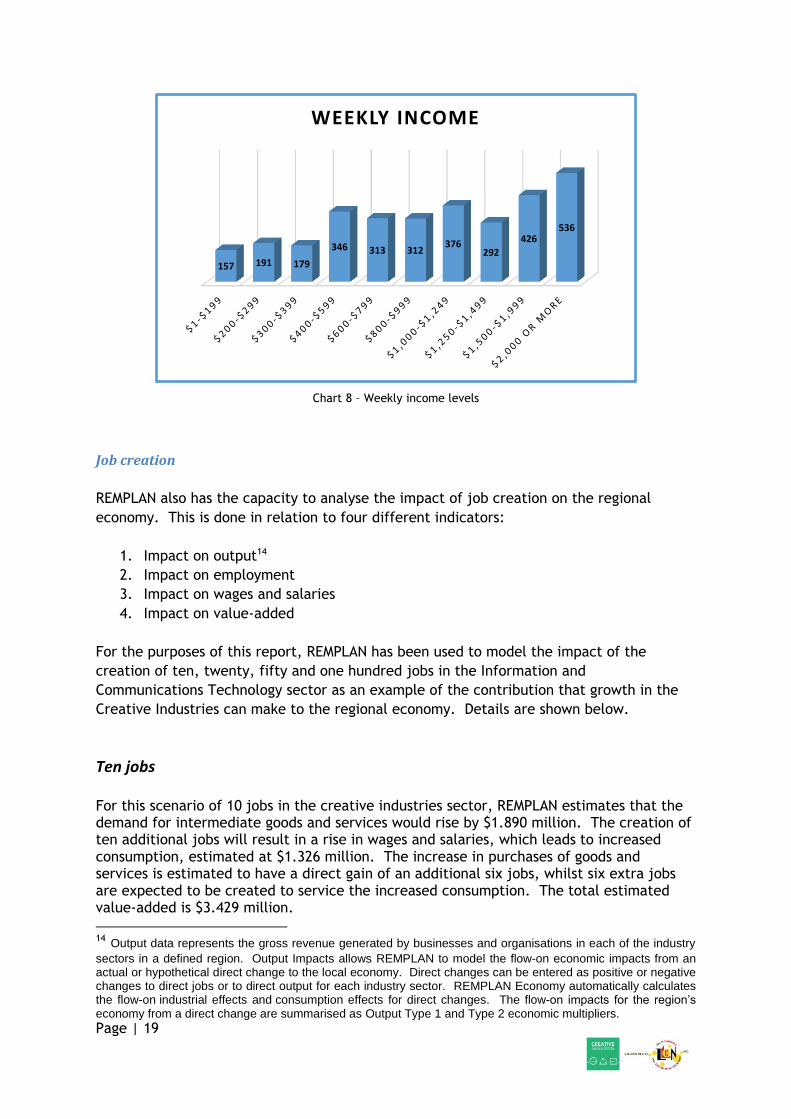
Income
As can be seen from the chart below, there is a spread of weekly income levels. Not surprisingly, those working in the Engineering Design and Engineering Consulting Service; and Computer System Design and Related Services are most highly represented at the highest income levels, whilst those working in Market Research and Statistical Services and Arts Education are at the lowest levels. This may be in part due to the part-time nature of some of this work.
454
315 329
398
709
315
555
1-15 hours 16-24 hours 25-34 hours 35-39 hours 40 hours 41-48 hours 49+ hours
Hours worked
Page | 19
Chart 8 – Weekly income levels
Job creation
REMPLAN also has the capacity to analyse the impact of job creation on the regional
economy. This is done in relation to four different indicators:
1. Impact on output14
2. Impact on employment
3. Impact on wages and salaries
4. Impact on value-added
For the purposes of this report, REMPLAN has been used to model the impact of the
creation of ten, twenty, fifty and one hundred jobs in the Information and
Communications Technology sector as an example of the contribution that growth in the
Creative Industries can make to the regional economy. Details are shown below.
Ten jobs
For this scenario of 10 jobs in the creative industries sector, REMPLAN estimates that the demand for intermediate goods and services would rise by $1.890 million. The creation of ten additional jobs will result in a rise in wages and salaries, which leads to increased consumption, estimated at $1.326 million. The increase in purchases of goods and services is estimated to have a direct gain of an additional six jobs, whilst six extra jobs are expected to be created to service the increased consumption. The total estimated value-added is $3.429 million.
14 Output data represents the gross revenue generated by businesses and organisations in each of the industry
sectors in a defined region. Output Impacts allows REMPLAN to model the flow-on economic impacts from an actual or hypothetical direct change to the local economy. Direct changes can be entered as positive or negative changes to direct jobs or to direct output for each industry sector. REMPLAN Economy automatically calculates the flow-on industrial effects and consumption effects for direct changes. The flow-on impacts for the region’s economy from a direct change are summarised as Output Type 1 and Type 2 economic multipliers.
157 191 179
346 313 312376
292
426536
WEEKLY INCOME

Page | 20
Chart 9 - 10 jobs - impact output total Chart 10 - 10 jobs - impact employment
Chart 11 - 10 jobs - impact wages & salaries Chart 12 - 10 jobs - impact value-added
As can be seen, the impact of new jobs can be quite significant. In this case, the creation of ten new direct jobs brings a total of $3.429 million and an overall increase of 22 jobs.
Twenty jobs
For this scenario, REMPLAN estimates that the demand for intermediate goods and services would rise by $3.780 million. The creation of twenty additional jobs will result in a rise in wages and salaries, which leads to increased consumption, estimated at $2.652 million. The increase in purchases of goods and services is estimated to have a direct gain of an additional thirteen jobs, whilst ten extra jobs are expected to be created to service the increased consumption. The total estimated value-added is $6.859 million.
Chart 13 - 20 jobs - impact output total Chart 14 - 20 jobs - impact employment
Chart 15 - 20 jobs - impact wages & salaries Chart 16 - 20 jobs - impact value-added
In this scenario, the creation of twenty new direct jobs brings a total of $6.859 million and
an overall increase of 43 jobs.

Page | 21
Fifty jobs
For this scenario, REMPLAN estimates that the demand for intermediate goods and services would rise by $9.451 million. The creation of fifty additional jobs will result in a rise in wages and salaries, which leads to increased consumption, estimated at $6.630 million. The increase in purchases of goods and services is estimated to have a direct gain of an additional 32 jobs, whilst 27 extra jobs are expected to be created to service the increased consumption. The total estimated value-added is $17.147 million.
Chart 17 - 50 jobs - impact output total Chart 18 - 50 jobs - impact employment
Chart 19 - 50 jobs - impact wages & salaries Chart 20 - 50 jobs - impact value-added
In this case, the creation of fifty new direct jobs brings a total of $17.147 million and an overall increase of 109 jobs.
One hundred jobs
For this scenario, REMPLAN estimates that the demand for intermediate goods and services would rise by $18.901 million. The creation of one hundred additional jobs will result in a rise in wages and salaries, which leads to increased consumption, estimated at $13.259 million. The increase in purchases of goods and services is estimated to have a direct gain of an additional 64 jobs, whilst 53 extra jobs are expected to be created to service the increased consumption. The total estimated value-added is $34.293 million.
Chart 21 - 100 jobs - impact output total Chart 22 - 100 jobs - impact employment
Page | 22
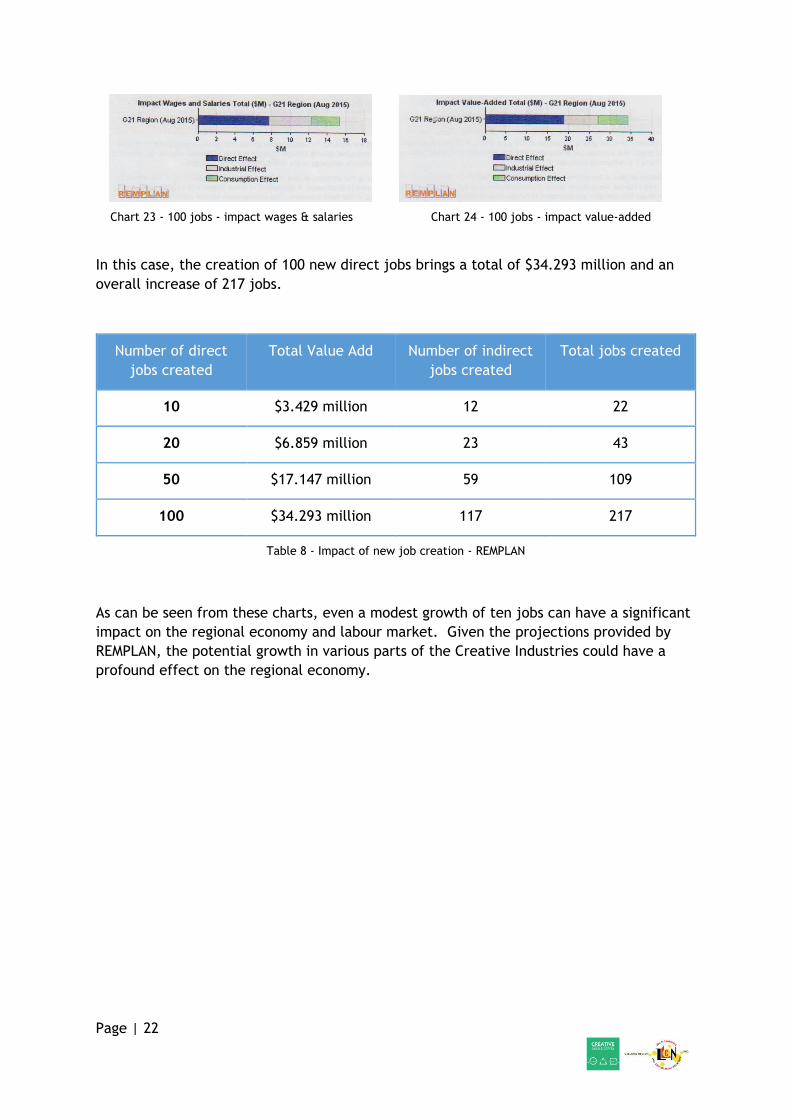
Chart 23 - 100 jobs - impact wages & salaries Chart 24 - 100 jobs - impact value-added
In this case, the creation of 100 new direct jobs brings a total of $34.293 million and an
overall increase of 217 jobs.
Number of direct
jobs created
Total Value Add Number of indirect
jobs created
Total jobs created
10 $3.429 million 12 22
20 $6.859 million 23 43
50 $17.147 million 59 109
100 $34.293 million 117 217
Table 8 - Impact of new job creation - REMPLAN
As can be seen from these charts, even a modest growth of ten jobs can have a significant
impact on the regional economy and labour market. Given the projections provided by
REMPLAN, the potential growth in various parts of the Creative Industries could have a
profound effect on the regional economy.