Embed Size (px)
Citation preview

REGIONAL CLIMATE AND VARIABILITY OF THE SUMMERTIME CONTINENTAL UNITED STATES IN REANALYSES
Michael G. Bosilovich (GSFC), Franklin R. Robertson (MSFC)

Motivation Global reanalyses assimilate many
observations, and the state fields can depict well the associated large scale circulation and weather variations
The background model produces many fields that are not observed regularly, if at all
How well are precipitation and temperature interannual variations represented in sub-continental regions? Focus on U.S. summer, when there are concerns
on extremes and when forecasts are most difficult

Modern-Era Retrospective analysis for Research and Applications (MERRA) 1979-Present (will not continue, depending on
remotely sensed observations) ½° lat x ⅔° lon, 42 pressure levels (derived from
72 terrain following model levels) 1 Hourly Surface/2D fields, 3 and 6 hourly 3D
fields; over 300 variables NCEP GSI analysis (~2008) GEOS5 GCM (~2008) New offline land and ocean reprocessing
products Gridded Innovations and Observations (GIO)

Additional Data
NCEP CFSR (Saha et al. 2010) Includes obs precipitation forcing in land analysis cycle
ERA Interim (Dee et al. 2011) Includes surface meteorology data assimilation
CPC Gauge Analysis (Chen et al. 2008) CRU 3.1 Surface Temperature (Mitchell and
Jones, 2005)

Regions
Regions track those defined For the USGCRP National Climate Assessment
• A first order approximation • Not optimal for some regional
climate features • Many results are also reflected
in basin scale evaluation (e.g. Mississippi River)

Summer Seasonal Precipitation
For MERRA dry southern plains, wet
northern Correlations are high or
comparable St Dev lean low, esp MW
0
1
2
3
4
5
NE SE MW GP SGP NGP NW SW US
Regional Precipitation JJA 79-08
CPC MERRA Interim CFSR
0.40.50.60.70.80.91.0
NE SE MW GP SGP NGP NW SW US
Regions Correlation JJA 79-08
MERRA Interim CFSR
0
0.2
0.4
0.6
0.8
1
NE SE MW GP SGP NGP NW SW US
Regional Precip JJA St Dev 79-08
CPC MERRA Interim CFSR
mm
day
-1

Regional Precipitation All reanalyses
agree well in NW In MW MERRA
underestimates anomaly magnitude
CFSR completely misses some anomalies
Interim has a persistent trend
-0.8
-0.4
0.0
0.4
0.8
1.2
1979
1980
1981
1982
1983
1984
1985
1986
1987
1988
1989
1990
1991
1992
1993
1994
1995
1996
1997
1998
1999
2000
2001
2002
2003
2004
2005
2006
2007
2008
2009
2010
2011
NW JJA Precip Anomalies (mm day-1)
Gauge MERRA Interim CFSR
-1.5-1.0-0.50.00.51.01.52.0
1979
1980
1981
1982
1983
1984
1985
1986
1987
1988
1989
1990
1991
1992
1993
1994
1995
1996
1997
1998
1999
2000
2001
2002
2003
2004
2005
2006
2007
2008
2009
2010
2011
MW JJA Precip Anomalies (mm day-1)
Gauge MERRA Interim CFSR

MERRA – Gauge Correlation
Barlow et al show some correlation of NW precipitation to ENSO

ENSO Connection
CPC ERA-I
CFSR MERRA
JJA Precipitation Correlation with MAM Niño34

Summer P and T Trends SE Pr – CFSR
discontinuity in 1998 ERA-I Pr – Systematic
decreasing trend over much of US
T – All have warming trends (MERRA largest)
Obs – new corrections may increase trends (Vose et al 2012)
00.10.20.30.40.50.6
NE SE MW GP SGP NGP NW SW US
79-08 JJA Temp Trend (K/Dec)
CRU31 MERRA Interim CFSR
-0.7-0.6-0.5-0.4-0.3-0.2-0.1
00.10.20.3
NE SE MW GP SGP NGP NW SW US
NCA Regions Trend JJA 79-08
Gauge MERRA Interim CFSR

Heat Wave Duration Index
5K above climatology for 5 day stretches Not exactly warming, but affected by warming Identifying an appropriate daily temperature
data set for comparisons

Max Precip in a Season
Largest precip occurrence each season at each grid point
Hurricane Season (Jun-Nov) shows increases along East Coast and SE US
MERRA represents the variability of the extreme precipitation well

Max Precip SLP/Ts Composite Anomaly
Compositing the most extreme years to show the supporting large scale environment
Low pressure in tropical Atlantic, with weaker westerly flow
SST Shows warm Atlantic, including off the east coast and La Niña Pacific pattern
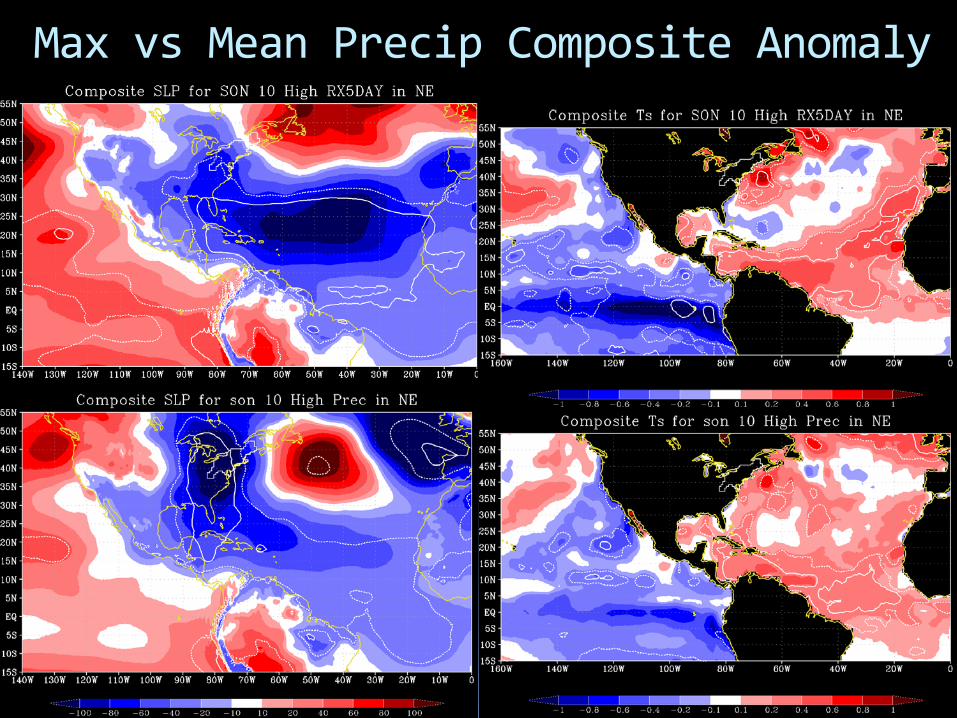
Max vs Mean Precip Composite Anomaly

Daily Composites of Extremes
Choose days when mean T2m exceeds 90th% JAN days in the Northeastern US Strong southerly flow ahead of low pressure
to the west

Summary
MW weakness in precip variability seems a good target to learn about the system
Is the strong ENSO a feature of global reanalysis, or perhaps a weakness in the ability to generate local feedback or circulations?
EC surface station analysis has clear benefit for the near surface state representation (what about fluxes?) Developing satellite surface temperature assimilation
for GMAO systems