Embed Size (px)
Citation preview
1 Copyright 2012 © Professor Michael E. Porter 20120329 – Toronto Region Economic Summit – FINAL
Professor Michael E. Porter Harvard Business School
Toronto Region Economic Summit
Toronto, Canada March 29, 2012
Regional Competitiveness:
The Role of Clusters
This presentation draws on ideas from Professor Porter’s articles and books, in particular, The Competitive Advantage of Nations (The Free Press, 1990),
“Building the Microeconomic Foundations of Competitiveness,” in The Global Competitiveness Report (World Economic Forum), “Clusters and the New
Competitive Agenda for Companies and Governments” in On Competition (Harvard Business School Press, 2008), and ongoing research on clusters and
competitiveness. No part of this publication may be reproduced, stored in a retrieval system, or transmitted in any form or by any means - electronic, mechanical,
photocopying, recording, or otherwise - without the permission of Michael E. Porter. Further information on Professor Porter’s work and the Institute for Strategy
and Competitiveness is available at www.isc.hbs.edu
2 Copyright © 2012 Professor Michael E. Porter 20120329 – Toronto Region Economic Summit – FINAL
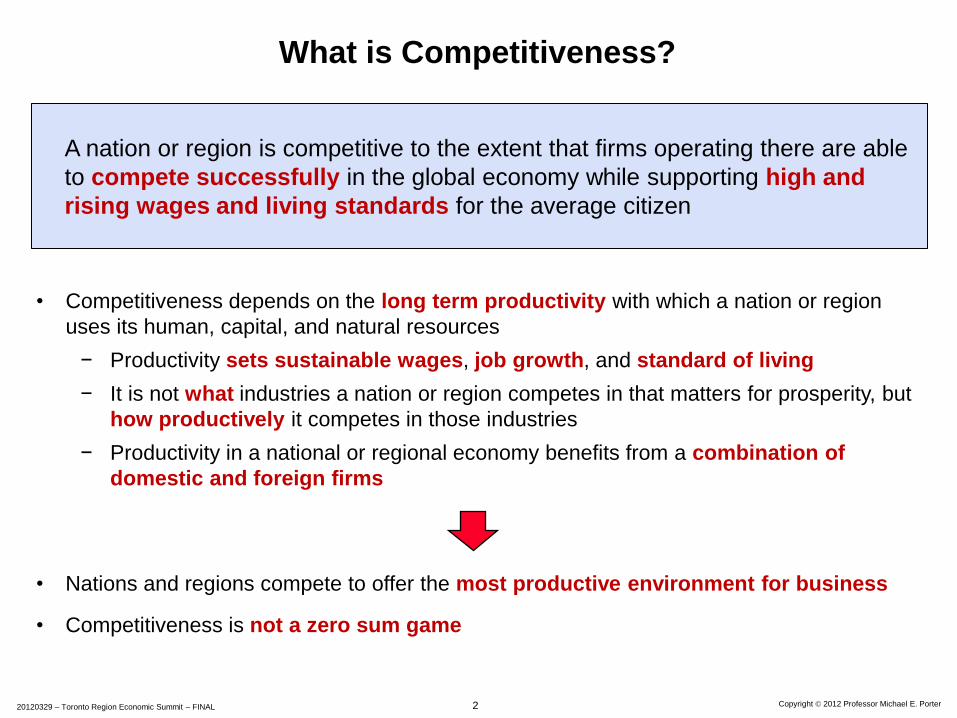
What is Competitiveness?
• Nations and regions compete to offer the most productive environment for business
• Competitiveness is not a zero sum game
• Competitiveness depends on the long term productivity with which a nation or region
uses its human, capital, and natural resources
− Productivity sets sustainable wages, job growth, and standard of living
− It is not what industries a nation or region competes in that matters for prosperity, but
how productively it competes in those industries
− Productivity in a national or regional economy benefits from a combination of
domestic and foreign firms
A nation or region is competitive to the extent that firms operating there are able
to compete successfully in the global economy while supporting high and
rising wages and living standards for the average citizen
3 Copyright © 2012 Professor Michael E. Porter 20120329 – Toronto Region Economic Summit – FINAL
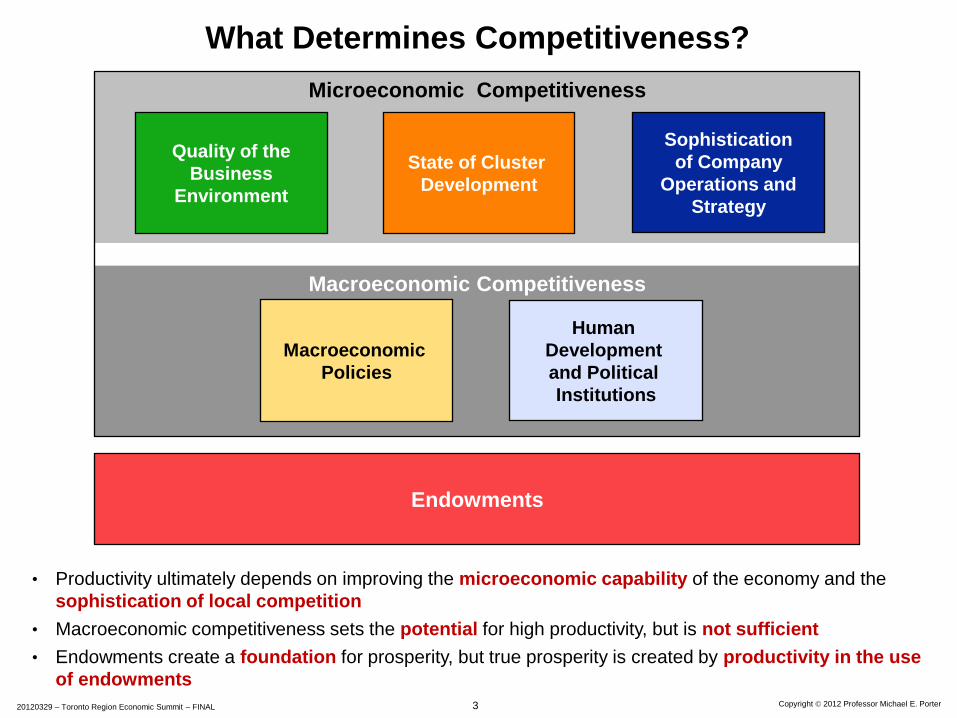
• Productivity ultimately depends on improving the microeconomic capability of the economy and the
sophistication of local competition
• Macroeconomic competitiveness sets the potential for high productivity, but is not sufficient
• Endowments create a foundation for prosperity, but true prosperity is created by productivity in the use
of endowments
What Determines Competitiveness?
Macroeconomic Competitiveness
Microeconomic Competitiveness
Sophistication
of Company
Operations and
Strategy
Quality of the
Business
Environment
Human
Development
and Political
Institutions
Macroeconomic
Policies
State of Cluster
Development
Endowments
4 Copyright © 2012 Professor Michael E. Porter 20120329 – Toronto Region Economic Summit – FINAL
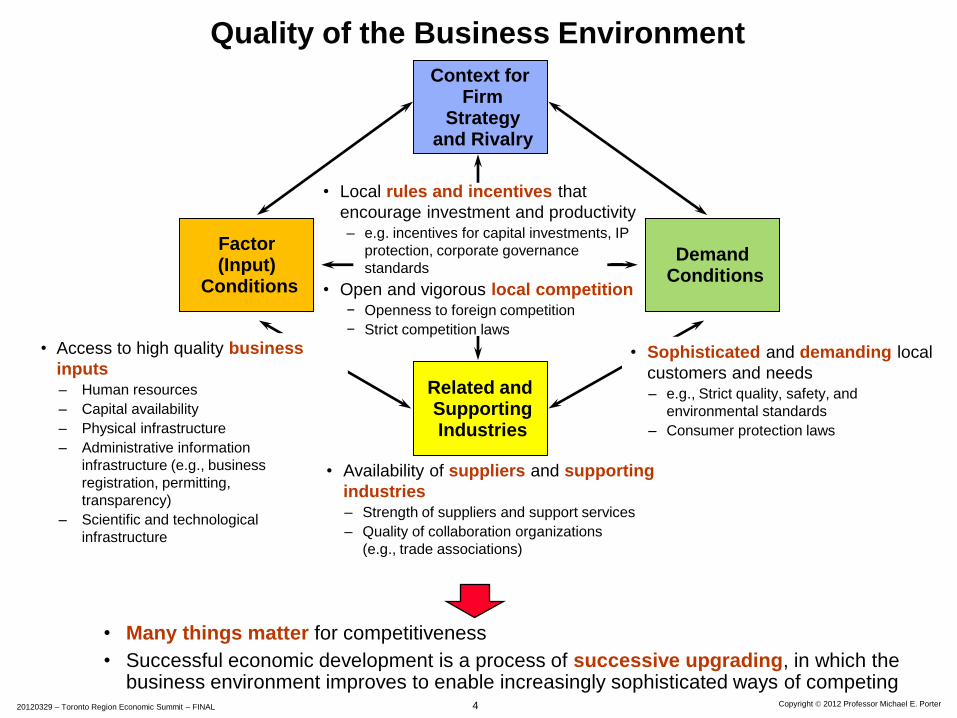
Quality of the Business Environment
Context for Firm
Strategy and Rivalry
Related and Supporting Industries
Factor (Input)
Conditions
Demand Conditions
• Sophisticated and demanding local
customers and needs – e.g., Strict quality, safety, and
environmental standards
– Consumer protection laws
• Many things matter for competitiveness
• Successful economic development is a process of successive upgrading, in which the business environment improves to enable increasingly sophisticated ways of competing
• Local rules and incentives that
encourage investment and productivity – e.g. incentives for capital investments, IP
protection, corporate governance
standards
• Open and vigorous local competition − Openness to foreign competition
− Strict competition laws
• Access to high quality business
inputs – Human resources
– Capital availability
– Physical infrastructure
– Administrative information
infrastructure (e.g., business
registration, permitting,
transparency)
– Scientific and technological
infrastructure
• Availability of suppliers and supporting
industries – Strength of suppliers and support services
– Quality of collaboration organizations
(e.g., trade associations)
5 Copyright 2012 © Professor Michael E. Porter 20120329 – Toronto Region Economic Summit – FINAL
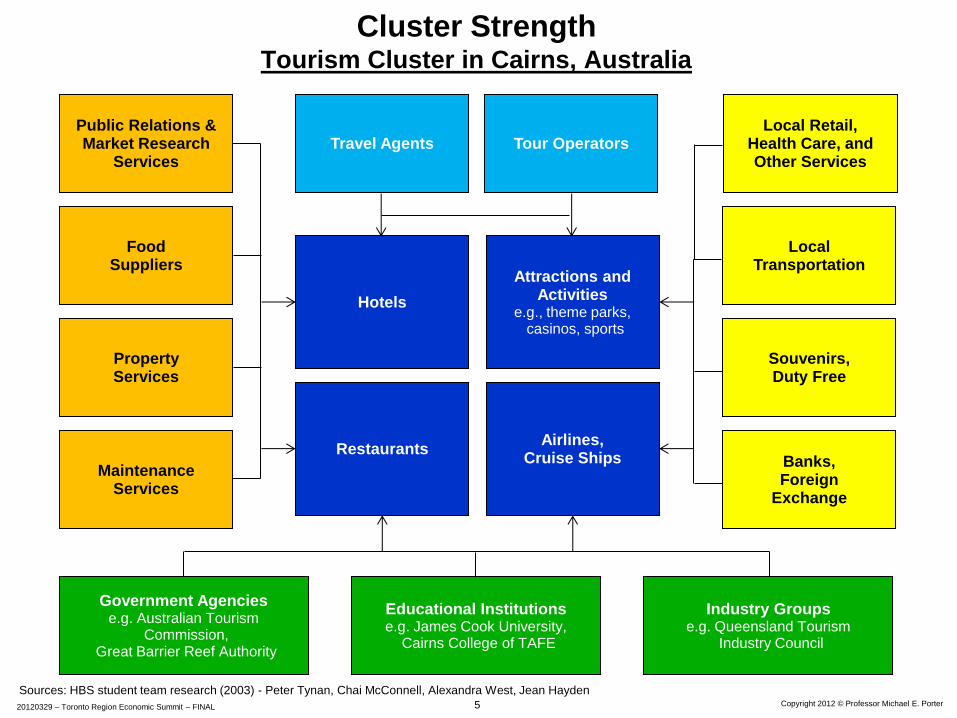
Sources: HBS student team research (2003) - Peter Tynan, Chai McConnell, Alexandra West, Jean Hayden
Restaurants
Attractions and Activities
e.g., theme parks, casinos, sports
Airlines, Cruise Ships
Travel Agents Tour Operators
Hotels
Property Services
Maintenance Services
Government Agencies e.g. Australian Tourism
Commission, Great Barrier Reef Authority
Educational Institutions e.g. James Cook University,
Cairns College of TAFE
Industry Groups e.g. Queensland Tourism
Industry Council
Food Suppliers
Public Relations & Market Research
Services
Local Retail, Health Care, and Other Services
Souvenirs, Duty Free
Banks, Foreign
Exchange
Local Transportation
Cluster Strength Tourism Cluster in Cairns, Australia
6 Copyright © 2012 Professor Michael E. Porter 20120329 – Toronto Region Economic Summit – FINAL
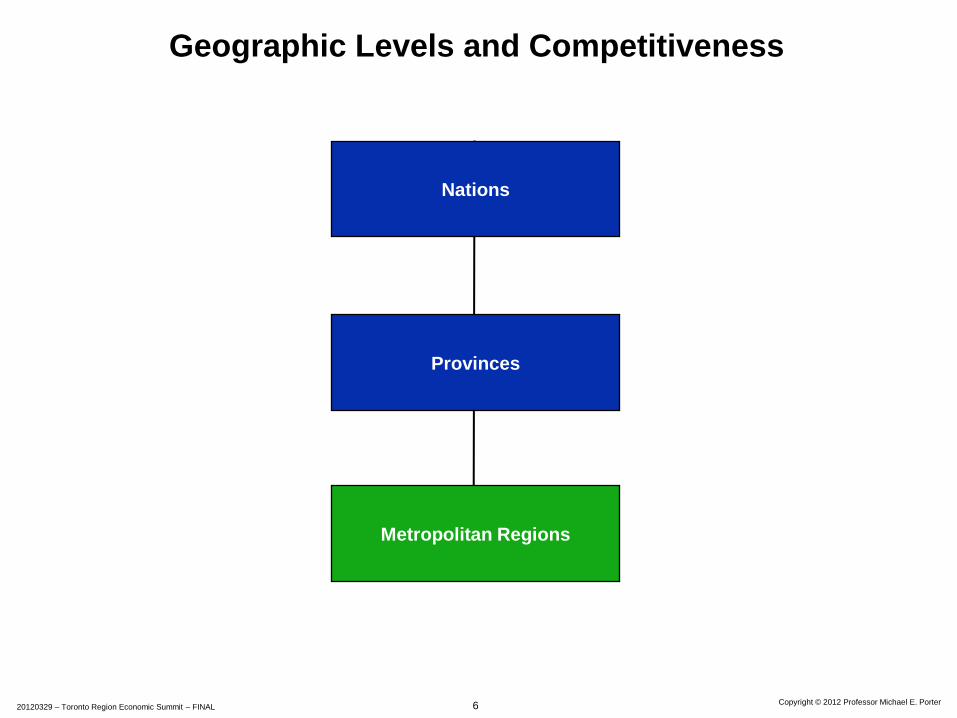
Geographic Levels and Competitiveness
Nations
Provinces
Metropolitan Regions
7 Copyright © 2012 Professor Michael E. Porter 20120329 – Toronto Region Economic Summit – FINAL
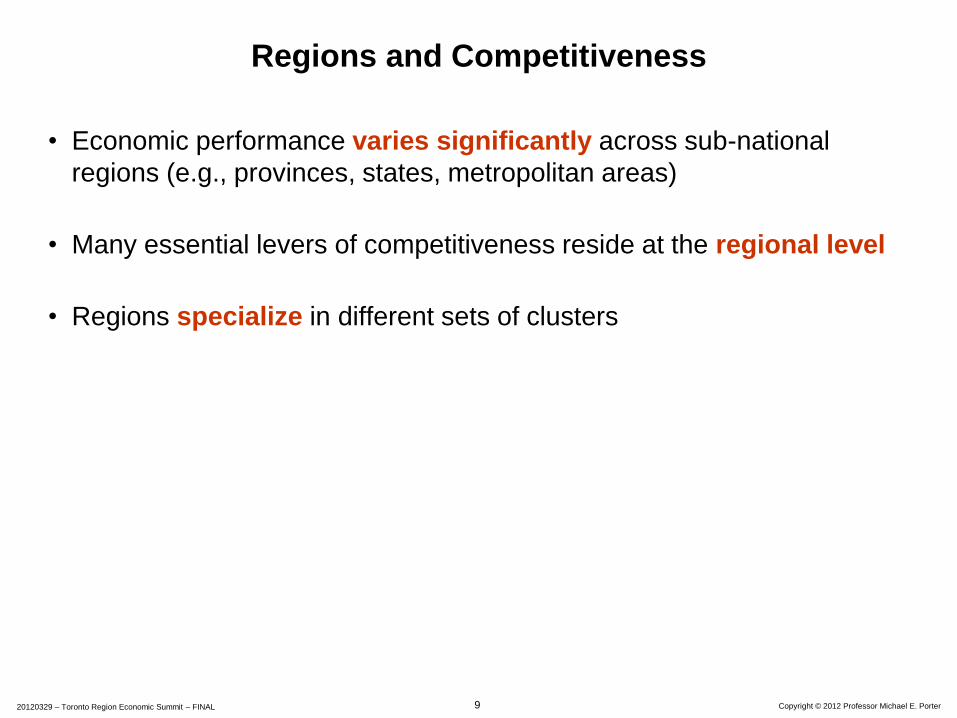
Regions and Competitiveness
• Economic performance varies significantly across sub-national
regions (e.g., provinces, states, metropolitan areas)
8 Copyright 2012 Professor Michael E. Porter 20120329 – Toronto Region Economic Summit – FINAL
$25,000
$30,000
$35,000
$40,000
$45,000
$50,000
$55,000
$60,000
$65,000
-1.0% -0.5% 0.0% 0.5% 1.0% 1.5% 2.0% 2.5% 3.0% 3.5%
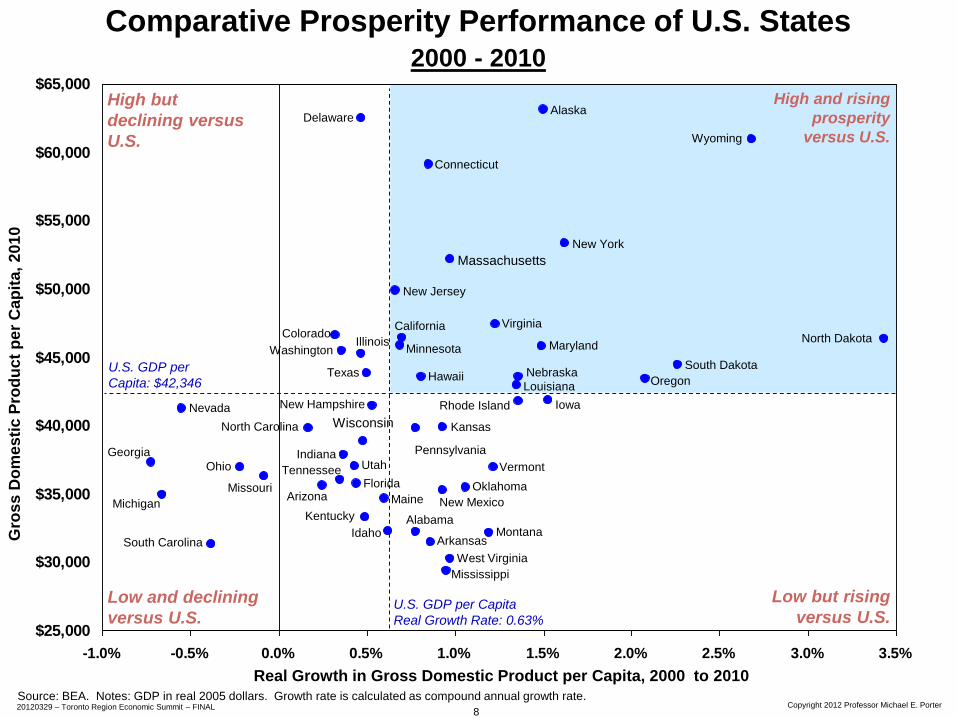
U.S. GDP per
Capita: $42,346
High and rising
prosperity
versus U.S.
Comparative Prosperity Performance of U.S. States 2000 - 2010
Source: BEA. Notes: GDP in real 2005 dollars. Growth rate is calculated as compound annual growth rate.
U.S. GDP per Capita
Real Growth Rate: 0.63%
Real Growth in Gross Domestic Product per Capita, 2000 to 2010
Gro
ss
Do
mes
tic P
rod
uct
pe
r C
ap
ita,
20
10
Low and declining
versus U.S.
Low but rising
versus U.S.
High but
declining versus
U.S.
Alabama
Alaska
Arizona
Arkansas
California Colorado
Connecticut
Delaware
Florida
Georgia
Hawaii
Idaho
Illinois
Indiana
Iowa
Kansas
Kentucky
Louisiana
Maine
Maryland
Massachusetts
Michigan
Minnesota
Mississippi
Missouri
Montana
Nebraska
Nevada New Hampshire
New Jersey
New Mexico
New York
North Carolina
North Dakota
Ohio
Oklahoma
Oregon
Pennsylvania
Rhode Island
South Carolina
South Dakota
Tennessee
Texas
Utah Vermont
Virginia
Washington
West Virginia
Wisconsin
Wyoming
9 Copyright © 2012 Professor Michael E. Porter 20120329 – Toronto Region Economic Summit – FINAL
Regions and Competitiveness
• Economic performance varies significantly across sub-national
regions (e.g., provinces, states, metropolitan areas)
• Many essential levers of competitiveness reside at the regional level
• Regions specialize in different sets of clusters
10 Copyright © 2012 Professor Michael E. Porter 20120329 – Toronto Region Economic Summit – FINAL
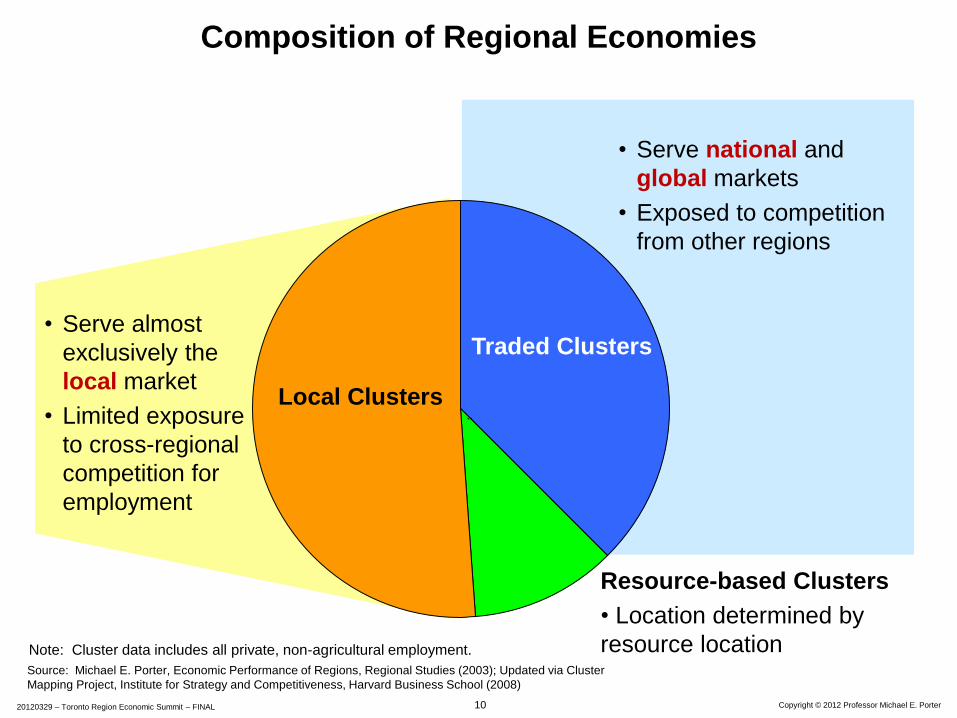
Composition of Regional Economies
``
• Serve almost
exclusively the
local market
• Limited exposure
to cross-regional
competition for
employment
Local Clusters
Traded Clusters
• Serve national and
global markets
• Exposed to competition
from other regions
Source: Michael E. Porter, Economic Performance of Regions, Regional Studies (2003); Updated via Cluster
Mapping Project, Institute for Strategy and Competitiveness, Harvard Business School (2008)
Resource-based Clusters
• Location determined by
resource location Note: Cluster data includes all private, non-agricultural employment.
11 Copyright © 2012 Professor Michael E. Porter 20120329 – Toronto Region Economic Summit – FINAL
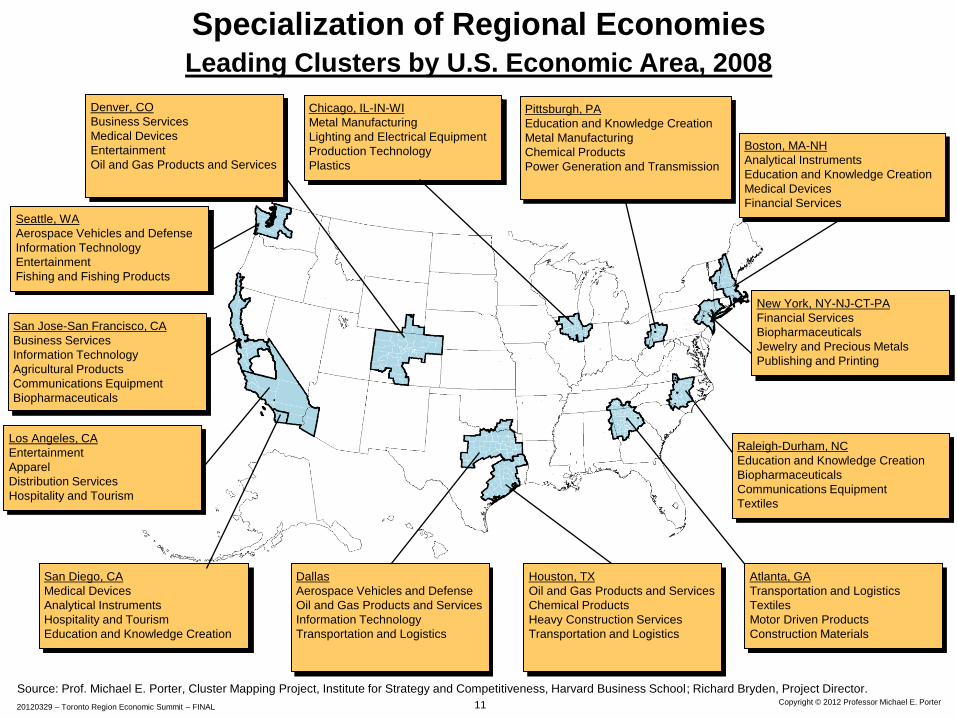
Specialization of Regional Economies Leading Clusters by U.S. Economic Area, 2008
Boston, MA-NH
Analytical Instruments
Education and Knowledge Creation
Medical Devices
Financial Services
Los Angeles, CA
Entertainment
Apparel
Distribution Services
Hospitality and Tourism
San Jose-San Francisco, CA
Business Services
Information Technology
Agricultural Products
Communications Equipment
Biopharmaceuticals
New York, NY-NJ-CT-PA
Financial Services
Biopharmaceuticals
Jewelry and Precious Metals
Publishing and Printing
Seattle, WA
Aerospace Vehicles and Defense
Information Technology
Entertainment
Fishing and Fishing Products
San Diego, CA
Medical Devices
Analytical Instruments
Hospitality and Tourism
Education and Knowledge Creation
Chicago, IL-IN-WI
Metal Manufacturing
Lighting and Electrical Equipment
Production Technology
Plastics
Denver, CO
Business Services
Medical Devices
Entertainment
Oil and Gas Products and Services
Raleigh-Durham, NC
Education and Knowledge Creation
Biopharmaceuticals
Communications Equipment
Textiles
Atlanta, GA
Transportation and Logistics
Textiles
Motor Driven Products
Construction Materials
Dallas
Aerospace Vehicles and Defense
Oil and Gas Products and Services
Information Technology
Transportation and Logistics
Source: Prof. Michael E. Porter, Cluster Mapping Project, Institute for Strategy and Competitiveness, Harvard Business School; Richard Bryden, Project Director.
Houston, TX
Oil and Gas Products and Services
Chemical Products
Heavy Construction Services
Transportation and Logistics
Pittsburgh, PA
Education and Knowledge Creation
Metal Manufacturing
Chemical Products
Power Generation and Transmission
12 Copyright © 2012 Professor Michael E. Porter 20120329 – Toronto Region Economic Summit – FINAL
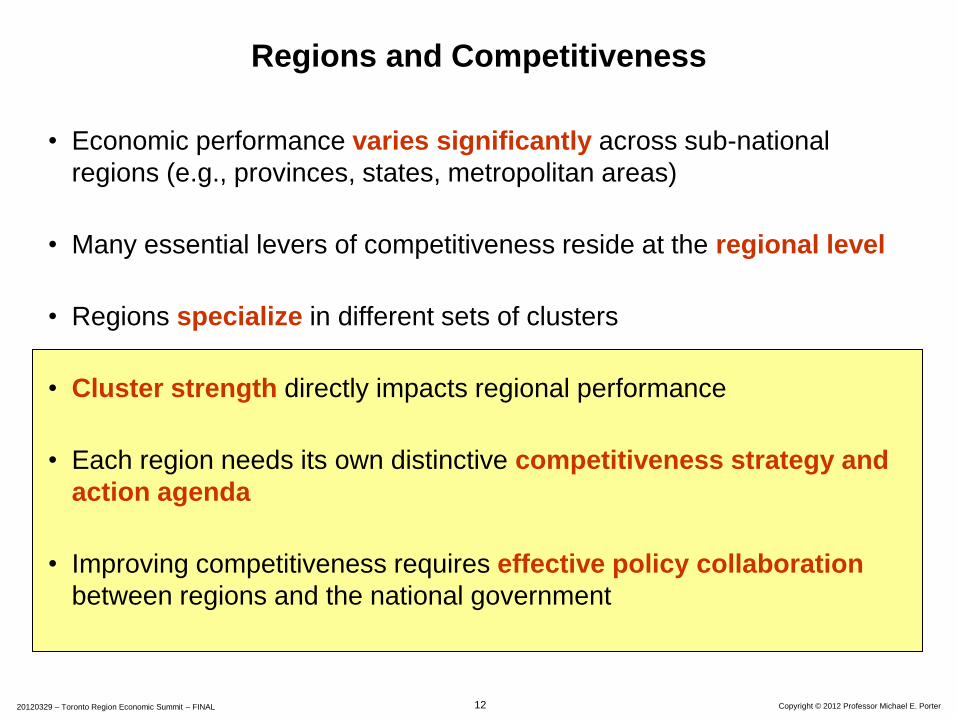
Regions and Competitiveness
• Economic performance varies significantly across sub-national
regions (e.g., provinces, states, metropolitan areas)
• Many essential levers of competitiveness reside at the regional level
• Regions specialize in different sets of clusters
• Cluster strength directly impacts regional performance
• Each region needs its own distinctive competitiveness strategy and
action agenda
• Improving competitiveness requires effective policy collaboration
between regions and the national government
13 Copyright 2012 © Professor Michael E. Porter
20120329 – Toronto Region Economic Summit – FINAL
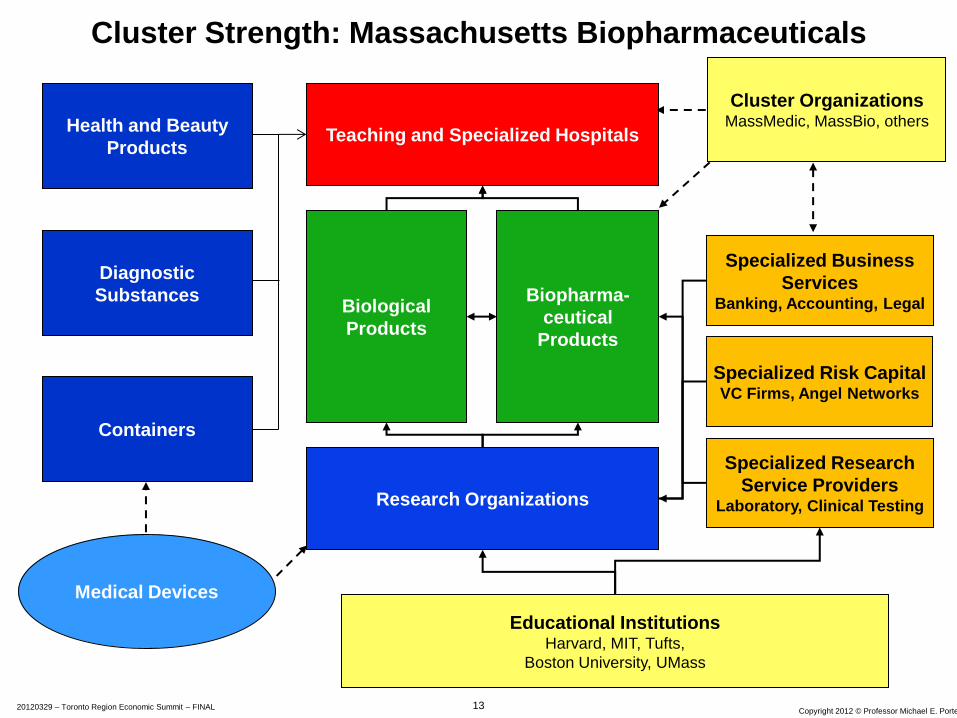
Research Organizations
Biological
Products
Specialized Risk Capital VC Firms, Angel Networks
Biopharma-
ceutical
Products
Specialized Business
Services Banking, Accounting, Legal
Specialized Research
Service Providers Laboratory, Clinical Testing
Diagnostic
Substances
Containers
Health and Beauty
Products Teaching and Specialized Hospitals
Educational Institutions Harvard, MIT, Tufts,
Boston University, UMass
Cluster Organizations MassMedic, MassBio, others
Cluster Strength: Massachusetts Biopharmaceuticals
Medical Devices
Copyright © 2012 Professor Michael E. Porter 20120329 – Toronto Region Economic Summit – FINAL
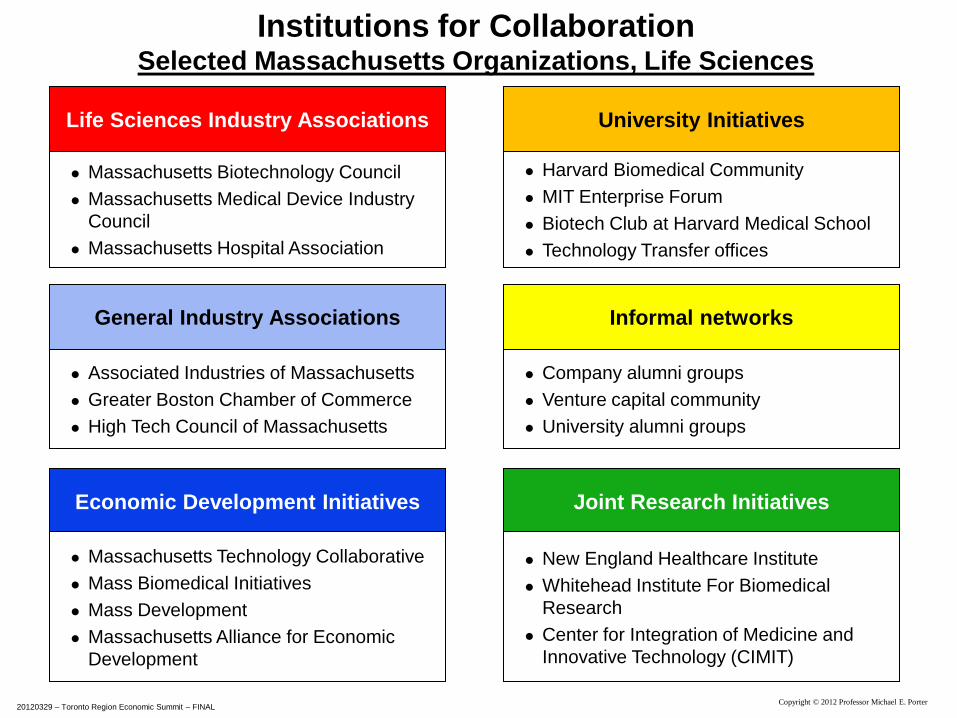
Institutions for Collaboration Selected Massachusetts Organizations, Life Sciences
Economic Development Initiatives
Massachusetts Technology Collaborative
Mass Biomedical Initiatives
Mass Development
Massachusetts Alliance for Economic
Development
Life Sciences Industry Associations
Massachusetts Biotechnology Council
Massachusetts Medical Device Industry
Council
Massachusetts Hospital Association
General Industry Associations
Associated Industries of Massachusetts
Greater Boston Chamber of Commerce
High Tech Council of Massachusetts
University Initiatives
Harvard Biomedical Community
MIT Enterprise Forum
Biotech Club at Harvard Medical School
Technology Transfer offices
Informal networks
Company alumni groups
Venture capital community
University alumni groups
Joint Research Initiatives
New England Healthcare Institute
Whitehead Institute For Biomedical
Research
Center for Integration of Medicine and
Innovative Technology (CIMIT)
15 Copyright 2012 © Professor Michael E. Porter 20120329 – Toronto Region Economic Summit – FINAL
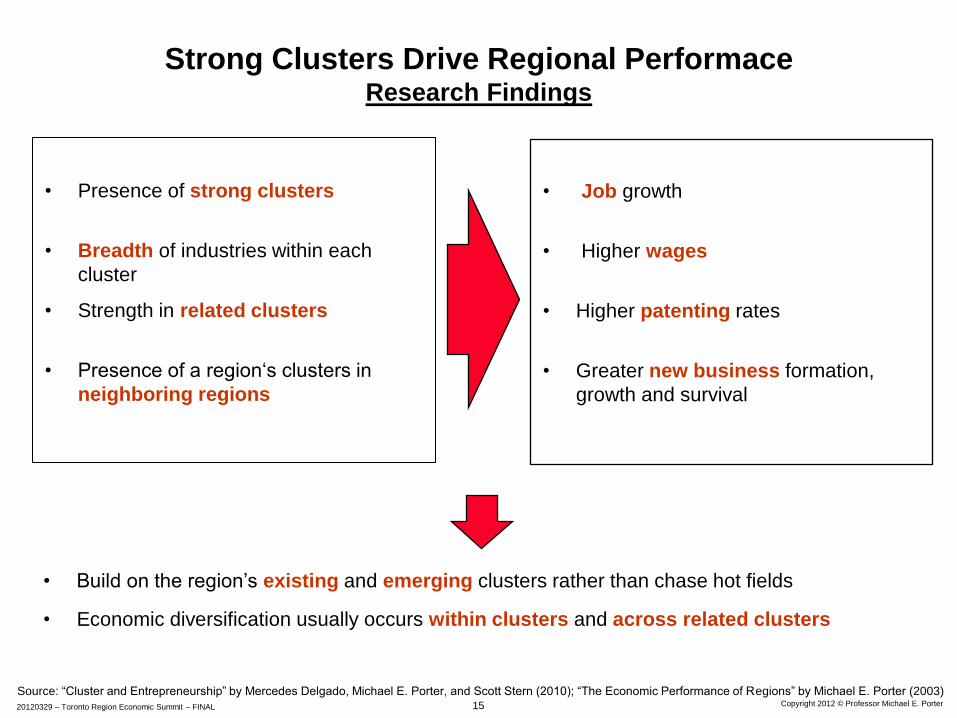
Strong Clusters Drive Regional Performace Research Findings
Source: “Cluster and Entrepreneurship” by Mercedes Delgado, Michael E. Porter, and Scott Stern (2010); “The Economic Performance of Regions” by Michael E. Porter (2003)
• Presence of strong clusters
• Breadth of industries within each
cluster
• Strength in related clusters
• Presence of a region‘s clusters in
neighboring regions
• Job growth
• Higher wages
• Higher patenting rates
• Greater new business formation,
growth and survival
• Build on the region’s existing and emerging clusters rather than chase hot fields
• Economic diversification usually occurs within clusters and across related clusters
16 Copyright 2012 © Professor Michael E. Porter 20120329 – Toronto Region Economic Summit – FINAL
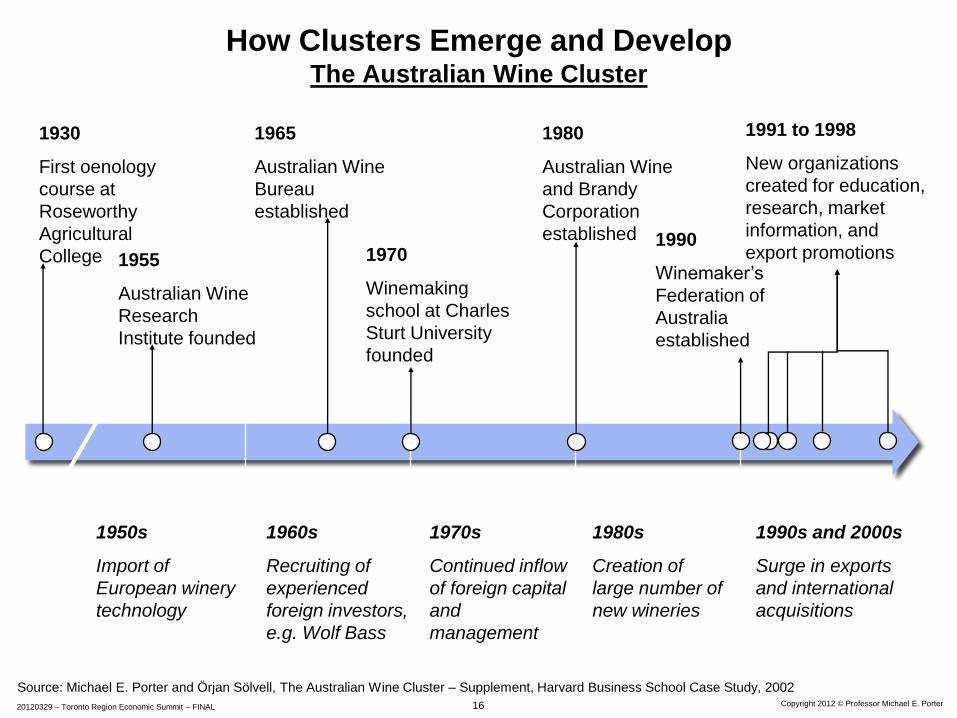
How Clusters Emerge and Develop The Australian Wine Cluster
1955
Australian Wine
Research
Institute founded
1970
Winemaking
school at Charles
Sturt University
founded
1980
Australian Wine
and Brandy
Corporation
established
1965
Australian Wine
Bureau
established
1930
First oenology
course at
Roseworthy
Agricultural
College
1950s
Import of
European winery
technology
1960s
Recruiting of
experienced
foreign investors,
e.g. Wolf Bass
1990s and 2000s
Surge in exports
and international
acquisitions
1980s
Creation of
large number of
new wineries
1970s
Continued inflow
of foreign capital
and
management
1990
Winemaker’s
Federation of
Australia
established
1991 to 1998
New organizations
created for education,
research, market
information, and
export promotions
Source: Michael E. Porter and Örjan Sölvell, The Australian Wine Cluster – Supplement, Harvard Business School Case Study, 2002
17 Copyright 2012 © Professor Michael E. Porter 20120329 – Toronto Region Economic Summit – FINAL
Furniture Building
Fixtures,
Equipment &
Services
Fishing &
Fishing
Products
Hospitality
& Tourism Agricultural
Products
Transportation
& Logistics
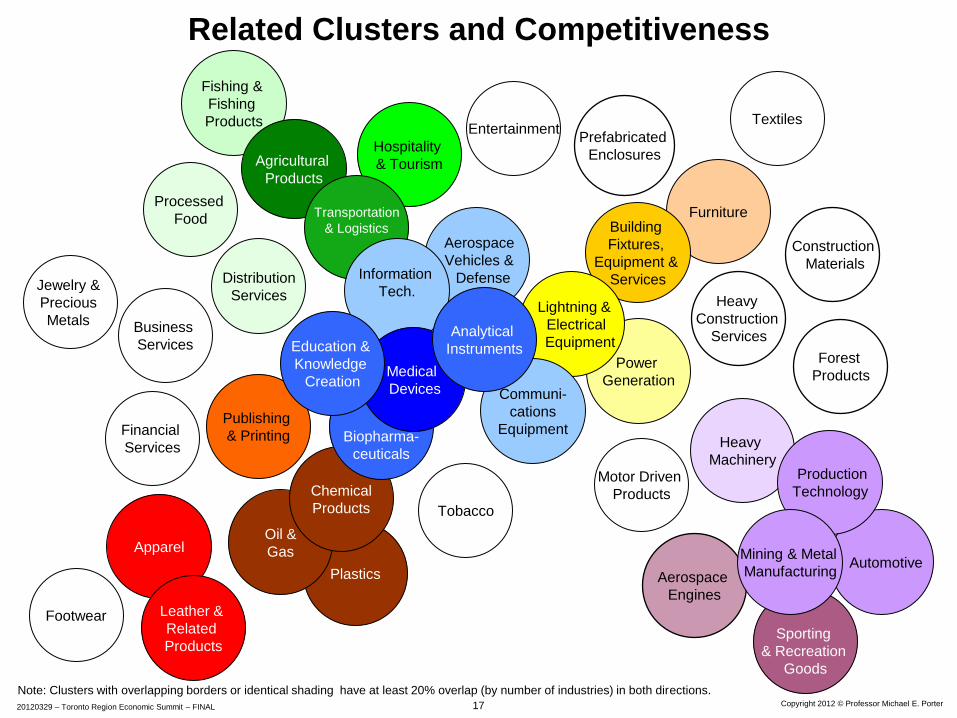
Related Clusters and Competitiveness
Plastics
Oil &
Gas
Chemical
Products
Biopharma-
ceuticals
Power
Generation
Aerospace
Vehicles &
Defense
Lightning &
Electrical
Equipment
Financial
Services
Publishing
& Printing
Entertainment
Information
Tech.
Communi-
cations
Equipment
Aerospace
Engines
Business
Services
Distribution
Services
Forest
Products
Heavy
Construction
Services
Construction
Materials
Prefabricated
Enclosures
Heavy
Machinery
Sporting
& Recreation
Goods
Automotive
Production
Technology Motor Driven
Products
Mining & Metal
Manufacturing
Apparel
Leather &
Related
Products
Jewelry &
Precious
Metals
Textiles
Footwear
Processed
Food
Tobacco
Medical
Devices
Analytical
Instruments Education &
Knowledge
Creation
Note: Clusters with overlapping borders or identical shading have at least 20% overlap (by number of industries) in both directions.
18 Copyright 2012 © Professor Michael E. Porter 20120329 – Toronto Region Economic Summit – FINAL
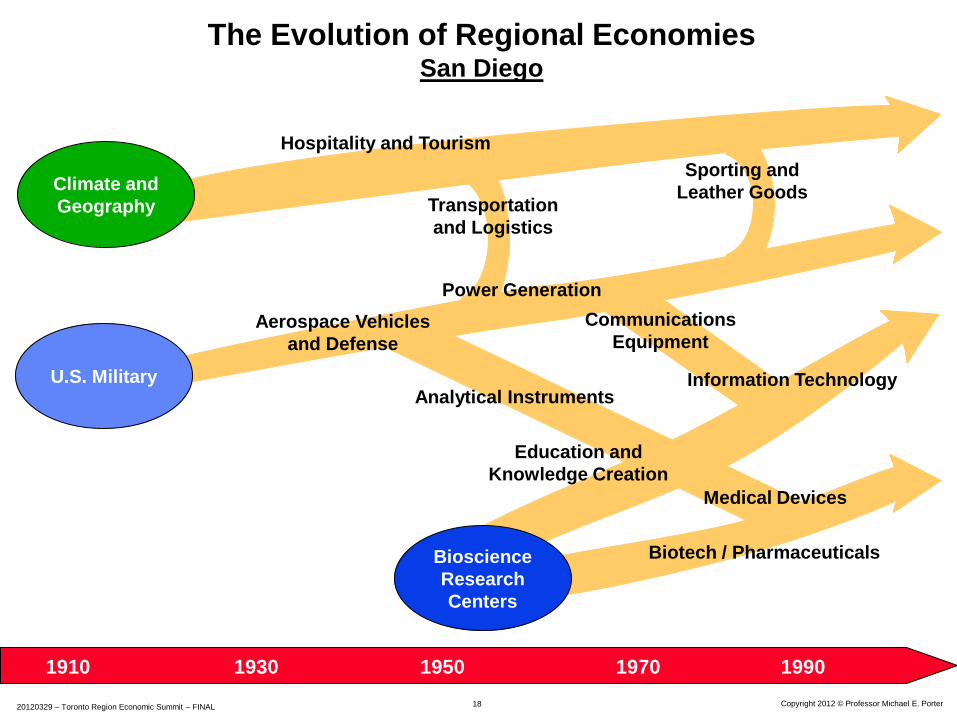
The Evolution of Regional Economies San Diego
U.S. Military
Communications
Equipment
Sporting and
Leather Goods
Analytical Instruments
Power Generation
Aerospace Vehicles
and Defense
Transportation
and Logistics
Information Technology
1910 1930 1950 1990 1970
Bioscience
Research
Centers
Climate and
Geography
Hospitality and Tourism
Medical Devices
Biotech / Pharmaceuticals
Education and
Knowledge Creation
Copyright 2012 © Professor Michael E. Porter
19 20120329 – Toronto Region Economic Summit – FINAL
0%
5%
10%
15%
20%
25%
30%
35%
40%
-6% -5% -4% -3% -2% -1% 0% 1% 2% 3% 4% 5% 6% 7%
Change in Toronto share of National Employment, 2002 to 2010
To
ron
to n
ati
on
al
em
plo
ym
en
t s
hare
, 2
01
0
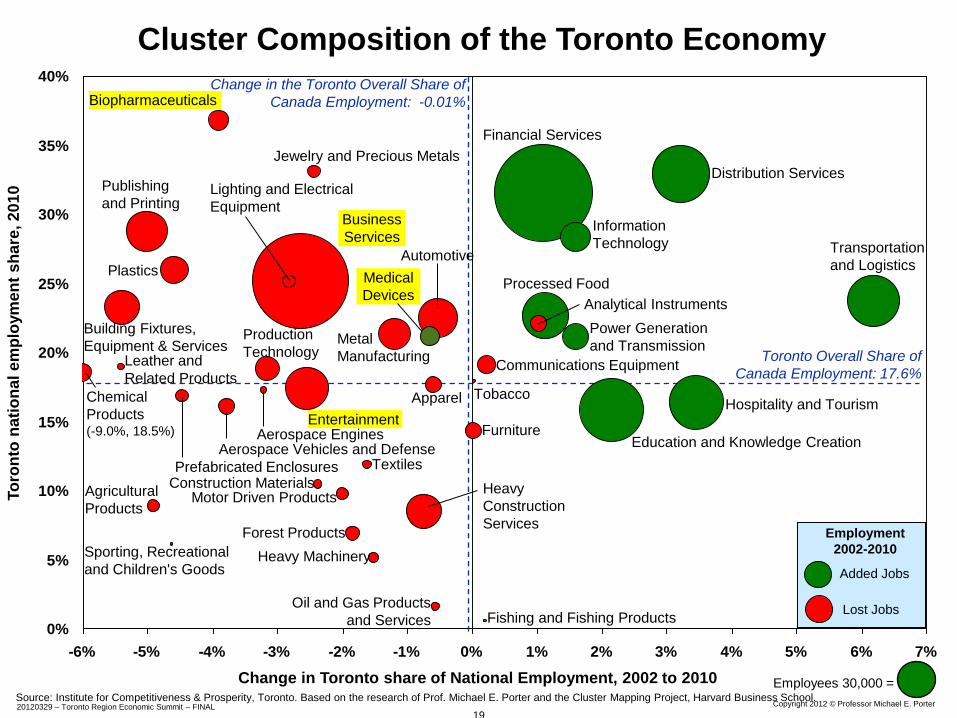
Employees 30,000 =
Cluster Composition of the Toronto Economy
Change in the Toronto Overall Share of
Canada Employment: -0.01%
Toronto Overall Share of
Canada Employment: 17.6%
Added Jobs
Lost Jobs
Employment
2002-2010
Chemical
Products (-9.0%, 18.5%)
Distribution Services
Transportation
and Logistics
Information
Technology
Financial Services
Processed Food
Hospitality and Tourism
Education and Knowledge Creation
Power Generation
and Transmission
Medical
Devices Analytical Instruments
Communications Equipment
Furniture
Biopharmaceuticals
Publishing
and Printing Business
Services
Plastics
Agricultural
Products
Entertainment
Heavy
Construction
Services
Automotive
Building Fixtures,
Equipment & Services
Jewelry and Precious Metals
Production
Technology
Lighting and Electrical
Equipment
Metal
Manufacturing
Oil and Gas Products
and Services
Aerospace Engines Aerospace Vehicles and Defense
Apparel
Forest Products
Prefabricated Enclosures
Motor Driven Products
Heavy Machinery
Textiles
Construction Materials
Leather and
Related Products
Sporting, Recreational
and Children's Goods
Tobacco
Fishing and Fishing Products
Source: Institute for Competitiveness & Prosperity, Toronto. Based on the research of Prof. Michael E. Porter and the Cluster Mapping Project, Harvard Business School.
Copyright 2012 © Professor Michael E. Porter
20 20120329 – Toronto Region Economic Summit – FINAL
Aerospace
Engines
Furniture Building
Fixtures,
Equipment &
Services
Fishing &
Fishing
Products
Hospitality
& Tourism Agricultural
Products
Transportation
& Logistics
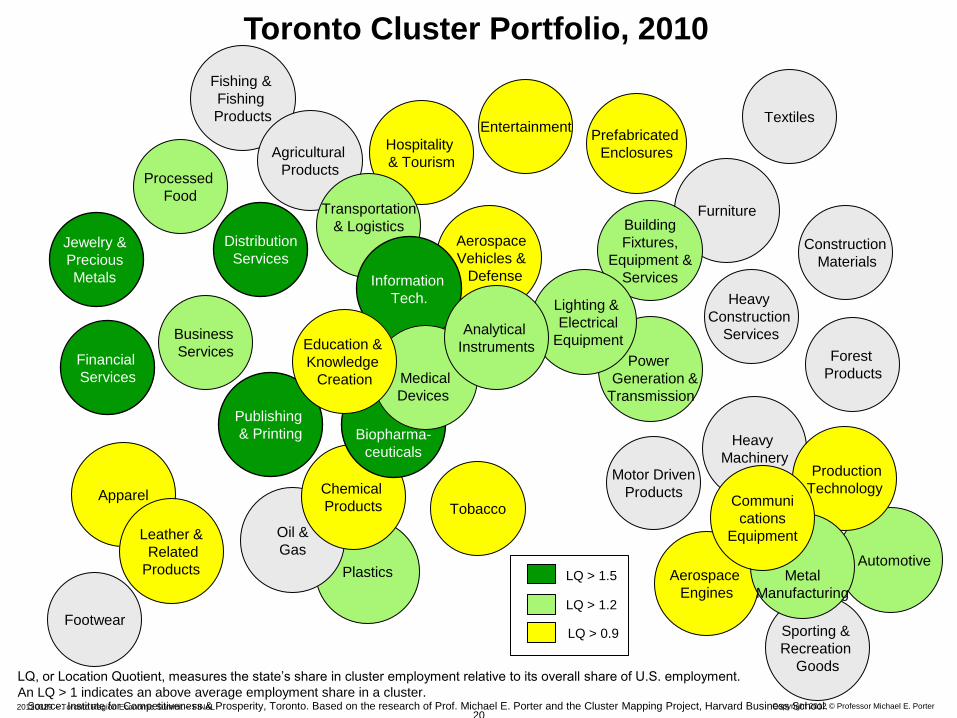
Toronto Cluster Portfolio, 2010
Plastics
Oil &
Gas
Chemical
Products
Biopharma-
ceuticals
Power
Generation &
Transmission
Aerospace
Vehicles &
Defense
Lighting &
Electrical
Equipment
Financial
Services
Publishing
& Printing
Entertainment
Information
Tech.
Business
Services
Distribution
Services
Forest
Products
Heavy
Construction
Services
Construction
Materials
Prefabricated
Enclosures
Heavy
Machinery
Sporting &
Recreation
Goods
Automotive
Production
Technology Motor Driven
Products
Metal
Manufacturing
Apparel
Leather &
Related
Products
Jewelry &
Precious
Metals
Textiles
Footwear
Processed
Food
Tobacco
Medical
Devices
Analytical
Instruments Education &
Knowledge
Creation
LQ > 1.5
LQ > 1.2
LQ > 0.9
LQ, or Location Quotient, measures the state’s share in cluster employment relative to its overall share of U.S. employment.
An LQ > 1 indicates an above average employment share in a cluster.
Communi
cations
Equipment
Source: Institute for Competitiveness & Prosperity, Toronto. Based on the research of Prof. Michael E. Porter and the Cluster Mapping Project, Harvard Business School.
21 Copyright 2012 © Professor Michael E. Porter 20120329 – Toronto Region Economic Summit – FINAL
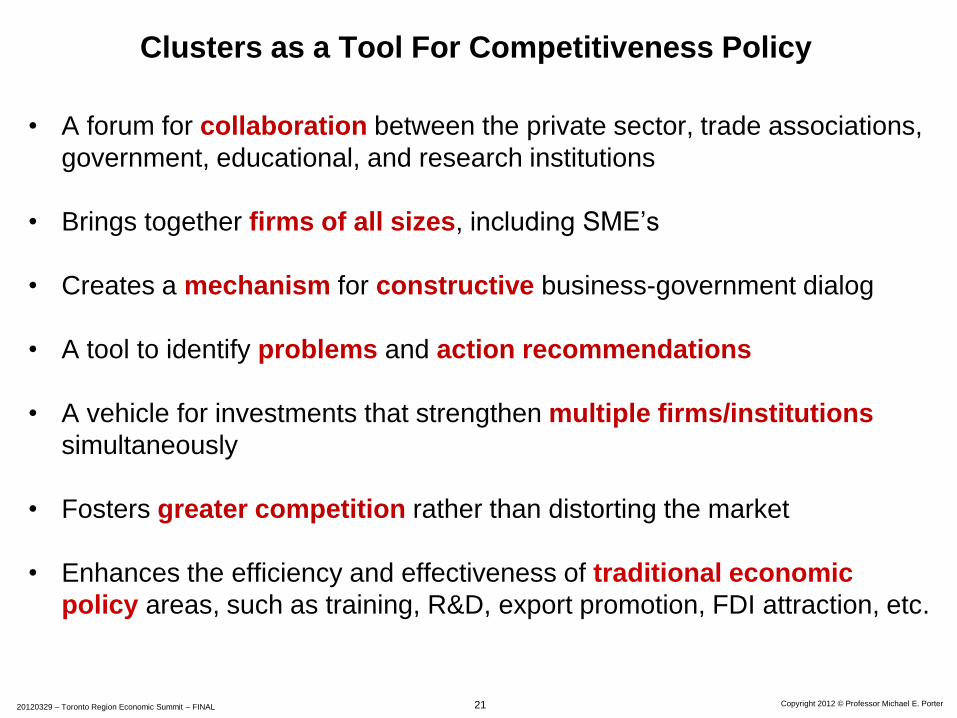
Clusters as a Tool For Competitiveness Policy
• A forum for collaboration between the private sector, trade associations,
government, educational, and research institutions
• Brings together firms of all sizes, including SME’s
• Creates a mechanism for constructive business-government dialog
• A tool to identify problems and action recommendations
• A vehicle for investments that strengthen multiple firms/institutions
simultaneously
• Fosters greater competition rather than distorting the market
• Enhances the efficiency and effectiveness of traditional economic
policy areas, such as training, R&D, export promotion, FDI attraction, etc.
22 Copyright 2012 © Professor Michael E. Porter 20120329 – Toronto Region Economic Summit – FINAL
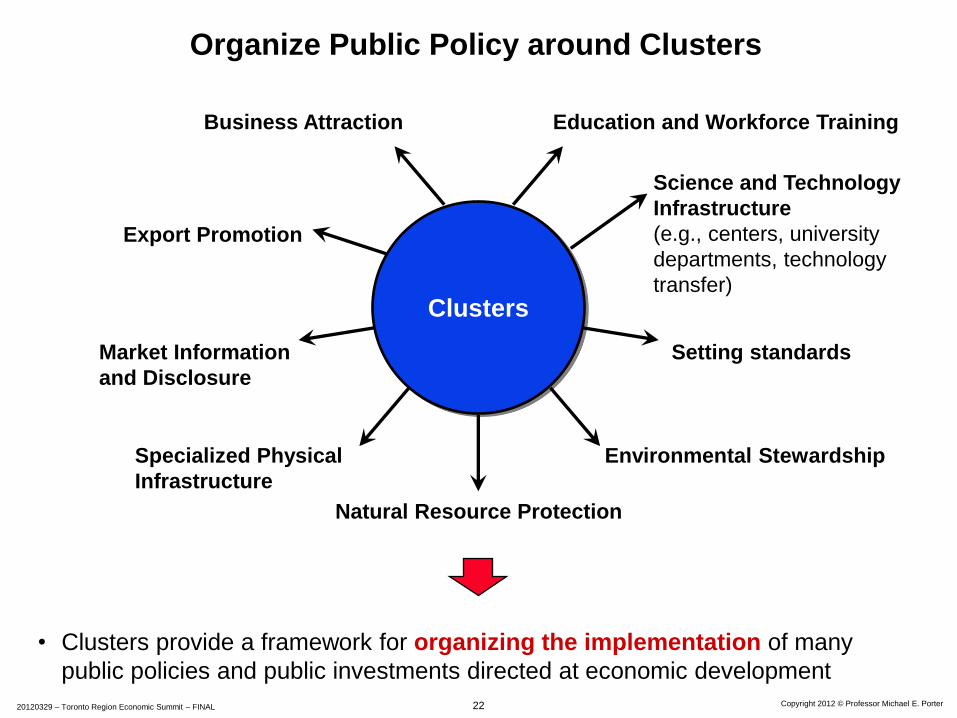
Clusters
Specialized Physical
Infrastructure
Natural Resource Protection
Environmental Stewardship
Science and Technology
Infrastructure
(e.g., centers, university
departments, technology
transfer)
Education and Workforce Training Business Attraction
Export Promotion
• Clusters provide a framework for organizing the implementation of many
public policies and public investments directed at economic development
Setting standards Market Information
and Disclosure
Organize Public Policy around Clusters
23 Copyright 2012 © Professor Michael E. Porter 20120329 – Toronto Region Economic Summit – FINAL
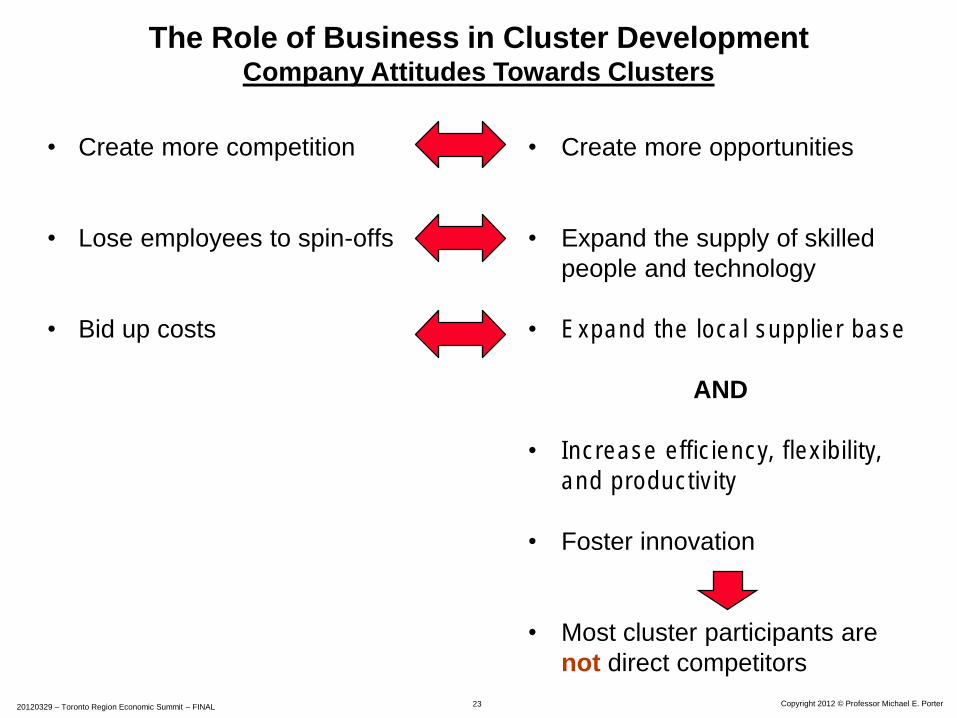
• Create more competition
• Lose employees to spin-offs
• Bid up costs
The Role of Business in Cluster Development Company Attitudes Towards Clusters
• Create more opportunities
• Expand the supply of skilled
people and technology
• Expand the local supplier base
AND
• Increase efficiency, flexibility,
and productivity
• Foster innovation
• Most cluster participants are
not direct competitors
24 Copyright © 2012 Professor Michael E. Porter 20120329 – Toronto Region Economic Summit – FINAL
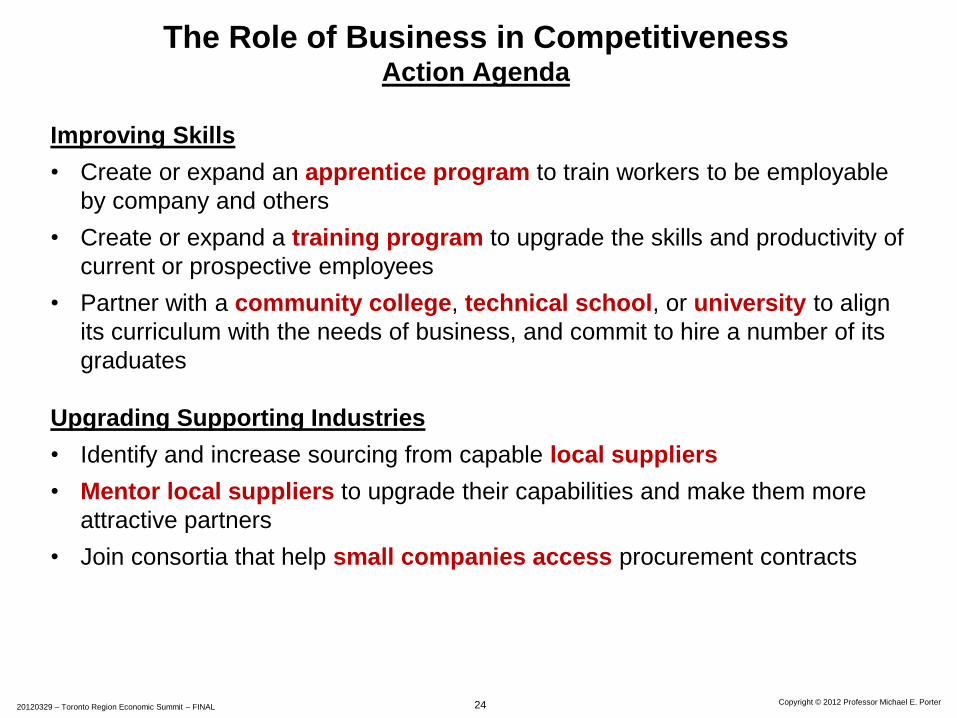
The Role of Business in Competitiveness Action Agenda
Improving Skills
• Create or expand an apprentice program to train workers to be employable
by company and others
• Create or expand a training program to upgrade the skills and productivity of
current or prospective employees
• Partner with a community college, technical school, or university to align
its curriculum with the needs of business, and commit to hire a number of its
graduates
Upgrading Supporting Industries
• Identify and increase sourcing from capable local suppliers
• Mentor local suppliers to upgrade their capabilities and make them more
attractive partners
• Join consortia that help small companies access procurement contracts
25 Copyright © 2012 Professor Michael E. Porter 20120329 – Toronto Region Economic Summit – FINAL
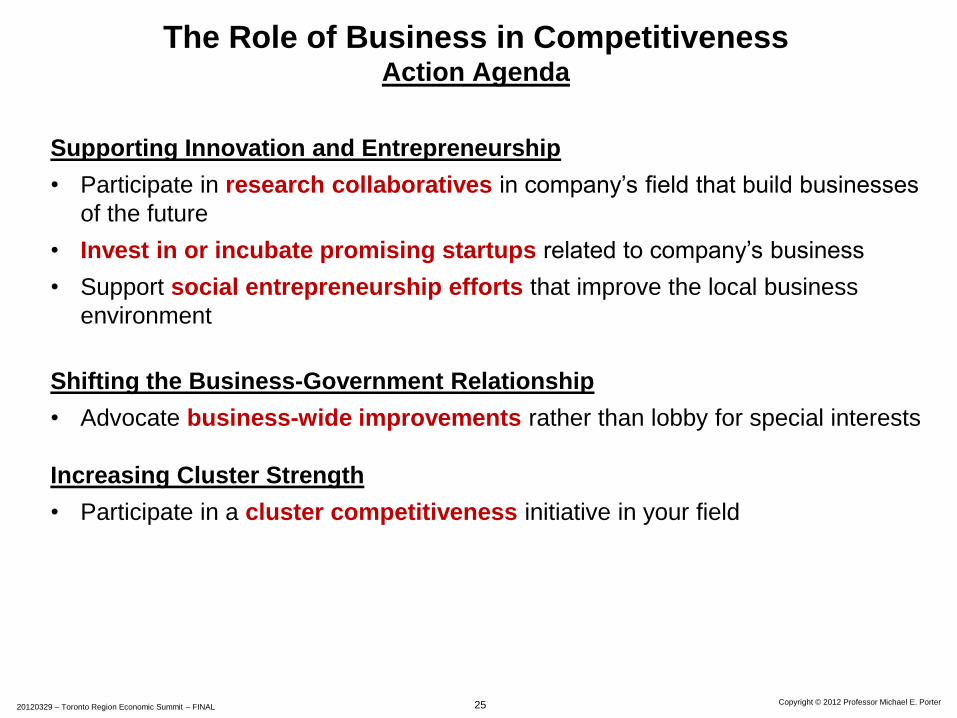
The Role of Business in Competitiveness Action Agenda
Supporting Innovation and Entrepreneurship
• Participate in research collaboratives in company’s field that build businesses
of the future
• Invest in or incubate promising startups related to company’s business
• Support social entrepreneurship efforts that improve the local business
environment
Shifting the Business-Government Relationship
• Advocate business-wide improvements rather than lobby for special interests
Increasing Cluster Strength
• Participate in a cluster competitiveness initiative in your field
26 Copyright 2012 © Professor Michael E. Porter 20120329 – Toronto Region Economic Summit – FINAL
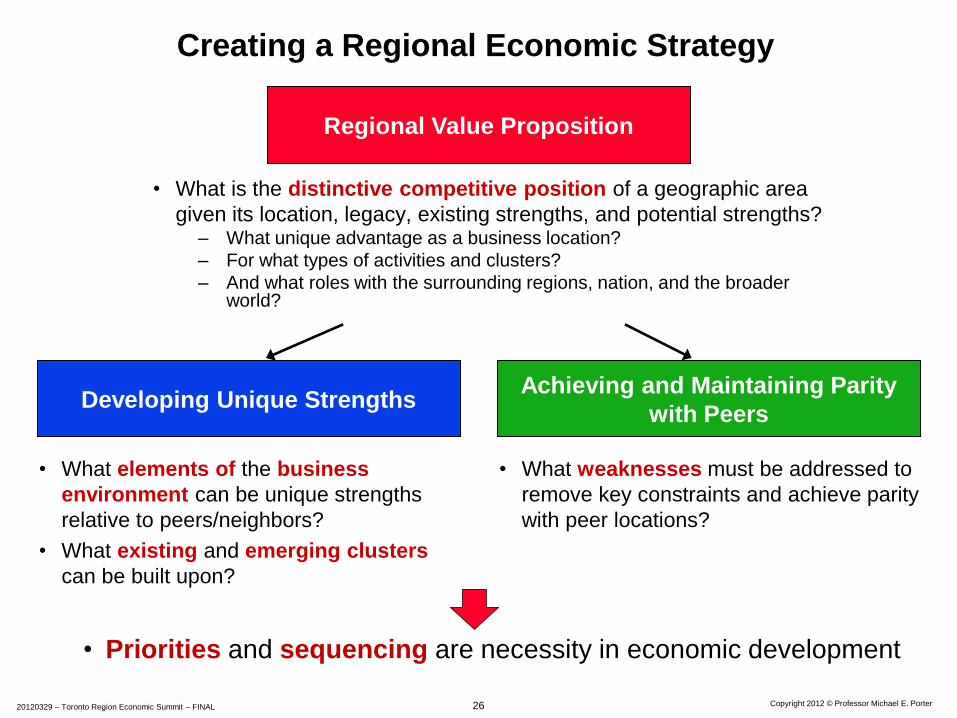
Regional Value Proposition
Creating a Regional Economic Strategy
• What is the distinctive competitive position of a geographic area
given its location, legacy, existing strengths, and potential strengths? – What unique advantage as a business location?
– For what types of activities and clusters?
– And what roles with the surrounding regions, nation, and the broader world?
Developing Unique Strengths Achieving and Maintaining Parity
with Peers
• What elements of the business
environment can be unique strengths
relative to peers/neighbors?
• What existing and emerging clusters
can be built upon?
• What weaknesses must be addressed to
remove key constraints and achieve parity
with peer locations?
• Priorities and sequencing are necessity in economic development