Embed Size (px)
Citation preview

Regional Corridors in South Asia: Regional Cooperation Agenda
Prabir DeRIS, New Delhi
Presentation at 5th South Asia Economic Summit (SAES)
September 11-13, 2012Islamabad, Pakistan

South Asia has high unrealised tradeCountry 2010 2010 2017 P/A
Unrealized trade, 2010
(US$ billion) (US$ billion) (US$ billion) (2010) (%)Actual trade
(A)Potential trade (P)
Potential trade (P)
Afghanistan 8.74 20.04 36.92 2.29 56.39
Bangladesh 42.44 87.10 123.48 2.05 51.28
Bhutan 1.49 2.98 21.00 2.00 49.97
India 573.71 798.98 2163.58 1.39 28.19
Maldives 1.37 2.20 7.43 1.60 37.66
Nepal 4.46 13.78 69.62 3.09 67.62
Pakistan 65.28 90.14 165.63 1.38 27.58
Sri Lanka 23.91 44.92 268.11 1.88 46.78
Total 721.40 1060.14 2855.77 1.4 45.68
Note: Based on a gravity modelSource: Author
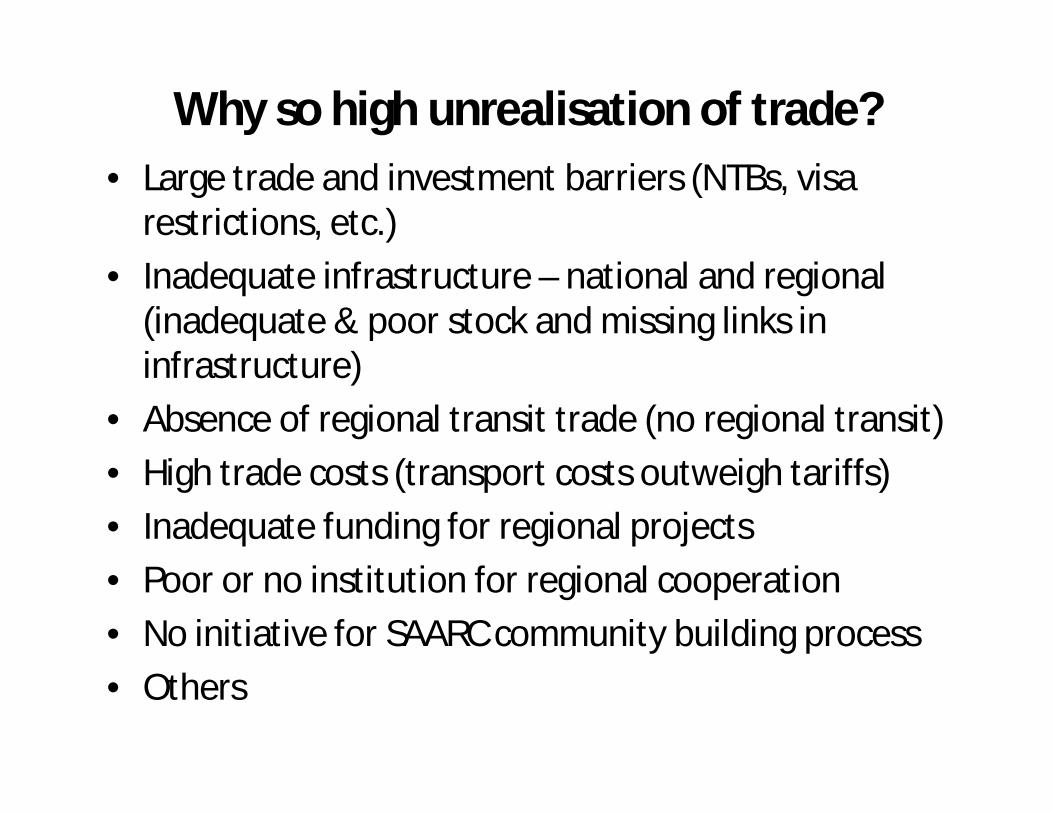
Why so high unrealisation of trade?• Large trade and investment barriers (NTBs, visa
restrictions, etc.)• Inadequate infrastructure – national and regional
(inadequate & poor stock and missing links in infrastructure)
• Absence of regional transit trade (no regional transit)• High trade costs (transport costs outweigh tariffs)• Inadequate funding for regional projects• Poor or no institution for regional cooperation• No initiative for SAARC community building process• Others

Example - NTBs in India – Pakistan trade (1/2)
Tariff barriers
Customs dutiesSpecial additional duties (SAD)Countervailing duties
Non-tariff barriers
Stringent visa regimesTrade distorting subsidiesOverland transportation limitationAir travel restrictionSea transportation restriction Transit restrictionPort of call restriction

Finance measures
Cumbersome payment systemsRestrictive official foreign exchange allocationRegulations concerning terms of trade for import paymentsNon-acceptance of letter of credit High commission of foreign banks offering letter of creditLack of bank branches
Quality control measures
License with no specific ex-ante criteriaLicense for selected importersSanitary and phytosanitary measures
Technical barriers to trade
Marking requirementsLabeling requirementsTesting, inspection and quarantine requirementsPre-shipment inspection/certificate acquisition
NTBs in India – Pakistan trade (2/2)
Source: De, Raihan and Ghani (2012) ‘What does MFN Trade mean for India and Pakistan? Can MFN be a Panacea?’ Mimeo, World Bank, Washington, D.C based on Taneja (2012), Khan (2011), Husain (2012)

Example - Poor connectivity in India –Pakistan
Sector Particular
Road transportation (passenger bus services)
Delhi – Lahore
Amritsar-Nankana Sahib
Amritsar – Lahore
Poonch – Rawalakot*
Srinagar – Muzaffarabad*
Rail transportation (passenger train services)
Delhi – Lahore
Munabao - Khokrapar
Shipping links Mumbai – Karachi
Air links
Delhi – Lahore
Mumbai – Karachi
Gas pipeline TAPI*
Electricity links Amritsar – Lahore*
Border (land) customs for trade
Wagah – Attari
Poonch - Rawalakot
Srinagar - Muzaffarabad
Monabao- Khokhrapar*
*Proposed / to be operational Source: Updated from De (2009)

Some major challenges (micro level) to trade in South Asia
1. Lack in simplification and harmonization of trade procedures, more particularly at the border.
2. No regional transit as yet3. Absence of regional corridor and modern
corridor management techniques4. No master plan for SAARC connectivity as yet5. Lack of financing and no resource mobilisation
plan for implementing regional connectivity projects
6. No regional institution for trade facilitation.

Definition, Rationale, & Literature

Regional corridors - definition
Economic corridor = Sum over all public capital, national or otherwise
Transport corridor Institutional infrastructure
Communication infrastructure
Trade corridor
Human infrastructure
GMS EWEC
n
iiXY
1
Transport corridor
Logistics corridor
Economic corridor
Catalysts: Trade facilitation, logistics services, a.o.
X Y
A B
Narrow vs. Broad CorridorsCA+CB+CH ≤ CAB
Corridor

Rationale - regional corridors1. Sustained economic growth has increased the
demand for transport and logistics services.2. Efficient transport networks have become more
important to regional cooperation, in both absolute and relative terms, as tariff-based barriers to economic cooperation have generally declined.
3. Better infrastructure would encourage fragmentation of production in the region, enhance the regional and global trade, and help realize South Asian integration process.
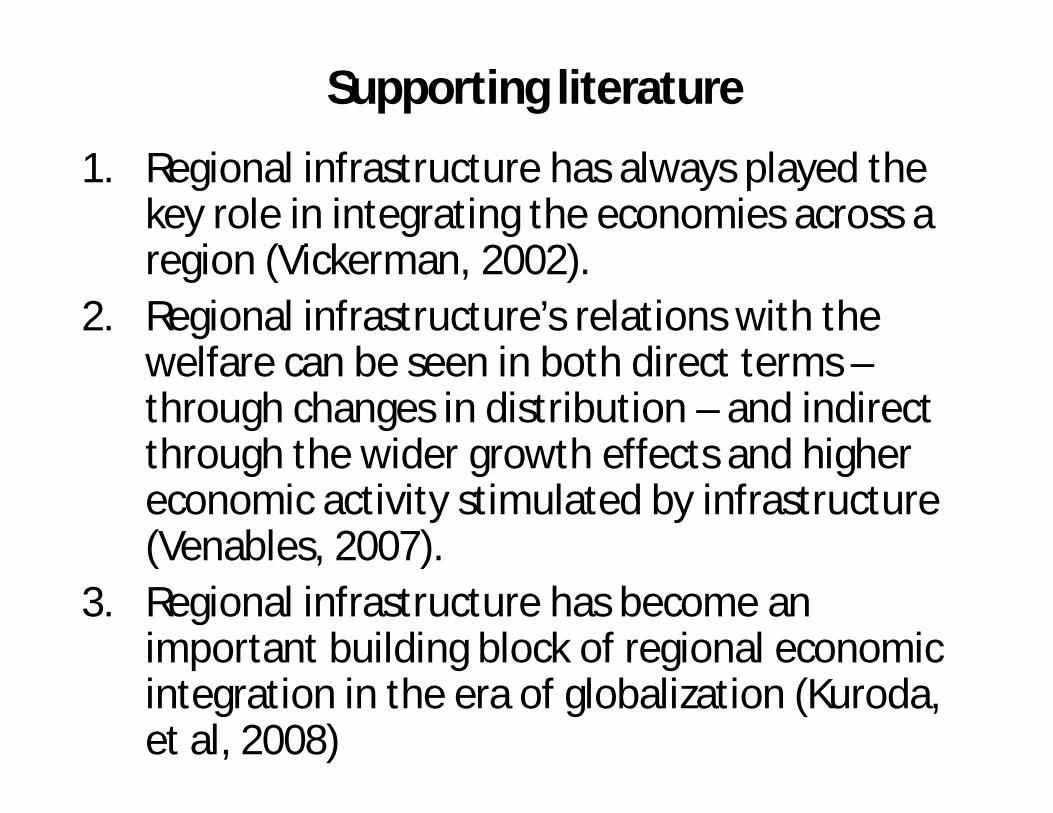
Supporting literature
1. Regional infrastructure has always played the key role in integrating the economies across a region (Vickerman, 2002).
2. Regional infrastructure’s relations with the welfare can be seen in both direct terms –through changes in distribution – and indirect through the wider growth effects and higher economic activity stimulated by infrastructure (Venables, 2007).
3. Regional infrastructure has become an important building block of regional economic integration in the era of globalization (Kuroda, et al, 2008)

Regional corridors help enhance trade flows
Source: Brooks (2008)
Regional Corridors

Regional corridors strengthen production blocks and regional integration
Corridor
Source: Kimura et al (2009)

Regional corridors foster regional cooperation
Afghanistan
Maldives
Pakistan
Sri Lanka
Bangladesh
Bhutan
Nepal
India
SAARC
x9
x2x1
x5
x10
x4x6
x7
x8
x9
X1, x2, ….,xn: countries
Corridor (s)
Source: De (2011)

List of select economic corridors in AsiaSr. No. Corridor Name Countries
1 North -South Economic CorridorPR China, Thailand, Lao PDR, Myanmar and
Viet Nam
2 East-West Economic Corridor Viet Nam, Myanmar, Lao PDR, Thailand
3 South Economic Corridor Thailand, Cambodia, Viet Nam and Lao PDR
4Kunming-Haiphong Transport Corridor-
Noi Bai-Lao Cai Hway PR China, Viet Nam
5 GMS Southern Coastal Road Corridor II Viet Nam
6CAREC Regional Road Corridor
Improvement (Sary Tash-Karamik) Kyrgyz Republic
7 Mekong ICT Project Lao PDR
8 Indonesia/North Java Corridor Indonesia, Indonesia
9 Indonesia/Eastern Sumatra Corridor Indonesia, Sumatra
10 East Asia Industrial Corridor Viet Nam, India, Thailand
11 CAREC Transport Corridor 1b Kazakhstan, PR China, Russian Federation
12 Western Regional Road Corridor Mongolia, PR China, Russian Federation Source: Author based on ADB

Four zones of regional corridors
Zone I
Zone II Zone IV
Zone III
National Regional
Nar
row
Bro
ad
National + Narrow
(Construction, upgrading)
Regional + Narrow
(Trade facilitation, logistics)
Regional + Broad
(Cross-border economic zones)
(Area development, SMEs, rural roads)
National + Broad
Source: Adapted from Srivastava (2011)
SAARC at here

Regional corridors in neighbouring regions
South Asia
SRMTC?
CAREC Economic Corridors
GMS Economic Corridors
Southeast Asia
Central Asia
IMT-GT Economic Corridors BIMP-EAGA
RegionalCorridors

Performance in trade facilitation –mixed results, needs greater
involvement of private sector in TF

South Asia has poor performance in trade facilitation
• Significant progress made in reducing time of import/export since 2005,– but developed economies also improved during that
period• On average, it still takes 30 days to move goods from
factory to deck-of-ship at the nearest seaport– South Asia: 30 days– South-East Asia: 20 days – Developed economies: 10 days
Improvements in TF could bring US$ 250 billion in additional trade for Asia and the Pacific (APEC, 2011)
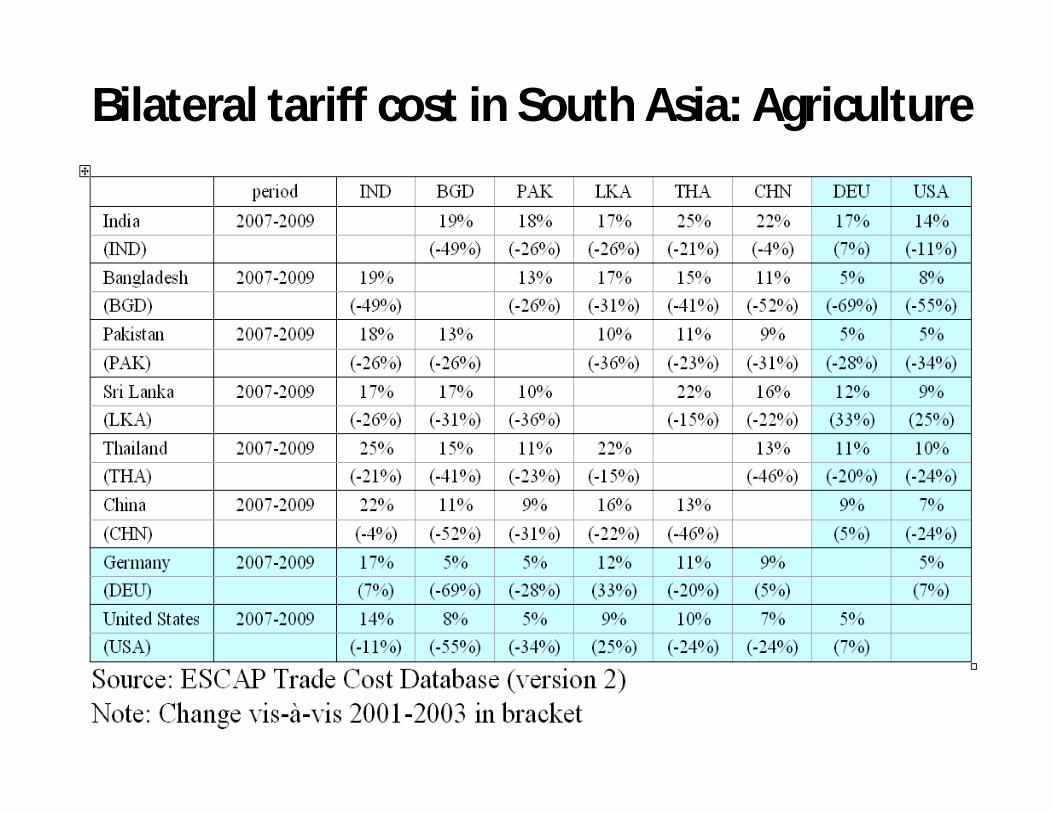
Bilateral tariff cost in South Asia: Agriculture

Bilateral non-tariff trade costs in South Asia: Agriculture

Bilateral tariff cost in South Asia: Manufacturing

Bilateral non-tariff trade costs in South Asia: Manufacturing

What explains changes in the trade costs across countries?*
50+ %
25%
10%
10%
1%
10-30%
60-90%
Natural trade costs(geographic and cultural distance between countries)
0-10%Tariff costs
Policy-relatedNon-Tarifftrade costs
Business environment
Availability/use of ICT services
Liner Shipping Connectivity (port and maritime services efficiency)
Direct cost of trade procedures
Other factors, including:-Indirect cost of trade procedures-Currency / exchange rate-Non-tariff Measures (SPS, TBT)
*simplified representation based on Duval and Uthoktham (2011)

Export takes longer time in LLDCs
YearAfghanistan Bangladesh Bhutan India Maldives Nepal Pakistan Sri Lanka
2006 66 35 38 27 21 43 31 25
2007 67 35 38 27 21 43 22 25
2008 67 28 38 18 21 43 22 21
2009 74 28 38 17 21 41 22 21
2010 74 25 38 17 21 41 22 21
2011 74 25 38 17 21 41 21 21
2012 74 25 38 16 21 41 21 21
Source: Doing Business Database, The World Bank
(Number of Days)

Rising costs of export in LLDCs(US$ per container)
Source: Doing Business Database, The World Bank
Afghanistan
Bangladesh Bhutan India Maldives Nepal Pakistan Sri
Lanka
2006 2,180 902 1,150 864 1,200 1,600 996 647
2007 2,180 902 1,150 864 1,200 1,600 515 647
2008 2,180 844 1,150 820 1,200 1,600 515 660
2009 2,680 905 1,210 945 1,348 1,764 611 715
2010 3,030 905 1,210 945 1,348 1,764 611 715
2011 3,545 920 2,230 1,055 1,550 1,960 611 715
2012 3,545 965 2,230 1,095 1,550 1,960 660 715
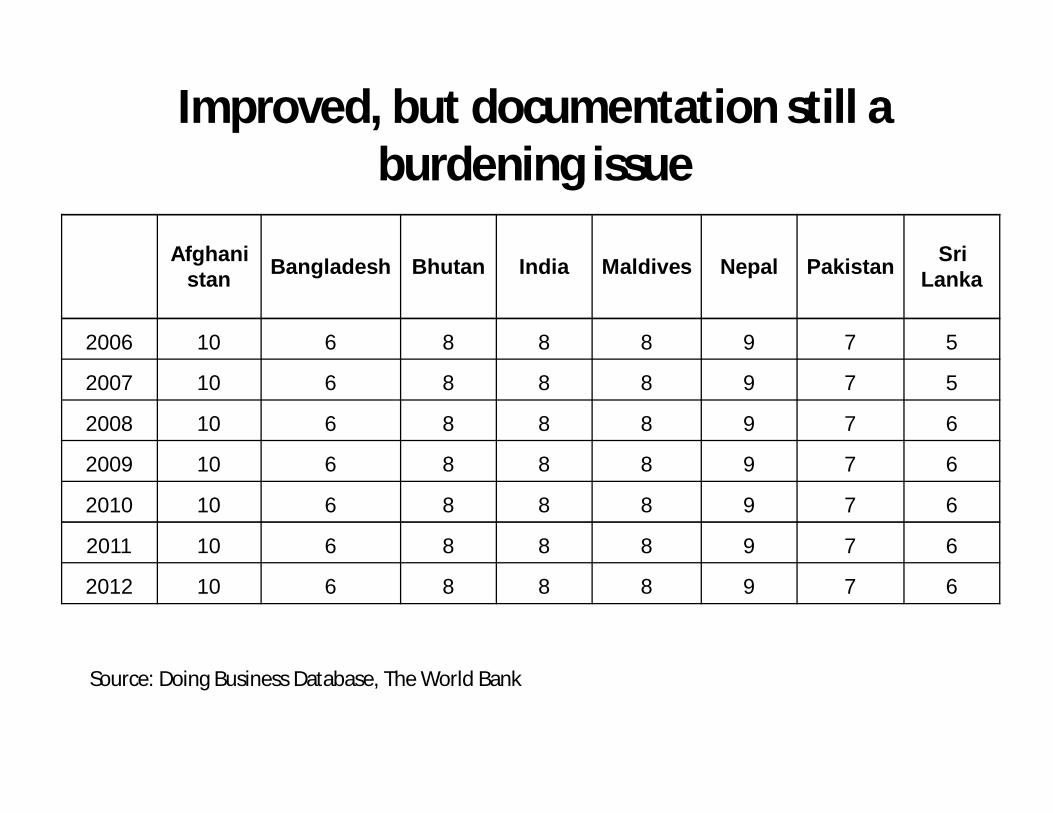
Improved, but documentation still a burdening issue
Afghanistan Bangladesh Bhutan India Maldives Nepal Pakistan Sri
Lanka
2006 10 6 8 8 8 9 7 5
2007 10 6 8 8 8 9 7 5
2008 10 6 8 8 8 9 7 6
2009 10 6 8 8 8 9 7 6
2010 10 6 8 8 8 9 7 6
2011 10 6 8 8 8 9 7 6
2012 10 6 8 8 8 9 7 6
Source: Doing Business Database, The World Bank

Policy-related non-tariff trade costs more important in South Asia – documentation
and inland transit critical to exportExport Time, 2011 Export Cost, 2011
Source: Doing Business Database, World Bank

Customs improved its performance: ExportExport time for selected products and countries in Asia (adjusted), 2010
Source: ESCAPhttp://www.unescap.org/tid/publication/tipub2615.pdf
Field level data

Customs improved its performance: Import0
510
1520
25D
ays
Inland trasportation
Terminal handling
Customs
Document preparation
Fabrics
Used CarsElectronics
Fabrics
Fabrics
Garments
Tea
RubberTyres
Fabrics
Auto Parts
Sugar
Bangladesh China India Japan Nepal Sri Lanka ThailandSource: ESCAPhttp://www.unescap.org/tid/publication/tipub2615.pdf
Import time for selected products and countries in Asia (adjusted), 2010Field level data

Days
22928 0.827 22625 Export procedures in India 124 223 Import procedures in Bangladesh 22 22120 41918 117 1.8 216 115 114 113 112 111 110 2
98 47654 13 2210 1 2 3 4 5 6 7 8 9 10 11 12 13 14 15 16 17 18 19 20 Procedures
28.25 days
Start
End
28.25 days
Start
End
Sr. No Process Days1 Buy 22 Obtain export permit 13 Contract registration and inspection 44 Excise inspection 25 Obtain cargo insurance 16 Arrange pre-shipment inspection 17 Obtain certificate of origin 18 Obtain SAFTA certificate 19 Submit customs declaration online 1
10Collect and endorse documents for import 1.75
11 Arrange transport for loading 112 Prepare other import documents 213 Provide customs declaration 0.514 Transfer to LCS 415 Parking of goods 216 Customs clearance 217 Send the goods to importer’s warehouse 118 Clear goods through customs 219 Transport to importer's premise 0.7520 Pay 1.50*
Total 28.50**
Time Procedure Chart of Trade in
Cotton Yarn Exporter = India
Importer = Bangladesh

Days
26 25 days 7252423222120 Export Procedures in Sri Lanka 19 218 Import Procedures in India 2 21716 1 1 1 115 2 214 113 0.412 0.25 0.311 0.6 0.310 0.59 18 2 0.0176 1.55 14 33210 1 2 3 4 5 6 7 8 9 10 11 12 13 14 15 16 17 18 19 20 21 22 23 Procedures
Start
End
Shipping
Start
End
Shipping
Start
End
Shipping
Start
End
Shipping
Time Procedure Chart of Trade in Rubber
TiresExporter = Sri Lanka
Importer = India
Sr. No Process Days1 Buy - conclude sales and contract terms 32 Obtain IEC code 13 Obtain bank related documents 1.54 Prepare all export documents 25 Lodge CUSDEC online 0.016 Pass CUSDEC manually 17 Obtain cargo insurance 0.58 Arrange transport and load on truck 0.69 Transport to port of departure 0.2510 Clear goods through customs at seaport 0.311 Port and terminal handling activities 0.312 Loading container onto vessel 0.413 Vessel information and filling IGM 114 Shipping 215 Allocation of berth 216 Filing Bill of entry & other import papers 117 Filing Delivery Order 118 Immigration 119 Plant quarantine 120 Unloading of goods from vessel 221 Verification of cargo 222 Send the goods to importer’s warehouse 223 Pay to exporter 7
Total days 25

Export process, 2009-10Exporter Product
exportedDestination Business process
No. of Steps No. of Parties
Bangladesh Shrimp Japan 10 14
Bangladesh Garments India 10 (8) 13 (12)
China Garments Japan 9 11
China Electronics Thailand 11 11
India Fabrics Bangladesh 13 16
India Vegetables UAE 12 14
India Fruits EU 13 14
Nepal Veg. ghee India 10 14
Nepal Veg. ghee China 5 10
Sri Lanka Rubber tyres India 7 13
Sri Lanka Tea Japan 7 12
Thailand Auto. parts India 7 11
Thailand Sugar Bangladesh 11 10
Source: ESCAP, http://www.unescap.org/tid/publication/tipub2615.pdf

Import process, 2009-10
Importer Product imported
Origin Business process
Steps involved
Parties involved
India Rubber tyres Sri Lanka 10 13
China Fabrics Japan 6 11
China Auto. parts Japan 6 11
Thailand Electronics China 6 12
Sri Lanka Fabrics India 7 13
Sri Lanka Used cars Japan 3 9
Bangladesh Fabrics India 5 8
Bangladesh Sugar Thailand 4 7
Nepal T&C India 5 10
Source: ESCAP, http://www.unescap.org/tid/publication/tipub2615.pdf

Export documents, 2009-10 Product
exportedDestination Documents Needed
(No.)
Bangladesh Shrimp Japan 24
Bangladesh Garments India 26 (17)
China Garments Japan 14
China Electronics Thailand 17
India Fabrics Bangladesh 18
India Vegetables UAE 22
India Fruits EU 27
Nepal Veg. ghee India 26
Nepal Veg. ghee China 43
Sri Lanka Rubber tyres India 19
Sri Lanka Tea Japan 24
Thailand Auto. parts India 35
Thailand Sugar Bangladesh 39
Source: ESCAP, http://www.unescap.org/tid/publication/tipub2615.pdf

Import documents, 2009-10
Product Imported Origin Documents Needed(No.)
India Rub tyres Sri Lanka 9
China Fabrics Japan 13
China Auto. parts Japan 13
Thailand Electronics China 44
Sri Lanka Fabrics India 19
Sri Lanka Used cars Japan 18
Bangladesh Fabrics India 10
Bangladesh Sugar Thailand 11
Nepal T&C India 20
Source: ESCAP, http://www.unescap.org/tid/publication/tipub2615.pdf

Requirement of export documents and copies, 2009-10
Export ProductDocuments Needed (No.)
from to Types Copies
China Japan Garments 14 28
China Thailand Electronics 14 22
India Bangladesh Fabrics 18 26
India UAE Vegetables 22 26
India EU Fruits 27 29
Thailand India Automobile parts 35 46
Thailand Bangladesh Sugar 39 50
Source: ESCAP, http://www.unescap.org/tid/publication/tipub2615.pdf

Import
Product
Documents Needed (No.)
from to Types Copies
India Sri Lanka Rubber tyres 9 17
China Japan Fabrics 16 37
China Japan Automobile parts 16 37
Thailand China Electronics 44 54
Requirement of import documents and copies, 2009-10
Source: ESCAP, http://www.unescap.org/tid/publication/tipub2615.pdf

Development of regional corridors –some outcomes are building
infrastructure, trade creation, generating production network (supply
chain), improves global and regional competitiveness, narrowing
development gaps, ..…

Intra-South Asia trade flow, 2011
AFG BDG IND MDS NPL PAK SL
South Asia Total
Share (%)
AFG 23.16 141.73 0.00 154.34 0.00 319.23 1.61
BDG 6.51 539.75 0.00 15.38 77.02 18.34 657.00 3.32
IND 517.89 4062.38 121.46 2335.78 2313.89 4890.58 14241.98 71.98
MDS 0.64 33.96 0.00 0.01 19.97 54.58 0.28
NPL 0.00 25.78 492.55 0.01 1.08 1.64 521.06 2.63
PAK 1930.99 635.81 320.59 5.07 1.01 303.05 3196.52 16.16
SL 0.00 25.49 625.09 72.30 0.64 72.21 795.73 4.02
Total 19786.10 100.00
Source: DOTS, IMF
(US$ million)

Trade and connectivity flow – South Asia with neighbouring regions – rising trade not
supported by adequate connectivity
SouthAsia
Central Asia
Southeast AsiaMiddle east/
Gulf
Southwest Asia
ANZ +Pacific
East Asia
Africa
Europe
Trade linkage (strong)Connectivity linkage (weak)
Weak
Moderate
Strong
Source: De (2012)
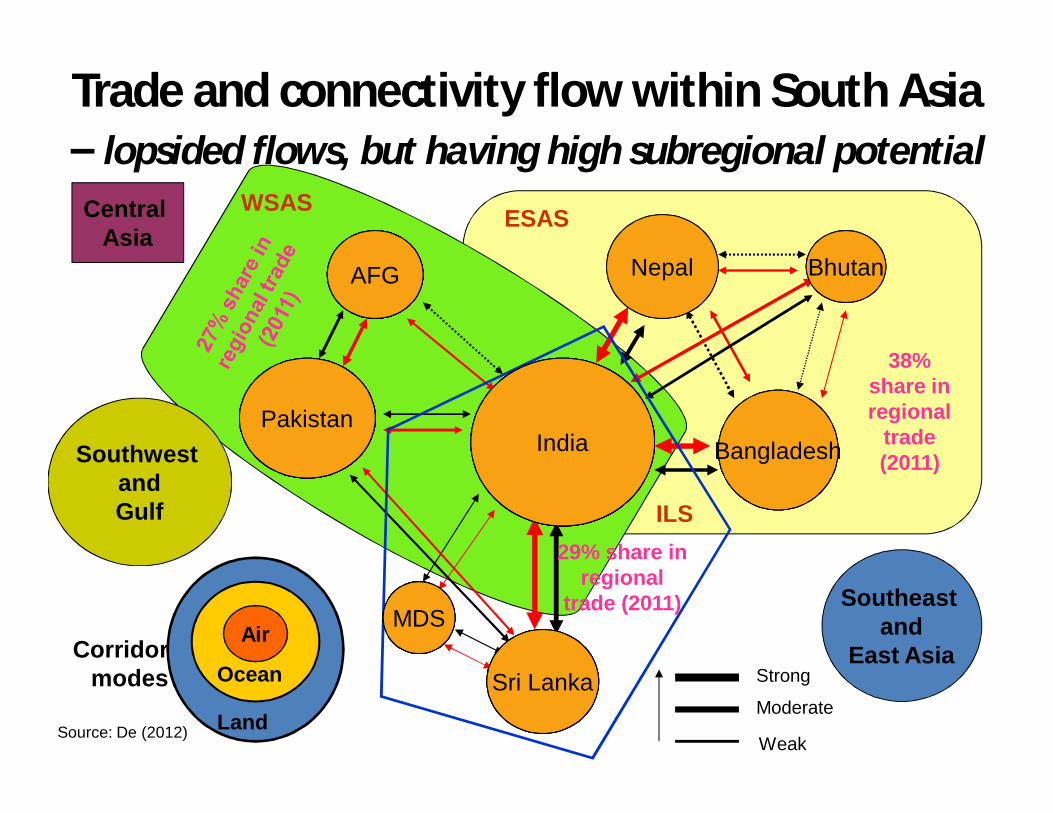
Trade and connectivity flow within South Asia – lopsided flows, but having high subregional potential
PakistanIndia
Sri Lanka
Nepal
Bangladesh
Bhutan
Southeast and
East AsiaMDS
AFG
ESAS
38% share in regional
trade (2011)
WSAS
Southwest andGulf
Central Asia
ILS29% share in
regional trade (2011)
Air
Land
Corridor modes
Pakistan
AFG
IndiaPakistan
AFG
MDS
IndiaPakistan
AFG
Sri Lanka
MDS
IndiaPakistan
AFG
Bangladesh
Sri Lanka
MDS
IndiaPakistan
AFG Bhutan
Bangladesh
Sri Lanka
MDS
IndiaPakistan
AFG Nepal Bhutan
Bangladesh
Sri Lanka
MDS
IndiaPakistan
AFG
Strong
Moderate
Weak
Ocean
Source: De (2012)
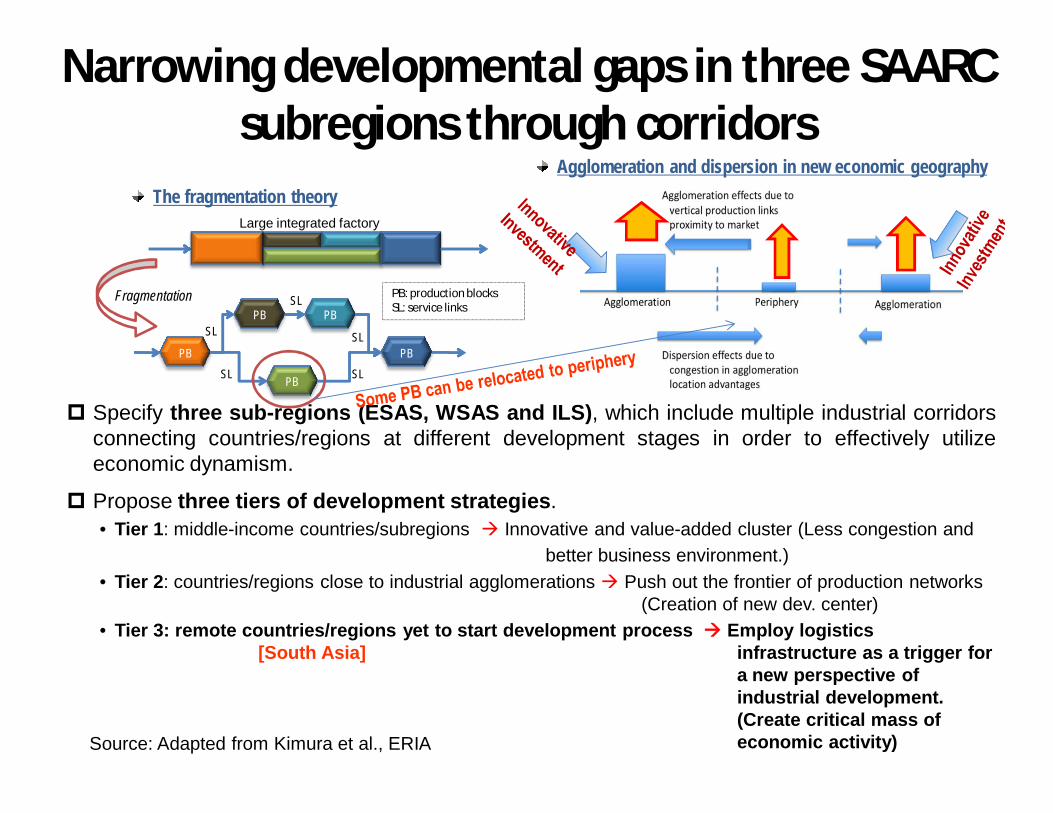
Specify three sub-regions (ESAS, WSAS and ILS), which include multiple industrial corridorsconnecting countries/regions at different development stages in order to effectively utilizeeconomic dynamism.
Propose three tiers of development strategies.• Tier 1: middle-income countries/subregions Innovative and value-added cluster (Less congestion and
better business environment.)• Tier 2: countries/regions close to industrial agglomerations Push out the frontier of production networks
(Creation of new dev. center)• Tier 3: remote countries/regions yet to start development process Employ logistics
[South Asia] infrastructure as a trigger for a new perspective of industrial development. (Create critical mass of economic activity)
PB: production blocksSL: service links
Agglomeration and dispersion in new economic geography
PB
PB
PB PB
PB
SL
SL
SL
SL
SL
Large integrated factory
The fragmentation theory
Fragmentation
Narrowing developmental gaps in three SAARC subregions through corridors
Source: Adapted from Kimura et al., ERIA

Economic welfare higher with improved connectivity and trade facilitation –
(i) Bangladesh – India trade(ii) India – Pakistan trade
What is the emerging direction of trade in South Asia?

General equilibrium simulation 1
Effects on Total Imports (% change from the base)
Source: De, Raihan and Kathuria (2012) World Bank WPS # 6155
Effects on Total Exports (% change from the base)
Welfare Effects of Bangladesh – India MFN Trade

Welfare Effects of India - Pakistan MFN Trade
General equilibrium simulation 2
(Equivalent variation in US$ million at 2007 prices)
Source: De, Raihan and Ghani (2012) ‘What does MFN Trade mean for India and Pakistan? CanMFN be a Panacea?’ Mimeo, World Bank, Washington, D.C
Country MFN MFN+BTF Bangladesh 21.08 32.25India 160.71 1406.67Nepal 18.01 32.22Pakistan 99.21 1229.08Sri Lanka 34.92 63.32Rest of South Asia 15.72 21.38China -10.52 -102.62USA -18.39 -122.33EU25 -29.55 -200.94Rest of the World -66.71 -585.41Note: MFN = Most Favored Nation; BTF = Bilateral Trade Facilitation between India and Pakistan Source: GTAP simulation

General equilibrium simulation 3
Country SAFTA without MFN SAFTA with MFN SAFTA+MFN+STF
Bangladesh -132.85 -111.77 1479.56India 1650.02 1810.73 5452.03Nepal 467.03 485.03 1654.21Pakistan 1022.46 1121.67 2618.38Sri Lanka 36.98 71.88 2173.12Rest of South Asia 282.49 298.21 1265.02China -205.69 -216.19 -760.12USA -252.08 -270.47 -985.54EU25 -318.77 -348.32 -1394.91Rest of the World -615.01 -681.72 -3020.78
India – Pakistan MFN and Welfare Effects of SAFTA(EV in million US$ at 2007 prices)
Source: De, Raihan and Ghani (2012) ‘What does MFN Trade mean for India and Pakistan? CanMFN be a Panacea?’ Mimeo, World Bank, Washington, D.C
Note: MFN = Most Favored Nation; STF = Trade facilitation among SAFTA member states

Larger gains in trade facilitation would come from bigger economies – more cooperation
and unilateral actions must
Reporter PartnerActual Trade
Potential Trade
Potential Trade P/A UT
2010 (A) 2010 (P) 2017 (P) 2010 2010
(US$ million) (%)
India
Afghanistan 516.16 1619.96 4961.31 3.138 68.14
Bangladesh 3376.42 18519.71 62528.75 5.485 81.77
Bhutan 345.48 427.21 773.22 1.237 19.13
Maldives 131.63 184.64 210.66 1.403 28.71
Nepal 2322.11 3851.02 11598.71 1.658 39.70
Pakistan 2563.33 9447.58 17376.59 3.686 72.87
Sri Lanka 3797.00 5803.96 22554.18 1.529 34.58
(a) India
Note: Based on a gravity modelSource: Author

Larger gains in trade facilitation would come from bigger economies – more
cooperation and unilateral actions must
Reporter Partner Actual TradePotential
TradePotential
Trade P/A UT
2010 (A) 2010 (P) 2017 (P) 2010 2010
(US$ million) (%)
Pakistan
Afghanistan 1875.67 2474.73 4989.85 1.319 24.21
Bangladesh 457.33 957.57 2075.13 2.094 52.24
Bhutan 0.24 30.99 72.14 131.341 99.24
India 2760.40 7415.73 9350.72 2.686 62.78
Maldives 4.54 14.68 25.39 3.234 69.08
Nepal 1.96 150.89 501.35 76.903 98.70
Sri Lanka 341.50 888.38 1693.41 2.601 61.56
Note: Based on a gravity modelSource: Author
(b) Pakistan

Towards Regional Corridors - Trade (and Transport) Facilitation Progress so Far

SAARC connectivity – mixed progress• Negotiation of Regional Transport and Transit Agreement, and a Regional Motor
Vehicle’s Agreement (ongoing).• SAARC Expert Group finalized the text of the Regional Agreement on Railways in August
2011. • Launch of feasibility studies of pilot projects:
– Birganj and Kathmandu (160 km) completed in October 2008 – negotiation ongoing• Kathmandu-Birgunj-Kolkata/Haldia – rail corridor
– Birgunj-Katihar-Singhabad-Rohanpur-Chittagong with links to Jogbani, Biratnagar and Agartala – rail corridor
– Agartala-Akhaura-Chittagong – rail corridor• Construction between Agartala and Akhaura (14 km) is about to commence.
– Phuntsholing and Hashimara – road corridor– Ferry link - between Colombo and Tuticorin (started already) and Colombo and Cochin – Karachi – Mumbai ferry link– Air link - Malé-New Delhi and Islamabad-New Delhi; – Establishment of modern border crossing facility at Phuntsholing. – Indian ocean cargo cooperation
• On-going projects: – Feasibility study for India - Bhutan rail link– Construction of railway line from Jiribam-Tupui (near to Imphal, India) has commenced– Construction of Kaladan Multimodal Transport project has started in December 2010– Railway infrastructure improvement projects in Sri Lanka– Intermodal connectivity – Air Services Agreement (single ticket to fly between South Asian nations)
• Demonstration run of container train involving Bangladesh, India and Nepal is being planned

Demonstration run of container train between ECO and SAARC?
Source: Drawn based on information of ECO & UNESCAP

Progress in modernizing and opening of land customs stations
• India’s Integrated Check Post (ICPs) project – Attari already started working since April 2012 [spread over 118 acres, a passenger terminal 9,600 s.m; cargo terminal 4,700 s.m; separate import and export warehouses, 10,000 s.m., parking space 50,000 s.m., etc.)
• Opening of Banglabandha – Fulbari land port for trade
• Opening of border haat in Baliamari (Bangladesh) –Kalaichar (India), and fFew more border haats (e.g. between India and Bangladesh) coming up

Progress in Customs cooperation• SAARC Agreement on Mutual Administrative Assistance in
Customs Matter, signed in 2005• The Seventh Meeting of the Sub-Group on Customs Cooperation
(11-12 February 2010) made following recommendations with a view to facilitating trade in goods in SAARC. – Building infrastructure including roads and railways networks near the
LCSs.– Customs clearance procedures at LCSs need to be smoothened;– Customs Administrations may consider a system of customs facilitation in
which export documentation of one Member State could be considered by the Customs Administration in the importing country for the purposes of assessing and clearing the consignment.
– Need for developing an Electronic Data Exchange System within the region, including at LCSs, with a view to ensure better facilitation of trade in goods among the SAARC countries including improved compliance.
– SAARC Secretariat to develop a regional/sub-regional project to set up automated customs clearing mechanism at the designated LCSs.
– Harmonisation of 8-digit tariff lines is needed, and in order to make this task easier, all Member States would further provide upto only 100 8-digit tariff lines with a trade potential of 75% (in value terms) in the region.

Recent development in Customs cooperation• Declaration of the Fifteenth Meeting of the Committee on
Economic Cooperation - Maldives, 15-16 July 2012 (Source: SAARC Secretariat Press Release July 24, 2012)– The Meeting recognised delays in customs clearance
procedures and decided that henceforth electronic copies of specimen signatures and seals of officials authorised to sign SAFTA Certificates of Origin may also be accepted in addition to sending the original copies of such documents in order to save time and to ensure that the consignments are not held up at the customs border points.
• India – Pak customs cooperation agreement, mutual recognition of standards and redressal of trade disputes

Encouraging progress in transit• Common transit is must for a common market• All SAARC countries have in-principally agreed to regional
transit. • Motor Vehicle Agreement is being negotiated.• SAARC Expert Group finalized the text of the Regional
Agreement on Railways in August 2011. • Sub-regional transit has been agreed between India, Nepal,
Bhutan and Bangladesh. – Bilateral document between India and Bangladesh signed
during the state visit of Indian PM to Bangladesh in September 2011 to facilitate overland transit traffic between Bangladesh and India
– Demonstration run of container train between Bangladesh, India and Nepal is getting ready.
• Huge trade opportunities if Afghanistan – Pakistan Transit Agreement covers Western South Asia and Central Asia

Subregional transit better option to open regional transit
AGH
PAK IND
BHUNPL
BDG
Source: Author
ESAS
WSAS
SOUTH ASIA
Proposed transit
ESAS: Eastern South Asia SubregionWSAS: Western South Asia Subregion

Linking South Asia with neighbours• Uzbekistan – Afghanistan railway line (a section till
Mazar-i-Sharif already opened)• Highway in Afghanistan, aided by India• TAPI gas pipeline• China – Nepal highway and railway • India – Nepal railway project, India – Bhutan railway
project, etc.• India – Myanmar – Thailand trilateral highway (a
section already in operation)• India – ASEAN ocean shipping network • India – ASEAN open sky• Others

Three important developments on regional connectivity (Strong Impact on South Asian
Trade Flow)1. Transit for traffic between India, Bangladesh,
Nepal, and Bhutan.2. Integrated check posts (ICP) in Attari in Punjab,
Moreh in Manipur, Petrapole in West Bengal, and Raxul in Bihar.
3. Pakistan – ECO and India – ASEAN connectivity projects, particularly Mekong – India Economic Corridor (MIEC) and BIMSTEC Trilateral Highway

Mekong – India Economic Corridor
• Envisaged to support India-ASEAN connectivity
• Aims to strengthen production network – regional and otherwise.
• MIEC involves integrating the four Mekong countries (Myanmar, Thailand, Cambodia and Vietnam) with India.
• It connects Ho Chi Minh City (Vietnam) with Dawei (Myanmar) via Bangkok (Thailand) and Phnom Penh (Cambodia) and further linking to Chennai in India.
• It is expected to augment trade with India by reducing travel distance between India and MIEC countries and removing supply side bottlenecks.
• Approx. investment US$ 88 billion.

Emerging Architecture, SAARC and ASEAN
Source: ASEAN-India Connectivity Report 2012, RIS

Deepening South Asian Integration

The Renewed Vision
1. With SAFTA, South Asia has entered into the second era of regional integration
2. Vision is to achieve Common (Single) Market through Customs Union and then Economic Union
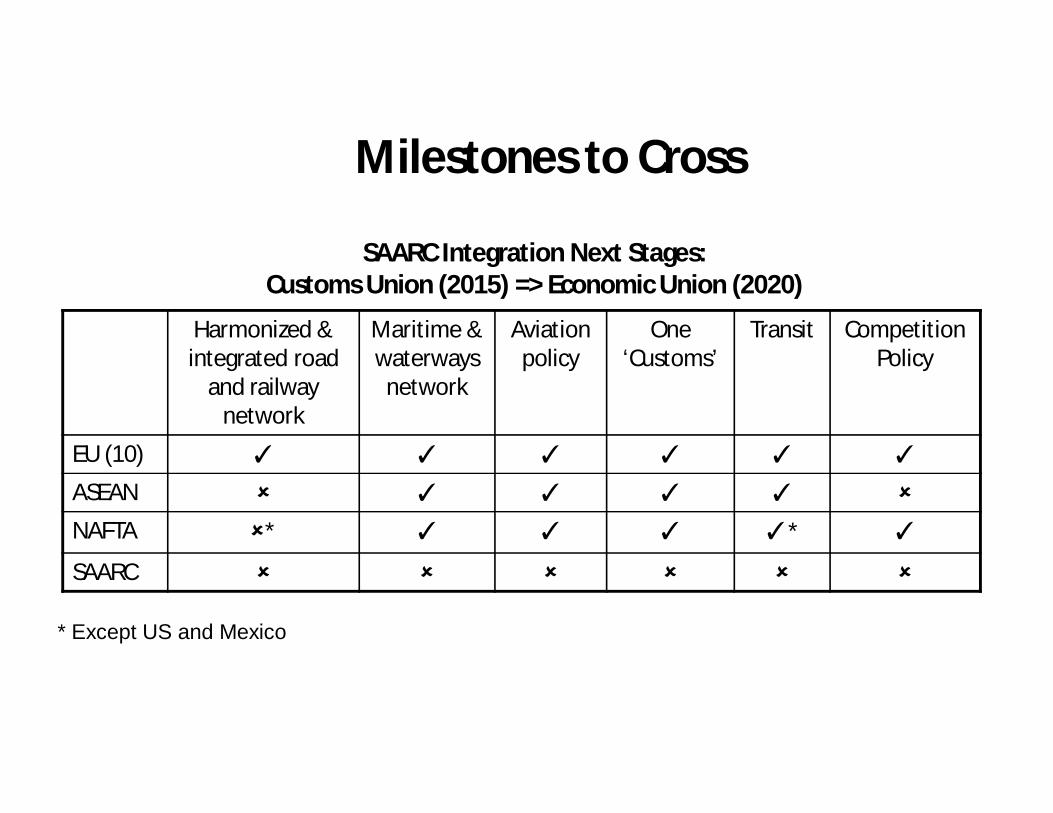
Milestones to Cross
Harmonized & integrated road
and railway network
Maritime & waterways
network
Aviation policy
One ‘Customs’
Transit Competition Policy
EU (10) ✓ ✓ ✓ ✓ ✓ ✓
ASEAN ✓ ✓ ✓ ✓
NAFTA * ✓ ✓ ✓ ✓* ✓
SAARC
SAARC Integration Next Stages: Customs Union (2015) => Economic Union (2020)
* Except US and Mexico

The Agenda

Source: World Bank

Congested land borders
Unplanned and informal market
Long queue of trucks
3.60hrs
5.00 hrs
78.40hrs
10.00hrs
Loading at Kolkata
Kolkata to Petrapole
Time at Petrapole
Unloading at Benapole
5.10hrsCrossing border returning from Benapole
International border
Total Time = 102.10 hrs. (≈ 4 days)
Kolkata
Bangladesh
India
Case of India (Petrapole) and Bangladesh (Benapole)
3.60hrs
5.00 hrs
78.40hrs
10.00hrs
Loading at Kolkata
Kolkata to Petrapole
Time at Petrapole
Unloading at Benapole
5.10hrsCrossing border returning from Benapole
International border
Total Time = 102.10 hrs. (≈ 4 days)
Kolkata
Bangladesh
India
3.60hrs
5.00 hrs
78.40hrs
10.00hrs
Loading at Kolkata
Kolkata to Petrapole
Time at Petrapole
Unloading at Benapole
5.10hrsCrossing border returning from Benapole
International border
Total Time = 102.10 hrs. (≈ 4 days)
Kolkata
Bangladesh
India
3.60hrs
5.00 hrs
78.40hrs
10.00hrs
Loading at Kolkata
Kolkata to Petrapole
Time at Petrapole
Unloading at Benapole
5.10hrsCrossing border returning from Benapole
International border
Total Time = 102.10 hrs. (≈ 4 days)
Kolkata
Bangladesh
India

Multiple handling in rail and road
• Trade Procedures at South Asia border points
Source: Based on ADB
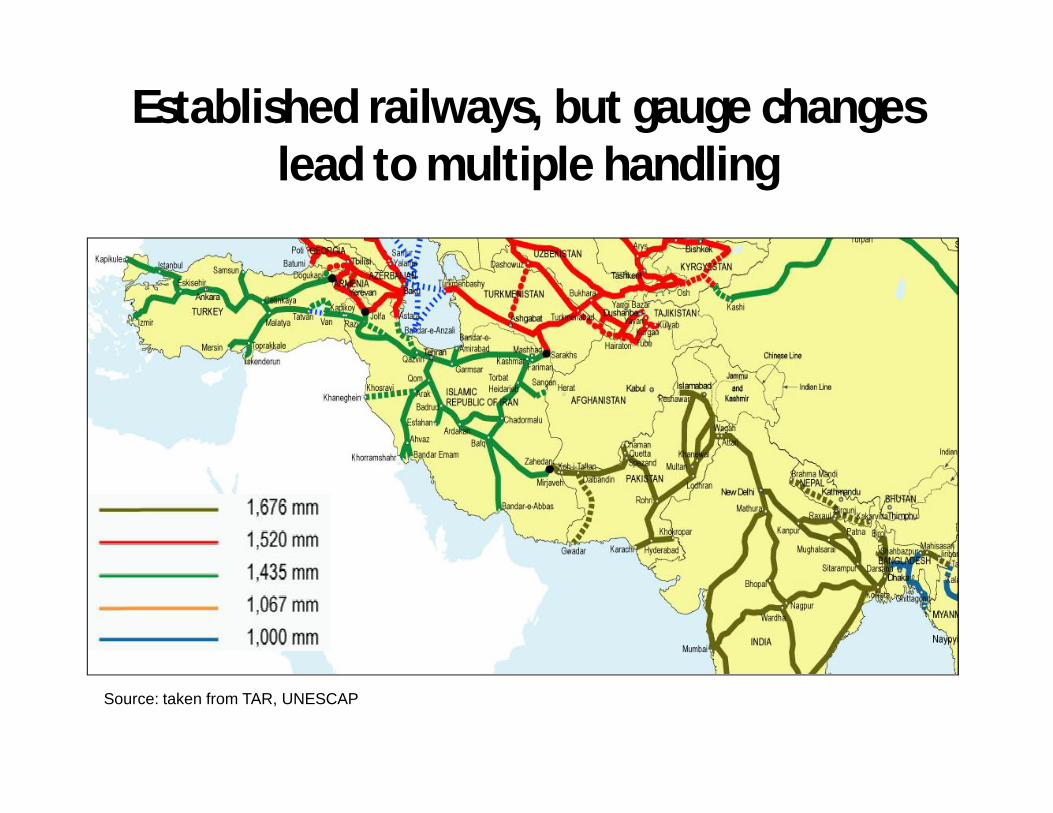
Established railways, but gauge changes lead to multiple handling
Source: taken from TAR, UNESCAP

Need to facilitate express delivery chain in South Asia
Pick-up Local station
Gateway export Hub Gateway
importLocal station Delivery
Source: Author

Cumbersome trade procedures
Source: De (2011)
(i) BPA Charts of Cotton Yarn Export from India to Bangladesh

Cumbersome trade procedures
Source: Hossain and Rahman (2011)
(ii) BPA Charts of RMG Export from Bangladesh to India

Good progress, but manual handling of documentation still in South Asia
Sr. No. Process Submission of Documents
1 Buy Electronic and manual
2 Obtain export permit Electronic
3 Contract registration and inspection Electronic and manual
4 Excise inspection Manual
5 Obtain cargo insurance Electronic
6 Arrange pre-shipment inspection Manual
7 Obtain certificate of origin Electronic and manual
8 Obtain SAFTA certificate Electronic and manual
9 Submit customs declaration Electronic
10 Arrange transport for loading Manual
11 Transfer to LCS Manual
12 Parking of goods Manual
13 Customs clearance Electronic and manual
14 Send the goods to importer’s warehouse Manual
15 Pay Electronic
Indian Export of Fabrics to Bangladesh, 2010

Absence of international conventions on trade & transport facilitation
Convention Afghanistan Bangladesh Bhutan India Maldives Nepal Pakistan Sri Lanka
Convention onRoad Traffic (1968)
No Yes No Yes No No Yes Yes
Convention on Road Signs and Signals (1968)
No No No Yes No No Yes No
Customs Convention on Temporary Importation of Commercial Road Vehicles (1956)
Yes No No No No No No No
Customs Convention on Containers (1972)
No No No No No No No No
Convention on International Transport of Goods under Cover of TIR Carnets (1975)
Yes No No No No No No No
Convention on the Contract for the International Carriage of Goods by Road (1956)
No No No No No No No No
Convention on the Harmonization of Frontier Controls of Goods (1982)
No No No No No No No No

Financing SAARC connectivity
• Set-up SAARC Infrastructure Fund (SIF)• Look for traditional sources – World Bank,
ADB, Islamic Development Bank, countries like Japan, etc.
• Domestic resources for domestic components of connectivity
• Special project development facility (SPDF) for feasibility studies

South Asian corridor integration
• Three strategies:– Asian level planning – UNESCAP– Regional / subregional level planning &
implementations: SAARC Corridors, ADB [SASEC]– National level planning & implementations:
Individual countries, ADB, a.o

Subregional inter-linkages:ECO - SAARC – BIMSTEC – GMS/ASEAN
Delhi
Kolkata
Kabul
Lahore
Dhaka GMS EWEC
Katmandu
Chennai
Chitagong
Dawei
Thimpu

Policy options • Overland connectivity is not a distant dream
– Strengthen Afghanistan - India – Pakistan road, rail and air link
– South Asia Economic corridor!• More direct links among ports. Few ports are directly
connected – No direct call of container shipping
• Open sky???…. few airports are directly connected. – New routes for cargo + passengers – Complete ASA, & implement with all South Asian
countries

Fostering South Asia Connectivity: The Enabling Environment
1. Accession to the International Conventions2. Multimodal Transport and Transit3. Strengthening and Harmonizing Rules, Regulations,
and Standards4. Demonstration Projects5. Financing Cross-border Transport Projects6. Strengthening Coordination among Countries and
Stakeholders7. Closer Cooperation on Security8. Strengthening Regional Cooperation

Some specific recommendations1. Strengthen cross-border infrastructure (move from road corridors to
economic corridors)2. Accept subregional and subsequently regional transit3. Fast track lane and priority of goods in transit to cross the border4. Set-up SAARC Single Window (Customs) (pilot run of authorized economic
operator, AEO; and mutual recognition agreement)5. Simplification and harmonization of trade procedures, more particularly at
border. 6. Introduce modern corridor management techniques in selected corridors7. Promote multimodal transportation (with rail transit, regular container train
in the region)8. Improve the efficiency of border corridors (both side of border improvement
in ICP project in parallel)9. Liberalize visa regime10. Open sky in South Asia11. Effective project coordination among government stakeholders12. Stronger institution (public-private interface) for trade facilitation is urgently
needed. 13. Regional study for SAARC Master Plan of Connectivity should be done.14. Set-up SAARC connectivity coordination committee to coordinate the Master
Plan and its feasibility.

Thank [email protected]
ADB-UNESCAP BPA Study – Trade procedures harmonization study
SASEC Corridors

Target Corridor 1 (Nepal Corridor)
Kakarvitta-Panitanki-Fulbari-Banglabandha

Target Corridor 2 (Bhutan Corridor)
Phuentsholing-Jaigaon-Hasimara-Changrabandha-Burimari

Target Corridor 3 (Nepal Corridor)
Kathmandu-Birgunj-Kolkata

Team Members
Name RemarksPrabir De Team leader
Achyut Bhandari Bhutan
Abid Khan Bangladesh
Tahseen Khan India
Pushpa Rajkarnikar Nepal
Cuong NguyenTasneem Mirza
ADB
Sangwon Lim ESCAP