Embed Size (px)
Citation preview

TRANSPORTATION RESEARCH RECORD 1114 37
Regional Differences in Preferences for Median Crossover Signing
GILLIAN M. WoRSEY, CHARLES E. DARE, AND RICHARD N. SCHWAB
Described In this paper Is a study of advance warning signs for median crossovers on divided highways. Candidate crossover signs were Identified from a literature review, survey of current state practices, and discussions with FHWA personnel. Seven of these signs were selected for further testing In a laboratory study for leglblllty, understanding, and driver preference. Sixty subjects representing a cross-section of drivers participated In the study: 30 at the Turner-Fairbanks Highway Research Center In McLean, Virginia, and 30 at the University of Missouri-Rolla In Rolla, Missouri. 1\vo of the seven signs were word messages and five were symbolic signs. The results from both groups of participants showed that the most appropriate word message sign would appear to be "median crossover.'' This sign was understood best by the participants to whom It was shown, and "crossover" was the word the majority of participants believed best conveyed the Intended meaning. Of the symbolic signs tested, the one found to be the best was that of two median noses. This symbolic sign performed well In tests of legibility and understanding and was the sign least often confused with other signs. It was also the symbolic sign most preferred by the participants and was the simplest of the symbolic designs. The symbolic signs were substantially more legible than the word messages, and the symbolic design of two median noses is recommended to Identify median crossovers.
Median crossovers are often provided on divided highways between intersections for the use of emergency vehicles and to accommodate minor turning movements for convenient access to adjacent roadside development. About 35 percent of the accidents that occur between intersections on four-lane highways involve median openings (1) . As a result concern has been expressed that public-use crossovers may be hazardous, especially where visibility of the crossover is limited. If used, such crossovers should be signed to provide advance warning to drivers. Hazards associated with crossovers include (a) vehicles slowing down in the fast lane of a divided highway or accelerating into it, (b) vehicles turning across the divided highway, and (c) vehicles making sudden lane changes. These maneuvers may possibly lead to rear-end or broadside collisions.
The third revision of the 1978 Manual on Uniform Traffic Control Devices (MUTCD) (2) provides for the use of a median crossover sign (Dl3-l, see Figure 1) but this is a large (6-x 3-ft) guide sign and there may not be sufficient room on suburban divided highways to erect such a large sign. Also, it is not the color that is customarily used for warning messages.
G. M. Worsey and C. E. Dare, Department of Civil Engineering, University of Missouri-Rolla, Rolla, Mo. 65401. R. N. Schwab, Federal Highway Administration, Turner-Fairbank Highway Research Center, 6300 Georgetown Pike, McLean, Va. 22101.
The MUTCD does not currently suggest an advance warning sign for median crossovers, although it does suggest that a green and white advance message sign showing the distance to the crossover (D13-2) may be used.
The principal findings of a study to determine the most appropriate design of an advance warning median crossover sign are discussed in this paper. The objective of the study was to identify alternative designs for median crossover signs from a nationwide review of practices for signing median crossovers and related literature on traffic signs. These alternative designs were then tested for legibility, recognition, meaning, and preference. They were first tested at the Turner-Fairbanks Highway Research Center in McLean, Virginia, and later at the University of Missouri-Rolla, thus enabling a comparison to be made between the results obtained in Virginia and those obtained in Missouri.
METHOD
Participants
The Virginia participants were paid volunteers recruited from among research fellowship students and computer center staff at the Turner-Fairbanks Highway Research Center and from a list of participants in previous experiments at the center.
Thirty participants were tested, 10 (5 males and 5 females) in each of the following age groups: 17 to 29, 30 to 49, and 50 and over. The mean age of participants in each group was 22.6, 40.4, and 58.6 years, respectively. All participants had their vision tested on an Ortho-Rater to ensure corrected visual acuity of 20/33 or better and to ensure normal color vision. The mean visual acuity was 20/20.
The Missouri participants were unpaid volunteers recruited from among psychology and civil engineering students, staff, faculty, and wives of faculty members at the University of Missouri-Rolla. Thirty subjects in the 17 to 29, 30 to 49, and 50
72"
CROSSOVER
¢===i
WHITE ON GREEN
36"
FIGURE 1 Median crossover sign (Dl3-l) (2).

38
and over age groups were tested. The mean age of participants in each group was 20.7, 41.2, and 58.3 years, respectively. The differences in mean ages for the Missouri and Vrrginia participants were fairly small.
The only method available for testing to ensure corrected visual acuity of 20/30 or better was a Snellen Eye Chart, which only allowed visual acuity to be classified as 20/20 or 20/30. Unfortunately, color vision could not be tested but their color vision was correct according to each participant and no one had problems with colors during the experiment.
Apparatus
Seven candidate signs for median crossovers were studied in the experiment. These included five symbolic designs and two word signs. The design of the signs came from several sources, including a survey of state highway departments (two signs), a literature review (one sign), FHWA personnel (two signs), and a Virginia crossover sign. The word signs included "crossover," as this is the wording on the signs in Revision 3 of the 1978 Manual on Uniform Traffic Control Devices, and "median opening." Questions about wording were included in the last part of the experiment. The 7 signs along with the 13
-I. BLACK ON 2. BLACK ON 3.
~ YELLOW
MEDIAN OPENING
TRANSPORTATION RESEARCH RECORD 1114
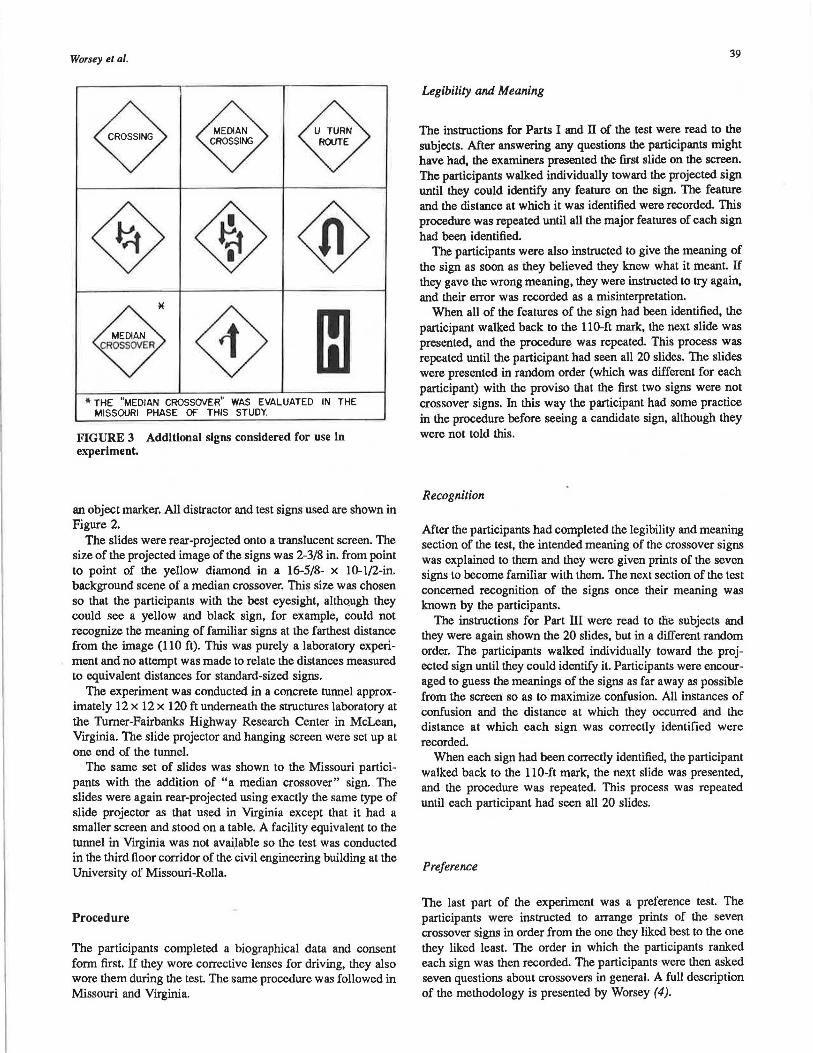
distractor signs used in the experiment are shown in Figure 2. Nine other sign designs (from the same sources) were considered, but in order to keep testing time to approximately 1 hr, only a limited number of signs could be tested. The other designs considered are shown in Figure 3. When time was available, the "median crossover" sign was shown to the Missouri participants.
At the suggestion of the FHWA Office of Traffic Operations, all the signs tested were black on yellow diamond warning signs, with the exception of the Virginia crossover sign and the permissive U-turn sign suggested by the Office of Traffic Operations. Instead of a green ring to denote a permissive sign as has been tested in previous sign studies (3) the Office of Traffic Operations suggested using a green periphery (see Figure 2). The signs were composed on a computer graphics system and superimposed onto a digitized photograph of a median crossover from which slides were made.
Thirteen signs were used as distractors. These included a permissive right-tum sign, similar to the permissive U-turn sign, and a railroad crossbuck outlined in red, which was part of another FHWA study. Of 11 signs from the MUTCD, 10 were chosen because they had already been drawn on the computer graphics system. A type 3L object marker was also used because the Vrrginia crossover sign was similar in size to
WHITE ON 4. BLACK ON GREEN
<;>~ = S CAROLINA FHWA VIRGINIA FHWA
5. BLACK ON 6 BLACK ON 7. BLACK ON WHITE 8 BLACK ON WHITE YELLOW <&)w GREEN EDGE GREEN EDGE
~ m!l 0 CANADA S CAROLINA FHWA FHWA
9. BLACK ON WHITE IO. BLACK ON WHITE II. RED ON WHITE 12. BLACK ON RED CIRCLE RED CIRCLE YELLOW
~ [@ ~ ~ R3-I MUTCD R3-4 MUTCO FHWA OM3-L MUTCD
13 BLACK ON 14. BLACK ON 15. BLACK ON 16. BLACK ON YELLOW
0 <!>OW YELLOW
0 ~ Wl-4R MUTCD Wl-2R MUTCD Wl·5R MUTCD W4-I MUTCD
17. BL ACK ON 18. BLACK ON 19. BLAC~ ON 20. BLACK ON
~OW $ow YEL OW <f!)ow ~
W2-I MUTCD W2-2 MUTCO W6-3 MUTCO W6-2 MUTCD
FIGURE 2 All distractor and test signs used in experiment.
Worsey el al.
~ v
* THE "MEDIAN CROSSOVER" WAS EVALUATED IN THE MISSOURI PHASE OF THIS STUDY.
FIGURE 3 Additional signs considered for use In experiment.
an object marker. All distractor and test signs used are shown in Figure 2.
The slides were rear-projected onto a translucent screen. The size of the projected image of the signs was 2-3/8 in. from point to point of the yellow diamond in a 16-5/8- x 10-1/2-in. background scene of a median crossover. This size was chosen so that the participants with the best eyesight, although they could see a yellow and black sign, for example, could not recognize the meaning of familiar signs at the farthest distance from the image (110 ft). This was purely a laboratory experiment and no attempt was made to relate the distances measured to equivalent distances for standard-sized signs.
The experiment was conducted in a concrete tunnel approximately 12 x 12 x 120 ft underneath the structures laboratory at the Turner-Fairbanks Highway Research Center in McLean, Virginia. The slide projector and hanging screen were set up at one end of the tunnel.
The same set of slides was shown to the Missouri participants with the addition of "a median crossover" sign. The slides were again rear-projected using exactly the same type of slide projector as that used in Virginia except that it had a smaller screen and stood on a table. A facility equivalent to the tunnel in Virginia was not avai.lable so the test was conducted in the third floor corridor of the civil engineering building at the University of Missouri-Rolla.
Procedure
The participants completed a biographical data and consent form first. If they wore corrective lenses for driving, they also wore them during the test. The same procedure was followed in Missouri and Virginia.
39
Legibility and Meaning
The instructions for Parts I and II of the test were read to the subjects. After answering any questions the participants might have had, the examiners presented the first slide on the screen. The participants walked individually toward the projected sign until they could identify any feature on the sign. The feature and the distance at which it was identified were recorded. This procedure was repeated until all the major features of each sign had been identified.
The participants were also instructed to give the meaning of the sign as soon as they believed they knew what it meant. If they gave the wrong meaning, they were instructed to try again, and their error was recorded as a misinterpretation.
When all of the features of the sign had been identified, the participant walked back to the 110-ft mark, the next slide was presented, and the procedure was repeated. This process was repeated until the participant had seen all 20 slides. The slides were presented in random order (which was different for each participant) with the proviso that the first two signs were not crossover signs. In this way the participant had some practice in the procedure before seeing a candidate sign, although they were not told this.
Recognition
After the participants had completed the legibility and meaning section of the test, the intended meaning of the crossover signs was explained to them and they were given prints of the seven signs to become familiar with them. The next section of the test concerned recognition of the signs once their meaning was known by the participants.
The instructions for Part Ill were read to th~ subjects and they were again shown the 20 slides, but in a different random order. The participants walked individually toward the projected sign until they could identify it. Participants were encouraged to guess the meanings of the signs as far away as possible from the screen so as to maximize confusion. All instances of confusion and the distance at which they occurred and the distance at which each sign was correctly identified were recorded.
When each sign had been correctly identified, the participant walked back to the 110-ft mark, the next slide was presented, and the procedure was repeated. This process was repeated until each participant had seen all 20 slides.
Preference
The last part of the experiment was a preference test. The participants were instructed to arrange prints of the seven crossover signs in order from the one they liked best to the one they liked least. The order in which the participants ranked each sign was then recorded. The participants were then asked seven questions about crossovers in general. A full description of the methodology is presented by Worsey (4).

40
RESULTS
Legibility
Although the different experimental conditions preclude statistical comparison, the data in Table 1 indicate that the legibility distances for both groups of participants were similar. The distances for the Missouri participants were slightly longer in most but not all cases.
Understanding
The data in Table 2 indicate that the Missouri participants had more difficulty in guessing the meaning of the signs than the Virginia participants. This was particularly true for the symbol signs although only the arrows sign was guessed by more than one-half of the panicipants in Virginia. However, this difference was not statistically significant.
The total number of misinterpretations of the signs by uncued participants was approximately the same (98 in Virginia and 103 in Missouri). The da.ta in Table 2 indicate that the Missouri participants generally misinterpreted the signs more often than the Virginia participants. They also failed more frequently to guess the meaning of the signs, with the exception of the permissive U-tum sign. However, these differences were not statistically significant.
In Virginia, the arrows sign was misinterpreted most often, followed by the nose plus arrows sign and the crossover sign. In Missouri, the nose plus arrows sign was misinterpreted most
TRANSPORTATION RESEARCH RECORD 1114
often, followed by the "crossover" sign and the permissive U-tum sign. The most frequent misinterpretations of the crossover signs were. basically the same for both groups of participants.
The data in Table 2 indicate that the mean distances at which participants in both states understood the meaning of the signs were similar. The word signs were understood at much shorter distances, and of the symbol signs, the arrows sign was understood at the farthest distance.
Recognition
The data in Table 3 indicate that the mean distances at which participants in both states recognized the signs were somewhat similar, with the Missouri participants recognition distances being slightly shorter for all the signs except the arrows sign. The greatest difference was for the "median opening" sign, which Missouri participants recognized at a mean distance approximately 12 ft shorter than the distance Virginia participants recognized it. In both sets of results the Virginia crossover sign was recognized at by far the greatest average distance and the worded signs were recognized at the shortest distances.
The total number of instances in which participants confused the crossover signs with other signs was 20 for both data sets. These confusions followed a similar pattern for both data sets. In Missouri all the signs were recognized by all the participants, whereas in Virginia one participant did not recognize the crossover nose sign.
TABLE 1 COMPARISON OF SIGN FEATURE MEAN LEGIBILITY DISTANCES (ft)
Type of Sign
5 7 2 3 4 Crossover 6 Perrnis-Median Crossover Crossover Nose Plus Crossover sive
Feature State Crossover Opening Virginia Nose Arrows Arrows U-Tum
Sign shape Virginia 100 107 63 102 104 108 101 Missouri 104 106 65 102 103 109 102
Sign color Virginia 106 108 99 106 107 108 100 Missouri 109 108 96 108 108 105 86
Symbol or letter color Vuginia 15 71 57 79 84 89 55 Missouri 83 76 55 93 95 101 76
Symbol or letter presence Virginia 48 54 52 83 85 90 66 Missouri 41 50 69 93 95 101 85
Median nose presence Virginia NIA NIA 34 36 35 NIA 26 Missouri NIA NIA 37 40 35 NIA 29
Road pattern Vuginia NIA NIA NIA NIA 34 52 25 Missouri NIA NIA NIA NIA 38 59 28
Crossover movement V..i:rginia NIA NIA NIA NIA NIA 48 25 · Misso~ : N/A' I. NIA NIA NIA NIA 50 27 , : . · . .. ..
Read legend Virginia· • . i2 ·.· 11 NIA NIA NIA NIA NIA 'Missouri· .ii- .. :·
12 NIA NIA NIA NIA NIA : .~-~
NoTB: NIA= not applicable.

Worsey et al. 41
TABLE2 COMPARISON OF TIIB UNDERSTANDING OF SIGNS IN VIRGINIA AND MISSOURI
Type of Sign
2 Median
State Crossover Opening
Understanding distance (ft) Virginia 14 11 Missouri 13 12
Correct answer first atlempt Virginia 16 27 (freq) Missouri 12 24
Incorrect guess before correct Virginia 10 3 answer (freq) Missouri 13 5
Did not make a correct guess Virginia 4 0 (freq) Missouri 5 1
Misinterpretations (freq) Vuginia 18 5 Missouri 20 7
Subjects who would not Vuginia 0 0 attempt to guess meaning Missouri 2 0 (freq)
Preference
The data in Table 3 indicate that the Virginia participants had a much more clearly defined set of preferences than the Missouri participants. (Their mean preference rankings ranged from 3.07 to 6.00, whereas the Missouri participants' mean preference rankings had much less spread, from 3.52 to 4.76.)
The permissive U-tum sign, followed by the Virginia crossover sign, was least preferred by Virginia participants, whereas the Virginia crossover sign, followed by the permissive U-tum sign, was least preferred by Missouri participants. The Virginia participants most preferred the crossover nose sign, followed by the nose plus arrows sign and then the word signs. The Missouri participants most preferred. the "median opening" sign, followed by the crossover nose sign and then the arrows and nose plus arrows signs. The rankings given to each sign by the Virginia and Missouri participants were found
5 7 3 4 Crossover 6 Pennis-Crossover Crossover Nose Plus Crossover sive Virginia Nose Arrows Arrows U-Turn
25 33 31 41 22 26 29 28 37 19
13 18 15 13 9 12 9 11 14 9
4 5 8 11 6 2 4 4 8 5
13 7 7 6 15 16 17 15 81 16
10 11 18 23 13 8 15 24 12 17
8 3 2 0 10 10 9 4 1 8
to be significantly different for all the signs except for "crossover" and the Virginia crossover signs.
All participants were asked their opinions on median crossovers; 80 percent of the Missouri participants considered crossovers to be hazardous whereas only 73 percent of Virginia participants considered them hazardous (Table 4). The types of hazards participants associated with median crossovers were slightly different for both groups. Traffic accelerating into the fast lane was considered as much of a hazard as traffic slowing in the fast lane by Missouri participants but not Virginia participants (Table 5). Missouri participants appeared to be more concerned with traffic crossing the divided highway than the Virginia participants (13 participants, compared with 4 Virginia subjects, mentioned traffic pulling out in front of them or turning traffic). One Missouri participant mentioned gravel crossovers as being dangerous.
The responses to the question, "What effect would a
TABLE 3 COMPARISON OF THE RECOGNITION AND PREFERENCE RANKINGS OF SIGNS IN VIRGINIA AND MISSOURI
Type of Sign
5 7 2 3 4 Crossover 6 Permis-Median Crossover Crossover Nose Plus Crossover sive
State Crossover Opening Virginia Nose Arrows Arrows U-Turn
Recognition distance (ft) Vuginia 39 42 82 48 47 57 61 Missouri 34 29 76 48 45 60 58
Confusions (freq) Vuginia 2 2 0 2 8 5 1 Missouri 0 2 0 3 9 6 0
Subjects who did not know Virginia 0 0 0 1 0 0 0 the meaning (freq) Missouri 0 0 0 0 0 0 0
Mean preferences (rank) Vuginia 3.47 3.37 4.57 3.07 3.23 4.30 6.00 Missouri 4.10 3.52 4.76 3.62 3.79 3.66 4.62
42 TRANSPORTATION RESEARCH RECORD 1114
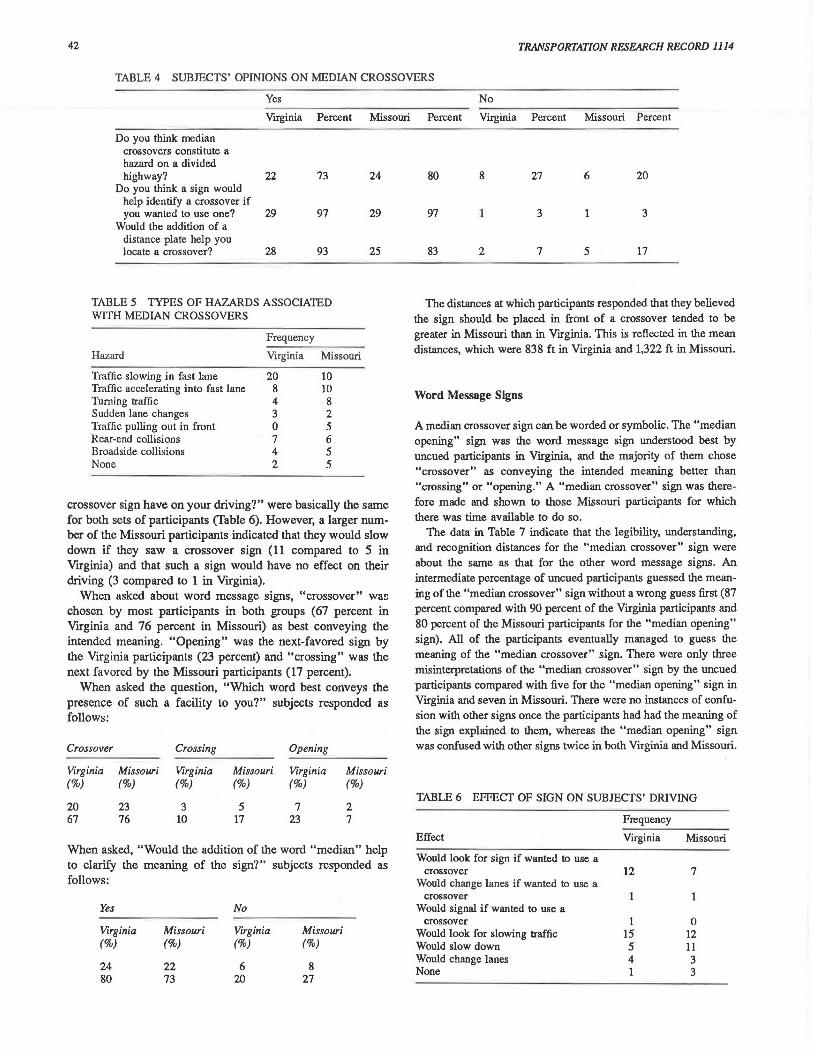
TABLE 4 SUBJECTS' OPINIONS ON MEDIAN CROSSOVERS
Yes
Vrrginia Percent
Do you think median crossovers constitute a hazard on a divided highway? 22 73
Do you think a sign would help identify a crossover if you wanted to use one? 29 97
Would the addition of a distance plate help you locate a crossover? 28 93
TABLE 5 TYPES OF HAZARDS ASSOCIATED WITH MEDIAN CROSSOVERS
Hazard
Traffic slowing in fast lane Traffic accelerating into fast lane Turning traffic Sudden lane changes Traffic pulling out in front Rear-end collisions Broadside collisions None
Frequency
Virginia Missouri
20 8 4 3 0 7 4 2
10 10 8 2 5 6 5 5
Missouri
24
29
25
crossover sign have on your driving?" were basically the same for both sets of participants (Table 6). However, a larger number of the Missouri participants indicated that they would slow down if they saw a crossover sign (11 compared to 5 in Virginia) and that such a sign would have no effect on their driving (3 compared to 1 in Virginia).
When asked about word message signs, "crossover" wai: chosen by most participants in both groups (67 percent in Virginia and 76 percent in Missouri) as best conveying the intended meaning. "Opening" was the next-favored sign by the Virginia participants (23 percent) and "crossing" was the next favored by the Missouri participants (17 percent).
When asked the question, "Which word best conveys the presence of such a facility to you?" subjects responded as follows:
Crossover Crossing Opening
Virginia Missouri Virginia Missouri Virginia Missouri (%) (%) (%) (%) (%) (%)
20 23 3 5 7 2 67 76 10 17 23 7
When asked, "Would the addition of the word "median" help to clarify the meaning of the sign?" subjects responded as follows:
Yes No
Virginia Missouri Virginia Missouri (%) (%) (%) (%)
24 22 6 8 80 73 20 27
No
Percent Virginia Percent Missouri Percent
80 8 27 6 20
97 3 1 3
83 2 7 5 17
The distances at which participants responded that they believed the sign should be placed in front of a crossover tended to be greater in Missouri than in Virginia. This is reflected in the mean distances, which were 838 ft in Virginia and 1,322 ft in Missouri.
Word Message Signs
A median crossover sign can be worded or symbolic. The "median opening" sign was the word message sign understood best by uncued participants in Virginia, and the majority of them chose "crossover" as conveying the intended meaning better than "crossing" or "opening." A "median crossover" sign was therefore made and shown to those Missouri participants for which there was time available to do so.
The data in Table 7 indicate that the legibility, understanding, and recognition distances for the "median crossover" sign were about the same as that for the other word message signs. An intermediate percentage of uncued participants guessed the meaning of the "median crossover" sign without a wrong guess first (87 percent compared with 90 percent of the Virginia participants and 80 percent of the Missouri participants for the "median opening" sign). All of the participants eventually managed to guess the meaning of the "median crossover" sign. There were only three misinterpretations of the "median crossover" sign by the uncued participants compared with five for the "median opening" sign in Virginia and seven in Missouri. There were no instances of confusion with other signs once the participants had had the meaning of the sign explained to them, whereas the "median opening" sign was confused with other signs twice in both Virginia and Missouri.
TABLE 6 EFFECT OF SIGN ON SUBJECTS' DRIVING
Effect
Would look for sign if wanted to use a crossover
Would change lanes if wanted to use a crossover
Would signal if wanted to use a crossover
Would look for slowing traffic Would slow down Would change lanes None
Frequency
Virginia
12
1 15 5 4 1
Missouri
7
0 12 11 3 3

Worsey el al. 43
TABLE 7 COMPARISON OF THE "MEDIAN CROSSOVER" SIGN WITH THE "MEDIAN OPENING" AND "CROSSOVER" SIGNS
Crossover
Virginia
Legibility distances (ft) Sign shape 100 Sign color 106 Legend color 75 Letter presence 48 Read legend 12
Understanding distance (ft) 14 Recognition distance (ft) 39 Correct answer 16 First attemtp (freq) Percent 53
Incorrect answer 10 Before correct one (freq) Percent 33
Don't know (freq) 4 Percent 13
Misinterpretations (freq) 18 Confusions (freq) 2
CONCLUSIONS
From this study there appears to be justification for the use of signs indicating the presence of a median crossover that can be used by the general public. The majority of participants tested in both groups perceived crossovers as hazardous locations, and from their responses to the questions they were clearly aware of the potential hazards that crossovers can cause. Most participants indicated that if such a sign were installed, it would likely have a beneficial effect on their driving behavior.
Although word message signs can usually be understood once they are read, they are not as legible as symbolic signs. Of the symbolic signs, the arrows sign had the best average legibility and understanding distances in both Virginia and Missouri, but it had by far the most misinterpretations by participants in Vrrginia. Although it was ranked second among the symbol signs by the Missouri participants in terms of preference, it was ranked fifth by the Vrrginia participants and is therefore not recommended.
Of the other symbolic signs, the permissive U-turn sign had low average legibility and understanding distances in both Virginia and Missouri and was not well understood by the participants. This is reflected in its being ranked last in the preference test by the majority of participants in Virginia and many in Missouri. The significance of the green periphery to indicate a permissive sign was not understood, and this sign is not recommended.
Of the symbolic signs, the Virginia crossover sign also had low average legibility distances and again was not well understood by uncued participants in both Virginia and Missouri. In the preference test it was not well liked by either group of participants. However, it did very well in the recognition test in both Vrrginia and Missouri, presumably because of its different color and shape. It was recognized at a far greater average distance than any of the other signs and was the only sign not confused in Virginia. Several participants in both Virginia and
Median Median Opening Crossover
Missouri Virginia Missouri Missouri
104 107 106 102 109 108 108 107 83 71 76 93 41 54 50 49 12 11 12 12 13 11 12 12 34 42 29 28 12 27 24 21
40 90 80 87 13 3 5 3
43 10 17 13 5 0 1 0
17 3 20 5 7 3 0 2 2 0
Missouri mentioned that if they had initially known the meaning of the sign they believed it would be the best one to use. The meaning of the sign was not obvious to the participants in either Vrrginia or Missouri. However, in Vrrginia the sign is placed at the median opening, which should lead to a high degree of self-education.
Of the remaining symbolic signs, the nose plus arrows sign had slightly better average legibility distances but the crossover nose sign had slightly better average understanding and recognition distances in both Virginia and Missouri. The latter sign also had fewer misinterpretations and instances of confusion in the understanding and recognition sections of the experiment than the former in both Virginia and Missouri. It was also given the best average rank out of all the signs in the Vrrginia preference test and the best average rank out of the symbol signs in Missouri. It also had the simplest design of all the signs tested. Of the symbol signs tested, the crossover nose sign (see Figure 2) is recommended to indicate the presence of a median crossover.
Despite the different experimental conditions, the legibility, understanding, and recognition distances of all the signs were similar for both groups of participants. However, the Missouri participants had more difficulty identifying the green (Virginia crossover and permissive U-turn) signs than the Vrrginia participants.
The Missouri participants had more difficulty than the Virginia participants in guessing the meaning of nearly all the signs, especially the symbol signs. They misinterpreted the signs more often and could not guess the meaning of the signs as frequently.
The greatest differences between the Virginia and Missouri results were in the preference rankings the participants gave to the signs. The Virginia participants had a much more clearly
defined set of preferences, whereas the Missouri participants' preferences were much more evenly spread with little agreement among the participants. The Missouri participants also

44
TABLE 8 SUMMARY OF FAVORABLE AND UNFAVORABLE FINDINGS FOR EACH CROSSOVER SIGN
Sign Type l'avorable Aspects lJnfavorabie Aspects
Word Usually understood once Much less legible than message read symbolic signs
Arrows Most legible sign Misinterpreted the most Understood the farthest Not liked by subjects
away Permissive Not confused with other Legible at shorter
U-tum signs distances Understood the closest
out of symbol signs Least liked by most
subjects Meaning of green
periphery not understood
Virginia Recognized the farthest Legible at shorter crossover away distances
Not confused with other Understood the second signs closest out of symbol
signs Not liked by subjects Not understood well
Nose plus Second most legible of arrows symbol signs
Crossover Understood the second nose farthest away
Misinterpreted the second least of symbol signs
Most preferred of symbol signs
preferred the word message signs more than the Vrrginia participants. This was especially true for females, particularly those over 50. The Virginia participants preferred the crossover nose and nose plus arrows signs over the word message signs, whereas the Missouri participants preferred the "median opening" sign.
Although there were some differences in the Virginia and Missouri results, the same conclusions were reached-that a "median crossover" sign would be the best word message sign to use and the crossover nose sign would be the best symbolic
TRANSPORTATION RESEARCH RECORD 1114
sign to use to indicate the presence of a median crossover. Despite the Missouri participants' preferences for word message signs, legibility of the symbolic signs was so much greater that the crossover nose sign is the sign recommended for field evaluation to identify median crossovers. Table 8 contains a summary of the findings pertaining to the signs tested in this study and the impressions and preferences expressed by the subjects.
ACKNOWLEDGMENT
A substantial portion of this study was supported by a Grant for Research Fellowship awarded by the Federal Highway Administration, U.S. Department of Transportation. Special thanks are extended to the following individuals and organizations for their guidance, suggestions, and technical help: Samuel Tignor and Howard Bissell of the Federal Highway Administration and R. N. Robertson and C. Morris of the Virginia Department of Highways and Transportation. The opinions, interpretations, and conclusions expressed in this paper are solely those of the authors.
REFERENCES
1. P. D. Cribbins, J. M. Arey, and J. K. Donaldson. Effects of Selected Roadway and Operational Characteristics on Accidents on MultiLane Highways. In Highway Research Record 188, HRB, National Research Council, Washington, D.C., 1967, pp. 8-25.
2. Manual on Uniform Traffic Control Devices, Revision 3. FHWA, U.S. Department of Transportation, 1978.
3. J. Walker, E. Alicandri, and K. Roberts. An Evaluation of Candidate Symbolic Routing Signs for Trucks Carrying Hazardous Cargo. Report FHWA-RD-85-081. FHWA, U.S. Department of Transportation, 1985. ·
4. G. M. Worsey. An lnvestigation of Signs for Median Crossovers. Ph.D. dissertation. University of Missouri-Rolla, 1986.
Publication of this paper sponsored by Committee on Traffic Control Devices.