Embed Size (px)
Citation preview
1
REGIONAL ENERGY OUTLOOK CENTRAL JAVA PROVINCEYEAR 2005 - 2025
Regional CAREPI Technical Team Yogyakarta and Central Java
Pusat Studi Pengelolaan Energi Regional Universitas Muhammadiyah Yogyakarta (PUSPER UMY)
Dinas Energi dan Sumber Daya Mineral
Provinsi Jawa Tengah
In collaboration with :
2
REGIONAL ENERGY OUTLOOK CENTRAL JAVA PROVINCE YEAR 2005 - 2025
Regional CAREPI Technical Team of Yogyakarta and Central JavaPusat Studi Pengelolaan Energi Regional (PUSPER) UMY
Advisory Board:
1. Head, Data and Information Centre for Energy and Mineral Resources Ministry of Energy and Mineral Resources (Pusdatin ESDM) Jakarta
2. Nico H. van der Linden, M.Sc. (Energy Research Center of the Netherlands)3. Head, Regional Office of Energy and Mineral Resources, Central Java Province4. Director, PUSPER Universitas Muhammadiyah Yogyakarta
Steering Committee:
1. Koen E.L. Smekens, MSc. ( Energy Research Center of the Netherlands)2. Ir. Oetomo Tri Winarno, MT. (Institute of Technology, Bandung)3. Ir. Surya Budi Lesmana, MT. (PUSPER Universitas Muhammadiyah Yogyakarta) 4. Sri Atmaja P. Rosyidi, Ph.D. (PUSPER Universitas Muhammadiyah Yogyakarta)5. Lilies Setiartiti, SE, MSi. (PUSPER Universitas Muhammadiyah Yogyakarta)
Authors:
1. Dr. Joko Windarto 2. Mahmud Fauzi Isworo3. Ir. Purwanto, MT.4. Dominggus Yosua Suitella5. Irwan 6. Anggakara S
2009 CAREPI Project, Pusat Studi Pengelolaan Energi Regional Universitas Muhammadiyah Yogyakarta and Energy Research Center of the Netherlands (ECN)
http://www.carepi.info
\
3
PREFACE
With the deepest sense of gratitude and humility, all praises and thanks to Allah for
giving us the strength to write this report entitled “Regional Energy Outlook of Special
Region of Central Java Province Year 2005- 2025”.
This report is part of the outcomes produced as part of of “Contributing to proverty
Allevation through Regional Energy Planning in Indonesia, CAREPI” program. CAREPI
program is one of projects in cooperation between Indonesia and the Netherlands in the
scheme of Energy Working Group (EWG) and a collaborative works between Center of
Regional Energy Management Universitas Muhammadiyah Yogyakarta (Pusat Studi
Pengelolaan Energi Regional, PUSPER UMY), Data and Information Centre for Energy
and Mineral Resources Ministry of Energy and Mineral Resources (Pusdatin ESDM), The
office of Mining and Energy Central Java Province, Center for Research on Energy Policy
Institut Teknologi Bandung (ITB), Energy research Center of the Netherlands (ECN),
SenterNovem Netherlands and European Union (EU).
This report consists of the database of energy demand and supply in 2005 and energy
outlook 2005 to 2025 based on LEAP modeling from two scenarios, i.e. National Energy
Policy (KEN) and Regional Energy Policy (KED). Energy and related data were collected
and analysed from several sources that have contributed in the data collection process.
They are PT. Pertamina, , PT PLN (Persero) P3B Regional of Central Java and
Yogyakarta, PT Indonesia Power , PT. KAI, BPS Central Java, PT. Angkasa Pura and
related regional offices in Central Java Province. We would like to take this opportunity to
convey our greatest appreciation to all contributors who have supported and provided the
data and analyses for this book. We hope that the readers would be able to use this report
as a reference of energy situation and outlook of Central Java until 2025, based on the data
in 2005. We also welcome all feedback to improve the quality of this report.
Yogyakarta, 30 October 2009
Regional Technical Team of CAREPI
4
TABLE OF CONTENTS
Preface ................................................................................................................ 3
Table of Contents ................................................................................................ 4
List of Tables ...................................................................................................... 6
List of Figures ..................................................................................................... 7
1. INTRODUCTION......................................................................................... 9
1.1 Task D-16 in CAREPI ............................................................................ 9
1.2 Objectives................................................................................................ 9
1.3 Scope and Boundary ................................................................................ 10
2. GENERAL INFORMATION OF THE REGION .......................................... 11
2.1 Macroeconomic Condition....................................................................... 12
2.2 Energy Issues........................................................................................... 13
3. CURRENT ENERGY SITUATION.............................................................. 14
3.1 Energy Consumption ............................................................................... 14
3.2 Energy Supply ......................................................................................... 15
4. ENERGY SCENARIOS................................................................................ 19
4.1 Energy Policies ........................................................................................ 19
4.1.1 National Energy Policy ................................................................... 19
4.1.2 Regional Energy Policy................................................................... 21
4.2 Scenario Assumptions.............................................................................. 22
4.2.1 Scenario Assumptions ..................................................................... 22
4.2.2 Scenario Parameters ........................................................................ 22
4.3 Energy Scenario Outcomes ...................................................................... 24
4.3.1 Demand Side................................................................................... 24
4.3.2 Suply Side....................................................................................... 27
4.3.3 Comparison KEN and KED result ................................................... 31
4.4 Target Energy Mix dengan Scenario KEN dan KED.................................. 36
5. PRO – POOR ENERGY ACCESS ................................................................ 42
5.1 Poor Village Profile ................................................................................. 38
5.2 Design of Proposed Energy Infrastructure................................................ 42
5
6. FEASIBILITY – MICRO HYDRO PROJECTS ............................................ 46
6.1 Introduction ............................................................................................. 46
6.1.1 Background..................................................................................... 46
6.1.2 Description of Location for PLTMH ............................................... 46
6.1.3 Resent Condition............................................................................. 47
6.2 Design and Development of Micro Hydro Project ................................... 49
6.2.1 Design Project PLTMH Sorosida ................................................... 49
6.2.1 Scope of the Project ........................................................................ 50
6.2.3 Implementation of the Project ......................................................... 50
6.3 Utilization of Micro hidro ....................................................................... 50
6.3.1 Operation and maintanence ............................................................. 50
6.3.2 Final use of the electricity .............................................................. 51
6.3.3 Cost of the Project........................................................................... 51
7. CONCLUSION AND RECOMMENDATION.............................................. 53
Annex 1
Annex 2
Annex 3
6
LIST OF TABLES
Tabel 2.1 RGDP Development and Inflation ....................................................... 11
Table 2.2 Regional Gross Domestic Product Central Java Province
Based on Field of Employment in Year 2001 – 2005.............................. 11
Table 3.1 Oil Production Central Java Province in Year 2005 .............................. 14
Table 3.2 The Utilization of Large Scale Hydropower ......................................... 15
Table 3.3 The Utilization of Small Scale Hydropower.......................................... 15
Table 3.4 Crude Oil Deposits .............................................................................. 16
Table 4.1 Projection of Biodiesel Usage .............................................................. 22
Table 4.2 Projection of Bioethanol Usage ........................................................... 22
Table 4.3 Projection of Biofuel Usage ................................................................. 22
Table 5.1 Type of Energy Used in Desa Sokawera............................................... 40
Table 5.2 Renewable Energy Potential in Kecamatan Sokawera........................... 40
Table 6.1 Description of Electricity Consumption in Sidoharjo Village ............... 46
Table 6.2 Electricity Consumption for House Hold in Sukoharjo Village ............ 47
Table 6.3 Design Characteristics of PLTMH Sorosido ......................................... 49
Table 6.4 The Estimated Cost of PLTMH Sorosido Construction Project ............. 51
Table 6.5 Operational and Maintenance Cost of PLTMH Sorosido ..................... 51
7
LIST OF FIGURES
Figure 3.1 Final Energy Consumption per sector................................................................... 14
Figure 4.1 Energy Consumption per sector up to 2025 using KEN scenario …... .................. 23
Figure 4.2 Energy consumption per type of energy to 2025 with KEN scenario ................... 24
Figure 4.3 Energy Consumption per sector until Year 2025 with KED scenario .................... 14
Figure 4.4 Energy consumption per energy type up to 2025 with KED Scenario .................. 26
Figure 4.5 Projected Petroleum Mining Capacity ................................................................. 27
Figure 4.6 Refinery Production ............................................................................................ 28
Figure 4.7 Imported Fuel from other region .......................................................................... 29
Figure 4.8 Plant Capacity Projections in central java province until the year 2025 ............... 30
Figure 4.9 Fuel usage in power Plant ................................................................................... 30
Figure 4.10 Biodiesel Plant Capacity Projections .................................................................... 31
Figure 4.11 Proyeksi Kapasitas Pabrik Bioethanol .................................................................. 31
Figure 4.12 12 Projected Capacity Vegetable Oil Factory ....................................................... 32
Figure 4.13 Comparison between KEN and KED scenario per household sector up to
2025..................................................................................................................... 32
Figure 4.14 Comparison between KED and KED Scenario per household sector energy-
type up to 2025 .................................................................................................... 32
Figure 4.15 Comparison between KEN and KED Scenario per commercial sector up to
2025..................................................................................................................... 33
Figure 4.16 Comparison between KED and KED Scenario per commercial sector energy
type up to 2025 .................................................................................................... 34
8
Figure 4.17 Comparison between KED and KED Scenario per industrial sector up to 2025 .... 34
Figure 4.18 Comparison between KED and KED Scenario per industrial sector energy
type up to 2025 .................................................................................................... 35
Figure 4.19 Comparison between KED and KED Scenario per transportation sector up to
2025..................................................................................................................... 36
Figure 4.20 Comparison between KED and KED Scenario per transportation sector
energy type up to 2025......................................................................................... 37
Figure 4.21 Comparison between KED scenario and KED per other sectors up to 2025.......... 38
Figure 4.22 Comparison between KED scenario and KED per energy type of other
sectors up to 2025 ................................................................................................ 38
Figure 4.23 Capacity added in powerplant up to 2025............................................................. 39
Figure 4.24 the comparison of electricity energy estimation between KEN and KED
scenario up to 2025.............................................................................................. 39
Figure 4.25 the comparison of electricity energy Balanced between KEN and KED
scenario up to 2025.............................................................................................. 40
Figure 4.26 Comparison of crude oil projection between KEN and KED sector scenarios
in the year of 2025 ............................................................................................... 40
Figure 4.27 Energy balance for petroleum up to 2025............................................................. 40
Figure 4.28 Comparison between refinery output by sector scenario KEN and KED until
the year of 2025 ................................................................................................... 40
Figure 4.29 the comparison of refinery output by Fuel between KEN and KED until 2025 ..... 40
Figure 4.30 Distribution of oil fuels in Central Java Province ................................................. 40
Figure 4.31 The initial condition of Energy in Central Java..................................................... 40
Figure 4.32 KEN Scenario of Energy Condition ..................................................................... 40
Figure 4.33 KED Scenario of Energy Condition ..................................................................... 40

9
Figure 5.1 Map of Banyumas Regency in Central Java Region ............................................. 40
Figure 6.1 Location Map of Pakuluran Hamlet, Sidoharjo Village, Doro Subdistrict,
Pekalongan District.............................................................................................. 45
10
CHAPTER 1
INTRODUCTION
1.1 Task D-16 in CAREPI
The activity of compiling this report on the Regional Energy Outlook for Central
Java 2005 – 2025 is part of CAREPI’s activities in “Contributing to Poverty Alleviation
through Regional Energy Planning in Indonesia” which is a cooperation among Pusat Studi
Pengelolaan Energy Regional, University of Muhammadiyah Yogyakarta (PUSPER
UMY) with The Office of Energy and Mineral Sources Central Java Province, Center of
Energy Policy – Bandung Institute of Technology, Energy Research Center of Netherlands,
SenterNovem – Netherlands, and European Union.
This book contains forecasts on energy needs, supply and distribution in Central Java
until the year 2025 based on a database of energy demand and supply in Central Java in
2005. This report is intended to be a reference for energy professionals and researchers by
and large for community that need data and information about forecasts of energy needs
and distribution in Central Java until year 2025.
1.2 Objective
Central Java Province is located in between two big provinces namely West Java and
East Java and is located at longitude 5o40’ and 8o30’ South and latitude 108o30’ and
111o30’ East (including Karimunjawa Island). The longest span from west to east is 263
km and from north to south is 226 km (not including Karimunjawa Island).
Regarding its administrative status, Central Java Province is divided into 29 districts
and 6 municipalities. The size of Central Java Province in 2005 is 3.25 million acre or
about 25.04% of the total size of Java Island (1.07% of the size of Indonesia). It consists of
996,000 acre (30.60%) of rice plantation and 2.26 million acre (69.40%) of non rice
plantation. Compared to previous year’s condition, the size of rice plantation in 2005
decreased around 0.02% ; however, the size of non rice plantation increased 0.01%.
The number of residents in Central Java Province is around 35 million people of
which 21% of the residents belong to low income classes. Final energy consumption in
11
Central Java in 2005 was 43.84 million barrel of oil equivalents. The distribution
percentages of usage based on types of energy are Coal (6.22%), Gasoline (25.21%),
Kerosene (17.69%), FO (26.04%), ADO (26.04%), IDO (0.74%), Electricity (14.78%),
LPG (1.95%), Wood (3.46%), and the rest are Avtur (0.53%) and also Coal briquette
(0.20%).
In 2006, the Government of Indonesia issued Presidential Decree named Presidential
Decree Number 5 Year 2006 about National Energy Policy. The application of National
Mix Energy is in line with Presidential Decree No. 5 Year 2006, with percentage in each
type of energy, such as:
– Crude oil is less than 20% of total primary energy use
– Natural Gas is less than 30% of total primary energy use
– Coal is less than 33% of total primary energy use
– Vegetable oil is more than 5% of total primary energy use
– Geothermal is more than 5% of total primary energy use
– Biomass, Nuclear power, Micro hydro, solar power, and wind power are more
than 5% of total primary energy use
– Liquefied coal is more than 2% of total primary energy use
With the national energy targets above, regional policies are needed to achieve the
National Energy Policy, supported by studies like this Regional Outlook Energy Central
Java Province 2005 – 2025.
1.3 Scope and Boundary
The aim of collecting documents on Regional Outlook Energy Central Java Province
2005 – 2025 is to identify plans of energy needs and supply in Central Java until 2025
based on Regional Energy Policy (Kebijakan Energy Daerah or KED) to support National
Energy Policy (Kebijakan Energy Nasional or KEN). The scopes of study in collecting
Regional Outlook Energy Central are as follows.
a. The base year for compiling data of energy supply and demand is 2005.
b. Scenarios used are based on Regional Energy Policy (KED) scenario and National
Energy Policy (KEN) scenario.
c. The Regional Energy Policy (KED) scenario, is mainly based on assumptions
depicting the real conditions of the energy potential in Central Java.
d. Data are taken from BPS, Pertamina, PLN etc.
12
CHAPTER 2
GENERAL INFORMATION OF THE REGION
2.1 Macroeconomic Condition
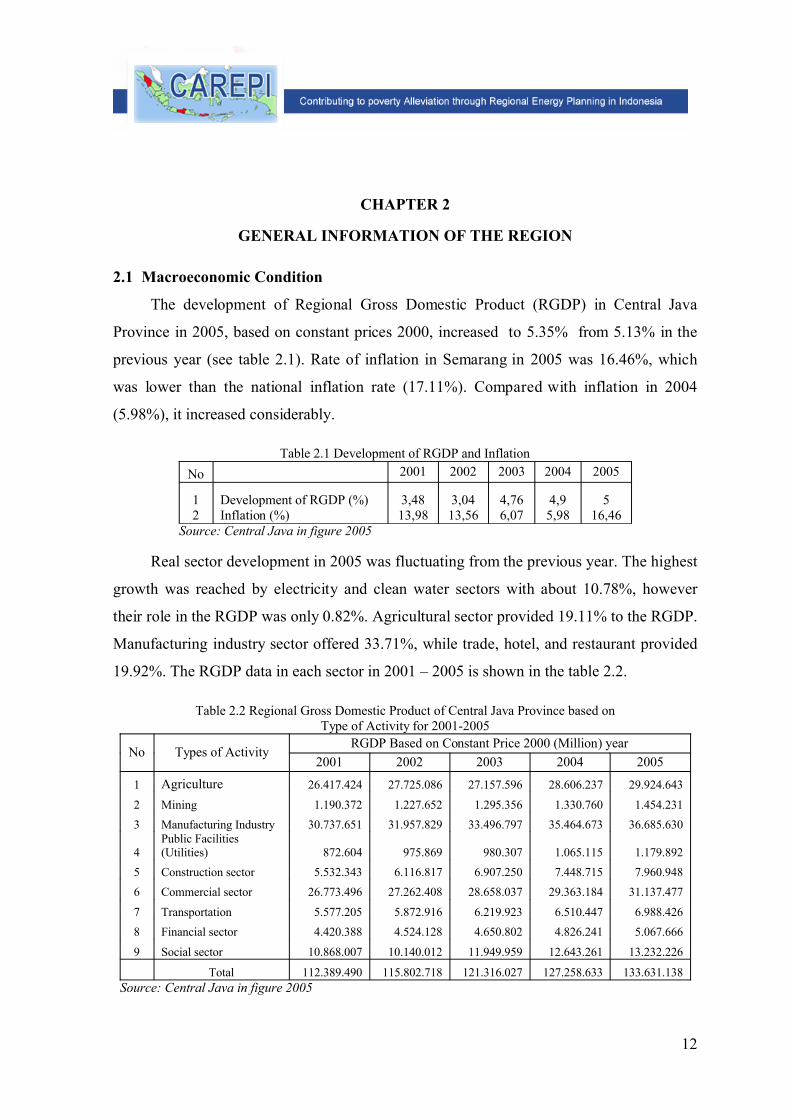
The development of Regional Gross Domestic Product (RGDP) in Central Java
Province in 2005, based on constant prices 2000, increased to 5.35% from 5.13% in the
previous year (see table 2.1). Rate of inflation in Semarang in 2005 was 16.46%, which
was lower than the national inflation rate (17.11%). Compared with inflation in 2004
(5.98%), it increased considerably.
Table 2.1 Development of RGDP and InflationNo 2001 2002 2003 2004 2005
12
Development of RGDP (%)Inflation (%)
3,4813,98
3,0413,56
4,766,07
4,95,98
516,46
Source: Central Java in figure 2005
Real sector development in 2005 was fluctuating from the previous year. The highest
growth was reached by electricity and clean water sectors with about 10.78%, however
their role in the RGDP was only 0.82%. Agricultural sector provided 19.11% to the RGDP.
Manufacturing industry sector offered 33.71%, while trade, hotel, and restaurant provided
19.92%. The RGDP data in each sector in 2001 – 2005 is shown in the table 2.2.
Table 2.2 Regional Gross Domestic Product of Central Java Province based on Type of Activity for 2001-2005
RGDP Based on Constant Price 2000 (Million) yearNo Types of Activity
2001 2002 2003 2004 2005
1 Agriculture 26.417.424 27.725.086 27.157.596 28.606.237 29.924.643
2 Mining 1.190.372 1.227.652 1.295.356 1.330.760 1.454.2313 Manufacturing Industry 30.737.651 31.957.829 33.496.797 35.464.673 36.685.630
4Public Facilities (Utilities) 872.604 975.869 980.307 1.065.115 1.179.892
5 Construction sector 5.532.343 6.116.817 6.907.250 7.448.715 7.960.9486 Commercial sector 26.773.496 27.262.408 28.658.037 29.363.184 31.137.477
7 Transportation 5.577.205 5.872.916 6.219.923 6.510.447 6.988.4268 Financial sector 4.420.388 4.524.128 4.650.802 4.826.241 5.067.666
9 Social sector 10.868.007 10.140.012 11.949.959 12.643.261 13.232.226
Total 112.389.490 115.802.718 121.316.027 127.258.633 133.631.138 Source: Central Java in figure 2005
13
2.2 Energy Issues
At present, energy supply in Central Java mainly comes from crude oil (fossil fuel)
which covers about 70%. Meanwhile, the use of renewable energy is very limited at less
than 3%. With this condition, actual measures need to be taken dealing with energy needs
in the future.
Some measures that need to be done in support of the national energy policy are:
– Conversion program of Kerosene to LPG
– Development acceleration of the 10,000 MW Steam Power Plant program
– Development acceleration of infrastructure for Gas Pipe Network Kalimantan
– Central Java.
– Development of infrastructure for LPG supply and distribution
– Policy on energy pricing to improve energy conservation and diversification
– Policy on developing energy infrastructure to assure energy supply,
especially non-crude oil fuels.
14
CHAPTER 3
CURRENT ENERGY SITUATION
3.1 Energy Consumption
3.1.1 Fuel Based Final Energy
In 2005, final energy consumption in Central Java is 43.84 million Barrel Oil
Equivalent, BOE (SBM=Setara Barel Minyak) with relative distribution per energy type
such as Coal (6.22%), Premium (25.21%), Kerosene (17.69%), Gasoline (3.17%), Solar
Oil (26.04%), Diesel Oil (0.74%), Electricity (14.78%), LPG (1.95%), Wood (3.46%), and
Avtur (0.53%) as well as Coal Briquette (0.20%).
The use of each type of energy in Central Java is as follows:
Avtur : 0.23 million Barrel Oil Equivalent (SBM)
Kerosene : 7.75 million Barrel Oil Equivalent (SBM)
Premium : 11.05 million Barrel Oil Equivalent (SBM)
Solar Oil : 11.42 million Barrel Oil Equivalent (SBM)
Diesel Oil : 0.32 million Barrel Oil Equivalent (SBM)
Gasoline : 1.39 million Barrel Oil Equivalent (SBM)
Electricity : 6.48 million Barrel Oil Equivalent (SBM)
LPG : 0.85 million Barrel Oil Equivalent (SBM)
Coal briquette : 0.09 million Barrel Oil Equivalent (SBM)
Wood : 1.52 million Barrel Oil Equivalent (SBM)
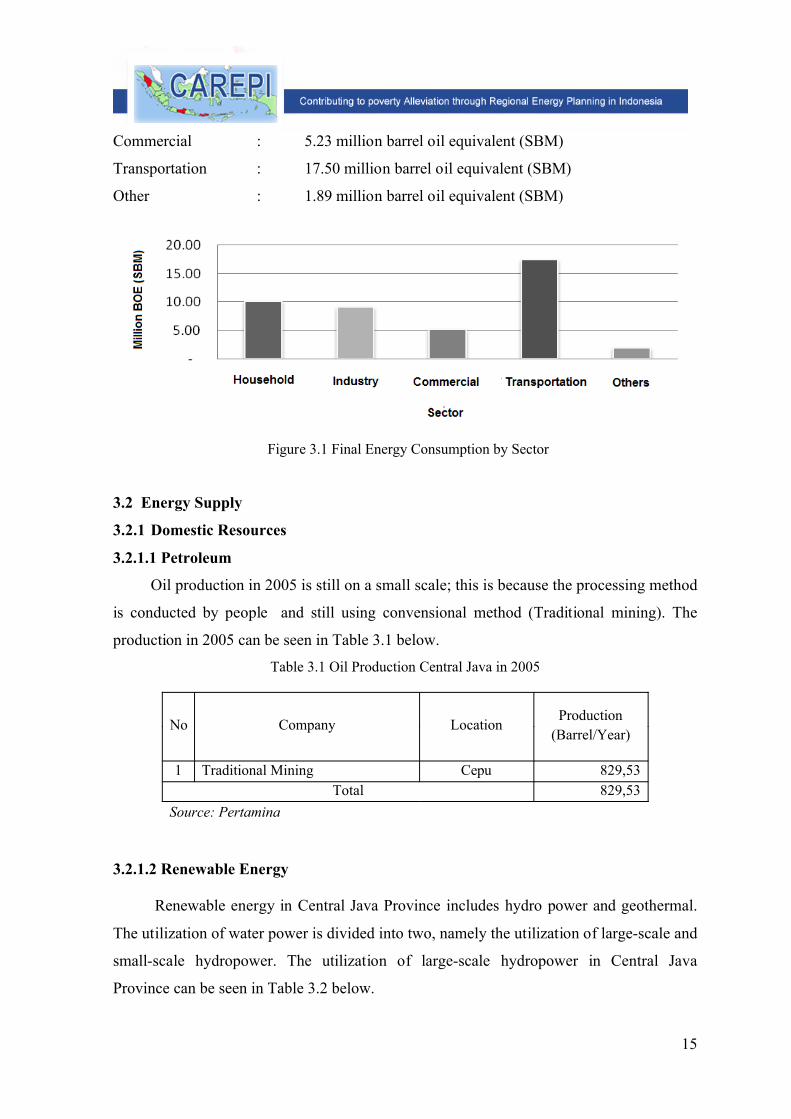
3.1.2 Final Energy by Sector
The distribution of energy consumption by sector is as follows: Households
(23.10%), Industrial Sector (20.73%), Commercial (11.92%), Transport (39.92%), Others1
(4.32%) as shown in Figure 3.1. The final energy by sector is as follows:
Households : 10.13 million barrel oil equivalent (SBM)
Industry sector : 9.09 million barrel oil equivalent (SBM)
1 The sector Others consists of agriculture, construction and mining.
15
Commercial : 5.23 million barrel oil equivalent (SBM)
Transportation : 17.50 million barrel oil equivalent (SBM)
Other : 1.89 million barrel oil equivalent (SBM)
Figure 3.1 Final Energy Consumption by Sector
3.2 Energy Supply
3.2.1 Domestic Resources
3.2.1.1 Petroleum
Oil production in 2005 is still on a small scale; this is because the processing method
is conducted by people and still using convensional method (Traditional mining). The
production in 2005 can be seen in Table 3.1 below.
Table 3.1 Oil Production Central Java in 2005
No Company Location Production (Barrel/Year)
1 Traditional Mining Cepu 829,53Total 829,53
Source: Pertamina
3.2.1.2 Renewable Energy
Renewable energy in Central Java Province includes hydro power and geothermal.
The utilization of water power is divided into two, namely the utilization of large-scale and
small-scale hydropower. The utilization of large-scale hydropower in Central Java
Province can be seen in Table 3.2 below.
16
Table 3.2 Utilization of Large Scale Hydropower
No Name Location Installed Capacity ( MW )
Production (MWh/Year)
1 PLTA Jelok Jelok 20.48 125,5832 PLTA Timo Timo 12.00 73,5843 PLTA Ketenger Ketenger 8.04 49,3014 PLTA Garung Garung 26.40 115,6325 PLTA Wadaslintang Wadaslintang 16.80 73,5846 PLTA Mrica Mrica 180.90 380,0007 PLTA Kedungombo Kedungombo 22.50 70,746
Total 2,877.12 888,431Source: RUPED of Central Java in 2005
The utilization of small-scale hydropower can be seen in Table 3.3. The province of
Central Java also has potentially geothermal energy reserves. This geothermal energy is
converted into electrical energy to fulfill the electricity needs of Central Java.
Table 3.3 The Utilization of Small Scale Hydropower
No Village Sub District Regency Installed Capacity (kW)
Production (KWh/Year)
1 Purbasari Karangjambu Purbalingga 40 63,072 2 Tripis Watumalang Wonosobo 50 78,840 3 Giyombong Bruno Purworejo 10 15,768 4 Kalisalak Kd Banteng Banyumas 10 15,768 5 Sidoarjo Doro Pekalongan 24 37,843 6 Mudal Temanggung Temanggung 20 31,536 7 Tanjung Mlongo Jepara 104 163,987
Total 258 406,814Source: RUPED of Central Java in 2005
3.2.2 Import / Export Transaction
3.2.2.1 Petroleum
Most of the petroleum processed at the Cilacap refinery in Central Java province
comes from outside Central Java,. The amount of crude oil imported from other regions is
107,686.37 thousand barrel, which is processed in Cilacap. Since the large Block Cepu
17
refinery was not opened yet in 2005, the oil produced is still in small scale, so there were
no oil exports in 2005.
3.2.2.2 Electricity
The electrical system in Central Java is part of the interconnection system between
Java and Bali, therefore there will be import or export of electricity from other regions. But
in 2005, the production of electricity in Central Java province is too low for its own
demand so that Central Java still imports electricity from other regions as much as 4194.91
GWh.
3.2.3. Resource Potential
The province of Central Java has oil reserves in Block Cepu, which is situated on the
border with East Java, the areas that are included in Central Java province are Kedung
Tuban, Alas Dara and Kemuning. The amount of oil reserves in the three regions can be
seen in Table 3.4 below.Table 3.4 Oil Reserves
Reserves (MMSTB)No Location Resources
(MMSTB) Proved Potential1 Kedung Tuban 80 - 80 2 Alas Dara 12 - 12 3 Kemuning 70 - 70
Total 162 - 162 Source: www.balitbangjatim.com
The other potential energy found in Central Java province includes solar power,
biogas and biomass. The Province of Central Java has a biomass potential of rice as much
as 421,204.8 tons, Maize for 109,562.7 tons, 9,309.7 tons of Coconut, Sugar Cane for
10,495.7 tons and 8,198.5 tons of Trash. Cilacap has the greatest potential for Rice
(34,170.7 tons), Grobogan District has the greatest potential for maize (21,808.3 tons),
Kebumen Regency for Coconut (1503.7 tons), Sugar cane from Pati District (1962.2 tons),
and Trash from Banjarnegara Regency (2808.3 tons).
Central Java Province has a potential for biofuels of 2,048.6 tons of cotton, castor
oil of 1.6 tons, Coconut for 173,960.1 tons and 10,495.7 tons of sugar cane. Jepara has the
greatest potential for cotton area (1372.1 tons), castor oil is from Grobogan District (31.91

18
tons), coconut is from Wonogiri District (56,193.2 tons), and sugar cane is from Pati
Regency (1.962 tonnes).
Central Java Province has biogas potential, from: cattle (cow) of 3,224,383.20 tons
manure, 5,803,320.60 tons of Goat manure, and 3,225,504.06 tons of chicken manure.
Semarang has the greatest potential for cow manure (691,509.60 tons), Wonogiri District
for goat manure (1,018,350.00 tons) and Brebes for chicken manrure (311,984.46 tons).
19
CHAPTER 4
ENERGY SCENARIO
4.1 Energy Policy
The policy related to energy in Indonesia is divided into 2 based on the scope of
energy policies issued by the government. The first policy is called National Energy Policy
(KEN) being the target to be achieved as a whole (National) and Regional Energy Policy
(KED) which is determined by the local government for each area, referring to the KEN
and conditions of potential energy which exists in each region.
4.1.1 National Energy Policy
The policy on the management and utilization of energy in Indonesia is stated in the
National Energy Policy document 2003 - 2020 (KEN), National Energy Management
Blueprint 2005 to 2025 (PEN), and Presidential Regulation No. 5 Year 2006 on National
Energy Policy (Perpres KEN). KEN regulation basically strengthens the document of PEN
and KEN which is issued by the Ministry of Energy and Mineral Resources. Based on
KEN regulation, the objective of national energy policy is to direct the efforts in
maintaining security of energy supply in the country (Article 2 paragraph 1)
The legal basis of energy consists of:
1. Law Number 22 Year 1999 on Regional Government (State Gazette Year 1999
Number 60, Additional State Gazette Number 3952);
2. Law Number 22 Year 2001 on Oil and Gas
In an effort to create business activities of Oil and Gas which is independent,
reliable, transparent, competitive, efficient, and environmentally conservation
sound and encourage the development of potential and national role, the
government has issued Law Number 22 Year 2001 on Oil and Gas. The activity of
Hilir Migas business is focused on Processing, Transportation, Storage, and / or
Commerce and it is conducted through the mechanism of fair, healthy, and
transparent competition. However, the Government has the responsibility to ensure
the availability and nonstop distribution of fuel which is a vital commodity and
dominate people’s life in Republic of Indonesia.
20
3. Law No. 32 Year 2004 on Regional Autonomy
4. Law No. 30 Year 2007 on Energy
5. Government Regulation Number 10 Year 1989 on the Provision and Utilization of
Electricity Energy (State Gazette Year 1989 Number 24, Additional State Gazette
Number 3394);
6. Government Regulation Number 25 Year 2000 on the Authority of Provinces as
Autonomous Regions (State Gazette Year 2000 Number 54, Additional State
Gazette Number 3952);
7. In implementing the responsibility for setting and monitoring of business activities
and distribution of fuel supply and gas transportation business in the pipeline, the
Government has established an independent body of Badan Pengatur Hilir
Minyak dan Gas Bumi (Government Regulation no. 67 Year 2002 and the
Presidential Decree. 86 Year 2002).
8. Government Regulation No. 36 Year 2004 on Business Activities of Usaha Hilir
Minyak dan Gas Bumi;
9. Government Regulation No. 3 Year 2005 on amendments to the Regulation No. 10
Year 1989 on the Provision and Utilization of Electricity Energy which stated that
in order to implement regional autonomy in Electrical Power field, it is necessary to
give local governments a role in electricity supply. To ensure the availability of
primary energy to supply electricity for the public interest, the local energy
resources are prioritized by focusing the use of renewable energy sources
10. Presidential Regulation No. 5 Year 2006 on National Energy Policy;
11. Presidential Instruction No. 1 Year 2005 on the Provision and Utilization of Bio
Fuels (Biofuels) as Other Fuel;
12. ESDM No. 0048 of 2005 on Standards and Quality (Specification) and Control of
Fuel, Fuel Gas, Other Fuels, LPG, LNG and Processing Results which is marketed
within the country;
13. Regulation of the Minister of Energy and Mineral Resources No. 0007 Year 2005
on Requirements and Guidelines for the Implementation of Business Licenses in
the Activity of Usaha Hilir Minyak dan Gas Bumi;
14. Decree of the Minister of Energy and Mineral Resources No. 0954
K/30/MEM/2004 on General Plan of National Electricity.
21
15. Decision of the General Director of Oil and Natural Gas No. 3675 K/24/DJM/2006
on March 17, 2006 on the specification of fuel types of SOLAR;
16. Decision of the General Director of Oil and Natural Gas No. 3674 K/24/DJM/2006
on March 17, 2006 on the fuel types of BENSIN
17. Decision of Governor. 541/40/2004 on the Coordination Team of Control &
Distribution Monitoring of fuel in the province of Central Java (Secretariat for
Economic Affairs Bureau of Central Java Province)
18. Decree of. Chairman of TKP3BBM, No.541/11825/2005) on the Working Group
(Public Complaints Unit and the Monitoring of kerosene fuel UPMP BBMT
(BAPERMAS of CENTRAL JAVA PROVINCE)
4.1.2 Regional Energy Policy
1. Regional Energy Policy (KED) which is issued by local governments refers to the
KEN and conditions of the energy potential existing in their areas.
2. Guarantee the availability and nonstop distribution of fuel throughout the areas of
Republic of Indonesia;
3. National Fuel Reserve policy;
4. Mechanisms and/or formulation of the price of a particular fuel prior to the
existence of fair, healthy and transparent business competition;
5. Availability and distribution of certain types of fuel;
6. The capacity of minimum storage facilities that must be realized by Enterprises;
7. Administrative sanctions and / or fines for enterprises that do not provide national
fuel reserves when needed;
8. Imposing sanctions for violations of business license;
9. Policies related to the determination of Commerce Region for specific fuel types;
10. Policies on market opening phase;
11. Opening or closing the import or export of fuel based on technical and economic
considerations
12. Petroleum processing policies relating to the location, type and amount of fuel
produced;
13. Incentives for fuel distribution in Remote Areas;
14. The policy of fuel storage associated with the location, type and the amount.
22
4.2 Scenario Assumptions and Parameters
4.2.1 Assumption Scenarios
Scenarios used have to support policy and to be based on law as mentioned above.
Such scenarios should include the provision of fuel oil, usage of new renewable energy,
and increase of the electrification ratio and other assumptions as described as follows
Realize mix national energy based on Presidential regulation (Per-Pres) No. 5
Year 2006 with the percentage of each energy:
- Crude Oil is Less Than 20% of total primary energy use
- Natural Gas is More Than 30% of total primary energy use
- Coal is More Than 33% of total primary energy use
- Bio Fuels is More Than 5% of total primary energy use
- Geothermal is More Than 5% of total primary energy use
- Biomass, Nuclear, micro hydro, Solar, and Wind Power is More than 5%
of total primary energy use
- Coal liquefied is More Than 2% of total primary energy use
Increasing electrification ratio up to 100% in 2020, in accordance with national
policies on the above mentioned number 9
Convert energy from kerosene to LPG, in accordance with national policies on
the above mentioned number 18 and 19.
Achieve energy elasticity less than one in 2025 in accordance with national
policies on the above mentioned number 1 and 2.
Start to use renewable energy such as bio-diesel and bio-ethanol to support the
target of mix energy based on Presidential Rules No. 5 Year 2006 and president
instruction no 1 year 2005
The energy usage from natural gas that began in 2012 in accordance with
national energy policy that is mentioned in numbers 17 and 18.
Other national policies are not included into the scenario but should be included
because it became the legal basis and the basic policy which is used as reference for energy
planning in the Central Java Province.
23
Assumptions mentioned above will be inputed in the LEAP model related to the
energy consumption intensity, which will be conducted for incoming years based on the
assigned targets. For the addition of power plant capacity inputed into the transformation
sector of the model, changes to the existing generating capacity value to the year ahead in
accordance with existing policies are made. Such as the addition of Geothermal Power
Plant in Ungaran and PLTP Tanjung Jati Baru (B). In this scenario natural gas will begin
functioning in 2012 with the source of natural gas from East Kalimantan natural gas
pipeline to Semarang.
In accordance with CAREPI goal to reducing poverty in each region, there is a
change in the activity of household sector, beginning with changing of people's living
conditions from rural to urban. There is a poverty reduction which occurs both in villages
and cities. This leads to the changes from agricultural land to industrial and construction
sectors which resulting reduction of income value from the agricultural sector.
To reduce the dependence of fuel oil consumption, switches towards the usage
of renewable energy such as biodiesel, bioethanol, and vegetable oils will be made. This
will begin functioning in 2009. The source of biofuel is derived from Jatropha, cassava,
kappas, coconut, and other green energy-producing plants.
4.2.2 Parameter Scenarios
4.2.2.1 KEN (National Energy Policy) Scenarios
For KEN Scenario, assumptions used are as follows:
Population Growth is 1% per year, where this figure is taken from RUKN
(National Electricity General Plan) 2007. This is due to the absence of other
references that states the growth data like the above.
Total PDRB growth is 6.1% per year where this figure is taken from RUKN
(National Electricity General Plan) 2007. This is due to the absence of other
references that states the growth data as above.
The growth of electricity consumption for Household sector is 7.65%,
2.71% Commercial and Industrial 0.68%
Ratio of electrification is 100% by 2020, This data is taken from the
planned target of PLN in 2020.
24
Conversion from Kerosene to LPG and LPG in 2010 has replaced
kerosene, this is in accordance with national policy that for kerosene
conversion targets to LPG for the island of Java to be completed in 2010.
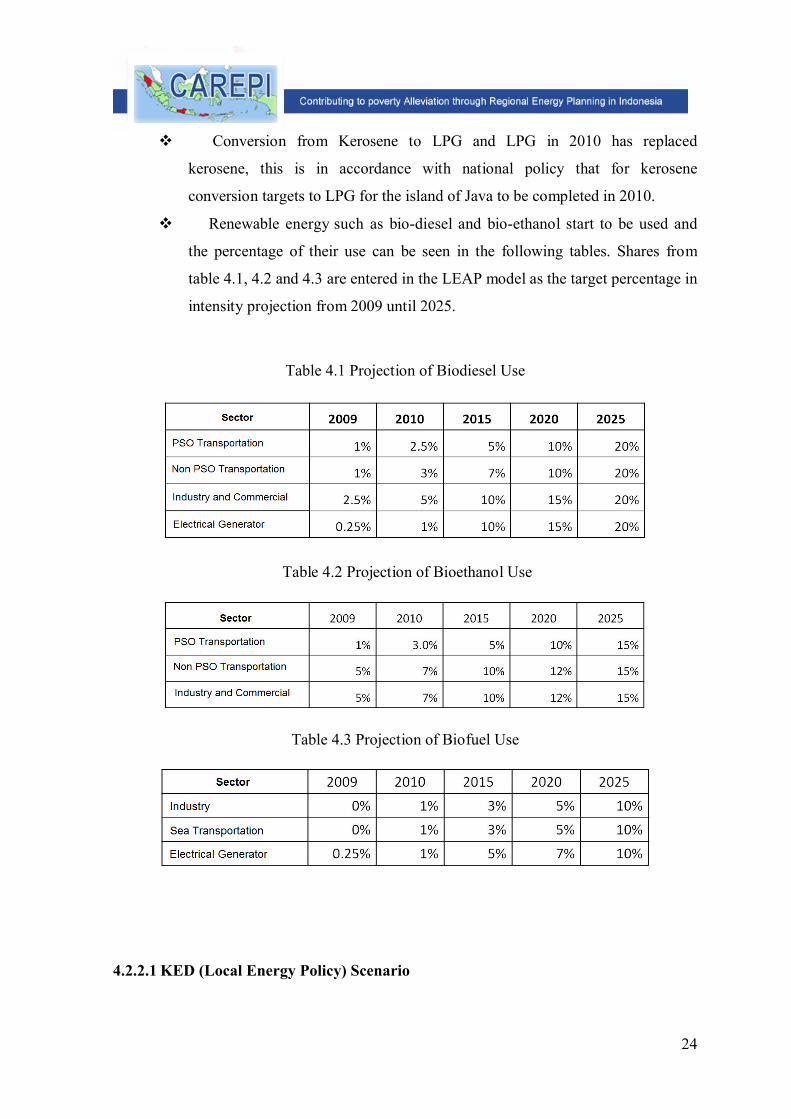
Renewable energy such as bio-diesel and bio-ethanol start to be used and
the percentage of their use can be seen in the following tables. Shares from
table 4.1, 4.2 and 4.3 are entered in the LEAP model as the target percentage in
intensity projection from 2009 until 2025.
Table 4.1 Projection of Biodiesel Use
Table 4.2 Projection of Bioethanol Use
Table 4.3 Projection of Biofuel Use
4.2.2.1 KED (Local Energy Policy) Scenario
25
Population Growth is 2.60 % per year, These figures are obtained by
following the growth pattern of population census data from BPS for 3 periods
before the year 2005.
Total PDRB Growth is 7 % per year, These figures obtained by following
the pattern of GDP growth of 3 periods of census data before the year 2005
from BPS.
The growth of electricity consumption for Household sector 3.05 %,
Commercial 2,74%, and Industrial 0,69%, These figures are obtained from a
Jateng RUKD report in 2007.
Electrification ratio in 2020 is 100% This data is taken from the plan target
of PLN in 2020 and targets for electrification ratio from MEMR for Central
Java Province.
Conversion from Kerosene to LPG and LPG in 2009 LPG has replaced
kerosene this is in accordance with local policy that kerosene conversion
targets to LPG for Central Java province will be completed in 2009.
Renewable energy such as bio-diesel and bio-ethanol start to be used and the
percentage of their use up to 2025 is similar to KEN Scenario.
From table 4.1, 4.2 and 4.3 the target percentage is entered in LEAP as
intensity projections from year 2009 until year 2025.
4.3 Energy Scenario Outcomes
In energy policy, each region has a policy named the Regional Energy Policy
(Kebijakan Energi Daerah-KED) which must be suited with their local conditions and is
also expected to support the National Energy policy (KEN).
The energy calculation outcome until the year 2025 of the scenario is generally
divided into 2 groups : the demand and the supply side. On both sides two scenarios t KEN
(National Energy Policy) and Ked (Regional Energy Policy) are given. From the second
scenario you will see different results in accordance with the policies applied.
The results of energy projections of Central Java using LEAP (Longe-range
Alternatives Planning System) is divided into 2 parts namely demand and supply in which
the result can be seen as follows:
26
4.3.1 Demand Side
4.3.1.1 KEN
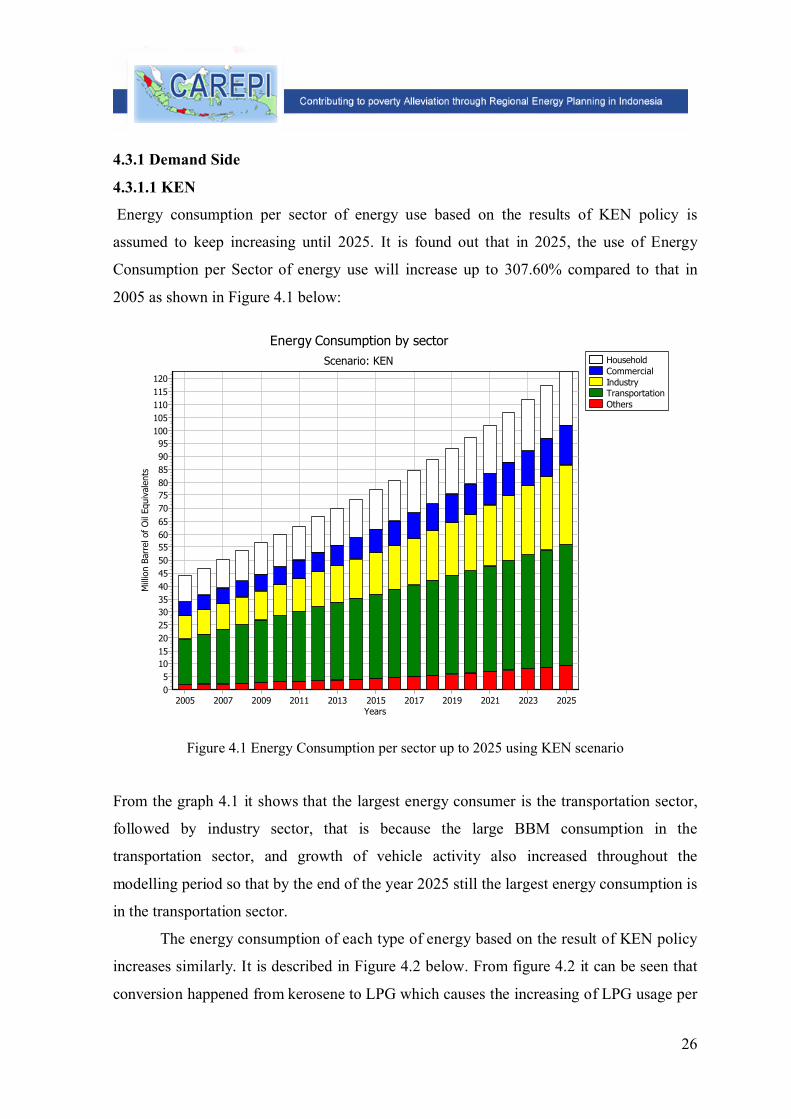
Energy consumption per sector of energy use based on the results of KEN policy is
assumed to keep increasing until 2025. It is found out that in 2025, the use of Energy
Consumption per Sector of energy use will increase up to 307.60% compared to that in
2005 as shown in Figure 4.1 below:
HouseholdCommercialIndustryTransportationOthers
Energy Consumption by sectorScenario: KEN
Years2005 2007 2009 2011 2013 2015 2017 2019 2021 2023 2025
Mill
ion
Barr
el o
f O
il Eq
uiva
lent
s
12011511010510095908580757065605550454035302520151050
Figure 4.1 Energy Consumption per sector up to 2025 using KEN scenario
From the graph 4.1 it shows that the largest energy consumer is the transportation sector,
followed by industry sector, that is because the large BBM consumption in the
transportation sector, and growth of vehicle activity also increased throughout the
modelling period so that by the end of the year 2025 still the largest energy consumption is
in the transportation sector.
The energy consumption of each type of energy based on the result of KEN policy
increases similarly. It is described in Figure 4.2 below. From figure 4.2 it can be seen that
conversion happened from kerosene to LPG which causes the increasing of LPG usage per
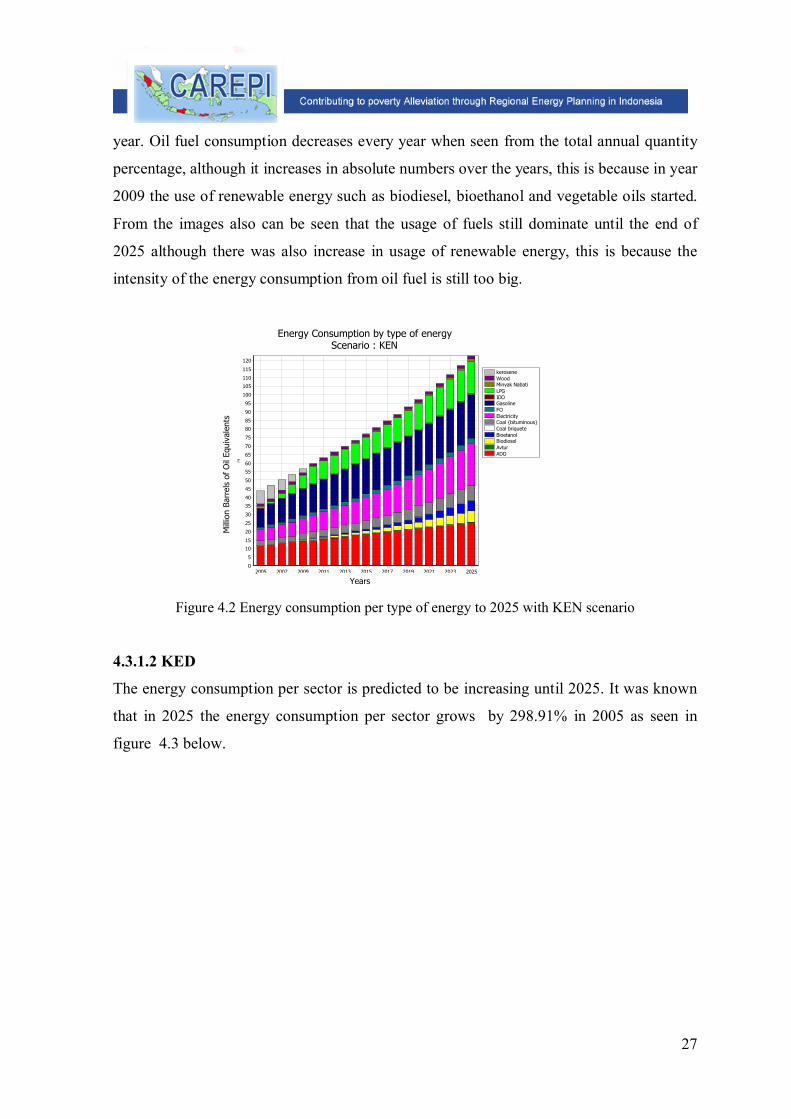
27
year. Oil fuel consumption decreases every year when seen from the total annual quantity
percentage, although it increases in absolute numbers over the years, this is because in year
2009 the use of renewable energy such as biodiesel, bioethanol and vegetable oils started.
From the images also can be seen that the usage of fuels still dominate until the end of
2025 although there was also increase in usage of renewable energy, this is because the
intensity of the energy consumption from oil fuel is still too big.
keroseneWoodMinyak NabatiLPGIDOGasolineFOElectricityCoal {bituminous}Coal briqueteBioetanolBiodieselAvturADO
2005 2007 2009 2011 2013 2015 2017 2019 2021 2023 2025
M
120
115
110
105
100
95
90
85
80
75
70
65
60
55
50
45
40
35
30
25
20
15
10
5
0
Energy Consumption by type of energyScenario : KEN
Mill
ion
Barr
els
of O
il Eq
uiva
lent
s
Years
Figure 4.2 Energy consumption per type of energy to 2025 with KEN scenario
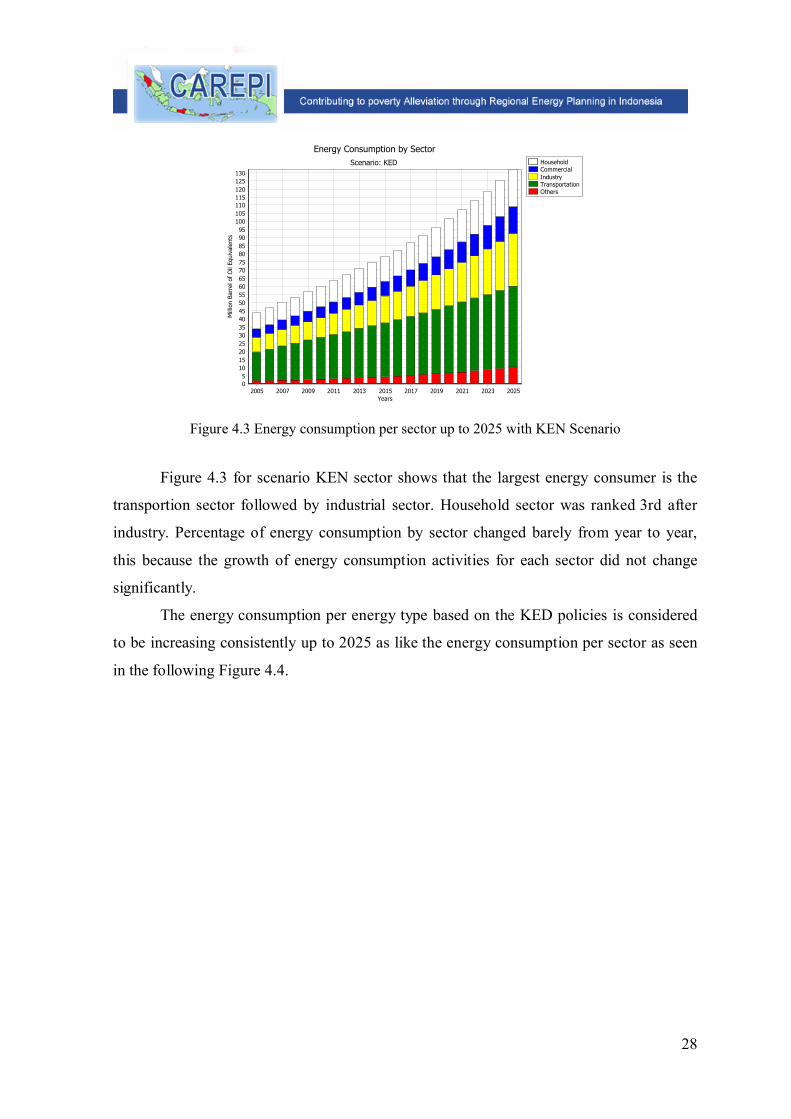
4.3.1.2 KED
The energy consumption per sector is predicted to be increasing until 2025. It was known
that in 2025 the energy consumption per sector grows by 298.91% in 2005 as seen in
figure 4.3 below.
28
HouseholdCommercialIndustryTransportationOthers
Energy Consumption by SectorScenario: KED
Years2005 2007 2009 2011 2013 2015 2017 2019 2021 2023 2025
Mill
ion
Barr
el o
f O
il Eq
uiva
lent
s
13012512011511010510095908580757065605550454035302520151050
Figure 4.3 Energy consumption per sector up to 2025 with KEN Scenario
Figure 4.3 for scenario KEN sector shows that the largest energy consumer is the
transportion sector followed by industrial sector. Household sector was ranked 3rd after
industry. Percentage of energy consumption by sector changed barely from year to year,
this because the growth of energy consumption activities for each sector did not change
significantly.
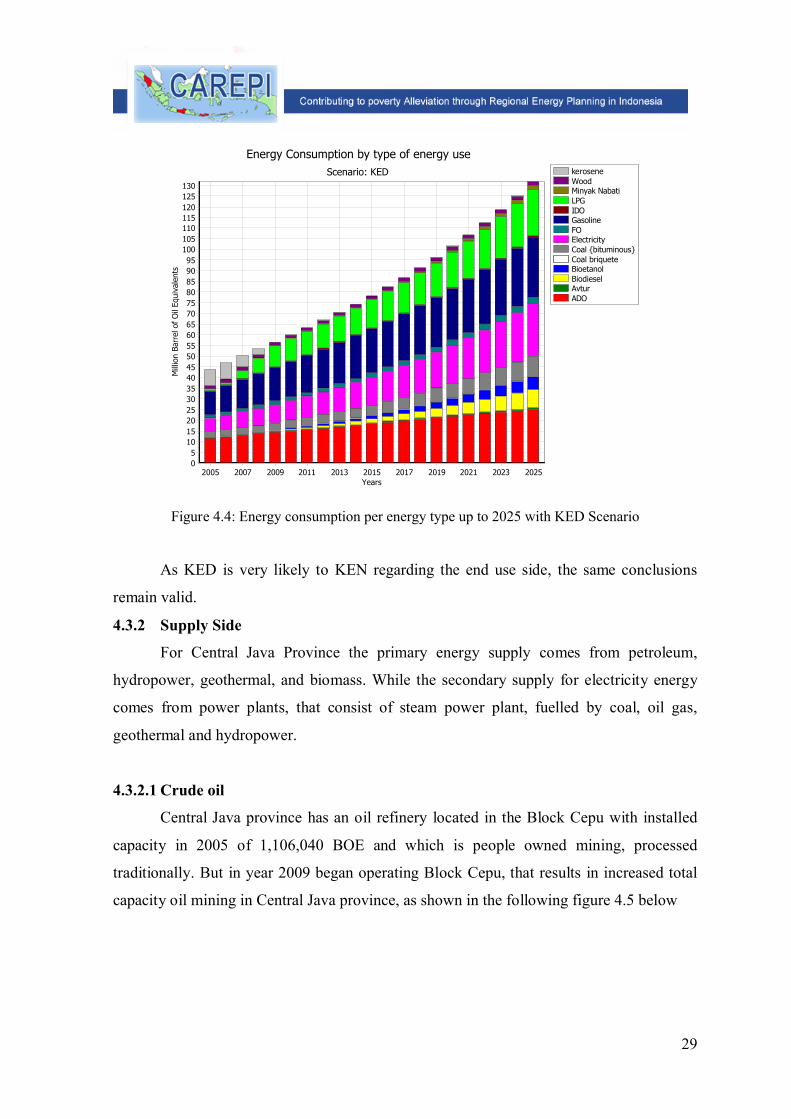
The energy consumption per energy type based on the KED policies is considered
to be increasing consistently up to 2025 as like the energy consumption per sector as seen
in the following Figure 4.4.
29
keroseneWoodMinyak NabatiLPGIDOGasolineFOElectricityCoal {bituminous}Coal briqueteBioetanolBiodieselAvturADO
Energy Consumption by type of energy useScenario: KED
Years2005 2007 2009 2011 2013 2015 2017 2019 2021 2023 2025
Mill
ion
Barr
el o
f O
il Eq
uiva
lent
s
13012512011511010510095908580757065605550454035302520151050
Figure 4.4: Energy consumption per energy type up to 2025 with KED Scenario
As KED is very likely to KEN regarding the end use side, the same conclusions
remain valid.
4.3.2 Supply Side
For Central Java Province the primary energy supply comes from petroleum,
hydropower, geothermal, and biomass. While the secondary supply for electricity energy
comes from power plants, that consist of steam power plant, fuelled by coal, oil gas,
geothermal and hydropower.
4.3.2.1 Crude oil
Central Java province has an oil refinery located in the Block Cepu with installed
capacity in 2005 of 1,106,040 BOE and which is people owned mining, processed
traditionally. But in year 2009 began operating Block Cepu, that results in increased total
capacity oil mining in Central Java province, as shown in the following figure 4.5 below

30
Tambang RakyatBlok Cepu
Oil Minning Capacity
Years2005 2007 2009 2011 2013 2015 2017 2019 2021 2023 2025
Thou
sand
BBL
Oil
Equi
v/Ye
ars
4,200
4,000
3,800
3,600
3,400
3,200
3,000
2,800
2,600
2,400
2,200
2,000
1,800
1,600
1,400
1,200
1,000
800
600
400
200
0
Figure 4.5 Projected Petroleum Mining Capacity
4.3.2.2 Refinery
1. Oil Production
In 2009 Central Java Province has a new oil refinery that is Cepu portable refinery
so the oil production increased as shown in Figure 4.6 below.
Kilang UP IV CilacapKilang PPT Migas CepuKilang Portable Cepu
Refinery OutputScenario: KEN
Years2005 2007 2009 2011 2013 2015 2017 2019 2021 2023 2025
Mill
ion
Barr
el o
f O
il Eq
uiva
lent
s
11511010510095908580757065605550454035302520151050
Kilang UP IV CilacapKilang PPT Migas CepuKilang Portable Cepu
refinery OutputScenario: KED
Years2005 2007 2009 2011 2013 2015 2017 2019 2021 2023 2025
Mill
ion
Barr
el o
f O
il Eq
uiva
lent
s
11511010510095908580757065605550454035302520151050
Figure 4.6 Refinery Production
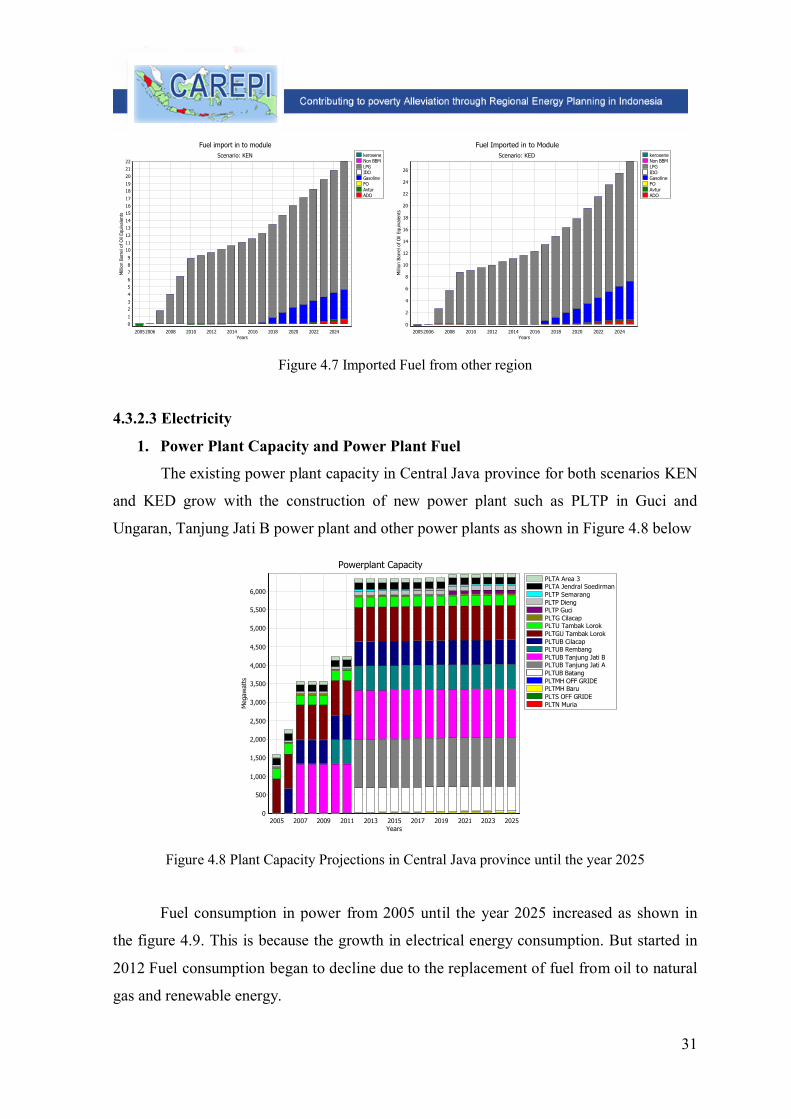
2. Imported Fuel
Along with the conversion process from kerosene to LPG the LPG consumption
from year 2009 until the year 2025 has been increased, but this increase was not
accompanied by the increase of LPG production at existed oil refineries so in year 2009
Central Java province began import LPG from other regions. Current supplies are
sufficient for Premium and Solar consumption but from the projection made for both
scenarios KEN (National Energy Policy) and KED (Regional Energy Policy) Central Java
province began importing in 2017 Premium and Solar Oil in 2022, as shown in the picture
below 4.7.
31
keroseneNon BBMLPGIDOGasolineFOAvturADO
Fuel import in to moduleScenario: KEN
Years20052006 2008 2010 2012 2014 2016 2018 2020 2022 2024
Mill
ion
Barr
el o
f Oil
Equi
vale
nts
222120
1918
171615141312
1110
987654
32
10
keroseneNon BBMLPGIDOGasolineFOAvturADO
Fuel Imported in to ModuleScenario: KED
Years20052006 2008 2010 2012 2014 2016 2018 2020 2022 2024
Mill
ion
Barr
el o
f O
il Eq
uiva
lent
s
26
24
22
20
18
16
14
12
10
8
6
4
2
0
Figure 4.7 Imported Fuel from other region
4.3.2.3 Electricity
1. Power Plant Capacity and Power Plant Fuel
The existing power plant capacity in Central Java province for both scenarios KEN
and KED grow with the construction of new power plant such as PLTP in Guci and
Ungaran, Tanjung Jati B power plant and other power plants as shown in Figure 4.8 below
PLTA Area 3PLTA Jendral SoedirmanPLTP SemarangPLTP DiengPLTP GuciPLTG CilacapPLTU Tambak LorokPLTGU Tambak LorokPLTUB CilacapPLTUB RembangPLTUB Tanjung Jati BPLTUB Tanjung Jati APLTUB BatangPLTMH OFF GRIDEPLTMH BaruPLTS OFF GRIDEPLTN Muria
Powerplant Capacity
Years2005 2007 2009 2011 2013 2015 2017 2019 2021 2023 2025
Meg
awat
ts
6,000
5,500
5,000
4,500
4,000
3,500
3,000
2,500
2,000
1,500
1,000
500
0
Figure 4.8 Plant Capacity Projections in Central Java province until the year 2025
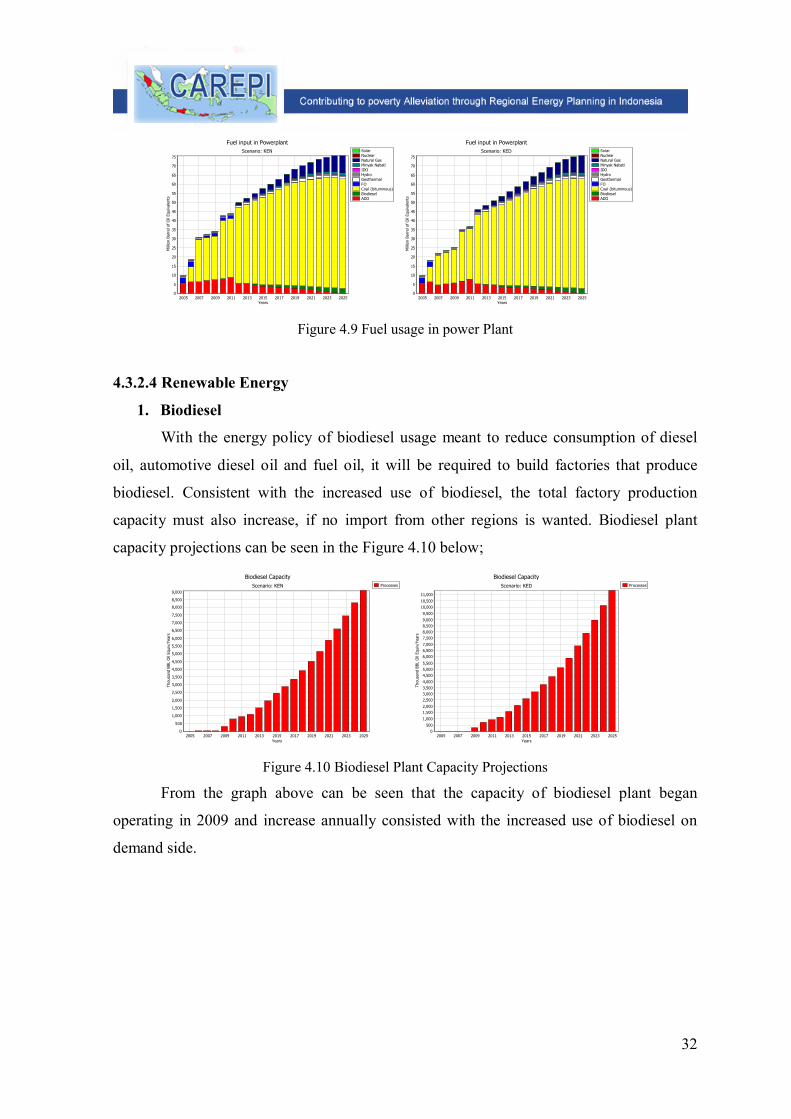
Fuel consumption in power from 2005 until the year 2025 increased as shown in
the figure 4.9. This is because the growth in electrical energy consumption. But started in
2012 Fuel consumption began to decline due to the replacement of fuel from oil to natural
gas and renewable energy.
32
SolarNuclearNatural GasMinyak NabatiIDOHydroGeothermalFOCoal {bituminous}BiodieselADO
Fuel input in PowerplantScenario: KEN
Years2005 2007 2009 2011 2013 2015 2017 2019 2021 2023 2025
Mill
ion
Barr
el o
f O
il Eq
uiva
lent
s
75
70
65
60
55
50
45
40
35
30
25
20
15
10
5
0
SolarNuclearNatural GasMinyak NabatiIDOHydroGeothermalFOCoal {bituminous}BiodieselADO
Fuel input in PowerplantScenario: KED
Years2005 2007 2009 2011 2013 2015 2017 2019 2021 2023 2025
Mill
ion
Barr
el o
f O
il Eq
uiva
lent
s
75
70
65
60
55
50
45
40
35
30
25
20
15
10
5
0
Figure 4.9 Fuel usage in power Plant
4.3.2.4 Renewable Energy
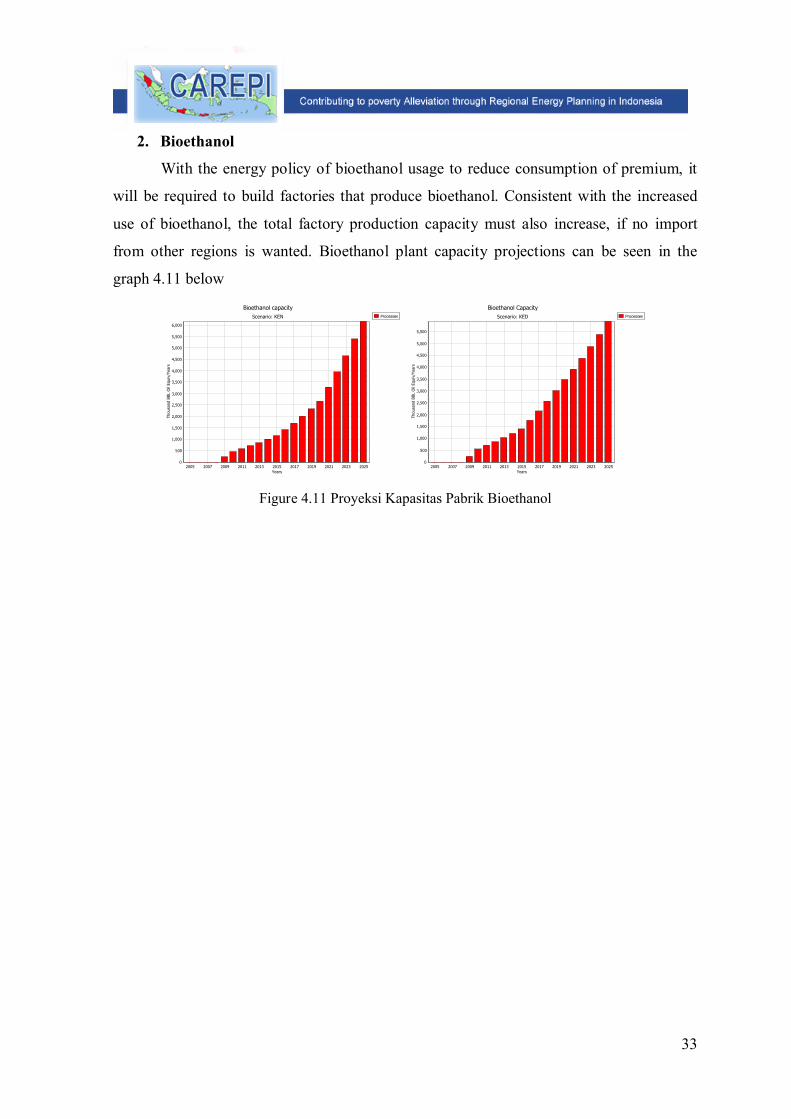
1. Biodiesel
With the energy policy of biodiesel usage meant to reduce consumption of diesel
oil, automotive diesel oil and fuel oil, it will be required to build factories that produce
biodiesel. Consistent with the increased use of biodiesel, the total factory production
capacity must also increase, if no import from other regions is wanted. Biodiesel plant
capacity projections can be seen in the Figure 4.10 below;
Processes
Biodiesel CapacityScenario: KEN
Years2005 2007 2009 2011 2013 2015 2017 2019 2021 2023 2025
Thou
sand
BBL
Oil
Equi
v/Ye
ars
9,000
8,500
8,000
7,500
7,000
6,500
6,000
5,500
5,000
4,500
4,000
3,500
3,000
2,500
2,000
1,500
1,000
500
0
Processes
Biodiesel CapacityScenario: KED
Years2005 2007 2009 2011 2013 2015 2017 2019 2021 2023 2025
Thou
sand
BBL
Oil
Equi
v/Ye
ars
11,000
10,50010,000
9,500
9,0008,5008,0007,500
7,0006,5006,000
5,5005,0004,500
4,0003,5003,0002,500
2,0001,500
1,000
5000
Figure 4.10 Biodiesel Plant Capacity Projections
From the graph above can be seen that the capacity of biodiesel plant began
operating in 2009 and increase annually consisted with the increased use of biodiesel on
demand side.
33
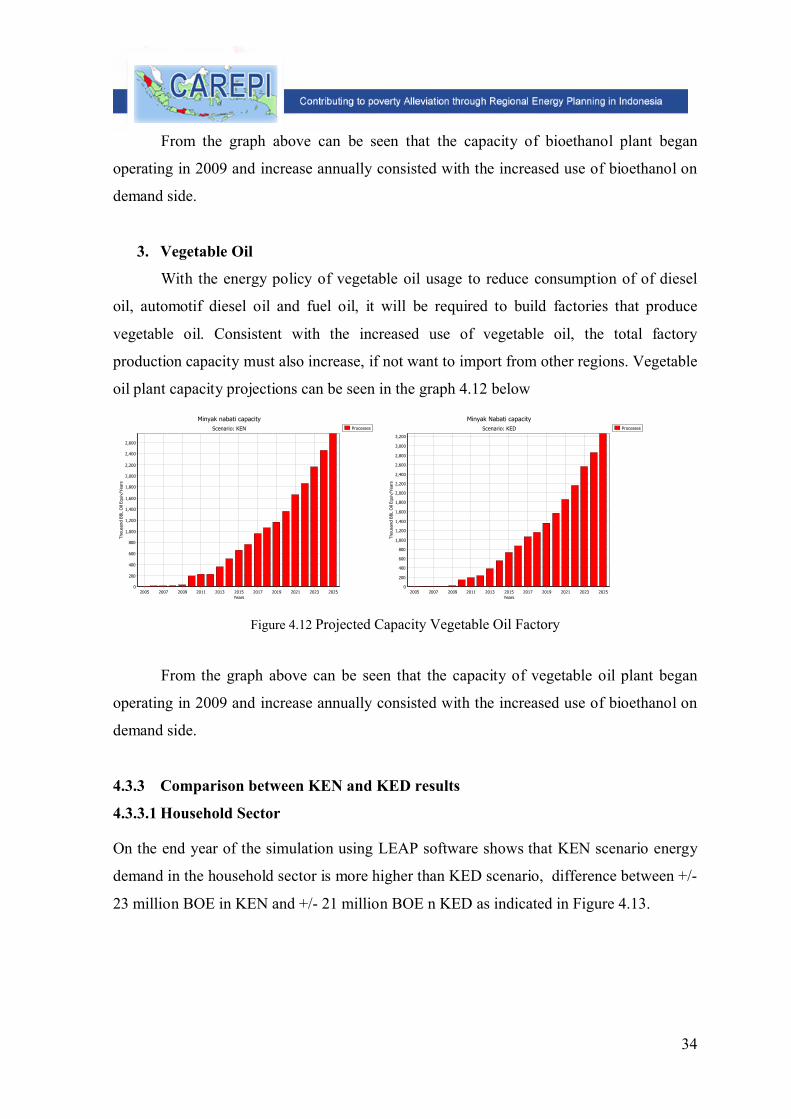
2. Bioethanol
With the energy policy of bioethanol usage to reduce consumption of premium, it
will be required to build factories that produce bioethanol. Consistent with the increased
use of bioethanol, the total factory production capacity must also increase, if no import
from other regions is wanted. Bioethanol plant capacity projections can be seen in the
graph 4.11 below
Processes
Bioethanol capacityScenario: KEN
Years2005 2007 2009 2011 2013 2015 2017 2019 2021 2023 2025
Thou
sand
BBL
Oil
Equi
v/Ye
ars
6,000
5,500
5,000
4,500
4,000
3,500
3,000
2,500
2,000
1,500
1,000
500
0
Processes
Bioethanol CapacityScenario: KED
Years2005 2007 2009 2011 2013 2015 2017 2019 2021 2023 2025
Thou
sand
BBL
Oil
Equi
v/Ye
ars
5,500
5,000
4,500
4,000
3,500
3,000
2,500
2,000
1,500
1,000
500
0
Figure 4.11 Proyeksi Kapasitas Pabrik Bioethanol
34
From the graph above can be seen that the capacity of bioethanol plant began
operating in 2009 and increase annually consisted with the increased use of bioethanol on
demand side.
3. Vegetable Oil
With the energy policy of vegetable oil usage to reduce consumption of of diesel
oil, automotif diesel oil and fuel oil, it will be required to build factories that produce
vegetable oil. Consistent with the increased use of vegetable oil, the total factory
production capacity must also increase, if not want to import from other regions. Vegetable
oil plant capacity projections can be seen in the graph 4.12 below
Processes
Minyak nabati capacityScenario: KEN
Years2005 2007 2009 2011 2013 2015 2017 2019 2021 2023 2025
Thou
sand
BBL
Oil
Equi
v/Ye
ars
2,600
2,400
2,200
2,000
1,800
1,600
1,400
1,200
1,000
800
600
400
200
0
Processes
Minyak Nabati capacityScenario: KED
Years2005 2007 2009 2011 2013 2015 2017 2019 2021 2023 2025
Thou
sand
BBL
Oil
Equi
v/Ye
ars
3,200
3,000
2,800
2,600
2,400
2,200
2,000
1,800
1,600
1,400
1,200
1,000
800
600
400
200
0
Figure 4.12 Projected Capacity Vegetable Oil Factory
From the graph above can be seen that the capacity of vegetable oil plant began
operating in 2009 and increase annually consisted with the increased use of bioethanol on
demand side.
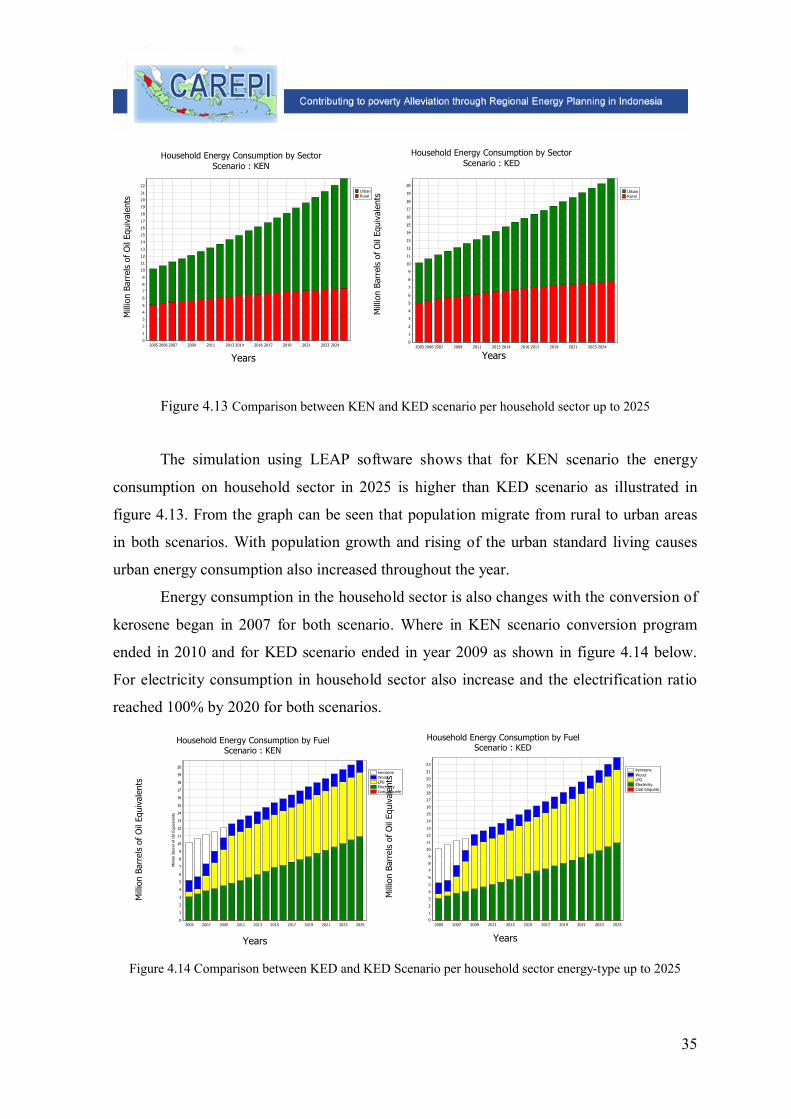
4.3.3 Comparison between KEN and KED results
4.3.3.1 Household Sector
On the end year of the simulation using LEAP software shows that KEN scenario energy
demand in the household sector is more higher than KED scenario, difference between +/-
23 million BOE in KEN and +/- 21 million BOE n KED as indicated in Figure 4.13.
35
UrbanRural
20052006 2007 2009 2011 2013 2014 2016 2017 2019 2021 2023 2024
20
19
18
17
16
15
14
13
12
11
10
9
8
7
6
5
4
3
2
1
0
UrbanRural
2005 2006 2007 2009 2011 2013 2014 2016 2017 2019 2021 2023 2024
22
21
20
19
18
17
16
15
14
13
12
11
10
9
8
7
6
5
4
3
2
1
0
Household Energy Consumption by SectorScenario : KEN
Mill
ion
Barr
els
of O
il Eq
uiva
lent
s
Years
Household Energy Consumption by SectorScenario : KED
Mill
ion
Barr
els
of O
il Eq
uiva
lent
s
Years
Figure 4.13 Comparison between KEN and KED scenario per household sector up to 2025
The simulation using LEAP software shows that for KEN scenario the energy
consumption on household sector in 2025 is higher than KED scenario as illustrated in
figure 4.13. From the graph can be seen that population migrate from rural to urban areas
in both scenarios. With population growth and rising of the urban standard living causes
urban energy consumption also increased throughout the year.
Energy consumption in the household sector is also changes with the conversion of
kerosene began in 2007 for both scenario. Where in KEN scenario conversion program
ended in 2010 and for KED scenario ended in year 2009 as shown in figure 4.14 below.
For electricity consumption in household sector also increase and the electrification ratio
reached 100% by 2020 for both scenarios.
keroseneWoodLPGElectricityCoal briquete
2005 2007 2009 2011 2013 2015 2017 2019 2021 2023 2025
Mill
ion
Barr
el o
f O
il Eq
uiva
lent
s
20
19
18
17
16
15
14
13
12
11
10
9
8
7
6
5
4
3
2
1
0
keroseneWoodLPGElectricityCoal briquete
2005 2007 2009 2011 2013 2015 2017 2019 2021 2023 2025
22
21
20
19
18
17
16
15
14
13
12
11
10
9
8
7
6
5
4
3
2
1
0
Household Energy Consumption by FuelScenario : KEN
Mill
ion
Barr
els
of O
il Eq
uiva
lent
s
Years
Household Energy Consumption by FuelScenario : KED
Mill
ion
Barr
els
of O
il Eq
uiva
lent
s
Years
Figure 4.14 Comparison between KED and KED Scenario per household sector energy-type up to 2025
36
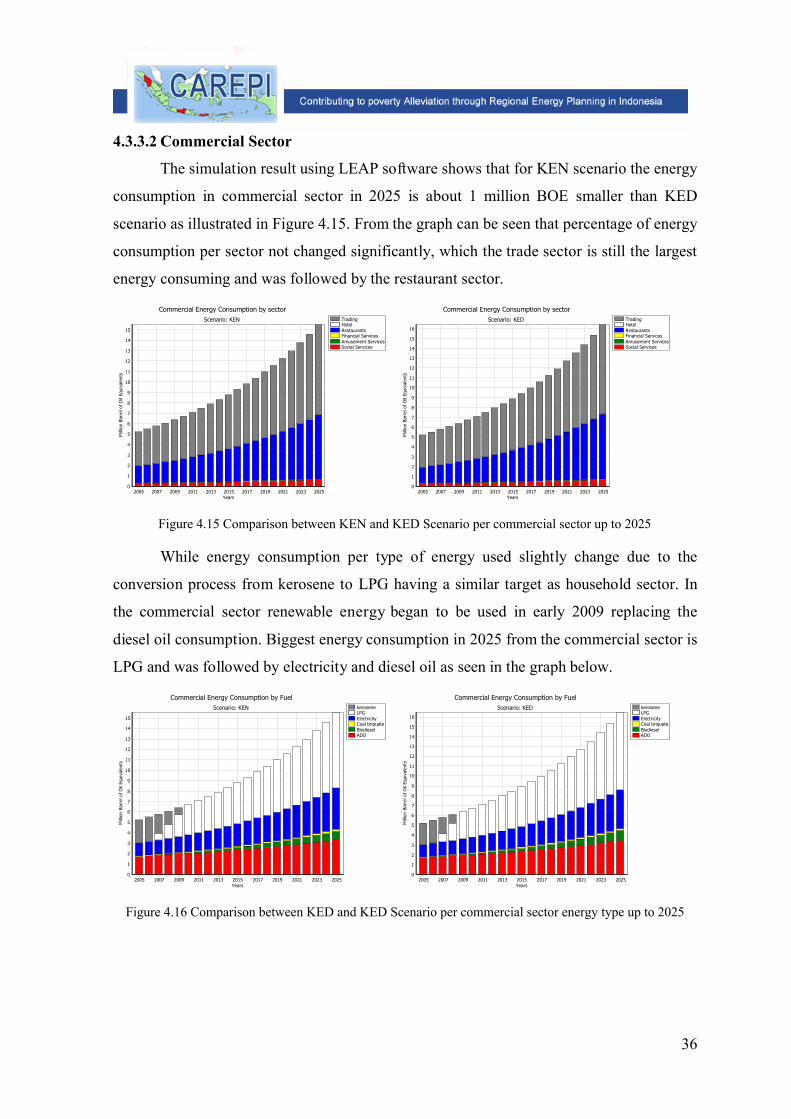
4.3.3.2 Commercial Sector
The simulation result using LEAP software shows that for KEN scenario the energy
consumption in commercial sector in 2025 is about 1 million BOE smaller than KED
scenario as illustrated in Figure 4.15. From the graph can be seen that percentage of energy
consumption per sector not changed significantly, which the trade sector is still the largest
energy consuming and was followed by the restaurant sector.
TradingHotelRestaurantsFinancial ServicesAmusement ServicesSocial Services
Commercial Energy Consumption by sectorScenario: KEN
Years2005 2007 2009 2011 2013 2015 2017 2019 2021 2023 2025
Mill
ion
Barr
el o
f O
il Eq
uiva
lent
s
15
14
13
12
11
10
9
8
7
6
5
4
3
2
1
0
TradingHotelRestaurantsFinancial ServicesAmusement ServicesSocial Services
Commercial Energy Consumption by sectorScenario: KED
Years2005 2007 2009 2011 2013 2015 2017 2019 2021 2023 2025
Mill
ion
Barr
el o
f O
il Eq
uiva
lent
s
16
15
14
13
12
11
10
9
8
7
6
5
4
3
2
1
0
Figure 4.15 Comparison between KEN and KED Scenario per commercial sector up to 2025
While energy consumption per type of energy used slightly change due to the
conversion process from kerosene to LPG having a similar target as household sector. In
the commercial sector renewable energy began to be used in early 2009 replacing the
diesel oil consumption. Biggest energy consumption in 2025 from the commercial sector is
LPG and was followed by electricity and diesel oil as seen in the graph below.
keroseneLPGElectricityCoal briqueteBiodieselADO
Commercial Energy Consumption by FuelScenario: KEN
Years2005 2007 2009 2011 2013 2015 2017 2019 2021 2023 2025
Mill
ion
Barr
el o
f O
il Eq
uiva
lent
s
15
14
13
12
11
10
9
8
7
6
5
4
3
2
1
0
keroseneLPGElectricityCoal briqueteBiodieselADO
Commercial Energy Consumption by FuelScenario: KED
Years2005 2007 2009 2011 2013 2015 2017 2019 2021 2023 2025
Mill
ion
Barr
el o
f O
il Eq
uiva
lent
s
16
15
14
13
12
11
10
9
8
7
6
5
4
3
2
1
0
Figure 4.16 Comparison between KED and KED Scenario per commercial sector energy type up to 2025
37
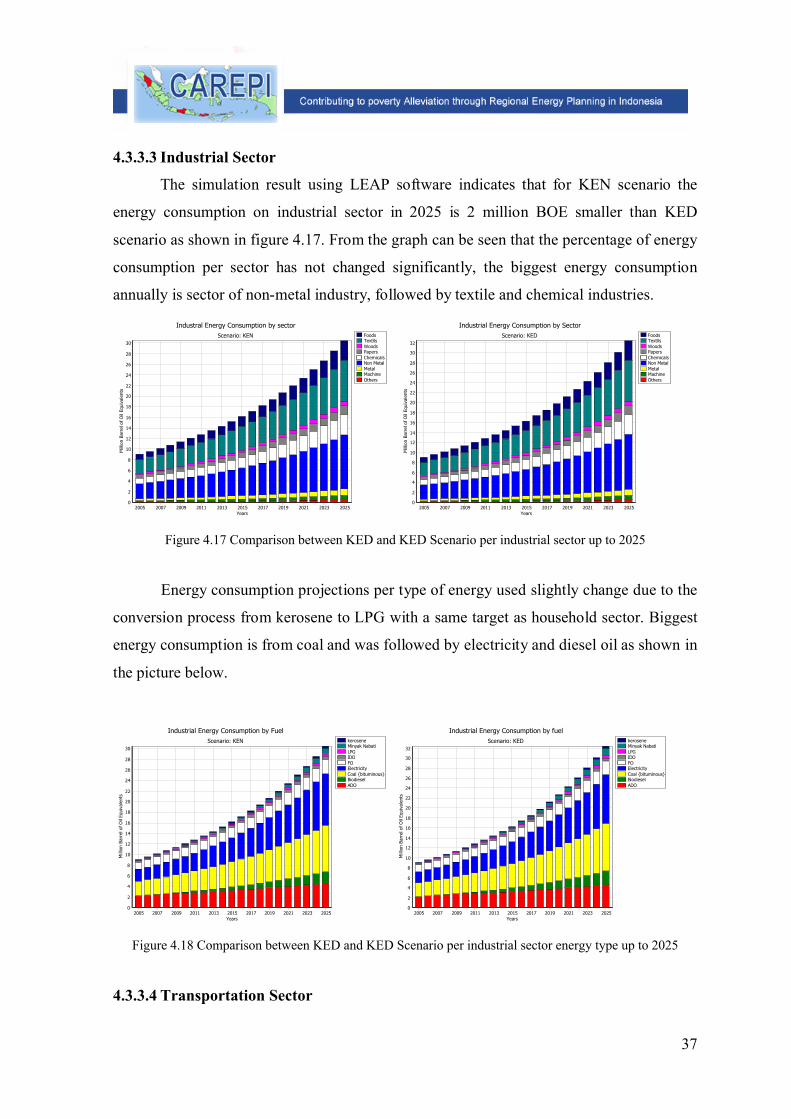
4.3.3.3 Industrial Sector
The simulation result using LEAP software indicates that for KEN scenario the
energy consumption on industrial sector in 2025 is 2 million BOE smaller than KED
scenario as shown in figure 4.17. From the graph can be seen that the percentage of energy
consumption per sector has not changed significantly, the biggest energy consumption
annually is sector of non-metal industry, followed by textile and chemical industries.
FoodsTextilsWoodsPapersChemicalsNon MetalMetalMachineOthers
Industral Energy Consumption by sectorScenario: KEN
Years2005 2007 2009 2011 2013 2015 2017 2019 2021 2023 2025
Mill
ion
Barr
el o
f O
il Eq
uiva
lent
s
30
28
26
24
22
20
18
16
14
12
10
8
6
4
2
0
FoodsTextilsWoodsPapersChemicalsNon MetalMetalMachineOthers
Industrial Energy Consumption by SectorScenario: KED
Years2005 2007 2009 2011 2013 2015 2017 2019 2021 2023 2025
Mill
ion
Barr
el o
f O
il Eq
uiva
lent
s
32
30
28
26
24
22
20
18
16
14
12
10
8
6
4
2
0
Figure 4.17 Comparison between KED and KED Scenario per industrial sector up to 2025
Energy consumption projections per type of energy used slightly change due to the
conversion process from kerosene to LPG with a same target as household sector. Biggest
energy consumption is from coal and was followed by electricity and diesel oil as shown in
the picture below.
keroseneMinyak NabatiLPGIDOFOElectricityCoal {bituminous}BiodieselADO
Industrial Energy Consumption by FuelScenario: KEN
Years2005 2007 2009 2011 2013 2015 2017 2019 2021 2023 2025
Mill
ion
Barr
el o
f O
il Eq
uiva
lent
s
30
28
26
24
22
20
18
16
14
12
10
8
6
4
2
0
keroseneMinyak NabatiLPGIDOFOElectricityCoal {bituminous}BiodieselADO
Industrial Energy Consumption by fuelScenario: KED
Years2005 2007 2009 2011 2013 2015 2017 2019 2021 2023 2025
Mill
ion
Barr
el o
f O
il Eq
uiva
lent
s
32
30
28
26
24
22
20
18
16
14
12
10
8
6
4
2
0
Figure 4.18 Comparison between KED and KED Scenario per industrial sector energy type up to 2025
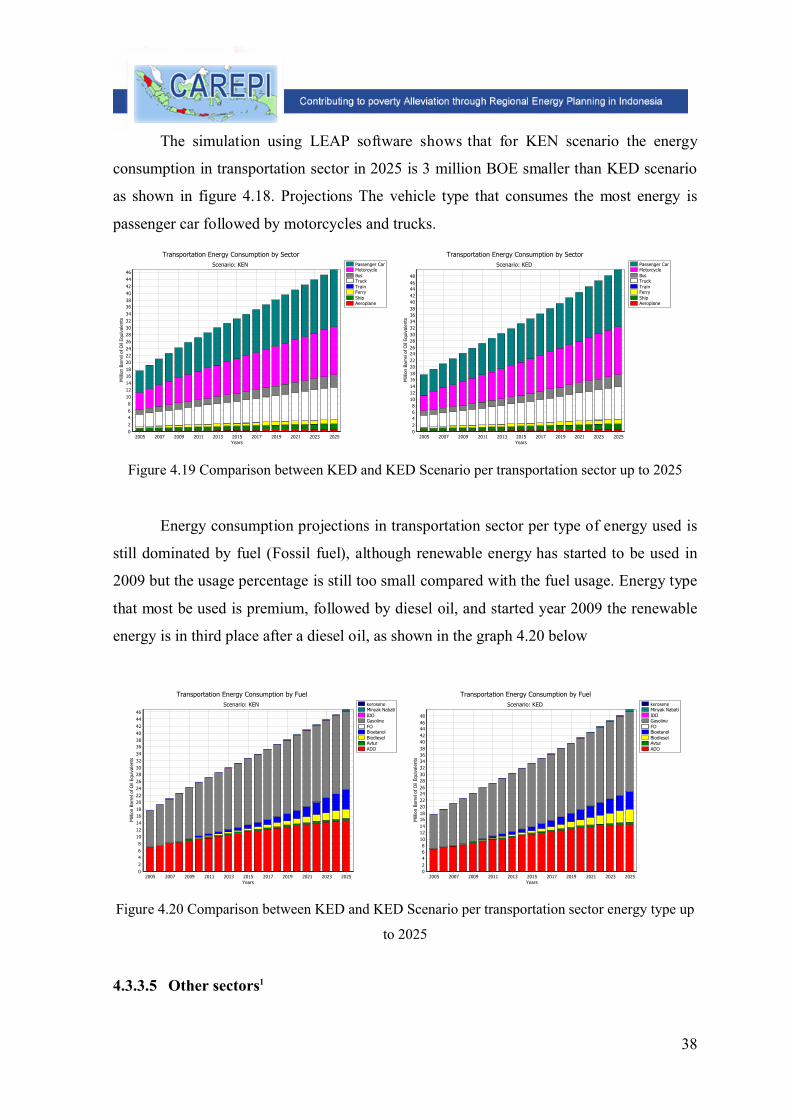
4.3.3.4 Transportation Sector
38
The simulation using LEAP software shows that for KEN scenario the energy
consumption in transportation sector in 2025 is 3 million BOE smaller than KED scenario
as shown in figure 4.18. Projections The vehicle type that consumes the most energy is
passenger car followed by motorcycles and trucks.
Passenger CarMotorcycleBusTruckTrainFerryShipAeroplane
Transportation Energy Consumption by SectorScenario: KEN
Years2005 2007 2009 2011 2013 2015 2017 2019 2021 2023 2025
Mill
ion
Barr
el o
f O
il Eq
uiva
lent
s
4644424038363432302826242220181614121086420
Passenger CarMotorcycleBusTruckTrainFerryShipAeroplane
Transportation Energy Consumption by SectorScenario: KED
Years2005 2007 2009 2011 2013 2015 2017 2019 2021 2023 2025
Mill
ion
Barr
el o
f O
il Eq
uiva
lent
s
484644424038363432302826242220181614121086420
Figure 4.19 Comparison between KED and KED Scenario per transportation sector up to 2025
Energy consumption projections in transportation sector per type of energy used is
still dominated by fuel (Fossil fuel), although renewable energy has started to be used in
2009 but the usage percentage is still too small compared with the fuel usage. Energy type
that most be used is premium, followed by diesel oil, and started year 2009 the renewable
energy is in third place after a diesel oil, as shown in the graph 4.20 below
keroseneMinyak NabatiIDOGasolineFOBioetanolBiodieselAvturADO
Transportation Energy Consumption by FuelScenario: KEN
Years2005 2007 2009 2011 2013 2015 2017 2019 2021 2023 2025
Mill
ion
Barr
el o
f O
il Eq
uiva
lent
s
4644424038363432302826242220181614121086420
keroseneMinyak NabatiIDOGasolineFOBioetanolBiodieselAvturADO
Transportation Energy Consumption by FuelScenario: KED
Years2005 2007 2009 2011 2013 2015 2017 2019 2021 2023 2025
Mill
ion
Barr
el o
f O
il Eq
uiva
lent
s
484644424038363432302826242220181614121086420
Figure 4.20 Comparison between KED and KED Scenario per transportation sector energy type up
to 2025
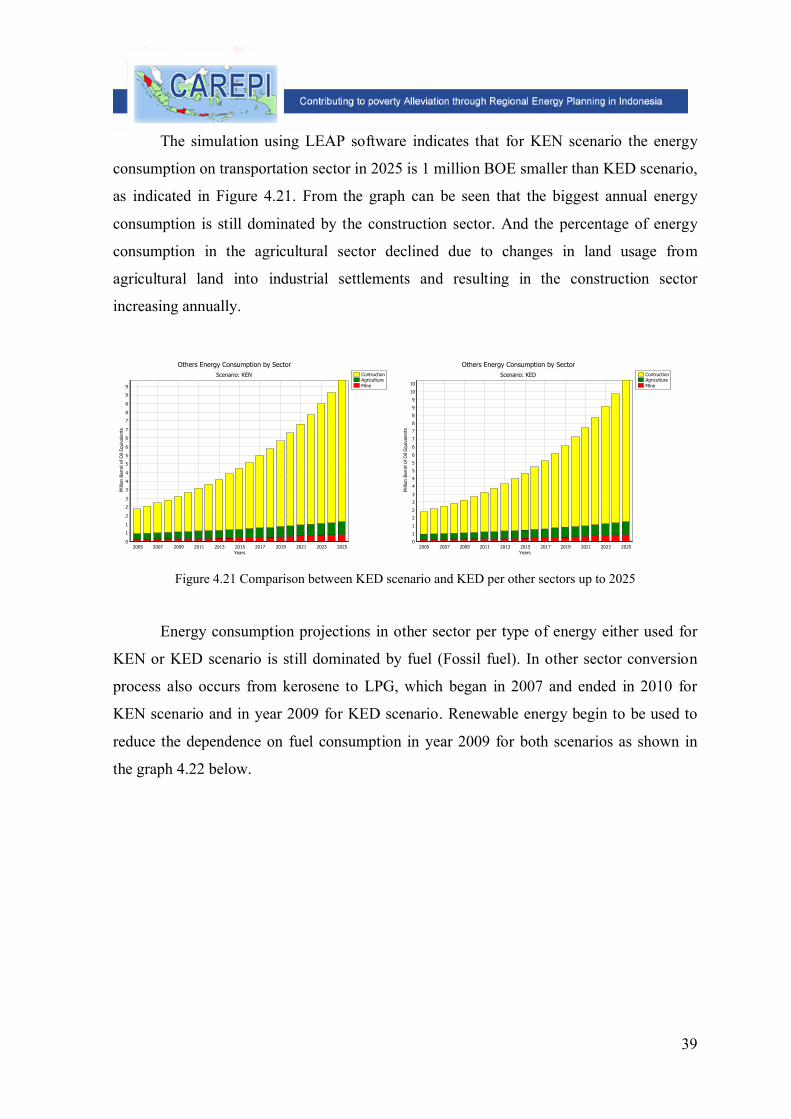
4.3.3.5 Other sectors1
39
The simulation using LEAP software indicates that for KEN scenario the energy
consumption on transportation sector in 2025 is 1 million BOE smaller than KED scenario,
as indicated in Figure 4.21. From the graph can be seen that the biggest annual energy
consumption is still dominated by the construction sector. And the percentage of energy
consumption in the agricultural sector declined due to changes in land usage from
agricultural land into industrial settlements and resulting in the construction sector
increasing annually.
ContructionAgricultureMine
Others Energy Consumption by SectorScenario: KEN
Years2005 2007 2009 2011 2013 2015 2017 2019 2021 2023 2025
Mill
ion
Barr
el o
f O
il Eq
uiva
lent
s
9
9
8
8
7
7
6
6
5
5
4
4
3
3
2
2
1
1
0
ContructionAgricultureMine
Others Energy Consumption by SectorScenario: KED
Years2005 2007 2009 2011 2013 2015 2017 2019 2021 2023 2025
Mill
ion
Barr
el o
f O
il Eq
uiva
lent
s
10
10
9
9
8
8
7
7
6
6
5
5
4
4
3
3
2
2
1
1
0
Figure 4.21 Comparison between KED scenario and KED per other sectors up to 2025
Energy consumption projections in other sector per type of energy either used for
KEN or KED scenario is still dominated by fuel (Fossil fuel). In other sector conversion
process also occurs from kerosene to LPG, which began in 2007 and ended in 2010 for
KEN scenario and in year 2009 for KED scenario. Renewable energy begin to be used to
reduce the dependence on fuel consumption in year 2009 for both scenarios as shown in
the graph 4.22 below.
40
keroseneLPGIDOGasolineFOBioetanolBiodieselADO
Others Energy Consumption by FuelScenario: KED
Years20052006 2008 2010 2012 2014 2016 2018 2020 2022 2024
Mill
ion
Barr
el o
f O
il Eq
uiva
lent
s
10
10
9
9
8
8
7
7
6
6
5
5
4
4
3
3
2
2
1
1
0
keroseneLPGIDOGasolineFOBioetanolBiodieselADO
Others Energy Consumption by FuelScenario: KEN
Years20052006 2008 2010 2012 2014 2016 2018 2020 2022 2024
Mill
ion
Barr
el o
f O
il Eq
uiva
lent
s
9
9
8
8
7
7
6
6
5
5
4
4
3
3
2
2
1
1
0
Figure 4.22 Comparison between KED scenario and KED per energy type of other sectors up to 2025
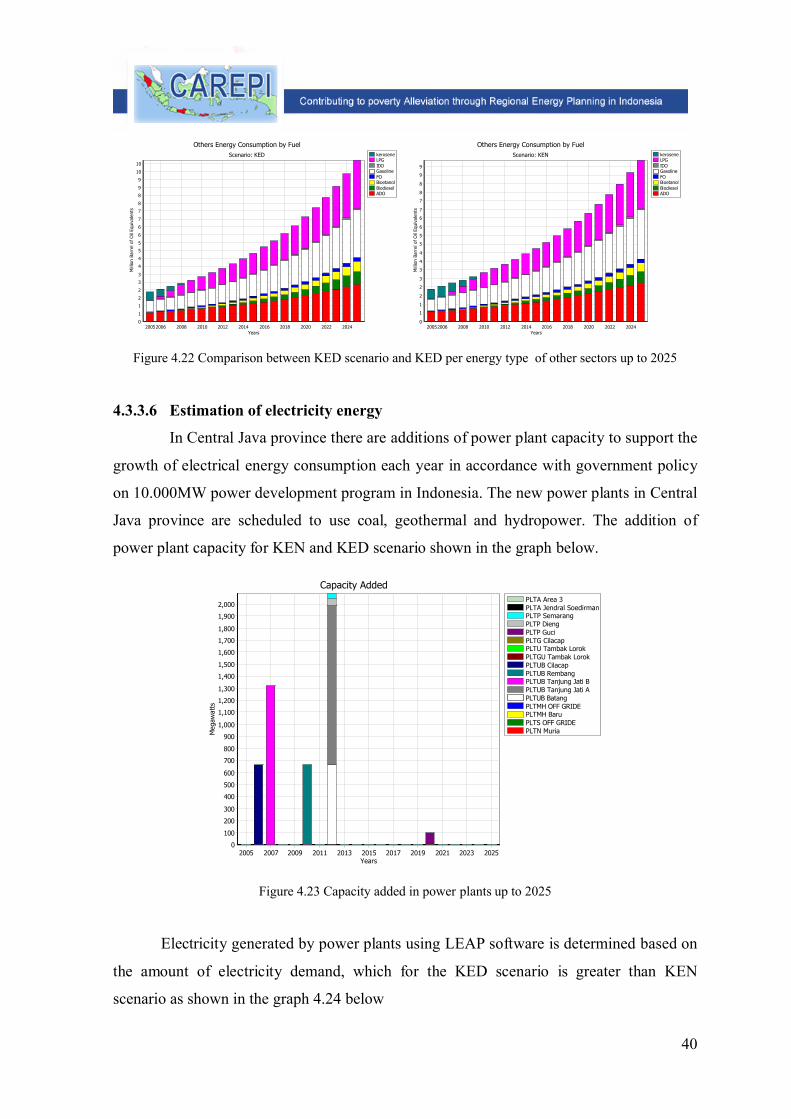
4.3.3.6 Estimation of electricity energy
In Central Java province there are additions of power plant capacity to support the
growth of electrical energy consumption each year in accordance with government policy
on 10.000MW power development program in Indonesia. The new power plants in Central
Java province are scheduled to use coal, geothermal and hydropower. The addition of
power plant capacity for KEN and KED scenario shown in the graph below.
PLTA Area 3PLTA Jendral SoedirmanPLTP SemarangPLTP DiengPLTP GuciPLTG CilacapPLTU Tambak LorokPLTGU Tambak LorokPLTUB CilacapPLTUB RembangPLTUB Tanjung Jati BPLTUB Tanjung Jati APLTUB BatangPLTMH OFF GRIDEPLTMH BaruPLTS OFF GRIDEPLTN Muria
Capacity Added
Years2005 2007 2009 2011 2013 2015 2017 2019 2021 2023 2025
Meg
awat
ts
2,000
1,900
1,800
1,700
1,600
1,500
1,400
1,300
1,200
1,100
1,000
900
800
700
600
500
400
300
200
100
0
Figure 4.23 Capacity added in power plants up to 2025
Electricity generated by power plants using LEAP software is determined based on
the amount of electricity demand, which for the KED scenario is greater than KEN
scenario as shown in the graph 4.24 below
41
PLTA Area 3PLTA Jendral SoedirmanPLTP SemarangPLTP DiengPLTP GuciPLTG CilacapPLTU Tambak LorokPLTGU Tambak LorokPLTUB CilacapPLTUB RembangPLTUB Tanjung Jati BPLTUB Tanjung Jati APLTUB BatangPLTMH OFF GRIDEPLTMH BaruPLTS OFF GRIDEPLTN Muria
2005 2007 2009 2011 2013 2015 2017 2019 2021 2023 2025
27.00026.00025.00024.00023.00022.00021.000
20.00019.00018.00017.00016.00015.00014.00013.00012.00011.00010.0009.0008.0007.0006.000
5.0004.0003.0002.0001.000
0
PLTA Area 3PLTA Jendral SoedirmanPLTP SemarangPLTP DiengPLTP GuciPLTG CilacapPLTU Tambak LorokPLTGU Tambak LorokPLTUB CilacapPLTUB RembangPLTUB Tanjung Jati BPLTUB Tanjung Jati APLTUB BatangPLTMH OFF GRIDEPLTMH BaruPLTS OFF GRIDEPLTN Muria
2005 2007 2009 2011 2013 2015 2017 2019 2021 2023 2025
27.00026.00025.00024.00023.00022.00021.00020.000
19.00018.000
17.00016.00015.000
14.00013.00012.00011.00010.0009.0008.0007.0006.0005.0004.0003.000
2.0001.000
0
Electricity GenerationScenario : KEN
Thou
sand
Bar
rels
of
Oil
Equi
vale
nts
Years
Electricity GenerationScenario : KED
Thou
sand
Bar
rels
of
Oil
Equi
vale
nts
Years
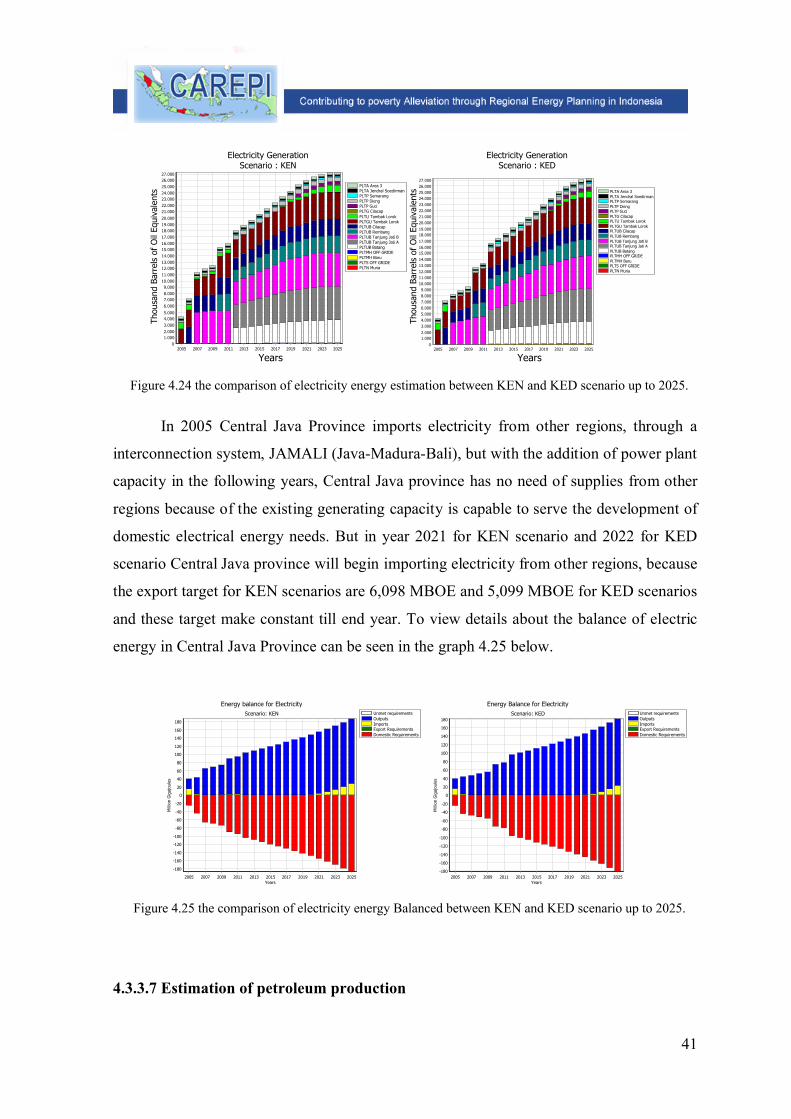
Figure 4.24 the comparison of electricity energy estimation between KEN and KED scenario up to 2025.
In 2005 Central Java Province imports electricity from other regions, through a
interconnection system, JAMALI (Java-Madura-Bali), but with the addition of power plant
capacity in the following years, Central Java province has no need of supplies from other
regions because of the existing generating capacity is capable to serve the development of
domestic electrical energy needs. But in year 2021 for KEN scenario and 2022 for KED
scenario Central Java province will begin importing electricity from other regions, because
the export target for KEN scenarios are 6,098 MBOE and 5,099 MBOE for KED scenarios
and these target make constant till end year. To view details about the balance of electric
energy in Central Java Province can be seen in the graph 4.25 below.
Unmet requirementsOutputsImportsExport RequirementsDomestic Requirements
Energy balance for ElectricityScenario: KEN
Years2005 2007 2009 2011 2013 2015 2017 2019 2021 2023 2025
Mill
ion
Gig
ajou
les
180
160
140
120
100
80
60
40
20
0
-20
-40
-60
-80
-100
-120
-140
-160
-180
Unmet requirementsOutputsImportsExport RequirementsDomestic Requirements
Energy Balance for ElectricityScenario: KED
Years2005 2007 2009 2011 2013 2015 2017 2019 2021 2023 2025
Mill
ion
Gig
ajou
les
180
160
140
120
100
80
60
40
20
0
-20
-40
-60
-80
-100
-120
-140
-160
-180
Figure 4.25 the comparison of electricity energy Balanced between KEN and KED scenario up to 2025.
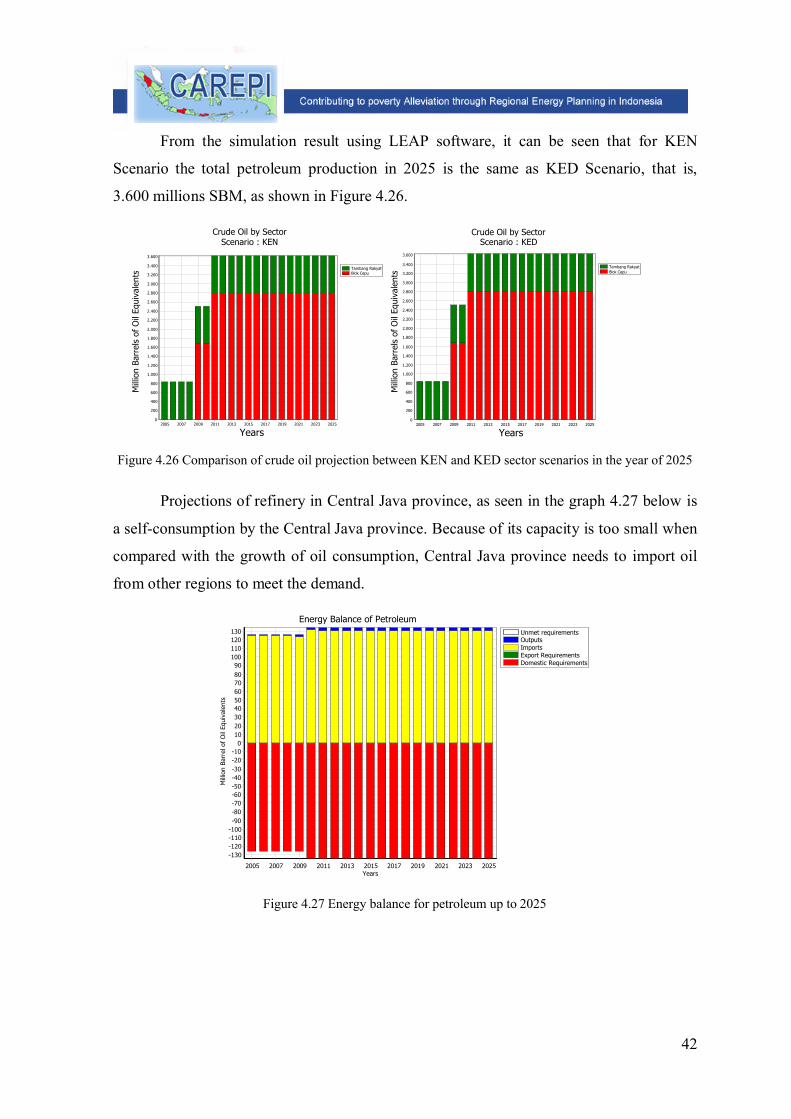
4.3.3.7 Estimation of petroleum production
42
From the simulation result using LEAP software, it can be seen that for KEN
Scenario the total petroleum production in 2025 is the same as KED Scenario, that is,
3.600 millions SBM, as shown in Figure 4.26.
Tambang RakyatBlok Cepu
2005 2007 2009 2011 2013 2015 2017 2019 2021 2023 2025
3.600
3.400
3.200
3.000
2.800
2.600
2.400
2.200
2.000
1.800
1.600
1.400
1.200
1.000
800
600
400
200
0
Tambang RakyatBlok Cepu
2005 2007 2009 2011 2013 2015 2017 2019 2021 2023 2025
3.600
3.400
3.200
3.000
2.800
2.600
2.400
2.200
2.000
1.800
1.600
1.400
1.200
1.000
800
600
400
200
0
Crude Oil by SectorScenario : KEN
Mill
ion
Barr
els
of O
il Eq
uiva
lent
s
Years
Crude Oil by SectorScenario : KED
Mill
ion
Barr
els
of O
il Eq
uiva
lent
s
Years
Figure 4.26 Comparison of crude oil projection between KEN and KED sector scenarios in the year of 2025
Projections of refinery in Central Java province, as seen in the graph 4.27 below is
a self-consumption by the Central Java province. Because of its capacity is too small when
compared with the growth of oil consumption, Central Java province needs to import oil
from other regions to meet the demand.
Unmet requirementsOutputsImportsExport RequirementsDomestic Requirements
Energy Balance of Petroleum
Years2005 2007 2009 2011 2013 2015 2017 2019 2021 2023 2025
Mill
ion
Barr
el o
f O
il Eq
uiva
lent
s
1301201101009080706050403020100
-10-20-30-40-50-60-70-80-90
-100-110-120-130
Figure 4.27 Energy balance for petroleum up to 2025
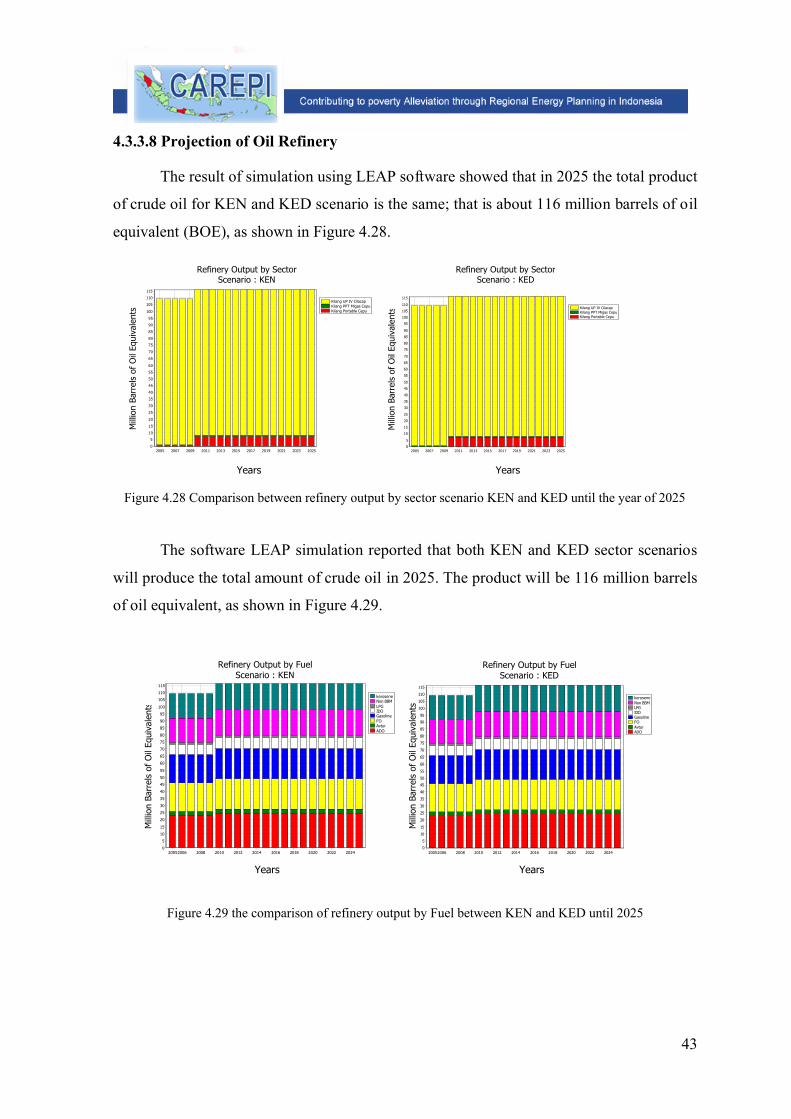
43
4.3.3.8 Projection of Oil Refinery
The result of simulation using LEAP software showed that in 2025 the total product
of crude oil for KEN and KED scenario is the same; that is about 116 million barrels of oil
equivalent (BOE), as shown in Figure 4.28.
Kilang UP IV CilacapKilang PPT Migas CepuKilang Portable Cepu
2005 2007 2009 2011 2013 2015 2017 2019 2021 2023 2025
115
110
105
100
95
90
85
80
75
70
65
60
55
50
45
40
35
30
25
20
15
10
5
0
Kilang UP IV CilacapKilang PPT Migas CepuKilang Portable Cepu
2005 2007 2009 2011 2013 2015 2017 2019 2021 2023 2025
115
110
105
100
95
90
85
80
75
70
65
60
55
50
45
40
35
30
25
20
15
10
5
0
Refinery Output by SectorScenario : KEN
Mill
ion
Barr
els
of O
il Eq
uiva
lent
s
Years
Refinery Output by SectorScenario : KED
Mill
ion
Barr
els
of O
il Eq
uiva
lent
s
Years
Figure 4.28 Comparison between refinery output by sector scenario KEN and KED until the year of 2025
The software LEAP simulation reported that both KEN and KED sector scenarios
will produce the total amount of crude oil in 2025. The product will be 116 million barrels
of oil equivalent, as shown in Figure 4.29.
keroseneNon BBMLPGIDOGasolineFOAvturADO
20052006 2008 2010 2012 2014 2016 2018 2020 2022 2024
115
110
105
100
95
90
85
80
75
70
65
60
55
50
45
40
35
30
25
20
15
10
5
0
keroseneNon BBMLPGIDOGasolineFOAvturADO
20052006 2008 2010 2012 2014 2016 2018 2020 2022 2024
115
110
105
100
95
90
85
80
75
70
65
60
55
50
45
40
35
30
25
20
15
10
5
0
Refinery Output by FuelScenario : KEN
Mill
ion
Barr
els
of O
il Eq
uiva
lent
s
Years
Refinery Output by FuelScenario : KED
Mill
ion
Barr
els
of O
il Eq
uiva
lent
s
Years
Figure 4.29 the comparison of refinery output by Fuel between KEN and KED until 2025
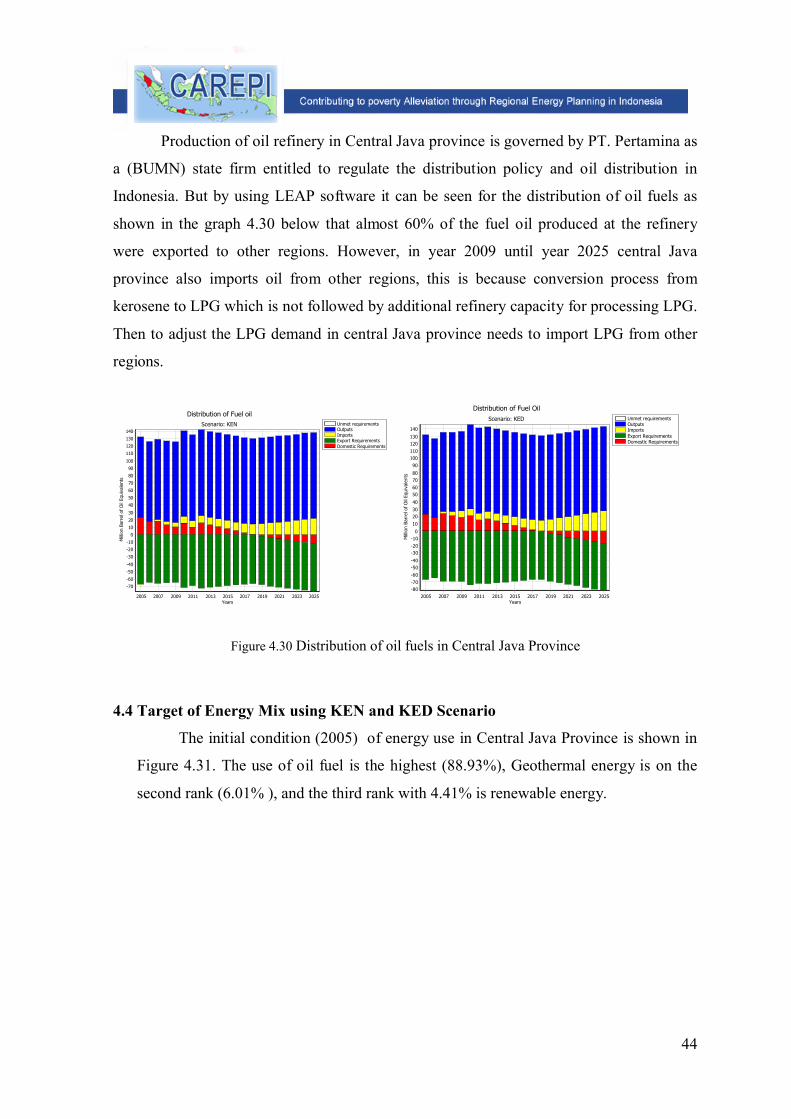
44
Production of oil refinery in Central Java province is governed by PT. Pertamina as
a (BUMN) state firm entitled to regulate the distribution policy and oil distribution in
Indonesia. But by using LEAP software it can be seen for the distribution of oil fuels as
shown in the graph 4.30 below that almost 60% of the fuel oil produced at the refinery
were exported to other regions. However, in year 2009 until year 2025 central Java
province also imports oil from other regions, this is because conversion process from
kerosene to LPG which is not followed by additional refinery capacity for processing LPG.
Then to adjust the LPG demand in central Java province needs to import LPG from other
regions.
Unmet requirementsOutputsImportsExport RequirementsDomestic Requirements
Distribution of Fuel oilScenario: KEN
Years2005 2007 2009 2011 2013 2015 2017 2019 2021 2023 2025
Mill
ion
Barr
el o
f O
il Eq
uiva
lent
s
140
130
120
110
100
90
80
70
60
50
40
30
20
10
0
-10
-20
-30
-40
-50
-60
-70
Unmet requirementsOutputsImportsExport RequirementsDomestic Requirements
Distribution of Fuel OilScenario: KED
Years2005 2007 2009 2011 2013 2015 2017 2019 2021 2023 2025
Mill
ion
Barr
el o
f O
il Eq
uiva
lent
s
140
13012011010090
80706050
40302010
0-10-20-30
-40-50-60-70-80
Figure 4.30 Distribution of oil fuels in Central Java Province
4.4 Target of Energy Mix using KEN and KED Scenario
The initial condition (2005) of energy use in Central Java Province is shown in
Figure 4.31. The use of oil fuel is the highest (88.93%), Geothermal energy is on the
second rank (6.01% ), and the third rank with 4.41% is renewable energy.
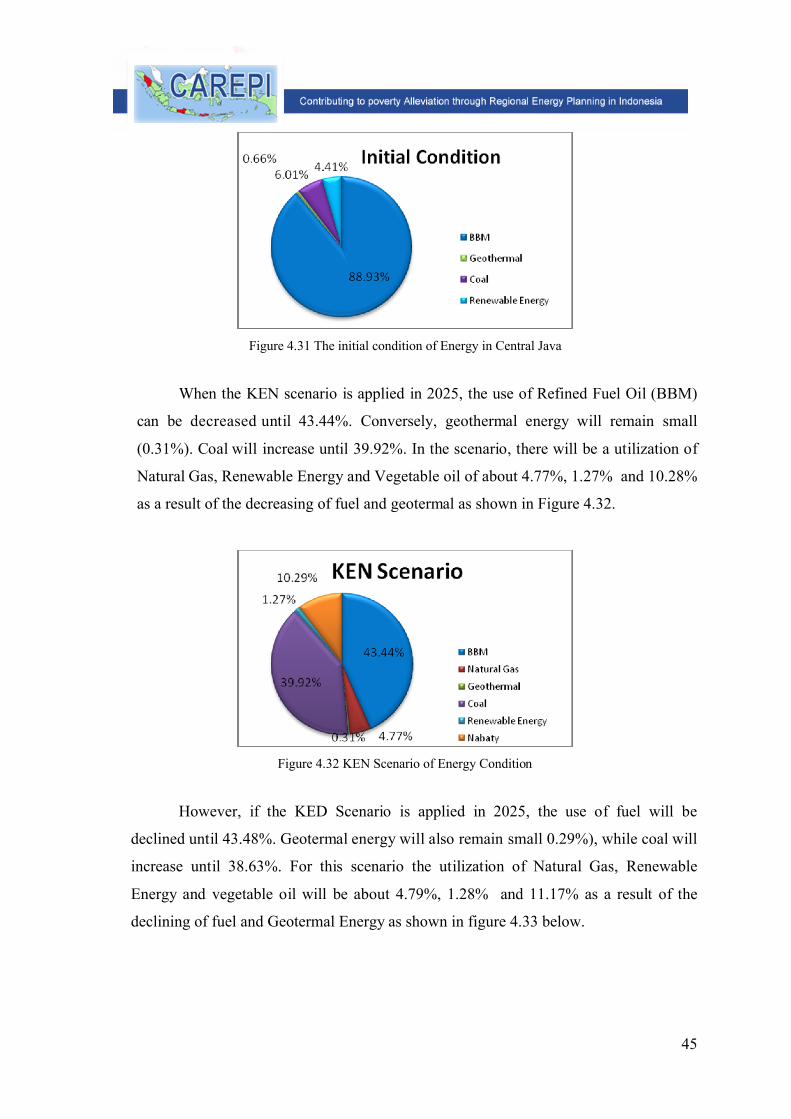
45
Figure 4.31 The initial condition of Energy in Central Java
When the KEN scenario is applied in 2025, the use of Refined Fuel Oil (BBM)
can be decreased until 43.44%. Conversely, geothermal energy will remain small
(0.31%). Coal will increase until 39.92%. In the scenario, there will be a utilization of
Natural Gas, Renewable Energy and Vegetable oil of about 4.77%, 1.27% and 10.28%
as a result of the decreasing of fuel and geotermal as shown in Figure 4.32.
Figure 4.32 KEN Scenario of Energy Condition
However, if the KED Scenario is applied in 2025, the use of fuel will be
declined until 43.48%. Geotermal energy will also remain small 0.29%), while coal will
increase until 38.63%. For this scenario the utilization of Natural Gas, Renewable
Energy and vegetable oil will be about 4.79%, 1.28% and 11.17% as a result of the
declining of fuel and Geotermal Energy as shown in figure 4.33 below.
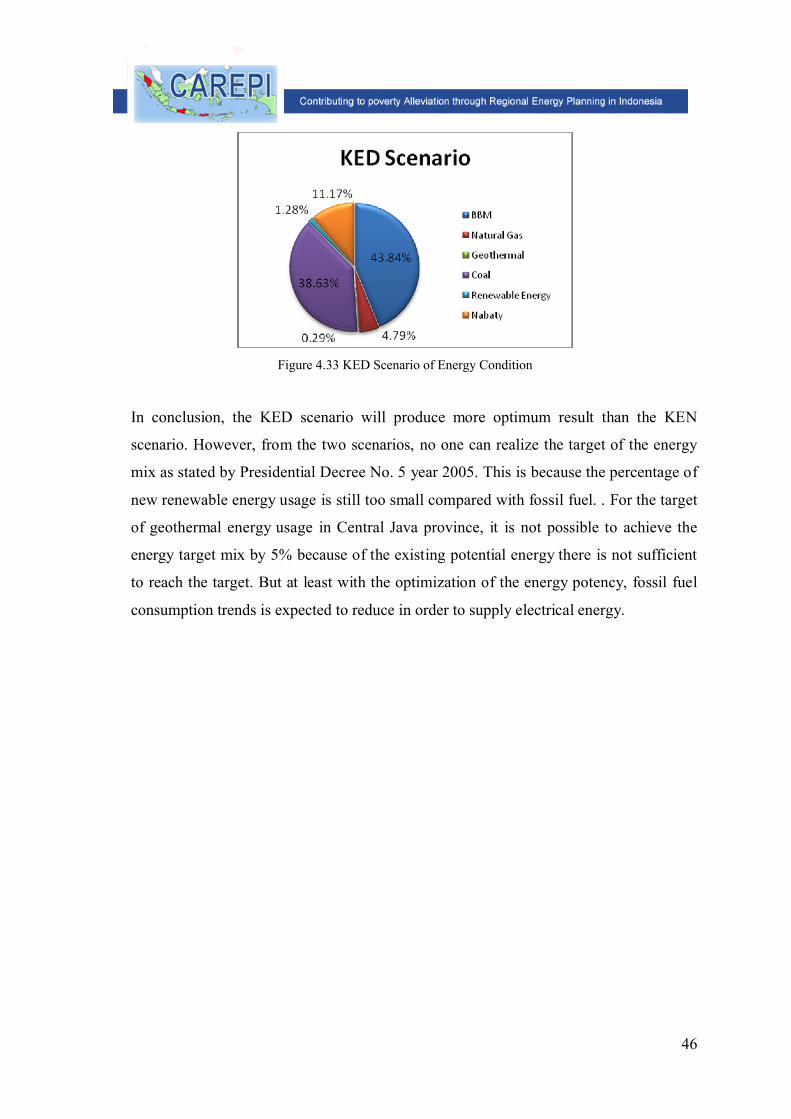
46
Figure 4.33 KED Scenario of Energy Condition
In conclusion, the KED scenario will produce more optimum result than the KEN
scenario. However, from the two scenarios, no one can realize the target of the energy
mix as stated by Presidential Decree No. 5 year 2005. This is because the percentage of
new renewable energy usage is still too small compared with fossil fuel. . For the target
of geothermal energy usage in Central Java province, it is not possible to achieve the
energy target mix by 5% because of the existing potential energy there is not sufficient
to reach the target. But at least with the optimization of the energy potency, fossil fuel
consumption trends is expected to reduce in order to supply electrical energy.
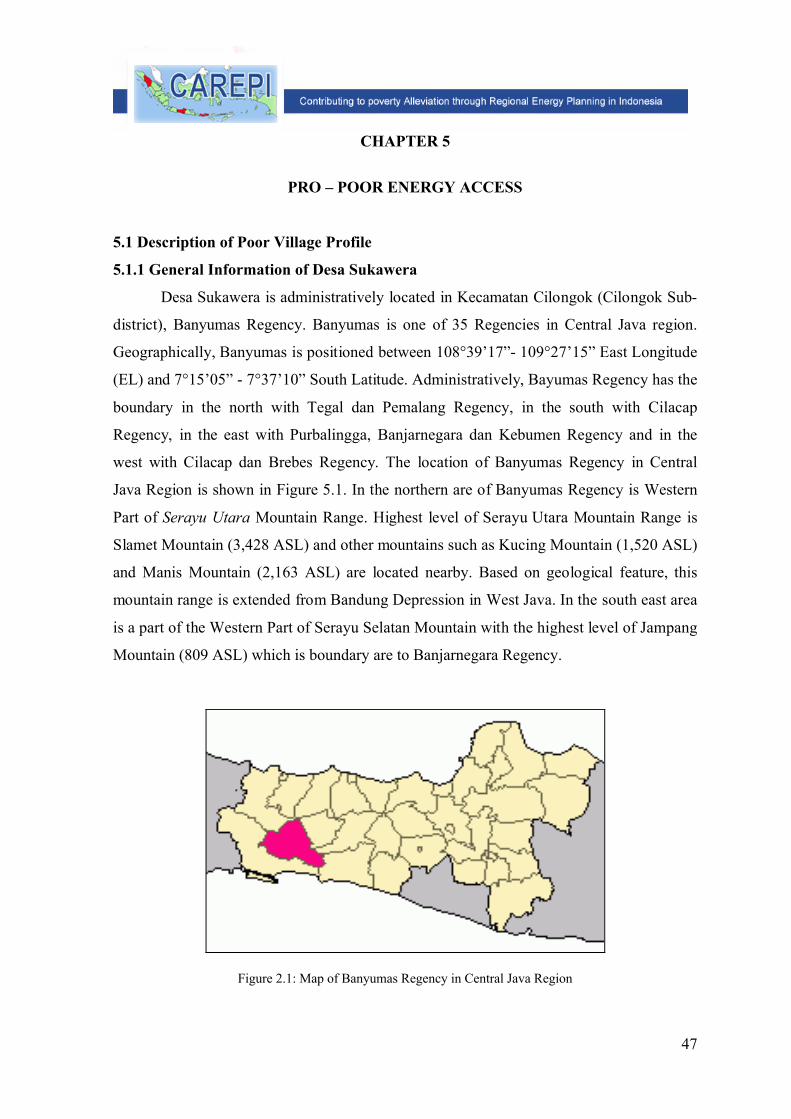
47
CHAPTER 5
PRO – POOR ENERGY ACCESS
5.1 Description of Poor Village Profile
5.1.1 General Information of Desa Sukawera
Desa Sukawera is administratively located in Kecamatan Cilongok (Cilongok Sub-
district), Banyumas Regency. Banyumas is one of 35 Regencies in Central Java region.
Geographically, Banyumas is positioned between 108°39’17”- 109°27’15” East Longitude
(EL) and 7°15’05” - 7°37’10” South Latitude. Administratively, Bayumas Regency has the
boundary in the north with Tegal dan Pemalang Regency, in the south with Cilacap
Regency, in the east with Purbalingga, Banjarnegara dan Kebumen Regency and in the
west with Cilacap dan Brebes Regency. The location of Banyumas Regency in Central
Java Region is shown in Figure 5.1. In the northern are of Banyumas Regency is Western
Part of Serayu Utara Mountain Range. Highest level of Serayu Utara Mountain Range is
Slamet Mountain (3,428 ASL) and other mountains such as Kucing Mountain (1,520 ASL)
and Manis Mountain (2,163 ASL) are located nearby. Based on geological feature, this
mountain range is extended from Bandung Depression in West Java. In the south east area
is a part of the Western Part of Serayu Selatan Mountain with the highest level of Jampang
Mountain (809 ASL) which is boundary are to Banjarnegara Regency.
Figure 2.1: Map of Banyumas Regency in Central Java Region
48
Based on geographical feature, Sokawera is situated at 600 to 800 m ASL with the
large parts of the area is hilly topography condition. Most area in Desa Sokawera is used
for plantation which includes natural forests and rice/paddy farming (lahan sawah). The
access road to the villages is unpaved-roads which are only suitable for motorbike and
bicycle. The average annual rainfall (1996 to 2006) which was taken from Logawa and
Cikidang Cilongok rainfall stations is about 2,500 mm. The rain session usually occurs
from November to April with the highest rainfall rate is about 3,071 mm. Based on the
high rainfall rate; the risk of natural disasters in Sokawera is local flood and landslide. The
dry session is from May to October with the peak month of dry is on August and
September. In dry session, some rice farming in Sokawera with rainfall irrigation system
will be faced on water crises. Sokawera village is also located in drainage basin (Daerah
Aliran Sungai, DAS) of Mengaji (Mengaji River). This river is a main source for semi-
technical irrigation and for household activities. Most of Mengaji River drainage basin is
still natural forest and has high capacity storage to receive the water from rainfall. Covered
area of Mengaji River is about 6,000 Ha.
Generally, the real social and economic condition in Sokawera community can be
described from the demography, social and economic activities of the community itself.
The population of Sokawera Village in 2007 is 7,101 people which are distributed in 1,775
households. About 1,420 households (80 %) are working on home industry of coconut
sugar with small sugar production capacity of about 5 kg/day and small farming. Another
economic activity that is usually carried out by Sokawera community is farming worker
(buruh tani) and collecting firewood for cooking which are taken from forests. They also
have additional income from the livestock trade such as cows, goat, chicken, etc., however,
it cannot be calculated as monthly income. The average income per household based on
these economic activities is in the range of Rp. (IDR) 8,000 to 17,000 per day. Sukawera
community is also common with informal economic activity of interhousehold barter and
sharing. It includes everything from household production and consumption of goods and
services. This economic system is household survival strategies in community to save their
money. According to the gender, the proportion of male and female is 51 % (3,622 person)
and 49 % (3,480 person) respectively. The population growth of Kecamatan Sokawera in
49
2007 is 0.20 %. The population growth of Desa Sokawera is relatively low due to the
urbanization movement has been occurred.
Economic performance of Desa Sokawera can be summarized from their GDP
(gross domestic products) of Kecamatan Cilongok. The agriculture sector was the
backbone of the local economy, contributing 43.53 % to the total GDP in 2006. The trade
sector contributed 15.84 %, which was followed by the service and industrial sector with
the contribution of 13.08 % and 8.43 % respectively. The high agricultural sector
contributed in the GDP originates from the five sub-sectors of food crops, plantation,
animal husbandry and its products, and forestry. Although the GDP increases from 2002 to
2006 which indicates that positive economic growth in Kecamatan Cilongok (with range of
annual GDP growth is about 8.13 to 15.32 %), Sokawera village is still categorized as
”kawasan tertinggal dan tumbuh lambat” (poor and low economic growth area) in
Banyumas Regency. This village is the isolated area and has relative static growth of social
and economic activities compared to other villages in Kecamatan Cilongok which have the
better access in trade and economic. The village is also categorized as a traditional village
due to the average educational level of community is still low; the production only meets
to the daily household needs and the limited communication with other villages.
5.1.2 Energy Profile of Desa Sokawera
The energy situation and potential of Desa Sokawera presented in this section is a
result of focus group discussion (FGD) and semi-structured interview from PRA analysis
(discussed in previous chapter). Table 5.1 presents the type of energy which is used in
community. Cooking and lighting are the principal energy services needed in the households
activities and constitutes approximately 80% of the total energy consumption in households.
Firewood is still dominated as the principal energy source for cooking which is prevalent to a
greater or lesser extent in almost all households (is about 80 % of total households in Desa
Sokawera), irrespective of their income level. Other related issue and phenomena from this
situation is that the government conversion program of kerosene to LPG for cooking has not
been effectively implemented in Desa Sokawera.
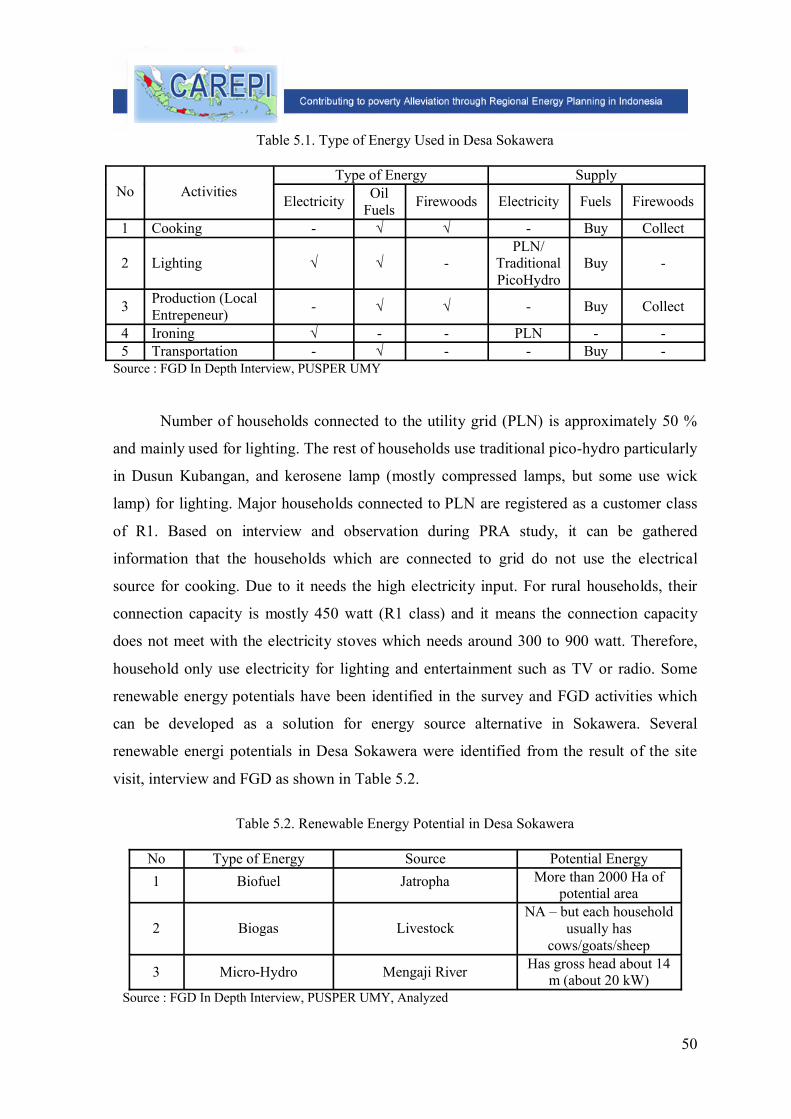
50
Table 5.1. Type of Energy Used in Desa Sokawera
Type of Energy SupplyNo Activities
Electricity Oil Fuels Firewoods Electricity Fuels Firewoods
1 Cooking - √ √ - Buy Collect
2 Lighting √ √ -PLN/
Traditional PicoHydro
Buy -
3 Production (Local Entrepeneur) - √ √ - Buy Collect
4 Ironing √ - - PLN - -5 Transportation - √ - - Buy -
Source : FGD In Depth Interview, PUSPER UMY
Number of households connected to the utility grid (PLN) is approximately 50 %
and mainly used for lighting. The rest of households use traditional pico-hydro particularly
in Dusun Kubangan, and kerosene lamp (mostly compressed lamps, but some use wick
lamp) for lighting. Major households connected to PLN are registered as a customer class
of R1. Based on interview and observation during PRA study, it can be gathered
information that the households which are connected to grid do not use the electrical
source for cooking. Due to it needs the high electricity input. For rural households, their
connection capacity is mostly 450 watt (R1 class) and it means the connection capacity
does not meet with the electricity stoves which needs around 300 to 900 watt. Therefore,
household only use electricity for lighting and entertainment such as TV or radio. Some
renewable energy potentials have been identified in the survey and FGD activities which
can be developed as a solution for energy source alternative in Sokawera. Several
renewable energi potentials in Desa Sokawera were identified from the result of the site
visit, interview and FGD as shown in Table 5.2.
Table 5.2. Renewable Energy Potential in Desa Sokawera
No Type of Energy Source Potential Energy1 Biofuel Jatropha More than 2000 Ha of
potential area
2 Biogas LivestockNA – but each household
usually has cows/goats/sheep
3 Micro-Hydro Mengaji River Has gross head about 14 m (about 20 kW)
Source : FGD In Depth Interview, PUSPER UMY, Analyzed
51
Renewable energy source of biofuel from Jatropha plantation is one of potential
plants in Desa Sokawera. Referring to area of the not-farming land is more than 2,000 Ha;
those lands can be cultivated with Jathropa for biofuel production. Due to the limited
knowledge regarding to Jathropa plantation, the building capacity on Jathropha cultivation
and corp method to the community is needed. Livestock production concentrates on cattle
cows, buffaloes, goats and sheep. Cows and buffaloes are used to work the fields, but
rarely marketed. With the amount of cows in Sokawera is significant because almost each
household has livestock, the biogas energy is promised energy with large potential source
which can be used.
5.2 Design of Proposed Energy Infrastucture
Based on the available energy potentials and the needs assessment from the PRA
results, several energy service programmes were proposed. These potential energy
programmes were also planned and designed in relationship with important issues of (1)
the sustainability of the programmes through cultural and social approach, (2) the
optimization of the available renewable energy sources, and (3) the improvement of the
better quality life through the energy programme. The potential proposed energy
programmes in Desa Sokawera are described as follows:
1. Biogas Energy Package (BGEP) for cooking purposes. This program was proposed due
to this energy service is high portion of energy used in Sokawera community. The
packet consists of four sub-programs which are:
a. Development a pilot installation for complete biogas energy infrastructure which is
efficient and low-cost construction based on the capacity of 2-4 cows for household
level.
b. Community assistance in terms of cultural approach for transferring the knowledge
and implementing the biogas energy program. The program is also followed by the
extension for the cow husbandry.
c. Assistance on the potential cooperation (koperasi), local entrepreneur or local
financial unit which is potential and interest in this program.
d. Assistance on fertilizer process from the biogas residue. The fertilizer can be used
by former group for farming or can be sold as the additional income for household.
52
2. Biodiesel Energy Package (BDEP) for household. The packet consists of three sub-
programs which are:
a. Development a pilot installation of complete simple-biodiesel process for oil
production in order to be used in kerosene stove or modified kerosene stove.
b. Community assistance in terms of cultural approach for transferring the knowledge
and implementing the Jathropa cultivation.
c. Assistance on the potential cooperation (koperasi), local entrepreneur or local
financial unit which is potential and interest in this program.
3. Micro-Hydro Power Plan (MHPP). The packet is to develop an installation of MHPP
for electricity in Dusun Kubangan (one of dusun which does not access to PLN grid).
Many studies show that the key constraint to energy supply by the renewable
energy for rural community is access to the initial capital needed to purchase the
equipment or to build the infrastructures to harness the resource. This leads rural
communities to choose energy options that are cheap on a day-to-day basis, but which
offer a poor quality of energy supply and are expensive over the longer term. In addition,
the current economical condition in community of Desa Sokawera, particularly for poor
household show that they cannot finance the proposed energy programme (i.e. Biogas for
Cooking) based on their income. Thus, financial way by other institutions/sources is need
in order to implement the proposed programme to the community. Several alternative
formal sources for financing the proposed programme are Banking, Micro Finance
Institution, Usaha Kecil dan Menengah (UKM). There are three reasons to involve the
UKM in this scheme. First, the performance of UKM shows the good achievement in order
to produce the economic activities in the rural community. Second, UKM involves the
investment and technology development for increasing its productivity. Third, UKM has
flexibility in the economic activities compared to the larger units. In addition, UKM in
Indonesia plays the important role for reserving the local worker, increasing the economic
units and supporting the household income. Other informal organization which has a
potential unit for financing the programme is Koperasi (Cooperation). The cooperation can
perform sustainable programme due to the cooperation is familiar unit in the community
and local farmers for financing their needs in household and farming sector. However, the
53
assistantship of both units (UKM and Cooperation) by university is still needed in order to
plan the appropriate financing scheme for proposed energy programme in Sokawera.
The regional energy office also plays an important role in this financial scheme.
The office can propose the regional budget for financing the subsidies or pilot programme
in Kecamatan Sokawera. The regional office is also able to propose the budget for building
capacity in the community for assistantship, mentoring and developing the proposed
programme. Several alternative scheme are described below that can be chosen which
scheme is appropriate for implementing in Desa Sokawera. These schemes involve all
financial stakeholders, i.e. Banking, Micro Finance Institution, Usaha Kecil dan Menengah
(UKM), Cooperation and Regional Energy Office as well.
1) Subsidies Scheme
Subsidies are granted either to service, commodities or activities that are viewed by
governments as crucial to the livelihood of low income people or to maintain economic
sectors viewed as strategic, i.e. agricultures, energy, etc. Subsidies occur when the budget
do not cover the cost of production on energy. Subsidies can be either direct such as
payments that reduce the cost of energy infrastructures to an investment, or indirect such as
changes the prices, taxes and the provision of recurrent inputs such as training or the
prevision of infrastructure. Much of logic of the subsidy rests on the assumption that there
will be a supply response. Many forms of subsidy are known to have side-effect that are
harmful to more self-sustaining development in the longer time or do not reach the
intended beneficiaries. In addition, the capability of regional government budget to subsidy
the programme is limited. Therefore, the programme cannot be running well if this
financial scheme will be implemented totally.
2) Credit Scheme
Credit is a financial intermediation between economic agents with credit and those
with deficit. For various reasons (confidence, pooling the resource of several small leaders,
skills, etc) an intermediate, generally a financial institution, is necessary to implement the
financial link between the incomes, i.e. when the crops are sold and the expenses, various
forms of the credit were develop to support both poor and wealthy farmer. However, the
54
types of credit widely used in the agricultural sector (in example) are not suitable for
funding the rural energy scheme for poor communities, particularly when the pay-back
period is spread over a medium term period. The costs of recovering small loans in isolated
areas are usually fairly high. Most of the banks do not have experience to deal with the
rural credit in energy sector, i.e. for small or micro scheme. Because of the risk, banks are
inclined to impose guarantees that poor rural communities have difficulty meeting. Loans
are a relatively new concept in financing the energy supply for rural communities in
Indonesia. Therefore, in this scheme, they (credits/loans) can be implemented by
cooperation or UKM which provide the quarantines requested by the Bank or Financial
Institutions.
The credit scheme is more appropriate for local entrepreneurs, i.e. food industry of
“tahu and tempe” and rice milling industry which are available in Kecamatan Sokawera.
These local industries can provide the guarantee for financial institutions which is needed
for credits and loans scheme. The credits and loans can finance the proposed biogas and
biomass package programme for local entrepreneurs. However, the low interest of credits
and loans must be considered for this proposed programme.
3) Combination of Various Funding Resources
The last proposed scheme is a combination of various funding resources which
involves a range of types of funding such as grants, subsidies, loans and contributions in
kind. This kind of scheme is a lesson learned from the implementation of energy financial
programme which was successfully employed in Nepal by USAID and Intermediate
Technology. The combination financial scheme is an appropriate scheme for financing the
development of (1) the biogas installation for households, (2) the Jatropha oil for
household, in Desa Sokawera.
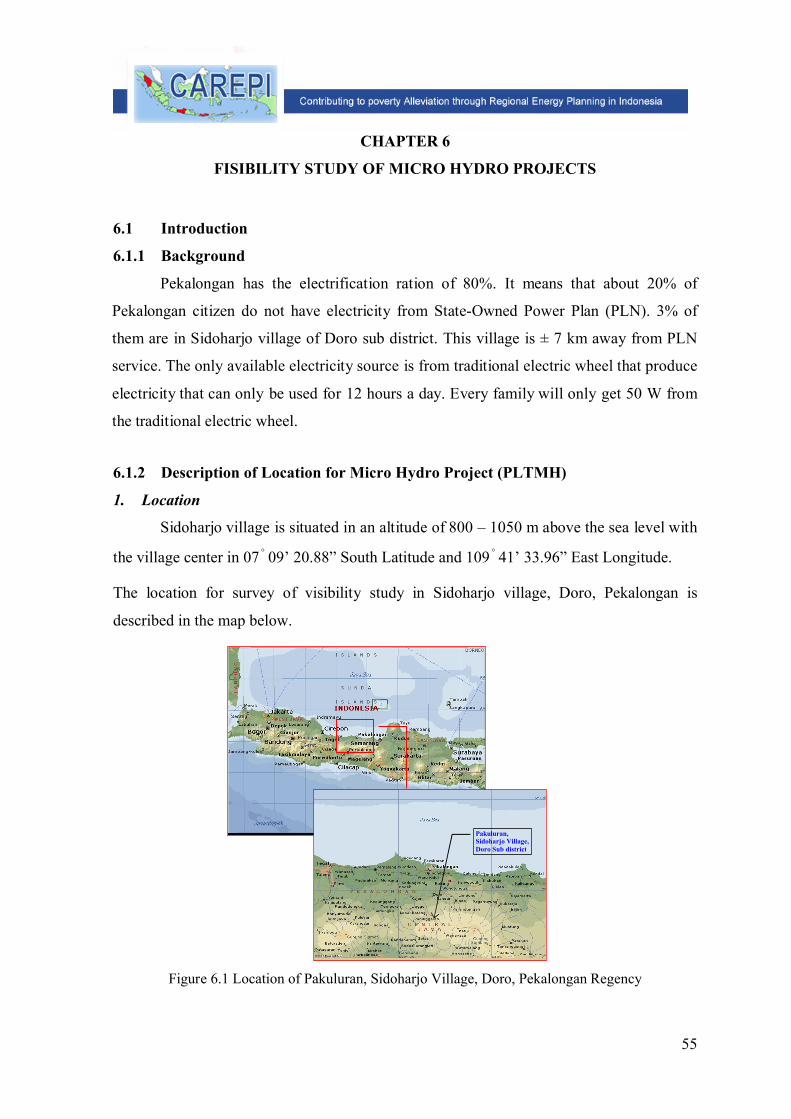
55
CHAPTER 6
FISIBILITY STUDY OF MICRO HYDRO PROJECTS
6.1 Introduction
6.1.1 Background
Pekalongan has the electrification ration of 80%. It means that about 20% of
Pekalongan citizen do not have electricity from State-Owned Power Plan (PLN). 3% of
them are in Sidoharjo village of Doro sub district. This village is ± 7 km away from PLN
service. The only available electricity source is from traditional electric wheel that produce
electricity that can only be used for 12 hours a day. Every family will only get 50 W from
the traditional electric wheel.
6.1.2 Description of Location for Micro Hydro Project (PLTMH)
1. Location
Sidoharjo village is situated in an altitude of 800 – 1050 m above the sea level with
the village center in 07 09’ 20.88” South Latitude and 109 41’ 33.96” East Longitude.
The location for survey of visibility study in Sidoharjo village, Doro, Pekalongan is
described in the map below.
Pakuluran, Sidoharjo Village, Doro Sub district
Figure 6.1 Location of Pakuluran, Sidoharjo Village, Doro, Pekalongan Regency
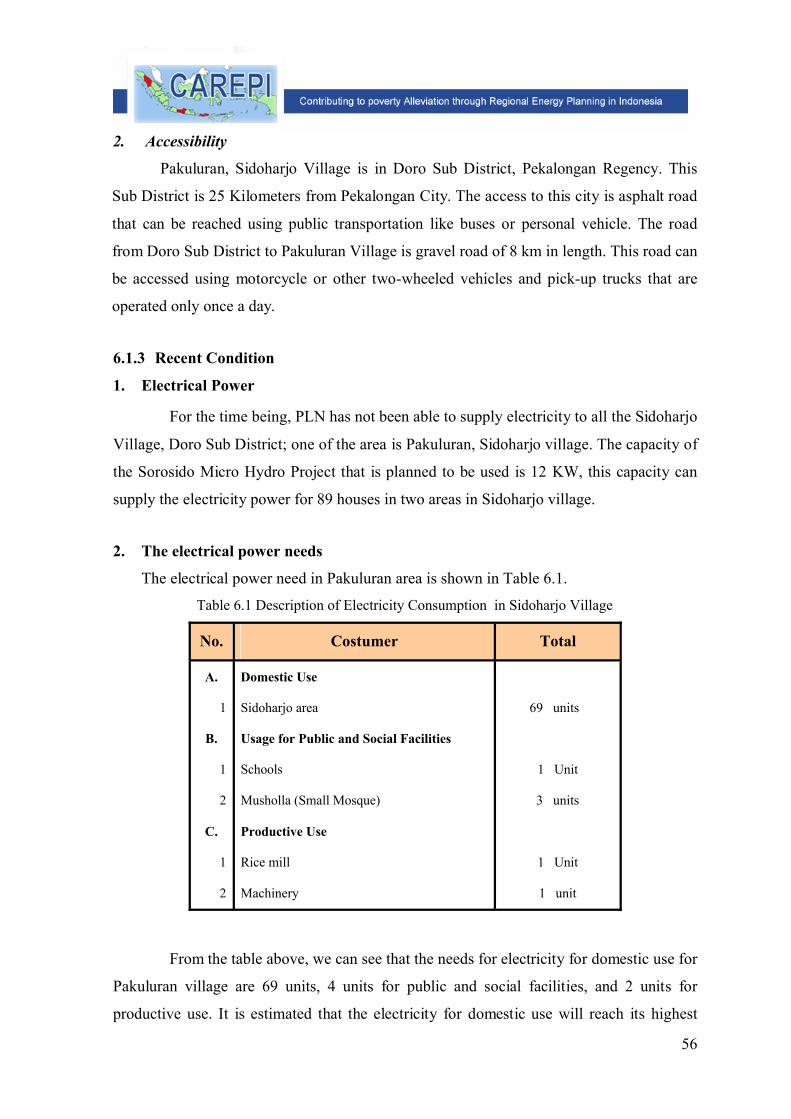
56
2. Accessibility
Pakuluran, Sidoharjo Village is in Doro Sub District, Pekalongan Regency. This
Sub District is 25 Kilometers from Pekalongan City. The access to this city is asphalt road
that can be reached using public transportation like buses or personal vehicle. The road
from Doro Sub District to Pakuluran Village is gravel road of 8 km in length. This road can
be accessed using motorcycle or other two-wheeled vehicles and pick-up trucks that are
operated only once a day.
6.1.3 Recent Condition
1. Electrical Power
For the time being, PLN has not been able to supply electricity to all the Sidoharjo
Village, Doro Sub District; one of the area is Pakuluran, Sidoharjo village. The capacity of
the Sorosido Micro Hydro Project that is planned to be used is 12 KW, this capacity can
supply the electricity power for 89 houses in two areas in Sidoharjo village.
2. The electrical power needs
The electrical power need in Pakuluran area is shown in Table 6.1.
Table 6.1 Description of Electricity Consumption in Sidoharjo Village
No. Costumer Total
A.
1
B.
1
2
C.
1
2
Domestic Use
Sidoharjo area
Usage for Public and Social Facilities
Schools
Musholla (Small Mosque)
Productive Use
Rice mill
Machinery
69 units
1 Unit
3 units
1 Unit
1 unit
From the table above, we can see that the needs for electricity for domestic use for
Pakuluran village are 69 units, 4 units for public and social facilities, and 2 units for
productive use. It is estimated that the electricity for domestic use will reach its highest
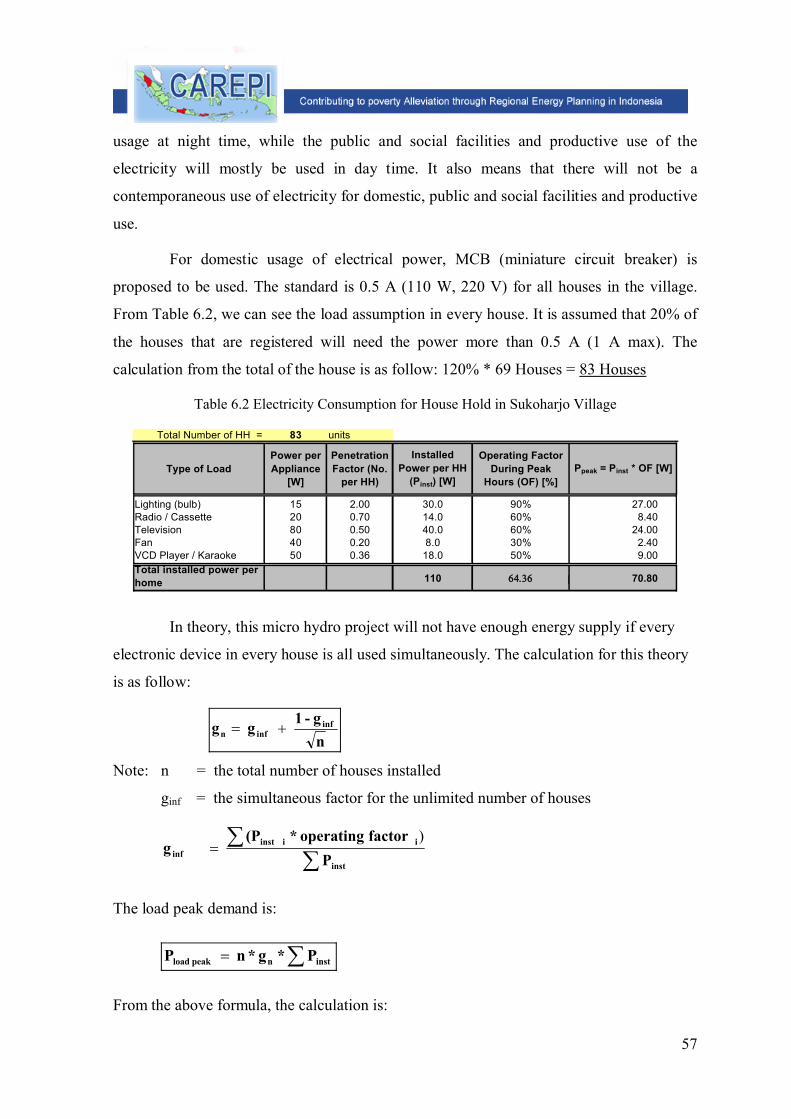
57
usage at night time, while the public and social facilities and productive use of the
electricity will mostly be used in day time. It also means that there will not be a
contemporaneous use of electricity for domestic, public and social facilities and productive
use.
For domestic usage of electrical power, MCB (miniature circuit breaker) is
proposed to be used. The standard is 0.5 A (110 W, 220 V) for all houses in the village.
From Table 6.2, we can see the load assumption in every house. It is assumed that 20% of
the houses that are registered will need the power more than 0.5 A (1 A max). The
calculation from the total of the house is as follow: 120% * 69 Houses = 83 Houses
Table 6.2 Electricity Consumption for House Hold in Sukoharjo Village
Total Number of HH = 83 units
Type of LoadPower per Appliance
[W]
Penetration Factor (No.
per HH)
Installed Power per HH
(Pinst) [W]
Operating Factor During Peak
Hours (OF) [%]Ppeak = Pinst * OF [W]
Lighting (bulb) 15 2.00 30.0 90% 27.00Radio / Cassette 20 0.70 14.0 60% 8.40Television 80 0.50 40.0 60% 24.00Fan 40 0.20 8.0 30% 2.40VCD Player / Karaoke 50 0.36 18.0 50% 9.00Total installed power per home 110 70.80
In theory, this micro hydro project will not have enough energy supply if every
electronic device in every house is all used simultaneously. The calculation for this theory
is as follow:
ng-1 g g inf
infn
Note: n = the total number of houses installed
ginf = the simultaneous factor for the unlimited number of houses
inst
iiinstinf P
factor operating*(P g
)
The load peak demand is:
instnpeakload P*g*n P
From the above formula, the calculation is:
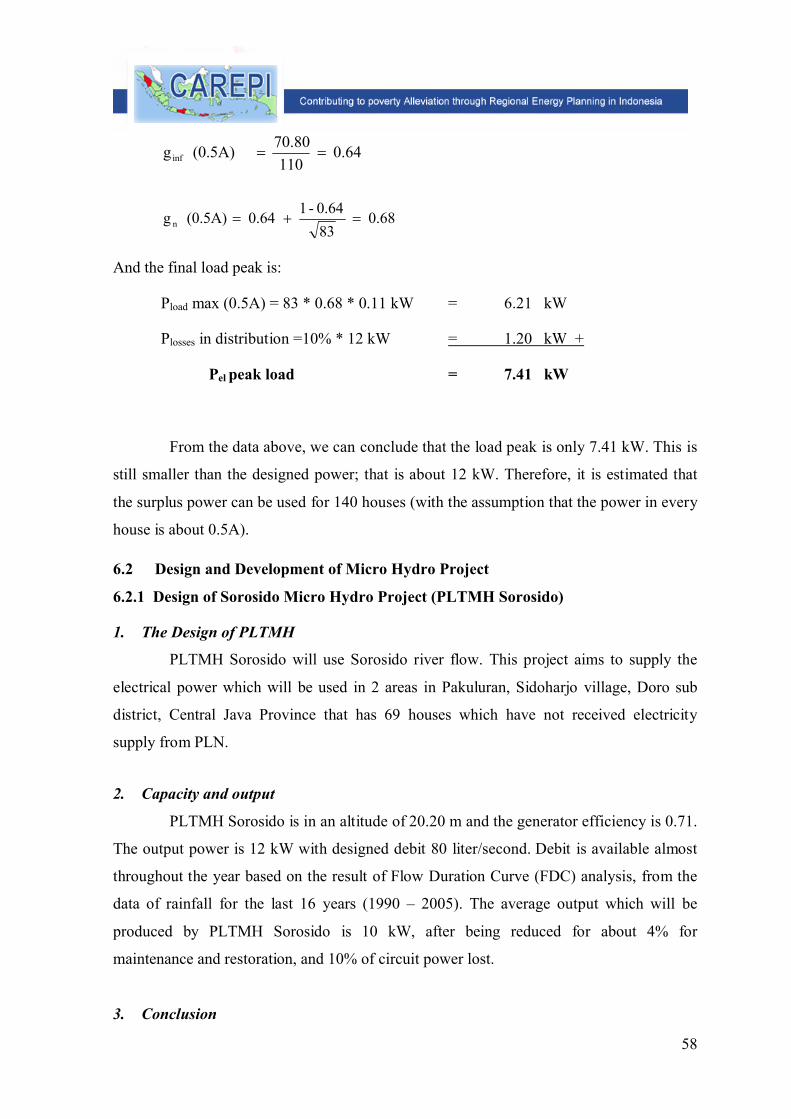
58
0.64 110
70.80 (0.5A) g inf
0.68 830.64-1 0.64 (0.5A) g n
And the final load peak is:
Pload max (0.5A) = 83 * 0.68 * 0.11 kW = 6.21 kW
Plosses in distribution =10% * 12 kW = 1.20 kW +
Pel peak load = 7.41 kW
From the data above, we can conclude that the load peak is only 7.41 kW. This is
still smaller than the designed power; that is about 12 kW. Therefore, it is estimated that
the surplus power can be used for 140 houses (with the assumption that the power in every
house is about 0.5A).
6.2 Design and Development of Micro Hydro Project
6.2.1 Design of Sorosido Micro Hydro Project (PLTMH Sorosido)
1. The Design of PLTMH
PLTMH Sorosido will use Sorosido river flow. This project aims to supply the
electrical power which will be used in 2 areas in Pakuluran, Sidoharjo village, Doro sub
district, Central Java Province that has 69 houses which have not received electricity
supply from PLN.
2. Capacity and output
PLTMH Sorosido is in an altitude of 20.20 m and the generator efficiency is 0.71.
The output power is 12 kW with designed debit 80 liter/second. Debit is available almost
throughout the year based on the result of Flow Duration Curve (FDC) analysis, from the
data of rainfall for the last 16 years (1990 – 2005). The average output which will be
produced by PLTMH Sorosido is 10 kW, after being reduced for about 4% for
maintenance and restoration, and 10% of circuit power lost.
3. Conclusion
59
The design of PLTMH is as shown in the table below:
Table 6.3 Design Characteristics of PLTMH Sorosido
Set-up Utilizing the Sorosido river flow
Design Characteristic Debit Design: 80 l/s
Gross Head: 25.42 m
Net Head: 22.20 m
Capacity Design: 12 kW
PLTMH Max power utilization: 7.53 kW
Village: 12 kW
Potential Power Product annually: 98,964 kW
Percentage of accomplishment: 95 %
6.2.2 Scope of the Project
The PLTMH project will limit the activities like:
Building the Weir and Intake, Headrace Canal, Forebay and Penstock,
Building the Power House, including Tailrace and Protection Wall,
Installing mechanical equipments like Cross Flow turbine and synchronous generator,
Installing electrical equipment, such as control panel and air ballast
6.2.3 Implementation of the Project
The implementation of this project will take 6 – 8 months including initial
preparation of a project (a detail design, Bidding, determining the best bidder),
construction work (civil works, M & E, transmission and distribution network), tryouts as
well as operator training and inauguration.
6.3 Utilization of Micro hydro
6.3.1 The Operation and Maintenance
The PLTMH will be operated for max 14 hours a day and will be utilized mostly
at night time; whereas, in day time it will be used for home industry. Generator will
periodically be turned off for maintenance and reparation. Two local citizens will be the
adviser or operator of the PLTMH. Their duties are to operate and maintain the electrical
and mechanical equipments:
60
Turning the generator on/off if necessary.
Control the electricity usage in groups or turning off the electricity on agreed schedule.
Observing the generator daily by controlling every part of the generator.
Cleaning the Intake & Weir, Headrace and Forebay from wastes and sedimentation.
Keeping the Power House clean.
Maintaining discipline in taking care of the generator as the operating procedure.
Turning off the generator immediately if there is a problem with the turbine and
electricity.
Maintaining the whole parts of the building/civil work.
Observing and taking note accurately of the kWh-meter in Power House everyday and
keeping the log book.
Being an operator and the village coordinator to guide guests or tourists who visit the
PLTMH facilities.
6.3.2 Final Utilization of the Electrical Energy
Rice mill and carpentry machines are already available in Pakuluran. The owners of
those machines are still used diesel generator to run those machines.
This PLTMH with the electric power available is expected to be able to maximize
the operations of those machines, especially in day time. As a result the final utilization of
this electrical power can increase the welfare and improve the economic condition of the
local citizen.
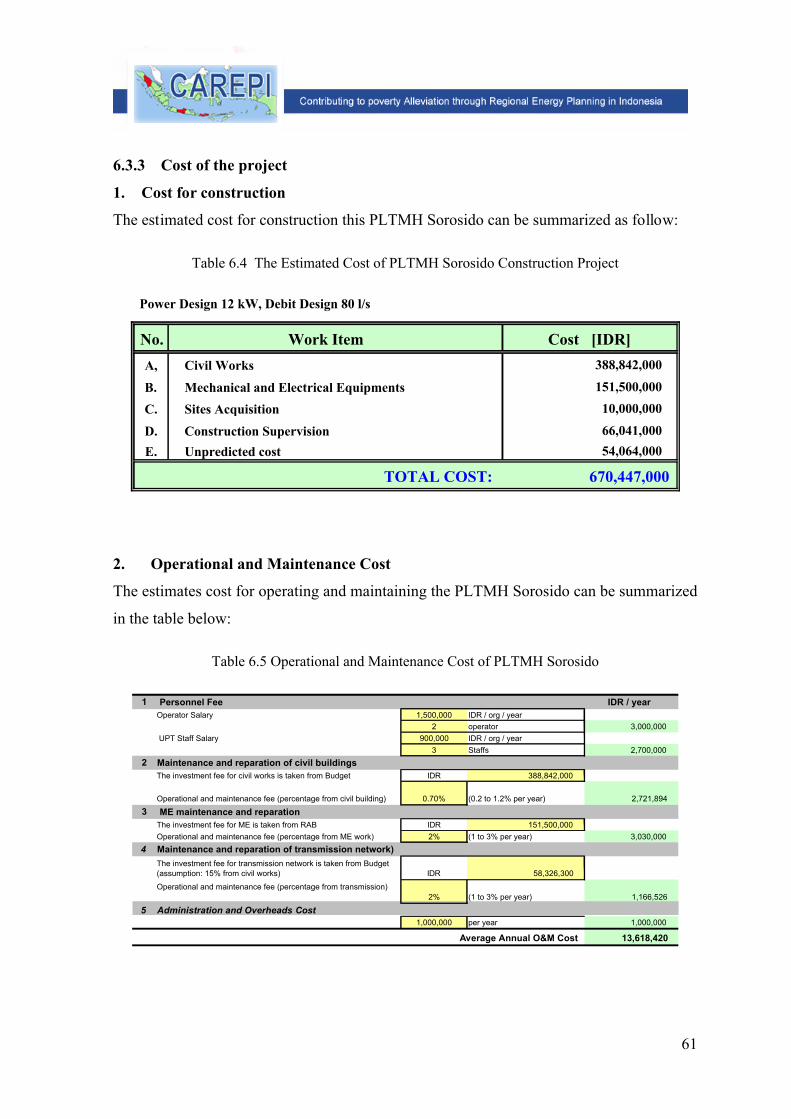
61
6.3.3 Cost of the project
1. Cost for construction
The estimated cost for construction this PLTMH Sorosido can be summarized as follow:
Table 6.4 The Estimated Cost of PLTMH Sorosido Construction Project
2. Operational and Maintenance Cost
The estimates cost for operating and maintaining the PLTMH Sorosido can be summarized
in the table below:
Table 6.5 Operational and Maintenance Cost of PLTMH Sorosido
1 Personnel Fee IDR / yearOperator Salary 1,500,000 IDR / org / year
2 operator 3,000,000 UPT Staff Salary 900,000 IDR / org / year
3 Staffs 2,700,0002 Maintenance and reparation of civil buildings
The investment fee for civil works is taken from Budget IDR 388,842,000
Operational and maintenance fee (percentage from civil building) 0.70% (0.2 to 1.2% per year) 2,721,894
3 ME maintenance and reparation The investment fee for ME is taken from RAB IDR 151,500,000Operational and maintenance fee (percentage from ME work) 2% (1 to 3% per year) 3,030,000
4 Maintenance and reparation of transmission network) The investment fee for transmission network is taken from Budget(assumption: 15% from civil works) IDR 58,326,300
Operational and maintenance fee (percentage from transmission)2% (1 to 3% per year) 1,166,526
5 Administration and Overheads Cost1,000,000 per year 1,000,000
Average Annual O&M Cost 13,618,420
Power Design 12 kW, Debit Design 80 l/s
No. Work Item Cost [IDR]A, Civil Works 388,842,000
B. Mechanical and Electrical Equipments 151,500,000
C. Sites Acquisition 10,000,000
D. Construction Supervision 66,041,000E. Unpredicted cost 54,064,000
670,447,000TOTAL COST:
62
CHAPTER 7
CONCLUSION AND RECOMMENDATION
7.1 Conclusion 1. There are two scenarios made; KEN (National Policy for Energy) and KED (Local
Policy for Energy). The KEN scenario is established to support the President regulation no 5 year 2006, while KED scenario is established based on the internal discussion among many parties, including ITB (Bandung Technology Institute) and ECN.
2. Using the scenario requirements’ attached, the targets on KEN scenario of 2025 energy mix as stated in President Regulation no. 5 can be achieved because the use of geothermal and renewable energy can be maximized.
3. The process of kerosene conversion into LPG will run until 2010 for KEN scenario and 2009 for KED scenario. After the conversion time is over, kerosene will no longer be on demand.
4. The development of electricity supply will refer to two electricity plans. KEN scenario refers to RUKN (General Plan for National Electricity) and RUKD (General Plan for Local Electricity); the purpose is to create synchronization in creating projects of electrical energy supply.
5. The Target of electrificated ratio for two scenarios is 100% in 20206. For both scenarios, the number of poor people is expected to decline, this can be
seen from teh used assumptions on the increasing ratio of electrification and the growth of GRDP.
7. In both scenario, energy supply increases from some supply sources like PLTMH, Penambahan, PLTP (Geothermal Power Plant) Semarang, and some new coal-fueled PLTU (Steam Power Plant) like PLTU Tanjung Jati, Cilacap, and Rembang. Petroleum mining in Cepu, joint cooperation with Exxon Mobil, has been prepared to supply the petroleum Energy.
8. In Central Java Province Pro-poor case has been conducted in Sokawera village, located in Kecamatan Cilongok (Cilongok Sub-district), Banyumas Regency. The reason is, the village is in remote area wich the unsuported access to energy supply.
9. From the Pro-poor activities in Sokawera Village resulted that the people are very enthusiastic and supported.
10. Mikrohidro FS activities in Central Java hase been conducted in Sidoharjo village located in the Doro sub district, Pekalongan Regency. Where there is potential for micro hydro energy 98,96 kW.
11. From the FS activity resulted that the cost needed to built PLMTH is Rp. 670,447,000
63
7.2 Recommedations1. To support the accomplishment of the target mix of 2025 as regulated in President
Regulation no. 5, 2006, serious steps on the utilization and management of Geothermal and renewable energy are needed.
2. Legal framework needs to be established to guarantee that coal supply from outside of Java Island, like Kalimantan and Sumatra can run smoothly, so it will not disrupt the electric power supply.
3. The assurance on the implementation of installing the gas pipeline which channels the gas from East Kalimantan until Semarang needs to be made, so that the target of energy mix 2025 can be achieved, as stated in President Regulation no.5, 2006.
4. Energy assets like geothermal, hydro power need to be developed maximally in order to decrease the fuel oil dependency. This can be done by promoting these assets to private-owned companies, so they, joint cooperation with government institution can manage these assets.
5. To support the utilization of renewable energy sources, such as bio-diesel, bio-ethanol and vegetable oil, a factory that produces those bio-fuel energies need to be established. Thus, the government should build cooperation with PT. Pertamina as a state-owned company whose business is in petroleum.
6. In terms of supplying the bio – fuel, the farmers need to have counseling, so that
they are willing to grow the plants that produce the bio – fuel, and legal framework
also needs to be established to give security guarantee to the farmers starting from
the planting process until selling the products to the market.
7. From the FS results should be followed up with detailed design to built PLTMH
soon, so the people can enjoy the electric energy.
8. From the results of Pro-poor activity should be followed up for real, by the local
governments and the people according to the submitted proposals by CAREPI
team.